SatoshiNakamoto
1480Suka0Pembagian44Penggemar1Ikuti
₿ Bitcoin Research & Analysis 📊 BTC Charts • Market Insights 🔥 Identifying Key Levels Before The Move 📈 Discipline Over Emotion
₿ Bitcoin Research & Analysis 📊 BTC Charts • Market Insights 🔥 Identifying Key Levels Before The Move 📈 Discipline Over Emotion
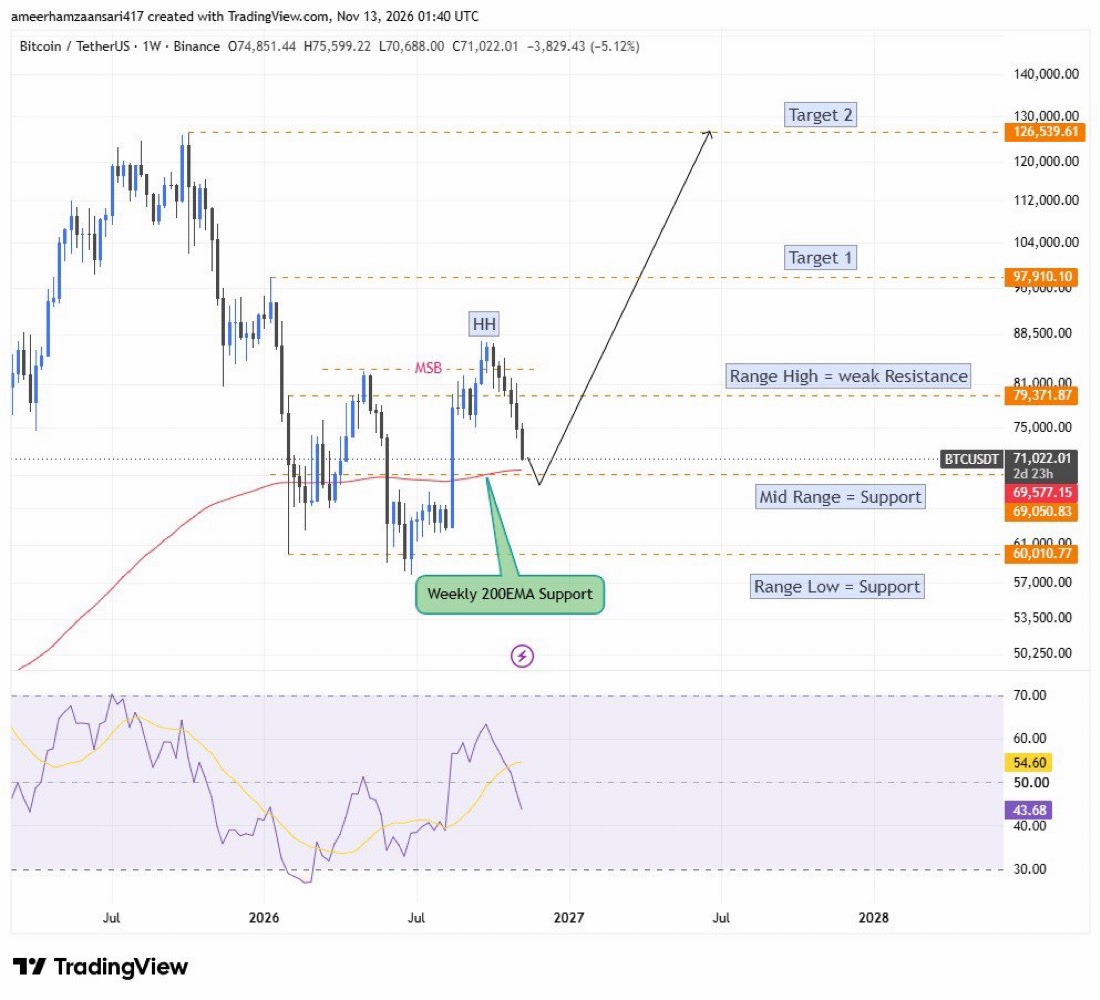
🚀 $BTC: ZONA PEMBALIKAN BESAR BERIKUTNYA?
Bitcoin sedang mendekati area support krusial, dan grafik mingguan menunjukkan potensi pembalikan bullish mungkin sedang terbentuk! 👀🔥 📊 Level Kunci BTC: 🟢 Zona Pembalikan: $67.000–$70.000 🟢 Support Utama: $60.010 🔴 Resistance Pertama: $79.372 🎯 Target 1: $97.910 🚀 Target 2: $126.540 EMA 200 mingguan berada di dekat zona pembalikan potensial, menjadikannya area penting untuk dipertahankan oleh para bull. 💥 Skenario Bullish: Jika Bitcoin bertahan di $67K–$70K dan mengonfirmasi higher low, pemulihan menuju $79K dapat membuka jalan ke $97K dan berpotensi ke $126K. ⚠️ Skenario Bearish: Penurunan berkelanjutan di bawah $67K akan melemahkan setup bullish dan meningkatkan risiko pergerakan menuju $60K. Tesis bull-market belum mati. Ini bisa jadi kesempatan higher-low alih-alih akhir dari siklus! 🐂 👀 Apakah Anda membeli saat harga turun (buy the dip) atau menunggu konfirmasi? #WSOT2026 $BTCUSDT
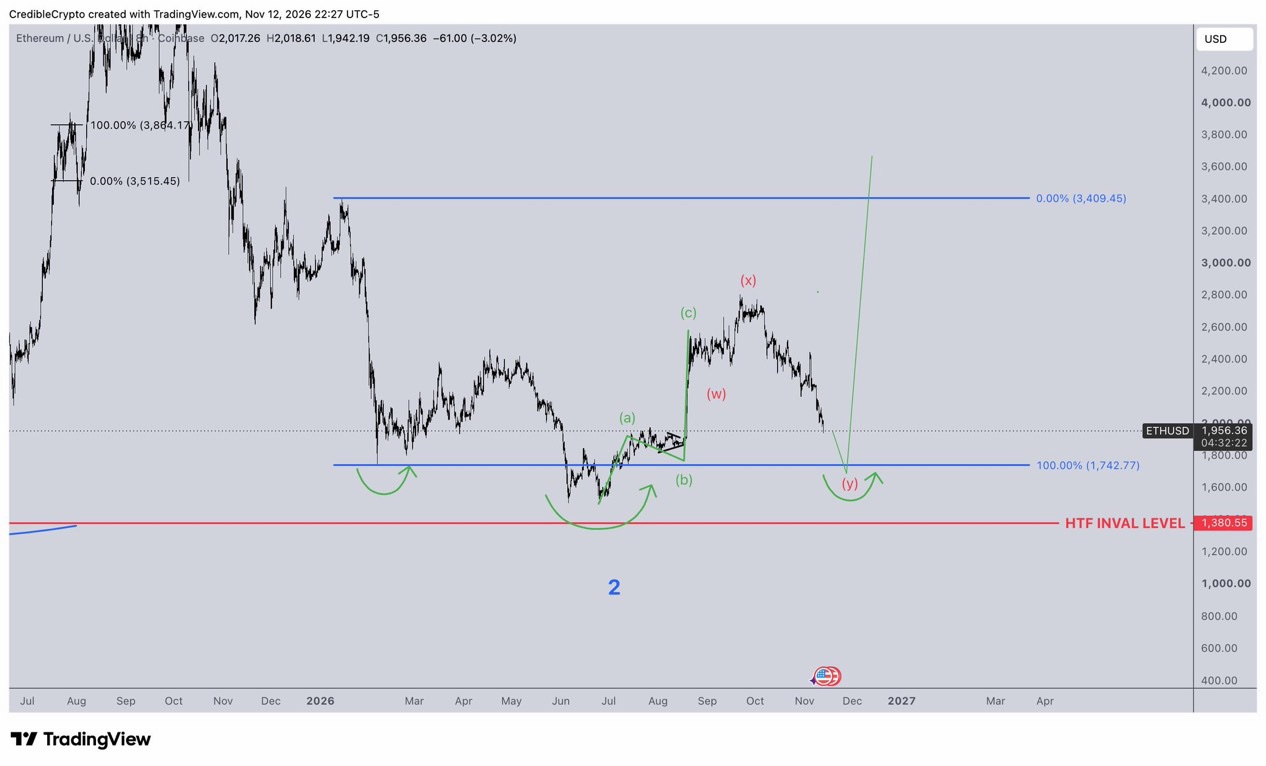
Saat ini, koreksi (pullback) pada $ETH sudah cukup dalam sehingga membatalkan subgelombang ke-5 terakhir yang saya cari untuk mengonfirmasi pergerakan dari level terendah sebagai pergerakan impulsif. Itu artinya, pergerakan naik tersebut adalah korektif (3 kaki), kita masih dalam proses pembentukan basis (base building) yang lebih besar, dan HTF inval di $1380 tetap menjadi asal mula dari impuls 5 gelombang terakhir yang selesai. Pada tahap ini, saya sekarang mencari level yang sedikit lebih rendah untuk *higher low* ke arah level terendah kisaran kita sebelum pergerakan nyata ke atas dimulai. #WSOT2026 $ETHUSDT
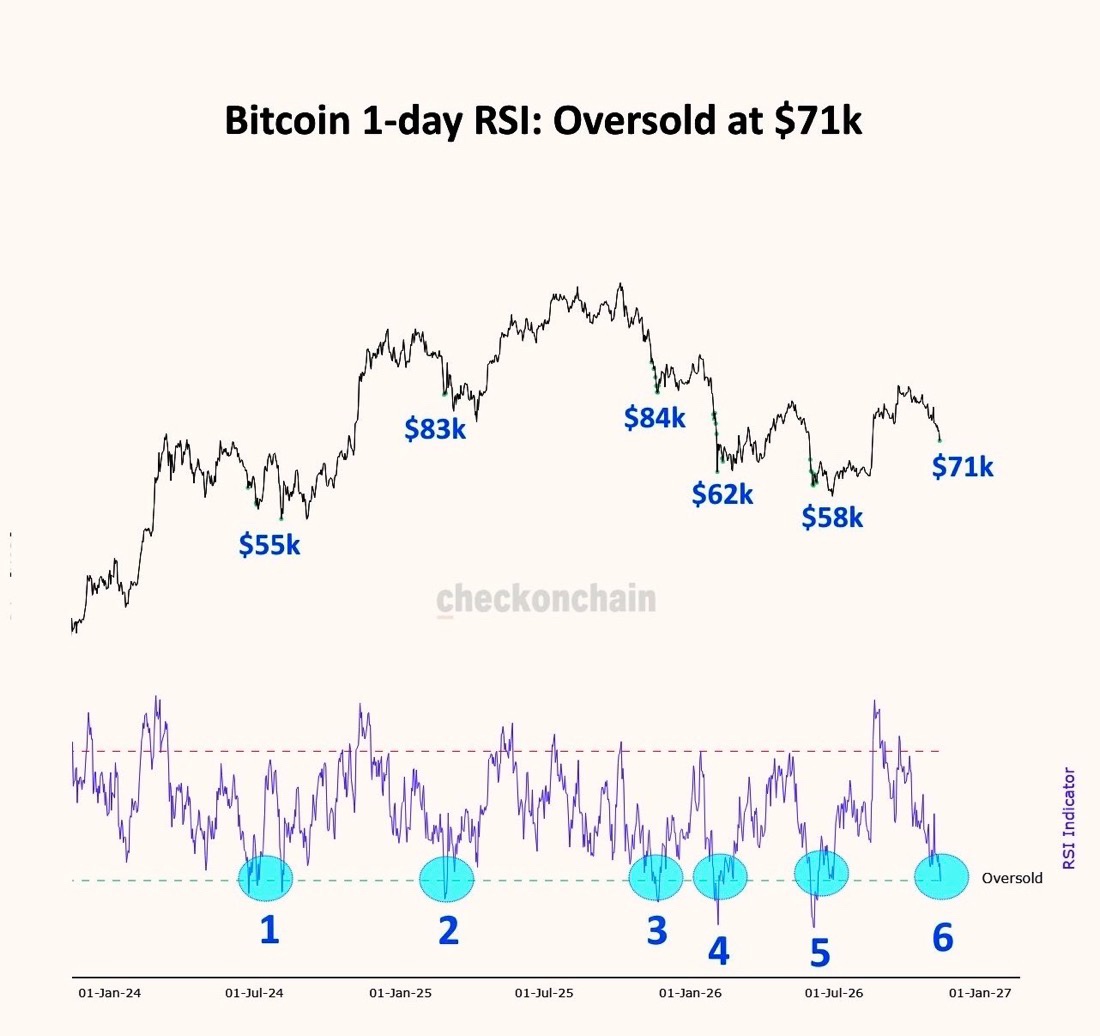
Max bearishness, max capitulation, max overselling. You know what that means. #WSOT2026
🚨 INI TIDAK NORMAL
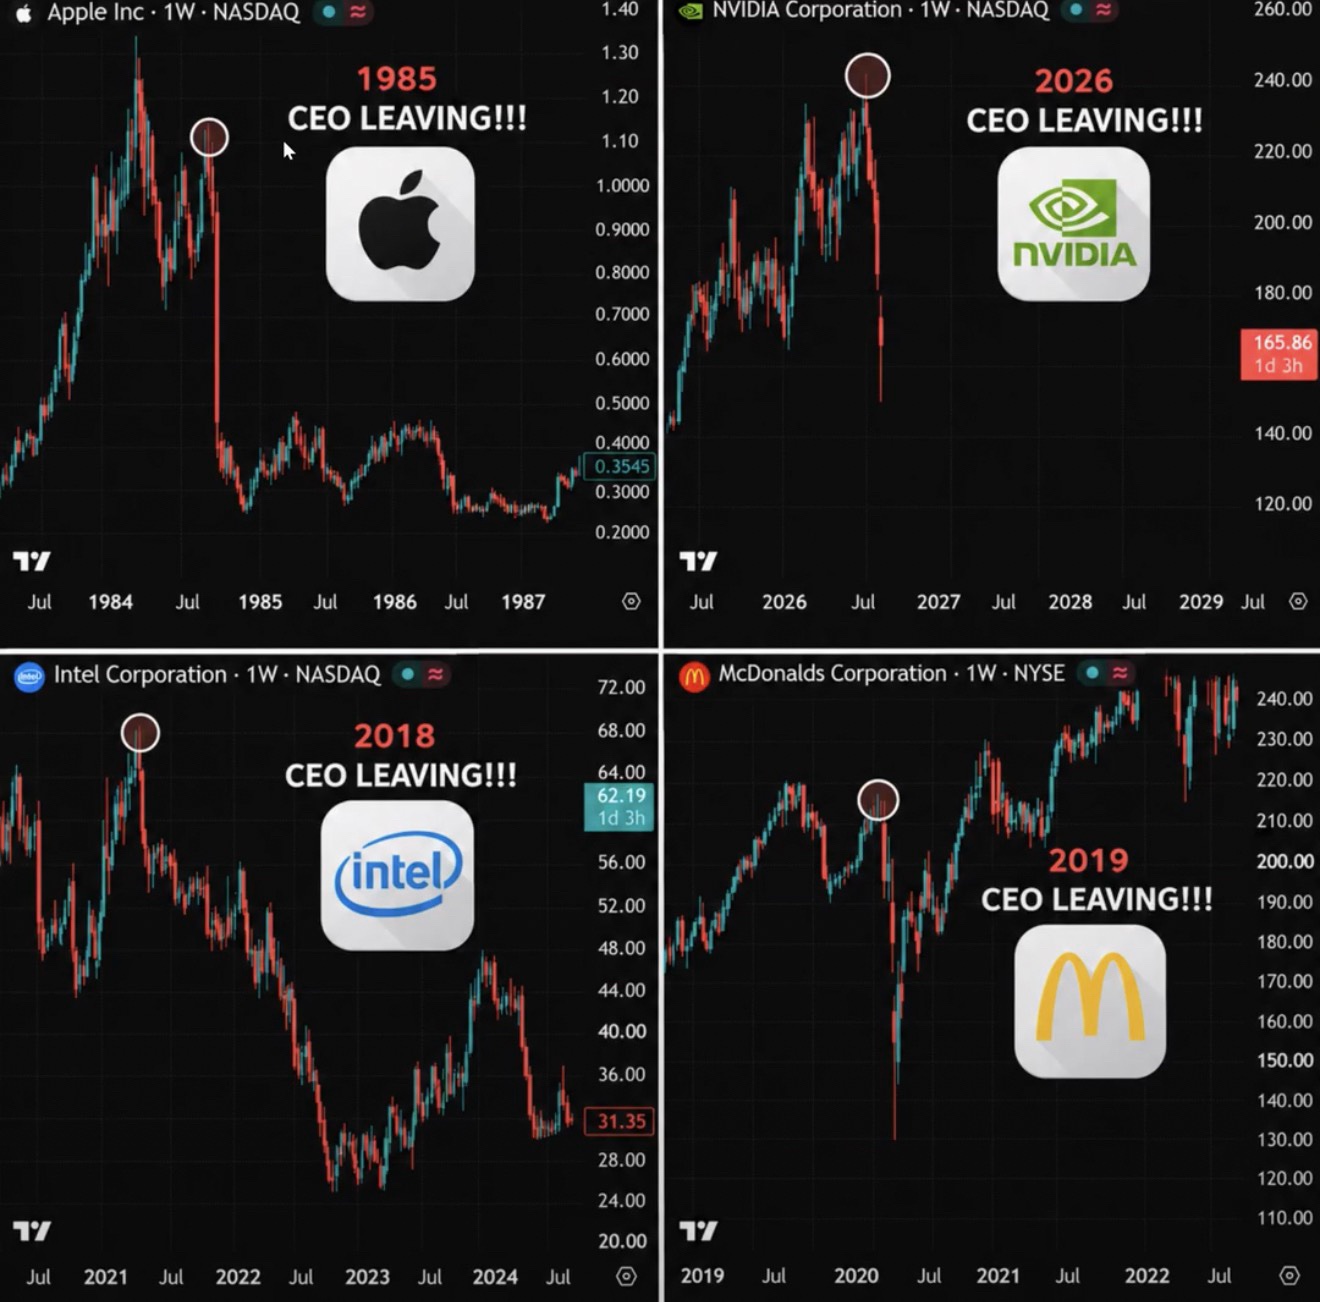
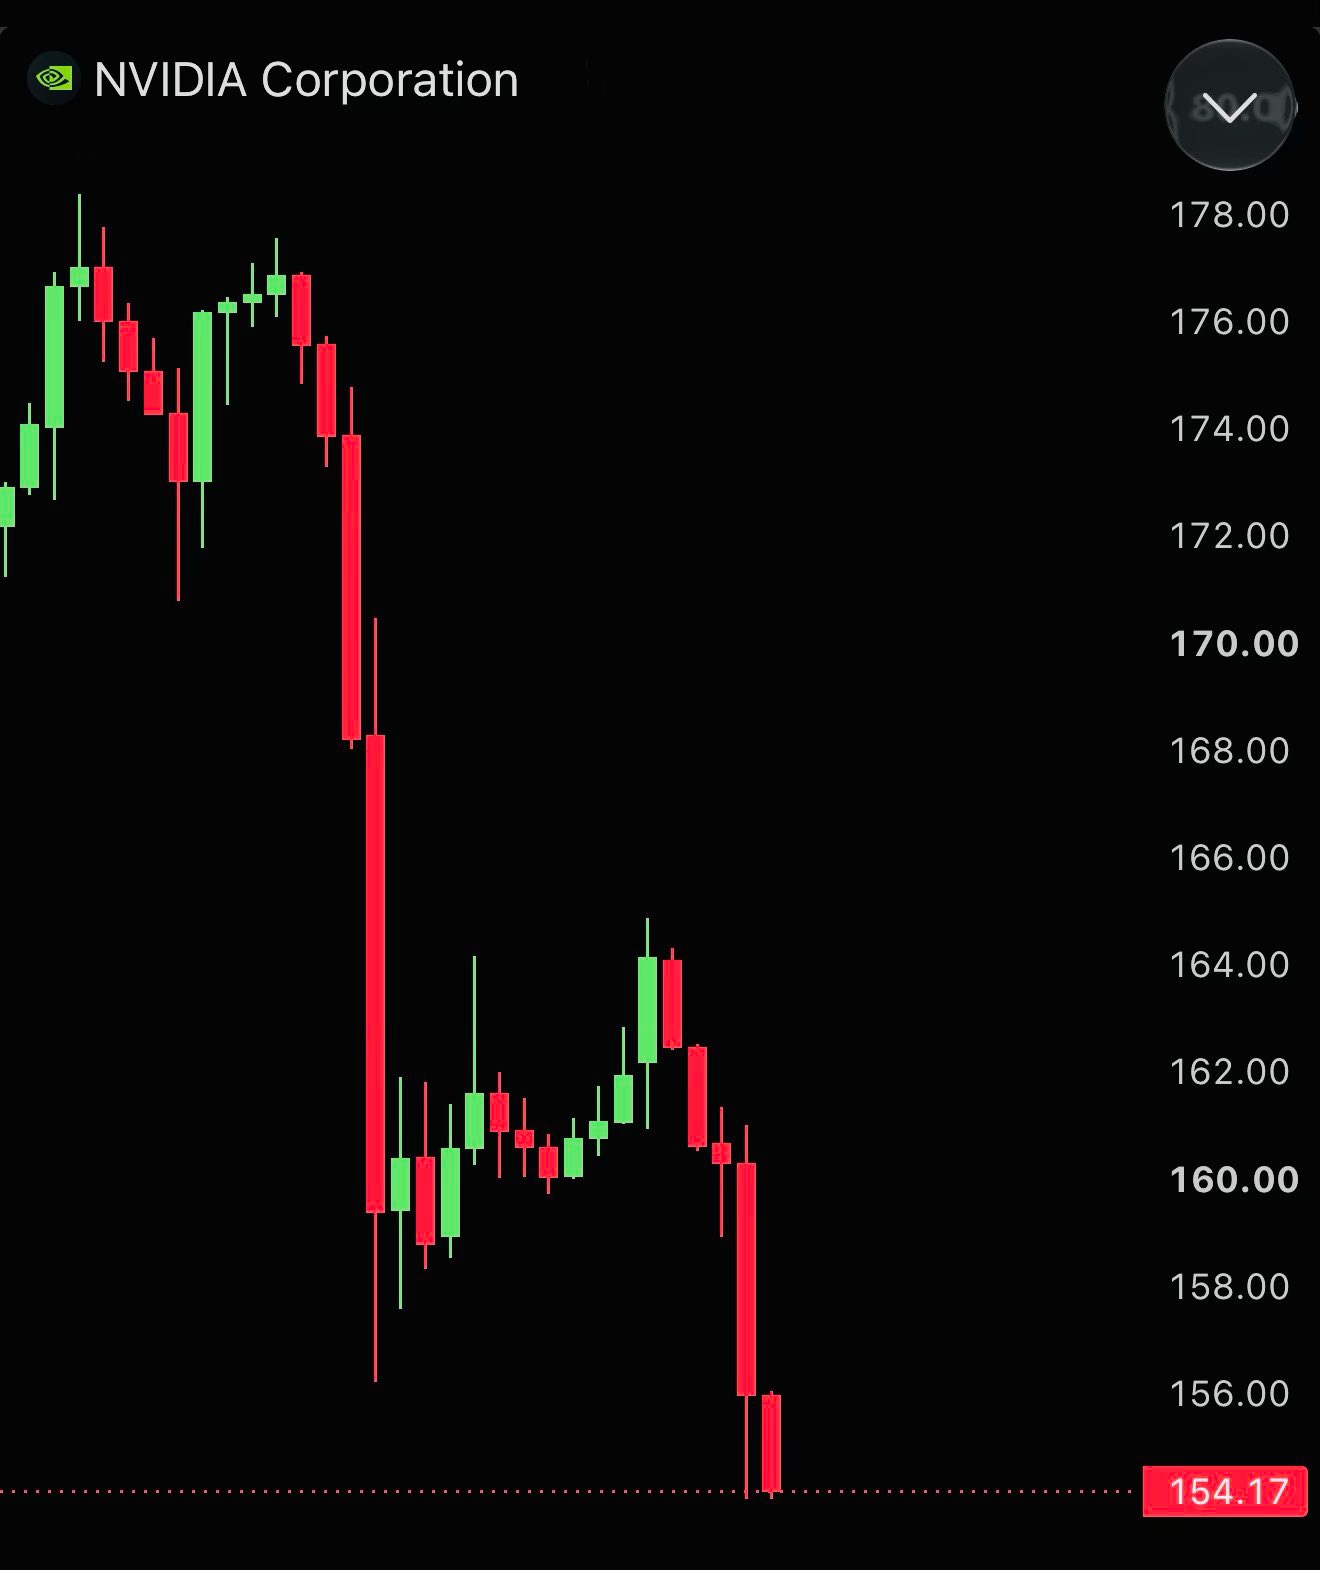
Jensen Huang baru saja MUNDUR sebagai CEO NVIDIA setelah 33 TAHUN. Dan apa yang terjadi pada perusahaan-perusahaan besar lainnya ketika CEO mereka tiba-tiba pergi seharusnya membuat SEMUA investor khawatir. Lihat sejarahnya: → 1985: Steve Jobs mundur sebagai CEO Apple. $AAPL ANJLOK lebih dari 21% dalam perdagangan setelah jam kerja (after-hours trading). → 2018: Brian Krzanich MUNDUR dari Intel. $INTC ANJLOK 4,5% pada hari perdagangan pertama. → 2019: Steve Easterbrook DIPECAT dari McDonald's. $MCD ANJLOK 4,9% seketika. → 2026: Jensen Huang MENINGGALKAN NVIDIA. $NVDA sudah TURUN 35% dari level tertingginya. Namun inilah yang LEWAT dari pengamatan semua orang: Mereka bukan eksekutif biasa. Mereka adalah pemimpin yang dipercaya investor untuk membentuk masa depan perusahaan mereka. Dan NVIDIA menghadapi ketidakpastian ini pada saat yang SANGAT berbahaya. Valuasi AI tetap sangat besar. Ekspektasi sangat tinggi. Dan orang yang membantu MEMBANGUN revolusi AI kini TELAH PERGI. Apakah ini menjamin kehancuran besar lainnya? TIDAK. Tetapi sejarah menunjukkan betapa cepatnya kepercayaan bisa hilang ketika ketidakpastian kepemimpinan melanda. Perusahaan berbeda. Dekade berbeda. RISIKO SAMA. SIMPAN GRAFIK INI. ANDA MUNGKIN AKAN SEGERA MEMBUTUHKANNYA. Perlu diingat: Saya telah menghabiskan 12+ tahun mempelajari pasar dan telah memprediksi puncak dan dasar pasar utama. Prediksi saya berikutnya akan diposting di sini terlebih dahulu. Ikuti dan aktifkan notifikasi. #WSOT2026
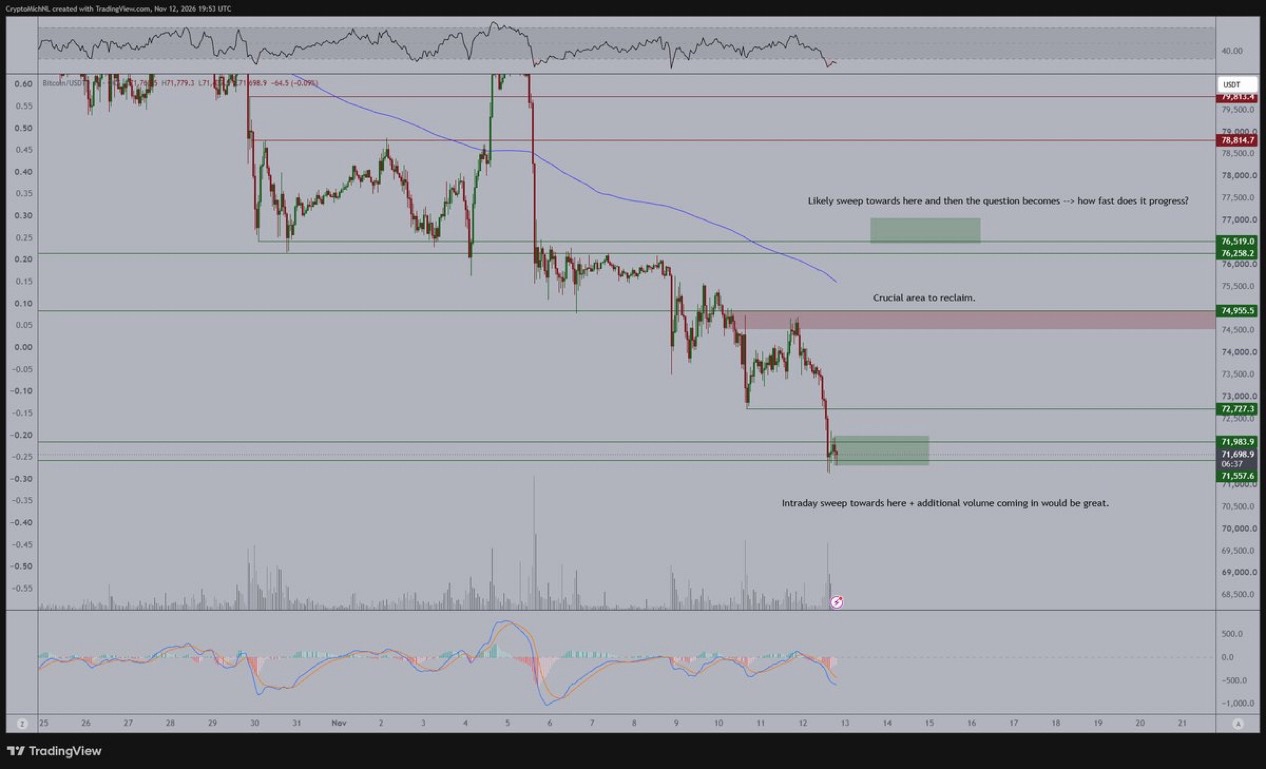
I've been buying #Bitcoin today. There are multiple reasons for this. Firstly: There's such terrible sentiment around the underlying asset that it's hard to keep pouring down much. Secondly: There have been so many events that could cause #Bitcoin to collapse. It didn't. Just a 20% correction. Thirdly: This is a support area, just barely beneath the 200-Day MA and ideal for liquidity. Fourthly: #Bitcoin bottomed on the Friday prior to the SpaceX IPO. I wouldn't be surprised if this is the same cadence as what we're seeing currently. Fifthly: Nasdaq is already up a lot, meaning that there's a gap between Bitcoin and the Nasdaq. It doesn't take long for this gap to close, which is why I've been buying Bitcoin today. #WSOT2026
BREAKING:
Jensen Huang has officially resigned as CEO of Nvidia ($NVDA), ending his 33-year run leading the company. CFO Colette Kress will take over as interim CEO while the board searches for a permanent successor. This is a seismic leadership change for the company at the centre of the global AI boom. The AI industry just lost one of its most influential figures. #WSOT2026 #USInflationRunsHotAndRateHikeBetsRise

#Bitcoin continues to go down and sweep.
It's now below the 200-Day MA, so it's in tricky waters. I'm waiting for a high-volume liquidation wick in the market, and then we're done with the correction. Or, it needs to reclaim substantial levels like $75,000. #WSOT2026
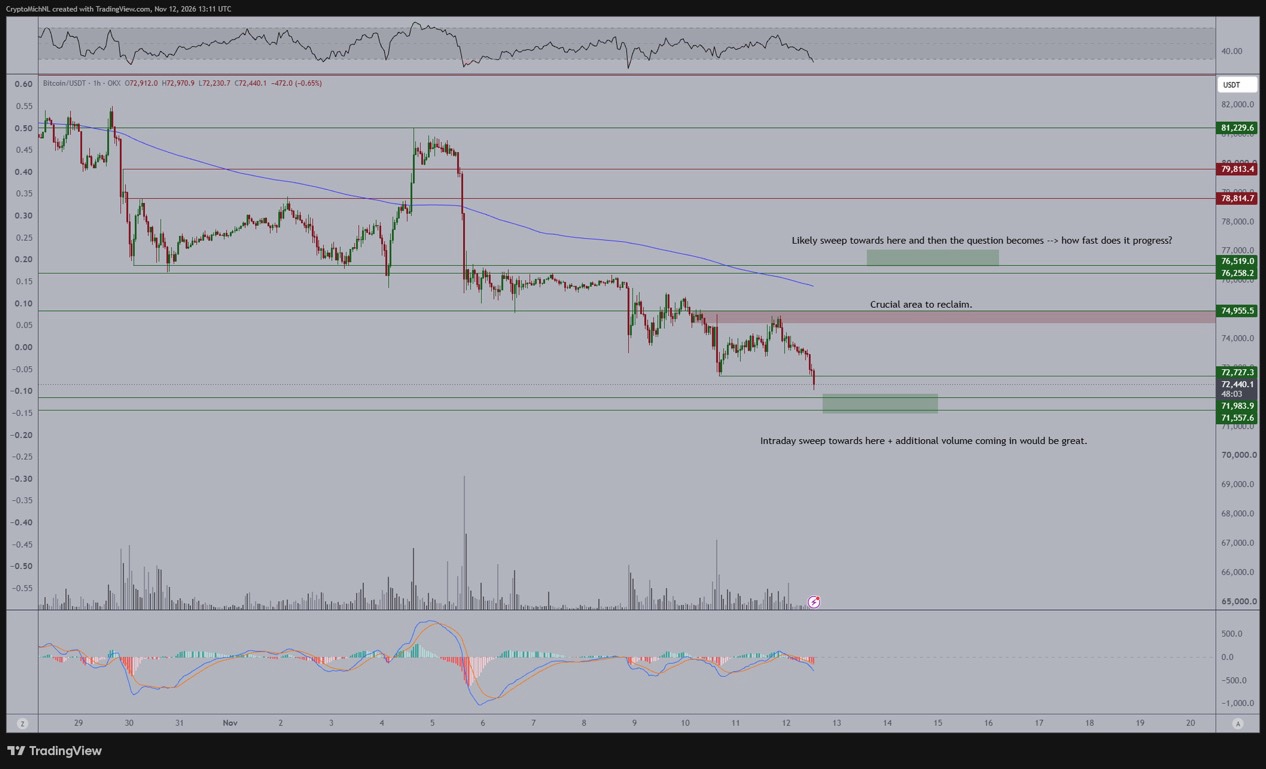
$Bitcoin sudah turun di bawah $72K. Laporan terbaru mengonfirmasi $BTC telah jebol di bawah $72K,🔥🚨 Menurut saya $BTC akan naik di atas $70k 👀 Bullrun besar akan segera dimulai 🚀🚀🚀 #WSOT2026
$1,26 Triliun telah lenyap dari Nvidia sejak perselingkuhan Jensen Huang terungkap. Biaya untuk berselingkuh itu kejam.. #WSOT2026

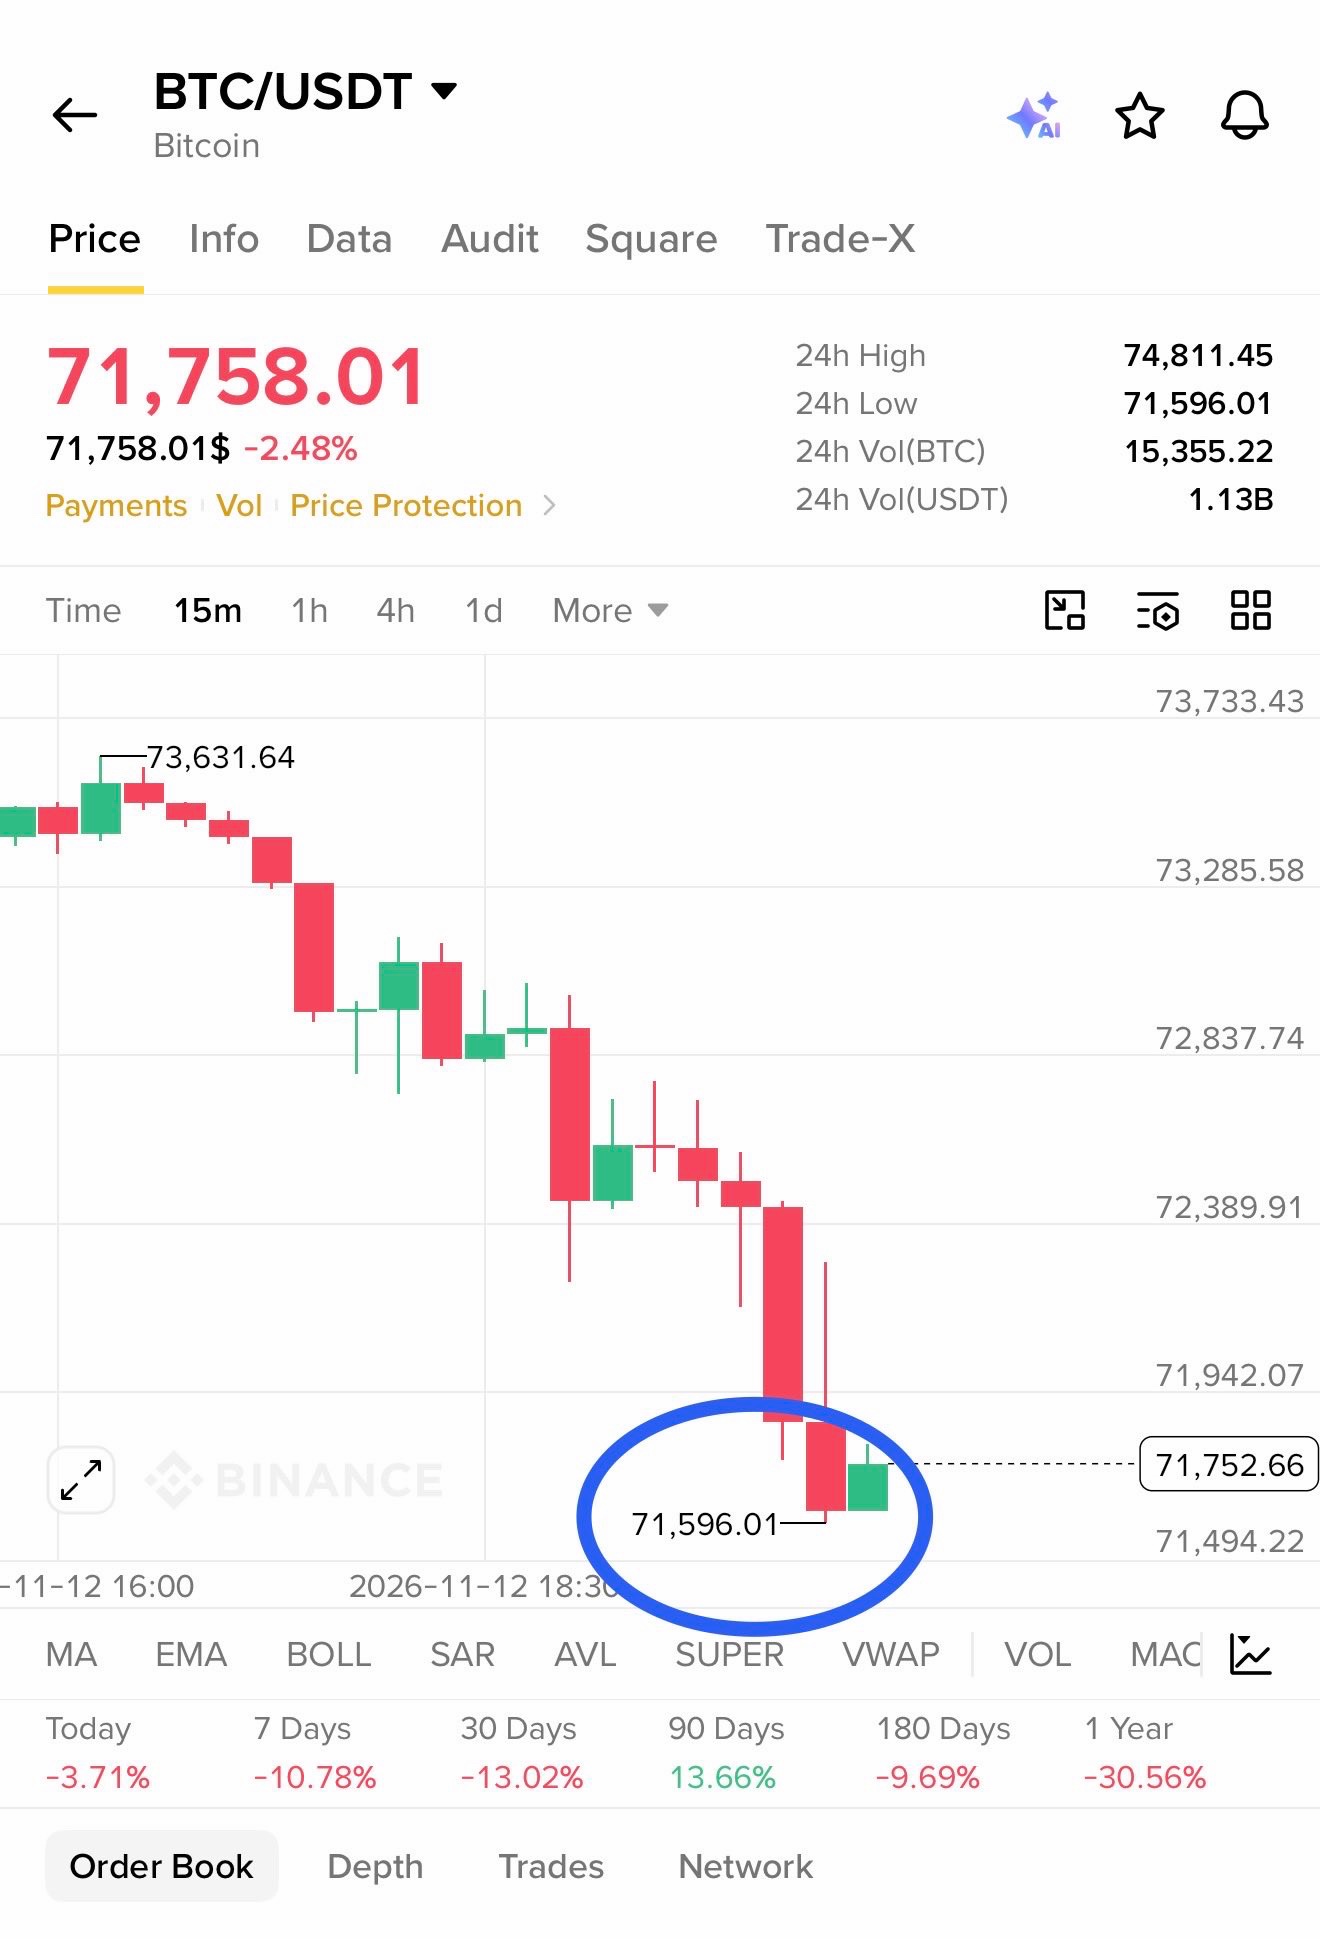
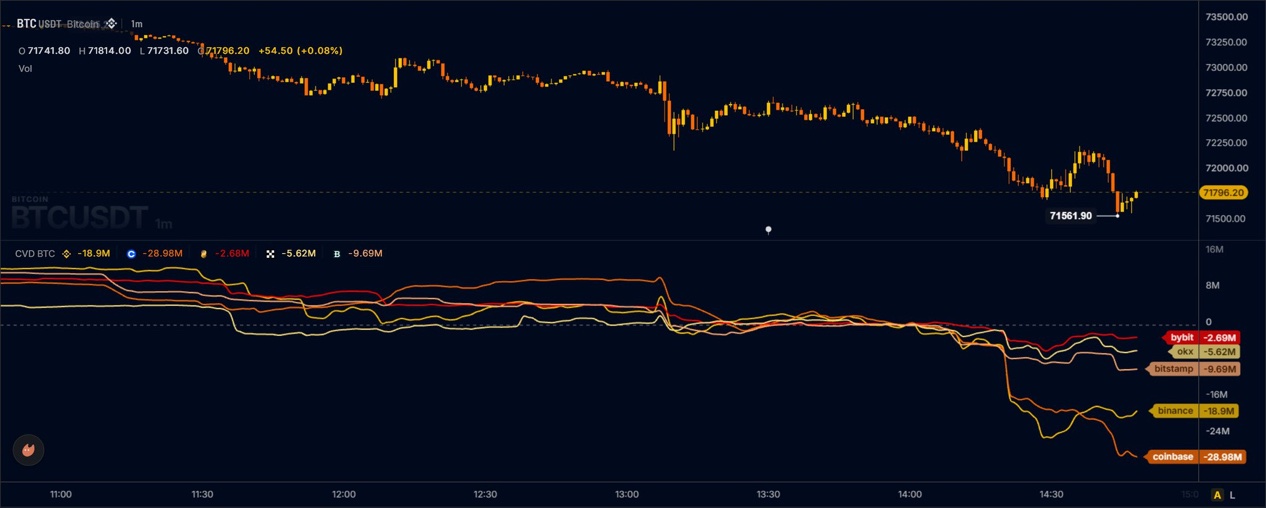
🚨 TEKANAN JUAL BITCOIN SEDANG MELEDAK!
$BTC sedang menghadapi tekanan jual yang agresif di bursa-bursa utama, dan grafiknya terlihat mengkhawatirkan! 📉 🔴 CVD Bursa menunjukkan aksi jual bersih yang besar: 🔻 Coinbase: -$28,98 Juta 🔻 Binance: -$18,9 Juta 🔻 Bitstamp: -$9,69 Juta 🔻 OKX: -$5,62 Juta 🔻 Bybit: -$2,69 Juta Bitcoin sudah turun ke arah $71.500, dengan penjual mendominasi pergerakan jangka pendek. ⚠️ Jika pembeli gagal mempertahankan area $71.500, gelombang aksi jual berikutnya bisa menyusul. 👀 Apakah ini aksi 'shakeout' terakhir sebelum pembalikan arah, atau awal dari koreksi yang lebih dalam? Tetap waspada. Volatilitas bisa meningkat! #WSOT2026 #InflasiASMelonjakDanTaruhanKenaikanSukuBungaMeningkat
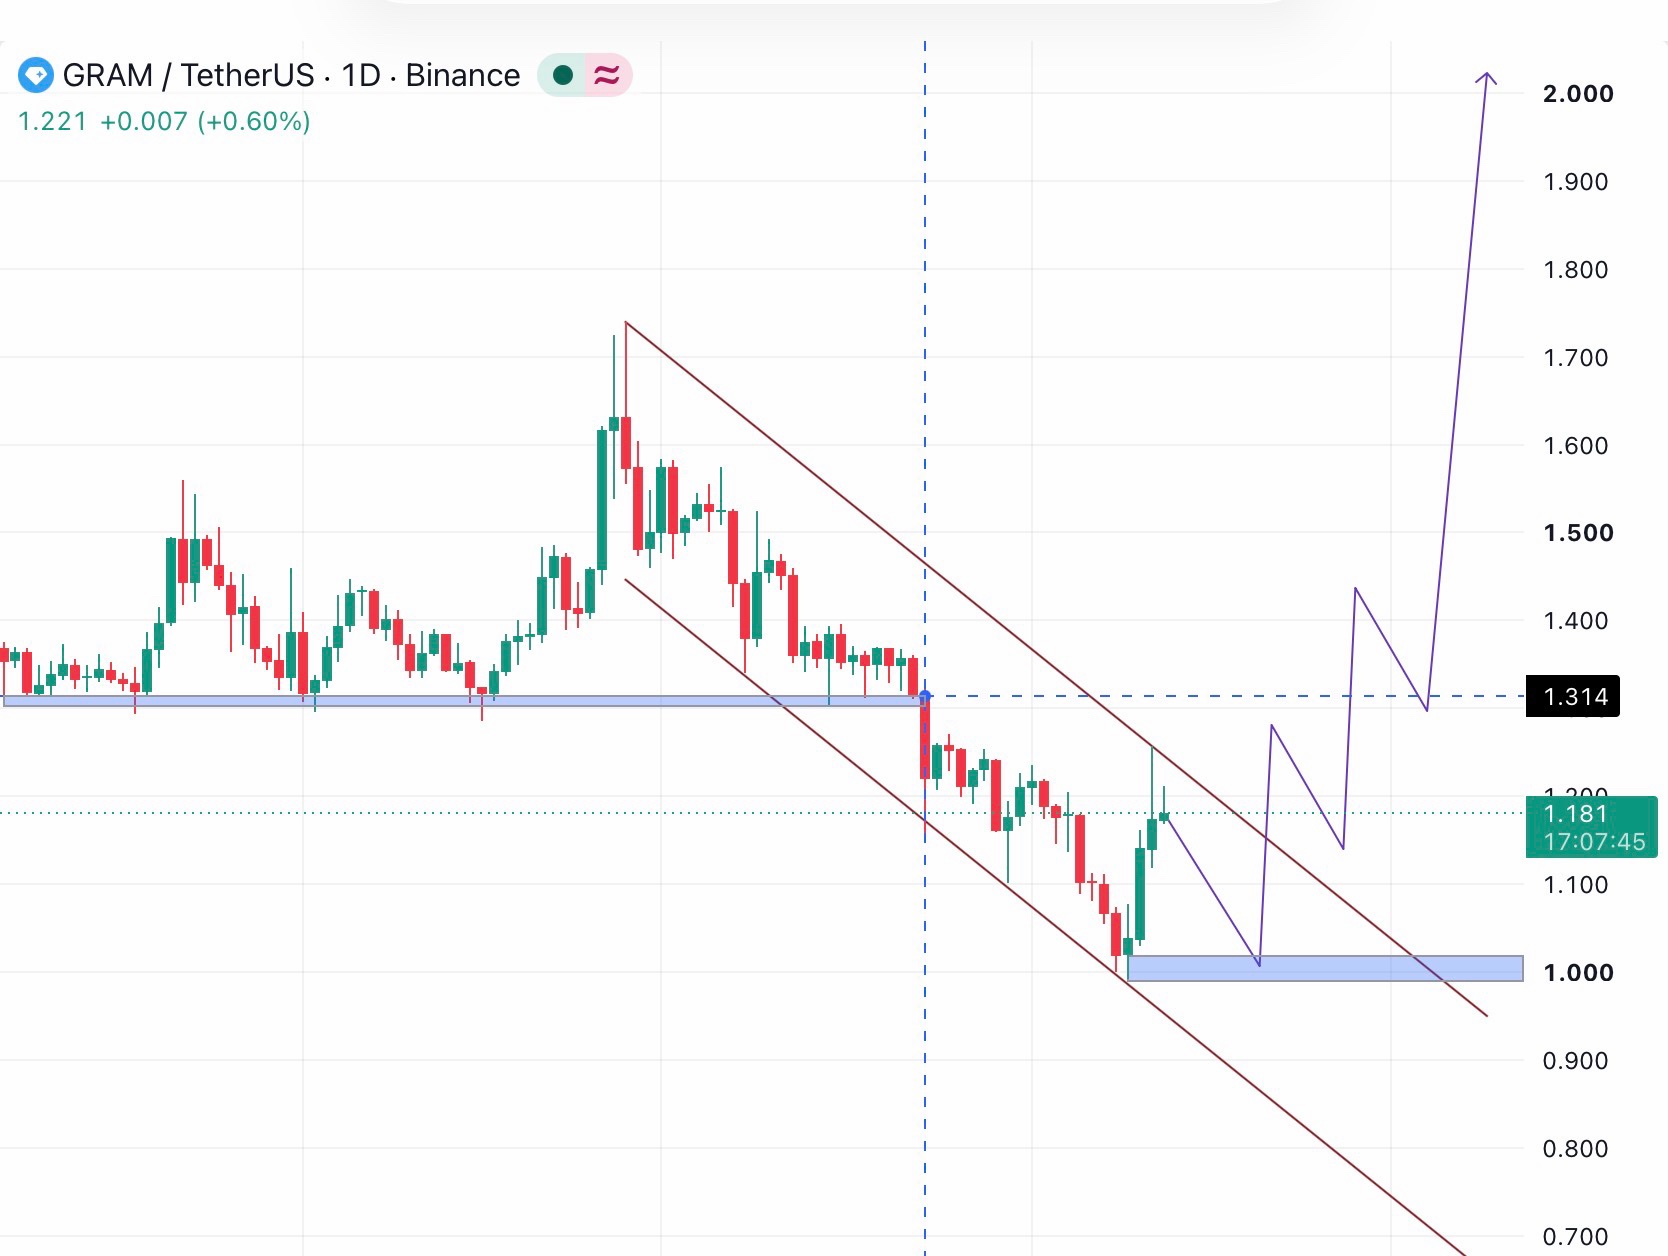
🚨 $GRAM: IS A MASSIVE BREAKOUT COMING?
🔥 $GRAM could be setting up for a major bullish reversal, and the chart is showing an interesting opportunity! After a prolonged correction, GRAM has bounced from the crucial $1.00 support region. 📊 KEY LEVELS TO WATCH: 🟢 Major Support: $1.00–$1.03 📈 Current Chart Price: $1.18 🎯 First Resistance: $1.31 🚀 Bullish Targets: $1.45 → $2.00 💥 WHAT MAKES THIS SETUP INTERESTING? GRAM is trading inside a descending channel, while buyers are attempting to establish a bottom near $1.00. A confirmed breakout above the channel and a successful reclaim of $1.31 could strengthen the bullish outlook. 🔥 The chart’s projected path even points toward $2.00 if momentum accelerates. ⚠️ However, losing the $1.00 support zone could invalidate the bullish setup. 💎 Could $GRAM eventually reach double-digit prices? That’s an ambitious long-term possibility, not a confirmed target from this chart. 🐂 Are you bullish on $GRAM? 👀 #WSOT2026 $GRAMUSDT
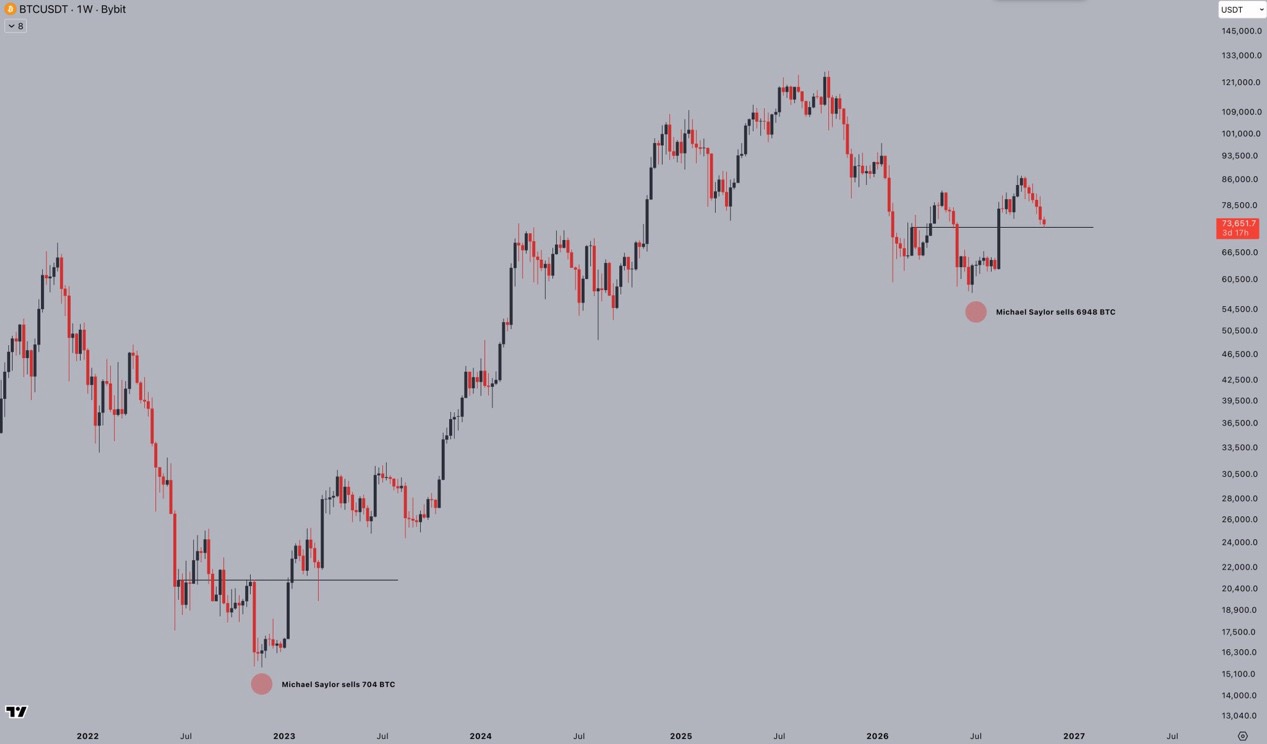
Michael Saylor really telegraphed to us that the bottom was in, and hardly anyone believed him. All you can do now is wait for that higher low to form and get on the programme there. Patience until then! $BTCUSDT $GRAMUSDT
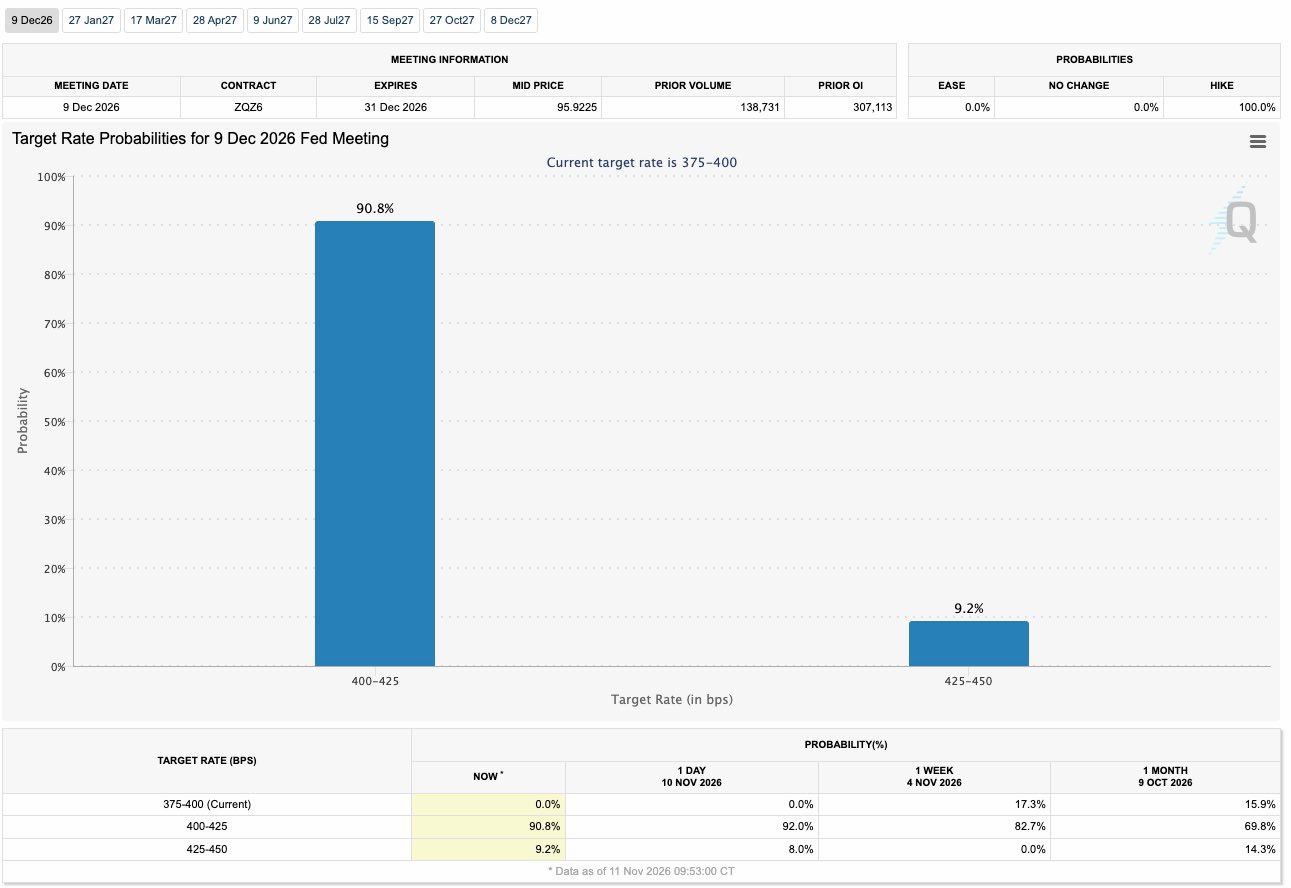
JUST IN: 🇺🇸 Market prices in 100% chance of Fed rate hike in December - CME FedWatch shows 90.8% odds of 25 bps hike, 9.2% chance of 50 bps. #WSOT2026 #USInflationRunsHotAndRateHikeBetsRise #BitcoinHitsTwoMonthLowAfterUSMidterms
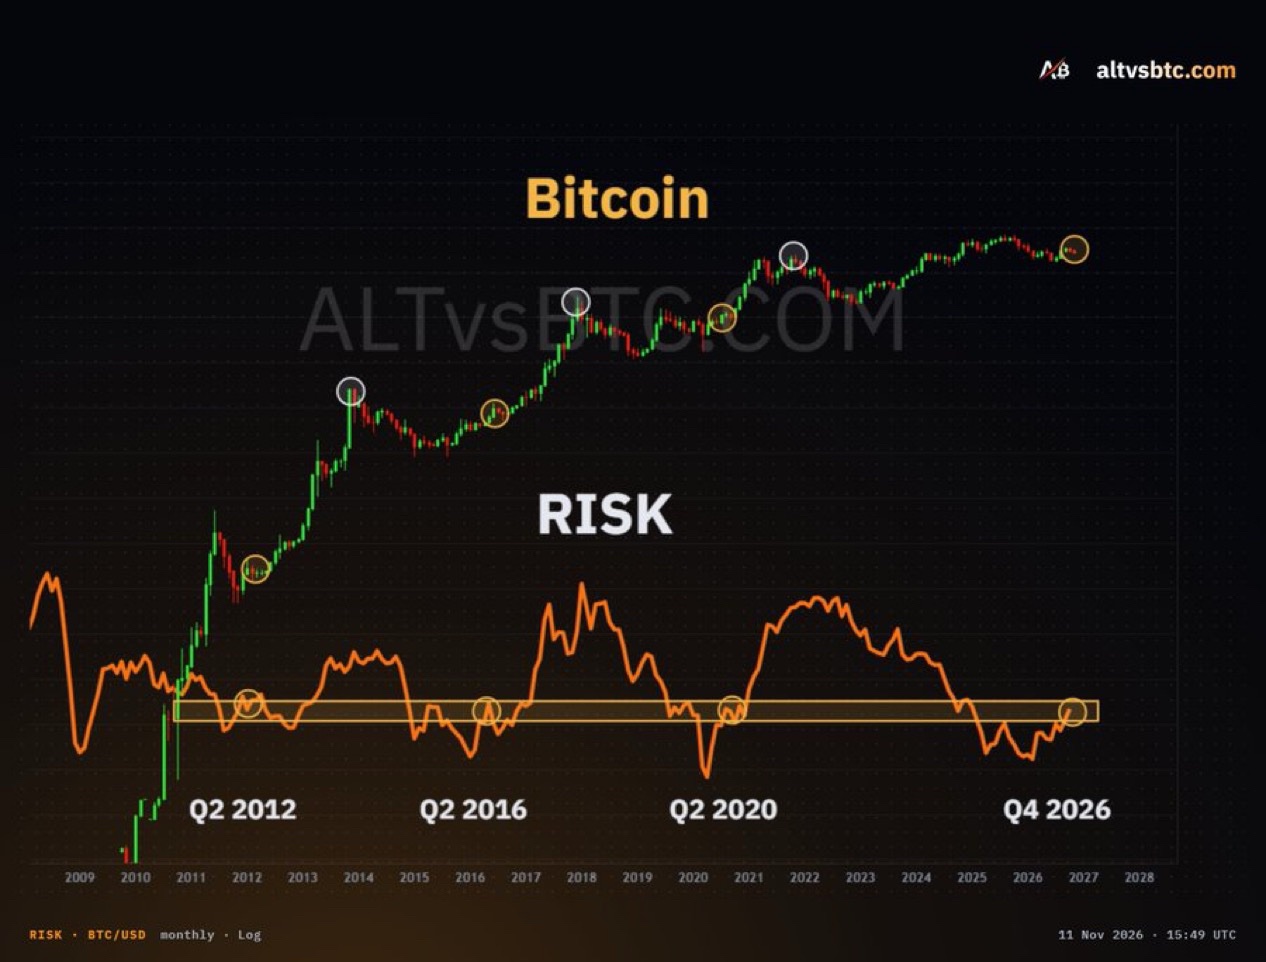
🚨 BITCOIN’S NEXT EXPLOSIVE RALLY LOADING?
🔥 Bitcoin’s long-term risk indicator is flashing a pattern that previously appeared before major BTC price expansions! 📊 According to the chart, Bitcoin’s current risk level in Q4 2026 is approaching zones last seen during three important periods: 🟢 Q2 2012 – Before a major Bitcoin bull run. 🟢 Q2 2016 – Ahead of the powerful 2017 rally. 🟢 Q2 2020 – Before Bitcoin’s historic 2020–2021 expansion. 💥 NOW THE PATTERN IS APPEARING AGAIN! The risk indicator is testing a similar historical zone, raising the possibility that Bitcoin could be entering another important accumulation phase. 📈 In previous cycles, upward turns from this region were followed by substantial price gains. ⚠️ However, historical patterns don’t guarantee the same outcome, and the indicator still needs to confirm a sustained reversal. 🚀 Could Q4 2026 mark the beginning of Bitcoin’s next major bull cycle? 🐂 Are you accumulating BTC or waiting for confirmation? 👀
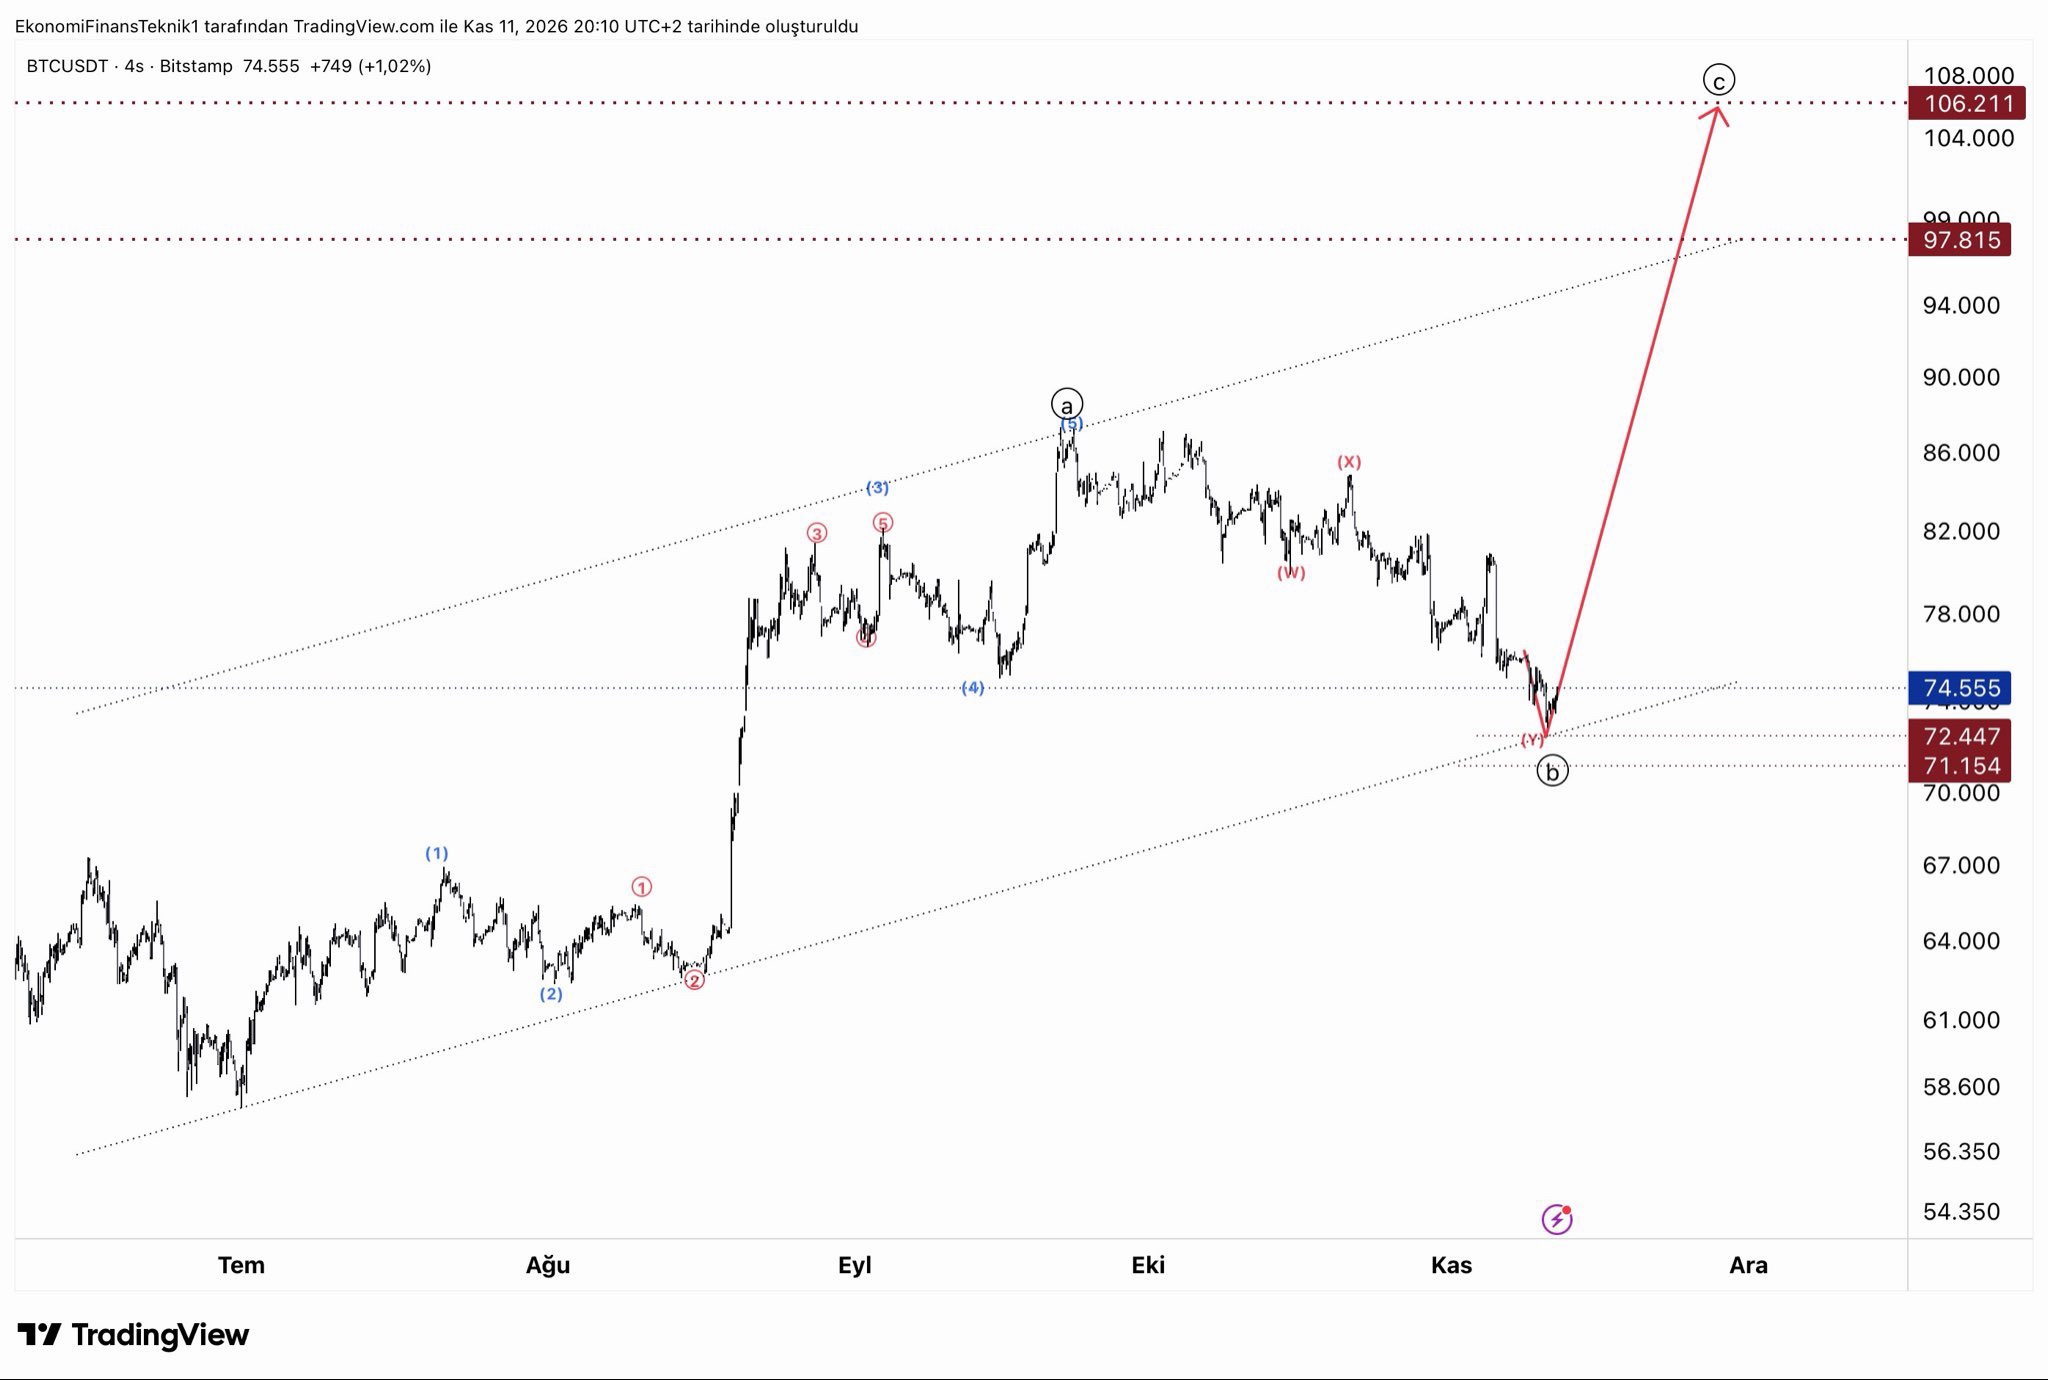
🚨 BITCOIN TO $106K? THE CHART SAYS YES!
🔥 Bitcoin could be preparing for a massive bullish reversal! A new BTC/USDT technical setup suggests the recent correction may be approaching a critical turning point. 📊 KEY LEVELS TO WATCH: 🟢 Current chart price: $74,555 🛡️ Major support: $71,154–$72,447 🎯 First upside target: $97,815 🚀 Bullish target: $106,211 The Elliott Wave projection suggests Bitcoin may be completing its corrective phase near a rising support trendline. 💥 WHAT HAPPENS NEXT? 🐂 Bullish scenario: If BTC holds the $71K–$72K support region and confirms a reversal, momentum could eventually push prices toward $98K and potentially $106K. 🐻 Bearish scenario: A sustained breakdown below $71K could invalidate the bullish setup and expose Bitcoin to further selling pressure. ⚡ The market is approaching a critical decision point. Is this the final shakeout before Bitcoin’s next explosive rally? 👀
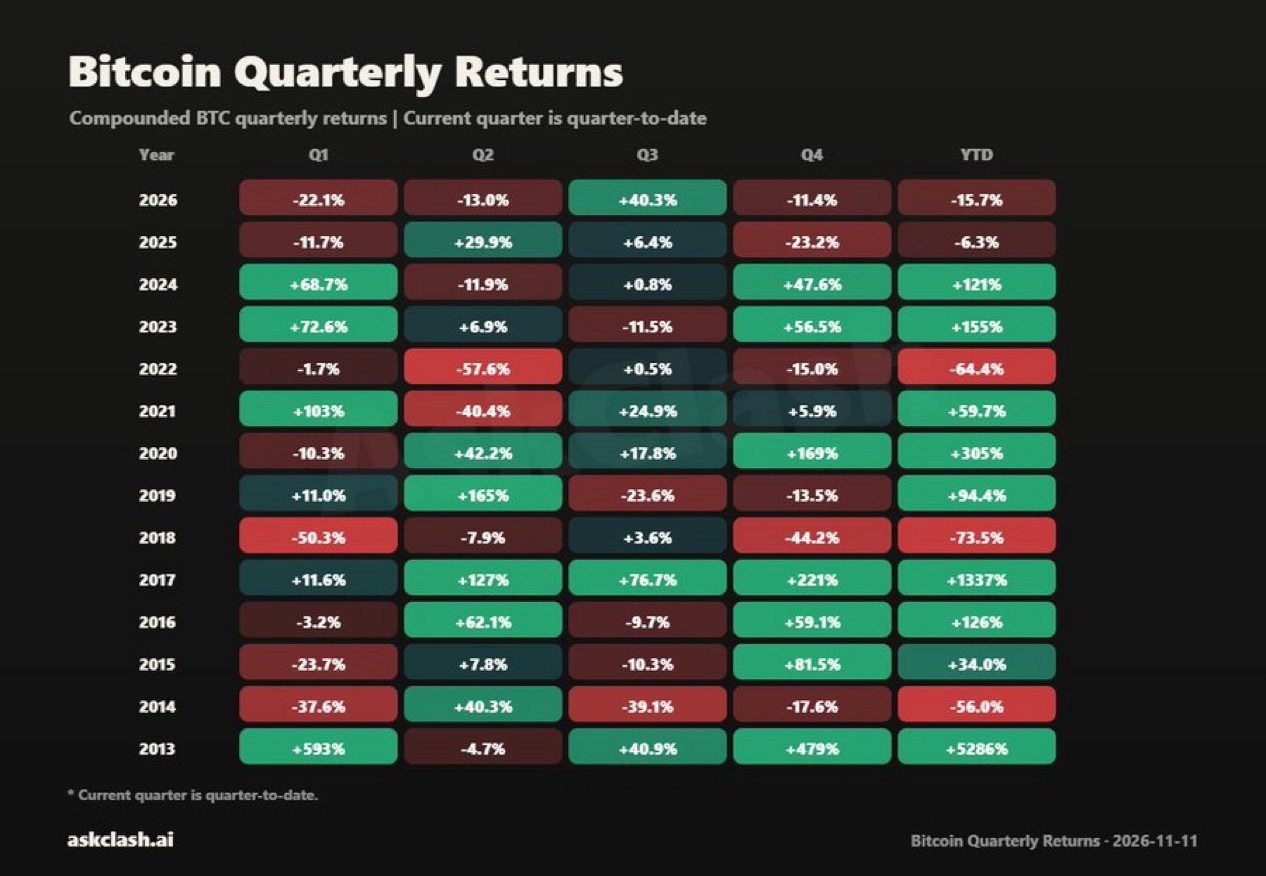
🚨 BITCOIN FACES A HISTORIC FIRST!
📉 Bitcoin could be heading toward something never seen before: TWO consecutive losing years! According to the reported figures: 🔴 2025: BTC dropped 6.3% 🔴 2026: BTC is down approximately 15.7% so far. 🔥 Bitcoin now needs a rally of roughly 18.6% before December 31 to finish 2026 in the green. But history tells an interesting story! 👀 📊 Previous Bitcoin recoveries: 🔴 2018: −74% 🟢 2019: +92% 🔴 2022: −64% 🟢 2023: +155% Every negative calendar year in Bitcoin’s history has been followed by a positive one. ⚠️ But 2026 could break that pattern. With less than two months remaining, Bitcoin bulls are running out of time. 🚀 Will BTC stage a massive year-end comeback, or will 2026 rewrite crypto history? 🐂 BULLISH or BEARISH? 🐻
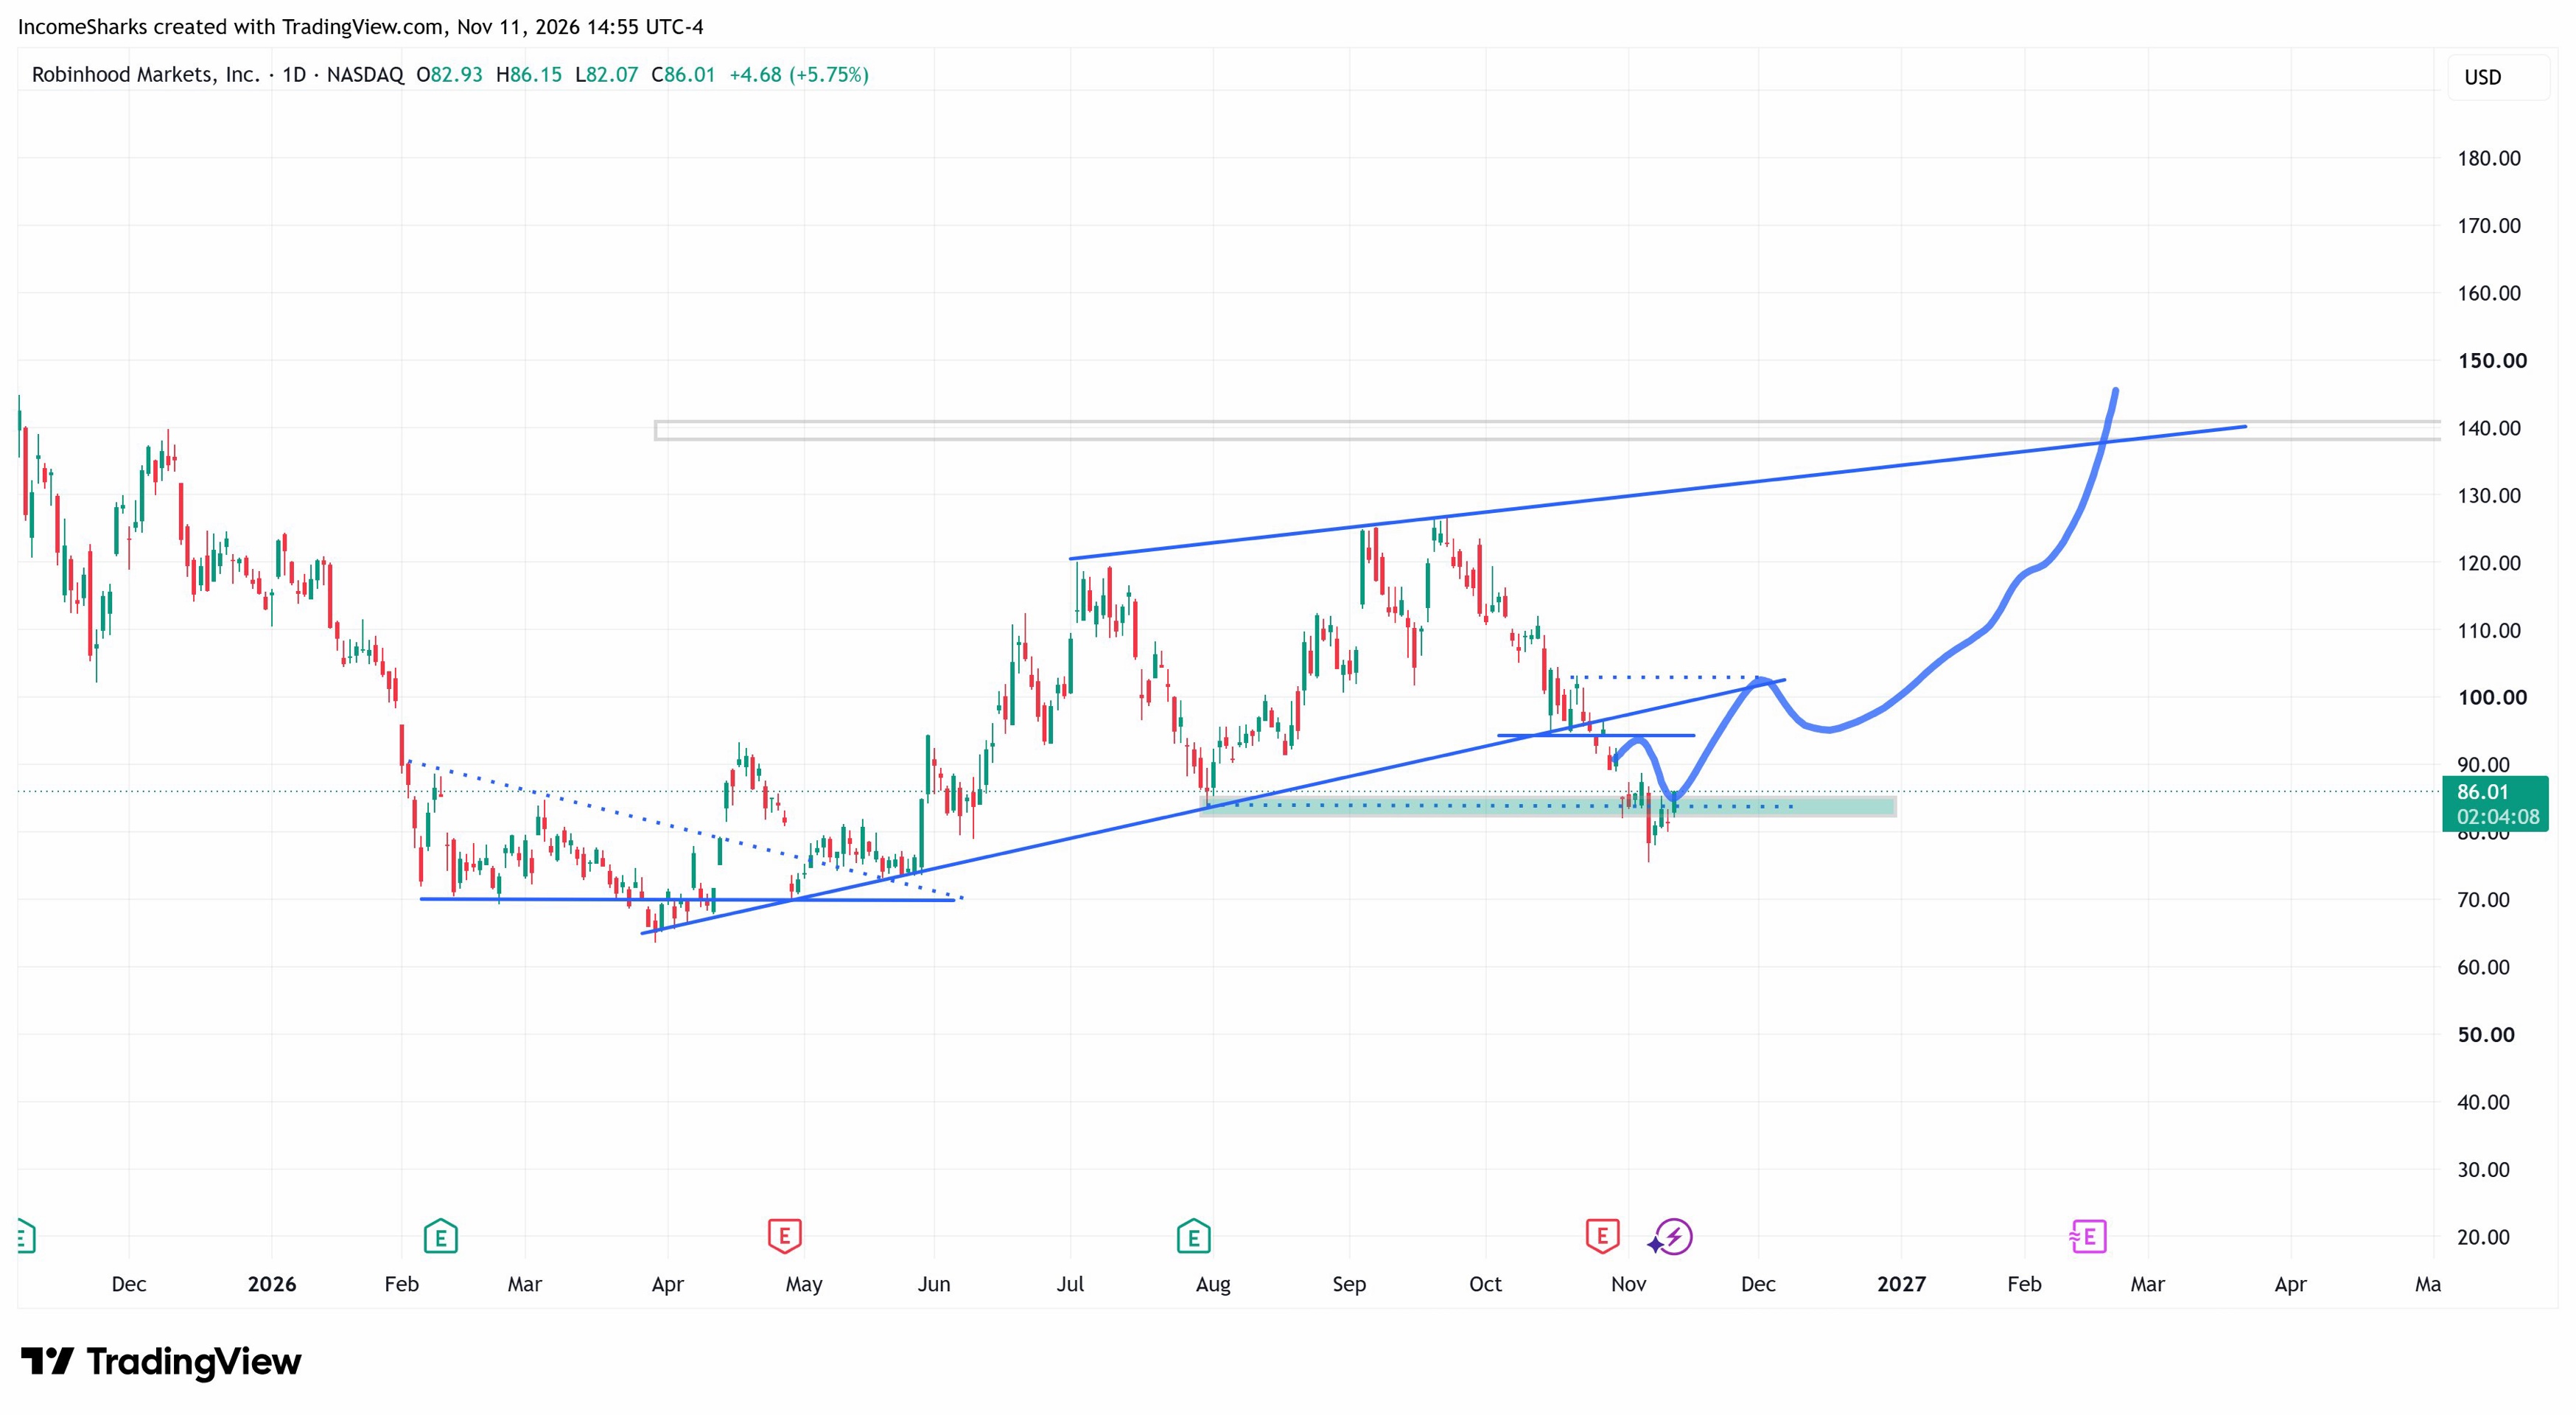
🚨 $HOOD: A MASSIVE 2027 RALLY AHEAD?
🔥 Robinhood ($HOOD) could be setting up for a major bullish reversal! The chart shows an interesting recovery setup as HOOD tests a crucial support zone around $83–$86. 📊 Here’s what traders are watching: 🟢 Key Support: $83–$86 📈 First Resistance: $95–$100 🚀 Potential Upside Target: $140–$145 The projected price path suggests a possible recovery toward $100, followed by a larger breakout attempt in 2027. 💥 The bigger picture? If Ethereum has established a bottom and the crypto market enters a strong recovery phase, Robinhood could benefit from renewed trading activity and investor enthusiasm. ⚠️ But the bullish scenario depends on support holding and buyers reclaiming resistance. Could $HOOD be one of the biggest winners of the next crypto rally? 👀
🚨 BITCOIN IS BIGGER THAN BANKING GIANTS!
🔥 Bitcoin’s rise is challenging the traditional financial world! The world’s largest cryptocurrency is now being compared with some of the biggest names in global finance: 🏦 Visa 🏦 Bank of America 🏦 HSBC 🏦 Allianz 💰 The claim? Bitcoin’s market cap exceeds all four combined! What started as an alternative to traditional finance has grown into a major global asset. 📈 No central bank. No corporate headquarters. Just a decentralized network with worldwide adoption. 🚀 Bitcoin isn’t just competing with traditional finance anymore. It’s changing the conversation. Are we witnessing the future of money? 👀 #WSOT2026 #AITechSelloffErases2Point5TrillionFromNasdaq100

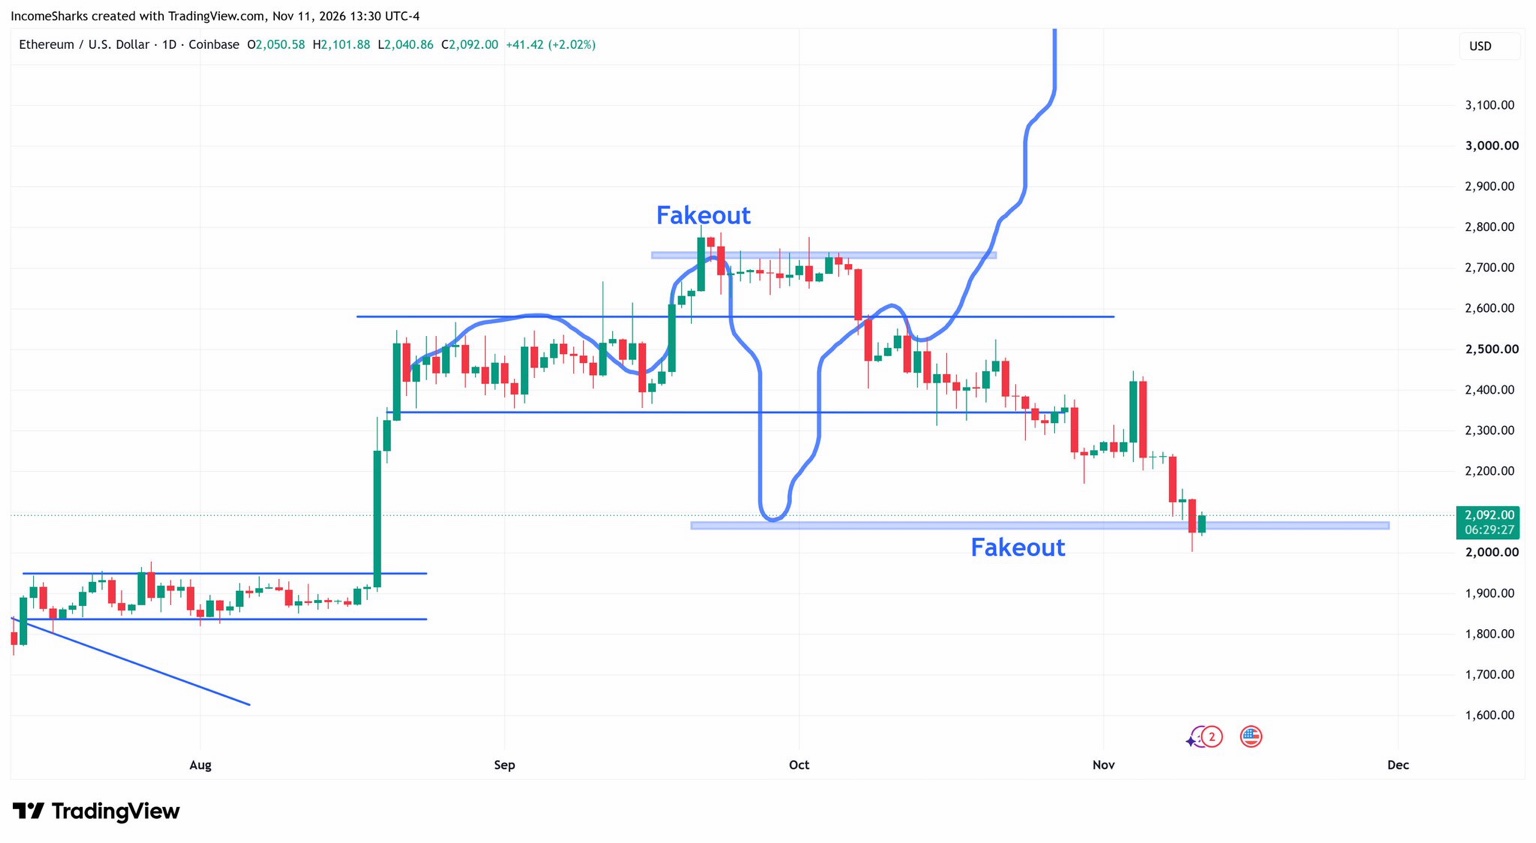
🚨 $ETH: BIG REVERSAL OR ANOTHER FAKEOUT?
Ethereum is approaching a critical moment as price tests the $2,050–$2,100 support zone. 📉 The previous fakeout near $2,750 triggered a sharp sell-off. 📊 Now ETH is testing the lower support area, exactly where the August chart suggested another potential fakeout. 🔥 WHAT HAPPENS NEXT? 🟢 Bullish scenario: ETH holds support, attracts buyers and starts reclaiming higher resistance levels. 🔴 Bearish scenario: ETH loses $2,050, potentially opening the door to further downside. The setup looks interesting, but confirmation is everything. 🚀 Could this be the beginning of Ethereum’s next major recovery? #ETH #WSOT2026
🚨 SHOCKING FED WARNING: A 50 BPS RATE HIKE COULD SHAKE STOCKS & CRYPTO! 📉 Wall Street may be underestimating the next big move from the Federal Reserve. 🏦 Bank of America has warned of a potential 50-basis-point rate hike in December, twice the standard 25-bps move. 🔥 Inflation is keeping the pressure on: 📊 Core CPI: +0.3% 📊 Headline CPI: +0.4% 📊 Estimated annual core PCE: 3.3% BofA also sees the possibility of another hike as early as January. What could this mean for markets? A more aggressive Fed could trigger fresh volatility across Bitcoin, altcoins and equities as tighter financial conditions weigh on risk appetite. ⚠️ But there’s a potential twist. Part of the inflation surprise may be linked to a temporary surge in oil prices. If energy prices continue falling, upcoming inflation data could tell a very different story. The next Fed decision could be a major turning point for risk assets. 🐂 Bullish or bearish for Bitcoin? 👀 #Bitcoin #Crypto #FederalReserve #Inflation #CPI #StockMarket