NNADOZIECOVENANT
3331Suka0Pembagian72Penggemar5Ikuti
YOUR MARKET ANALYST, AND NO.1 COMMUNITY BUILDER. That spot guy on BYBIT
YOUR MARKET ANALYST, AND NO.1 COMMUNITY BUILDER. That spot guy on BYBIT
Ekonomi Tiongkok saat ini
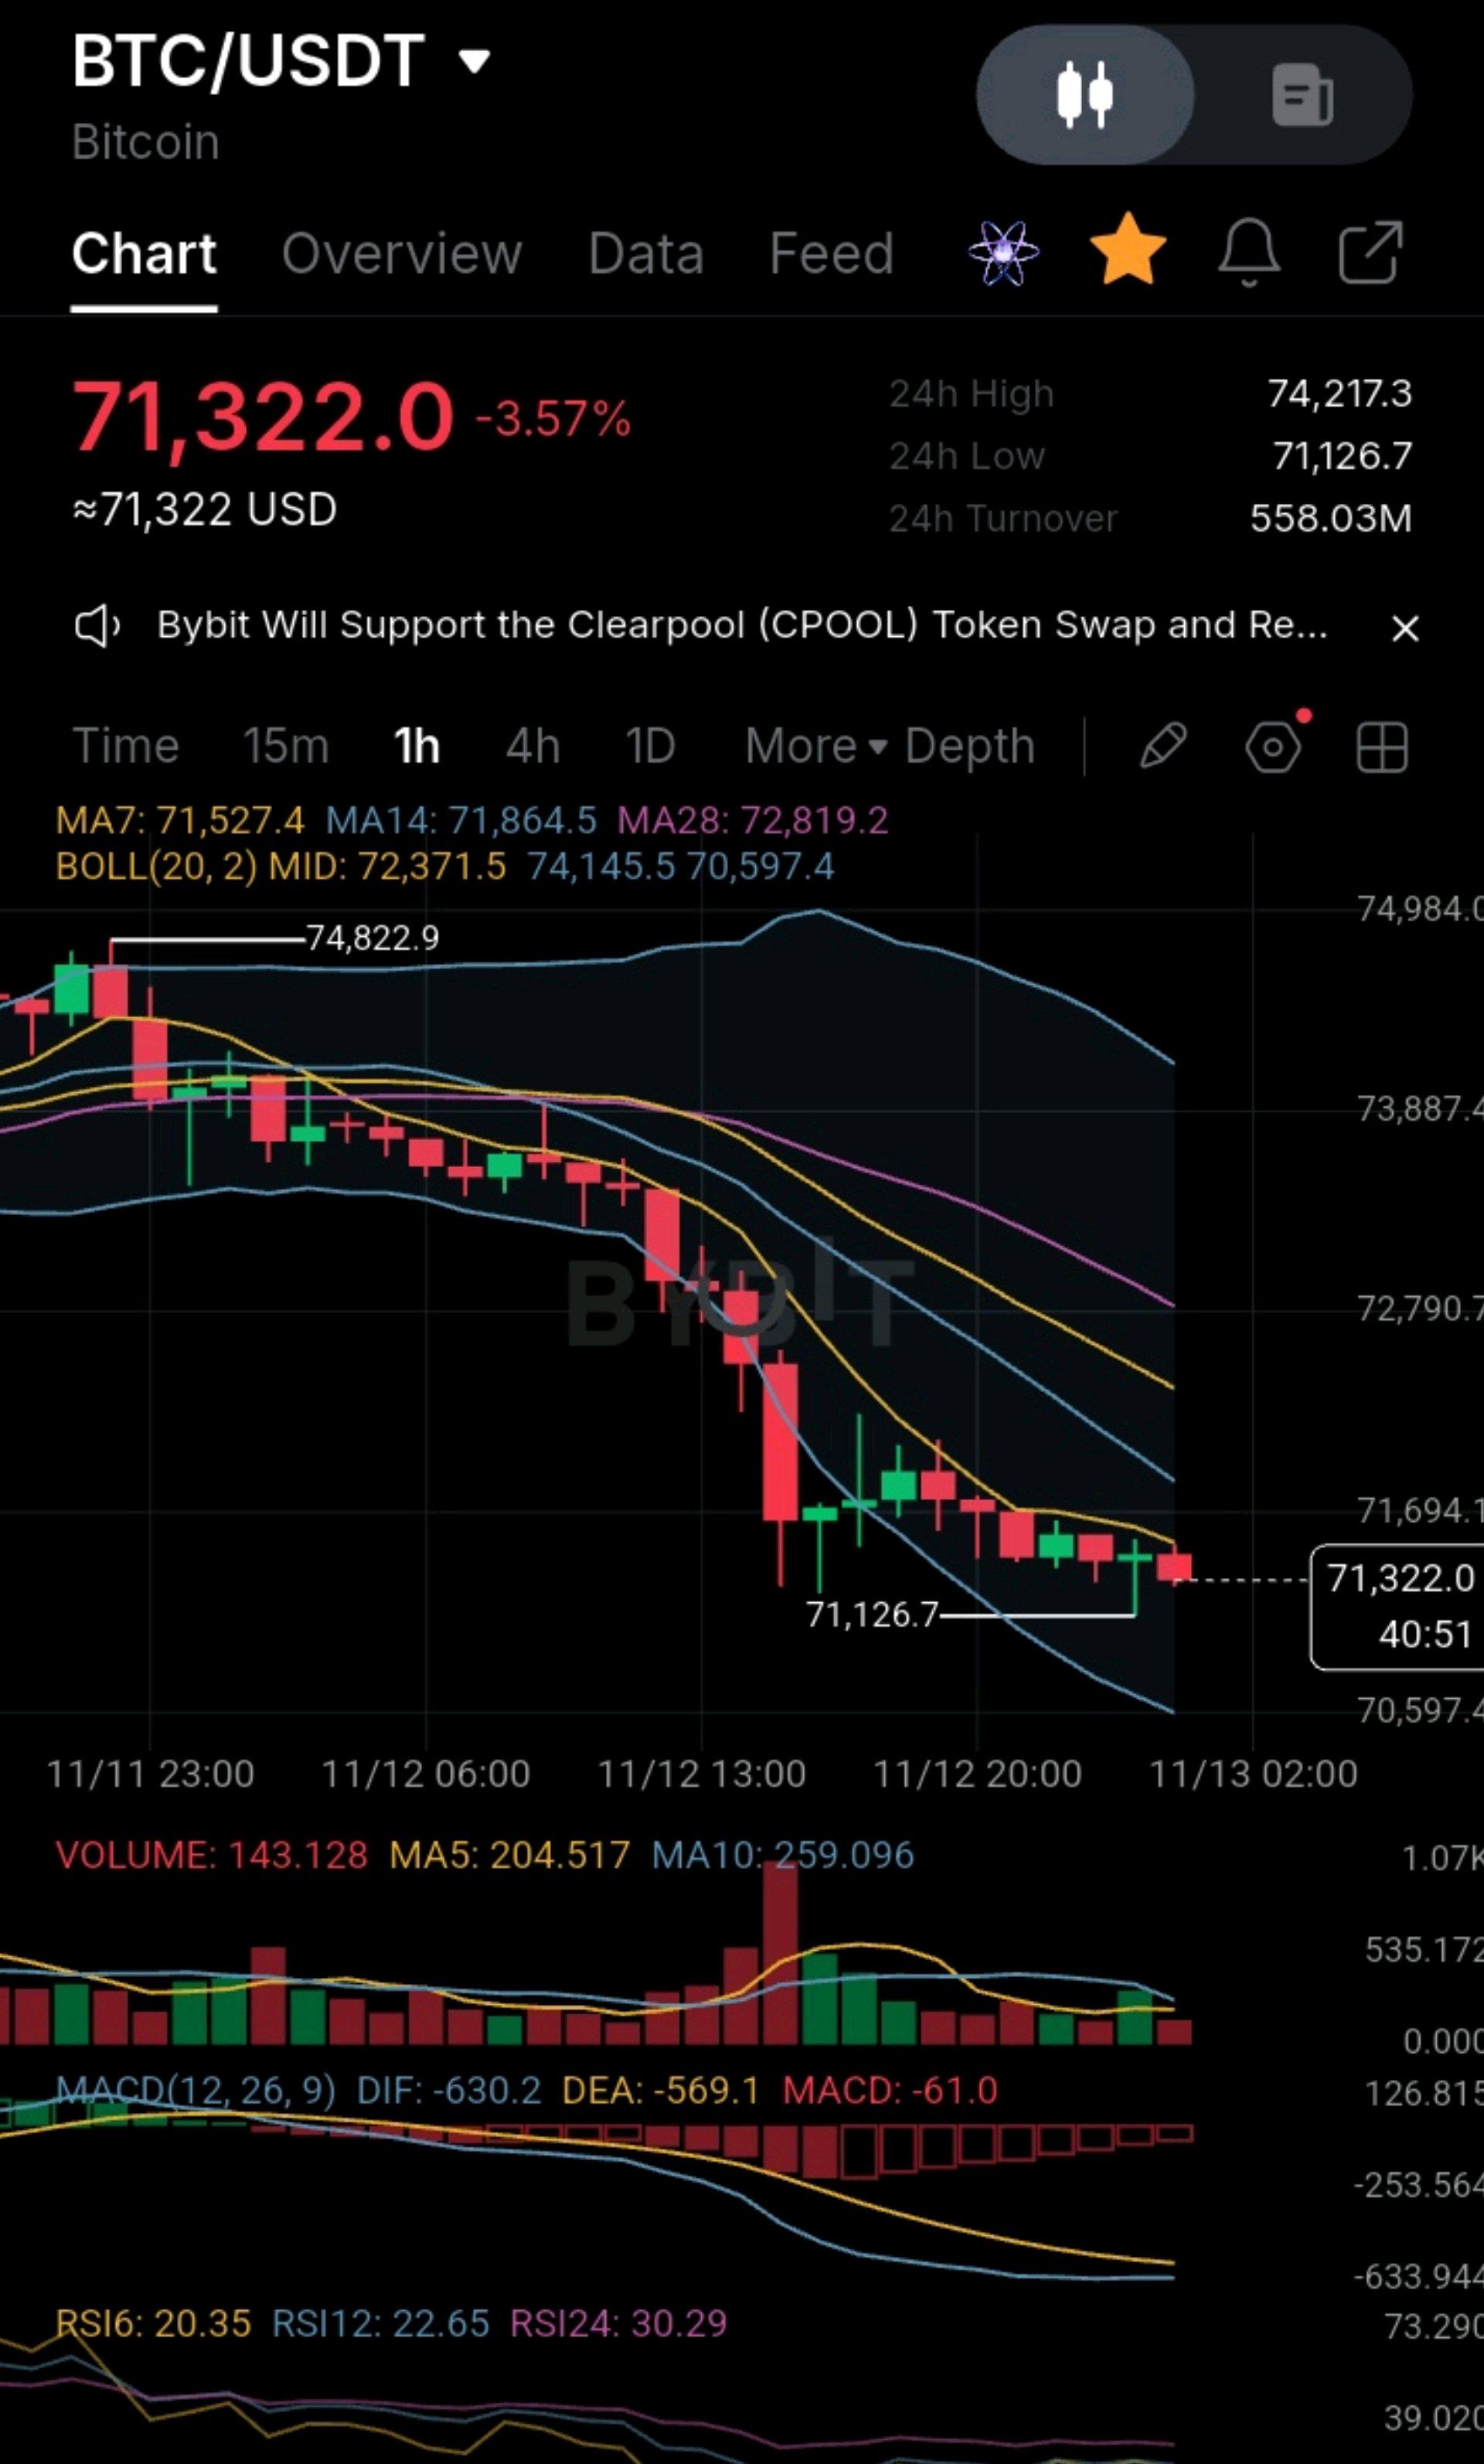
#ByXIMPACT #InflasiASMelonjakDanTaruhanKenaikanSukuBungaMeningkat #AnthropicIPOValuationTest #SanDiskMengumumkanPecahSaham8Untuk1 #BitcoinMencapaiTitikTerendahDuaBulanSetelahPemiluParuhWaktuAS Snapshot (13 November 2026): BTC diperdagangkan di sekitar $71.400, turun sekitar 4,1% dalam 24 jam dan 5,8% selama 7 hari terakhir. Sebulan yang lalu harganya mendekati $82.400, dan harga tertinggi sepanjang masa (all-time high) berada di sekitar $126.200. Indeks Fear & Greed berada di angka 29 (Takut). 🇨🇳 Kondisi ekonomi Tiongkok saat ini Harga: Harga produsen bulan Oktober naik 5,7% dari tahun ke tahun, kenaikan tercepat sejak Juni 2022, didorong oleh sektor pertambangan dan bahan baku. Harga konsumen hanya naik 0,7%, menyisakan kesenjangan sekitar lima poin persentase. Menurut pandangan saya, ini adalah tekanan biaya, bukan permintaan yang sehat, dan ini membuat langkah pelonggaran menjadi lebih sulit bagi Beijing. Pertumbuhan: gambaran yang tercampur. Satu laporan menyebutkan pertumbuhan kuartal ketiga dan penjualan ritel bulan September melampaui ekspektasi, setelah kuartal kedua yang lemah di angka 4,3%. Kebijakan: laporan kuartalan terbaru PBOC tidak lagi mencantumkan janji untuk memperkenalkan kebijakan tambahan, dan para analis melihat pertemuan kebijakan tahunan bulan Desember sebagai jendela berikutnya untuk stimulus baru. Bank sentral masih mengakui adanya pasokan yang kuat di tengah permintaan yang lemah. Yuan: mata uang ini telah menguat sekitar 5% tahun ini, dan PBOC menaikkan rasio cadangan devisa menjadi 6%, efektif mulai 15 November, untuk memperlambat penguatan tersebut. Saham: Ekuitas Tiongkok mengalami penurunan selama 12 minggu berturut-turut yang mencetak rekor, dan bank sentral serta regulator dijadwalkan untuk bertemu guna membahas dukungan pasar saham. Bagaimana Tiongkok memengaruhi BTC Likuiditas dan kredit. Beberapa analis berpendapat bahwa uang dan kredit dalam sistem Tiongkok memiliki dampak yang mendalam terhadap Bitcoin. Stimulus baru atau pertumbuhan kredit akan menjadi sentimen positif (tailwind), dan ketiadaannya menjadi sentimen negatif (headwind). Angka kredit dan pasokan uang akan dirilis minggu ini. Selera risiko. Data Tiongkok yang lemah dan penurunan saham Tiongkok cenderung mendorong pasar global ke arah risk-off (menghindari risiko), yang memukul kripto. Mata uang dan dolar. Yuan yang lebih kuat biasanya dibarengi dengan dolar yang lebih lemah, yang membantu BTC. Namun, indeks dolar AS baru saja mencapai level tertinggi dalam 19 bulan, dan langkah devisa PBOC sedikit memperketat likuiditas dolar di dalam negeri. Regulasi. Tindakan keras Tiongkok menargetkan bursa luar negeri, stablecoin, dan aset yang ditokenisasi, sehingga pembelian langsung dari Tiongkok terbatas. Sebaliknya, Beijing mendorong yuan digital sebagai bagian inti dari rencana 2026-2030 mereka. Apakah Tiongkok adalah pendorong utama? Tidak. Laporan mencatat bahwa ETF spot AS dan Eropa kini mendikte siklus kripto global, mengurangi dampak historis dari pergerakan yang dipimpin Asia. Tekanan besar baru-baru ini berasal dari pihak AS: data inflasi AS yang tinggi mengirim BTC ke level terendah sejak Agustus dan berada di bawah EMA 200 hari di $76.418, dan ETF spot AS mengalami kerugian $515 juta pada bulan Oktober, arus keluar bulanan pertama mereka sejak Juni. Tiongkok adalah faktor sekunder dan sebagian besar bekerja melalui sentimen risiko global. 📈 Skenario BTC (ilustratif, bukan prediksi) Skenario dasar, bergerak dalam kisaran dengan bias penurunan: satu pandangan melihat kisaran $70.000-$78.000 hingga akhir November. Rata-rata 200 hari di $76.418 dan 100 hari di $77.483 membentuk batas atas di atas harga. Skenario bearish: penembusan berkelanjutan di bawah $70.000 membuka jalan ke sekitar $69.000, lalu sekitar $63.800. Pengulangan bulan November tahun 2022 akan menempatkan BTC di dekat $65.500. Skenario bullish: merebut kembali $73.000-$73.200 (area 200 hari), lalu sekitar $78.000, dengan $79.300 sebagai resistance berikutnya. Mencapai angka pertengahan $80.000-an memerlukan perubahan nyata dalam kondisi makro. Katalis untuk dipantau: Data uang dan kredit Tiongkok minggu ini, aturan devisa 15 November, pertemuan kebijakan Tiongkok bulan Desember, arus masuk ETF AS, dan data inflasi AS berikutnya. Hati-hati dengan prakiraan. Mereka sangat berbeda. Kisaran tahun 2026 mencakup $47.100 hingga $87.900 dari satu sumber dan $74.900 pada akhir tahun dengan kisaran $68.100-$82.400 dari sumber lain. Pada bulan Agustus, beberapa situs memproyeksikan $90.000-$105.000 untuk bulan November, yang tidak terjadi. Tidak ada yang bisa memprediksi pergerakan berikutnya dengan pasti. Kecenderungan saya sendiri adalah berhati-hati: saya akan tetap defensif selama BTC berada di bawah rata-rata 200 hari (sekitar $76,4 ribu), dan saya akan menjadi lebih konstruktif hanya jika level tersebut berhasil direbut kembali dengan kembalinya arus masuk ETF. Untuk pemula: jangan trading berdasarkan berita utama tentang Tiongkok tanpa memeriksa level harga, gunakan ukuran posisi kecil, gunakan stop loss, dan hindari leverage di pasar yang sedang dalam kondisi "takut". Ini adalah analisis untuk diskusi, bukan nasihat keuangan. Harga dan prakiraan berubah dengan cepat, jadi periksa data langsung sebelum bertindak. $BTCUSDT


POSISI PAUS (versi jujur)
#IMPACTbyTrade #InflasiASMelonjakDanTaruhanKenaikanSukuBungaMeningkat #WSOT2026 #Pantauan IHK AS November #Data Penggajian AS dan Keputusan Suku Bunga Mendorong Pekan Makro 🐋 POSISI WHALE (versi jujur) BARD: risiko utama terkait whale adalah pasokan terjadwal. Investor swasta dijadwalkan mendapatkan 20% dari pasokan dengan 12 bulan cliff dan 36 bulan vesting, dan unlock untuk investor serta tim dilaporkan dipercepat mulai September 2026. Unlock dalam jumlah besar dapat menambah tekanan jual, jadi periksa tanggal unlock saat ini. Satu snapshot lama menunjukkan volume perp sekitar 14x volume spot, yang menunjukkan trader leverage menggerakkan sebagian besar aksi, tetapi data tersebut tidak bertanggal. KOR: listing baru biasanya berarti pemegang awal yang terkonsentrasi, float kecil, dan spekulasi berat. Satu snapshot menunjukkan open interest perp sekitar $1,1 juta dan funding rate positif 0,0294% per 8 jam, yang berarti posisi long harus membayar untuk menahan posisi, yang bisa dengan cepat terlikuidasi. Investor Seri A mengumpulkan dana pada valuasi $100 juta pada Juli 2026, jadi mungkin ada pemegang awal yang memegang posisi terkunci dalam jumlah besar. Itu adalah risiko untuk diverifikasi, bukan kesimpulan. Gunakan Arkham dan Nansen untuk label wallet, halaman pemegang di explorer (Etherscan untuk BARD, Basescan untuk KOR), Coinglass untuk open interest dan funding, serta dokumen proyek untuk tanggal unlock. 📈 INTERPRETASI TEKNIKAL BARD: breakout yang sudah mulai retrace. Harga berada di atas MA14 tetapi di bawah MA7, volume memudar, dan RSI tinggi (RSI6 67,24, RSI12 71,40, RSI24 69,54). Resistance di 0,1272 (MA7), lalu 0,1418 dan 0,1428. Support di 0,1087 (MA14), 0,1014 (BB tengah), 0,0961 (MA28), lalu 0,0806. KOR: tren lebih kuat yang secara berbahaya sudah jenuh (stretched). Strukturnya bullish, tetapi RSI6 di 75,45 dan gap hampir 50% di atas MA14 menyarankan untuk bersabar. Resistance di 0,000629, lalu sekitar 0,000680 (estimasi). Support di 0,000546 (upper band), sekitar 0,000528 (zona lonjakan sebelumnya), 0,000479 (MA7), lalu 0,000403/0,000396 dan low di 0,000301. Skor singkat: Tren jangka pendek: KOR lebih kuat. BARD sudah kehilangan MA7-nya. Momentum: keduanya memiliki cross MACD ke atas yang baru. Volume KOR bertahan lebih baik, dan volume BARD memudar dengan cepat. Ekstensi: BARD tidak terlalu stretched. KOR jauh lebih stretched. Kematangan proyek: BARD jelas lebih mapan. KOR baru berumur beberapa hari. Risiko keseluruhan: KOR jauh lebih tinggi, dan risiko BARD adalah overhang unlock. Area entry terbaik: BARD di 0,1090-0,1130 (MA14). KOR di 0,000480-0,000500 (MA7), yang sekitar 16-19% di bawah harga saat ini. 🧭 SARAN UNTUK PEMULA Jangan mengejar candle +45%. Keduanya lebih baik dibeli setelah pullback daripada di harga tertinggi. Berhati-hatilah dengan listing yang benar-benar baru. KOR sudah turun sekitar 98% dari harga tertinggi saat listing, dan pantulan di dalamnya bukanlah perubahan tren. Periksa jadwal unlock. Unlock terjadwal yang besar, seperti milik BARD, dapat terus menekan harga bahkan ketika chart terlihat bagus. Perhatikan funding rate. Funding rate positif yang tetap tinggi, seperti yang terjadi pada KOR di snapshot, berarti posisi long terlalu ramai dan rentan. Gunakan limit order pada token dengan likuiditas tipis, karena spread dan slippage memakan uang sungguhan. Selalu pasang stop loss sebelum masuk, dan jangan pindahkan setelah Anda berada dalam perdagangan. Risikokan hanya 1-2% dari akun Anda per perdagangan. Dengan stop loss yang lebar ini, itu berarti posisi kecil. Jangan gunakan leverage sampai Anda konsisten. 🎯 PANDANGAN SAYA Secara risk-adjusted, BARD adalah kandidat yang lebih baik: lebih mapan, tidak terlalu stretched, dan dengan zona pullback yang jelas. Saya menginginkan pantulan di MA14 atau reclaim di 0,1272 dengan volume meningkat. KOR memiliki chart yang lebih kuat saat ini, tetapi ini adalah listing berkapitalisasi kecil yang baru berumur beberapa hari dan hampir 50% di atas rata-ratanya, jadi jika Anda memperdagangkannya, jaga ukuran posisi tetap kecil dan tunggu pullback ke zona MA7. Jangan mengejar (chase) keduanya di sini. Call to action: Mana yang bertahan lebih baik jika pasar mendingin, $BARDUSDT atau $KORUSDT? Tulis pilihan Anda 👇 dan atur peringatan di BARD 0,1272 / 0,0990 dan KOR 0,000629 / 0,000440, lalu beri tahu saya apakah Anda menunggu pullback atau breakout. Ini adalah analisis teknikal untuk diskusi, bukan nasihat keuangan. Listing baru dan token berkapitalisasi kecil sangat fluktuatif dan Anda bisa kehilangan seluruh modal Anda, jadi gunakan batasan risiko Anda sendiri dan selalu gunakan stop loss. Angka kapitalisasi pasar dan unlock berasal dari situs data yang datanya tidak selalu sinkron dan tidak selalu memiliki tanggal, jadi periksa secara langsung sebelum mengandalkannya. Beri tahu saya di kolom komentar, situs data apa yang Anda gunakan untuk riset. $BTCUSDT $KORUSDT

KEKUATAN DAN KELEMAHAN PASAR
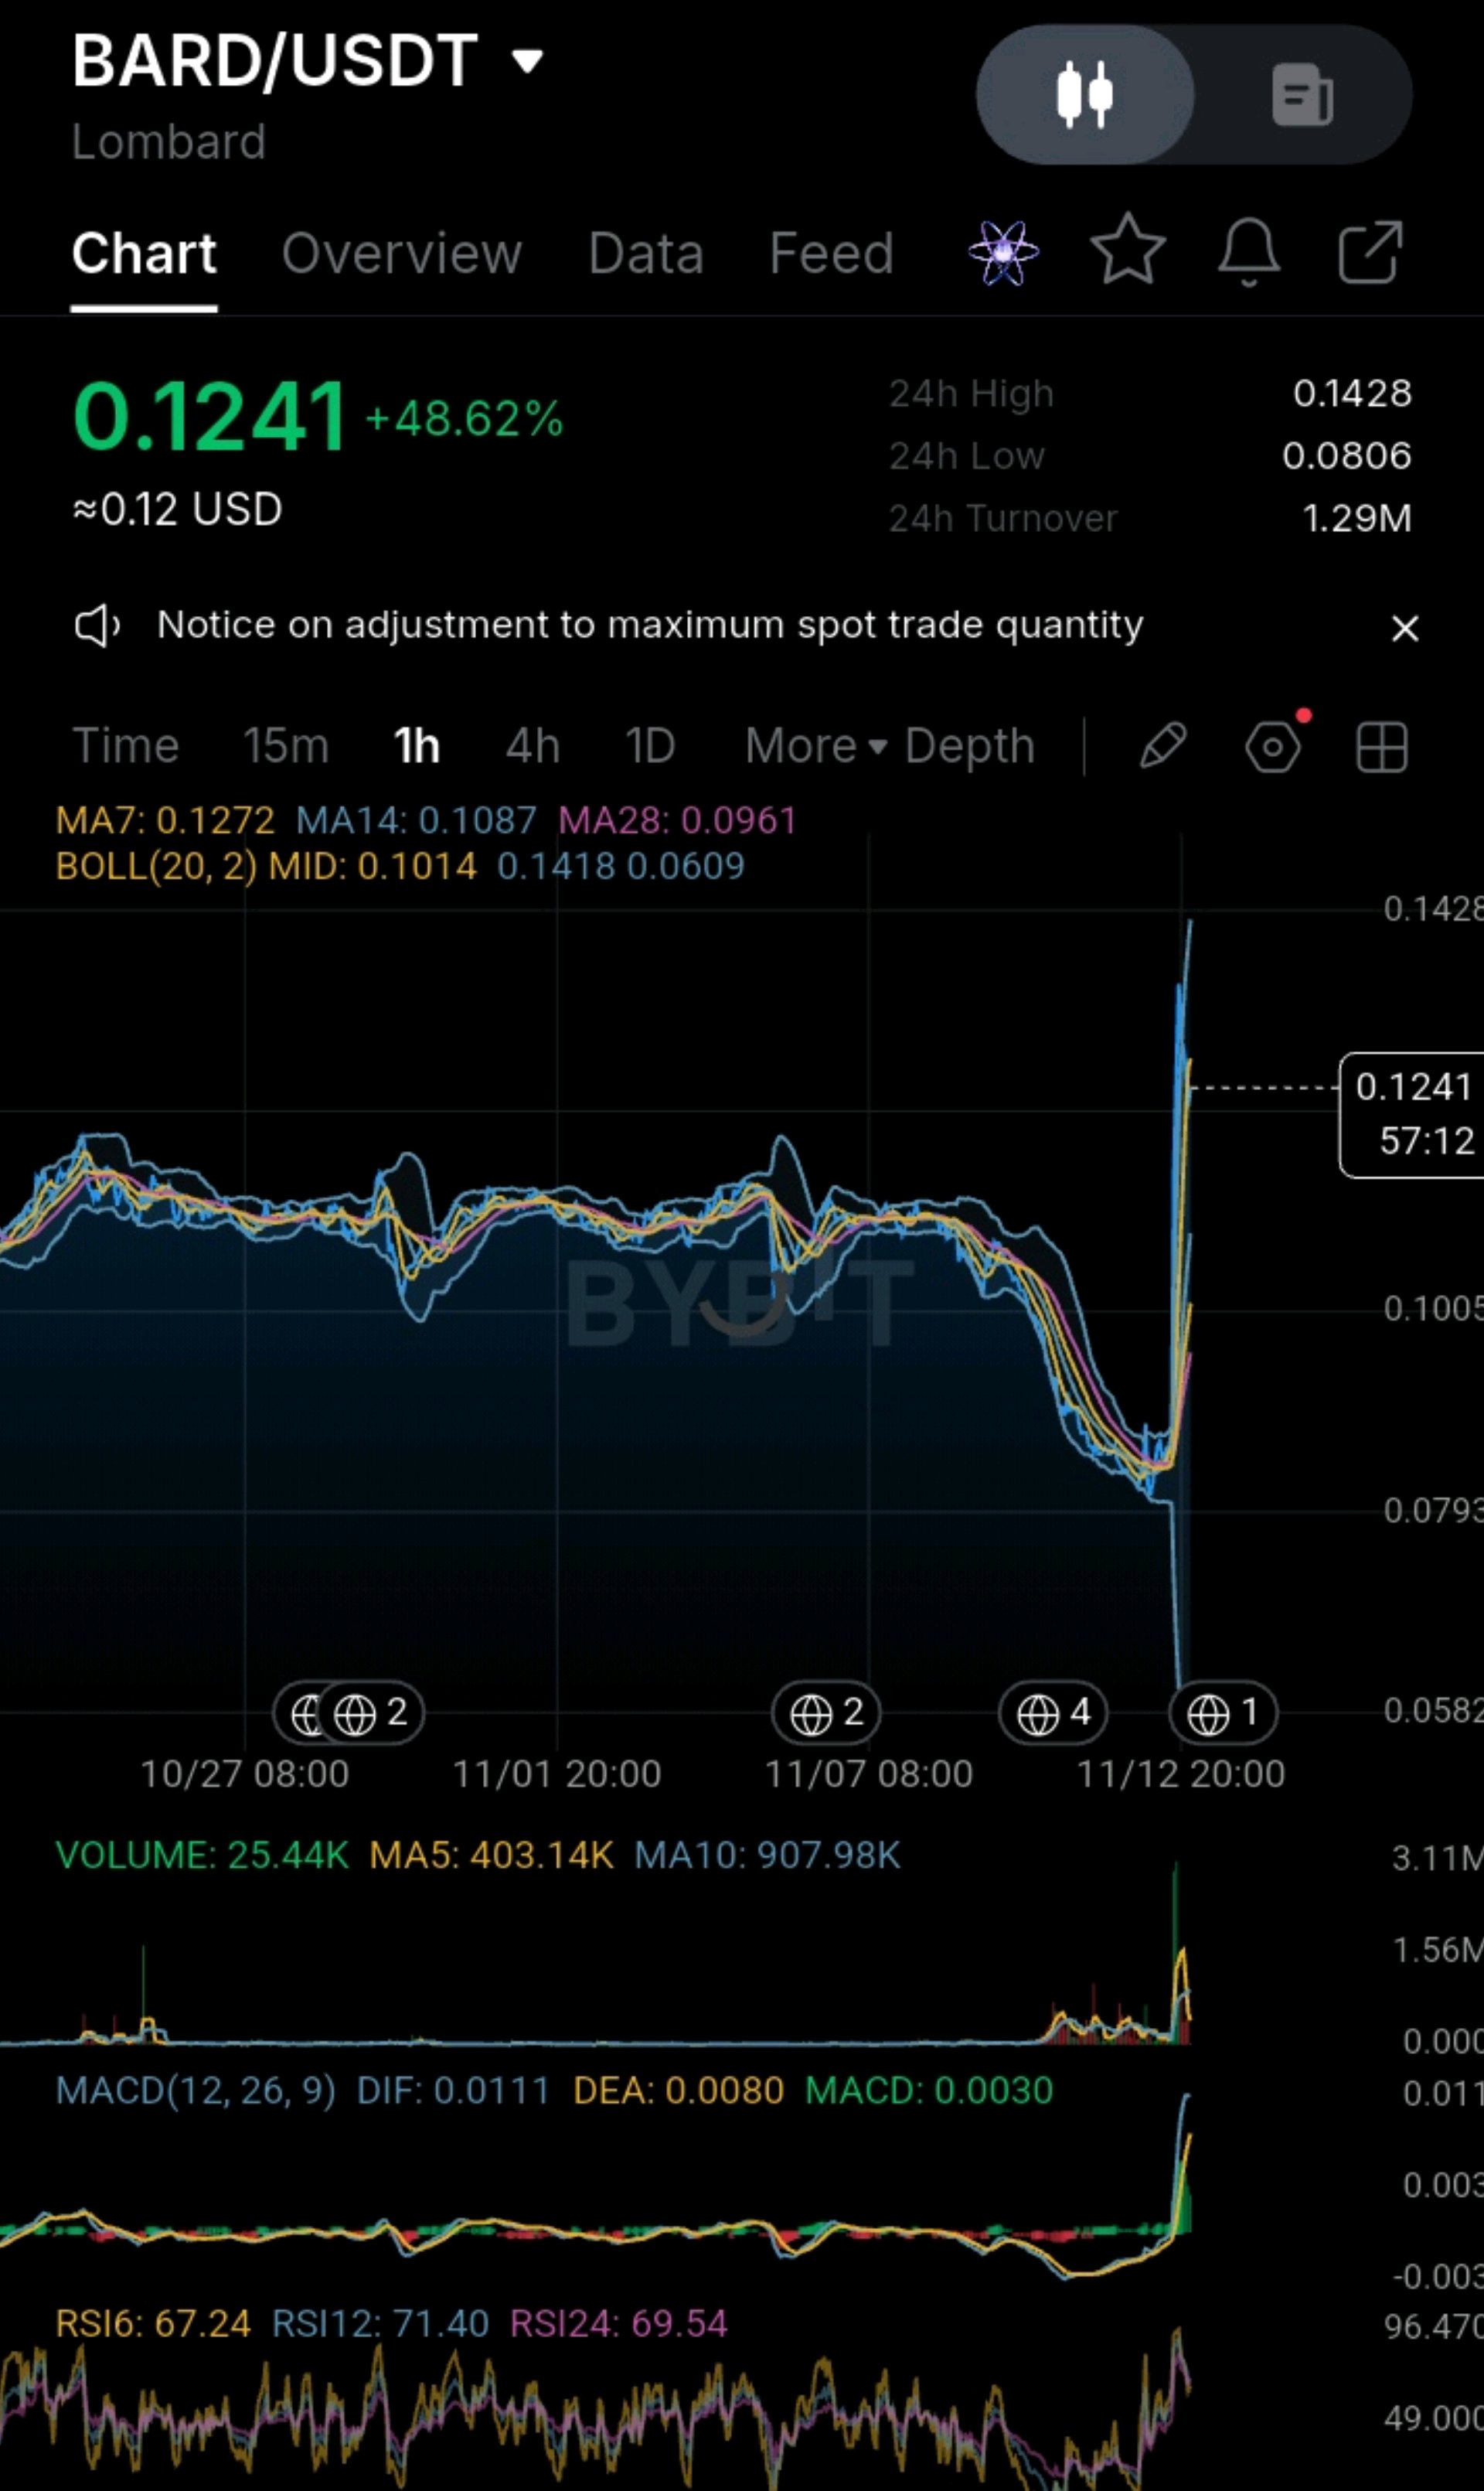
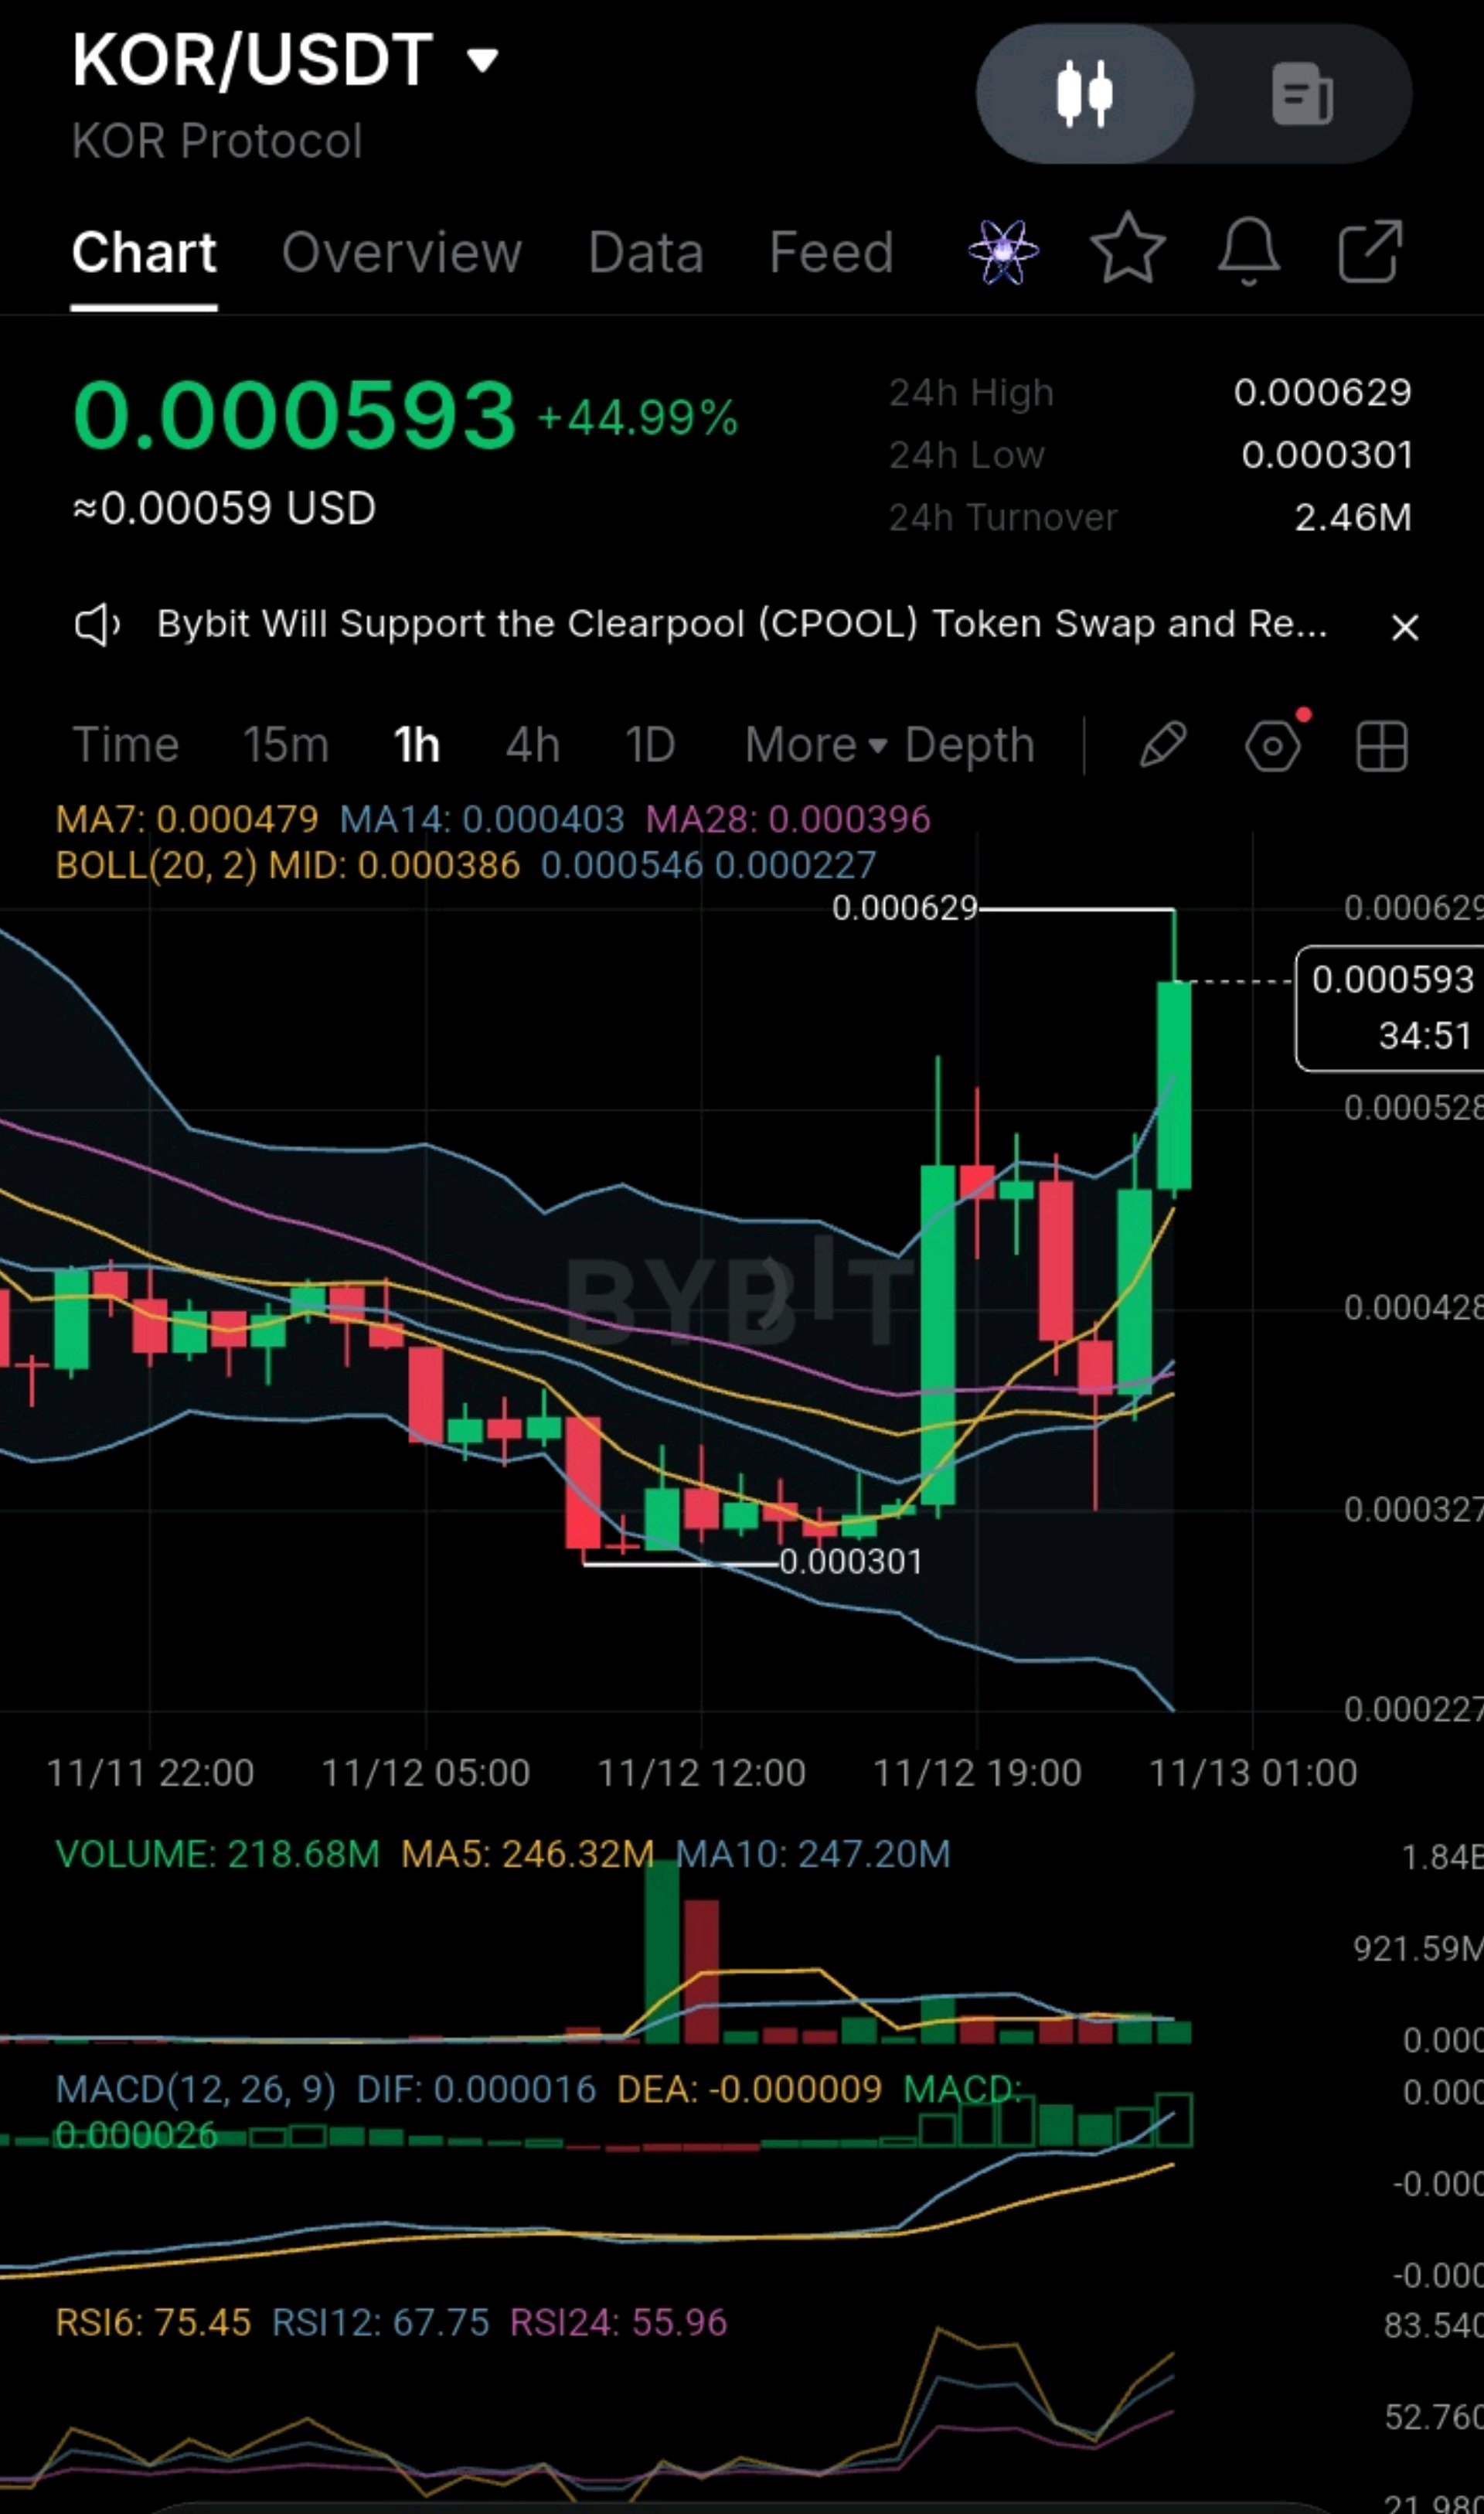
#ByXIMPACT #InflasiASMelonjakDanTaruhanKenaikanSukuBungaMeningkat #AnthropicIPOValuationTest #WSOT2026 #BitcoinMencapaiTitikTerendahDuaBulanSetelahPemiluParuhWaktuAS $BARD vs $KOR 🥊 Setup mana yang lebih kuat setelah hari yang besar? Kedua token naik 45-49% pada grafik 1 jam, tetapi keduanya adalah aset yang sangat berbeda di posisi yang sangat berbeda. BARD adalah protokol yang lebih mapan yang sudah mulai melepaskan kenaikannya. KOR adalah listing yang baru berumur beberapa hari yang baru saja menembus harga tertinggi 24 jam baru. ⚡ KEKUATAN DAN KELEMAHAN PASAR $BARD (0,1241, +48,62%) ✅ Kekuatan: harga berada di atas MA14 (0,1087), MA28 (0,0961) dan garis tengah Bollinger (0,1014), jadi penembusan dari kisaran (range) masih bertahan. MACD bersilangan ke atas (DIF 0,0111 vs DEA 0,0080). ✅ Kekuatan: harganya jauh lebih stabil, hanya sekitar 14% di atas MA14. Lombard juga merupakan protokol staking Bitcoin nyata yang didukung oleh Polychain, Franklin Templeton, dan Binance Labs. ⚠️ Kelemahan: harga sudah turun kembali di bawah MA7 (0,1272) setelah harga tertinggi 0,1428 ditolak di pita atas (0,1418). Volume memudar dengan cepat (MA5 403,14K vs MA10 907,98K). ⚠️ Kelemahan: gambaran suplai cukup berat. Hanya 22,5% dari suplai yang beredar saat peluncuran, dan satu laporan menyebutkan alokasi investor dan tim, sekitar 45% dari suplai, beralih ke unlock linear penuh mulai September 2026. Token ini juga jauh di bawah harga tertinggi sepanjang masa (ATH) Maret 2026 yang sekitar $1,70. $KOR (0,000593, +44,99%) ✅ Kekuatan: strukturnya jauh lebih bersih untuk jangka pendek, dengan harga terendah yang lebih tinggi (higher low), harga tertinggi yang lebih tinggi (higher high), dan harga tertinggi 24 jam baru di 0,000629. Harga berada di atas MA7 (0,000479), MA14 (0,000403) dan MA28 (0,000396), dan MACD bersilangan ke atas (DIF 0,000016 vs DEA -0,000009). ✅ Kekuatan: perputaran (turnover) solid untuk ukurannya (2,46 juta), dan volume stabil (218,68 juta vs MA5 sebesar 246,32 juta). ⚠️ Kelemahan: harganya sangat meluas (extended), sekitar 47% di atas MA14 dan di atas pita atas (0,000546), dengan RSI6 di 75,45 dan terdapat sumbu penolakan (rejection wick) di bagian atas. ⚠️ Kelemahan: ini adalah listing yang benar-benar baru. KOR diluncurkan dengan listing perdana dunia di KuCoin pada 4 November 2026, dan satu situs data menunjukkan harga tertinggi hari peluncuran sekitar $0,032, jadi bahkan setelah lonjakan hari ini, harganya sekitar 98% di bawah harga tersebut. Hanya sekitar 23% dari 10 miliar suplai yang dilaporkan beredar. ⚠️ Kelemahan: menurut perhitungan saya, 0,000593 dengan 2,28 miliar token yang beredar menghasilkan kapitalisasi pasar hanya sekitar $1,4 juta, dengan nilai terdilusi penuh (fully diluted value) mendekati $5,9 juta. Itu adalah basis yang sangat kecil untuk perputaran harian $2,46 juta. $BARDUSDT $KORUSDT

KOR turun perlahan
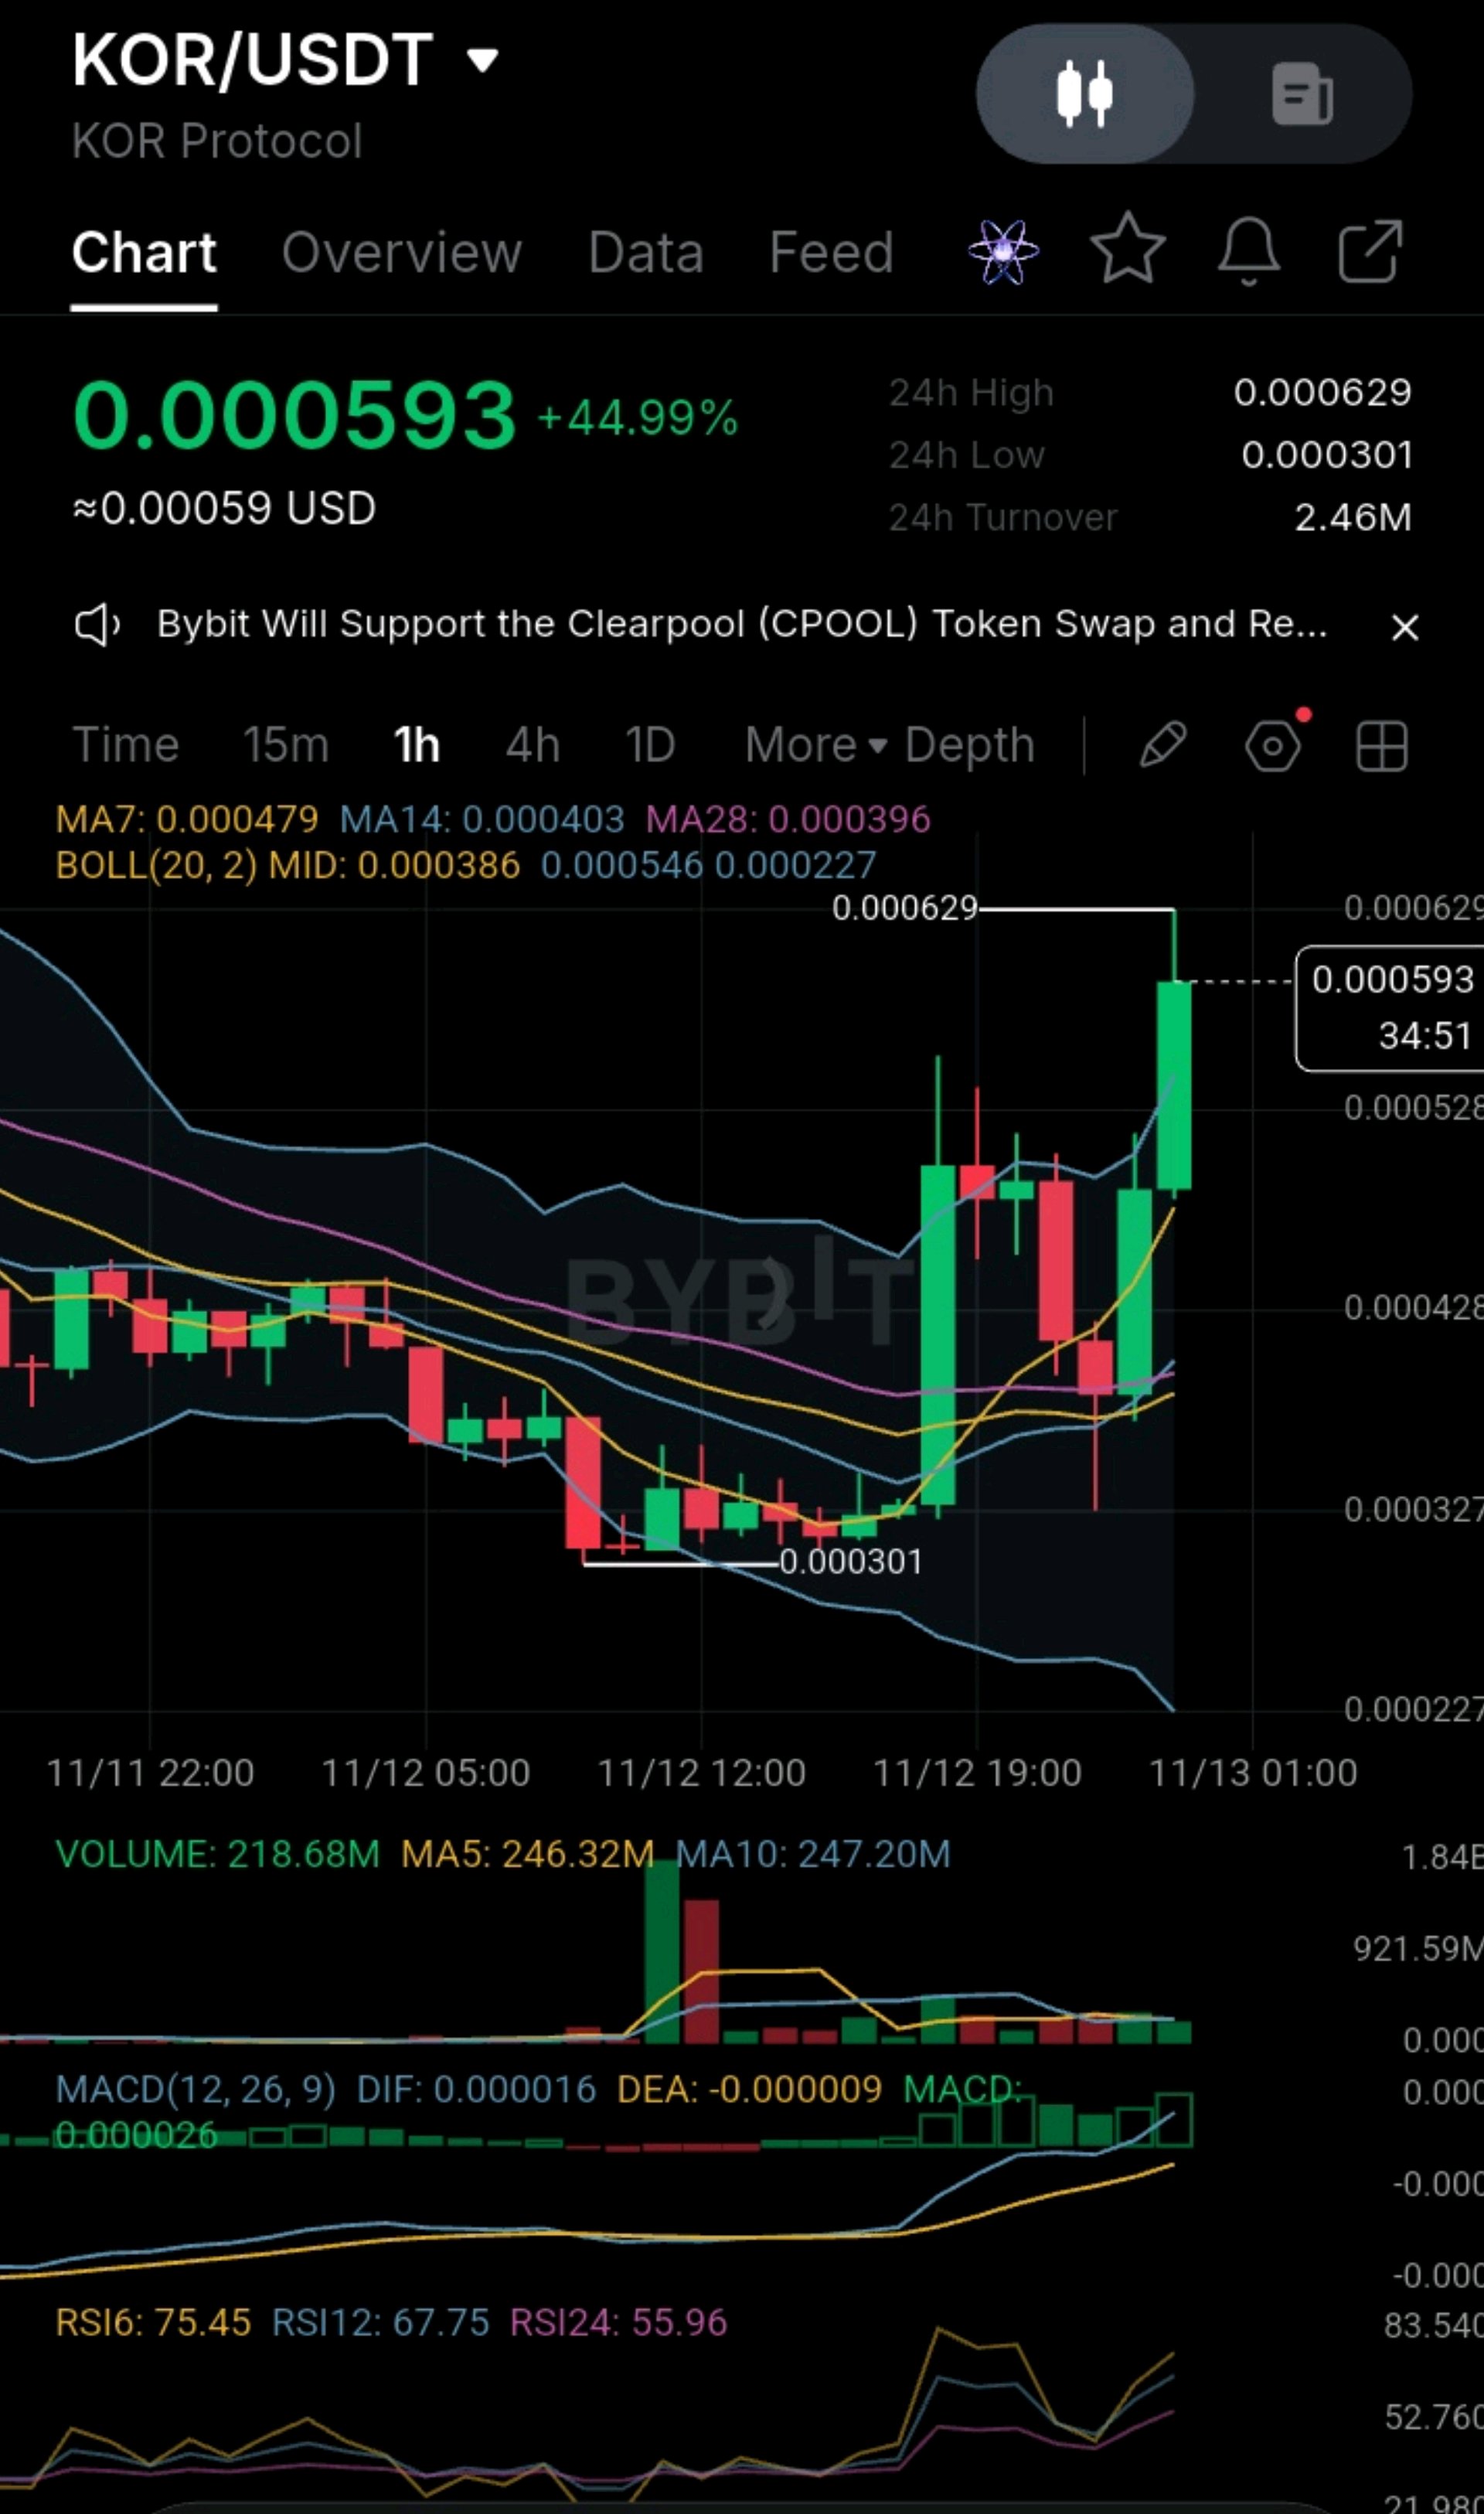
#IMPACTbyTrade #InflasiASMelonjakDanTaruhanKenaikanSukuBungaMeningkat #WSOT2026 #BitcoinMencapaiTitikTerendahDuaBulanSetelahPemiluParuhWaktuAS #DeutscheBankMeluncurkanPenyimpananAsetDigital $KORUSDT: Kesalahan terbesar dalam setup ini adalah menganggap candle vertikal +45% sebagai support yang terkonfirmasi. Lihat grafik 1 jam. KOR sempat turun ke level terendah 0.000301, lalu meluncur naik dengan candle bervolume besar dan terkoreksi (pullback) ke sekitar 0.00035. Pembeli kembali masuk dan mendorong harga menembus level tertinggi sebelumnya ke level tertinggi 24 jam baru di 0.000629. Saat ini diperdagangkan di 0.000593, naik 44,99% hari ini. Setelah penurunan panjang, pasar telah menemukan dasar (floor), dan itu penting. Reaksi dari level terendah 0.000301 sangat kuat. Pembeli mendorong KOR di atas MA7 (0.000479), MA14 (0.000403), dan MA28 (0.000396), menunjukkan bahwa permintaan belum sepenuhnya hilang. Namun, dorongan terakhir sudah terhenti di dekat 0.000629 dan diperdagangkan di atas Bollinger Band atas (0.000546). Itu detail penting. Pembeli telah menunjukkan kekuatan saat naik, namun mereka belum membuktikan bisa mempertahankan level tertinggi. Puncak 0.000629 ditolak dengan sumbu atas, dan volume saat ini (218,68 juta) berada di bawah MA5 (246,32 juta) dan MA10 (247,20 juta), jauh di bawah bar breakout pertama. Candle masih terbuka, jadi ini bisa berubah. Perspektif Pasar Saya Indikator menambah bukti yang menarik. MACD telah bersilangan ke atas (DIF 0.000016 di atas DEA -0.000009, histogram +0.000026), dan strukturnya menunjukkan higher low dan higher high. Namun, pergerakan itu terjadi di pasar yang sangat teregang (stretched). RSI6 berada di 75,45 (RSI12 67,75, RSI24 55,96), dan harga sekitar 24% di atas MA7 dan hampir 50% di atas MA14. Bagi saya, ini adalah dua perkembangan terpisah: perbaikan nyata dalam struktur jangka pendek, dan pergerakan yang terlalu jauh untuk dikejar. Jalur yang saya gambar bukanlah proyeksi naik yang lurus. Pullback menuju 0.000480-0.000528 (MA7 dan zona lonjakan sebelumnya) bisa terjadi sebelum percobaan lain ke level tertinggi. Hal yang akan mengubah gambaran besar adalah penutupan 1 jam yang meyakinkan di atas 0.000629, diikuti oleh harga yang bertahan di area tersebut dengan volume yang meningkat. Jika ini terjadi, target kenaikan saya adalah: 0.000593 — Target pemulihan awal 0.000629 — Level tertinggi 24 jam dan resistance kunci 0.000680 — Estimasi ekstensi (bukan level pasti) Level-level ini mewakili area di mana saya memperkirakan pasar akan menghadapi keputusan baru. Manajemen R:R Zona pullback dari MA7 (0.000479) ke area lonjakan sebelumnya (sekitar 0.000528) mencakup sekitar 0.00005, sekitar 10% dari harga. Itu area yang relatif lebar, jadi masuk di mana pun di dalamnya tanpa rencana yang jelas dapat menciptakan eksposur yang tidak perlu. Setup saya akan batal jika ada penutupan 1 jam yang bertahan di bawah 0.000440. Di bawah itu, zona 0.000403-0.000396 akan mulai berperan, dan penembusan level itu akan mengalihkan fokus kembali ke level terendah 0.000301. Untuk perdagangan aktual, saya ingin entry dan stop-loss berasal dari struktur harga yang terkonfirmasi. Ukuran posisi dan risk-to-reward harus dihitung menggunakan nilai-nilai tersebut. Sebagai contoh, dari entry di dekat 0.000490 dengan stop di 0.000440, risikonya sekitar 10,2%. Target pertama di 0.000593 menawarkan sekitar 21,0% (2,1R), level tertinggi 24 jam di 0.000629 sekitar 28,4% (2,8R), dan 0.000680 sekitar 38,8% (3,8R), semuanya sebelum biaya. Dari harga saat ini di 0.000593 dengan stop yang sama, risikonya sekitar 25,8%, dan pergerakan ke 0.000629 hanya menawarkan sekitar 6,1%, atau sekitar 0,24R. Mengejar harga (chasing) mengubah setup yang menarik menjadi tidak menarik. Target yang kuat tidak bisa mengompensasi risiko penurunan yang dikelola dengan buruk. Saya konstruktif terhadap struktur KOR karena adanya higher low, higher high, dan persilangan MACD baru. Namun, masalah utamanya sekarang adalah apakah level tertinggi bisa direbut kembali dengan volume nyata, dan apakah harga yang teregang bisa mendingin tanpa kehilangan MA7. Apakah Anda akan menunggu KOR mapan di atas 0.000629, atau mempertimbangkan peluang jika harga terkoreksi ke area 0.00048-0.00053? Ini adalah analisis teknis untuk diskusi, bukan nasihat keuangan. $KORUSDT
The important distinction
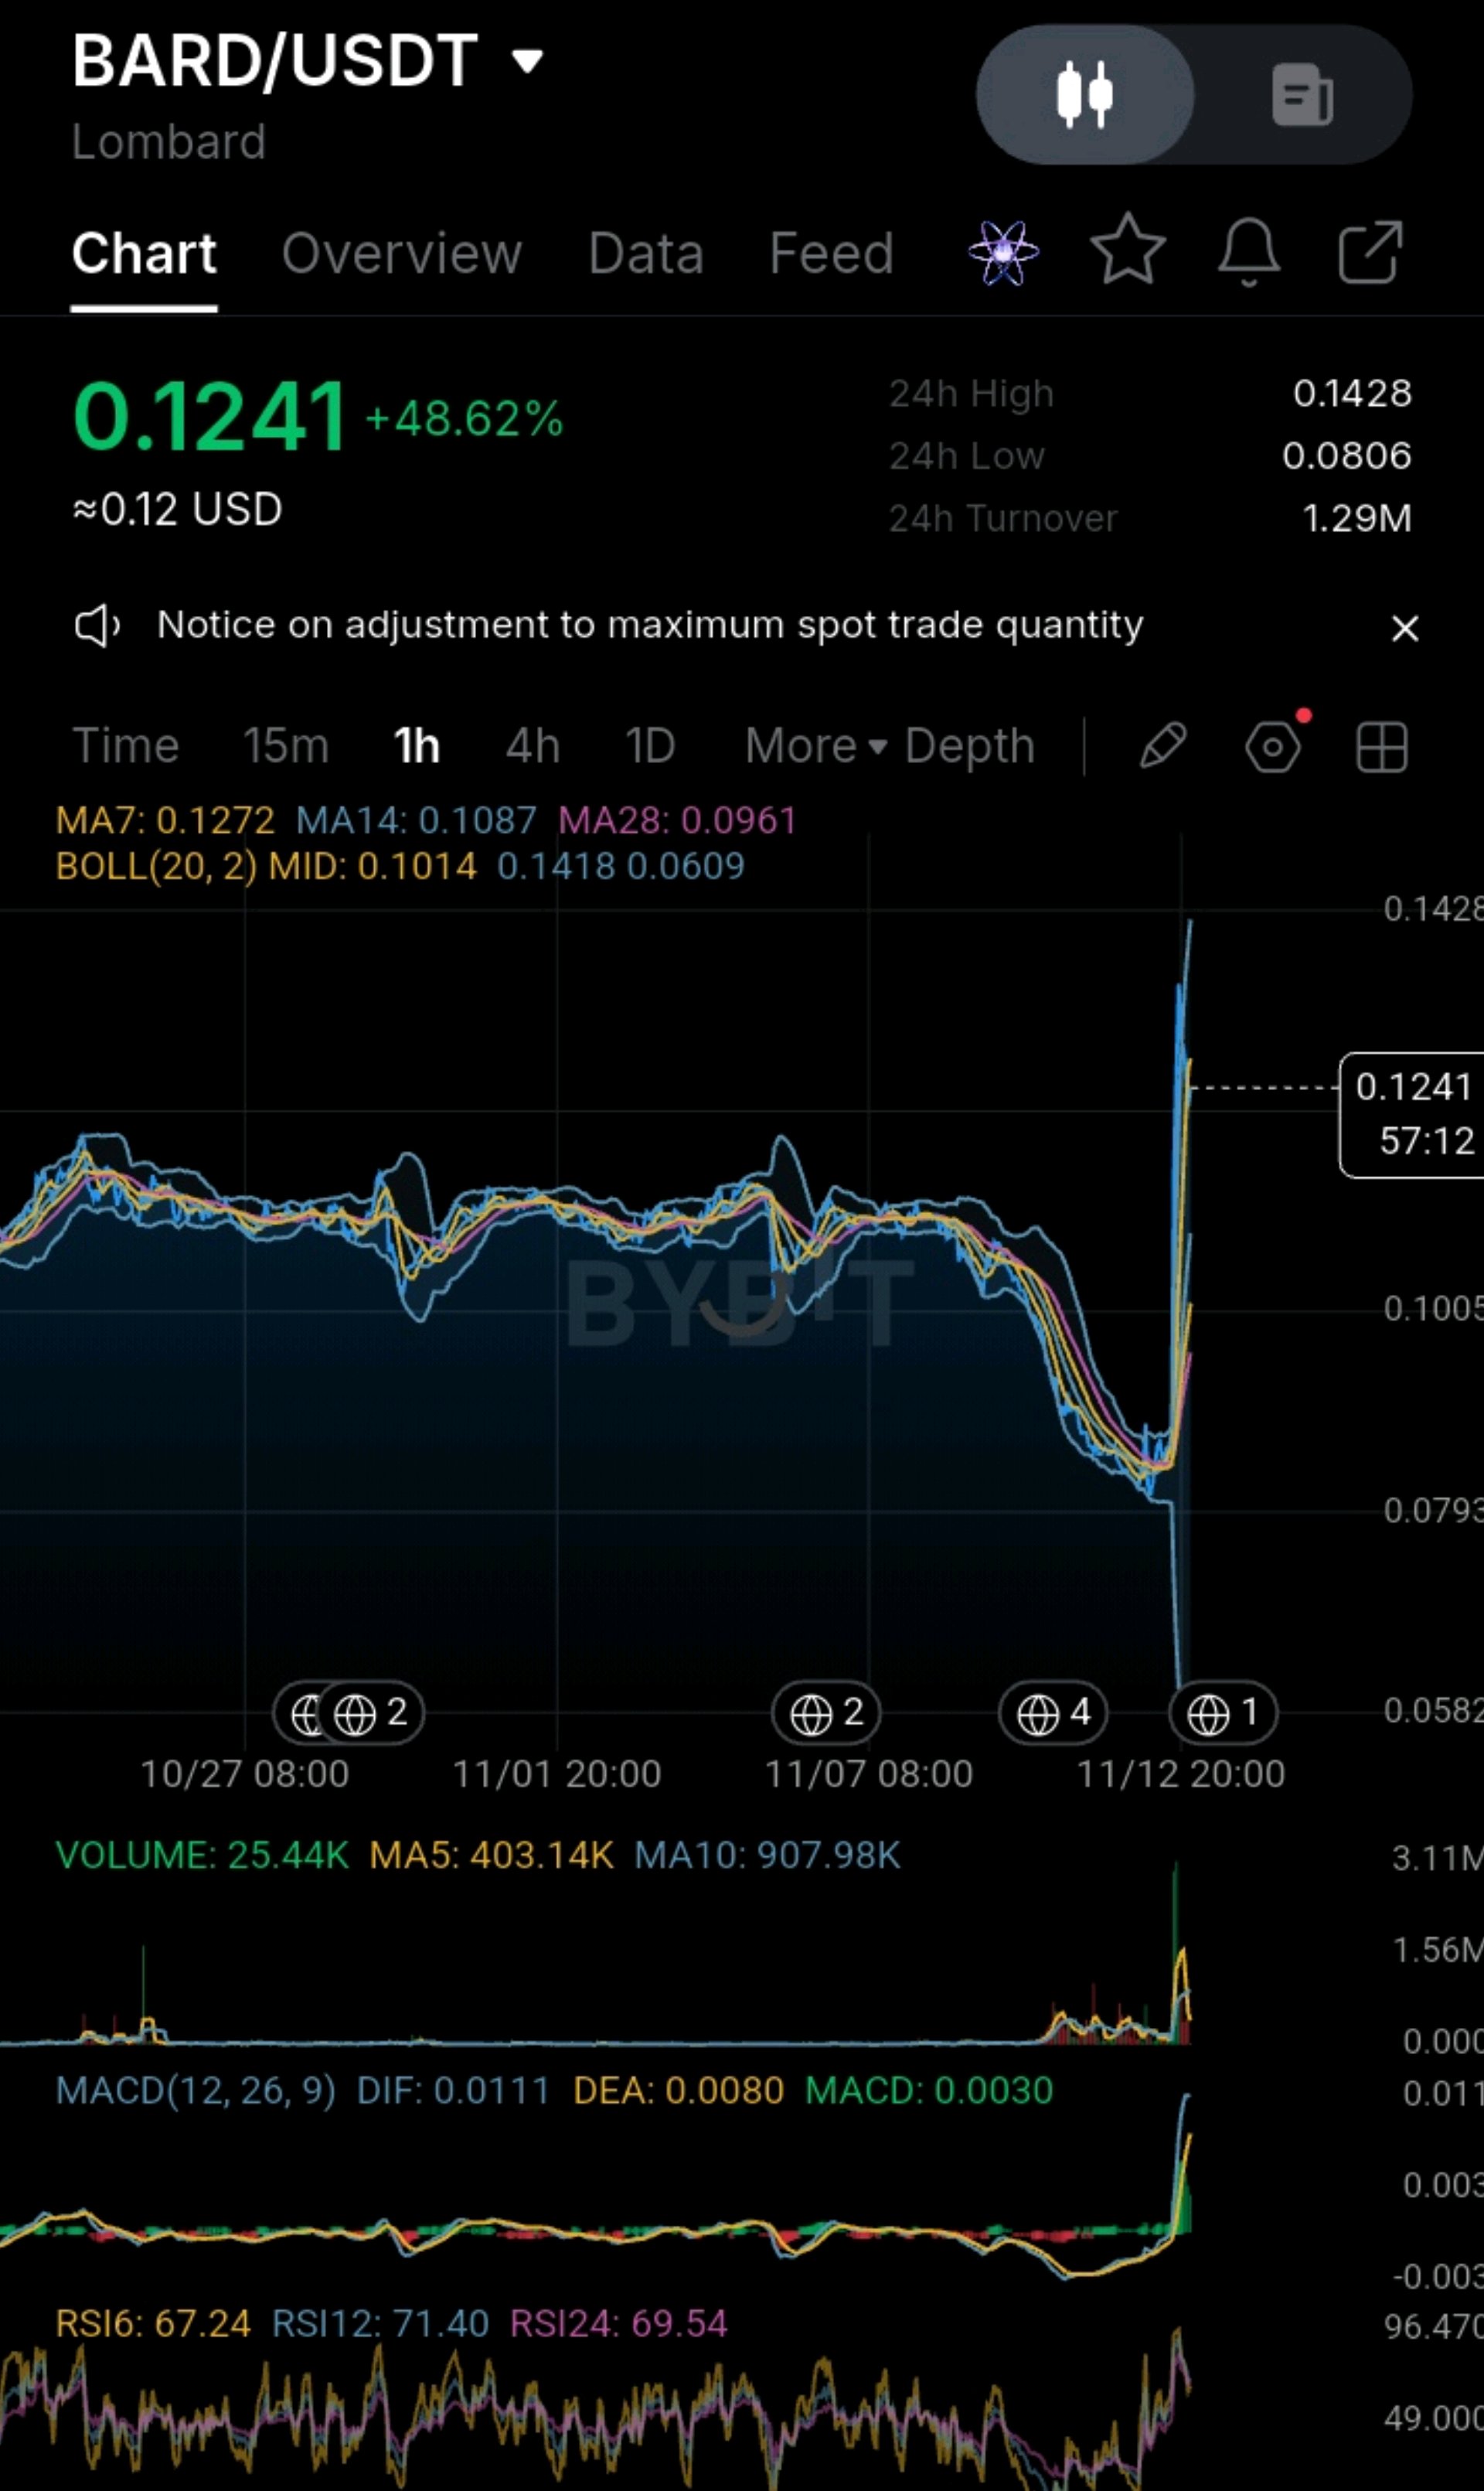
#ByXIMPACT #WSOT2026 #SanDiskAnnounces8For1StockSplit #BitcoinHitsTwoMonthLowAfterUSMidterms #AITechSelloffErases2Point5TrillionFromNasdaq100 $BARDUSDT has gone almost vertical, but the first pullback has already started. BARD is trading near 0.1241, up about 48.6% over 24 hours, after ranging for weeks and selling into a low near 0.0806. The 24h high is 0.1428, and turnover is about 1.29M. The move came out of a long, quiet range, and price has already slipped back below the MA7 (0.1272). The important distinction is between a breakout and a spike. The breakout is real in the sense that price is above the MA14 (0.1087), the MA28 (0.0961) and the Bollinger midline (0.1014), and MACD has crossed up (DIF 0.0111 vs DEA 0.0080). But a +48% move on thin turnover does not yet show that demand has been rebuilt, and it is a long way from the averages: about 14% above the MA14 and 22% above the midline. Momentum is elevated, not relaxed. RSI sits at 67 (RSI6), 71 (RSI12) and 69 (RSI24). The 0.1428 high came right at the upper band (0.1418) and was rejected, and volume has already cooled from the spike (MA5 403.14K vs MA10 907.98K). The current candle has just opened, so its volume reading means very little yet. Key levels Resistance: 0.1272 (MA7), then 0.1418 (upper band) and 0.1428 (24h high). Support: 0.1087 (MA14), 0.1014 (BB midline), 0.0961 (MA28), then the 0.0806 base. These are the areas where I expect the market to face new decisions. R:R Management The pullback zone around 0.1090-0.1130 is narrow, about 0.0040 in price, but the stop has to sit well below it. With an entry near 0.1100 and a stop at 0.0990, the risk is about 10%. That is a wide stop on a volatile token, so position size has to come down to keep the loss near 1-2% of the account. From those exact prices, the first target at 0.1272 offers roughly 1.6R, and the upper band at 0.1418 offers roughly 2.9R, before costs. Entering instead on a reclaim of 0.1272 with a stop under 0.1190 and a target of 0.1428 gives only about 1.5R, and that entry has less structural backing. For an actual trade, the entry and stop should come from confirmed structure, such as a bounce candle in the MA14 zone. Position size and risk-to-reward must then be calculated from those values. A strong target cannot compensate for poorly controlled downside risk. What would change the view A close below 0.0990 (under the midline) would weaken the setup. A move below the MA28 at 0.0961 would put the 0.0806 base back in play and could give back the whole move. A reclaim of 0.1272 on rising volume would strengthen the case. What this does not show The chart does not show a catalyst for the move, such as a listing or announcement, and it does not show who is trading it. Without wallet, derivatives or supply-release data, it would be a guess to say whether the volume was fresh demand or a handful of large accounts. Those should be checked before treating this as more than a technical move. I'm cautiously constructive on BARD's breakout, but only on a pullback with defined risk. The key issue now is whether buyers defend the MA14 zone or whether the move retraces toward the midline. Would you wait for BARD to reclaim 0.1272, or consider an opportunity if price returns to the 0.109-0.113 area? This is technical analysis for discussion, not financial advice. I wrote this as a market read, not a position update. Identify structure then you double down on it, that is the difference between the 1% from the 99%. $BARDUSDT

SUPRA vs NIGHT
#IMPACTbyTrade #WSOT2026 #AITechSelloffErases2Point5TrillionFromNasdaq100 #NovUSCPIWatch #USPayrollsAndRateDecisionsDriveMacroWeek SUPRA vs NIGHT — Comparative Market Analysis 1H Technical Outlook | 12 November 2026 Which coin has the stronger momentum? Which has better entry potential? Where might the whales be positioning? both coins are showing bullish structures, but they are at different stages of their market movements. SUPRA: Aggressive breakout, strong buying momentum, but significantly overbought. NIGHT: Strong upward movement followed by consolidation, with a healthier RSI but weakening momentum. My initial assessment: SUPRA has stronger immediate momentum, while NIGHT currently offers a more balanced technical setup. 1. Side-by-side comparison Chart time frame, 1H (1H) Price in screenshot, $0.0001450 ($0.04746) 24H change, +14.72%(+10.60%) RSI(6), 86.77 (59.90) RSI(12)82.59 (65.48) RSI(24), 75.40 (65.61) MACD, Bullish (Slightly bearish) Volume trend, Increasing (Declining) Price structure, Breakout (Consolidation) Immediate condition, Overextended (Cooling off) What this comparison tells us SUPRA is winning the momentum battle. Its breakout has stronger volume confirmation, and its MACD remains bullish. However, the extreme RSI readings make chasing the price dangerous. NIGHT is winning the short-term risk/reward setup. Its RSI is healthier, and it is consolidating above important moving averages. However, declining volume and a bearish MACD crossover mean another upward move is not yet confirmed. 2. Whale positioning — Where is the big money? This requires separating actual on-chain evidence from what a candlestick chart suggests. SUPRA: Whale assessment There are three important observations: SUPRA has recorded a sharp price increase accompanied by rising trading volume. CoinGlass reported positive spot net inflows in its November 11 snapshot, although the reported inflow was relatively small. SupraTools provides tracking for large wallet movements, staking, unlocks and exchange transfers. However, I cannot establish from the available evidence that large investors are accumulating SUPRA right now. Positive spot inflows alone do not prove whale buying. Whale interpretation: Possible accumulation, but confirmation is missing. NIGHT: Whale assessment NIGHT presents a more interesting ownership picture. Cardanoscan currently reports: Approximately 127,435 holders. Top 100 holders control approximately 81% of supply. Top 10 holders control approximately 59.2%. 16 wallets are classified as whales, holding approximately 66% of supply. Cardanoscan There is also evidence of significant large-wallet trading. Recent reported transactions include: A purchase of approximately 891,584 NIGHT. A sale of 500,000 NIGHT. Another purchase of approximately 476,202 NIGHT. A sale of approximately 488,139 NIGHT. Super Cardano Whale interpretation: Large holders are active, but their positioning is mixed. The concentration of NIGHT ownership is an important risk. Large holders can influence liquidity and price movements. Important distinction: A large wallet is not automatically a whale accumulating. Some large wallets belong to exchanges, treasury operations, foundations or custodians. My assessment: SUPRA: Momentum-led buying, with whale confirmation still needed. NIGHT: Concentrated ownership, with evidence of substantial buying and selling. Neither chart proves that whales are preparing for another pump. 3. Strengths and weaknesses SUPRA — Supra Strengths Strong bullish breakout. Increasing trading volume. Positive MACD momentum. Strong short-term buying interest. Potential for continuation if resistance breaks. Weaknesses RSI readings are dangerously elevated. Vulnerable to sudden profit-taking. A breakout failure could trigger a sharp retracement. Whale accumulation is not yet independently confirmed. Relatively small market depth can increase volatility. $SUPRAUSDT $NIGHTUSDT


Moving Averages
#ByXIMPACT #USInflationRunsHotAndRateHikeBetsRise #AITechSelloffErases2Point5TrillionFromNasdaq100 #NovUSCPIWatch #BybitAIEvolving 1. Market Structure: BULLISH 🟢 NIGHT has experienced a strong upward movement, climbing from approximately $0.04128 to $0.04885. However, the latest candles indicate that the rally is entering a consolidation phase. Key observations: Strong bullish breakout from the previous trading range. Price remains above the major moving averages. Buyers are defending the $0.0470–$0.0473 region. Recent candles suggest profit-taking after the initial rally. Interpretation: The overall 1H structure remains bullish, but upward momentum is cooling. 2. Moving Averages MA7 $0.04747 MA14 $0.04728 MA28 $0.04535 The moving averages remain bullishly aligned. MA7 is above MA14. MA14 is above MA28. Price remains above MA28. This supports the broader bullish structure. 3. Bollinger Bands Upper band $0.04946 Middle band $0.04635 Lower band $0.04324 Price is trading above the middle band and below the upper band. Unlike an extremely extended breakout, NIGHT is currently consolidating within the upper half of its Bollinger range. Interpretation: The bullish structure remains intact, although a further expansion towards the upper band requires renewed buying pressure. 4. Volume Analysis Current volume: 608.74K MA5: 1.55M MA10: 2.36M This is an important warning. Volume has declined considerably following the initial breakout. It suggests that buyers are becoming less aggressive at current levels. For another significant upward movement, NIGHT needs fresh buying volume. 5. MACD Analysis DIF: 0.00118 DEA: 0.00125 MACD: -0.00007 The MACD has turned slightly bearish. DIF is now below DEA, indicating a potential short-term bearish crossover. However, the negative histogram remains relatively small. Interpretation: Bullish momentum is weakening, but this alone does not confirm a complete trend reversal. 6. RSI Analysis RSI6: 59.90 RSI12: 65.48 RSI24: 65.61 Unlike an extremely overbought market, NIGHT's RSI readings remain relatively healthy. This leaves room for another upward movement if buyers return. However, declining RSI momentum should be monitored. 7. Important Price Levels Major resistance $0.04885 Next resistance $0.04946 Psychological resistance $0.05000 Immediate support $0.04700 Secondary support $0.04635 Stronger support $0.04535 Major support $0.04324 8. Trading Scenarios 🟢 Bullish Scenario If NIGHT maintains support around $0.0470–$0.0473: Buyers could attempt another test of $0.04885. A breakout above $0.04885 could expose $0.04946. A sustained breakout could open the psychological $0.05000 level. Confirmation requires increasing volume and a strengthening MACD. 🔴 Bearish Scenario If NIGHT loses $0.0470: Price could revisit $0.04635. Further weakness could expose $0.04535. A break below $0.04535 would weaken the current bullish structure considerably. 9. Final Verdict Market structure🟢 Bullish Moving averages🟢 Bullish Bollinger Bands🟢 Positive Volume🔴 Declining MACD🟡 Weakening RSI🟢 Healthy Overall Assessment: BULLISH, BUT CONSOLIDATING NIGHT has a stronger technical structure than a coin experiencing an exhausted, extremely overbought rally. However, three things deserve attention: Buying volume is declining. MACD has developed a bearish crossover. Price is struggling to move decisively above $0.04885. My trading position: I would avoid chasing NIGHT at $0.04746. I would watch for either a confirmed breakout above $0.04885 with volume or a healthy pullback towards $0.04635 followed by renewed buying pressure. The key level to watch is $0.04635. Holding this level would help preserve the current bullish structure.$NIGHTUSDT


SUPRA/USDT — 1H Technical Analysis
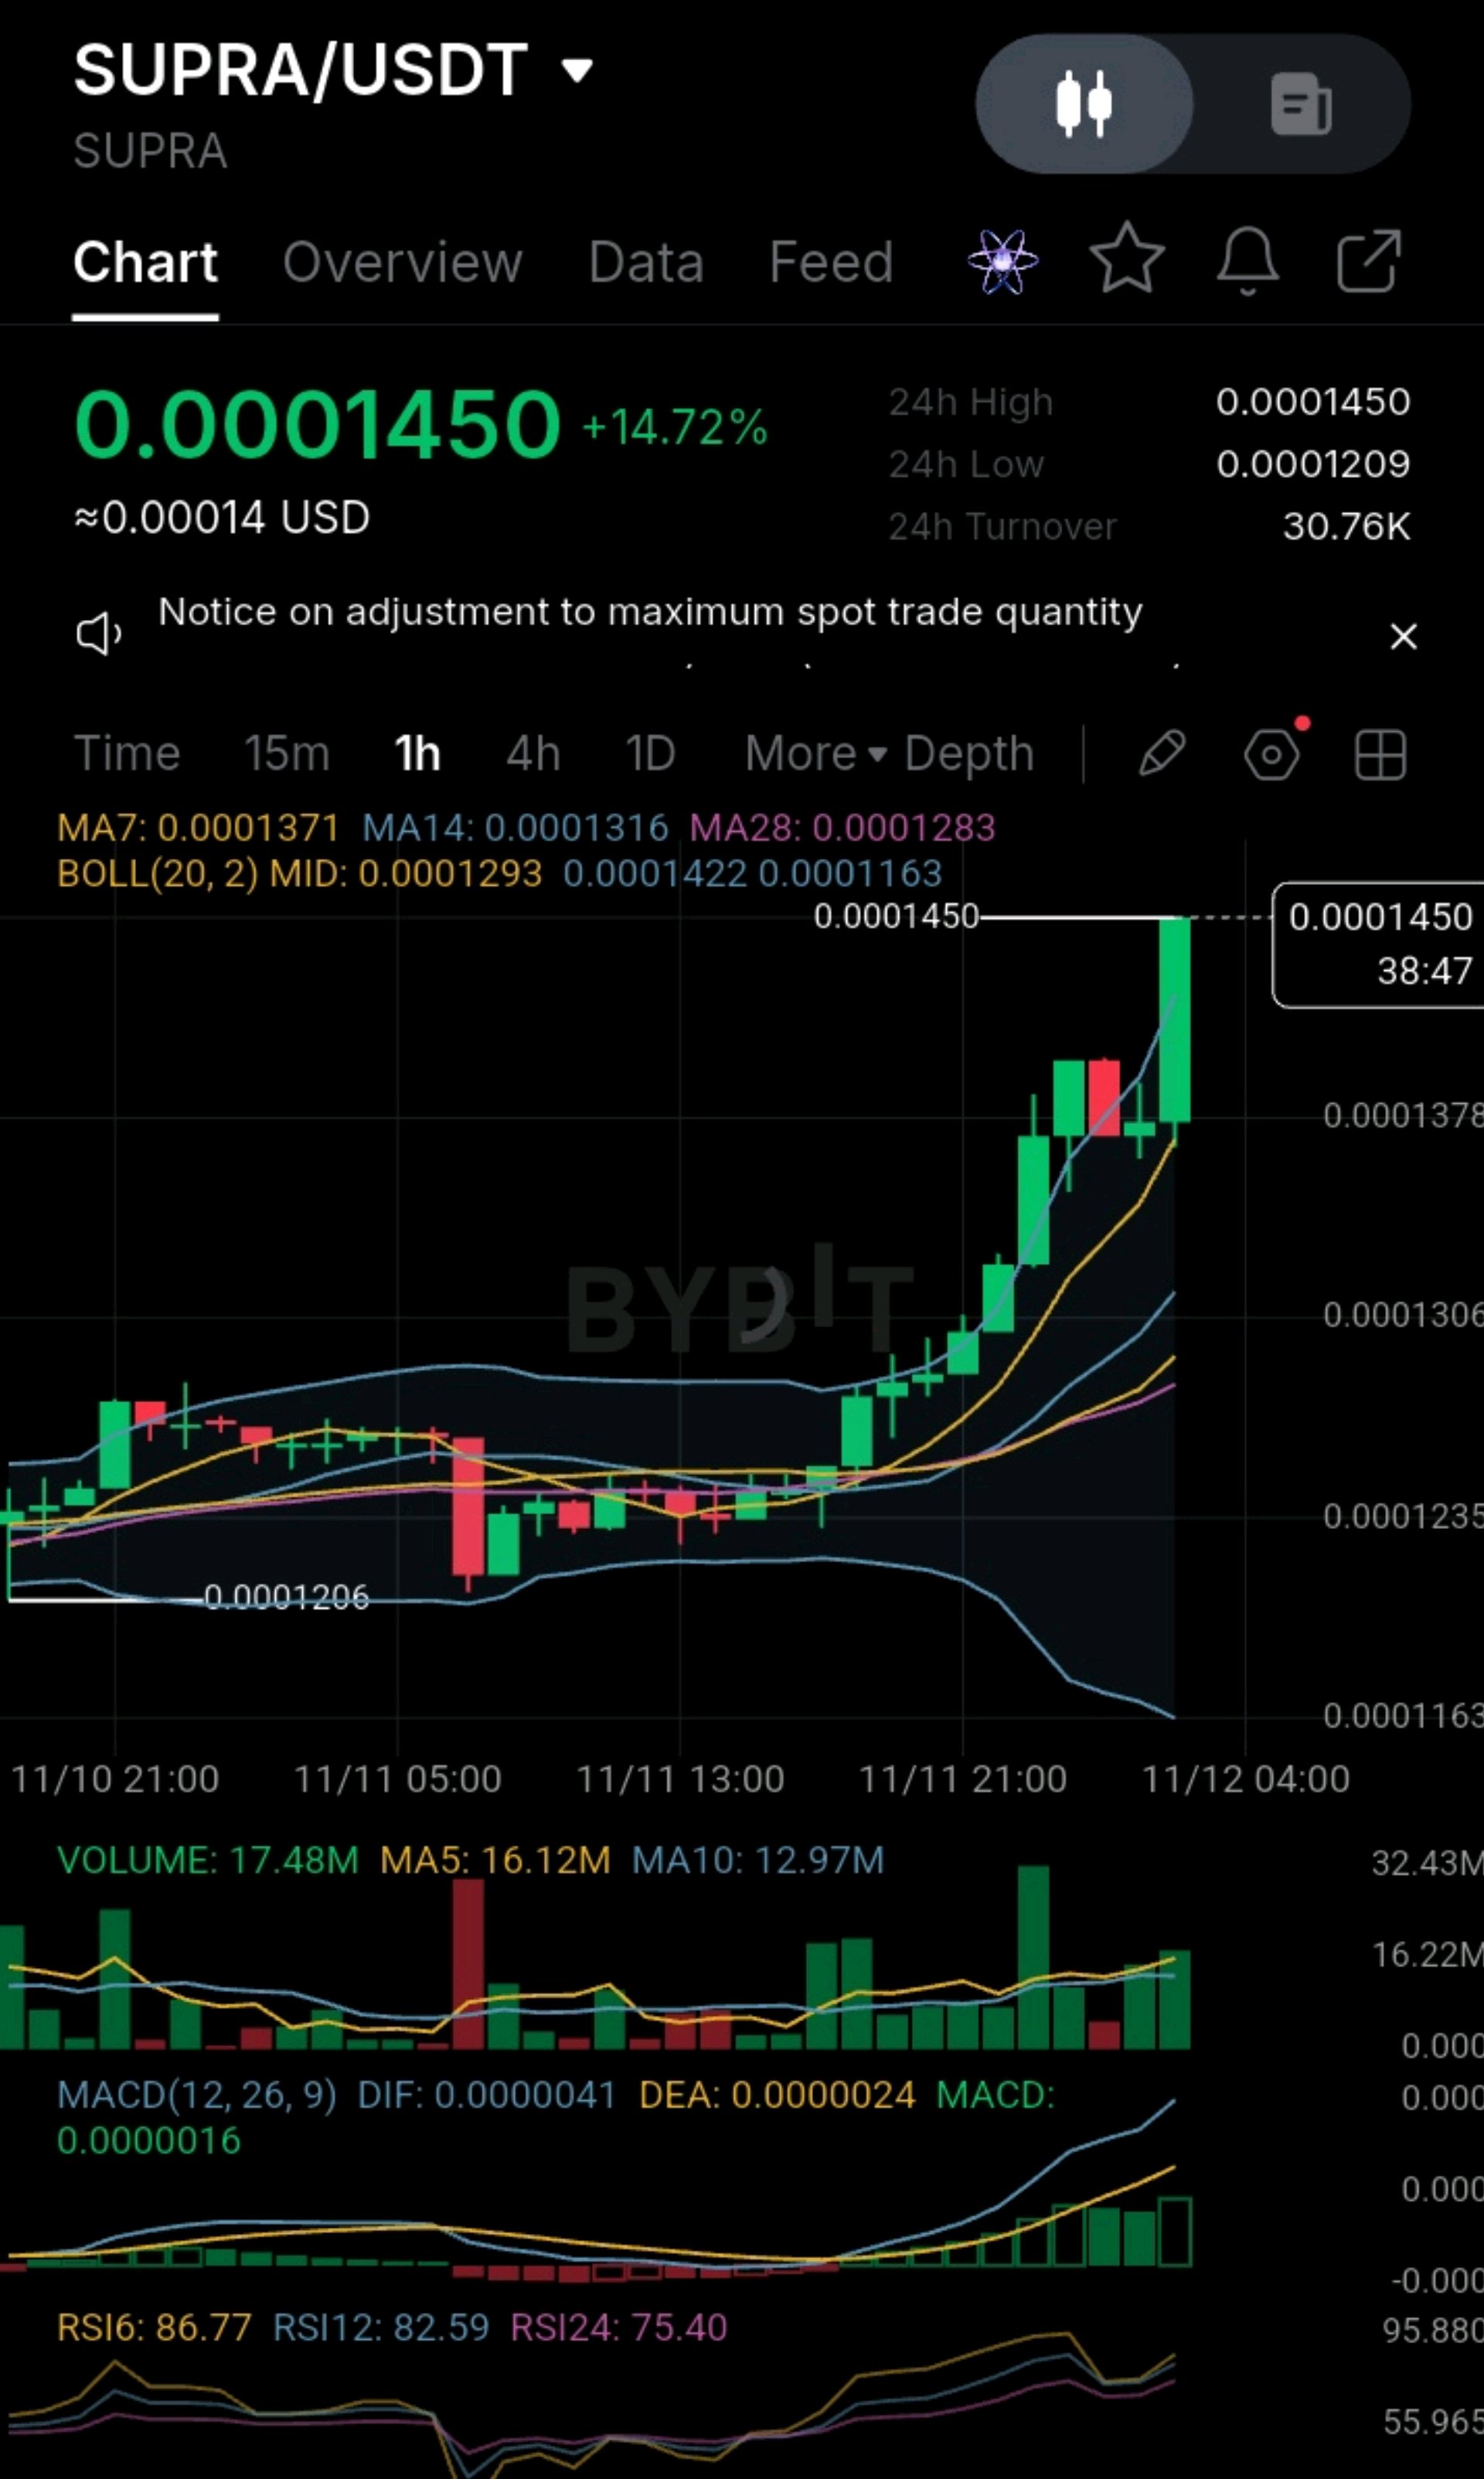
#IMPACTbyTrade #USInflationRunsHotAndRateHikeBetsRise #DeutscheBankLaunchesDigitalAssetCustody #AnthropicIPOTestsTheAIBoom #NovUSCPIWatch SUPRA/USDT — 1H Technical Analysis Current price: 0.0001450 24H change: +14.72% 24H high: 0.0001450 24H low: 0.0001209 1. Market Structure: BULLISH 🚀 SUPRA has broken out of its previous consolidation zone around 0.0001230–0.0001300. Strong consecutive bullish candles. Price has broken above the short-term moving averages. Buyers are showing increased momentum. The latest candle has reached a new 24-hour high. 2. Moving Averages MA7: 0.0001371 MA14: 0.0001316 MA28: 0.0001283 Interpretation: Bullish alignment. The shorter moving averages are above the longer ones, supporting the current upward trend. 3. Bollinger Bands Upper band: 0.0001422 Middle band: 0.0001293 Lower band: 0.0001163 Price is trading above the upper Bollinger Band. This indicates strong buying pressure but also suggests that the market may be overheating. 4. Volume Analysis Current volume: 17.48M MA5: 16.12M MA10: 12.97M Volume is increasing alongside the price breakout. This is encouraging because the upward movement has participation from buyers. 5. MACD DIF: 0.0000041 DEA: 0.0000024 MACD: 0.0000016 The MACD is bullish, with the DIF above the DEA. Positive momentum is still developing. 6. RSI — Important Warning ⚠️ • RSI6: 86.77 • RSI12: 82.59 • RSI24: 75.40 All three RSI readings are above 70. Interpretation: SUPRA is significantly overbought on the 1-hour timeframe. A short-term correction or profit-taking is possible. 7. Important Price levels Immediate resistance 0.0001450 Next resistance 0.0001500 Extended target 0.0001600 First support 0.0001378 Second support 0.0001306 Major support 0.0001235 8. Trading Outlook Bullish scenario: SUPRA breaks and sustains above 0.0001450. Volume continues increasing. A successful retest could open the way towards 0.0001500 and 0.0001600. Bearish scenario: Price fails to break 0.0001450. Buying volume declines. Price retreats towards 0.0001378 or 0.0001306.g Final Verdict 🟢 Trend: Bullish 🟢 MACD: Bullish 🟢 Volume: Increasing 🔴 RSI: Extremely overbought 🟡 Entry: Risky at current price; chasing the breakout is not advisable. My assessment: SUPRA has demonstrated a convincing bullish breakout, but the RSI readings suggest that entering immediately could expose traders to a sharp pullback. I would prefer a healthy retracement followed by renewed buying pressure before considering an entry. $SUPRAUSDT

Level kunci
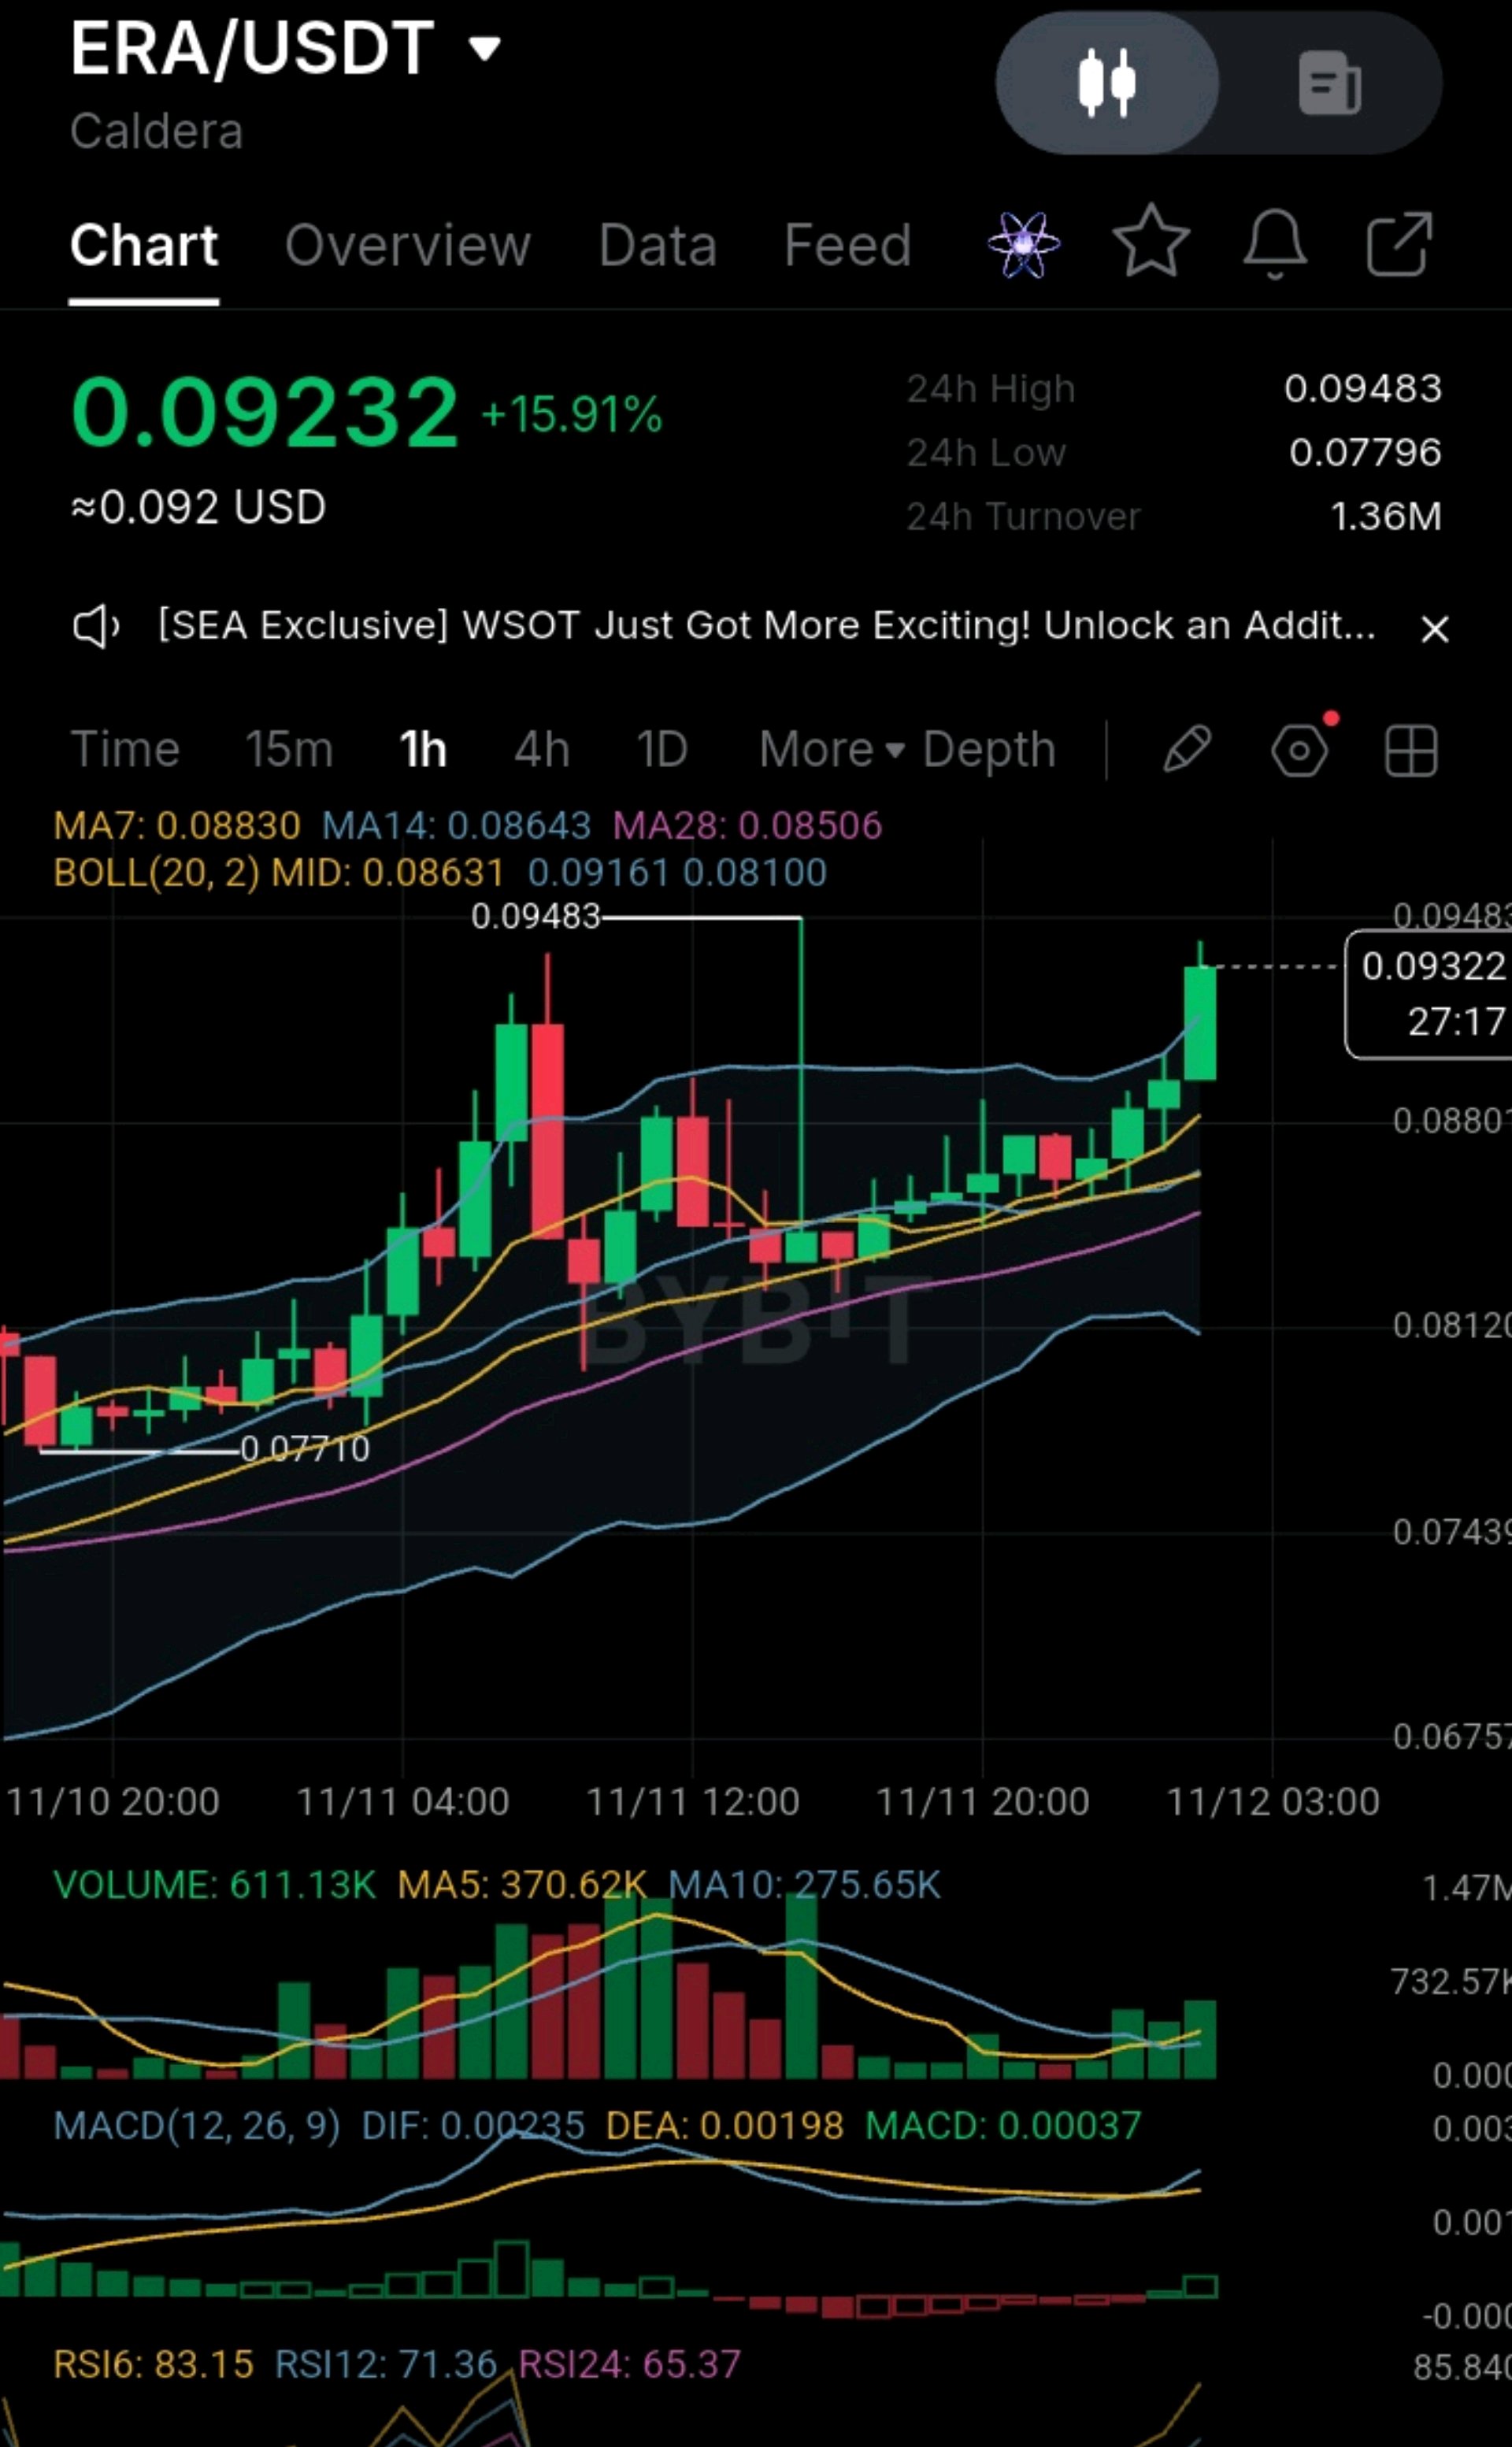
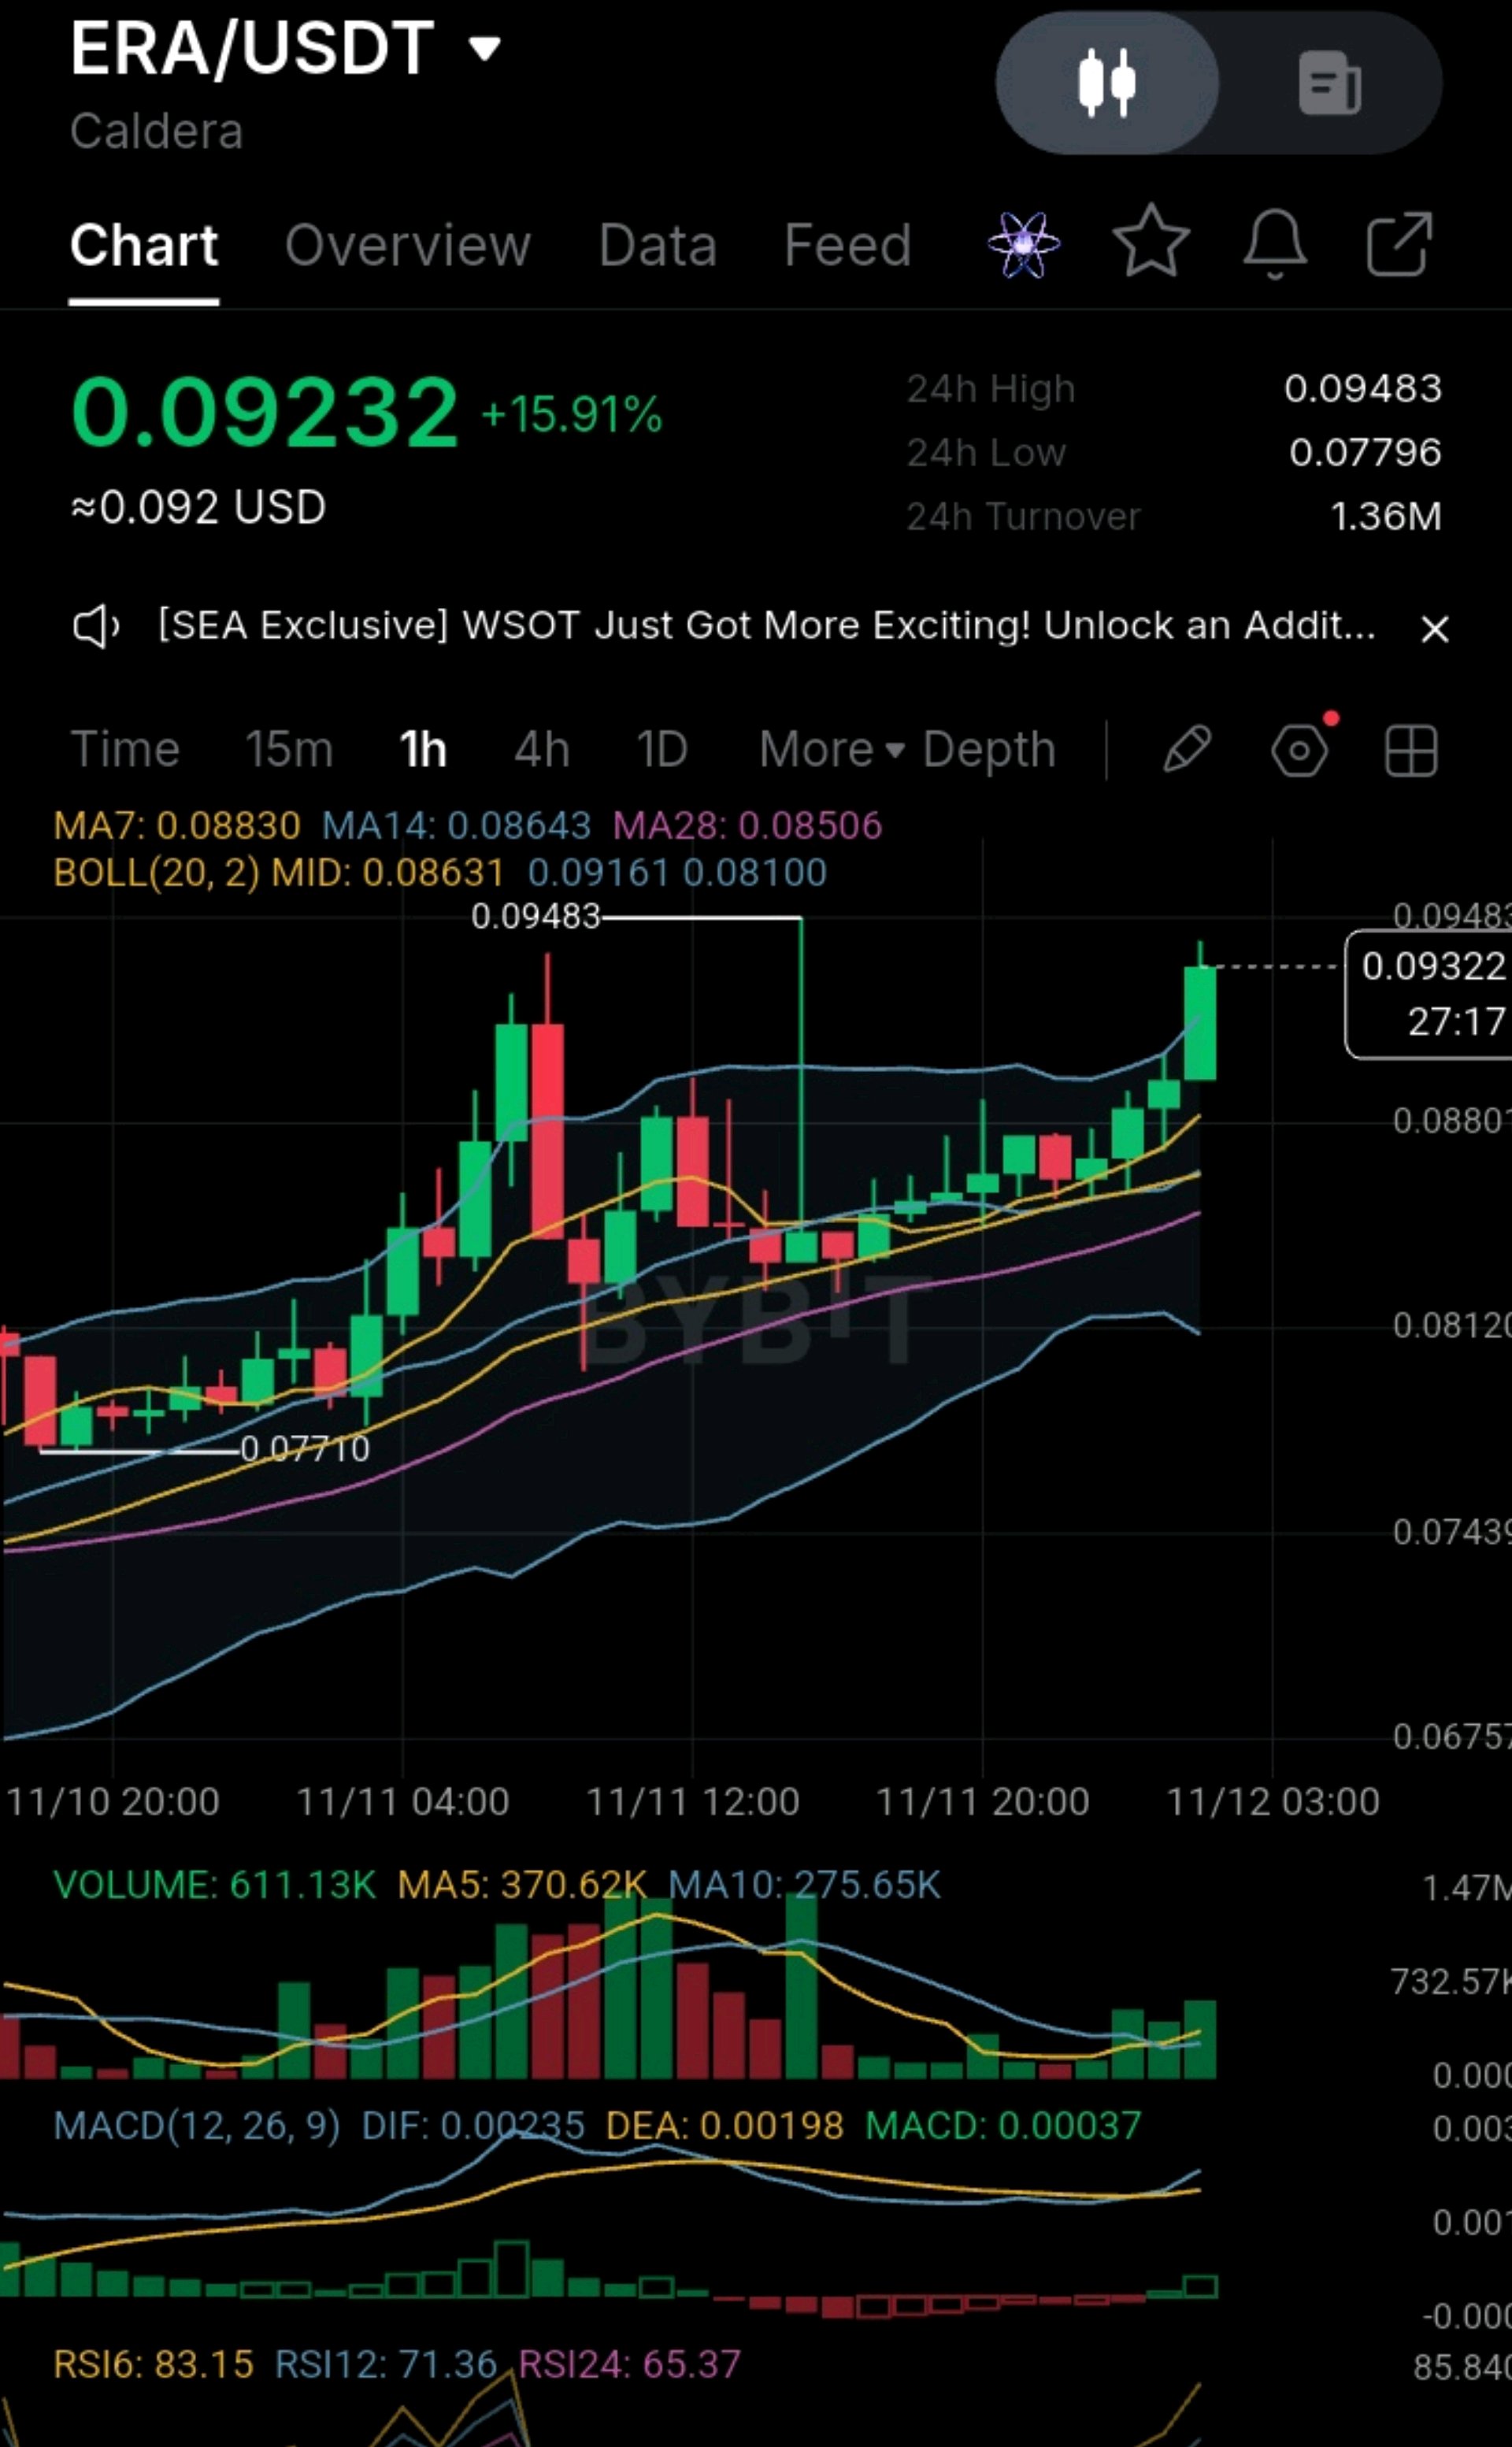
#ByXIMPACT #InflasiASMelonjakDanTaruhanKenaikanSukuBungaMeningkat #Penjualan Massal Saham Teknologi AI Menghapus 2,5 Triliun dari Nasdaq 100 #BitcoinMencapaiTitikTerendahDuaBulanSetelahPemiluParuhWaktuAS #Data Penggajian AS dan Keputusan Suku Bunga Mendorong Pekan Makro ERA sedang menekan kembali ke harga tertinggi 24 jam setelah tangga higher lows yang rapi. Penutupan per jam berikutnya akan menentukan apakah harga akan breakout atau gagal di 0,0948 untuk kedua kalinya. Lihat grafik 1 jam ini. ERA naik dari level terendah 0,0771, melonjak ke 0,09483, pullback dan bertahan di atas moving average, lalu rally lagi. Candle hijau terbaru sedang menembus Bollinger Band atas dan menguji harga tertinggi sebelumnya. Harga berada di kisaran 0,0923 hingga 0,0932, naik 15,91% pada hari ini, dan candle masih terbuka dengan sisa waktu sekitar 27 menit, jadi nilailah saat penutupan. Kekuatan: Harga berada di atas MA7 (0,08830), MA14 (0,08643), dan MA28 (0,08506), dan MA tersebut tersusun dalam urutan bullish dan sedang naik. MACD baru saja cross up (DIF 0,00235 vs DEA 0,00198, histogram +0,00037). Volume mengonfirmasi: bar saat ini (611,13K) jauh di atas MA5 (370,62K) dan MA10 (275,65K). Itu tidak biasa setelah pullback dan mendukung upaya breakout. Risiko Kelelahan: RSI6 berada di 83,15 (RSI12 71,36, RSI24 65,37), jadi jangka pendek sudah jenuh beli (overbought). Harga berada di atas Bollinger Band atas (0,09161) dan sekitar 5% di atas MA7, jadi pergerakan sudah terlalu jauh (extended). 0,09483 adalah zona penolakan sebelumnya, dan ERA sedang mengujinya untuk kedua kalinya. Uji ganda sering gagal tanpa volume yang kuat. Turnover tergolong moderat (1,36M), jadi pembalikan bisa terjadi secara tajam. Level kunci: Resistance: 0,09483 (tertinggi 24 jam), lalu kira-kira 0,0990-0,1000 (estimasi di dekat angka bulat, bukan level pasti). Support: 0,09161 (pita atas), 0,08830 (MA7), 0,08643 (MA14), 0,08631 (tengah BB), 0,08506 (MA28), lalu 0,0810 dan level terendah 0,0771. Rencana Trading (ilustratif): Entry yang disukai: pullback ke 0,0885-0,0905, di dekat MA7 dan bagian atas konsolidasi baru-baru ini, idealnya dengan candle pantulan. Stop loss: 0,0860, tepat di bawah MA14 dan garis tengah BB. Penembusan penutupan di bawah level ini membatalkan setup. Target 1: 0,09483, sekitar 1,5R dari entry 0,0895. Target 2: 0,0990, sekitar 2,7R. Alternatif breakout: penutupan per jam di atas 0,09483 dengan volume meningkat, dengan stop di bawah 0,0910 dan ukuran posisi lebih kecil, karena stop berada jauh dari entry breakout. Ukuran posisi: risikokan hanya 1-2% dari akun Anda pada jarak stop tersebut. Ambil profit parsial di Target 1 dan pindahkan stop ke titik impas (breakeven). Jika terjadi kesalahan: di bawah 0,0860, perkirakan penurunan ke MA28 (0,08506), lalu 0,0810 (pita bawah), dan penembusan di level itu akan membuat level terendah 0,0771 ikut bermain. Kesimpulan: ini adalah salah satu setup yang lebih sehat karena volume dan MACD setuju dengan tren. Namun dengan RSI6 di atas 83 dan pengujian ulang harga tertinggi sebelumnya, saya lebih memilih menunggu pullback ke zona MA7, atau penembusan volume yang terkonfirmasi di atas 0,09483, daripada membeli di harga tertinggi. Call to action: Apakah Anda akan membeli saat harga turun ke 0,0890, menunggu breakout terkonfirmasi di 0,0948, atau tetap menunggu sampai RSI mendingin? Pasang peringatan di 0,09483 dan 0,0860 agar Anda tidak melewatkan kedua pergerakan tersebut. Ini adalah analisis teknikal untuk diskusi, bukan nasihat keuangan. $ERAUSDT
Target Keuntungan Saya
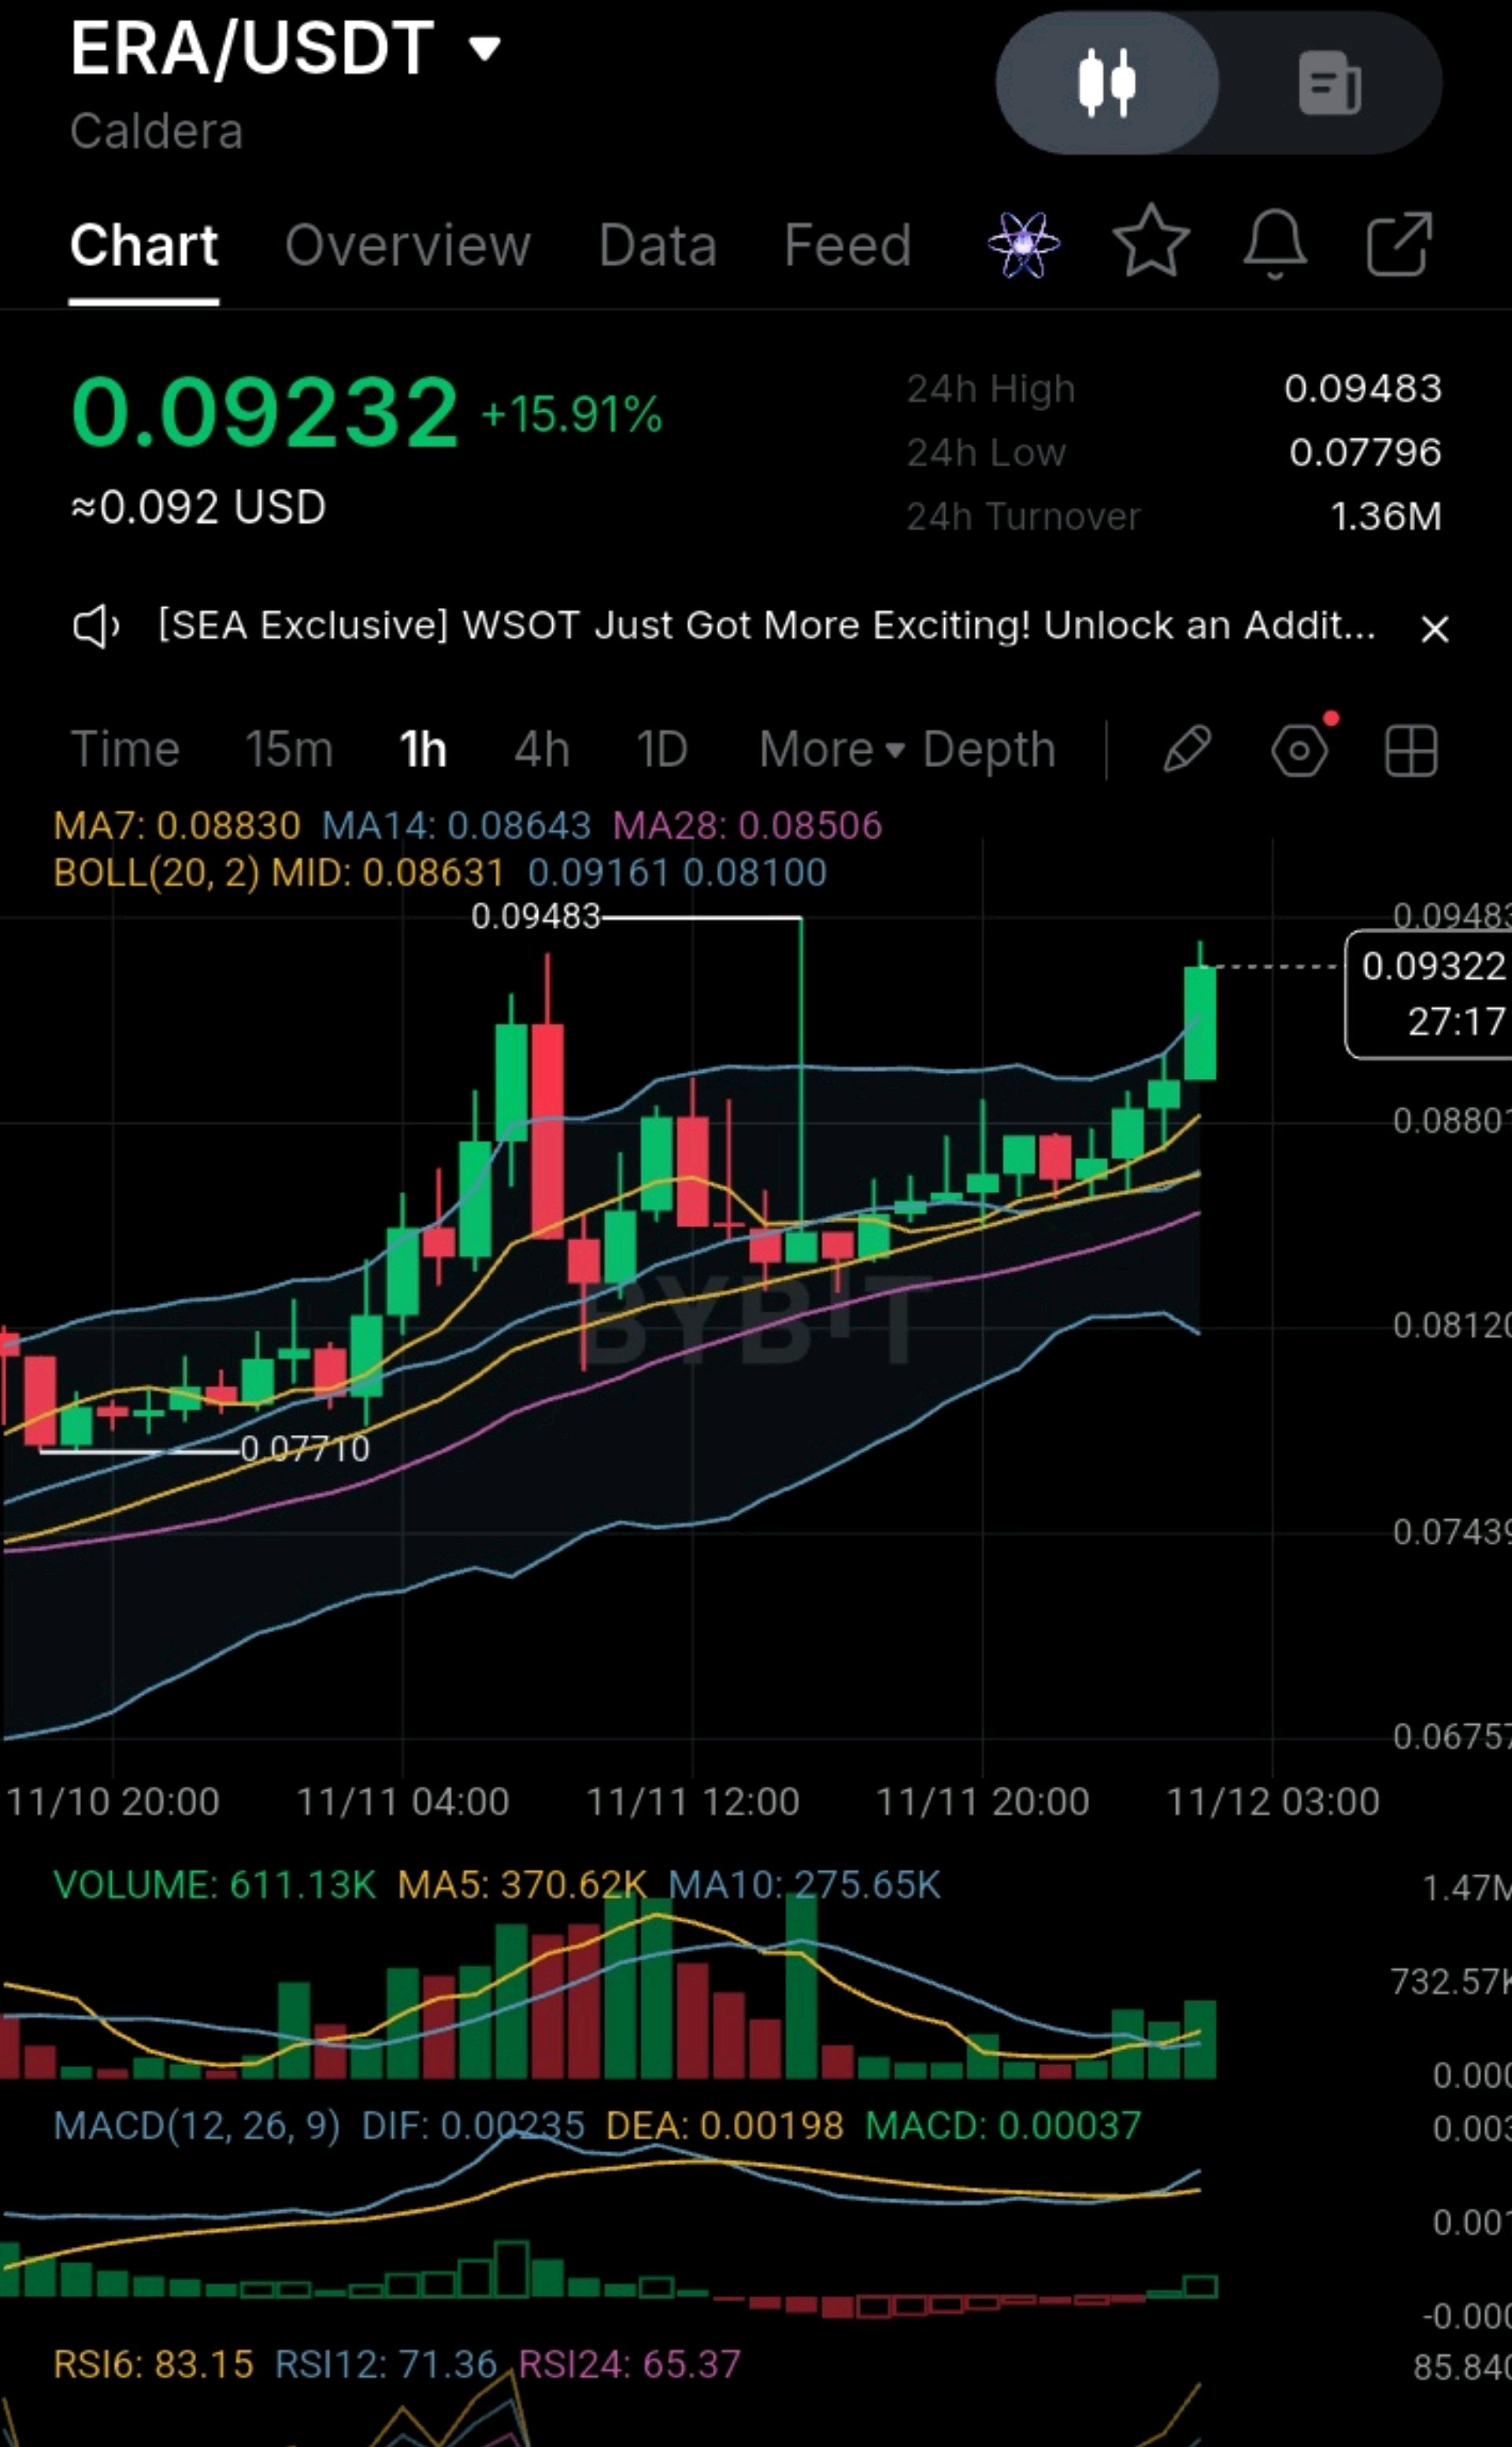
#IMPACTbyTrade #InflasiASMelonjakDanTaruhanKenaikanSukuBungaMeningkat #DeutscheBankMeluncurkanPenyimpananAsetDigital #Penjualan Massal Saham Teknologi AI Menghapus 2,5 Triliun dari Nasdaq 100 #BybitAIEvolving Saya sedang mengamati percobaan breakout ini dengan cermat. Uji coba kedua pada level tertinggi sebelumnya jarang memberikan entry yang nyaman, jadi dorongan saat ini menawarkan uji struktural yang jelas. Melihat timeframe 1 jam ini, grafik naik secara stabil dari level terendah 0.0771, melonjak ke puncak 0.09483, pullback dan bertahan di atas moving average-nya, lalu reli lagi. Harga sekarang sedang mendorong di 0.0923-0.0932, naik 15.91% hari ini, dan candle saat ini masih terbuka dengan sisa waktu sekitar 27 menit. Ini pengecekan realitas teknis saya: Kekuatan: MACD baru saja cross up (DIF 0.00235 vs DEA 0.00198, histogram +0.00037), dan MA tersusun dalam urutan bullish dan naik: MA7 di 0.08830, MA14 di 0.08643, dan MA28 di 0.08506. Volume mengonfirmasi dorongan ini, dengan bar saat ini di 611.13K dibandingkan dengan MA5 370.62K dan MA10 275.65K. Bahaya: RSI sedang panas, dengan RSI6 di 83.15 (RSI12 71.36, RSI24 65.37). Meskipun menunjukkan momentum pembeli yang kuat, harga berada di atas Bollinger Band atas (0.09161) dan sekitar 5% extended dari MA7, itulah mengapa saya mengamati retest 0.09483 ini dengan cermat. Turnover cukup moderat di 1.36M, jadi pembalikan arah bisa terjadi dengan tajam. Fondasi: Klaster moving-average (sekitar 0.0863-0.0883) dan garis tengah Bollinger (0.08631) telah menahan pullback seperti lantai, dengan setiap penurunan sejauh ini dipertahankan oleh pembeli. Eksekusi Trade dan Jaring Pengaman Saya: Saya sama sekali tidak tertarik untuk membabi buta mengejar candle hijau. Membeli di atas band berarti masuk dalam kondisi extended, dengan resistance tepat di atas dan stop jauh di bawah. Entry yang direncanakan adalah pullback ke area 0.0885-0.0905, dekat MA7 dan bagian atas konsolidasi baru-baru ini, idealnya dengan candle pantulan. Entry breakout hanya dihitung setelah penutupan hourly di atas 0.09483 dengan volume yang meningkat, dengan ukuran yang lebih kecil. Titik Invalidasi Saya: Risiko saya dibatasi di bawah MA14 dan midline Bollinger di 0.0860. Jika penjual berhasil menembus lantai tersebut dengan penutupan di bawahnya, momentum memudar, dan saya akan cut trade. Tanpa ragu. Di bawah itu, MA28 (0.08506) dan area 0.0810 akan mulai berperan. Target Upside Saya: Dorongan bersih menembus high 24 jam di 0.09483, kemudian 0.0990, yang merupakan estimasi di dekat angka bulat dan bukan level mutlak. Dari entry di 0.0895, itu sekitar 1.5R di target pertama dan sekitar 2.7R di target kedua. Presisi dan pelestarian modal adalah satu-satunya hal yang penting di sini. Siapa lagi yang mengamati breakout ini? Ini adalah analisis teknis untuk diskusi, bukan nasihat keuangan. $ERAUSDT

ADVICE TO BEGINNERS
#ByXIMPACT #USInflationRunsHotAndRateHikeBetsRise #WSOT2026 #AITechSelloffErases2Point5TrillionFromNasdaq100 #NovUSCPIWatch Check the next unlock dates before holding through them. On the chart, rising volume into the breakout is consistent with new buyers, but volume alone can't tell you who they are. MCRT: about 17,660 holders were reported, with roughly 5.03B tokens circulating, but at a market cap this small, concentrated wallets can matter a lot. The heavy volume at the breakout and the fade since then look more like a burst of speculation than steady accumulation. Check holder lists on BscScan, plus liquidity depth, before sizing up. Free tools for both: Arkham and Nansen for labeled wallets, the token's holder page on the block explorer, and Coinglass for open interest and funding where perps exist. 📈 TECHNICAL INTERPRETATION ERA: bullish but extended. Trend, volume and MACD agree, but RSI and the retest of 0.09483 argue for patience. Resistance is 0.09483, then about 0.0990 (an estimate). Support is 0.09161, 0.08830 (MA7), 0.08643 (MA14), 0.08631 (BB mid), then 0.08506 (MA28). MCRT: constructive consolidation with fading momentum. Price is sitting right on the MA7/MA14, which is a better location than ERA's, but MACD and volume are rolling over. Resistance is 0.00016500, 0.00017323, then 0.00017590. Support is 0.00015582, 0.00015385, 0.00014902 (BB mid), then 0.00014132 (MA28). Quick scorecard: Trend: ERA is stronger and confirmed by volume. MCRT is consolidating. Momentum: ERA has the fresh bullish MACD cross but is overheated. MCRT's has turned bearish. Liquidity: ERA wins by a wide margin. Entry location: MCRT is closer to support right now. ERA is extended. Risk of sharp reversal and manipulation: MCRT is higher. Supply overhang: ERA has scheduled unlocks. MCRT's concern is micro-cap concentration. 🧭 ADVICE TO BEGINNERS A big green day isn't a buy signal. ERA's RSI6 above 83 and a retest of a prior high are classic spots where beginners buy late. Liquidity matters. MCRT's thin market means slippage and wide spreads, so use limit orders and small size. Check the supply. Token unlocks can add selling pressure on schedule, so look up unlock dates before you buy. .Always set a stop before you enter, and don't move it once you're in a trade. Risk only 1-2% of your account per trade. Take partial profit and move your stop to breakeven. Skip leverage until you're consistent. Normal pullbacks on tokens like these can liquidate leveraged positions. Be careful with whale stories. Without wallet data, they're guesses. 🎯 MY VIEW On technicals alone, ERA is the higher-quality chart, with a trend backed by volume and a fresh MACD cross, but I wouldn't buy at the highs. I'd wait for a pullback to the 0.0885-0.0905 zone or a confirmed volume break above 0.09483. MCRT has the better entry location right now, but it is a thin micro-cap with fading momentum, so if you trade it, keep the size small and use a stop under 0.00014700. Call to action: Which one holds up better if the market dips, Drop your pick 👇 and set alerts at ERA 0.09483 / 0.0860 and MCRT 0.0001759 / 0.0001470, then tell me whether you're waiting for a pullback or a breakout. This is technical analysis for discussion, not financial advice. Small-cap tokens are highly volatile and you can lose your whole stake, so use your own risk limits and always use a stop. $ERAUSDT $MCRTUSDT
ERA vs $MCRT 🥊
#IMPACTbyTrade #InflasiASMelonjakDanTaruhanKenaikanSukuBungaMeningkat #Penjualan Massal Saham Teknologi AI Menghapus 2,5 Triliun dari Nasdaq 100 #DeutscheBankMeluncurkanPenyimpananAsetDigital #AnthropicIPOValuationTest $ERA vs $MCRT 🥊 Setup mana yang lebih kuat setelah hari yang besar? Kedua token naik tajam di grafik 1 jam, tetapi posisinya sangat berbeda. ERA sedang menekan ke arah harga tertinggi 24 jam dengan volume yang meningkat, sementara MCRT sedang berkonsolidasi setelah lonjakan vertikal di saat volume memudar. ⚡ KEKUATAN DAN KELEMAHAN PASAR $ERA (sekitar 0,0923, +15,91%) ✅ Kekuatan: tangga higher low yang bersih, dengan MA7 (0,08830), MA14 (0,08643), dan MA28 (0,08506) tersusun dalam urutan bullish dan sedang naik. ✅ Kekuatan: MACD baru saja bersilangan ke atas (DIF 0,00235 vs DEA 0,00198), dan volume sedang berekspansi (611,13K vs MA5 sebesar 370,62K), yang merupakan hal yang ingin Anda lihat dalam upaya breakout. ✅ Kekuatan: likuiditas jauh lebih tinggi, dengan omzet 24 jam sekitar 1,36 juta, kira-kira 11x lipat dari MCRT. ⚠️ Kelemahan: RSI6 berada di 83,15 dan harga berada di atas Bollinger Band atas (0,09161). Ini juga sedang menguji ulang harga tertinggi 0,09483 untuk kedua kalinya, dan pengujian ganda sering kali gagal tanpa volume yang kuat. ⚠️ Kelemahan: jadwal suplai cukup berat. Sekitar 79,8% dari total suplai ERA sebanyak 1 miliar masih terkunci di puluhan jadwal pembukaan (unlock) di masa depan saat data tersebut dipublikasikan, dengan vesting berlangsung hingga Juli 2029. $MCRT (0,00015656, +28,63%) ✅ Kekuatan: harga berada di atas MA7 (0,00015582), MA14 (0,00015385), dan MA28 (0,00014132), dan koreksi yang terjadi berlangsung tertib, bertahan di atas rata-rata tersebut. RSI telah mendingin ke level 60-64, jadi pergerakannya telah diatur ulang. ⚠️ Kelemahan: MACD telah bersilangan ke bawah (DIF 0,00000769 vs DEA 0,00000798), dan volume mulai mengering (6,98 juta vs MA5 sebesar 12,16 juta). Volume besar semuanya terjadi pada candle breakout. ⚠️ Kelemahan: ini adalah micro-cap. Situs data menunjukkan kapitalisasi pasar sekitar $330 ribu hingga $630 ribu, dan omzet 24 jam di grafik Anda hanya 120,14 ribu. Satu wallet besar bisa menggerakkan harga ke arah mana pun. 🐋 POSISI PAUS (versi jujur) ERA: gambaran suplai lebih penting daripada wallet mana pun. Alokasinya sekitar 32% untuk pendukung awal, 21% untuk perbendaharaan komunitas, masing-masing sekitar 15% untuk yayasan dan tim inti, serta 7% untuk airdrop. Token tim dan pendukung awal dikunci selama 12 bulan setelah peluncuran Juli 2025, kemudian mulai dibuka setiap bulan, jadi tekanan jual dari orang dalam adalah faktor nyata yang terus berlangsung. $ERAUSDT $MCRTUSDT

Metaplex Preparing
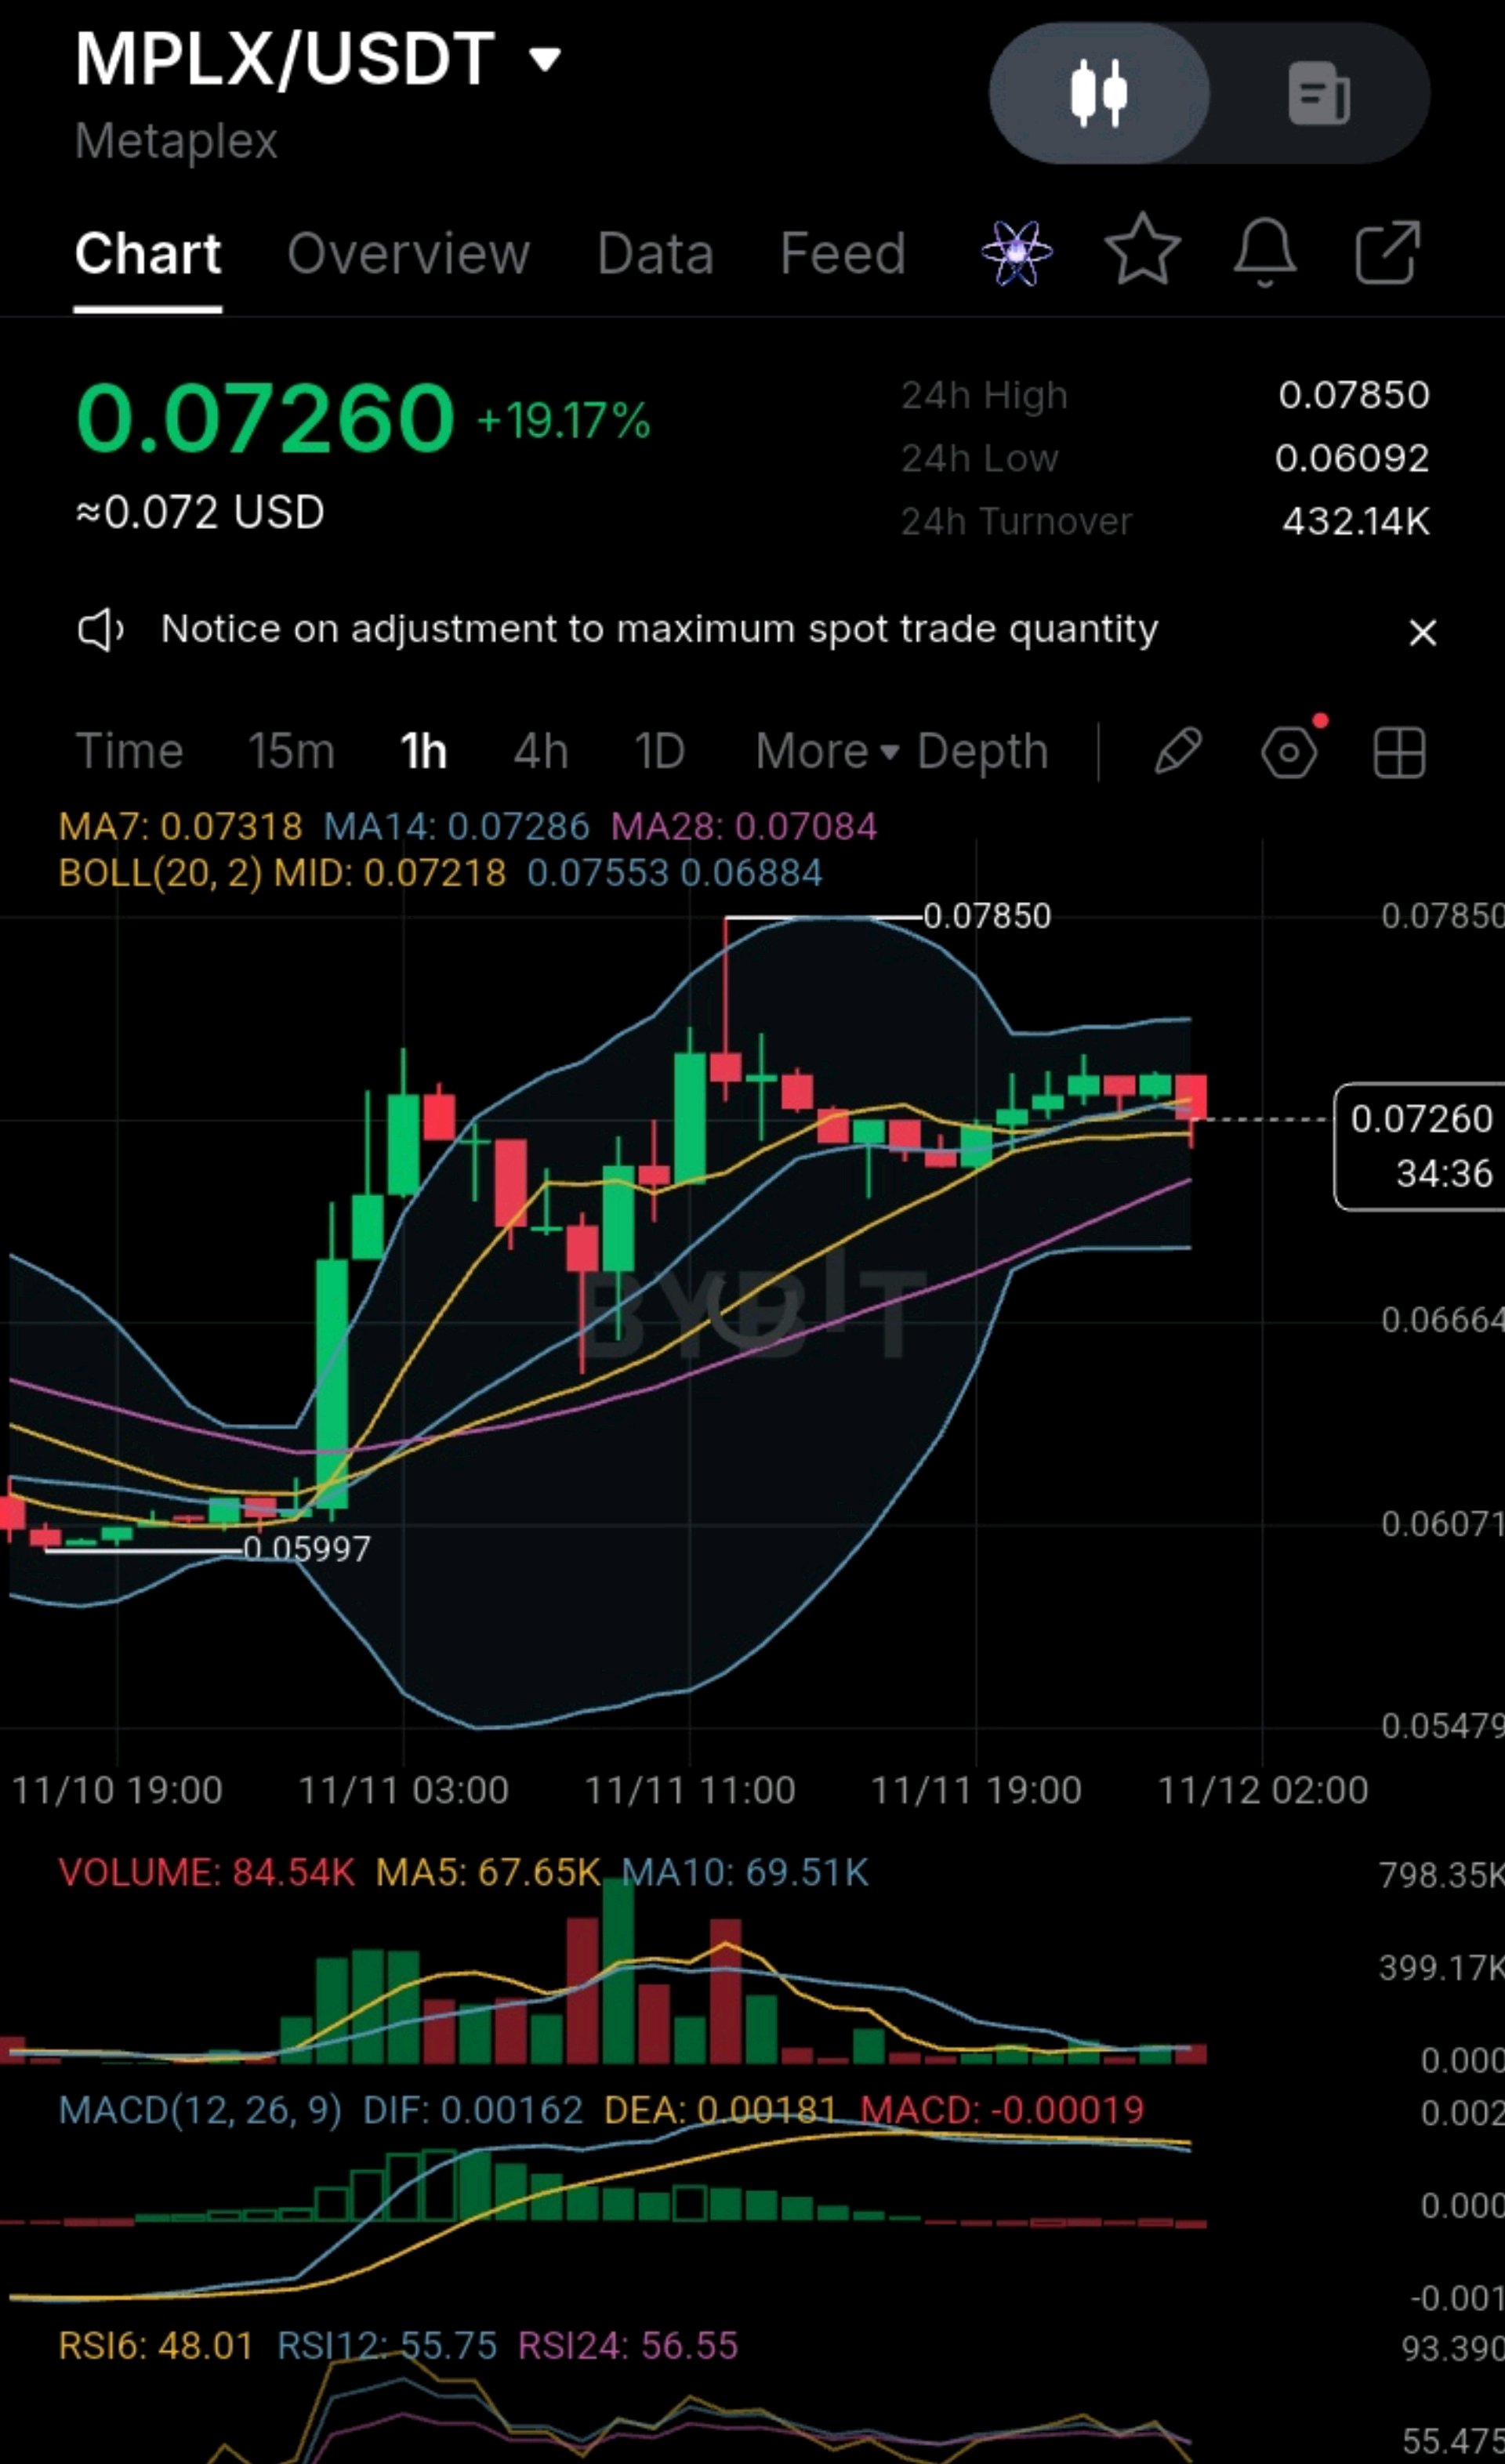
#ByXIMPACT #USInflationRunsHotAndRateHikeBetsRise #AITechSelloffErases2Point5TrillionFromNasdaq100 #DeutscheBankLaunchesDigitalAssetCustody #NovUSCPIWatch MPLX/USDT – Is Metaplex Preparing for Another Breakout or Losing Momentum? Current Price: $0.07260 24H Change: +19.17% 24H High: $0.07850 24H Low: $0.06092 24H Turnover: $432.14K 1. Market Structure MPLX has recorded a strong bullish move, climbing from approximately $0.0600 to $0.07850 before entering a consolidation phase. On the 1-hour chart, price is currently trading around $0.07260, suggesting that buyers are attempting to maintain the gains rather than allowing an immediate reversal. However, the latest candles show reduced momentum and indecision. 2. Moving Averages (MA) MA7: $0.07318 MA14: $0.07286 MA28: $0.07084 Price is currently below MA7 and MA14 but remains above MA28. This suggests short-term momentum is cooling, while the broader recovery structure remains intact. 3. RSI Analysis RSI6: 48.01 RSI12: 55.75 RSI24: 56.55 The RSI indicators show a neutral-to-mildly bullish structure. RSI6 has dropped below 50, indicating weakening immediate buying pressure. However, RSI12 and RSI24 remain above 50, suggesting the broader momentum has not completely turned bearish. 4. MACD Analysis DIF: 0.00162 DEA: 0.00181 MACD Histogram: -0.00019 The MACD is showing a slight bearish crossover, with DIF below DEA. This indicates that bullish momentum is weakening and sellers are beginning to exert some pressure. A bullish MACD recovery would strengthen the case for another upward move. 5. Volume Analysis Current Volume: 84.54K MA5 Volume: 67.65K MA10 Volume: 69.51K Volume is relatively healthy compared with its short-term averages. However, the significant volume expansion occurred during the initial price surge. The current consolidation needs stronger buying volume to support another breakout. 6. Bullish Scenario 🟢 If buyers successfully defend the $0.0710–$0.0720 region, MPLX could attempt another upward move. Key resistance levels: $0.0735 – Immediate resistance. $0.0755 – Upper Bollinger Band. $0.0785 – Previous local high. A convincing breakout above $0.0785, supported by increased volume, could open the door to further upside. 7. Bearish Scenario 🔴 If buying pressure continues to weaken, MPLX could lose its current consolidation structure. Important support levels: $0.0720 – Immediate support. $0.0708 – MA28 support. $0.0688 – Lower Bollinger Band. $0.0666 – Additional chart support. A sustained breakdown below $0.0688 would increase the risk of a deeper correction. 8. Critical Question Is MPLX consolidating before another bullish expansion, or was the move towards $0.07850 the peak of its current rally? The next important signals to watch are: Recovery above MA7 and MA14. MACD bullish crossover. RSI6 reclaiming 50. Increased buying volume during an attempt to break $0.0755. Final Observation MPLX remains up significantly over the last 24 hours, but its short-term momentum is cooling. The overall structure has not completely turned bearish, although another breakout should not be assumed without confirmation. For now, $0.0710–$0.0720 is an important area to watch. A successful defence could provide the foundation for another bullish attempt. Not financial advice. DYOR. $MPLXUSDT


MCRT meroket tajam
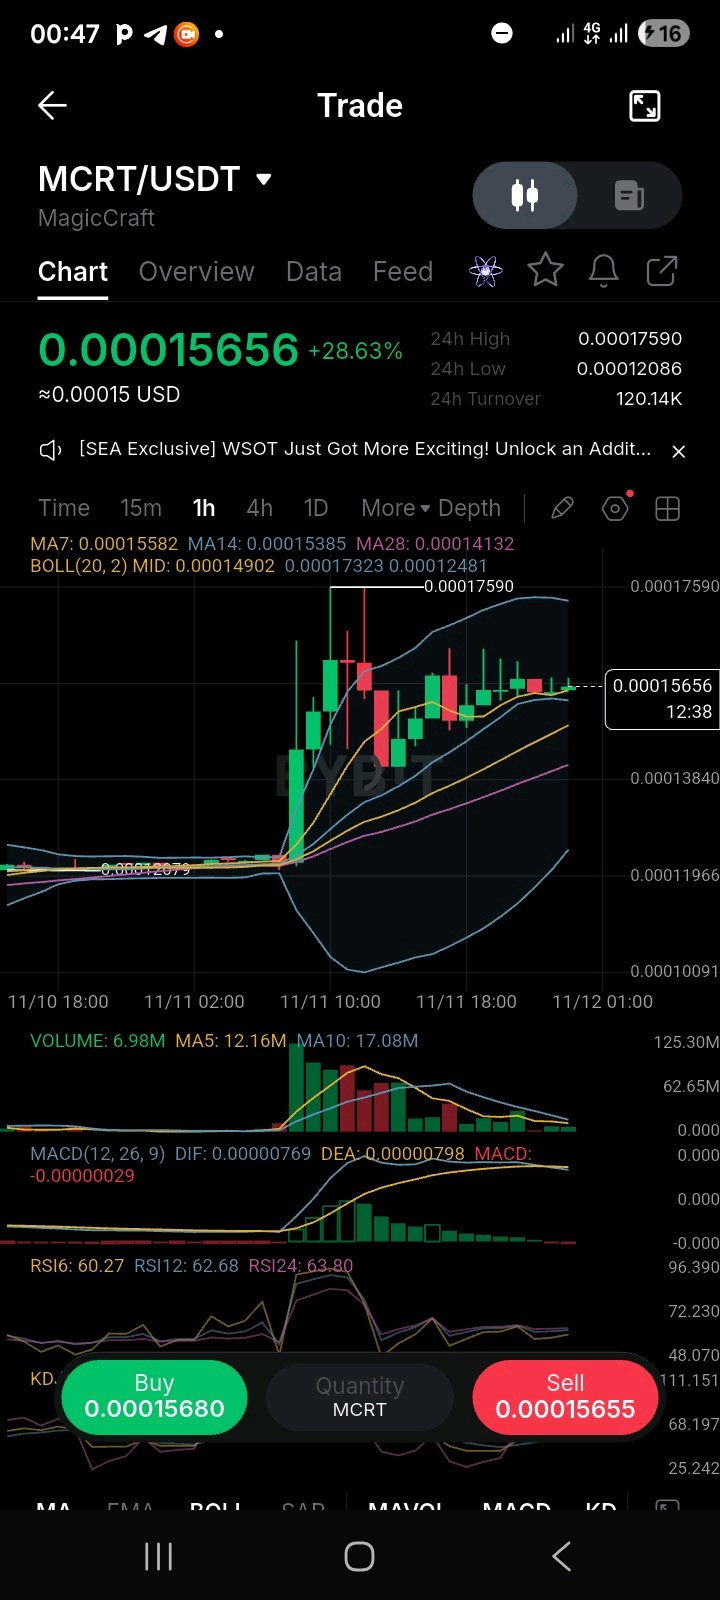
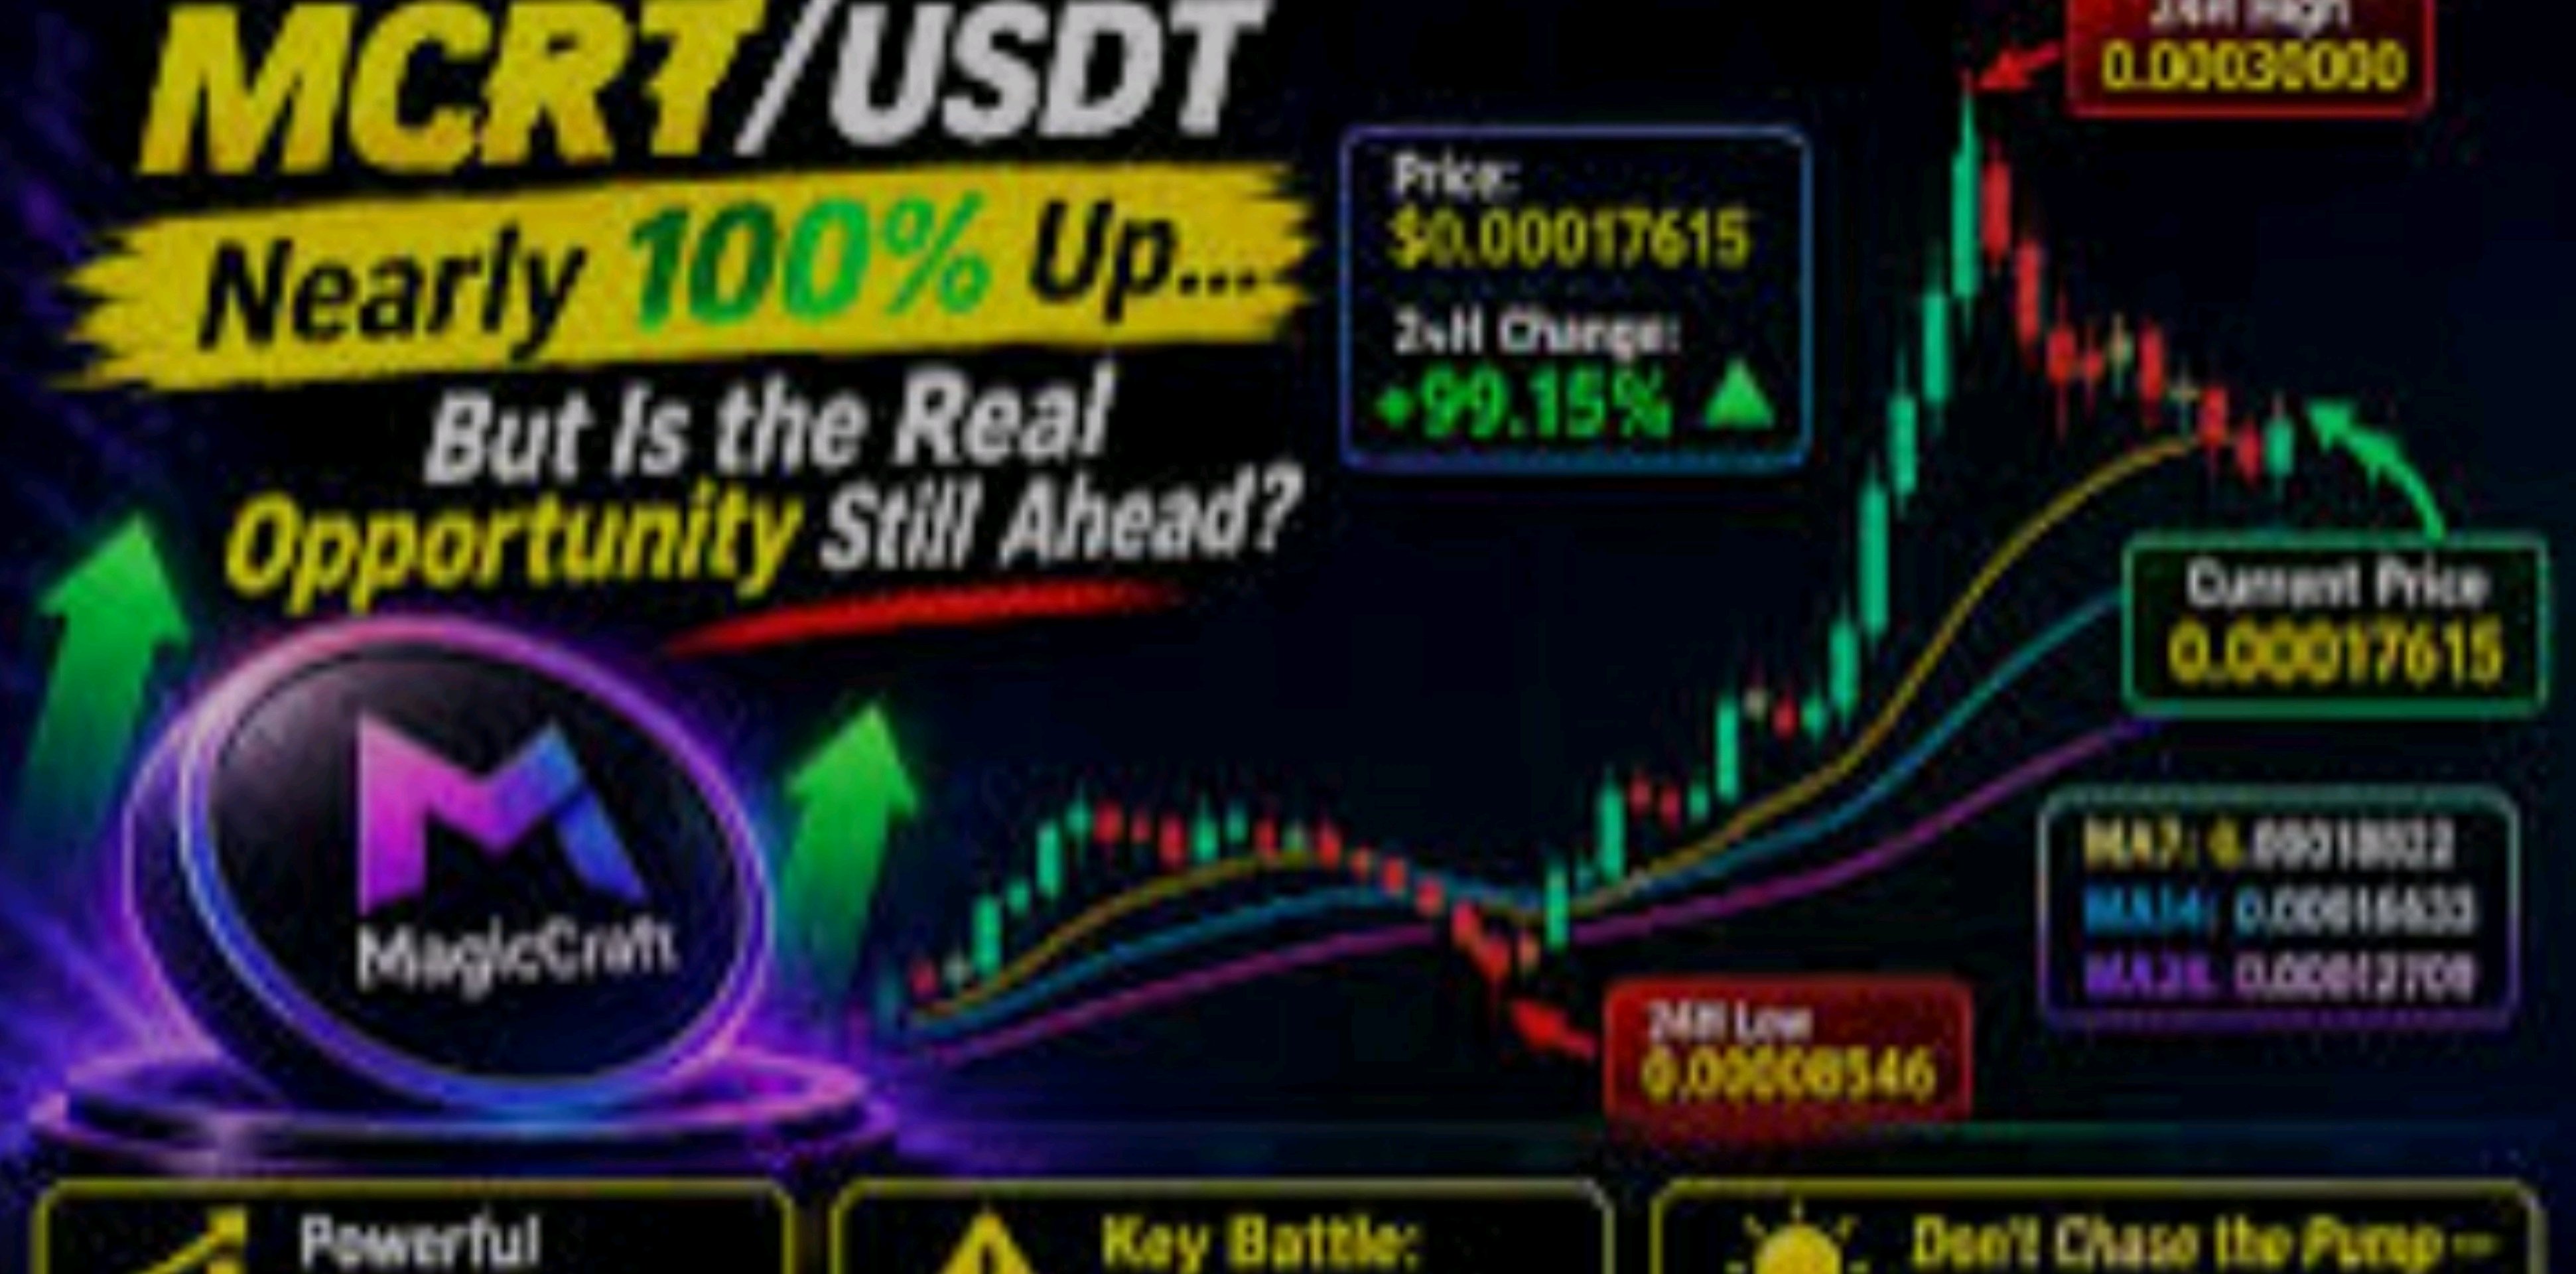
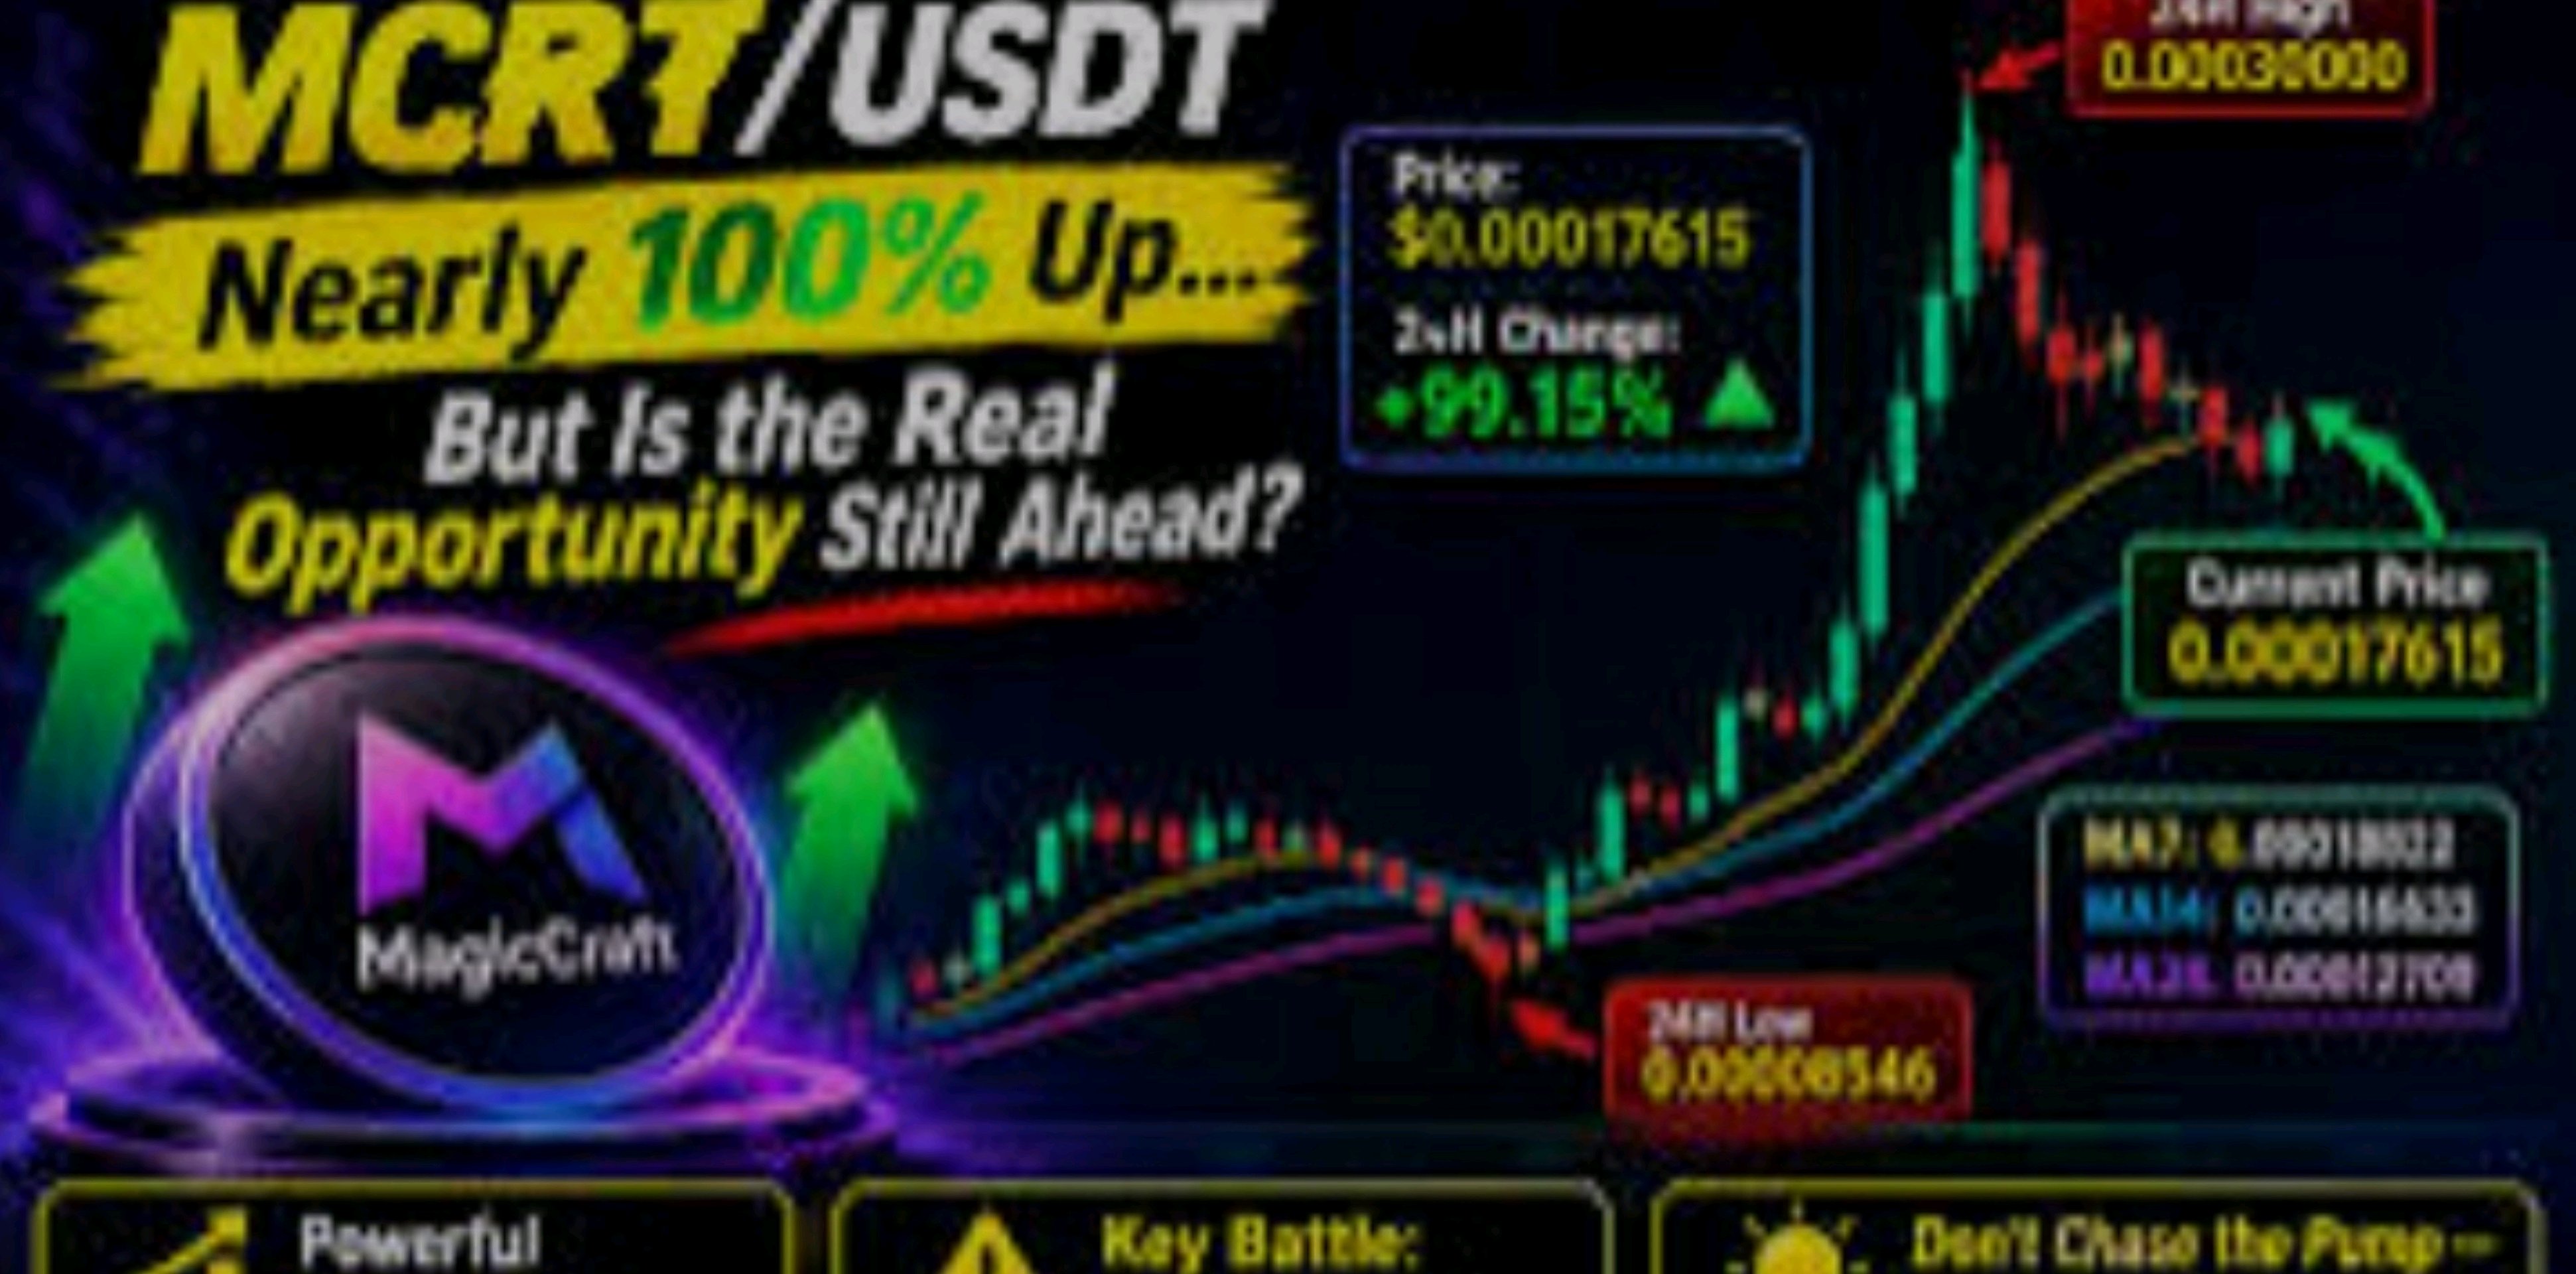
#IMPACTbyTrade #InflasiASMelonjakDanTaruhanKenaikanSukuBungaMeningkat #WSOT2026 #Data Penggajian AS dan Keputusan Suku Bunga Mendorong Pekan Makro #Volatilitas Minyak Melacak Pembicaraan Perdamaian Iran MCRT sempat melesat kencang, mendingin, dan sekarang sedang berkonsolidasi dalam rentang sempit di bawah level tertinggi 24 jamnya. Penutupan candle per jam berikutnya akan menentukan apakah ini adalah pola flag sebelum leg kedua atau justru pelemahan (fade). Lihat grafik 1 jam ini. MCRT sempat mendatar di sekitar 0,00012 selama berjam-jam, lalu meledak pada candle dengan volume besar hingga mencapai level tertinggi di 0,00017590. Harga sempat tertolak, turun kembali ke arah 0,00014, dan sejak itu berkonsolidasi dalam candle-candle kecil tepat di MA7/MA14. Harga saat ini 0,00015656, naik 28,63% hari ini, dan candle saat ini masih terbuka (tersisa sekitar 12 menit), jadi nilai saat penutupan. Kekuatan: Harga berada di atas MA7 (0,00015582), MA14 (0,00015385), dan MA28 (0,00014132), serta di atas garis tengah BB (0,00014902). Pullback terjadi secara teratur dan bertahan di atas moving average, yang merupakan tanda positif setelah pergerakan vertikal. RSI telah mendingin dari level ekstrem ke 60-64 (RSI6 60,27, RSI12 62,68, RSI24 63,80), jadi pergerakan telah ter-reset tanpa merusak struktur. Risiko Kelelahan: MACD telah melakukan crossing ke bawah: DIF (0,00000769) berada di bawah DEA (0,00000798), dengan histogram yang sedikit negatif. Momentum mulai memudar. Volume mulai mengering: 6,98 juta saat ini dibandingkan dengan MA5 sebesar 12,16 juta dan MA10 sebesar 17,08 juta. Volume besar hanya terjadi pada candle breakout. Level tertinggi 0,00017590 tertolak dengan sumbu panjang, jadi penjual aktif di level 0,00017-0,00017590. Turnover tipis (120,14K), dan kenaikan +28% pada token dengan harga mikro bisa berbalik arah dengan cepat. Level Kunci: Resistensi: 0,00016500, lalu 0,00017323 (upper band), kemudian 0,00017590 (tertinggi 24 jam) Support: 0,00015582 (MA7), 0,00015385 (MA14), 0,00014902 (BB mid), 0,00014132 (MA28), lalu basis di 0,00012079 Rencana Trading (ilustrasi): Entri yang disukai: saat koreksi (dip) ke 0,00015200-0,00015450 (area MA14), idealnya dengan candle pantulan (bounce). Stop loss: 0,00014700, tepat di bawah garis tengah BB. Penutupan di bawah level ini membatalkan setup. Target 1: 0,00016500, sekitar 2.0R dari entri 0,00015300. Target 2: 0,00017323, sekitar 3.4R. Target 3: 0,00017590 (tertinggi 24 jam), sekitar 3.8R. Alternatif breakout: penutupan per jam di atas 0,00017590 dengan volume yang meningkat, dengan stop di bawah 0,00016500 dan ukuran posisi lebih kecil, karena mengejar breakout memiliki risiko/imbalan yang lebih buruk. Ukuran posisi: risikokan hanya 1-2% dari akun Anda pada jarak stop loss. Ambil profit sebagian di Target 1 dan pindahkan stop ke titik impas (breakeven). Jika salah langkah: di bawah 0,00014700, perkirakan penurunan ke MA28 (0,00014132), dan di bawah itu seluruh pergerakan berisiko terkoreksi kembali ke arah basis 0,00012. Kesimpulan: strukturnya bullish dan konsolidasi terlihat sehat, tetapi momentum dan volume mulai memudar. Saya ingin melihat pantulan dari zona MA14/BB-mid atau breakout volume di atas 0,00017590 sebelum mempercayainya. Setelah kenaikan +28%, mengejar harga di sini memiliki risiko/imbalan yang buruk. Saya tidak melihat katalis berita di grafik, jadi periksa listing atau pengumuman terlebih dahulu. Call to action: Apakah Anda akan membeli saat turun ke 0,000153, menunggu breakout terkonfirmasi di 0,0001759, atau menepi sampai volume kembali? Pasang peringatan di 0,0001759 dan 0,0001470 agar Anda tidak melewatkan kedua pergerakan tersebut. Ini adalah analisis teknis untuk diskusi, bukan nasihat keuangan. $MCRTUSDT
Lonjakan tersebut tertolak
#ByXIMPACT #InflasiASMelonjakDanTaruhanKenaikanSukuBungaMeningkat #WSOT2026 #BitcoinMencapaiTitikTerendahDuaBulanSetelahPemiluParuhWaktuAS #Penjualan Massal Saham Teknologi AI Menghapus 2,5 Triliun dari Nasdaq 100 $MCRTUSDT – Tinjauan 1J | Long saat Pullback Pasangan: $MCRTUSDT Jika melihat grafik per jam, MCRT cenderung stagnan di kisaran 0.00012 selama berjam-jam, lalu melonjak dengan candle volume besar ke 0.00017590. Lonjakan tersebut tertolak, harga terkoreksi ke arah 0.00014, dan sejak saat itu berkonsolidasi dalam candle-candle kecil, kini diperdagangkan di sekitar 0.00015656, naik 28,63% dalam hari ini. Strukturnya cukup konstruktif, namun ini masih merupakan konsolidasi setelah pergerakan vertikal, bukan leg kedua yang terkonfirmasi. Saya lebih memilih membiarkan harga yang datang kepada saya daripada mengejar pergerakan ini. Pandangan Saat Ini dan Level Kunci Zona Beli: 0.00015200 – 0.00015450 Ini adalah area MA14 (0.00015385) dan tepat di atas MA7 (0.00015582), di mana pullback telah menemukan support. Jika harga kembali ke sini dan pembeli masuk dengan reaksi yang terlihat, seperti wick penolakan atau penutupan candle satu jam yang kuat kembali di atas 0.00015582, zona ini layak untuk diperhatikan. Pergerakan turun perlahan menembus zona ini tanpa adanya respons bukanlah hal yang ingin saya lihat. Zona Resistance: 0.00016500 – 0.00017590 Ini adalah area supply di atas di mana lonjakan harga ditolak sebelumnya, dan level tertinggi 24 jam di 0.00017590 berada di puncaknya, dengan Bollinger Band atas (0.00017323) di dalamnya. Penjual telah mempertahankan area ini sebelumnya, jadi saya mengharapkan adanya reaksi pada pengujian pertama. Penembusan yang bersih dan konsolidasi yang berkelanjutan di atas 0.00017590 dengan volume yang meningkat akan menunjukkan bahwa konsolidasi sedang mengarah ke atas dan membuka jalan menuju level tertinggi baru. Pengaturan Trading Posisi: Long saat pullback Zona Entry: 0.00015200 – 0.00015450, hanya setelah ada konfirmasi pembeli Stop-Loss: Penutupan di bawah 0.00014700 Invalidasi: Jika harga ditutup di bawah 0.00014700 (di bawah midline BB di 0.00014902), strukturnya rusak dan konsolidasi telah gagal. Pada titik itu tidak ada alasan untuk menahan posisi long, dan MA28 (0.00014132) akan menjadi fokus berikutnya. Take-Profit: TP1: 0.00016500 TP2: 0.00017323 TP3: 0.00017590 Mengapa Setup Ini Masuk Akal Membeli di 0.00015656 berarti masuk di posisi tengah rentang, dengan resistance yang dekat di atas dan stop yang jauh di bawah. Stop-loss akan berjarak sekitar 6,1%, sementara target pertama hanya sekitar 5,4%, sehingga reward-to-risk ke TP1 kira-kira 0,9:1 dan entry tersebut memiliki dukungan struktural yang minim. Menunggu pullback ke area 0.00015200 – 0.00015450 menempatkan stop tepat di bawah level yang jelas (midline BB), yang menjaga risiko tetap ketat dan meningkatkan rasio reward-to-risk menjadi sekitar 2:1 di TP1 dan hingga sekitar 3,8:1 di TP3. Target-target tersebut mengikuti level yang sudah ditunjukkan grafik, sehingga setiap level adalah tempat di mana harga sebelumnya bereaksi. Reaksi tersebut sama pentingnya dengan level itu sendiri. Sentuhan pada support bukanlah sinyal, tetapi sentuhan yang diikuti oleh pembeli yang mempertahankannya adalah sinyal yang valid. Momentum juga memudar, dengan MACD melintasi ke bawah (DIF 0.00000769 di bawah DEA 0.00000798) dan volume yang mengering (6,98 Juta vs MA5 12,16 Juta), jadi bersabar di sini tidak ada ruginya, sementara mengejar hari dengan kenaikan +28% seringkali justru merugikan. RSI telah mendingin ke 60-64, yang mana cukup sehat. Manajemen Risiko Tetap berpegang pada rencana. Jika stop terkena, terimalah dan lanjutkan, jangan digeser. Atur ukuran posisi agar kerugian tetap dapat dikelola, karena zona support bisa gagal, token ini tipis likuiditasnya (turnover 120,14 Ribu) dan tidak ada setup yang menjamin keuntungan. Ini adalah pengamatan pasar pribadi, bukan saran keuangan. $MCRTUSDT

NVDA Slips to $177.
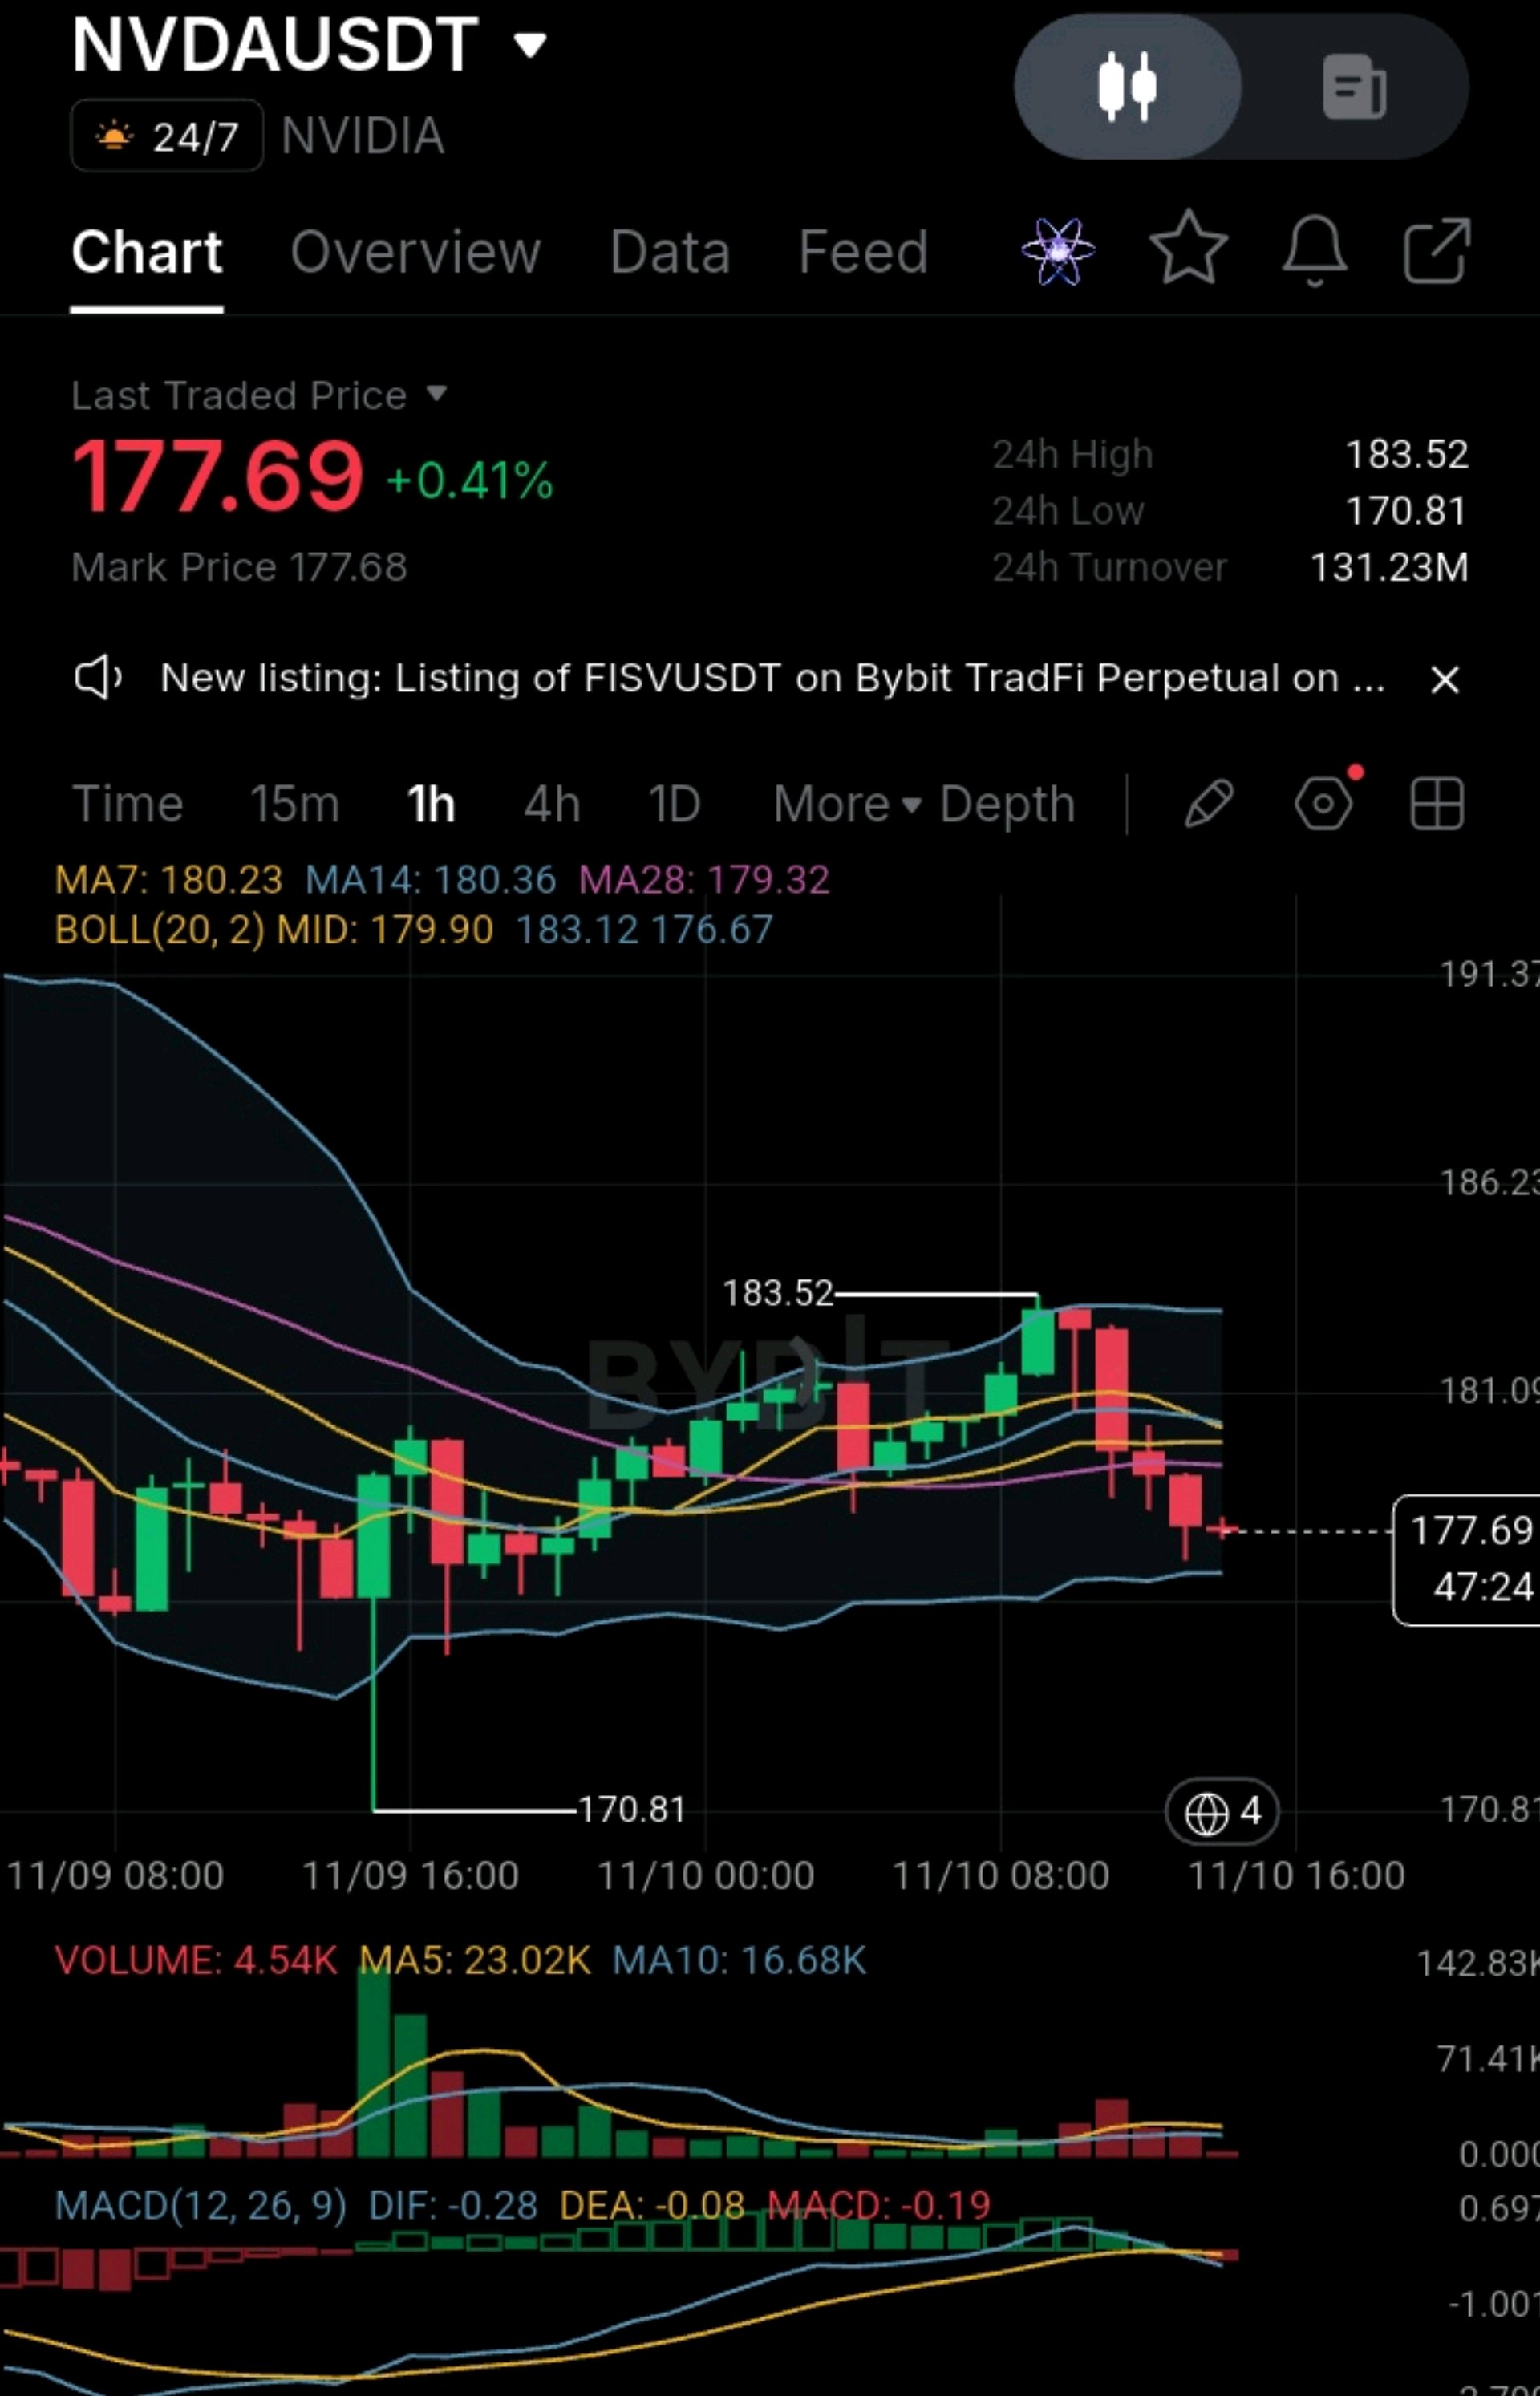
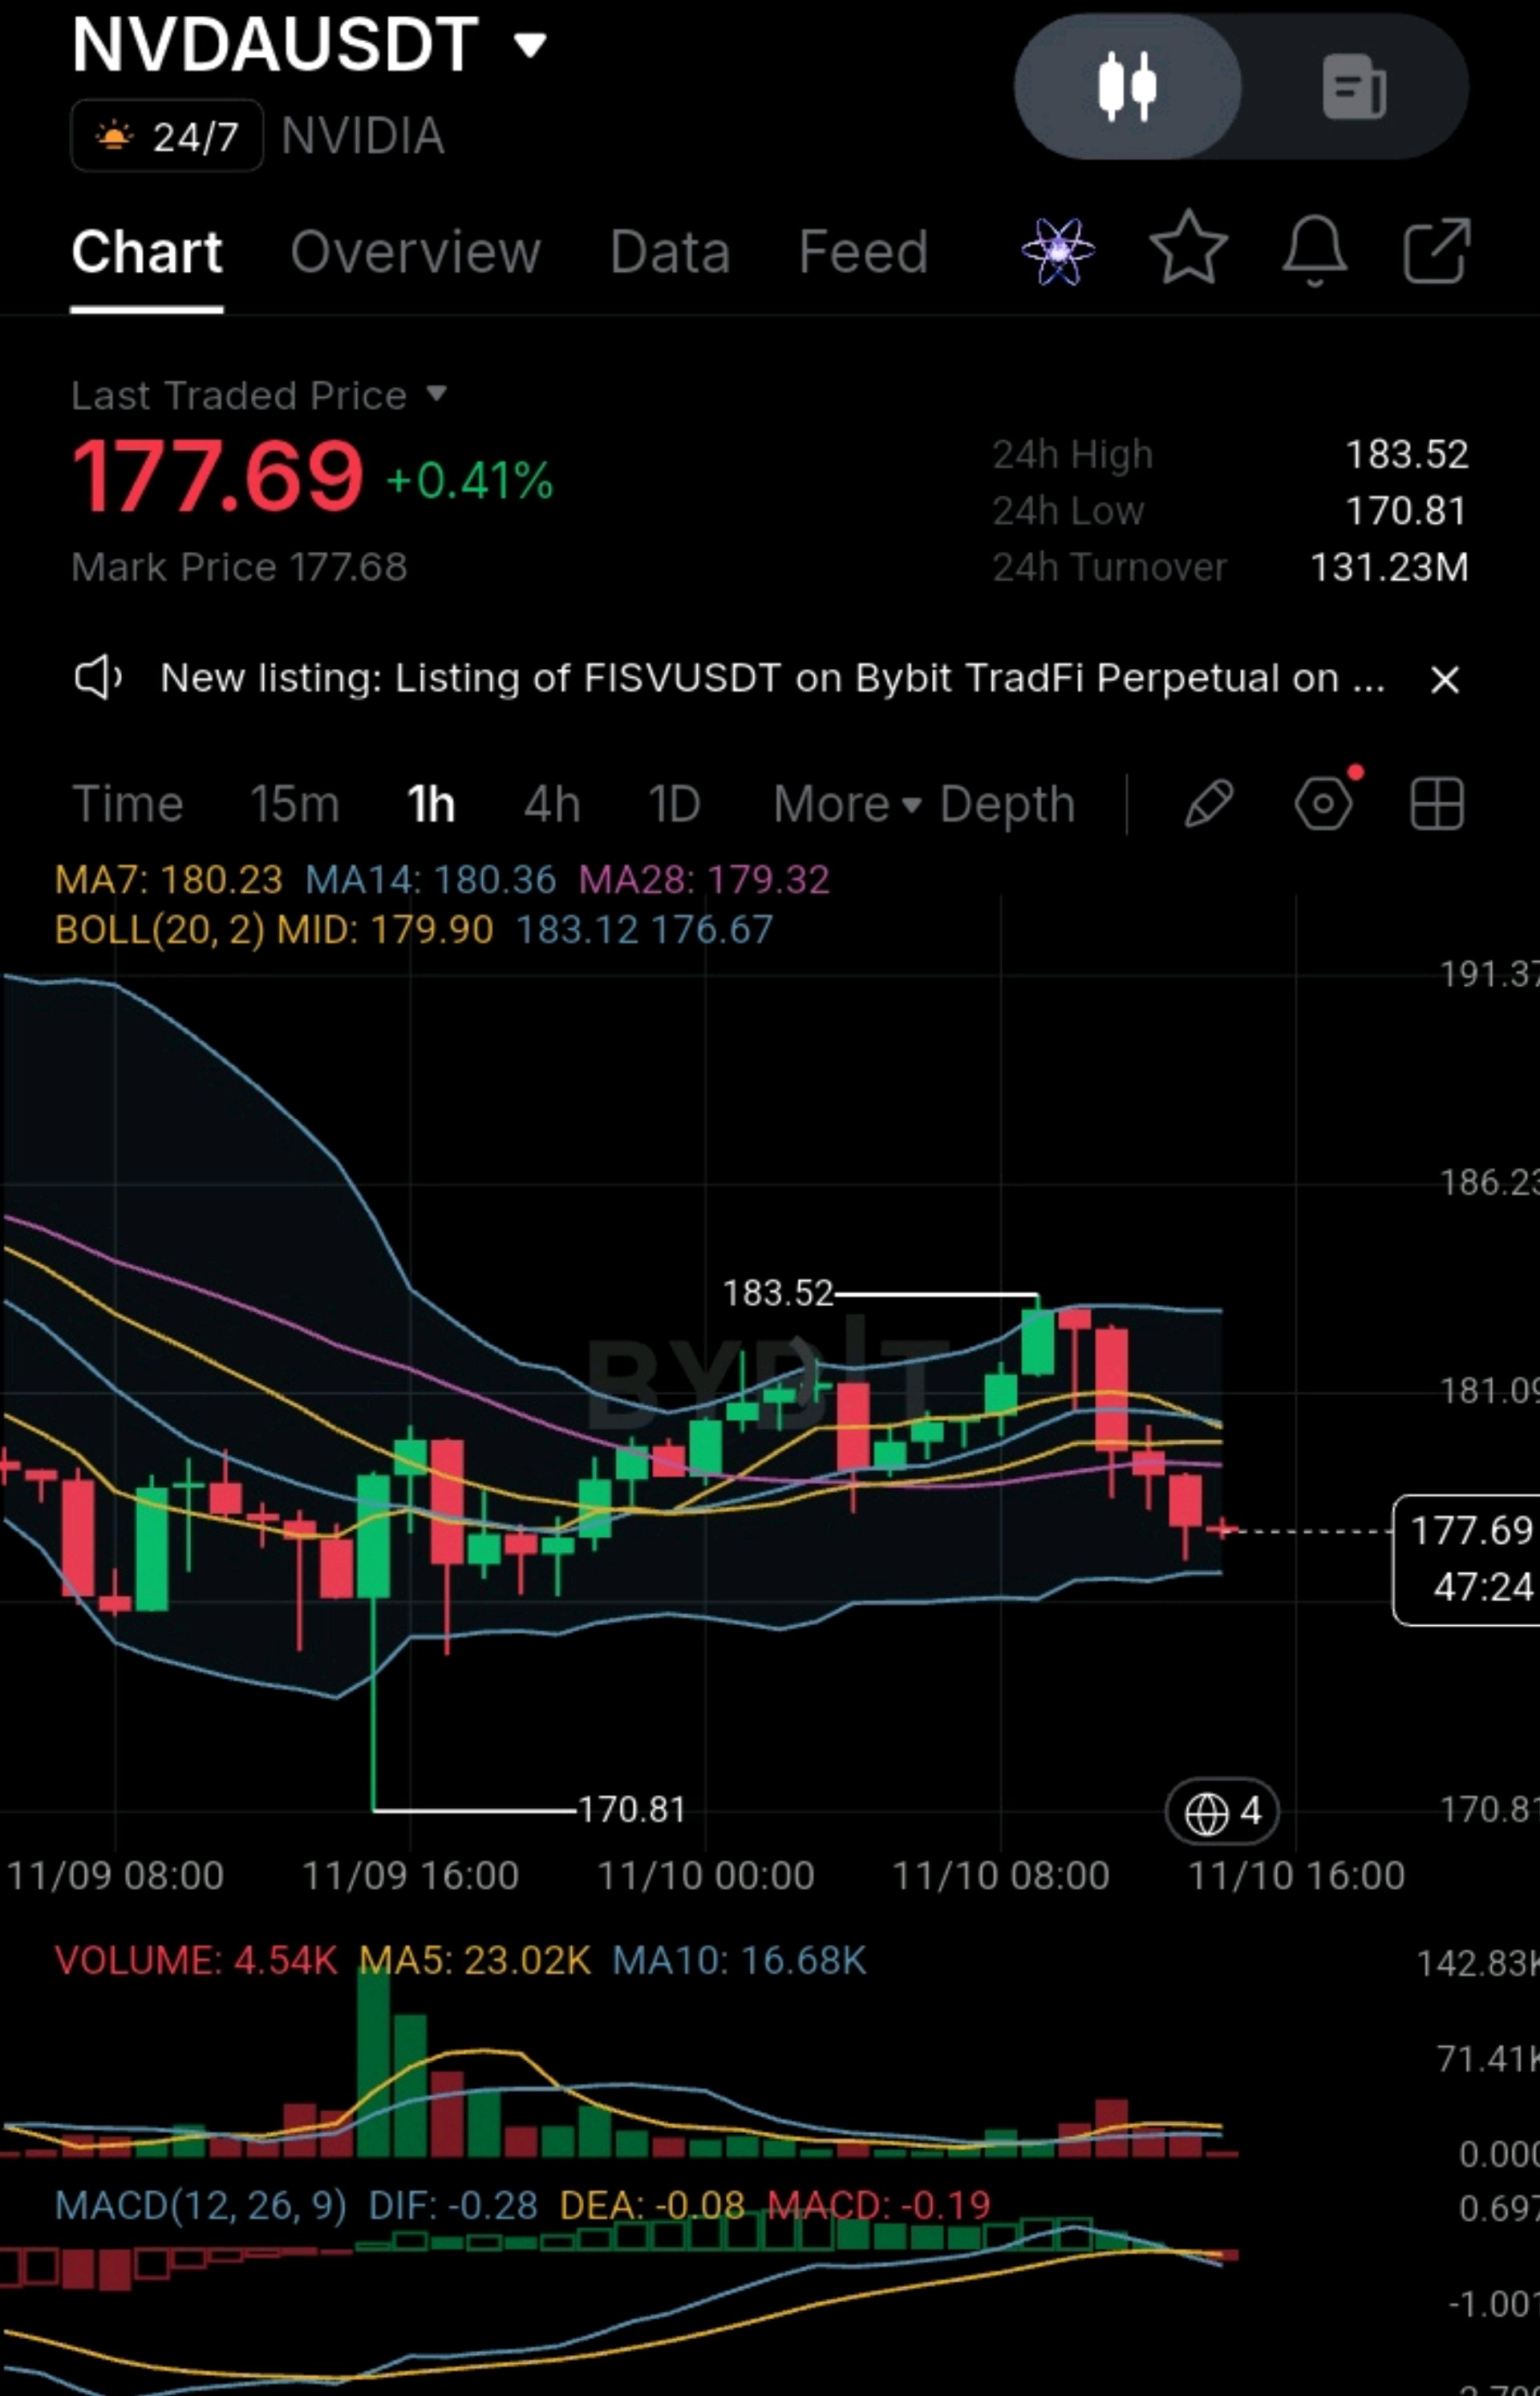
#IMPACTbyTrade #NovUSCPIWatch #USPayrollsAndRateDecisionsDriveMacroWeek #WSOT2026 #BybitAIEvolving NVDA Slips to $177.7: Can Bulls Reclaim $180? NVDAUSDT was rejected at $183.52 and has drifted lower, but the next support zone will show whether this is more than a short-term dip. On my 1H Bybit chart, NVDAUSDT is trading around $177.69, up 0.41% on the day. Price has slipped below the MA7, MA14 and MA28 cluster near $180, while the MACD has turned negative (DIF -0.28 below DEA -0.08, histogram -0.19). Sellers are showing up after the rejection at the upper Bollinger Band. But there's a catch. NVDA is now sitting just above $176.67, the lower Bollinger Band, and volume is thin (4.54K vs a MA5 of 23.02K), so neither side has much conviction. Bears may still push lower, but a bounce or consolidation here would not be surprising. The current candle is also still open, so judge it at the close. Here are the levels on my radar: $183.52: 24h high and major resistance. A solid 1H close above it would flip the bias bullish. $180.36-$179.90: MA14 and the Bollinger midline. Price needs to reclaim this zone to repair the structure. $176.67: Lower Bollinger Band and the nearest support to watch. $173.00: Next support area if $176.67 gives way (an estimate, not a hard level). $170.81: 24h low. Losing this level would weaken the recovery setup. The wider market remains sensitive to AI demand, earnings expectations (the next report is typically in late November, so check the date), China export rules and tariffs, so one green candle isn't enough to confirm a trend reversal. This is also a 24/7 perpetual tracking the stock, so it can gap when the US market opens. My approach is simple: watch how price reacts at $176.67 and $180.36 rather than assume the next move has already happened. Would you wait for a reclaim of $180.36, or are you expecting a break below $176.67? Not financial advice. DYOR. $NVDAXUSDT
CEO's private life
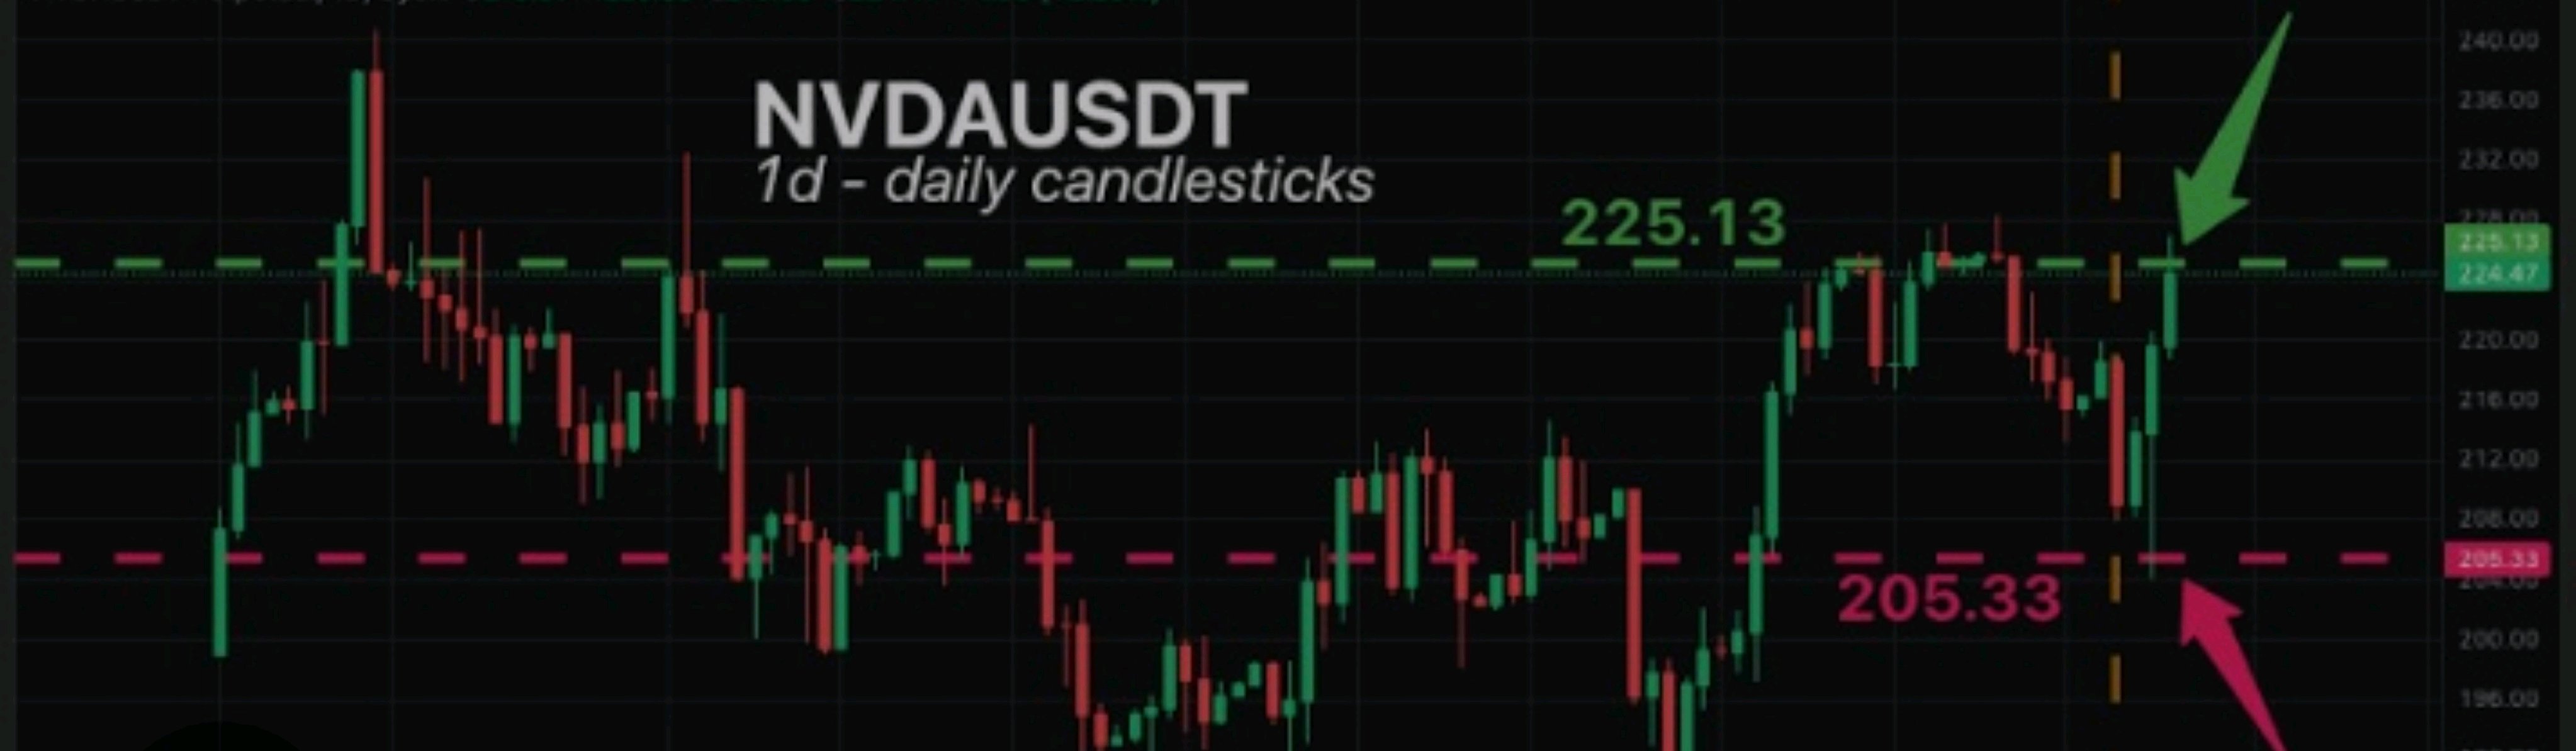
#ByXIMPACT Even then, a CEO's private life rarely moves a stock like NVDA much unless it affects leadership, governance or filings. 📊 Read Through My Current Analysis of $NVDA (NVDAUSDT) It has been quietly sliding, and the chart needs a reaction. NVDAUSDT is trading around 177.69 after being rejected at 183.52, right at the upper Bollinger Band (183.12). The 24h range is 170.81 to 183.52, and price has repeatedly interacted with the 180 region. That makes this area pretty important to me. Price is now below the MA7 (180.23), MA14 (180.36), MA28 (179.32) and the BB midline (179.90), so I'm less interested in calling every small bounce a reversal. Actually, for me, the first thing I'd want to see is the 176.67 area (lower Bollinger Band) hold properly. If buyers defend it and push NVDA back above 179.90-180.36, the chart could start building a short-term recovery. From there, 183.52 becomes the next area I'd pay attention to. But if 176.67 finally cracks and sellers manage to close below it, the market could revisit the 173 area, then the 170.81 low. Momentum and volume: MACD is negative and rolling over (DIF -0.28 below DEA -0.08, histogram -0.19). Volume is thin (4.54K vs a MA5 of 23.02K), so there's little conviction either way. The current candle is still open (about 47 minutes left), so judge it at the close. Fundamentals: I'm not factoring in any personal-life headlines about the CEO, since I couldn't find credible reporting on them. What actually moves NVDA is AI demand and data-center spending, earnings (the next report is typically in late November, so check the date), China export rules, tariffs, and the wider Nasdaq tone. This is also a 24/7 perpetual that tracks the stock, so it can gap when the US market opens. 🎯 Check my target: Recovery: 179.90 → 180.36 → 183.52 Breakdown: 176.67 → 173.00 → 170.81 Trade plan (illustrative): Sell-the-bounce: enter at 179.50-180.00 on a rejection, with a stop at 181.40 (above the MA14 and BB mid). Targets are 176.67 (about 1.9R) and 173.50 (about 3.8R). Bullish alternative: an hourly close above 180.40 on rising volume, with a stop at 178.50 and a target of 183.52 (about 1.5R). Risk only 1-2% of your account, take partial profit at the first target, and keep leverage low. I'm leaning cautiously bearish until NVDA proves otherwise. The averages are overhead and momentum is negative, and I'd rather see the chart reclaim 180.36 before changing that view. 176.67 vs 180.36 is where the next argument between buyers and sellers gets interesting This is technical analysis for discussion, not financial advice. The levels are illustrative, so size your risk and always use a stop. If you tell me whether you're long or short, I can tailor the plan to your entry and stop, Tell me in the comment. $NVDAXUSDT

$CPOOL And $NVDA
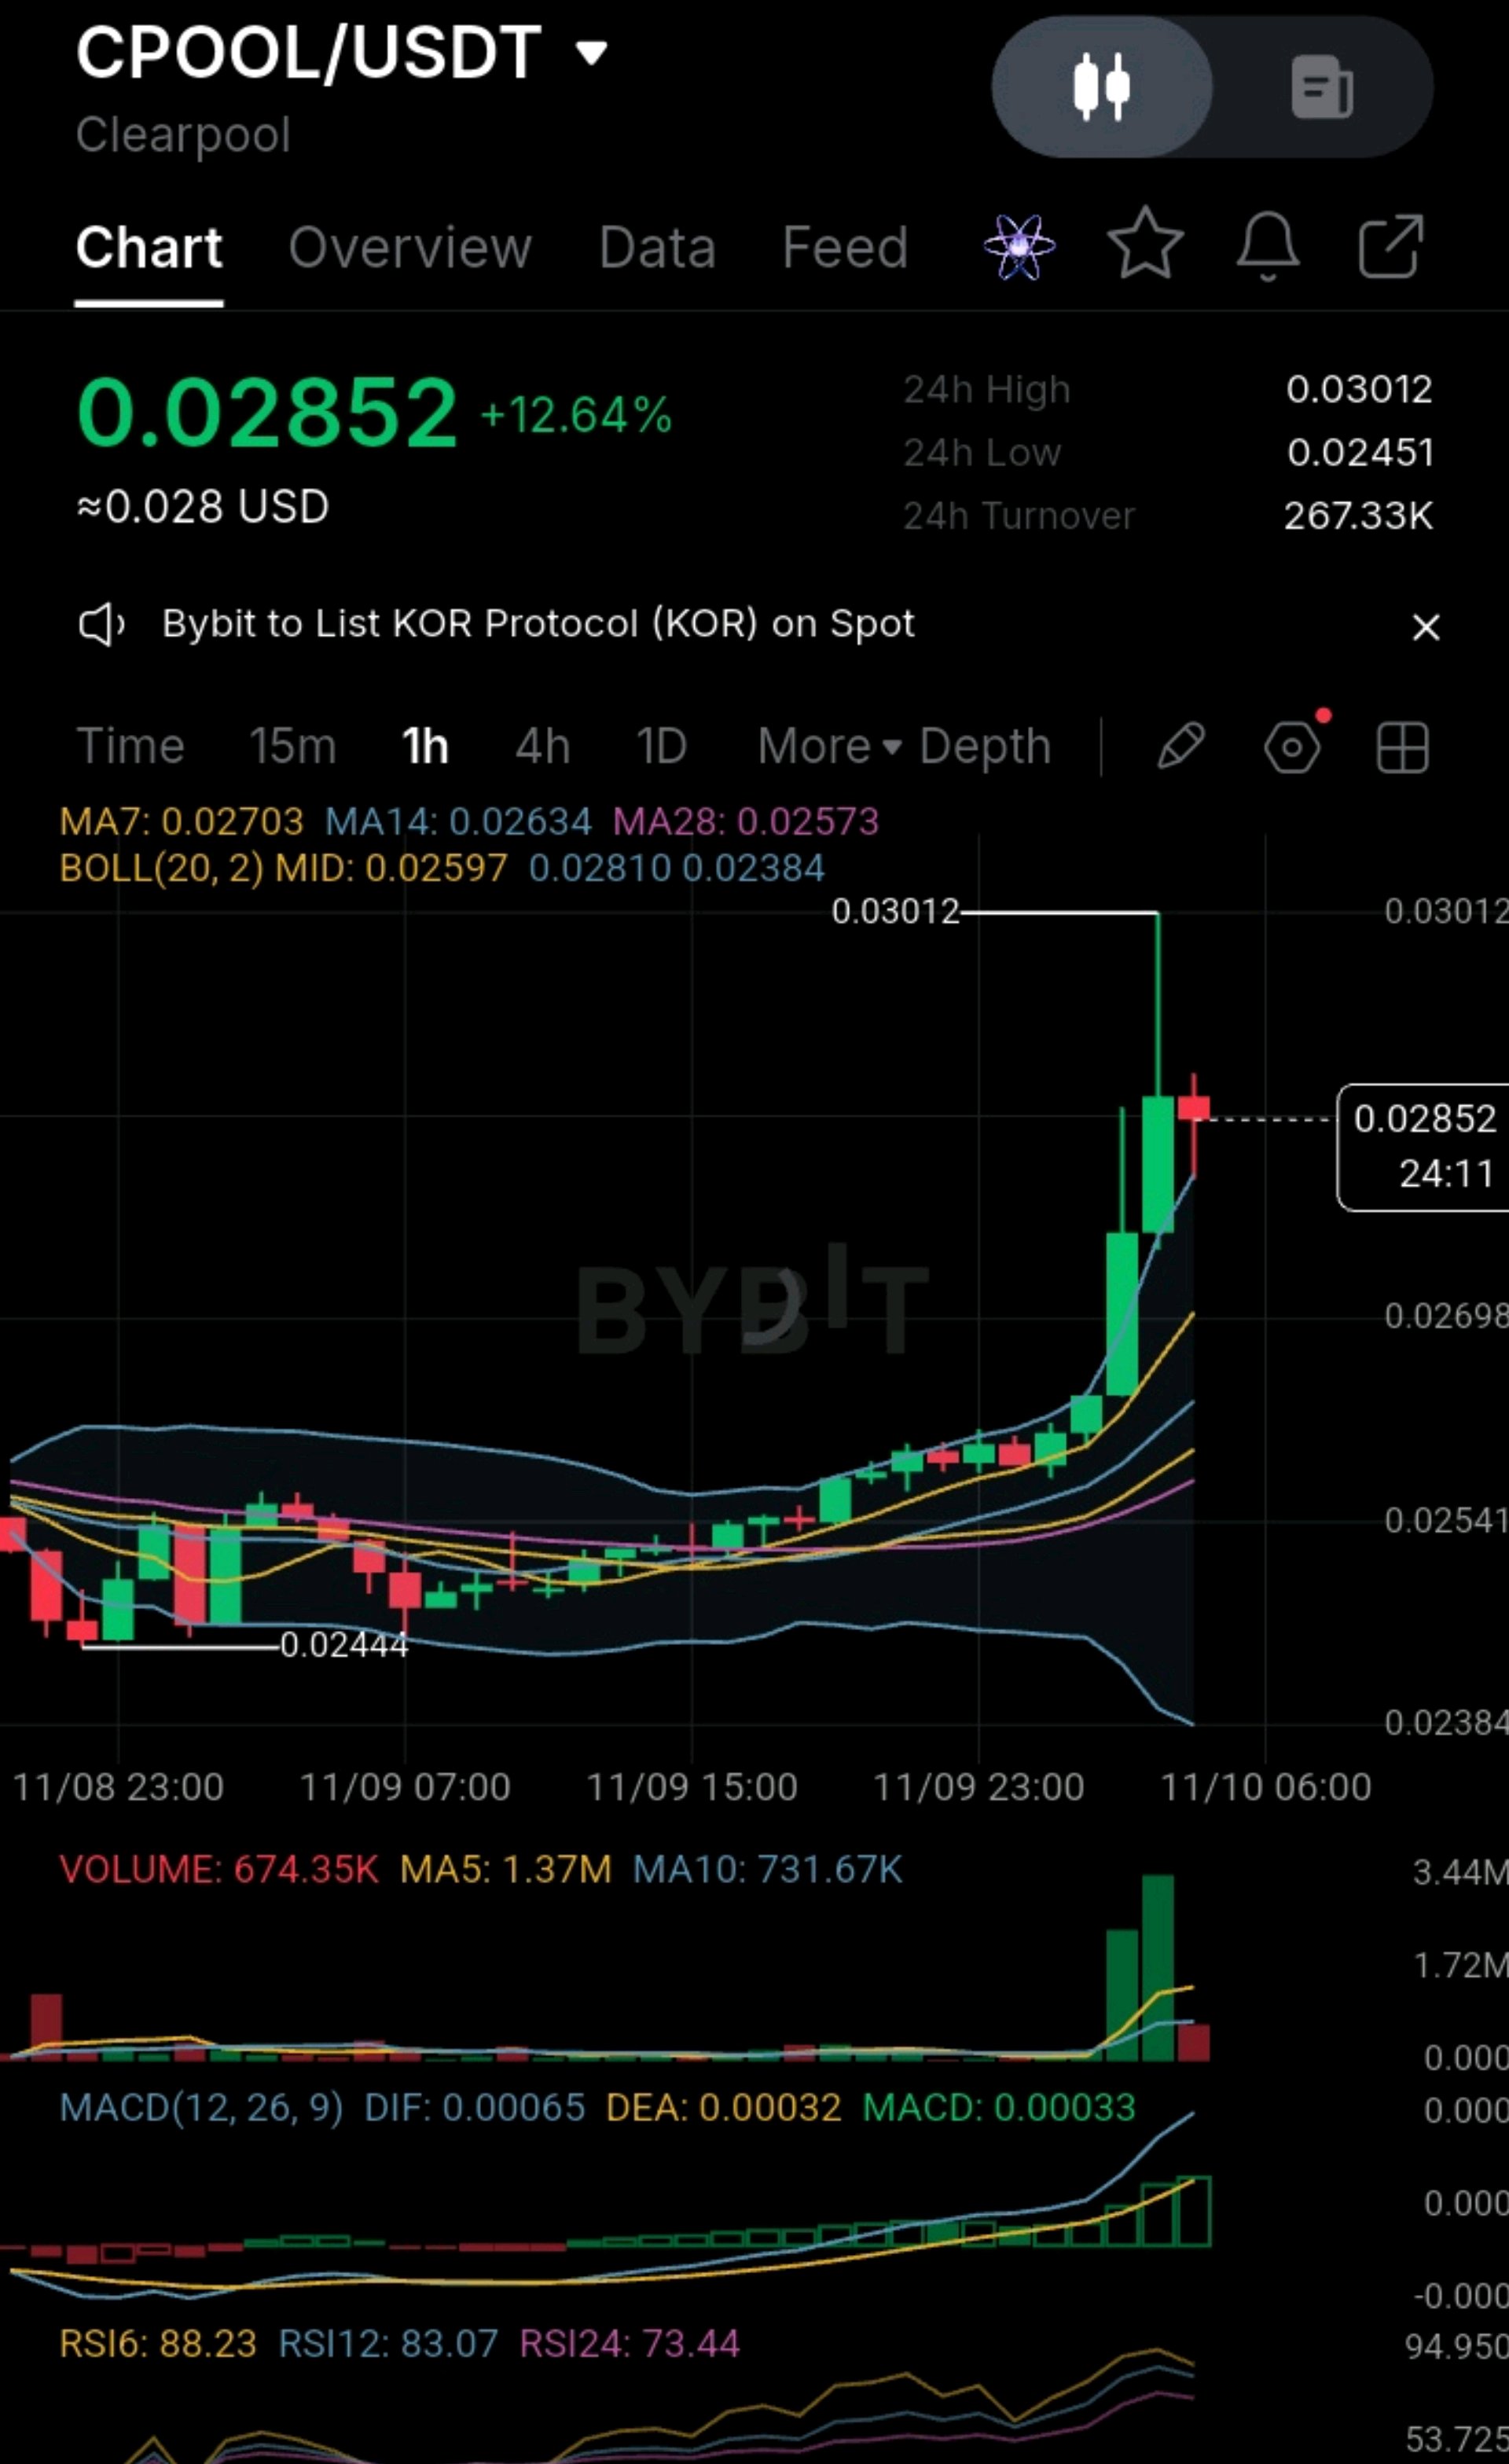
#IMPACTbyTrade #NovUSCPIWatch #USPayrollsAndRateDecisionsDriveMacroWeek #WSOTPicktoEarn10U #OilVolatilityTracksIranPeaceTalks This One Is For $CPOOL And $NVDA 😎 $CPOOL vs $NVDA 🚀📉 We can't keep pretending the small caps and the stock perps don't deserve attention whenever the market starts waking up 😂 The interesting part is how different these two feel on the 1-hour chart. One is a tiny DeFi token that just went vertical. The other is a trillion-dollar stock perp that is drifting lower. ⚡ MARKET STRENGTH AND WEAKNESS $CPOOL (0.02852, +12.64%) ✅ Strength: it broke out of a long base on two big volume candles, and MACD is positive and widening (DIF 0.00065 vs DEA 0.00032). Price is above MA7 (0.02703), MA14 (0.02634) and MA28 (0.02573). ⚠️ Weakness: it is heavily overheated. RSI6 is 88.23, RSI12 83.07 and RSI24 73.44, and price is above the upper Bollinger Band (0.02810). The 0.03012 high was rejected with a long wick, and volume is fading on the red candle (674.35K vs a MA5 of 1.37M). ⚠️ Weakness: it is very small and thin. Data sites show a market cap of roughly $28 million to $21 million, and 24h turnover on your chart is only 267.33K. $NVDA (177.69, +0.41%) ✅ Strength: it has deep liquidity, with about 131.23M in 24h turnover, roughly 490x CPOOL's. It is a mega-cap with an AI-demand story, and it trades 24/7 as a perp. ⚠️ Weakness: price sits below MA7 (180.23), MA14 (180.36), MA28 (179.32) and the BB midline (179.90). MACD is negative (DIF -0.28 below DEA -0.08, histogram -0.19), and it was rejected at 183.52, right at the upper band (183.12). Volume is dry (4.54K vs a MA5 of 23.02K). 🐋 WHALE POSITIONING CPOOL: I couldn't find reliable wallet-level data. On a token this small, one large wallet can move the price either way. The two big green volume bars at the breakout are consistent with large participants stepping in, but volume can't tell you whether they were buying or selling, and the fade since then looks like profit-taking. $NVDAXUSDT $CPOOLUSDT


BR/USDT
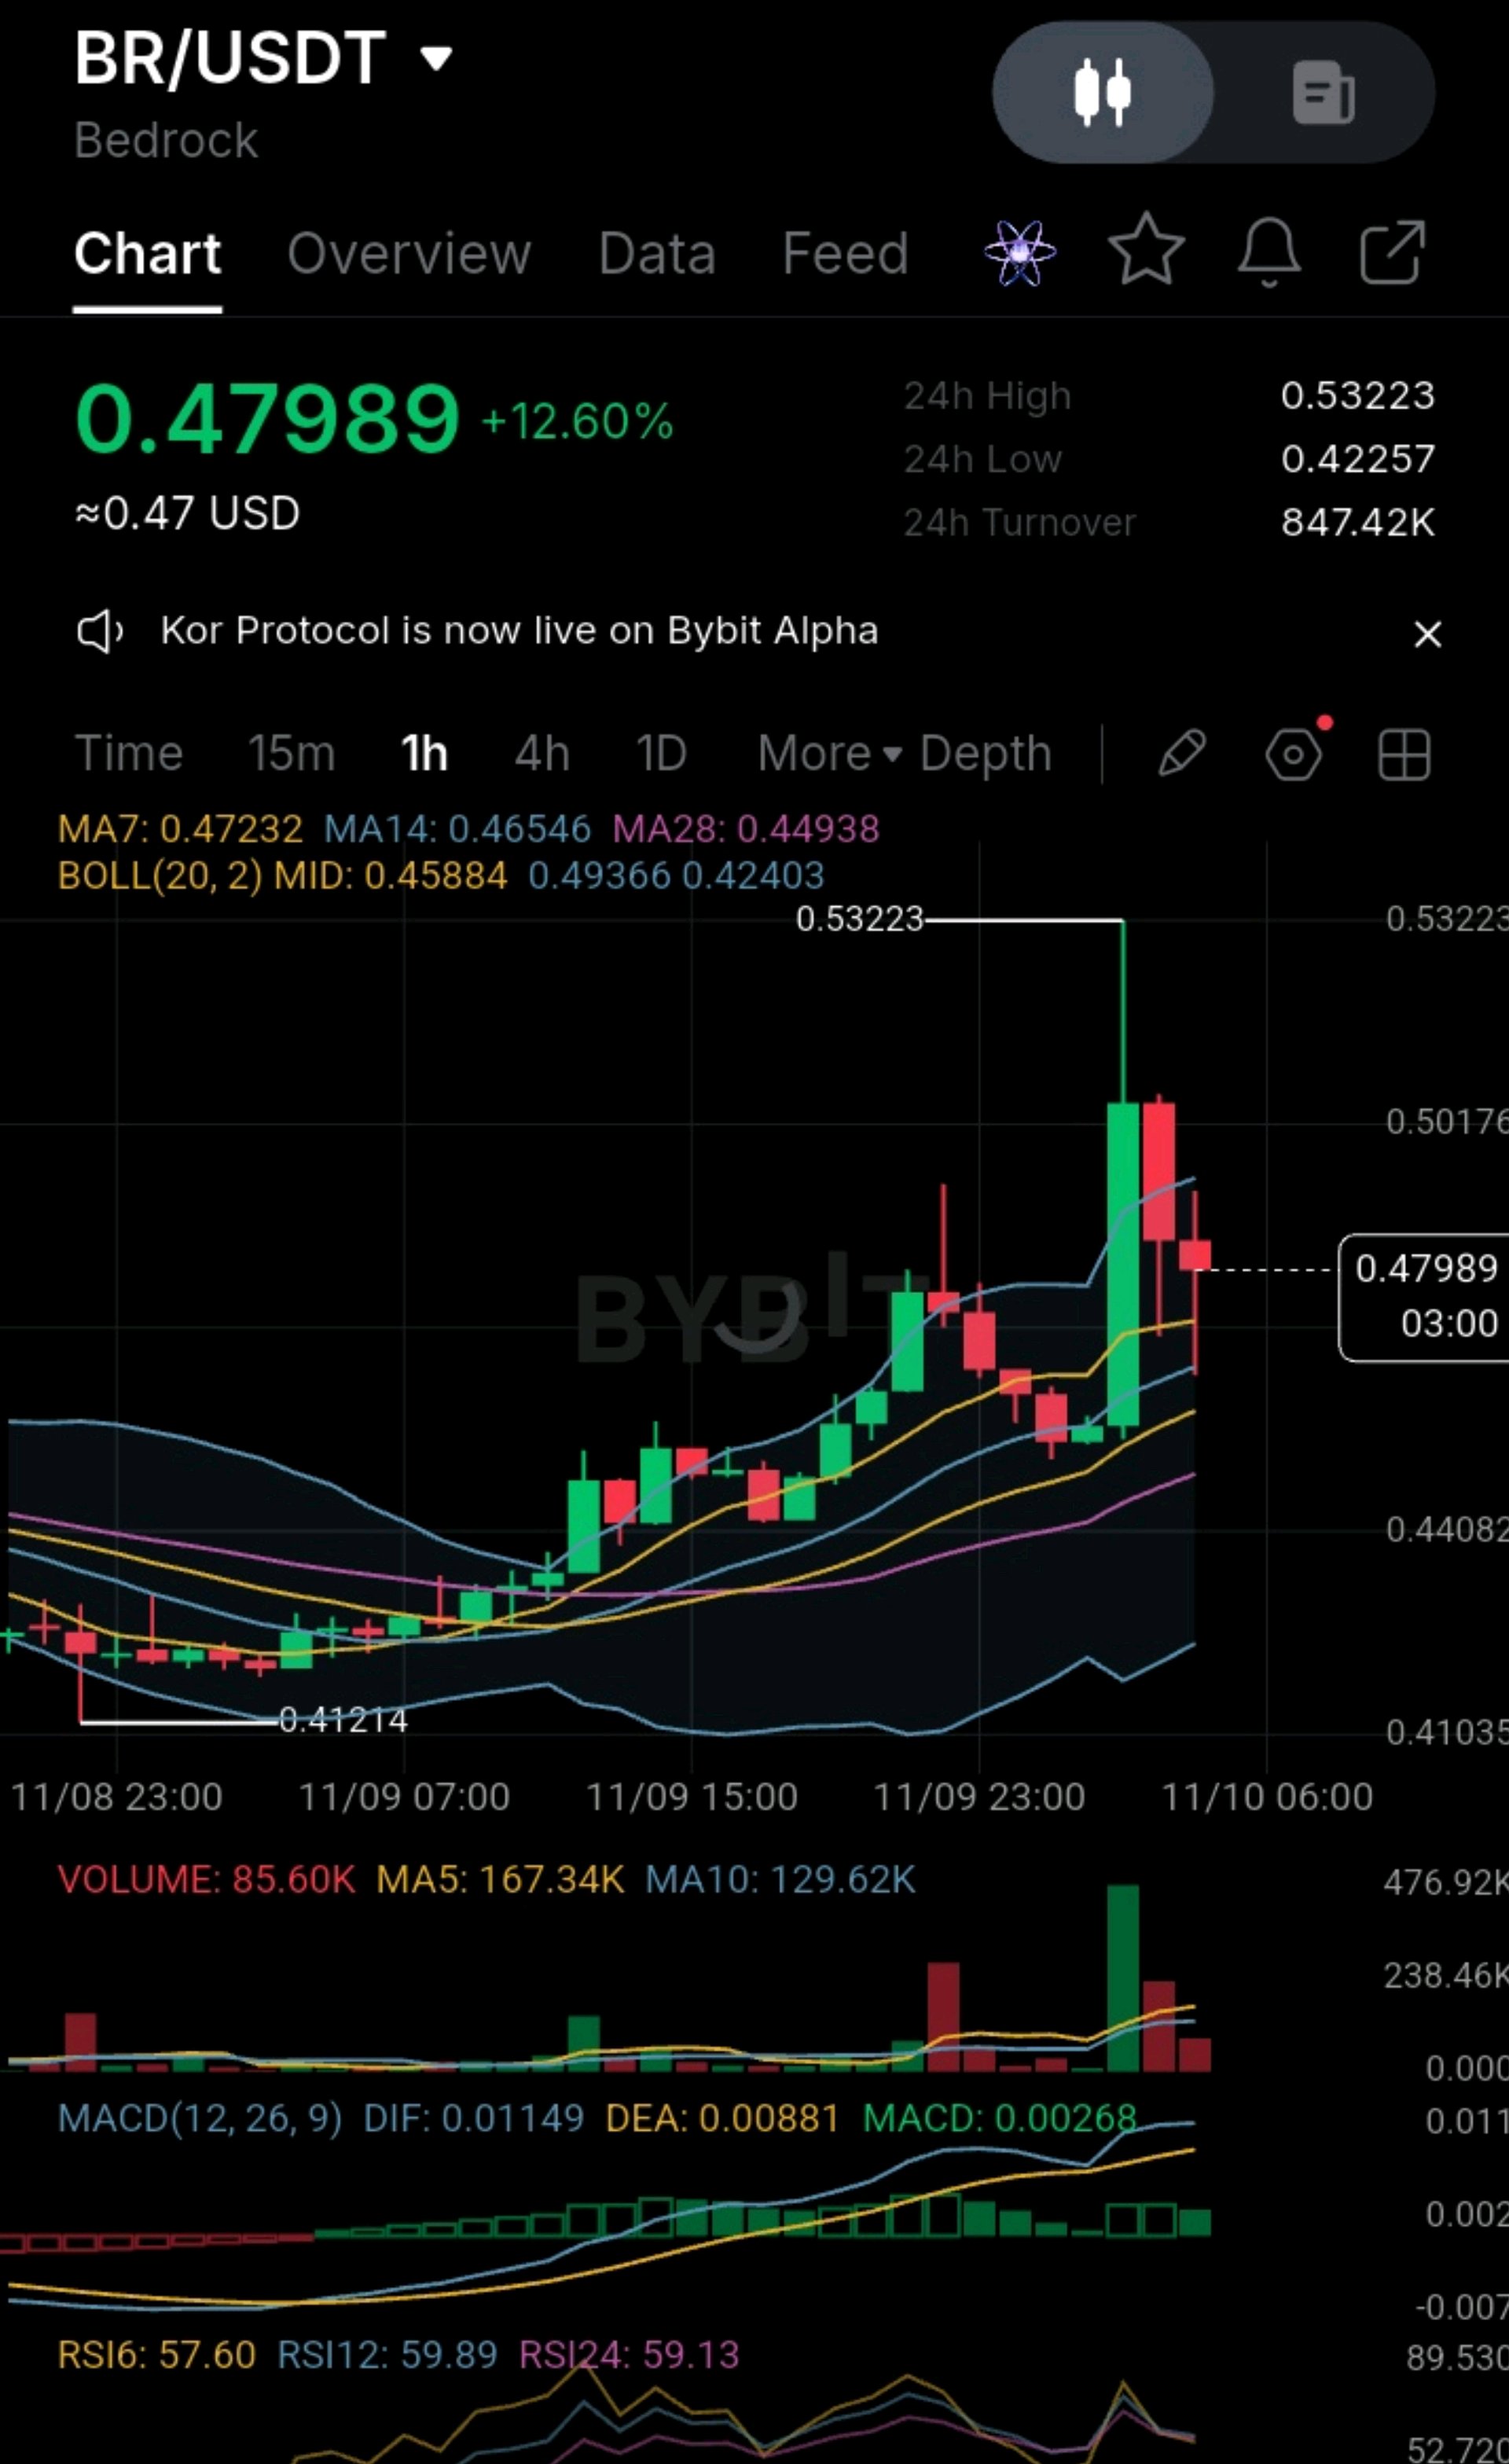
#ByXIMPACT #NovUSCPIWatch #WSOTPicktoEarn10U #USPayrollsAndRateDecisionsDriveMacroWeek #OilVolatilityTracksIranPeaceTalks This is an interesting chart. BR/USDT (Bedrock) is showing stronger bullish momentum, but there are signs of short-term profit-taking after a sharp price increase. Let's break it down. 1. Current market position Current price $0.47989 24h change +12.60% 24hhigh $0.53223 24h low $0.42257 24h turnover $847.42K Bedrock has rallied significantly from $0.41214 to $0.53223 before pulling back. That is a substantial move. 2. Technical indicators MA7, 0.47232 (Bullish) MA14, 0.46546 (Bullish) MA28, 0.44938 (Bullish) RSI6, 57.60 (Neutral-bullish) RSI12, 59.89 (Bullish) RSI24, 59.13(Bullish) MACD, +0.00268 (Bullish) What I find interesting A. Moving averages The price is above all three moving averages. Additionally: MA7 > MA14. MA14 > MA28. This is a bullish moving-average alignment. B. MACD DIF: 0.01149 DEA: 0.00881 MACD histogram: +0.00268. The MACD remains positive, suggesting the broader short-term momentum is still bullish. C. RSI RSI readings are between 57 and 60. This is encouraging because the market has not entered extreme overbought territory despite its 12.60% gain. 3. Important price levels These are the levels I would monitor. $0.53223, Major immediate resistance $0.50200, Intermediate resistance $0.49366, Upper Bollinger Band $0.47989, Current price $0.47232, First support $0.46546, Second support $0.45884, Bollinger middle line $0.44938, MA28 support 4. Something important: Volume Look at the volume during the big green candle. There was a significant increase in buying volume when Bedrock pushed towards $0.53223. However, subsequent candles show reduced volume. This could mean: Early buyers are taking profits. Buying pressure is cooling. The market is consolidating before another move. We cannot establish institutional accumulation or market-maker activity from this chart alone. 5. My trading outlook Short-term outlook: Bullish, but with pullback risk. I see two possible scenarios: Scenario A: Bullish continuation BR holds $0.472. Buyers return with stronger volume. Price breaks $0.49366. A convincing breakout could bring $0.502 and eventually $0.53223 into focus. Scenario B: Deeper correction BR loses $0.472. Price tests $0.465. Further weakness could bring $0.459 into play. I would avoid chasing the current price after its sharp rally. 6. My verdict BR has three encouraging characteristics: Bullish moving-average alignment. Positive MACD. RSI still has room before reaching overbought territory. However, declining volume after the spike means I want confirmation before considering an entry. One thing I want to investigate further There is an important distinction between buying a coin that has already pumped and identifying one that is preparing for another major move. I would investigate Bedrock's: Institutional backing and investors. Project fundamentals and utility. Tokenomics and circulating supply. Exchange listings and liquidity. Upcoming catalysts and potential price drivers. My question: Are you considering buying BR, or are you monitoring it for a potential major breakout? $BRUSDT @RoYoK
CPOOL just went vertical
#IMPACTbyTrade #NovUSCPIWatch #OilVolatilityTracksIranPeaceTalks #BybitAIEvolving #BOERateDecision CPOOL just went vertical out of a long base and is now stretched far above its averages. The next few hourly closes decide whether this is a first leg or a blow-off spike. Look at this 1-hour chart. CPOOL spent hours drifting around 0.0245-0.026, then launched through the Bollinger upper band on two big volume candles to a high of 0.03012. That candle was rejected with a long upper wick, and price is now 0.02852, up 12.64% on the day. The Power: Price is above MA7 (0.02703), MA14 (0.02634) and MA28 (0.02573), and the MAs are turning up in bullish order. MACD is positive and widening (DIF 0.00065 vs DEA 0.00032, histogram +0.00033). The breakout came on real volume, with the two big green bars standing far above the earlier flat volume. The Exhaustion Risk: RSI is overheated: RSI6 is 88.23, RSI12 83.07 and RSI24 73.44. That's deep in overbought territory on every period. Price is trading above the upper Bollinger Band (0.02810) and about 5.5% above the MA7. Moves this far from the averages usually snap back or at least consolidate. The 0.03012 high was rejected with a long wick, and the current candle is red. It has about 24 minutes left, so judge it at the close. Volume is fading on the red candle (674.35K vs a MA5 of 1.37M), so buyers are stepping back. Turnover is thin (267.33K), so spikes can reverse fast. Key levels: Resistance: 0.03012 (24h high), then roughly 0.0310 Support: 0.02810 (upper band), 0.02703 (MA7), 0.02634 (MA14), 0.02597 (BB mid), 0.02573 (MA28), then the 0.02444 base Trade Plan (illustrative): Preferred entry: a pullback into 0.0270-0.0274 (MA7 area), ideally with a bounce candle. Stop loss: 0.02580, below the BB mid and MA28. A closing break below invalidates the setup. Target 1: 0.02900, about 1.3R from a 0.02720 entry. Target 2: 0.03012 (24h high), about 2.1R. Target 3: 0.03150, an extension estimate, not a hard level, about 3R. Breakout alternative: an hourly close above 0.03012 on rising volume, with a stop under 0.02850 and smaller size, since the risk/reward is much worse when chasing. Position size: risk only 1-2% of your account on the stop distance. Take partial profit at Target 1 and move the stop to breakeven. If it goes wrong: below 0.0258, expect a slide to about 0.0250 and then the 0.02444 base, where the whole move would be given back. Verdict: the breakout is real, but with RSI6 at 88, this is a poor place to buy. I'd wait for a pullback to the MA7/MA14 zone or a clean volume breakout above 0.03012, and either way set the stop first. My Execution Strategy: I don't buy vertical candles. I let the market cool off, then take the entry with a defined stop. Call to action: Are you buying the dip to 0.0272, waiting for a confirmed break of 0.0301, or staying out until RSI cools? Drop your plan below 👇 and set alerts at 0.03012 and 0.02580 so you don't miss either move. This is technical analysis for discussion, not financial advice. $CPOOLUSDT @BitRase @RoYoK