Btc星辰
4020Suka0Pembagian95Penggemar2Ikuti
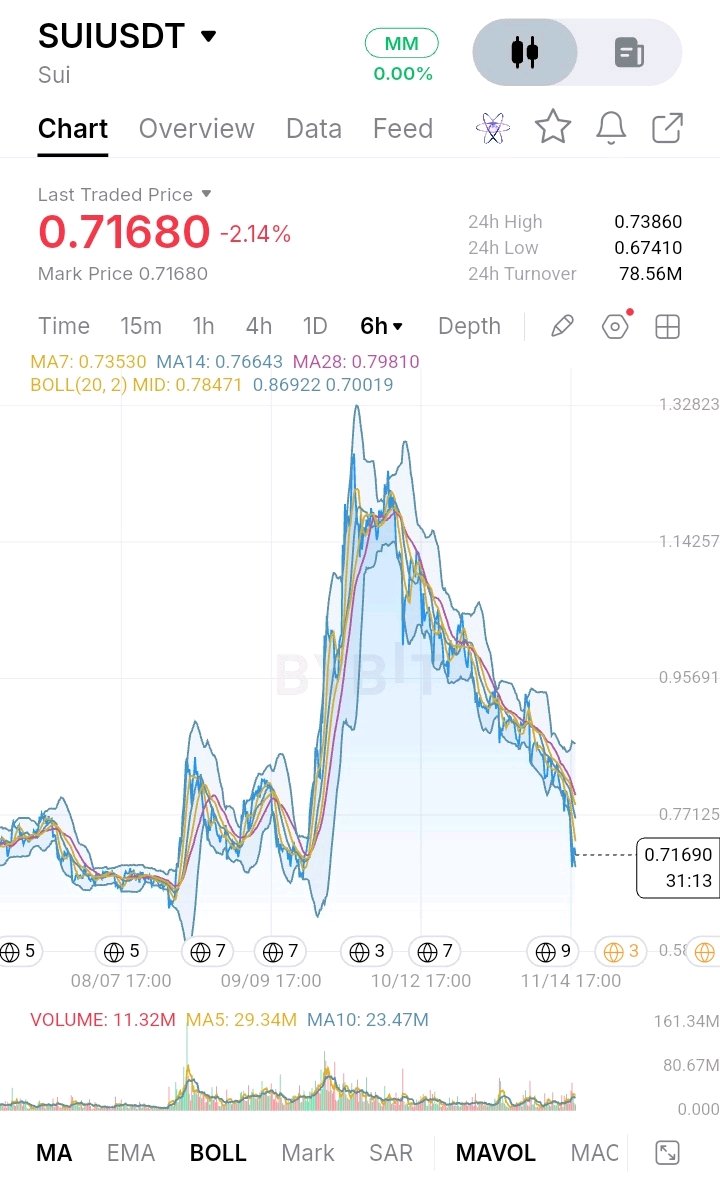
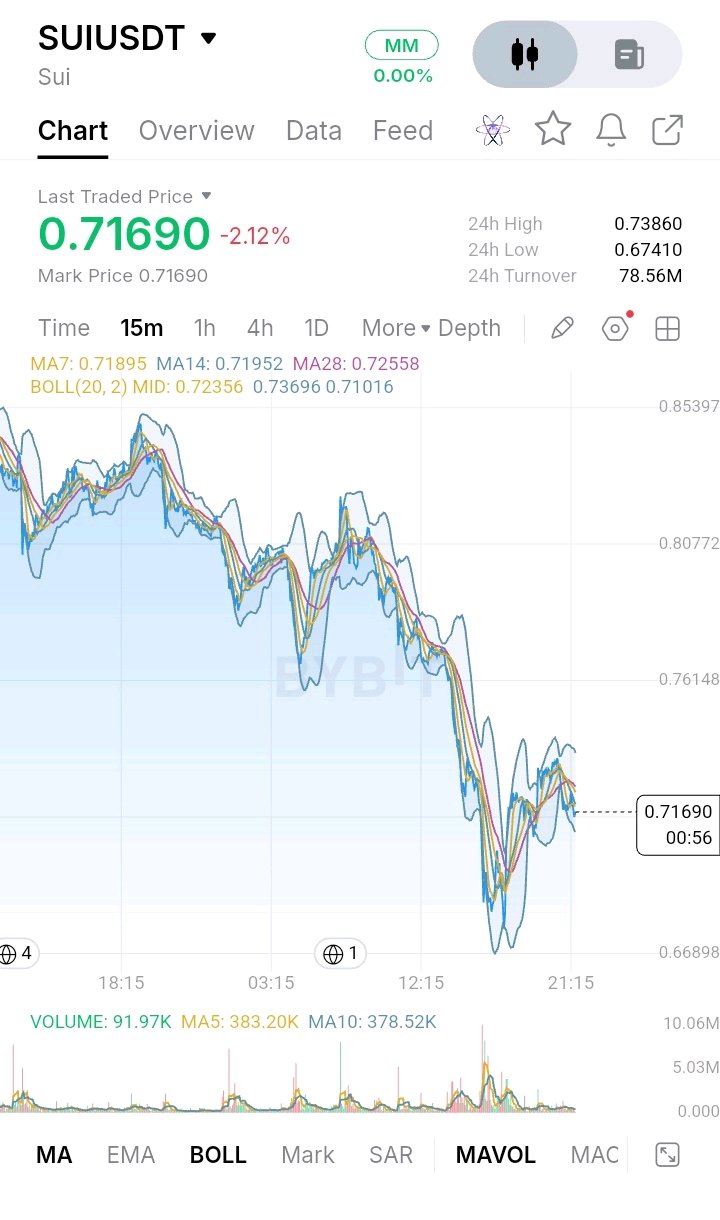
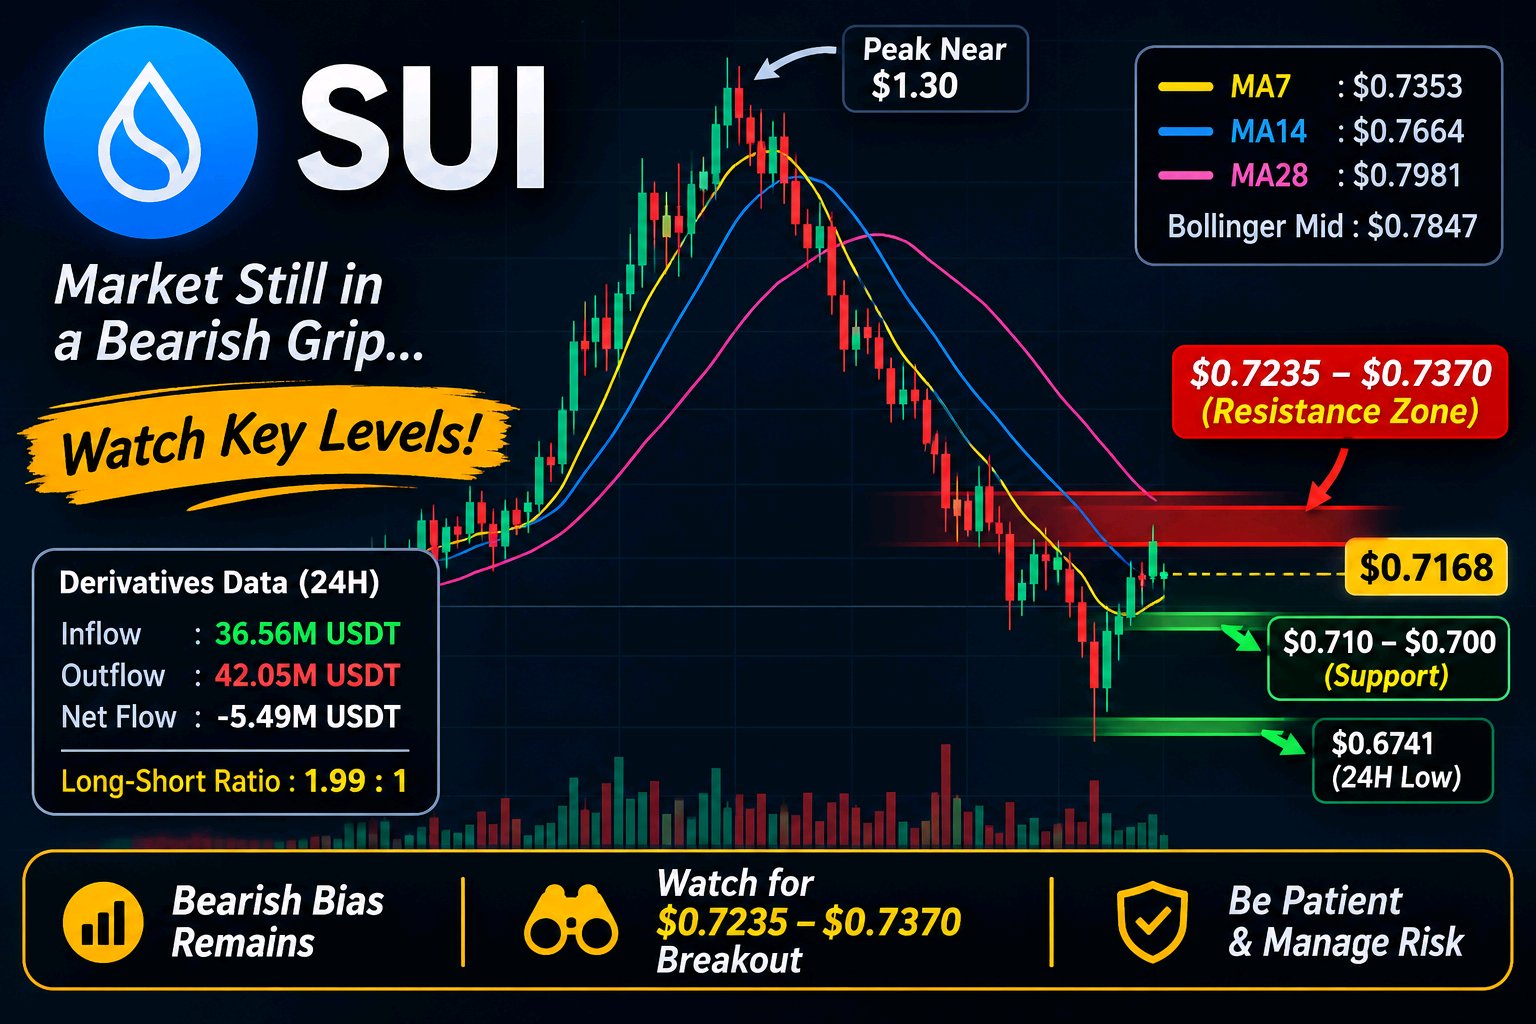
I've been watching $SUIUSDT closely, and what concerns me most right now is that the price is still struggling to build a strong recovery. Trading around $0.7168, SUI remains under selling pressure, and the overall market structure hasn't shown any convincing signs of a bullish reversal yet. There is a small recovery on the lower timeframe, but I don't think it's enough to change the bigger picture. Looking at the 6H chart, the downtrend is quite clear. SUI previously reached around $1.30, but since then, sellers have maintained control, pushing the price into a pattern of lower highs and lower lows. The moving averages support this bearish outlook. MA7 is around $0.7353, MA14 is near $0.7664, and MA28 stands at approximately $0.7981. With the current price trading below all three, buyers still have some work to do before the market can regain strength. Another level I'm paying attention to is the Bollinger middle band around $0.7847. If SUI manages to recover and hold above this area, it could be an early sign that buying momentum is improving. Until then, I would remain cautious. On the 15M chart, SUI has bounced after dropping toward $0.669. However, the recovery is facing resistance around $0.7235–$0.7370. This zone matters because it brings together the short-term moving averages and the upper part of the immediate recovery area. If buyers fail to reclaim it, the current bounce could simply develop into another lower high rather than the beginning of a new uptrend. The derivatives data adds another interesting perspective. The long-short ratio is approximately 1.99:1, showing that long positions are considerably higher than short positions. Meanwhile, 24H derivatives inflows are around 36.56M USDT, while outflows have reached 42.05M USDT, leaving a negative net flow of approximately 5.49M USDT. This suggests that more capital is leaving the derivatives market than entering it. With long positioning already elevated, another downward move could create additional liquidation pressure. For the downside, I'm watching $0.710–$0.700 first, followed by the previous 24H low at $0.6741. On the upside, $0.7386 is the first important level buyers need to reclaim. A stronger recovery would require sustained buying pressure rather than just a temporary bounce. Personally, I'm staying patient with SUI. I'm not treating this as an active long or short position. I want to see how price reacts around these levels before making a decision. Right now, protecting capital and waiting for confirmation makes more sense to me than rushing into a trade. #IMPACTbyTrade
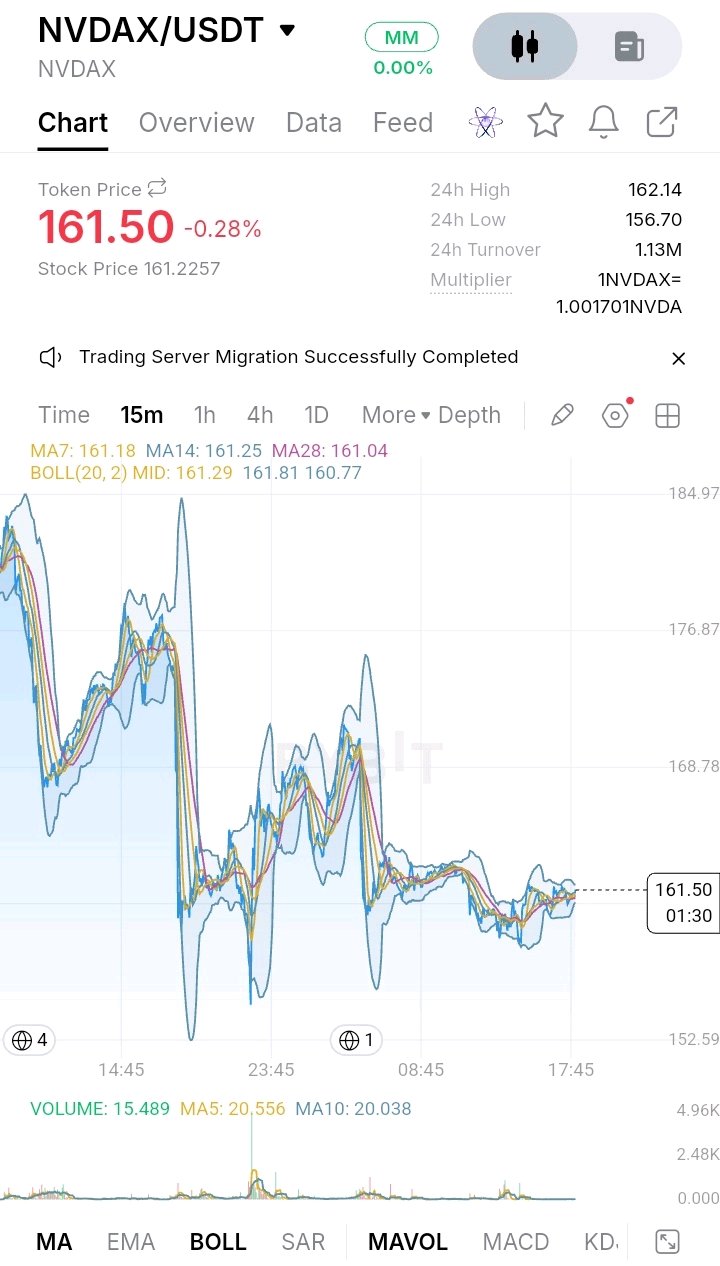
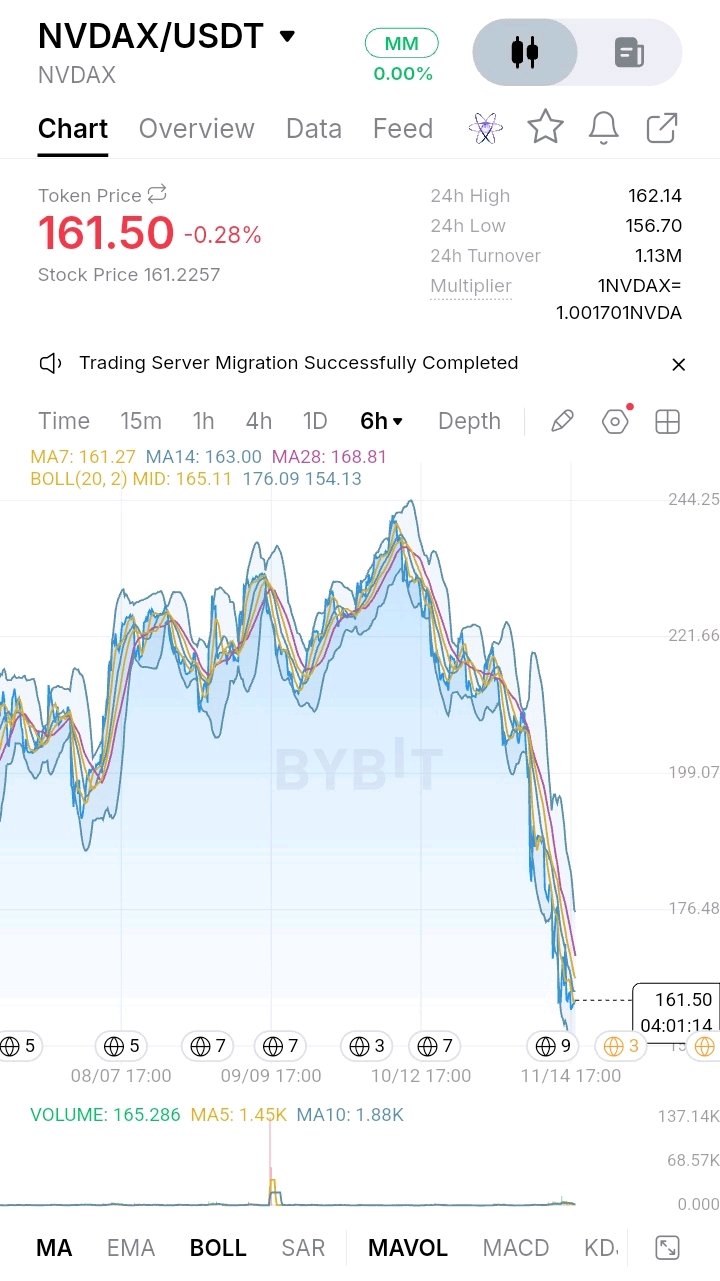
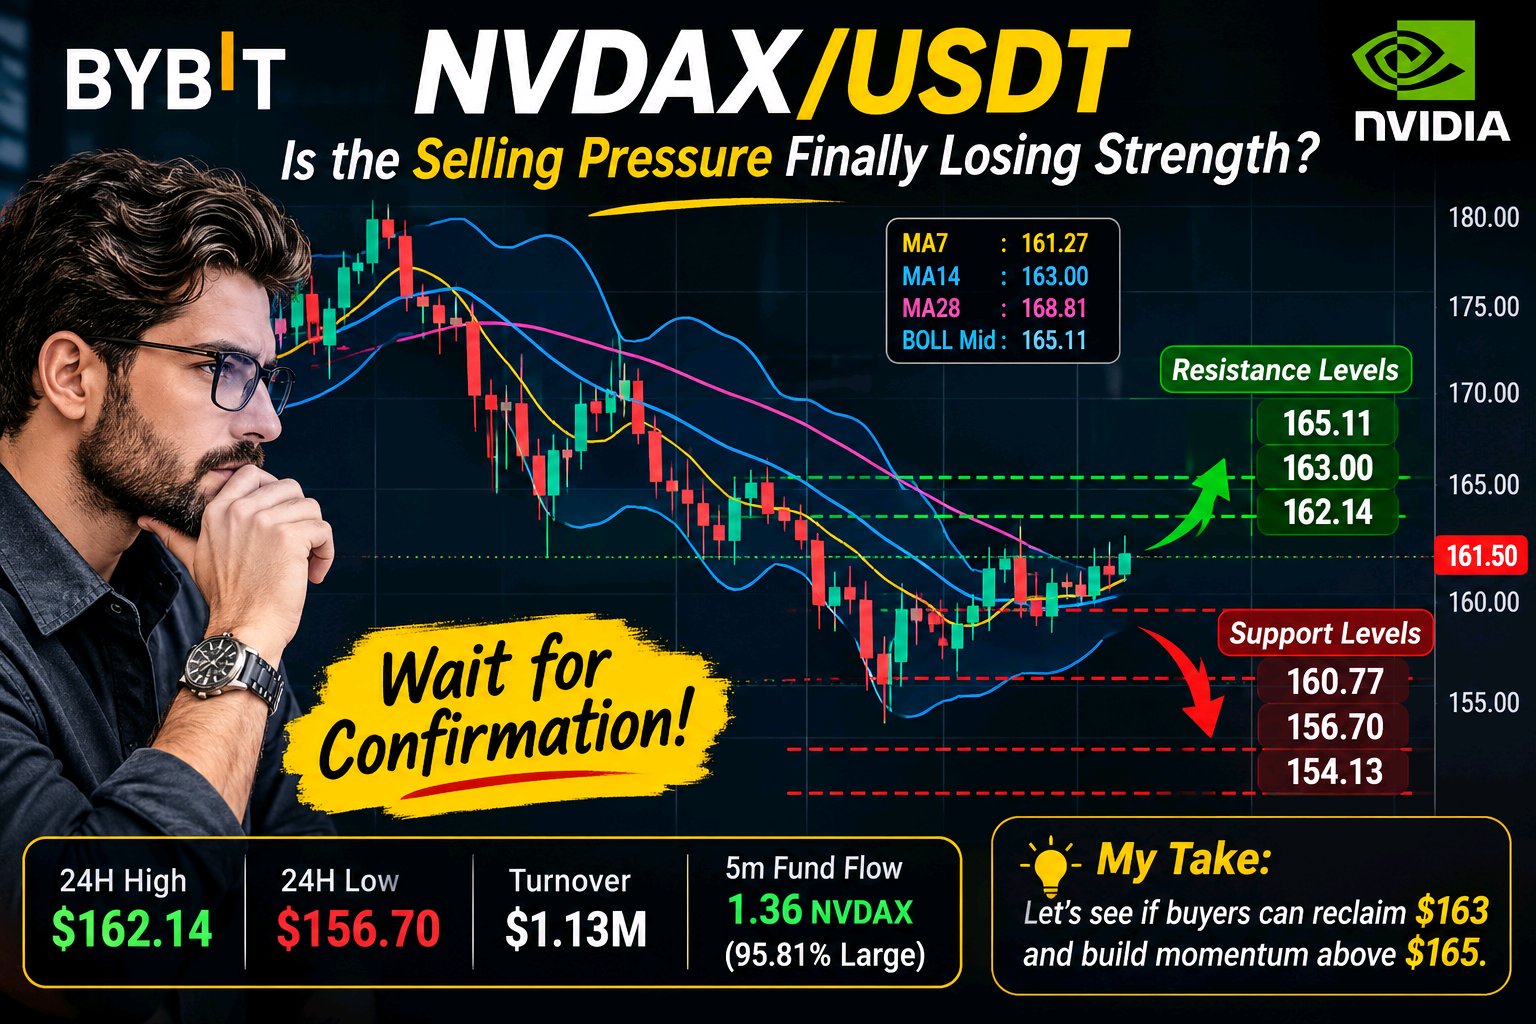
$NVDAXUSDT – Apakah Tekanan Jual Akhirnya Mulai Melemah?** Saya telah mengamati NVDAX dengan cermat, dan yang menarik perhatian saya saat ini adalah betapa melambatnya harga setelah penurunan tajam pada grafik 6 jam. Saat ini, NVDAX diperdagangkan di sekitar $161,50, turun 0,28%, dan meskipun pasar menunjukkan tanda-tanda stabilisasi, menurut saya masih terlalu dini untuk menyebut ini sebagai pembalikan bullish yang sesungguhnya. Jika melihat gambaran yang lebih besar, struktur 6 jam masih berada di bawah tekanan. Harga telah turun cukup jauh dari level tertinggi sebelumnya dan kini diperdagangkan di bawah ketiga rata-rata pergerakan (moving average): MA7 di $161,27, MA14 di $163,00, dan MA28 di $168,81. Garis tengah Bollinger juga berada di sekitar $165,11, yang menjadikannya level penting untuk diperhatikan. Sampai pembeli berhasil merebut kembali area-area ini, saya akan tetap berhati-hati untuk mengharapkan pemulihan yang berkelanjutan. Namun, pada jangka waktu 15 menit yang lebih pendek, kondisinya terlihat sedikit lebih menarik. Harga bergerak sideways di sekitar $161,50, dengan MA7 di $161,18, MA14 di $161,25, dan MA28 di $161,04. Bollinger Bands juga menjadi relatif menyempit, dengan pita tengah di $161,29. Ini menunjukkan bahwa volatilitas telah menurun dan pasar mungkin sedang bersiap untuk pergerakan yang lebih kuat. Untuk sisi kenaikan jangka pendek, $162,14 adalah level pertama yang saya perhatikan, diikuti oleh $163,00 dan garis tengah Bollinger $165,11 pada grafik 6 jam. Pergerakan meyakinkan di atas level-level ini akan memperbaiki prospek pemulihan. Di sisi penurunan, $160,77 adalah support jangka pendek terdekat, sementara $156,70 tetap menjadi level terendah 24 jam yang penting. Penembusan di bawah level terendah tersebut dapat mendatangkan tekanan jual baru, dengan $154,13 sebagai referensi pita Bollinger bawah 6 jam. Satu detail yang juga saya perhatikan adalah data arus dana Bybit. Arus masuk lima menit yang ditampilkan adalah 1,36 NVDAX, termasuk 1,30 dari transaksi besar dan 0,06 dari transaksi menengah. Itu patut dipantau, tetapi satu interval singkat tidak cukup untuk mengonfirmasi akumulasi yang berkelanjutan. Level tertinggi 24 jam berada di $162,14, level terendah di $156,70, dan perputaran (turnover) sekitar 1,13 juta USDT. Pengali (multiplier) yang ditampilkan adalah 1 NVDAX = 1,001701 NVDA, jadi harga saham NVIDIA yang mendasarinya juga tetap relevan. Saya tidak memegang posisi aktif berdasarkan grafik ini. Untuk saat ini, saya ingin melihat apakah pembeli dapat merebut kembali $163 dan membangun momentum di atas $165. Sampai itu terjadi, saya akan tetap bersabar. Terkadang melindungi modal dan menunggu konfirmasi yang jelas adalah keputusan yang jauh lebih baik daripada mencoba menangkap setiap pantulan harga. **Mari kita lihat apakah NVDAX dapat mengubah konsolidasi ini menjadi pemulihan yang nyata atau apakah penjual masih memiliki langkah lain ke depan.** #IMPACTbyTrade
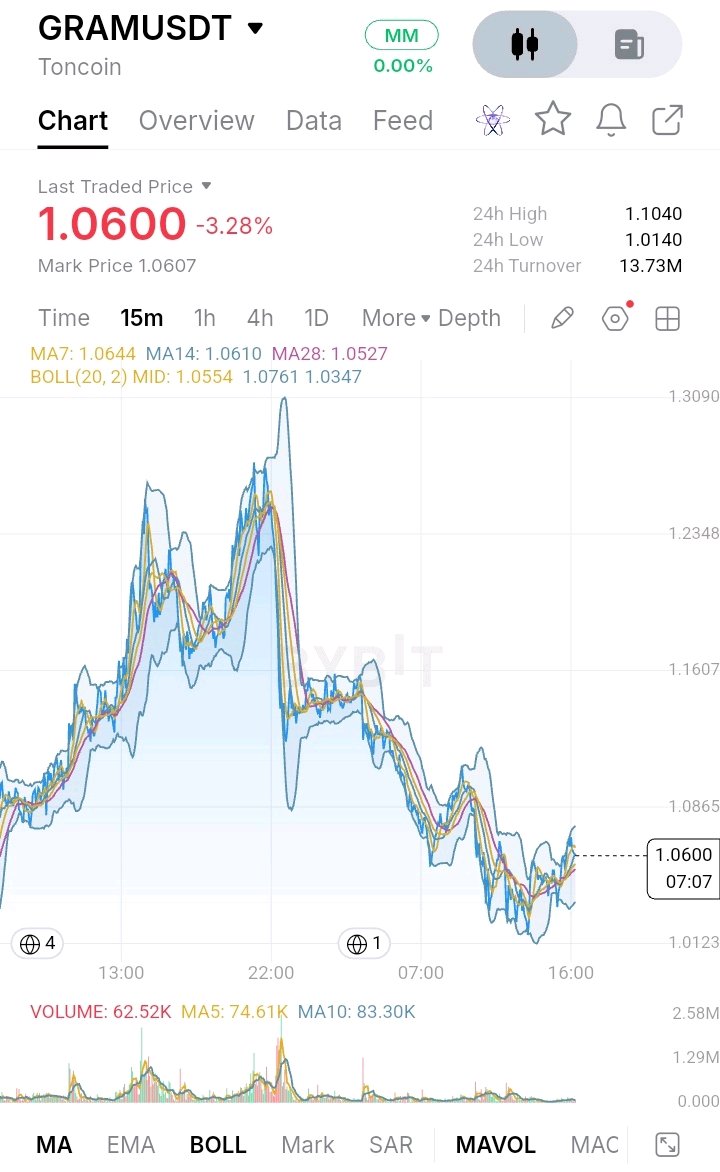
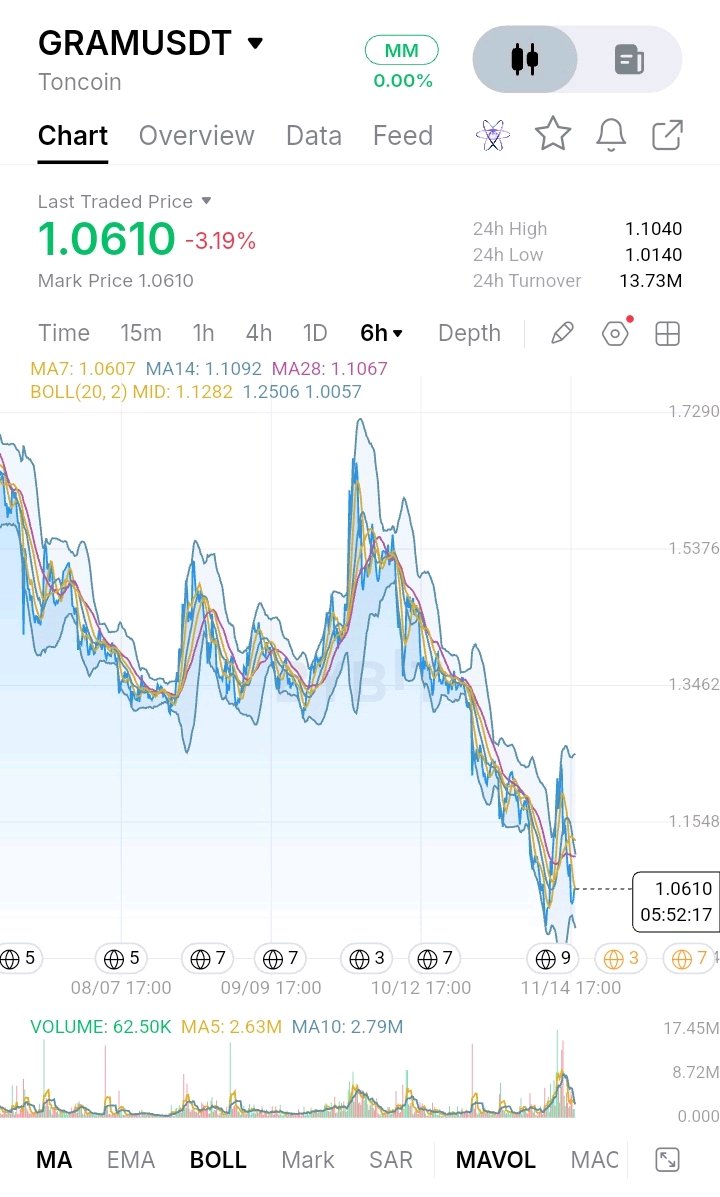
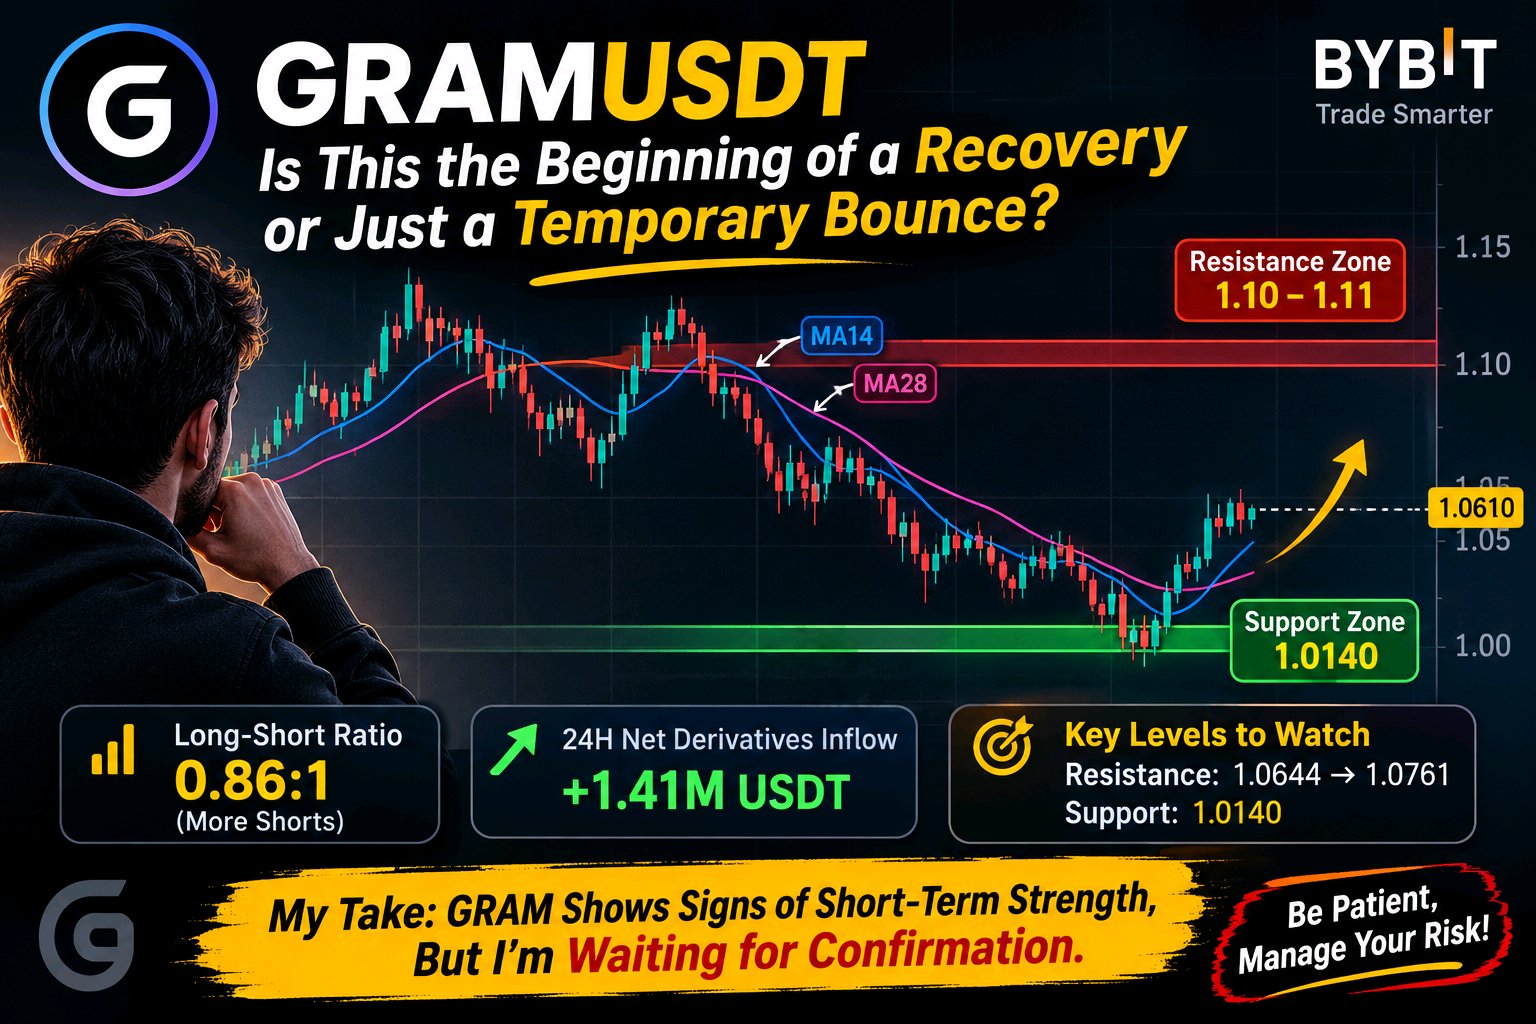
**$GRAMUSDT : Is This the Beginning of a Recovery or Just a Temporary Bounce?** I've been watching GRAM closely, and one thing that stands out to me is how price is trying to recover after a prolonged period of selling pressure. At the moment, GRAM is trading around 1.0610, showing some buying interest near the recent lows. However, I'm not ready to call this a trend reversal just yet. Looking at the 6H chart, the overall structure is still bearish. Price has been making lower highs and lower lows, which tells me sellers have maintained control for quite some time. Another important observation is that GRAM is still trading below MA14 (1.1092) and MA28 (1.1067). This makes the 1.10–1.11 area an important resistance zone to watch. If buyers manage to push price back above this region and hold it, the broader structure could start looking healthier. On the other hand, the recent low around 1.0140 deserves attention. Buyers have stepped in around this area, helping price recover toward 1.06. That's encouraging, but I would like to see whether this buying pressure can actually sustain itself rather than turning into another short-lived bounce. The 15M chart is showing some improvement. Price is trading near the short-term moving averages, with MA28 around 1.0527 and the Bollinger middle band near 1.0554. The immediate resistance is around 1.0644, followed by 1.0761. A convincing move above these levels could give the recovery more credibility. The derivatives data is also interesting. The long-short ratio stands at 0.86, while 24H net derivatives inflow is approximately 1.41M USDT. This suggests some positive capital movement, although it doesn't guarantee that the market is ready to reverse. Personally, I'm staying patient here. I don't have a confirmed active position based on this setup. For me, the priority is seeing GRAM hold its recent support and reclaim resistance with convincing price action. If that fails, another move toward the recent lows remains possible. **My takeaway:** GRAM is showing signs of short-term strength, but the bigger trend is still under pressure. I'd rather wait for confirmation than rush into a trade. Protecting capital matters more than catching every bounce. *This is my personal market analysis, not financial advice. Always manage your risk.* #IMPACTbyTrade
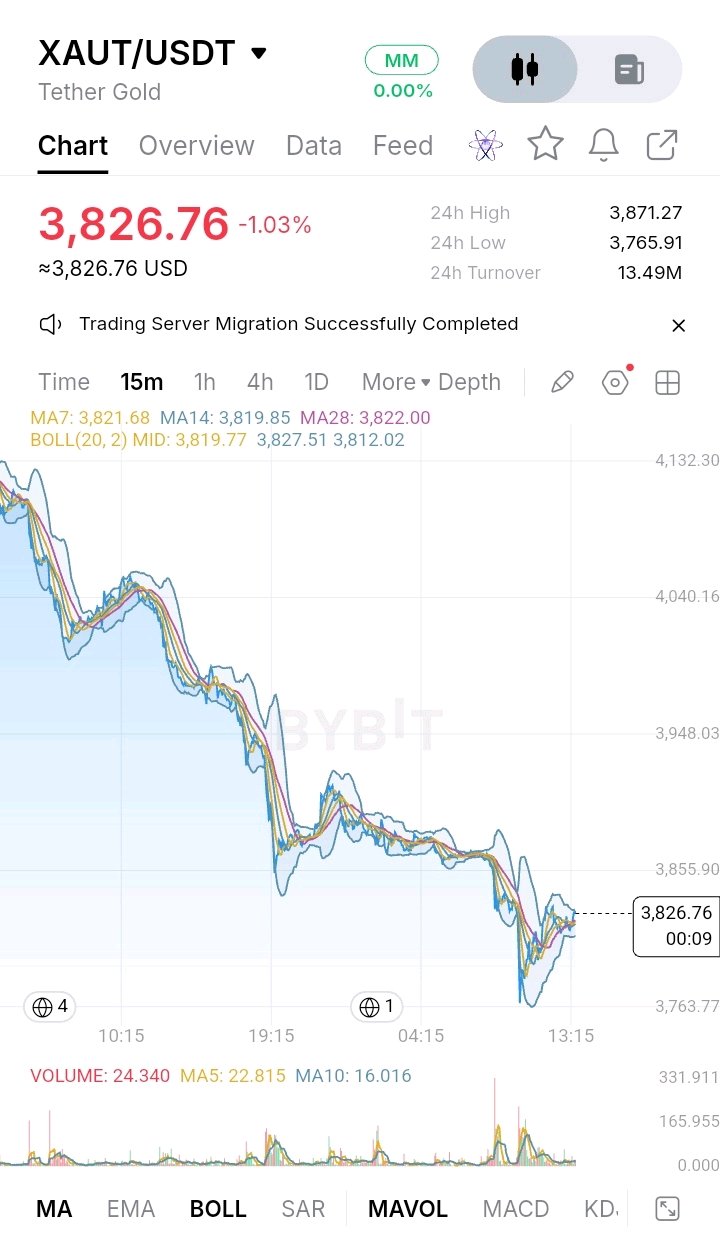
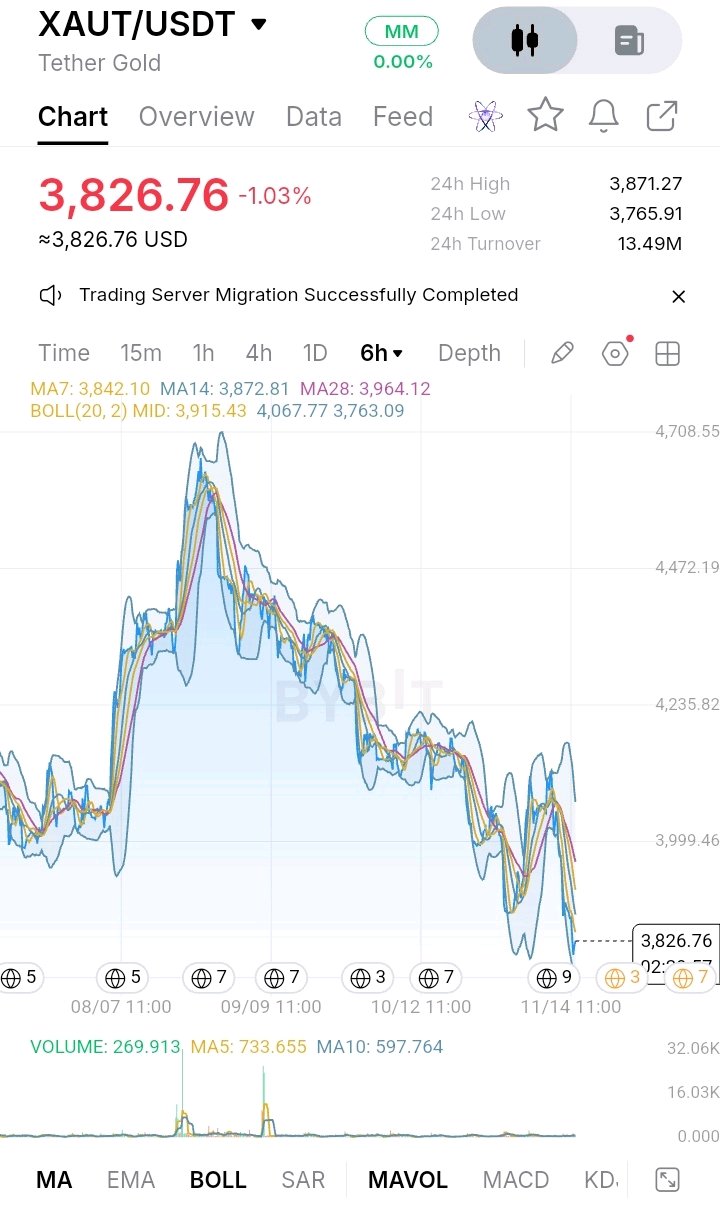
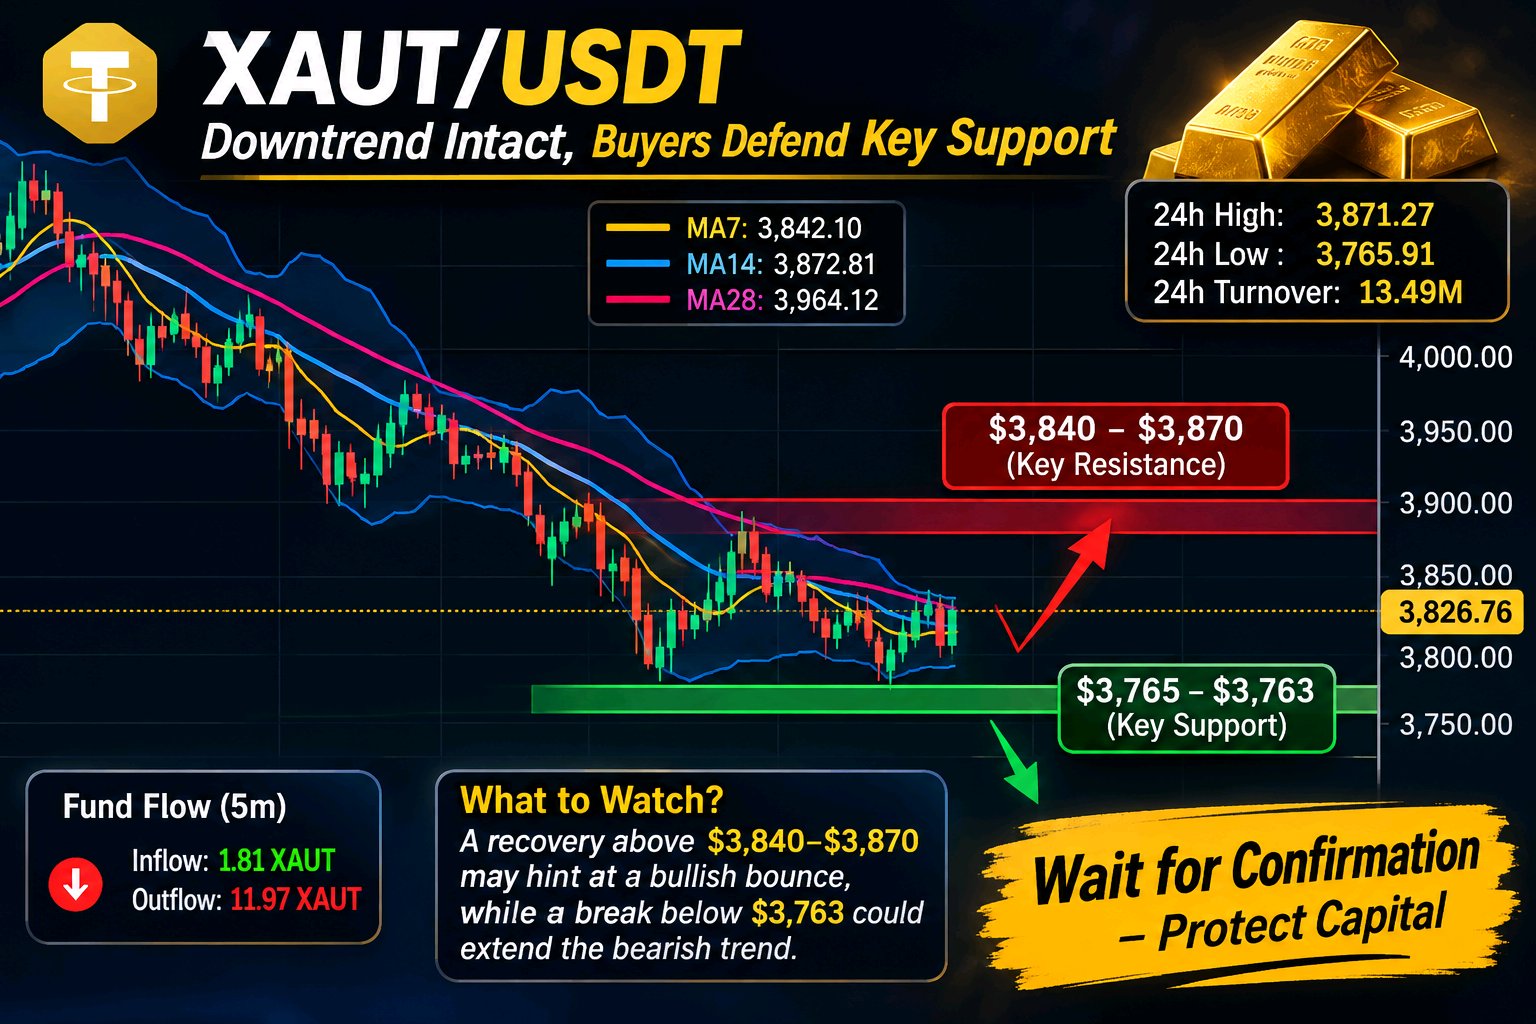
$XAUTUSDT Tren Turun Tetap Dominan, namun Pembeli Berusaha Mempertahankan Zona Support Bawah. Melihat XAUT/USDT, saya masih melihat pasar berjuang untuk membangun pemulihan yang berarti setelah penurunan yang berkepanjangan. Harga saat ini berada di sekitar $3.826,76, dan meskipun grafik 15 menit menunjukkan pemulihan tipis dari level terendah baru-baru ini, saya belum yakin bahwa ini adalah awal dari pembalikan tren yang sebenarnya. Yang paling mengkhawatirkan saya adalah struktur 6 jam yang lebih luas. Harga secara konsisten membentuk lower high dan lower low, sementara rata-rata pergerakan (moving average) tetap berada di atas harga pasar saat ini. MA7 berada di sekitar $3.842, MA14 di dekat $3.872, dan MA28 di sekitar $3.964. Penyelarasan ini mencerminkan tekanan jual yang berkelanjutan, bukannya pemulihan bullish yang terkonfirmasi. Area penting yang saya perhatikan adalah zona $3.765–$3.763. Wilayah ini sangat signifikan karena mencakup level terendah 24 jam baru-baru ini di $3.765,91 dan lower Bollinger Band 6 jam di dekat $3.763,09. Pembeli telah mencoba mempertahankan area ini, menghasilkan pemulihan jangka pendek. Namun, mempertahankan support untuk sementara tidak serta merta berarti penjual telah kehilangan kendali. Untuk sisi atas, wilayah $3.840–$3.870 layak mendapat perhatian. MA7 jangka pendek dan level tertinggi 24 jam berada di sekitar area ini. Jika harga berhasil pulih di atas level tersebut dan bertahan, kita bisa melihat momentum yang membaik. Namun, support sebelumnya di sekitar wilayah $3.855 sekarang mungkin bertindak sebagai resistance setelah breakdown, membuat pemulihan apa pun menjadi lebih menantang. Data arus dana (fund-flow) juga patut dipertimbangkan. Selama periode lima menit yang ditampilkan, arus keluar mencapai 11,97 XAUT terhadap arus masuk yang hanya 1,81 XAUT. Ketidakseimbangan ini menunjukkan bahwa tekanan jual tetap signifikan, meskipun pembacaan jangka pendek tunggal tidak dapat menentukan arah pergerakan besar berikutnya. Untuk saat ini, saya menganggap pengaturan bullish apa pun sebagai teoretis, bukan posisi aktif. Saya lebih suka melihat pemulihan yang berkelanjutan di atas resistance terdekat sebelum mempertimbangkan peluang long. Sebaliknya, breakdown yang terkonfirmasi di bawah $3.763 dapat memperkuat skenario kelanjutan bearish. Kesimpulan saya sederhana: XAUT menunjukkan tanda-tanda stabilisasi jangka pendek, tetapi tren yang lebih luas tetap bearish. Saya lebih memilih menunggu konfirmasi daripada mengantisipasi pembalikan terlalu dini. Melindungi modal dan menghormati struktur pasar lebih penting bagi saya daripada menangkap setiap pantulan sementara. #IMPACTbyTrade
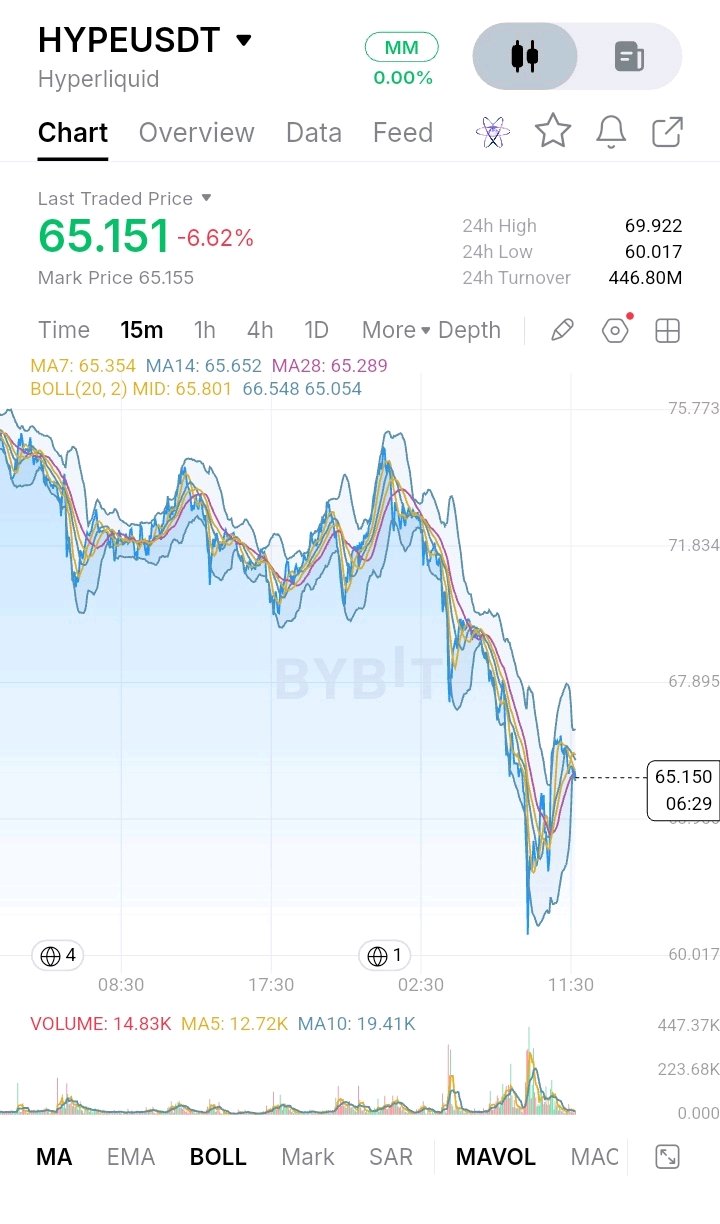
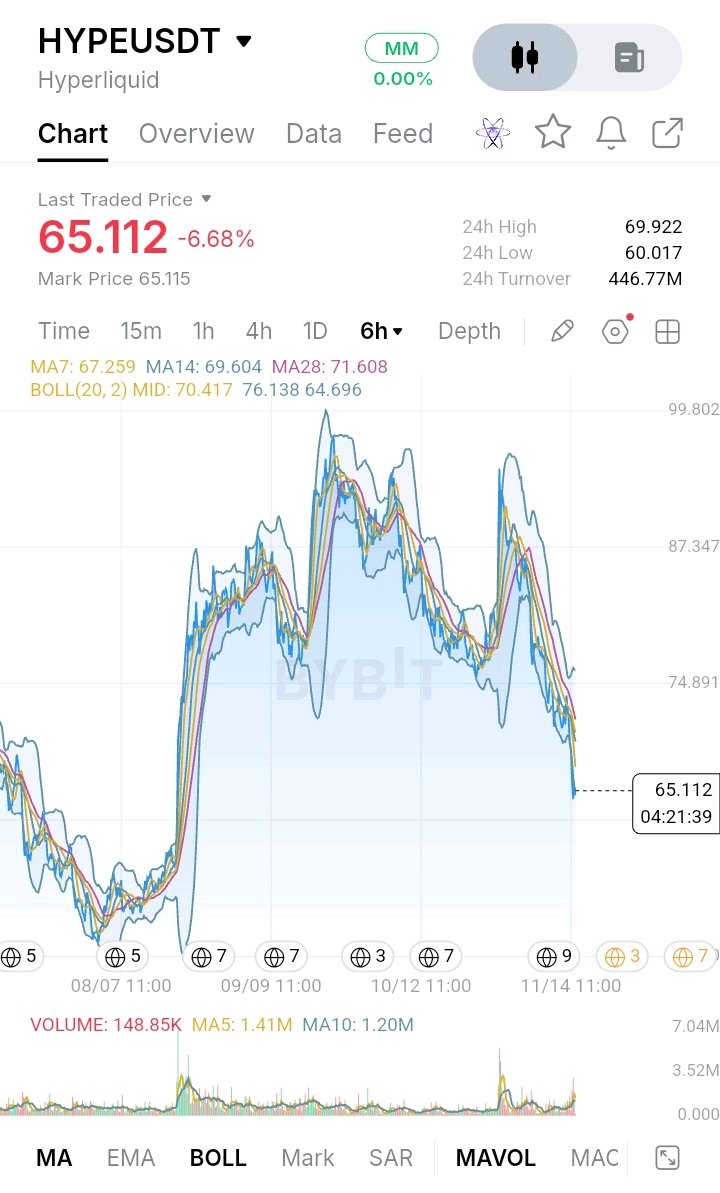
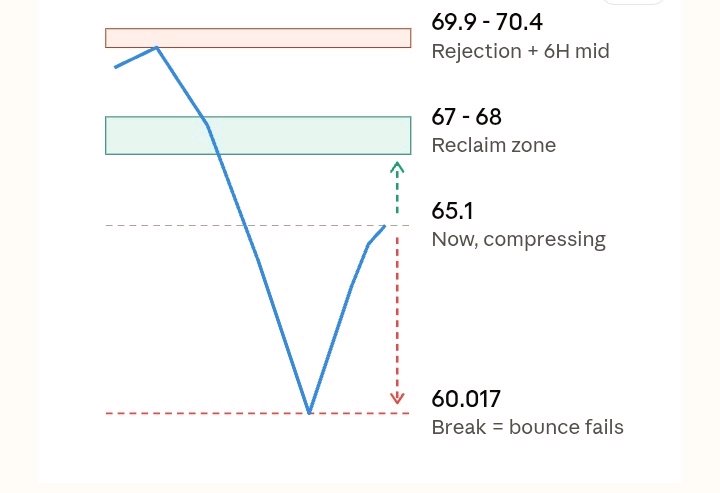
$HYPEUSDT mengalami pukulan telak hari ini, dan saya menyikapi pergerakan ini dengan hati-hati alih-alih terburu-buru menyebutnya sebagai titik terendah. Harga berada di sekitar 65,1, turun sekitar 6,6% hari ini setelah ditolak di dekat 69,9. Terendah 24 jam di 60,017 disertai dengan wick yang tajam, dan pantulan dari sana adalah tanda nyata pertama bahwa pembeli masih bersedia mempertahankan zona ini. Pada grafik 6 jam, struktur yang lebih luas masih konstruktif. HYPE reli dari basis awal Agustus ke hampir 99,8, yang menyisakan rentang lebar untuk dicerna. Namun, lower high di kisaran 90-an dan penurunan yang stabil sejak saat itu memberi tahu saya bahwa momentum telah mendingin. Harga sekarang berada di bawah MA7, MA14, dan MA28 (67,2, 69,6, 71,6), dan garis tengah Bollinger di dekat 70,4 telah berubah menjadi resistance overhead. Dengan rata-rata tersebut menumpuk di atas harga, saya memperkirakan reli ke area 67–70 akan bertemu dengan penawaran (supply) sebelum bisa breakout dengan bersih. Grafik 15 menit menunjukkan penurunan tersebut sebagai satu kaki panjang yang agresif dari area 75 ke 60,0, dengan volume yang melonjak di bagian bawah. Itu terlihat lebih seperti flush daripada penurunan lambat (slow bleed). Sejak itu, harga telah pulih ke sekitar 65 dan terjepit di sekitar rata-rata jangka pendek (65,3–65,6) di dalam Bollinger Bands yang menyempit. Pasar belum memutuskan, dan belum ada yang terkonfirmasi. Posisi menambah sedikit nuansa. Rasio long-short sebesar 1,73:1 menunjukkan trader masih cenderung long meskipun ada penurunan. Itu bisa memicu squeeze yang lebih tinggi, tetapi juga berarti pantulan yang gagal dapat memicu lebih banyak likuidasi posisi long. Arus derivatif bersih negatif sekitar 33,5 juta USDT, dengan arus keluar melebihi arus masuk, jadi modal lebih banyak yang keluar daripada yang masuk untuk membeli saat harga turun (buy the dip). Saya tidak memiliki posisi aktif di sini, dan saya tidak akan mengada-ada setup yang tidak didukung dengan jelas oleh grafik. Secara teoritis, skenario bullish membutuhkan reclaim di 67–68 dan bertahan di atasnya, dengan level tertinggi 69,9 sebagai ujian berikutnya. Skenario bearish adalah penembusan bersih kembali di bawah 60,0, yang akan membatalkan pantulan ini dan mengekspos level yang lebih rendah. Apa pun itu, stop loss harus ditempatkan di luar titik-titik ekstrem tersebut, dan ukuran posisi harus cukup kecil untuk bertahan dari wick yang fluktuatif. Untuk saat ini, saya memperhatikan bagaimana harga berperilaku di sekitar 67 dan apakah volume memudar atau justru meningkat pada dorongan berikutnya. Jika pembeli tidak dapat segera merebut kembali zona itu, saya lebih memilih untuk tetap bersabar daripada mencoba menangkap pisau yang jatuh (catching a falling knife). Ini adalah pandangan pribadi saya, bukan nasihat keuangan, jadi kelola risiko Anda sendiri. #IMPACTbyTrade
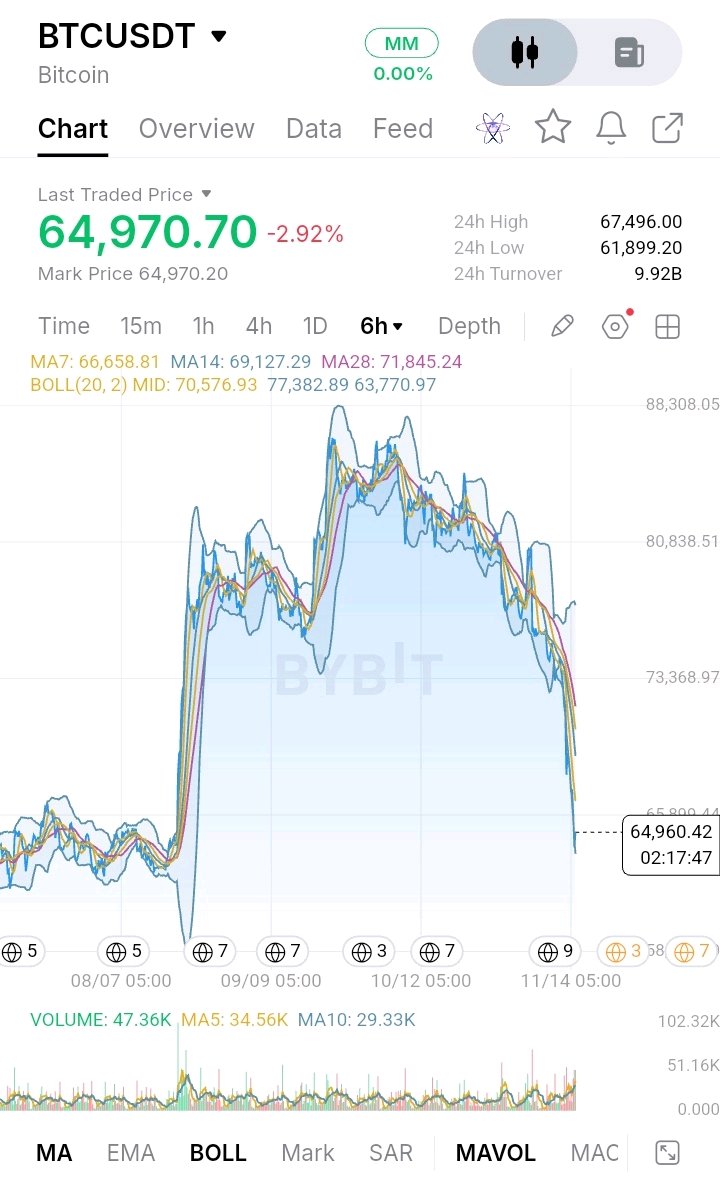
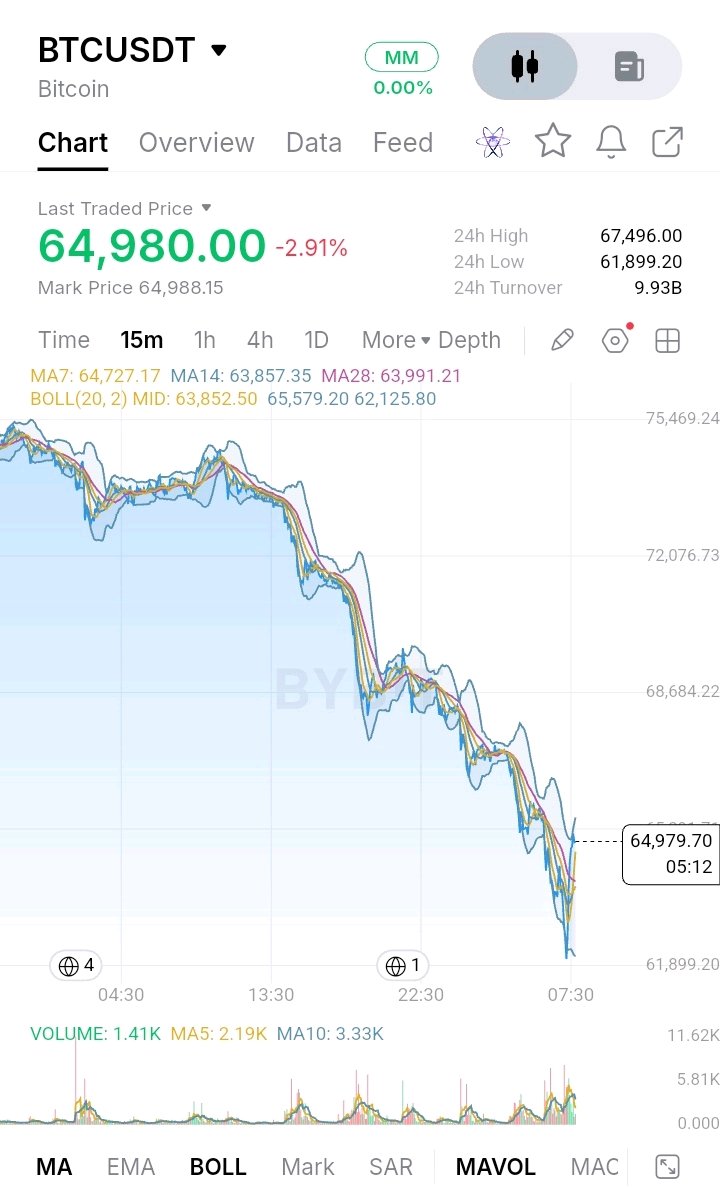
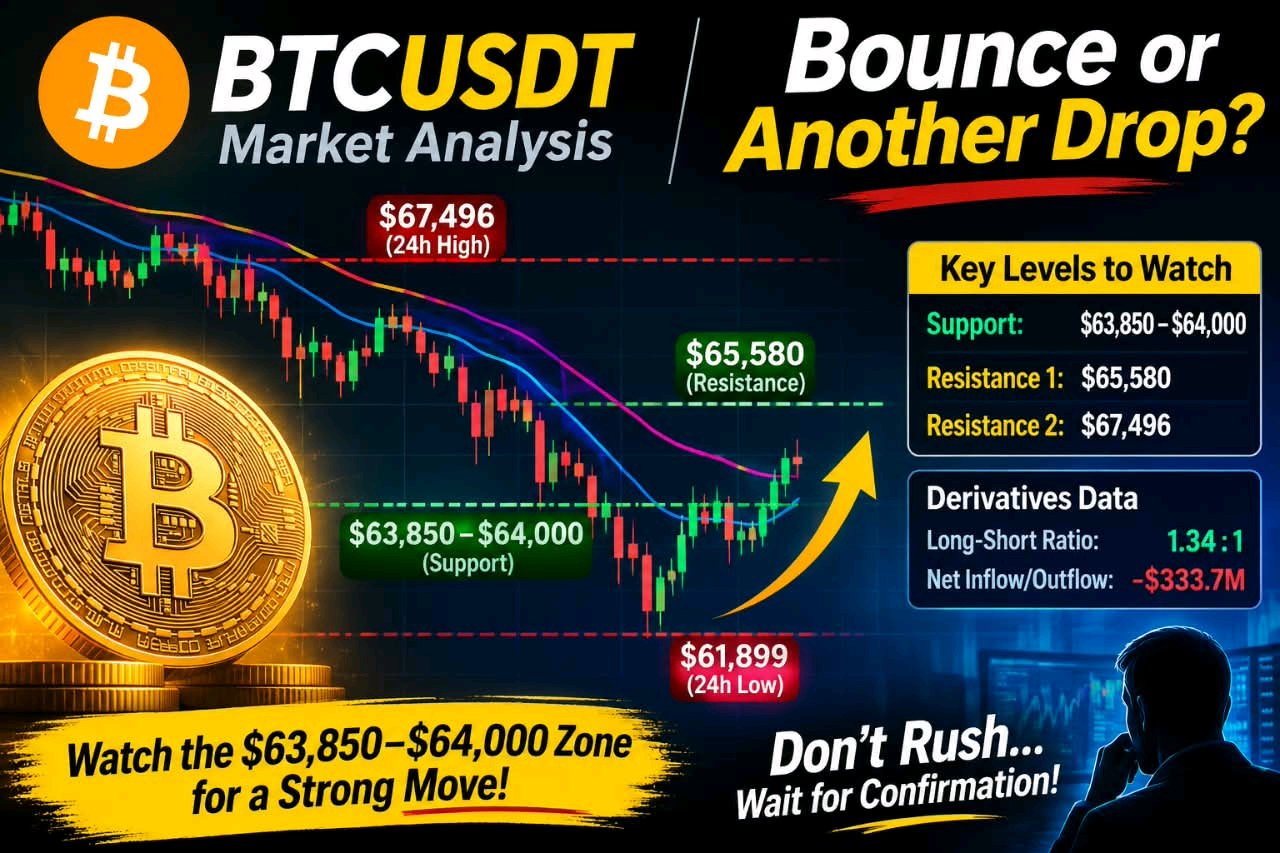
📉 Bitcoin sedang berusaha untuk bangkit, namun apakah ini awal dari pemulihan atau sekadar jeda dalam aksi jual? Melihat grafik $BTCUSDT, saya melihat pasar yang telah terpukul cukup keras tetapi kini mulai menunjukkan tanda-tanda minat beli jangka pendek. Bitcoin diperdagangkan di sekitar $64.970, turun sekitar 2,92% dalam 24 jam terakhir. Harga sempat turun ke $61.899 sebelum memantul kembali ke arah $65.000. Pemulihan itu patut diperhatikan, tetapi saya belum siap menyebutnya sebagai pembalikan tren. Pada grafik 6 jam, struktur keseluruhannya tetap bearish. BTC telah jatuh tajam dari kisaran $70.000–$73.000, menembus beberapa area harga penting yang sebelumnya menjadi support pasar. Moving average menunjukkan cerita yang sama: MA7 berada di sekitar $66.659, MA14 di dekat $69.127, dan MA28 di sekitar $71.845. Bitcoin diperdagangkan di bawah ketiganya, sementara garis tengah Bollinger berada di dekat $70.577. Bagi saya, ini berarti pemulihan yang lebih luas masih membutuhkan usaha sebelum struktur pasar mulai terlihat lebih sehat. 🔎 Berikut adalah level jangka pendek yang saya perhatikan: Support: $63.850–$64.000 Ini adalah area pertama yang saya ingin pembeli pertahankan. Area ini sejajar dengan moving average jangka pendek pada grafik 15 menit. Jika BTC menguji ulang zona ini dan bertahan, pembeli mungkin mendapatkan kesempatan lain untuk mendorong harga lebih tinggi. Namun, penutupan 15 menit yang tegas di bawah $63.850 akan melemahkan pengaturan pemulihan dan membawa level terendah $61.899 kembali menjadi fokus. Resistensi pertama: $65.580 Level ini menandai Bollinger Band atas pada grafik 15 menit. Pergerakan berkelanjutan di atasnya, diikuti dengan pengujian ulang yang berhasil, akan menunjukkan bahwa momentum jangka pendek sedang membaik. Jika BTC ditolak di sini dan jatuh kembali di bawah $64.000, saya akan lebih berhati-hati terhadap kekuatan pantulan ini. Resistensi berikutnya: $67.496 Ini adalah harga tertinggi 24 jam yang dilaporkan. Mendapatkan kembali level ini akan memberikan bukti pemulihan yang lebih kuat, meskipun Bitcoin masih perlu mengatasi level resistensi yang lebih tinggi untuk menantang tren penurunan yang lebih luas. 📊 Data derivatif juga patut diperhatikan. Rasio long-short sekitar 1,34:1 yang condong ke posisi long. Sementara itu, arus masuk derivatif berada di dekat $4,82 miliar terhadap arus keluar sekitar $5,15 miliar, menyisakan arus keluar bersih sekitar $333,7 juta. Angka-angka ini tidak memastikan pergerakan selanjutnya, tetapi mereka menyoroti mengapa saya tidak akan mengandalkan pantulan ini saja. Pendekatan saya: Saya lebih memilih memantau daripada terburu-buru mengambil posisi. Zona $63.850–$64.000 adalah ujian langsung bagi pembeli, sementara $65.580 adalah rintangan pertama yang perlu diatasi oleh bulls. Setiap entri potensial akan memerlukan konfirmasi, stop-loss yang jelas, dan rasio risk-to-reward yang masuk akal. Bitcoin mungkin menemukan support sementara, tetapi ujian sebenarnya adalah apakah pembeli dapat mempertahankan pemulihan tersebut. Sampai hal itu terjadi, saya tetap membuka kedua skenario dan membiarkan aksi harga memandu keputusan saya berikutnya. #IMPACTbyTrade
$SHIBUSDT has no independent blockchain, reserve, or central operator guaranteeing its price; it relies on market demand and the networks that host it. Its core choice was not to build a separate Layer 1: SHIB is an Ethereum token, while Shibarium adds a lower-cost Layer 2 route. That avoids running a competing base chain, but security inherits external infrastructure. Verifying Ethereum independently takes capable hardware, storage, bandwidth, and technical skill; most holders instead trust wallets, exchanges, RPC providers, and bridges. Unlike a high-throughput chain pursuing speed, SHIB leans on Ethereum’s established settlement. Which risk worries you more: dependence or fragmentation? #IMPACTbyTrade
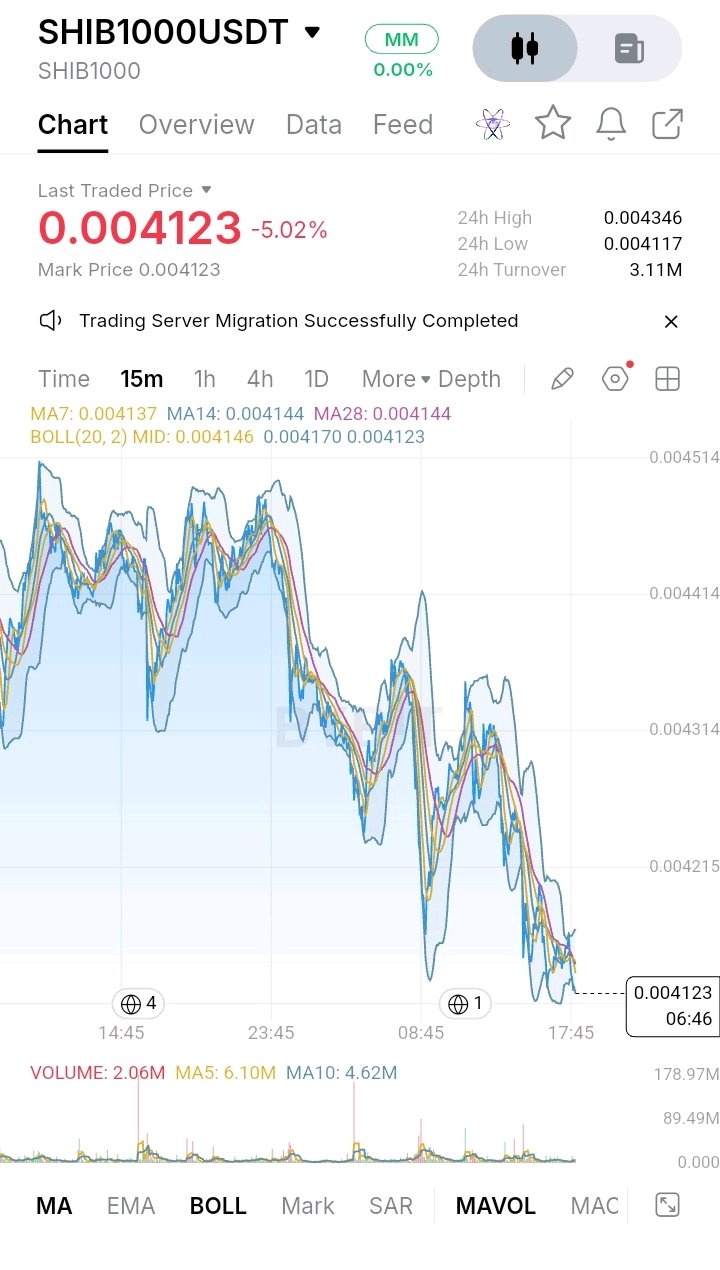
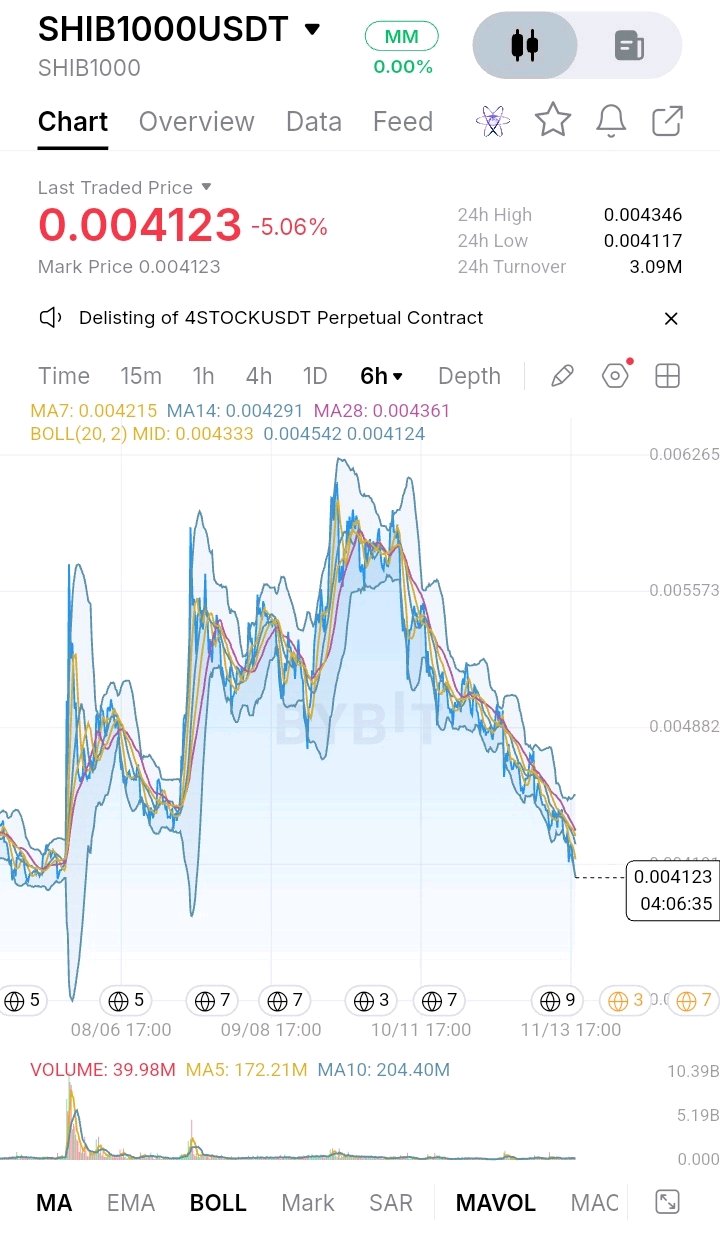

$BRUSDT tidak memiliki rantai (chain) sendiri, tidak memiliki konsensus, dan tidak memiliki kumpulan validator untuk diaudit. Protokol ini mengandalkan keamanan pinjaman: Ethereum dan jaringan lain di lapisan bawah, ditambah kontrak Bedrock, operator, dan mitra kustodian di lapisan atas. Pilihan desainnya adalah imbal hasil (yield) pada BTC dan ETH yang menganggur tanpa harus membangun lapisan dasar (base layer) baru. Risikonya adalah kepercayaan yang bertumpuk. Memverifikasi rantai tidak berarti memverifikasi protokol; Anda harus membaca kontrak, audit, dan perjanjian kustodian, dan sebagian besar pengguna hanya memercayai dasbor. Lapisan dasar bergaya Ethereum mendorong risiko ke dalam konsensus. Lapisan restaking mendorong risiko ke perantara. Mana yang lebih Anda takuti: kegagalan lapisan dasar, atau kegagalan di lapisan di atasnya? #IMPACTbyTrade
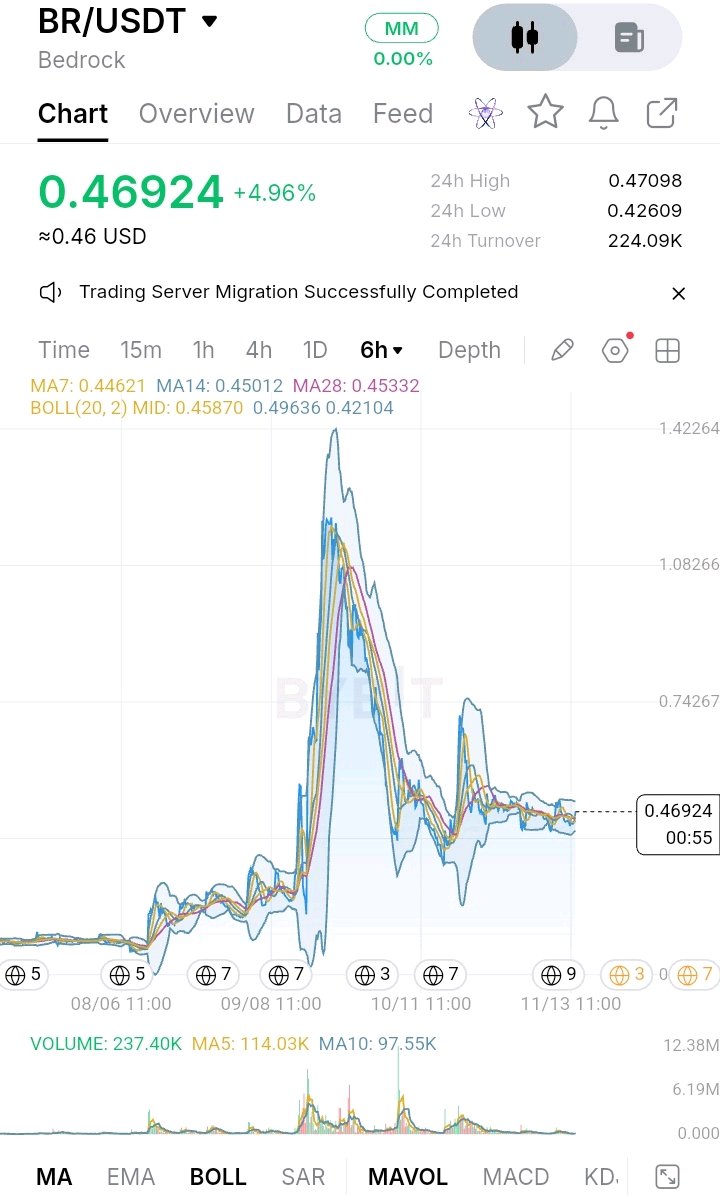
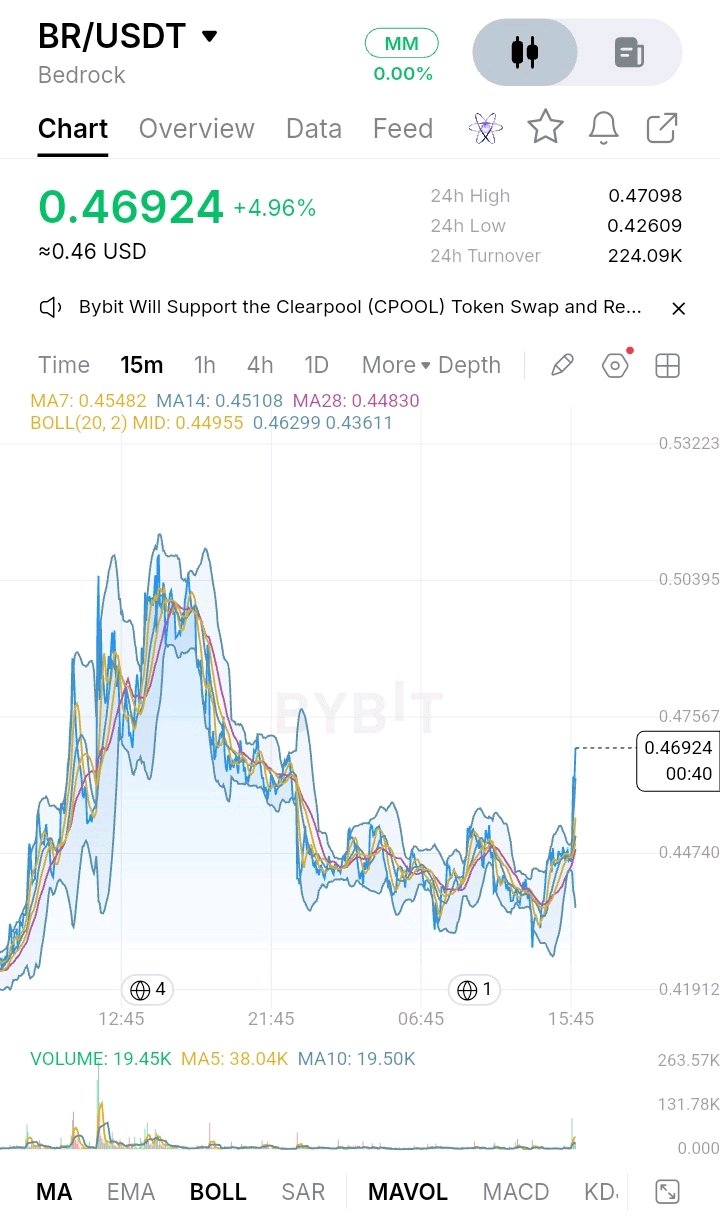

$INJUSDT has no issuer, no reserve, and no auditor vouching for its markets. It relies on a small, staked validator set reaching consensus on a Cosmos-based chain. Injective chose speed: sub-second finality and an on-chain order book. The cost is a limited validator set, professional-grade hardware, and few people able to verify the chain themselves. Most users read state through RPC providers, bridges, and front ends, so trust shifts to third parties. Ethereum takes the opposite path: slower finality in exchange for a far larger validator base and lighter node requirements. Which risk do you fear more: fast but concentrated, or decentralized but slow? #IMPACTbyTrade
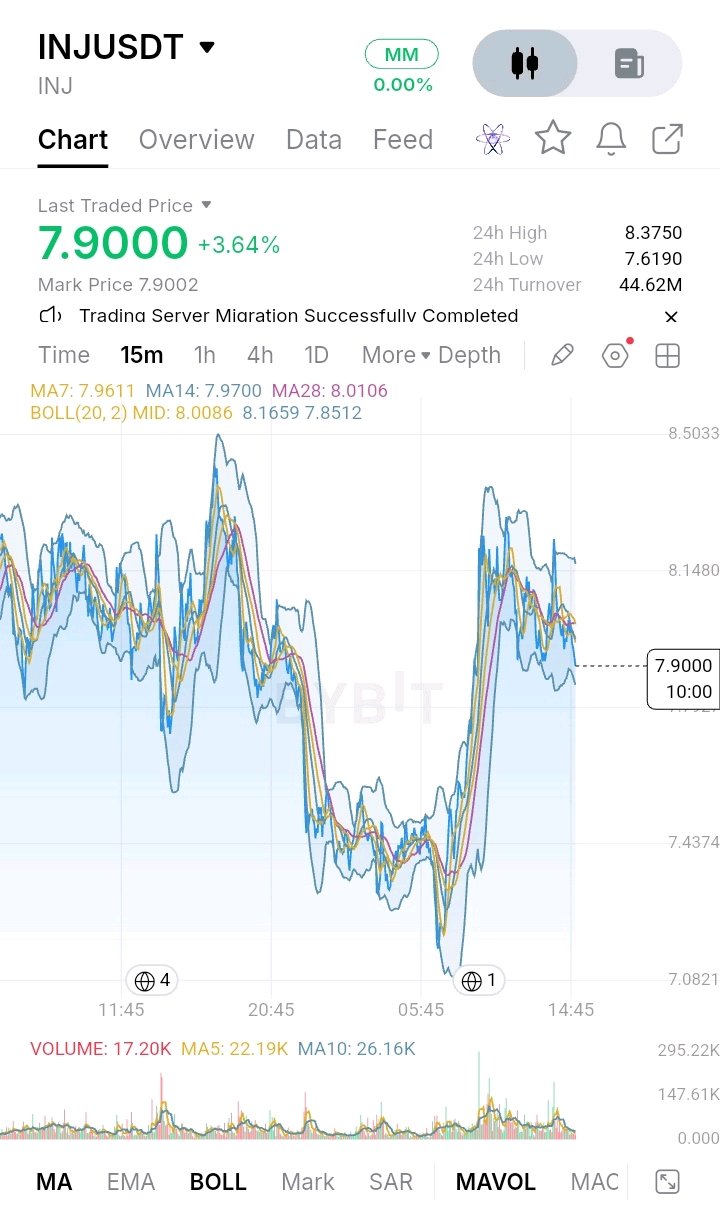
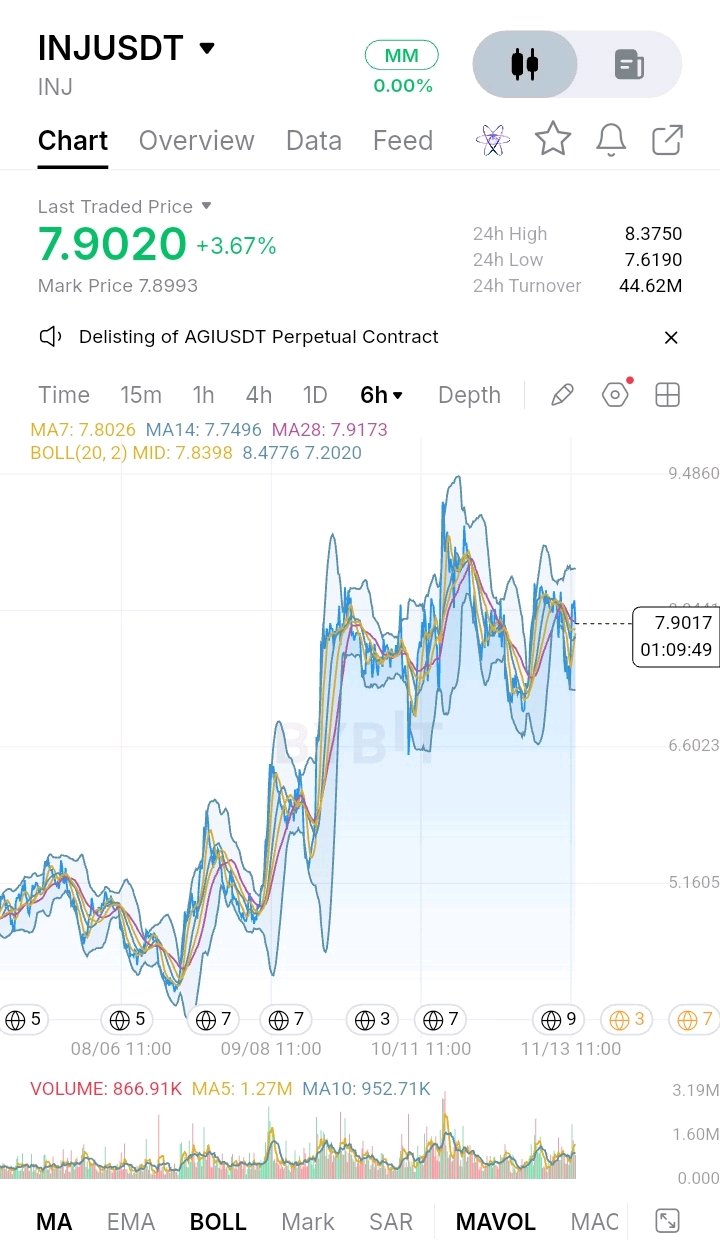

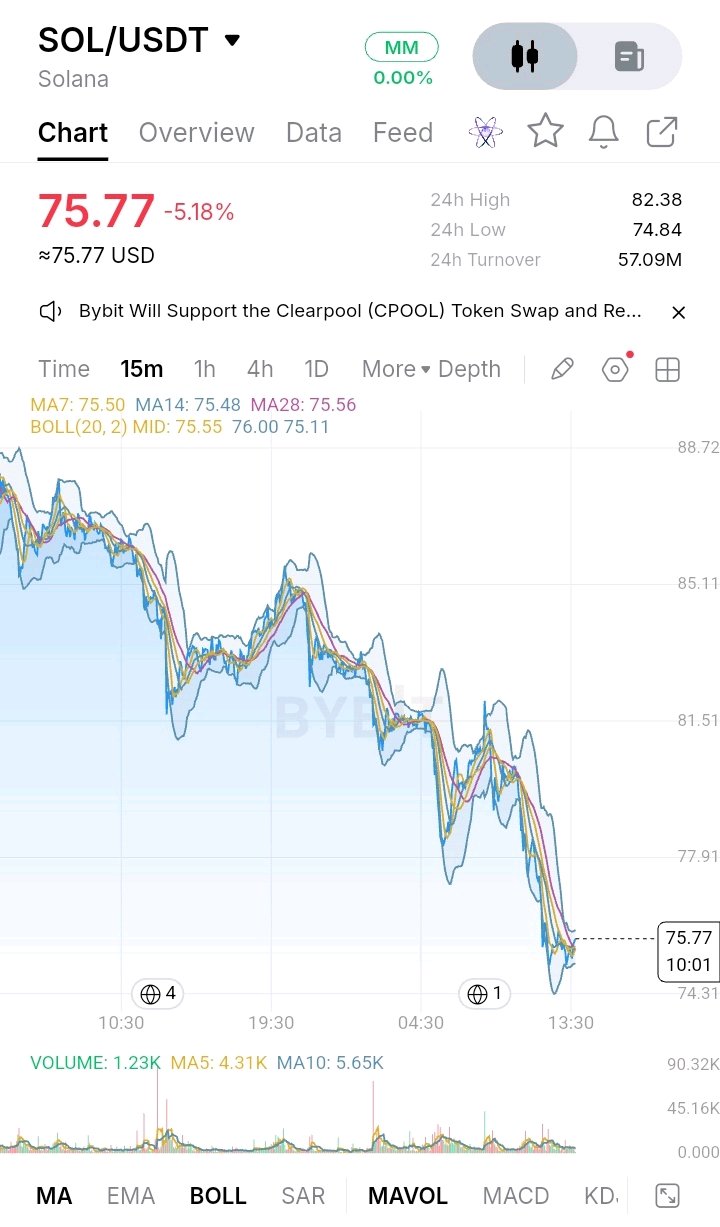
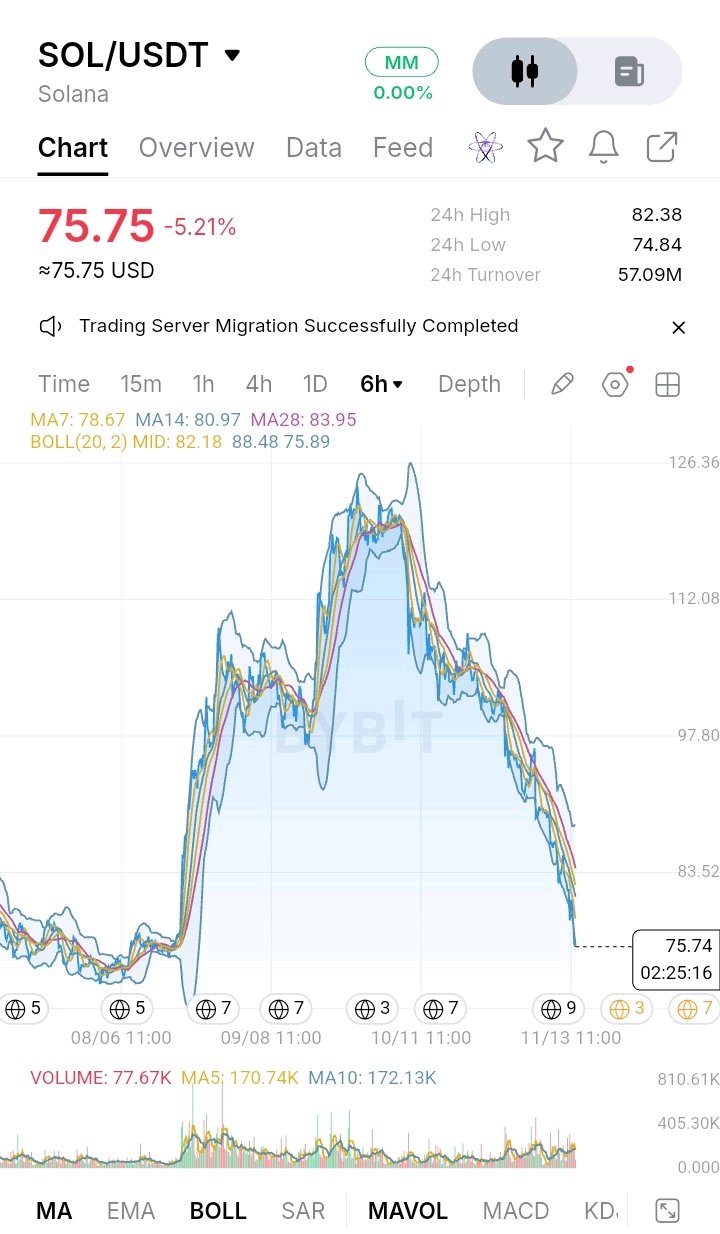
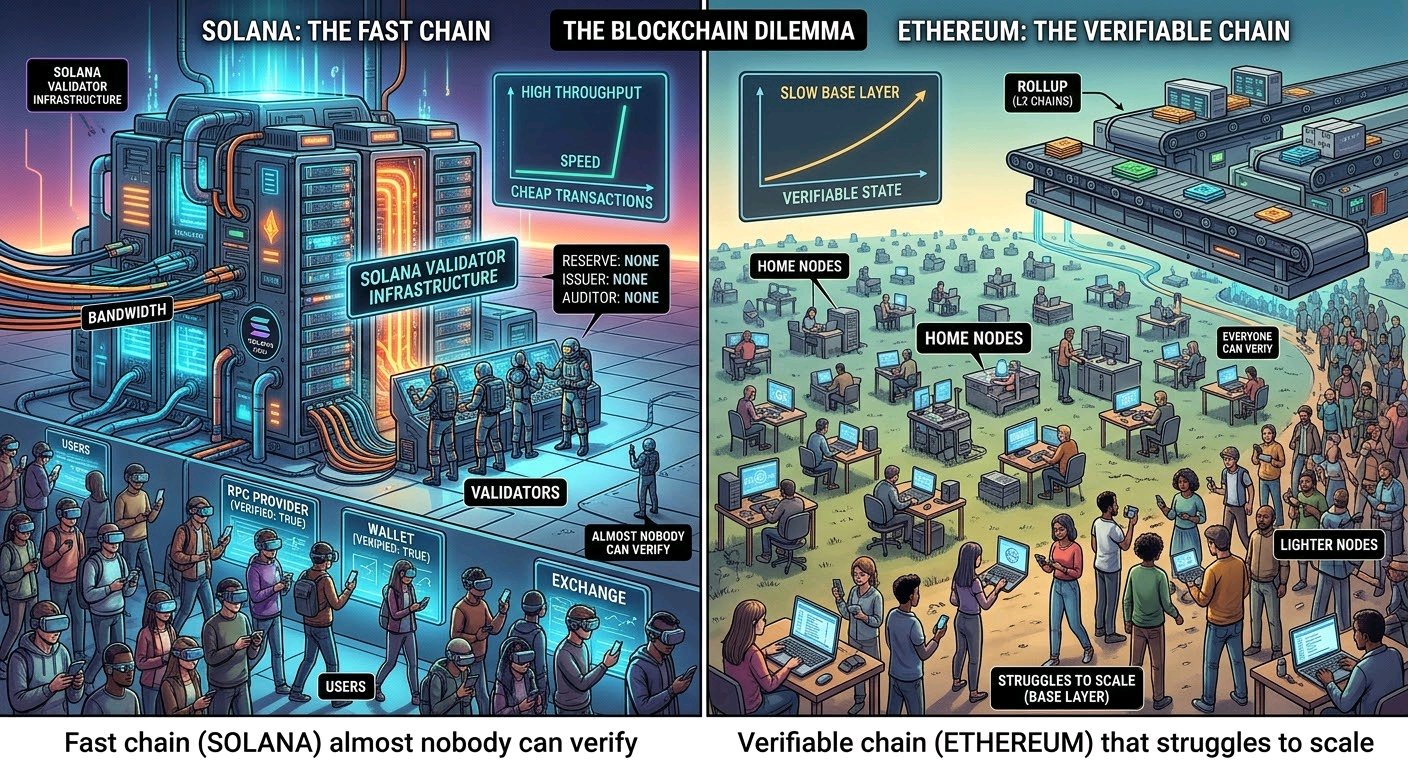
$SOLUSDT has no issuer, no reserve, and no auditor behind it. What it has is stake-weighted consensus and a bet that enough validators stay honest and online. Solana chose speed: cheap transactions, high throughput, one shared state. The price is hardware. Running a validator takes serious servers, lots of RAM, fast storage, and heavy bandwidth, so very few people can check the chain themselves. Most of us just take the word of RPC providers, wallets, and exchanges. Ethereum went the other way: a slower base layer, lighter nodes, and scaling pushed onto rollups. So which worries you more: a fast chain almost nobody can verify, or a verifiable chain that struggles to scale? #IMPACTbyTrade
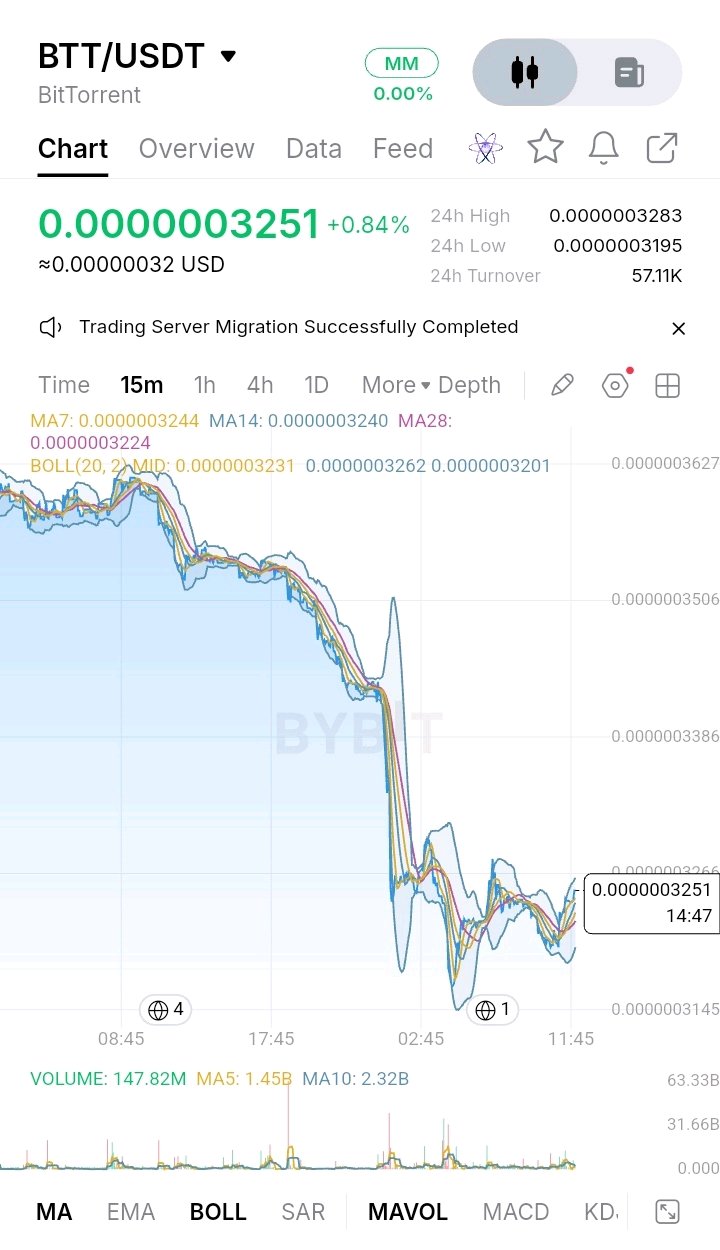
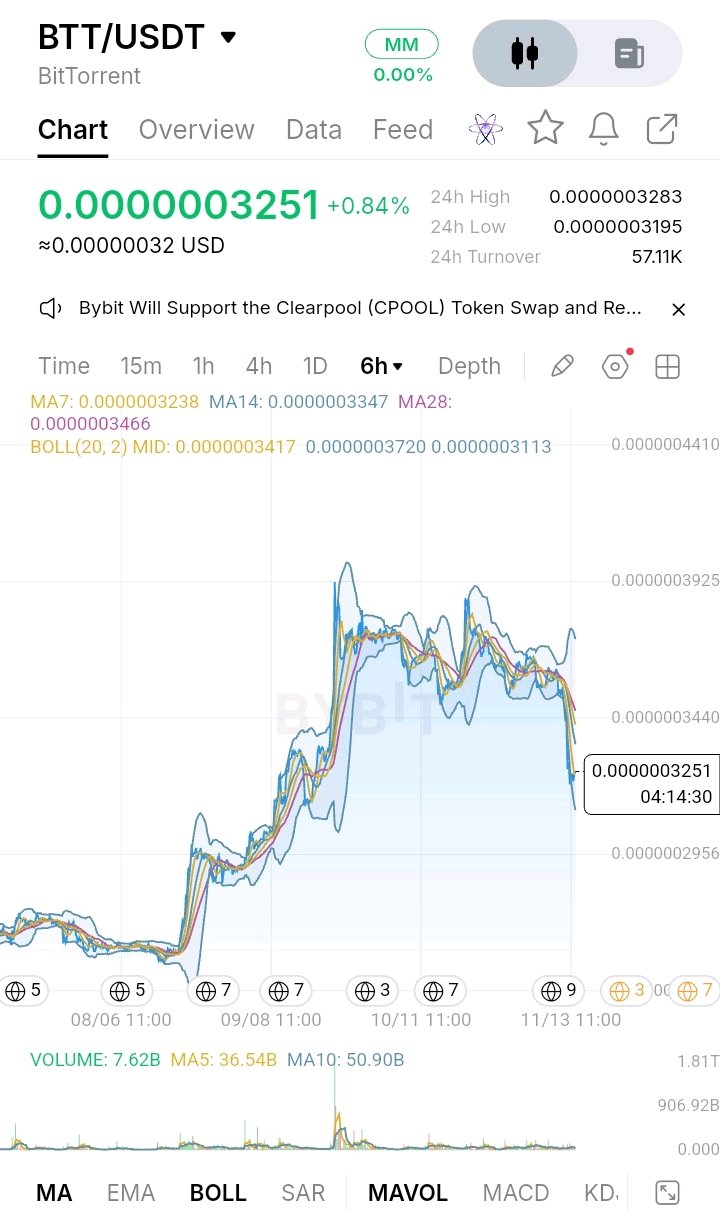
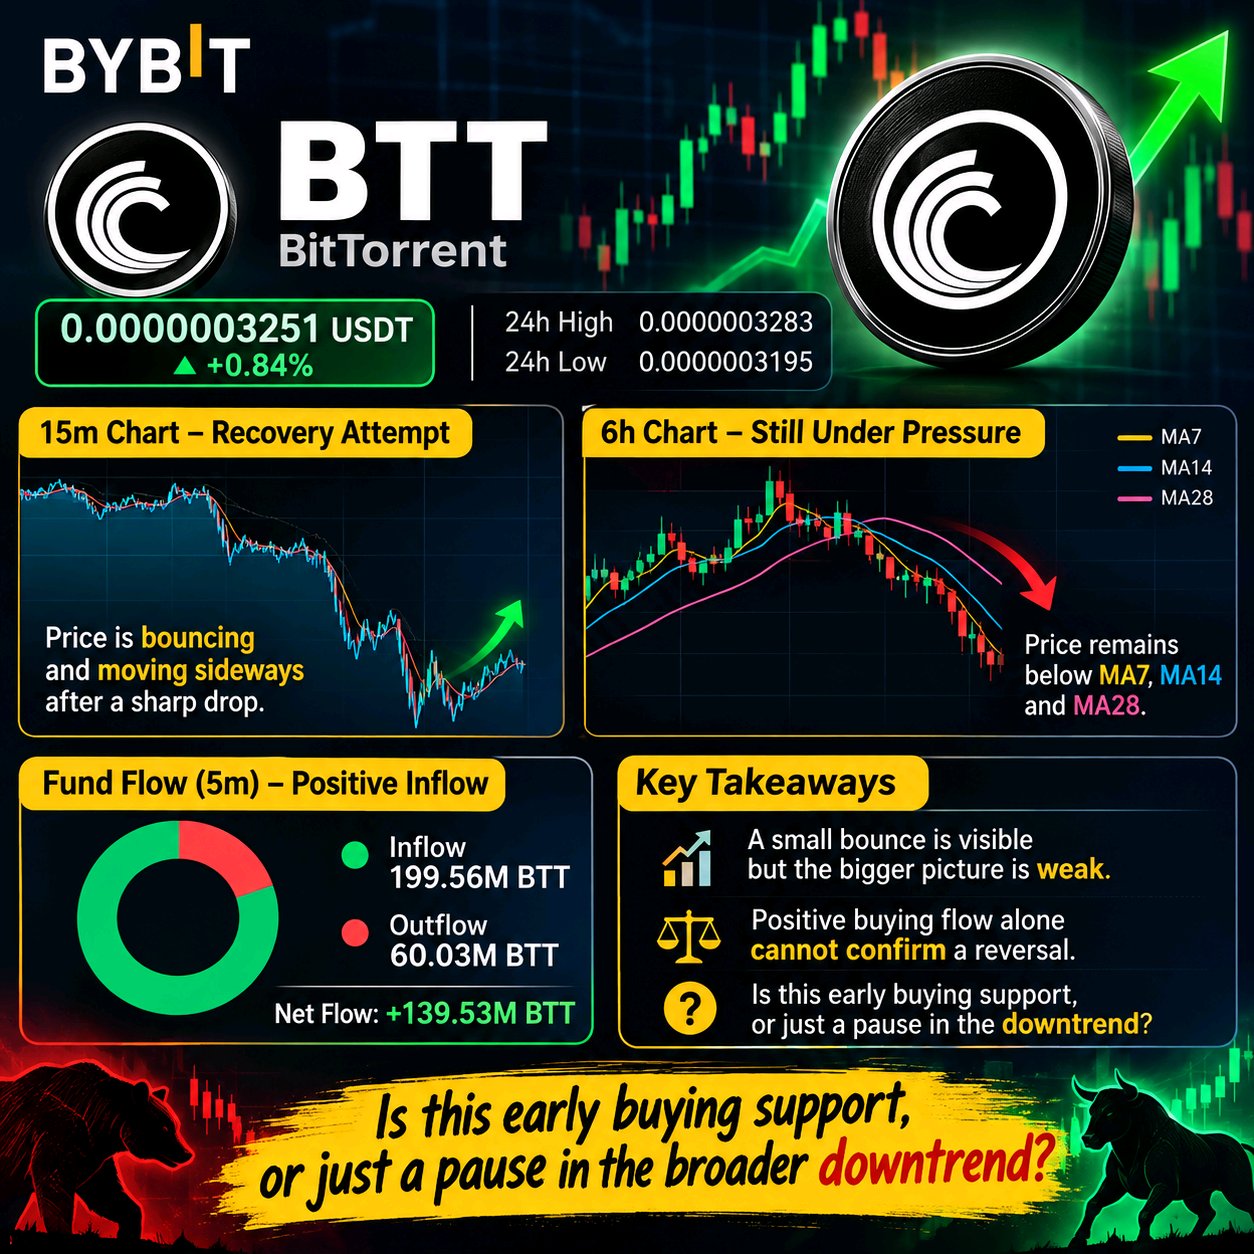
$BTTUSDT is showing a small bounce, but the bigger picture still looks weak. On Bybit, the price is around 0.0000003251 USDT, up 0.84%, with a 24-hour range of 0.0000003195 to 0.0000003283. The 15-minute chart shows price recovering and moving sideways after a sharp drop. However, the 6-hour chart remains under pressure, with price below its MA7, MA14 and MA28 levels. Bybit’s five-minute fund-flow data shows 199.56 million BTT flowing in against 60.03 million flowing out, a positive net flow. A positive flow alone cannot confirm a reversal. Is this early buying support, or just a pause in the broader downtrend? #IMPACTbyTrade
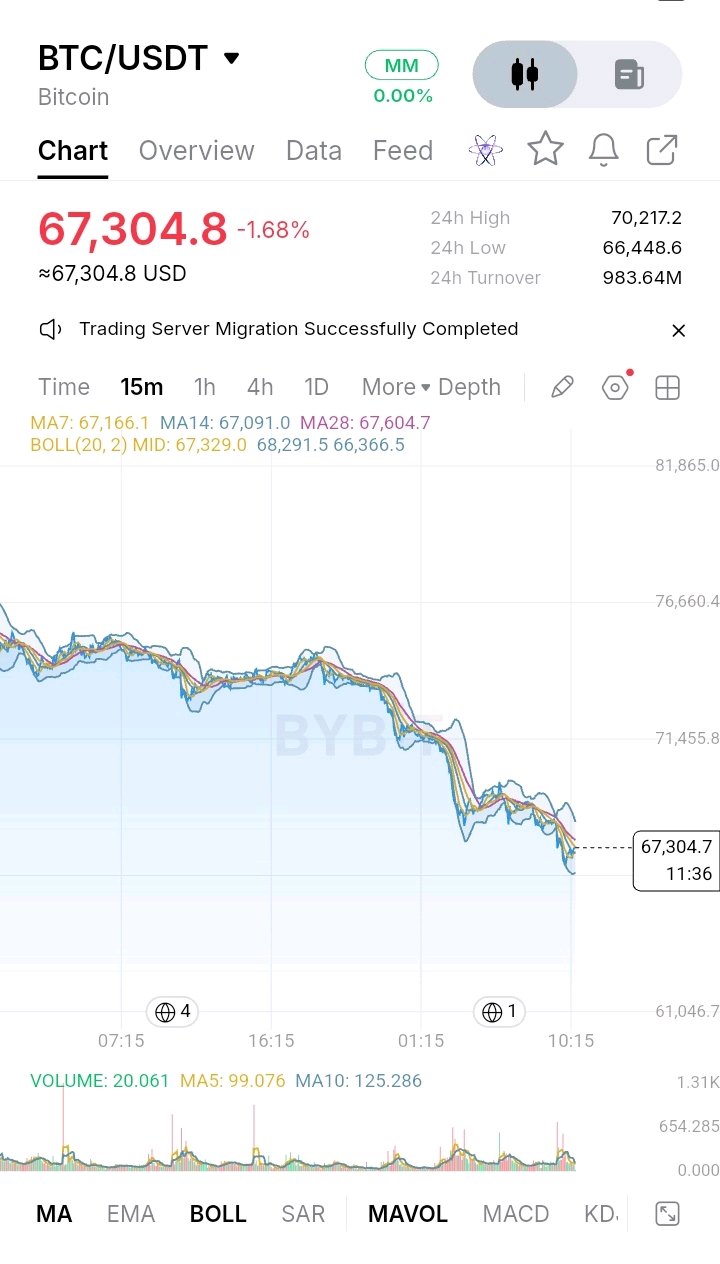
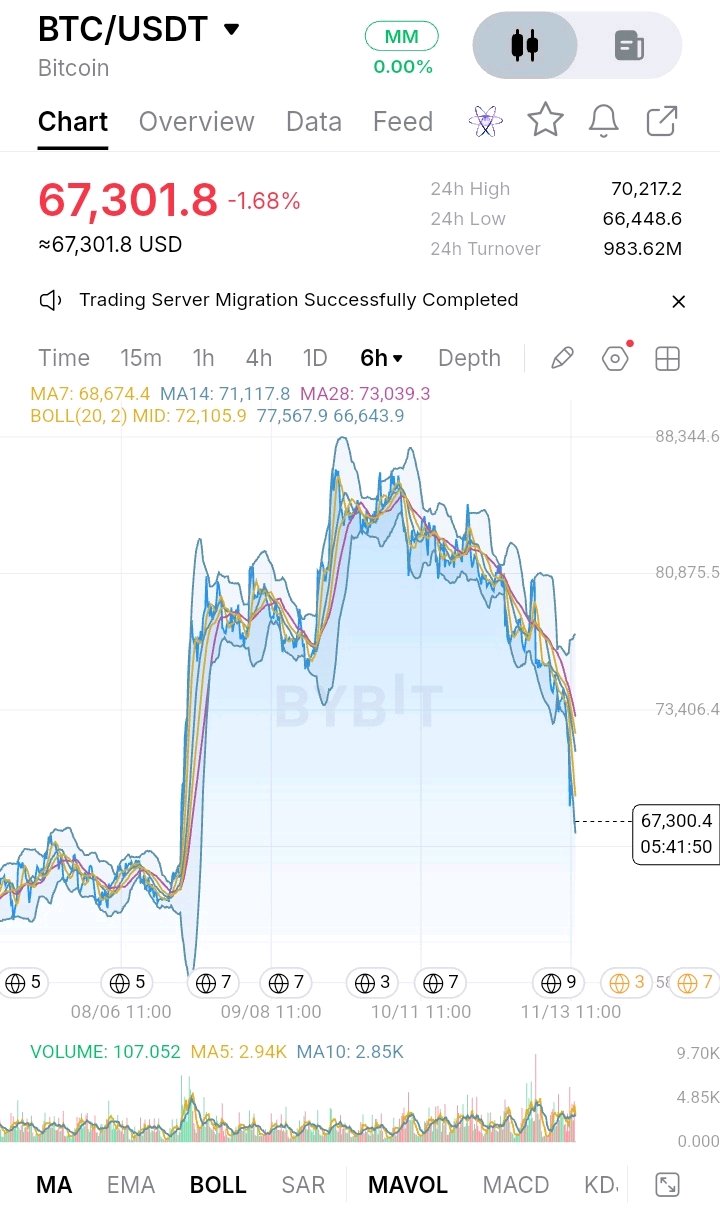
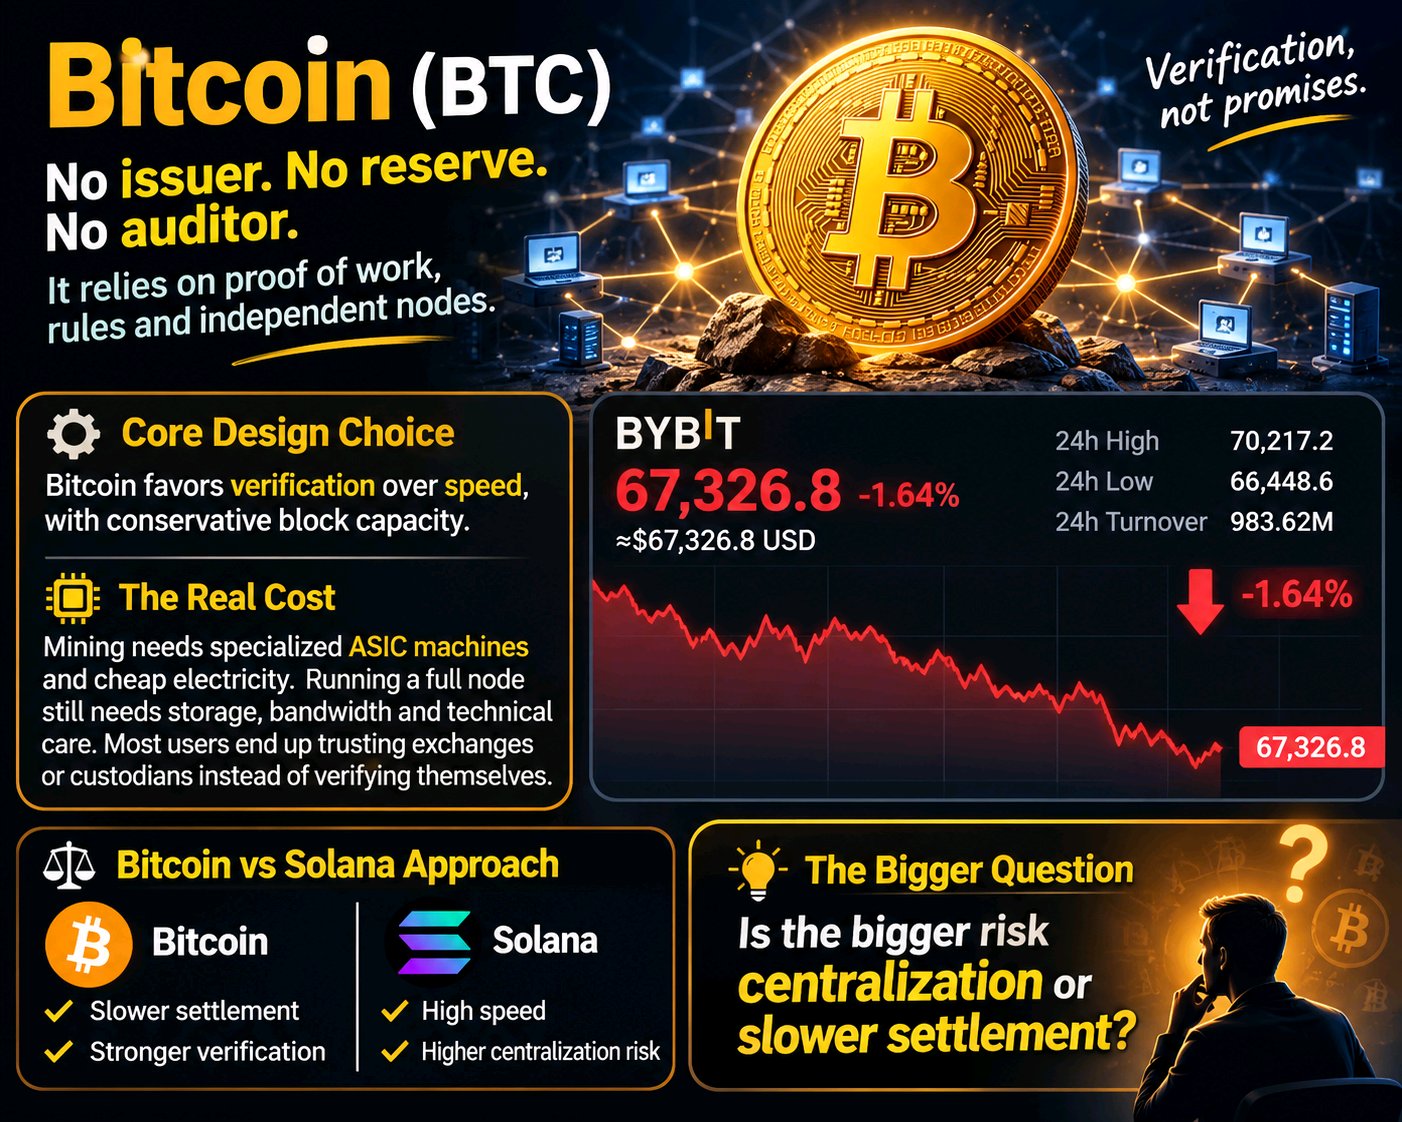
$BTCUSDT Bitcoin tidak memiliki perusahaan, cadangan, atau auditor pusat di belakangnya. Bitcoin mengandalkan proof of work, aturan, dan node independen untuk menjaga kejujuran buku besar. Bitcoin lebih mengutamakan verifikasi daripada kecepatan, tidak seperti rantai yang mengutamakan kecepatan. Penambangan membutuhkan mesin ASIC khusus dan listrik murah; pengguna masih bisa melakukan validasi dengan full node, meskipun penyimpanan, bandwidth, dan pengaturan tetap penting. Kebanyakan orang menggunakan bursa atau light wallet, jadi mereka memercayakan pengecekan rantai kepada pihak lain. Snapshot Bybit tanggal 14 November menunjukkan BTC di dekat $67.326, turun 1,64%, di bawah rata-rata pergerakan utama, dengan arus keluar lima menit melebihi arus masuk. Apakah risiko yang lebih besar adalah sentralisasi atau penyelesaian yang lebih lambat? #IMPACTbyTrade
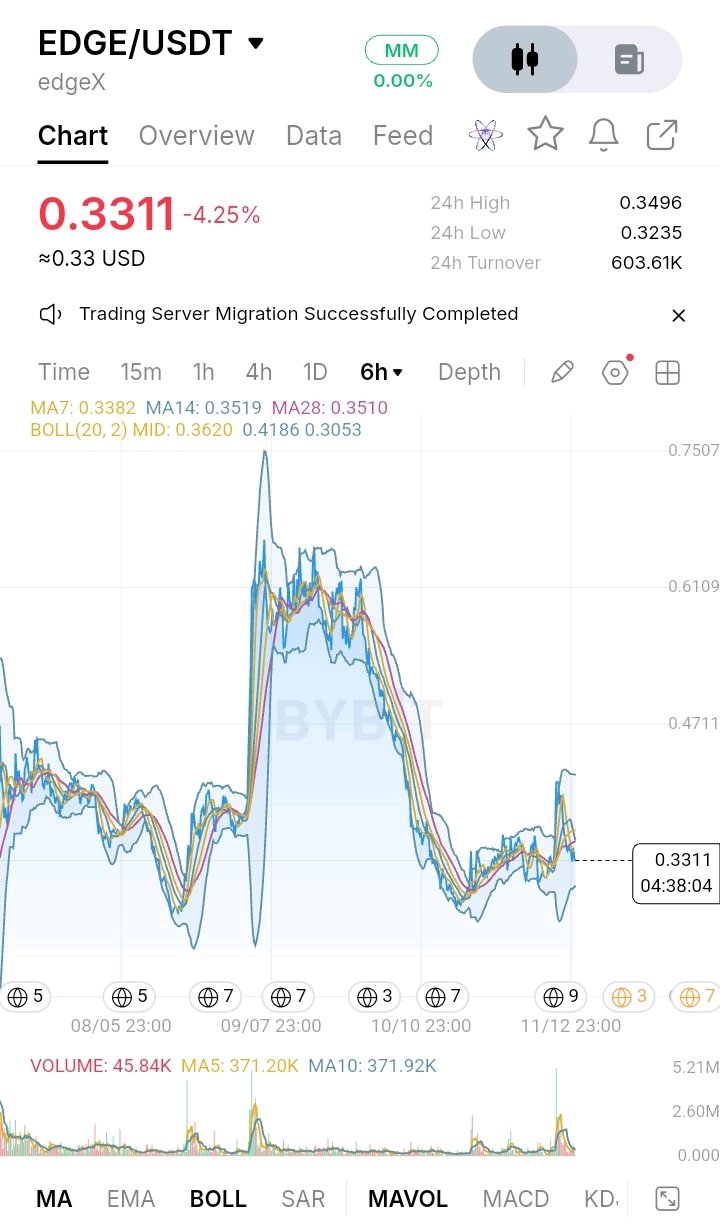
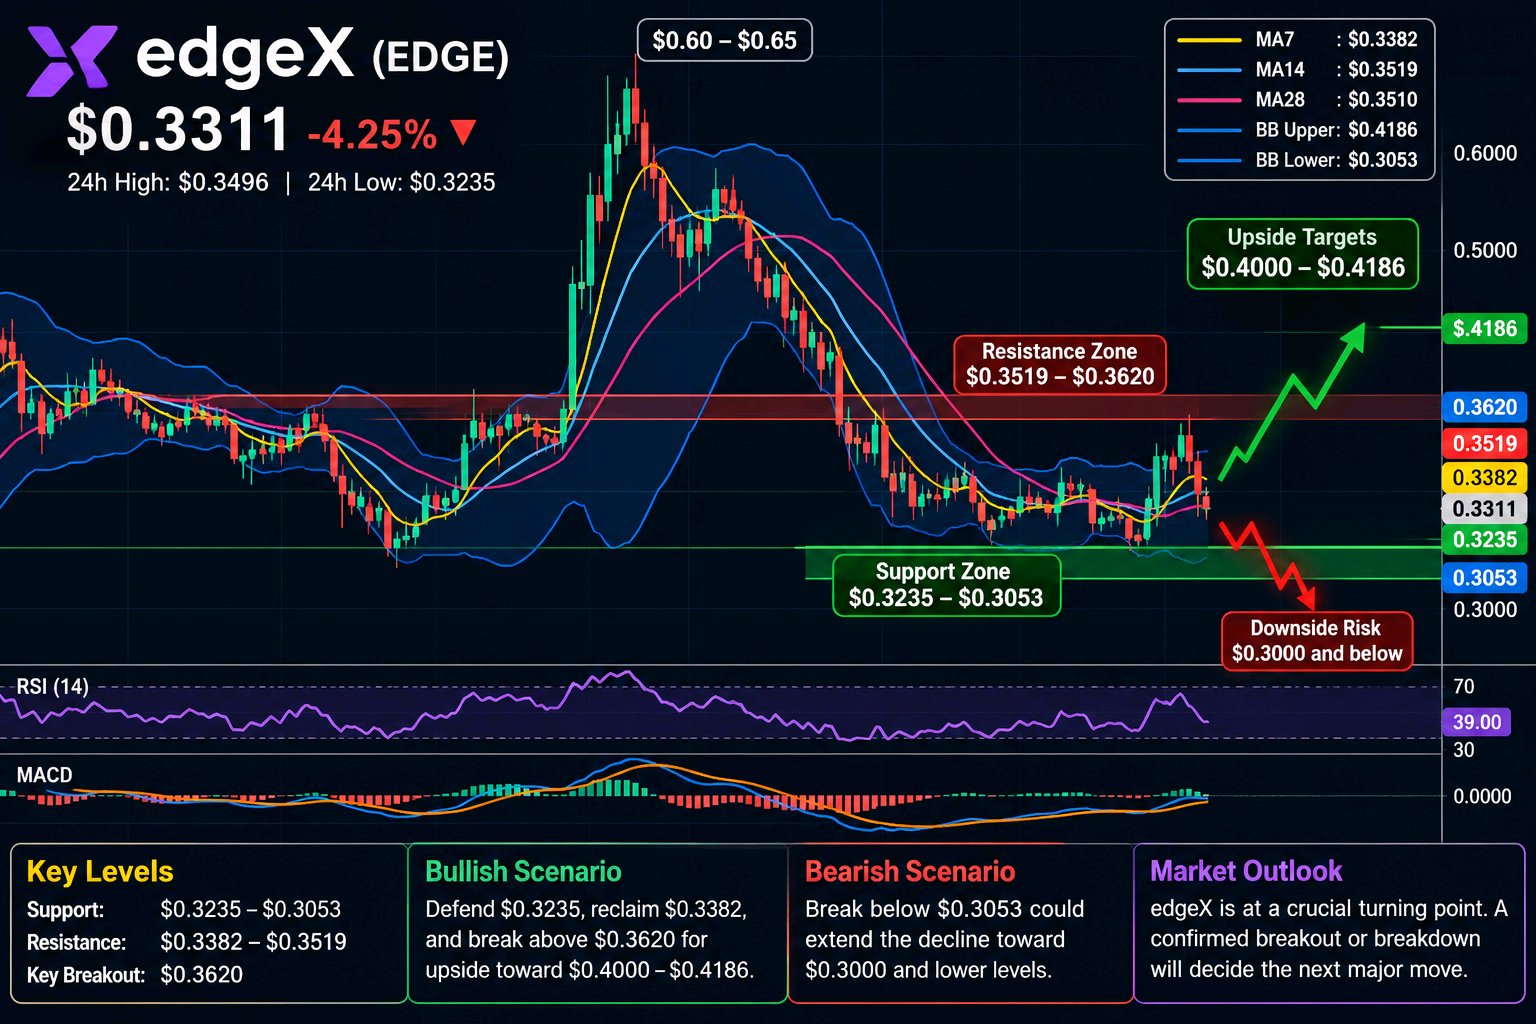
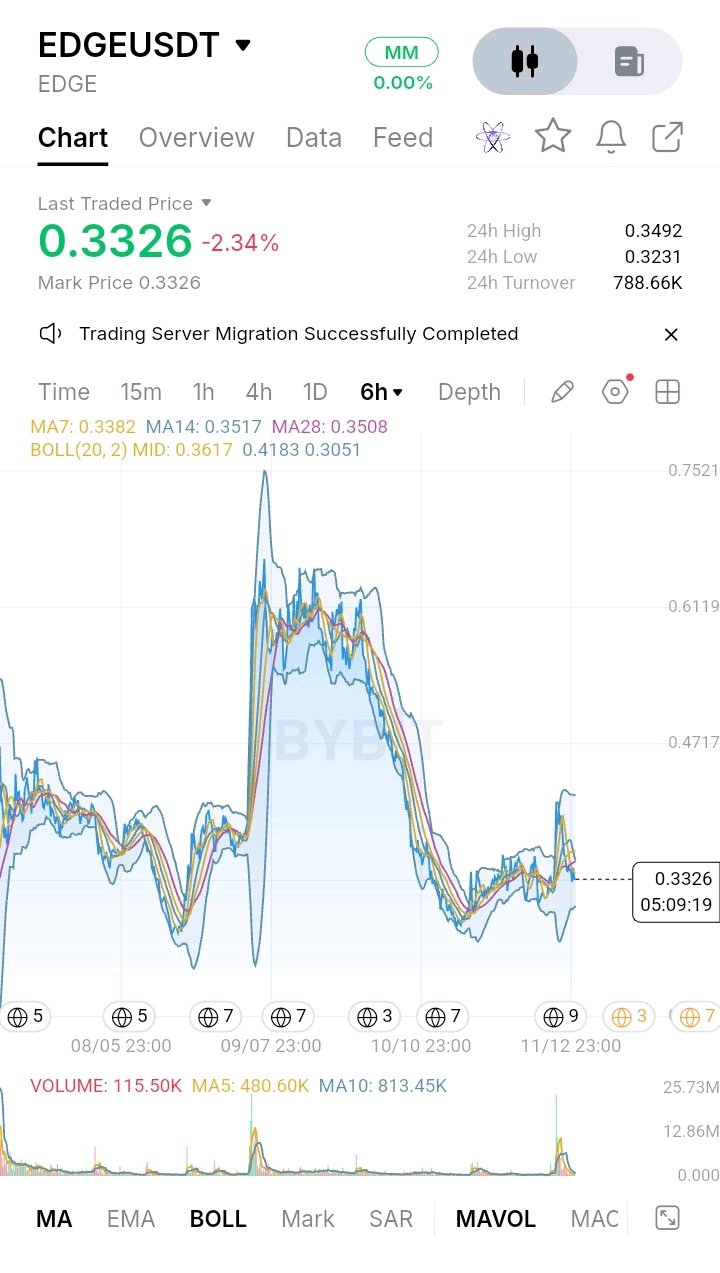
edgeX ($EDGEUSDT ) is currently trading around $0.3311, showing a 4.25% decline over the last 24 hours in the provided chart. The price has experienced considerable volatility, with a reported daily high of $0.3496 and a low of $0.3235. The broader six-hour structure reveals a significant correction from the previous rally near $0.60–$0.65, followed by an extended decline and an attempt to establish a recovery base around $0.30–$0.34. Although buyers have managed to stabilize price, the latest rejection suggests that selling pressure remains relevant. Looking at the market structure, edgeX is currently moving through a consolidation phase after a prolonged bearish correction. The recent recovery attempts have produced temporary upward spikes, but buyers have struggled to maintain momentum above nearby resistance. The price is trading below its six-hour MA7 at $0.3382, MA14 at $0.3519, and MA28 at $0.3510. This alignment indicates that short-term momentum remains weak and sellers currently have an advantage. The Bollinger Bands show a middle line at $0.3620, an upper boundary at $0.4186, and a lower boundary at $0.3053, highlighting the broader volatility zone. On the hourly timeframe, available technical readings indicate that edgeX remains below its EMA200, making this a significant structural decision area. The exact current 1H EMA200 value is not independently verified, so assigning a specific price would be misleading. Available hourly momentum readings also show RSI around 39, reflecting relatively weak buying strength, while MACD remains bearish. These signals suggest that a sustainable recovery requires stronger momentum rather than isolated upward candles. The immediate support zone lies between $0.3235 and $0.3053. The first level represents the recent daily low, while the second corresponds to the lower Bollinger Band. A breakdown below $0.3053 could expose the psychological $0.3000 level, potentially extending the correction toward lower historical consolidation areas. On the upside, $0.3382 is the first recovery hurdle, followed by $0.3496–$0.3519. Reclaiming this resistance cluster would improve short-term structure, while $0.3620 remains an important confirmation level for stronger bullish momentum. For buyers, the bullish scenario requires defending $0.3235, reclaiming $0.3382, and establishing sustained trading above $0.3519. A confirmed breakout through $0.3620 could open the way toward $0.4000 and potentially $0.4186. However, rejection around these levels would indicate that sellers remain in control. The bearish scenario becomes stronger if edgeX loses $0.3235 and subsequently breaks $0.3053 with increasing selling volume. Such a move would undermine the developing consolidation structure and increase downside risk. Overall, edgeX remains at an important technical turning point. The next major move will likely depend on whether buyers can defend the $0.3235–$0.3053 support region and reclaim the moving-average resistance cluster. Until that happens, recovery attempts should be treated cautiously, with a confirmed breakout or breakdown providing a clearer directional signal. #IMPACTbyTrade
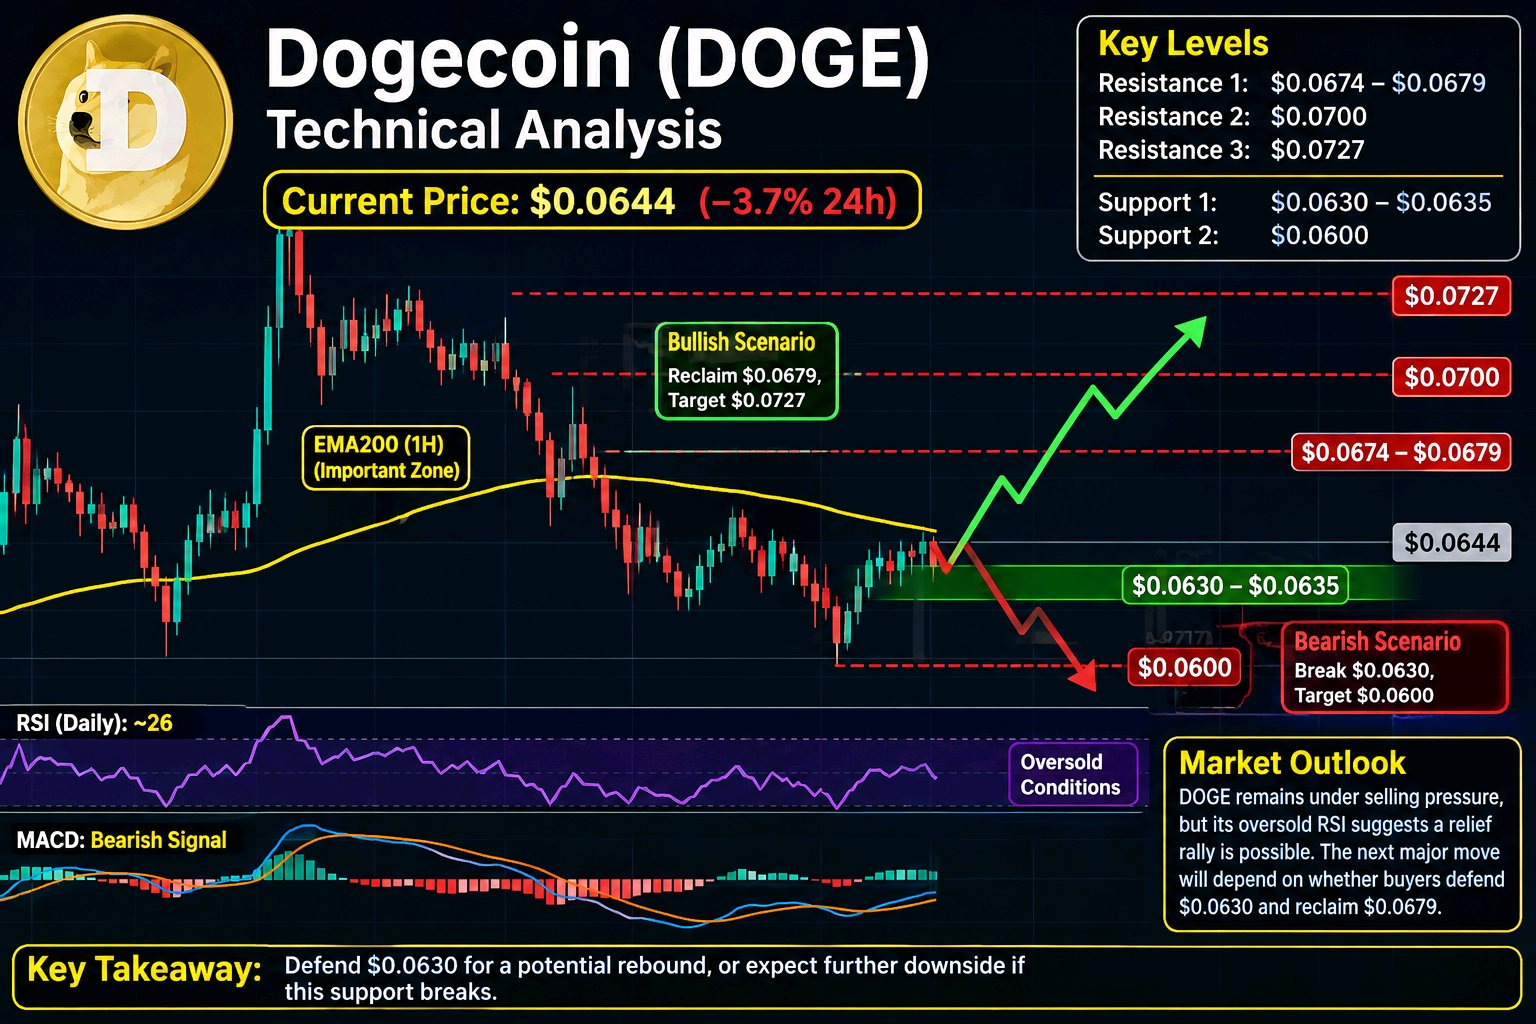
Dogecoin ($DOGEUSDT ) is currently trading around $0.0644, showing a decline of approximately 3.7% over the past 24 hours. The latest market data places its daily trading range between $0.0631 and $0.0674, highlighting continued selling pressure and elevated short-term volatility. DOGE has struggled to maintain its previous recovery attempts, with the broader price structure showing consecutive lower daily closes. After trading near $0.0727 on November 7, the price gradually weakened, moving toward the $0.0630 region. This decline indicates that sellers remain in control, although the latest movement near support suggests buyers are beginning to defend lower levels. CoinGlass +1 From a market-structure perspective, DOGE remains bearish in the short term. The recent decline from approximately $0.0727 toward $0.0631 demonstrates weakening momentum and a lack of sustained buying participation. The immediate consolidation area is developing between $0.0630 and $0.0675. Buyers need to establish higher lows and recover the upper boundary before a meaningful structural improvement can be considered. Meanwhile, sellers will attempt to keep the price below resistance and prevent a sustained recovery. The one-hour EMA200 is particularly important because it helps identify the broader intraday trend and acts as a potential dynamic resistance or support zone. However, a verified current one-hour EMA200 reading is unavailable in the supplied information, so assigning it an exact value would be unreliable. The same limitation applies to precise short-term moving-average and MACD readings. The available daily RSI is approximately 26, indicating deeply oversold conditions. This increases the possibility of a technical rebound, but oversold conditions alone do not confirm a trend reversal. CoinGlass +1 The $0.0630–$0.0635 region is the first important support zone because it contains the latest daily lows. A sustained breakdown below this area could expose DOGE to further downside, with $0.0600 acting as the next psychological level to monitor. On the upside, $0.0655 is an initial recovery threshold, followed by resistance around $0.0674–$0.0679. These levels matter because reclaiming them would demonstrate improving demand and potentially weaken the current bearish structure. A stronger recovery toward $0.0700 would provide additional evidence of renewed buying interest. For the bullish scenario, DOGE needs to defend $0.0630, establish higher lows, and reclaim $0.0679 with convincing trading volume. Successful acceptance above $0.0700 could open the way toward $0.0727, the recent swing-high region. Conversely, rejection near $0.0675–$0.0700 followed by a breakdown below $0.0630 would strengthen bearish continuation. Overall, DOGE remains under selling pressure, but its oversold daily RSI makes a relief rally increasingly possible. The next major move will likely depend on whether buyers can defend $0.0630 and generate enough volume to reclaim resistance. Until that happens, rallies should be treated cautiously rather than interpreted as confirmed reversals. #IMPACTbyTrade
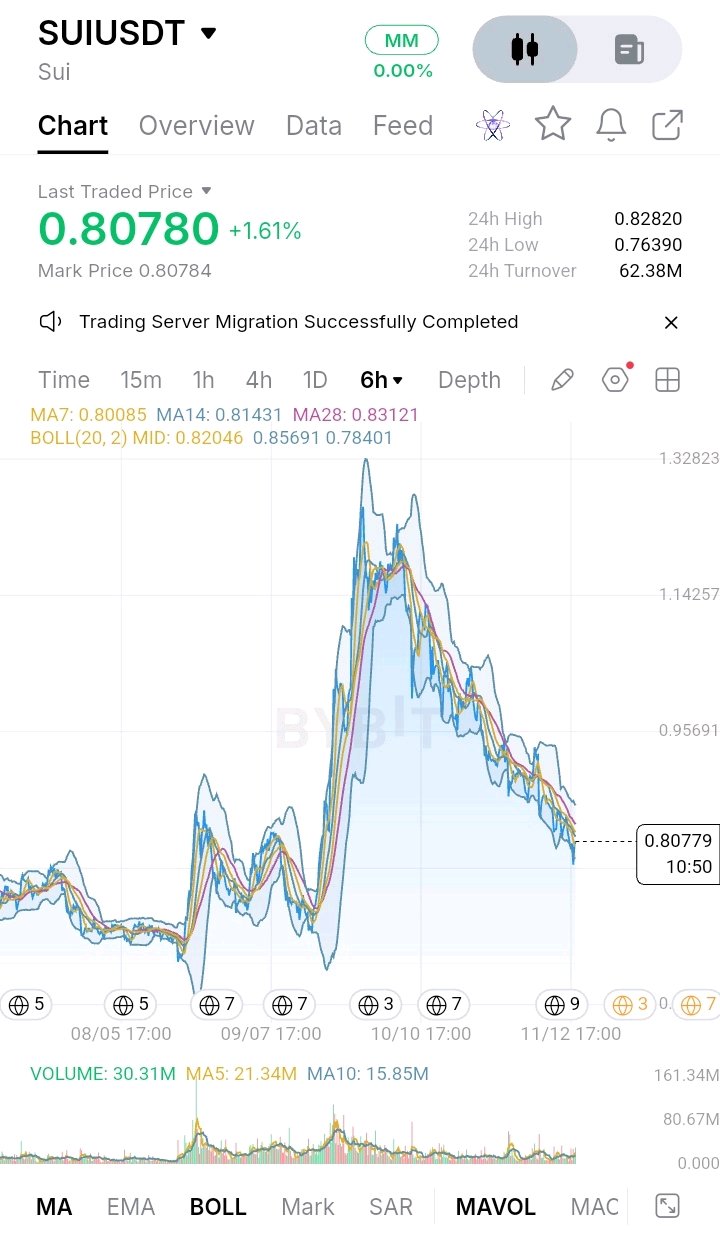
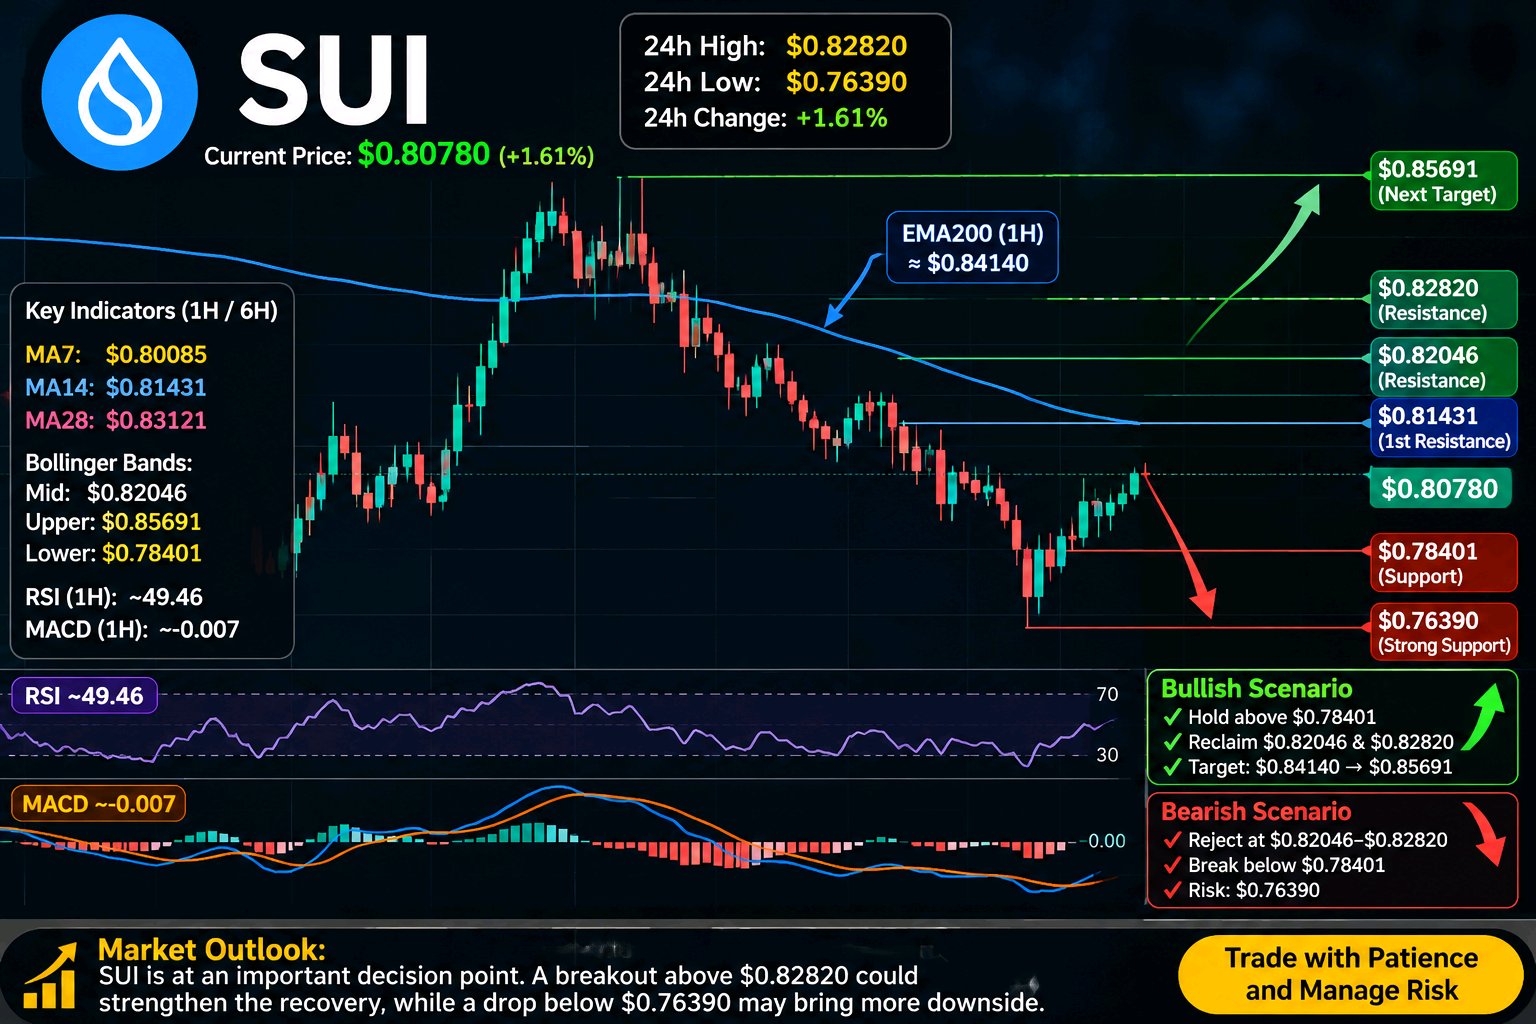
$SUIUSDT is currently trading around $0.80780, up 1.61% over the last 24 hours, showing an attempt to recover after a prolonged period of selling pressure. The latest 24-hour high stands at $0.82820, while the low is $0.76390. Looking at the broader 6-hour chart, SUI previously experienced a powerful rally toward approximately $1.30, but that move was followed by a sustained correction, with sellers gradually pushing the price into a series of lower highs and lower lows. The current recovery is encouraging, but buyers still need stronger confirmation before the overall market structure can be considered bullish. At the moment, SUI is trading above its 7-period moving average at $0.80085, but remains below the 14-period MA at $0.81431 and the 28-period MA at $0.83121. This shows that short-term buying activity is improving, although the medium-term trend continues to face resistance. The Bollinger Bands provide additional insight, with the middle line at $0.82046, the upper boundary at $0.85691, and the lower boundary at $0.78401. These levels are particularly important because they identify the current trading structure and potential areas where buyers and sellers may become more active. On the 1-hour timeframe, the EMA200 is around $0.84140, making it an important structural decision zone. SUI remains below this average, meaning the broader hourly trend has not yet confirmed a bullish reversal. The RSI is approximately 49.46, indicating relatively neutral momentum, while the MACD remains negative at approximately -0.007, suggesting that bearish pressure has not completely disappeared. However, the recent recovery from lower levels indicates that buyers are attempting to regain control. Investing.com India From a price-action perspective, $0.80000 is the first important psychological support, followed by $0.78401 and the recent low of $0.76390. Holding these levels would help buyers establish a stronger foundation. A breakdown below $0.76390 could invite further selling pressure and weaken the recovery. On the upside, $0.81431 is the first resistance, followed by $0.82046 and $0.82820. A convincing breakout above $0.82820, supported by stronger trading volume, could open the door toward $0.84140 and eventually $0.85691. For the bullish scenario, buyers need to defend current support, reclaim the important moving averages, and establish sustained momentum above $0.82820. Conversely, repeated rejection around $0.82046–$0.82820 would suggest that sellers remain in control. Overall, SUI is approaching an important turning point. The next significant move will depend on whether buyers can turn this recovery into a confirmed breakout or whether sellers push the price back toward lower support levels. Until resistance is convincingly reclaimed, patience and careful risk management remain essential. #IMPACTbyTrade
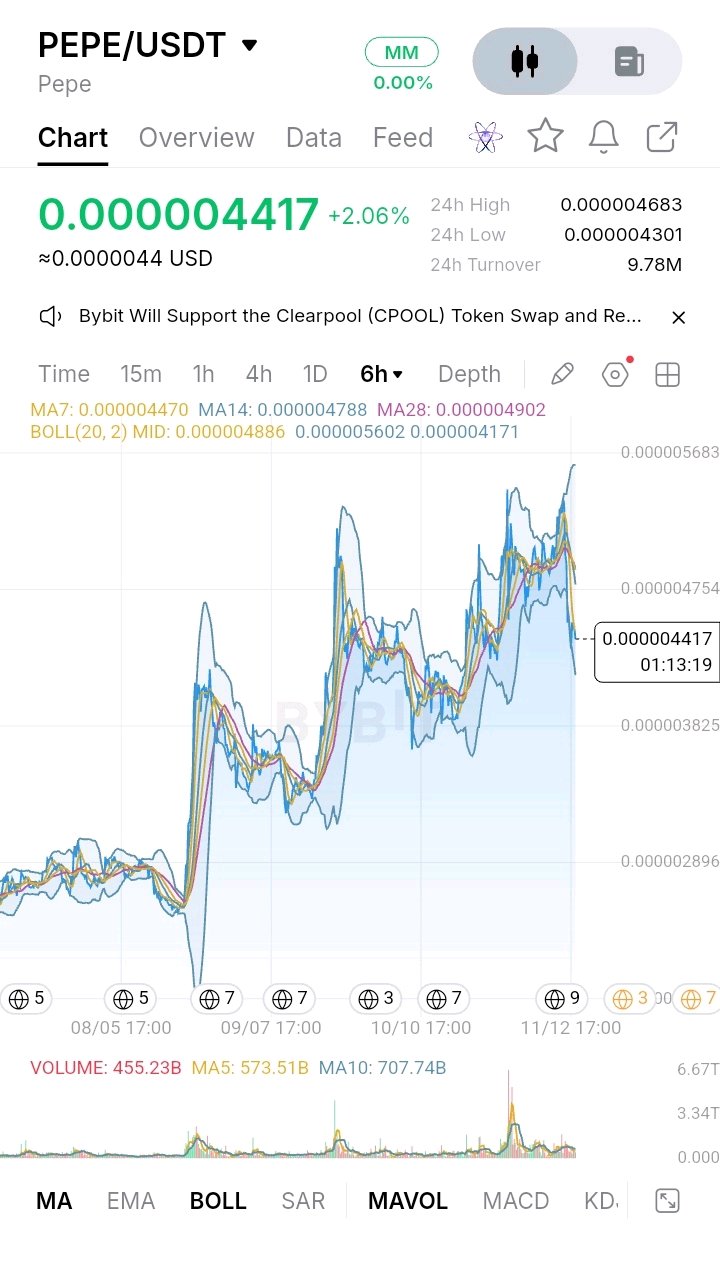
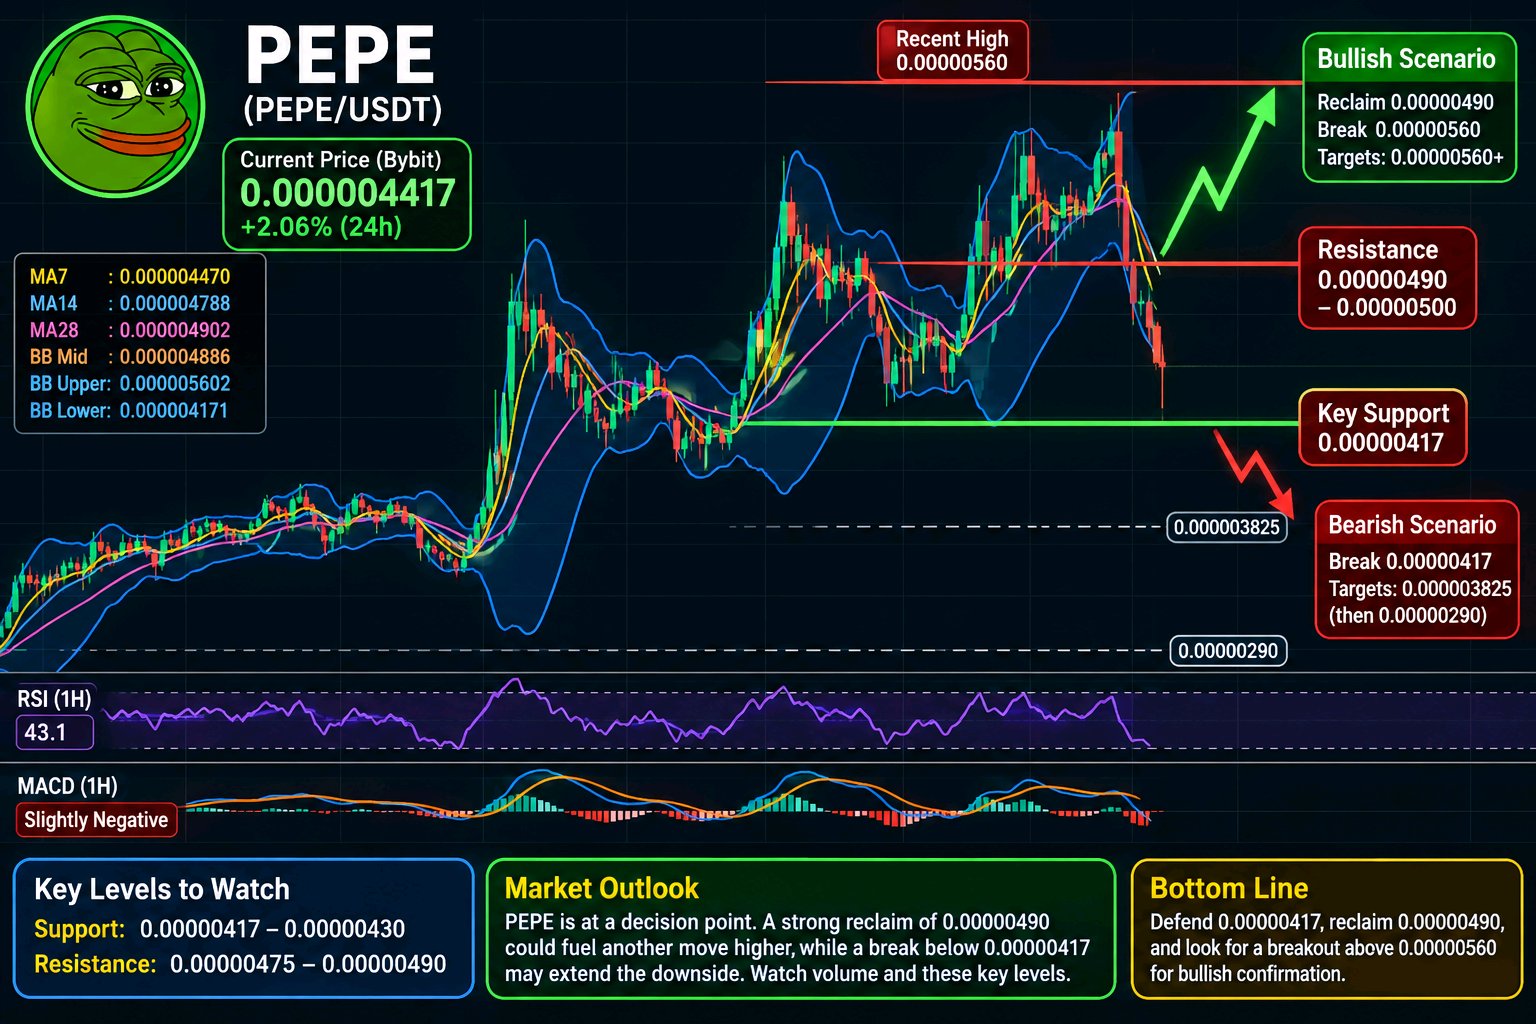
$PEPEUSDT is trading around 0.00000455 USDT in the latest available market snapshot, while the supplied Bybit chart records 0.000004417 USDT and a 24-hour gain of 2.06%. The difference reflects separate update times and venues, so the screenshot remains the reference for its indicator readings. The broader live range is approximately 0.00000429–0.00000469, showing meaningful intraday volatility. On the six-hour chart, PEPE advanced from a base near 0.0000029, made successive swings toward 0.0000048–0.0000056, and has now pulled back sharply from the latest peak. The structure is therefore a recovery that is losing short-term momentum, rather than a confirmed continuation breakout. The screenshot places price below the MA7 at 0.000004470, MA14 at 0.000004788 and MA28 at 0.000004902. That alignment shows sellers have regained control of the immediate trend. The Bollinger midline at 0.000004886 is another important reclaim level; the upper band at 0.000005602 marks an extended resistance area, while the lower band at 0.000004171 is the nearby volatility-based support. The current quote is close to that lower band, so a reaction there matters. On the one-hour timeframe, the latest published indicator snapshot reports RSI at 43.1, a weak, sub-50 momentum reading, and a bearish Supertrend. MACD is slightly negative, although its histogram is positive, suggesting downside momentum may be easing without yet confirming a bullish reversal. That same snapshot places PEPE 8.26% below its one-hour EMA200. The exact EMA200 price is not provided, so it should not be fabricated; the average remains a major structural decision zone, and buyers would need to reclaim it to improve the hourly trend. Immediate support sits around 0.00000430–0.00000417, combining the recent 24-hour low area with the chart’s lower Bollinger band. A sustained break below 0.00000417 would expose the 0.000003825 chart region, followed by the prior base around 0.0000029. On the upside, PEPE first needs to recover 0.00000447, then clear the 0.00000475–0.00000490 moving-average cluster. A convincing close above 0.00000490, supported by expanding volume, would open a retest of 0.0000050 and then 0.00000560, the recent upper-band and swing-high region. The bullish case requires buyers to defend 0.00000417, reclaim the short averages and turn 0.00000490 into support. Failure to do so, especially a decisive support break on rising sell volume, would keep the recovery vulnerable and strengthen the bearish continuation scenario. Overall, PEPE is at a decision point: compressed price action near support may produce a sharp move, but direction needs confirmation. Watch volume, the 0.00000417 floor and the 0.00000490 reclaim; those levels will show whether demand is returning or sellers are preparing another leg lower. #IMPACTbyTrade
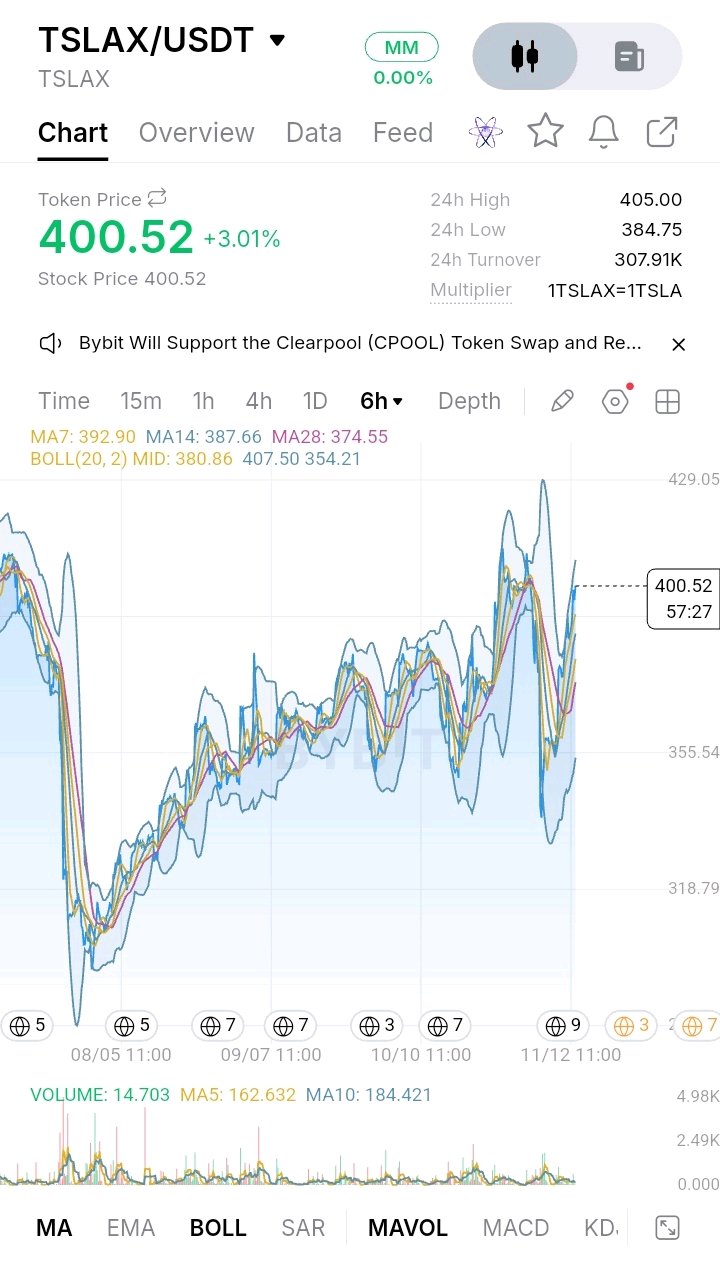
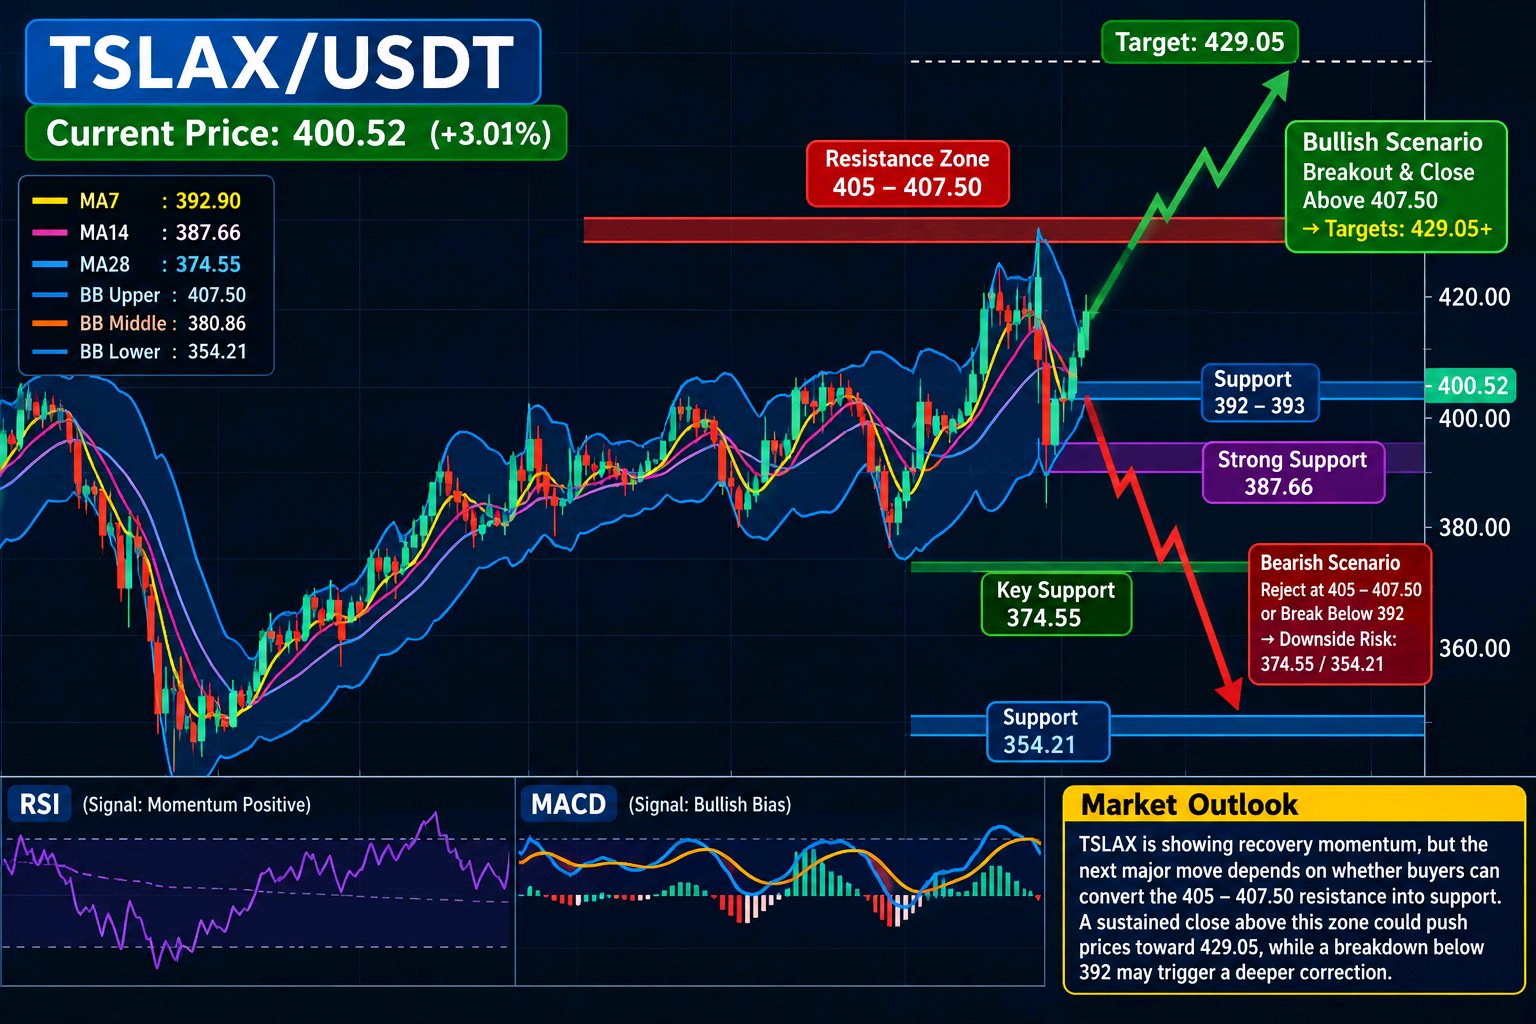
$TSLAXUSDT is currently trading at 400.52, showing a 3.01% gain over the last 24 hours. The chart reflects a recovering market structure, with buyers attempting to regain control after a previous period of significant selling pressure. The 24-hour high of 405.00 and low of 384.75 establish the immediate trading boundaries, while the recent price action suggests improving short-term momentum. On the 6-hour chart, TSLAX has recovered considerably from its earlier decline, which pushed the price toward the 300–320 region. Since that major swing low, the market has developed a broader recovery structure, with higher trading levels and repeated attempts to challenge overhead resistance. However, volatility remains elevated. The chart also shows several sharp upward and downward movements, indicating that buyers and sellers are still competing aggressively around important price zones. The moving-average structure supports the recovery. The displayed MA7 at 392.90, MA14 at 387.66 and MA28 at 374.55 are all below the current price. This alignment indicates positive short-term positioning, with the 392–393 area becoming the first important support zone. The Bollinger Bands show a middle line at 380.86, an upper band at 407.50 and a lower band at 354.21. Price approaching the upper band highlights the possibility of continued expansion, but also increases the risk of a temporary pullback. The 405–407.50 region is the immediate resistance area. A convincing 6-hour close above 407.50, supported by stronger trading volume, would improve the bullish structure and potentially open the way toward the previous chart high near 429.05. Beyond that level, further upside would require sustained buying pressure. On the downside, losing 392 would weaken immediate momentum, while a break below 387.66 could expose 380.86. A deeper correction toward 374.55 or the 354.21 Bollinger lower band would become possible if selling pressure accelerates. The 1-hour EMA200 value is not displayed in the supplied screenshot, so its exact level cannot be verified. It remains an important structural decision zone: buyers should establish price above it to strengthen the broader bullish case, while rejection below it would indicate continued trend risk. Similarly, RSI and MACD readings are unavailable, meaning overbought conditions, momentum divergence and potential crossover signals cannot be confirmed. The bullish scenario depends on defending 392–393, reclaiming 405 and establishing acceptance above 407.50. Conversely, repeated rejection around 405–407.50, followed by a loss of 392, would favor consolidation or another downward move. Overall, TSLAX is showing encouraging recovery momentum, but the next major move depends on whether buyers can convert the 405–407.50 resistance into support. Volume expansion, sustained 6-hour closes and confirmation from the 1-hour EMA200 will be important. Until those conditions appear, maintaining a balanced outlook and respecting the support structure is more sensible than assuming an immediate breakout. #IMPACTbyTrade
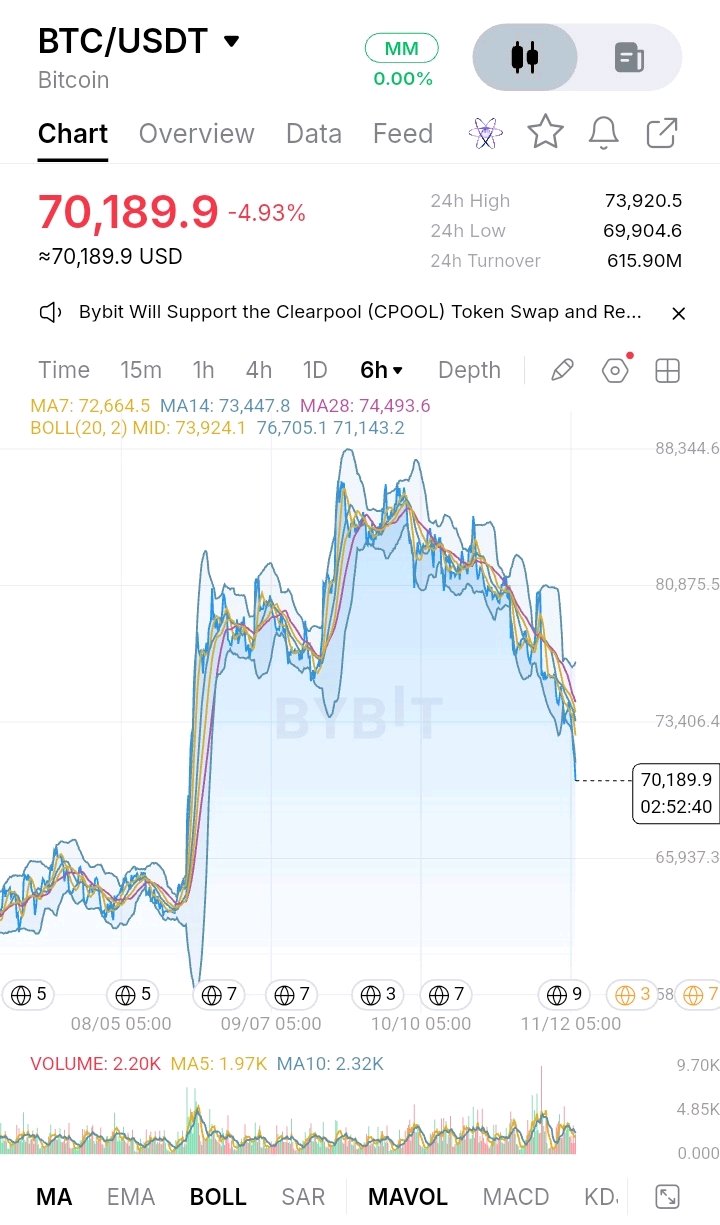
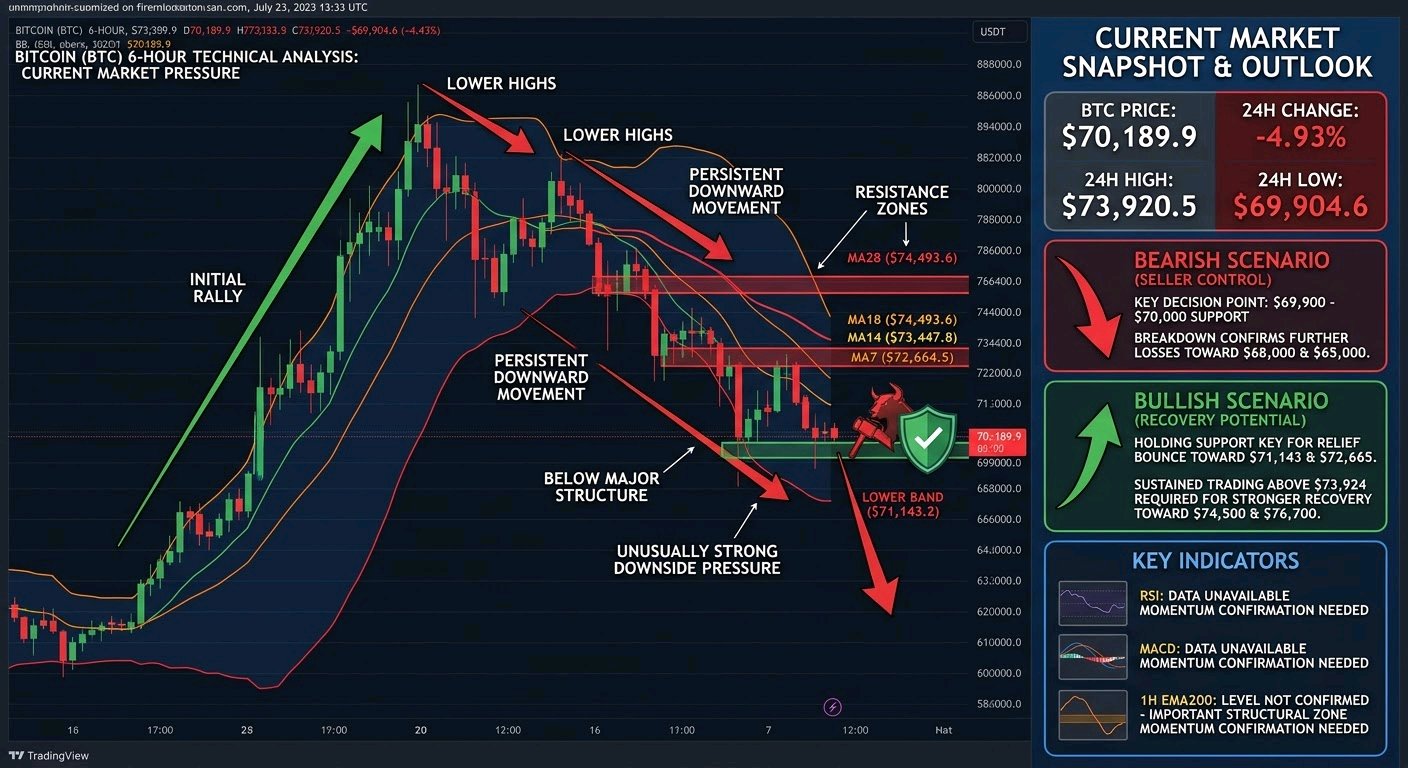
Bitcoin ($BTCUSDT ) menghadapi tekanan jual yang kuat, dengan harga saat ini diperdagangkan di sekitar $70.189,9, turun 4,93% selama 24 jam terakhir. Penurunan baru-baru ini telah mendorong BTC menjauh dari zona pemulihan sebelumnya, menimbulkan pertanyaan tentang apakah pembeli dapat mempertahankan struktur pasar saat ini. Level tertinggi 24 jam berada di $73.920,5, sedangkan level terendah di $69.904,6, menunjukkan volatilitas yang signifikan dan ketidakpastian yang meningkat. Melihat grafik 6 jam, Bitcoin sebelumnya mengalami reli yang kuat dari wilayah $60.000-an bawah menuju area $87.000–$88.000. Namun, pemulihan itu perlahan kehilangan kekuatan, diikuti oleh level tertinggi yang lebih rendah dan pergerakan turun yang terus-menerus. Ini menunjukkan penjual saat ini mengendalikan struktur jangka pendek yang lebih luas. Aksi harga terbaru juga menunjukkan BTC diperdagangkan di bawah rata-rata pergerakan utamanya, yang mengindikasikan bahwa momentum bullish telah melemah secara signifikan. Rata-rata pergerakan mengonfirmasi kelemahan ini. MA7 berada di sekitar $72.664,5, MA14 di dekat $73.447,8, dan MA28 di sekitar $74.493,6. Ketiganya diposisikan di atas harga saat ini, menciptakan beberapa zona resistensi. Bollinger Bands menunjukkan garis tengah di dekat $73.924,1, pita atas di sekitar $76.705,1, dan pita bawah di dekat $71.143,2. BTC yang diperdagangkan di bawah pita bawah menunjukkan tekanan penurunan yang sangat kuat, meskipun pemantulan sementara masih mungkin terjadi. Nilai EMA200 1 jam tidak terlihat dalam tangkapan layar yang disediakan, sehingga level pastinya tidak dapat dikonfirmasi. Ini tetap menjadi zona keputusan struktural yang penting: merebutnya kembali akan memperkuat potensi pemulihan, sementara penolakan dapat memperkuat momentum bearish. Pembacaan RSI dan MACD juga tidak tersedia, yang berarti konfirmasi momentum memerlukan data indikator tambahan. Bagi pembeli, $69.900–$70.000 adalah wilayah support terdekat. Mempertahankan area ini dapat mendorong pemantulan menuju $71.143, diikuti oleh $72.665. Pemulihan yang lebih kuat memerlukan perebutan kembali level $73.448–$73.924. Perdagangan yang berkelanjutan di atas klaster resistensi ini dapat membuka jalan menuju $74.500 dan berpotensi $76.700. Di sisi bearish, penembusan yang menentukan di bawah $69.900 dapat mengekspos BTC pada kerugian lebih lanjut menuju wilayah psikologis $68.000 dan $65.000. Penjual akan membutuhkan tekanan penurunan yang berkelanjutan untuk mengonfirmasi kaki kelanjutan lainnya. Secara keseluruhan, Bitcoin tetap lemah secara teknis sampai pembeli merebut kembali rata-rata pergerakan yang hilang dan menetapkan level tertinggi yang lebih tinggi. Pergerakan besar berikutnya kemungkinan akan bergantung pada apakah $70.000 menarik permintaan beli yang berarti atau penjual memaksakan penembusan support lainnya. Konfirmasi melalui volume dan indikator momentum sangat penting sebelum menganggap pemantulan apa pun sebagai pembalikan tren yang asli. #IMPACTbyTrade
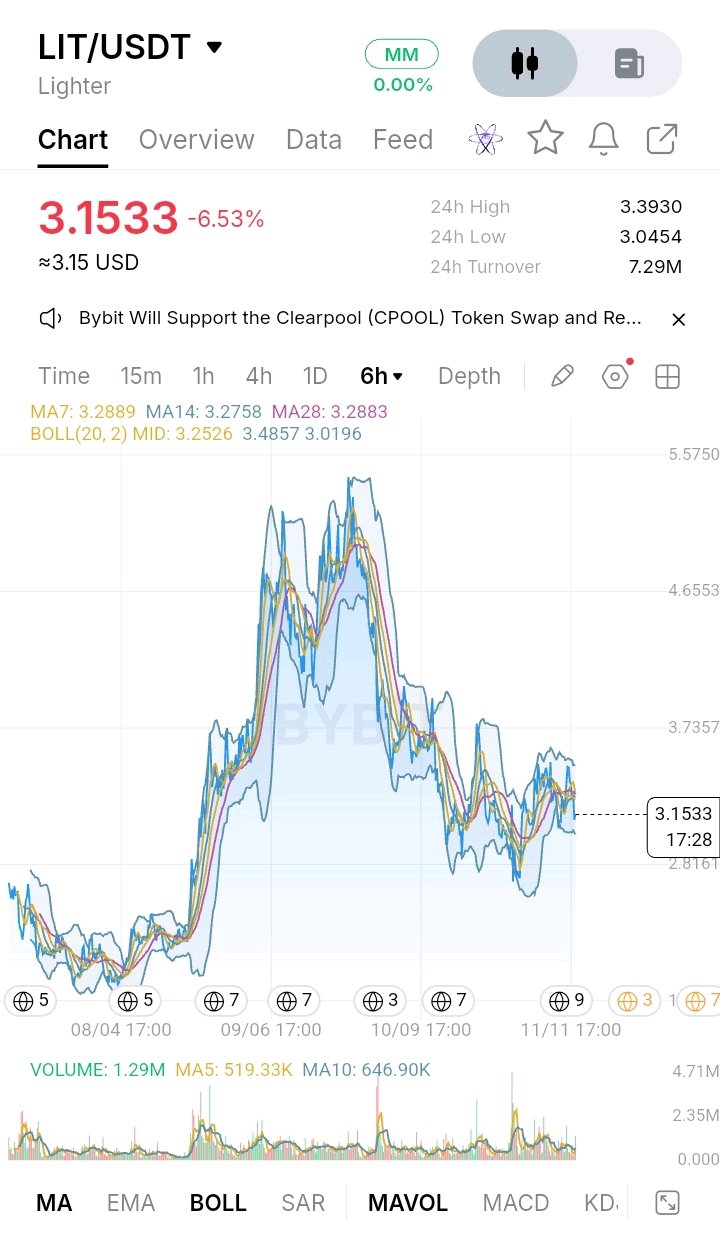
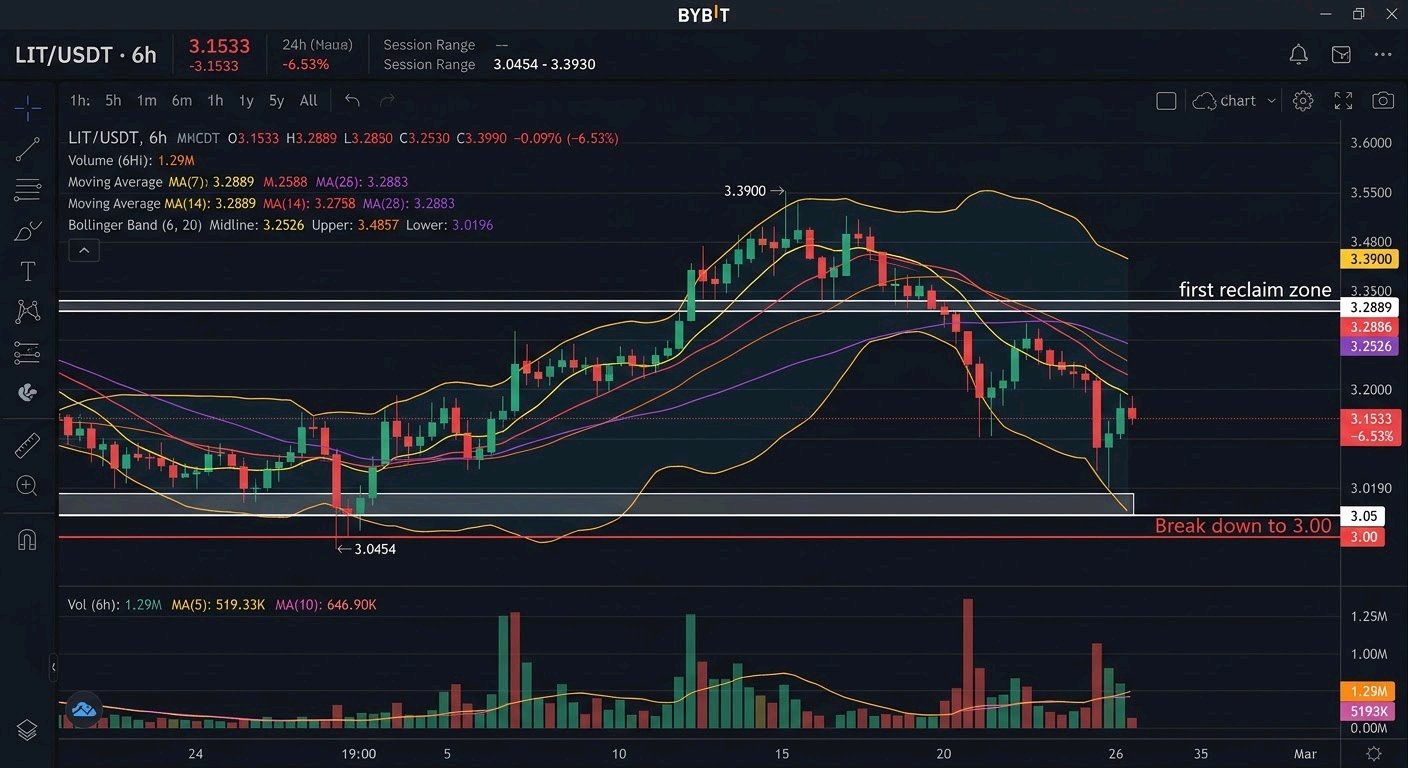
$LITUSDT is trading at 3.1533 USDT in the supplied Bybit snapshot, down 6.53% over 24 hours. The session range is 3.0454–3.3930, showing active trading and meaningful volatility. Price has pulled back from 3.39 and sits in the lower half of that range. On the six-hour chart, the broader structure remains corrective: LIT rallied sharply from its earlier base, peaked around 5.5 in September, and then formed lower highs and lower lows. Recent action looks like choppy stabilization after the decline, not a confirmed reversal. The six-hour moving averages reinforce this cautious reading. MA7 is 3.2889, MA14 is 3.2758 and MA28 is 3.2883, all above price and tightly clustered. This 3.28–3.29 area is the first reclaim zone: buyers need to recover it and hold it on a closing basis to show improving momentum. The Bollinger midline is 3.2526, also above price, while the upper and lower bands are 3.4857 and 3.0196. The lower band and 24-hour low place immediate support around 3.02–3.05. A decisive six-hour close below this area would expose the psychological 3.00 level and confirm continued seller control. The 1-hour EMA200 is not displayed, so its exact value cannot be verified and should not be guessed. It remains an important structural decision zone: reclaiming and holding above it would strengthen the recovery case, while rejection beneath it would leave rallies vulnerable. RSI and MACD readings are also absent, so there is no reliable basis to claim an oversold condition or bullish crossover. Visible evidence shows price below its short-term averages and Bollinger midpoint, consistent with near-term selling pressure. Six-hour volume is 1.29M, above MA5 at 519.33K and MA10 at 646.90K, indicating elevated participation, although volume alone does not reveal which side is dominant. For a bullish shift, LIT must defend 3.02–3.05, reclaim 3.25, and then close above 3.28–3.29 with stronger buying volume. That would open a test of 3.39, followed by the 3.48–3.49 upper-band region. A sustained break there would improve the structure and bring higher resistance into view; the September peak near 5.54 remains a major historical reference, not an immediate target. Conversely, rejection around 3.25–3.29 followed by a break below 3.0454 would favor another downward leg, with 3.00 the first psychological level to watch. Overall, LIT is at a decision point, not a confirmed bottom. Buyers must defend 3.02–3.05 and reclaim the moving-average cluster; sellers retain control while price stays below 3.28–3.29. A high-volume close outside this nearby range is the clearest trigger for the next directional move. #IMPACTbyTrade
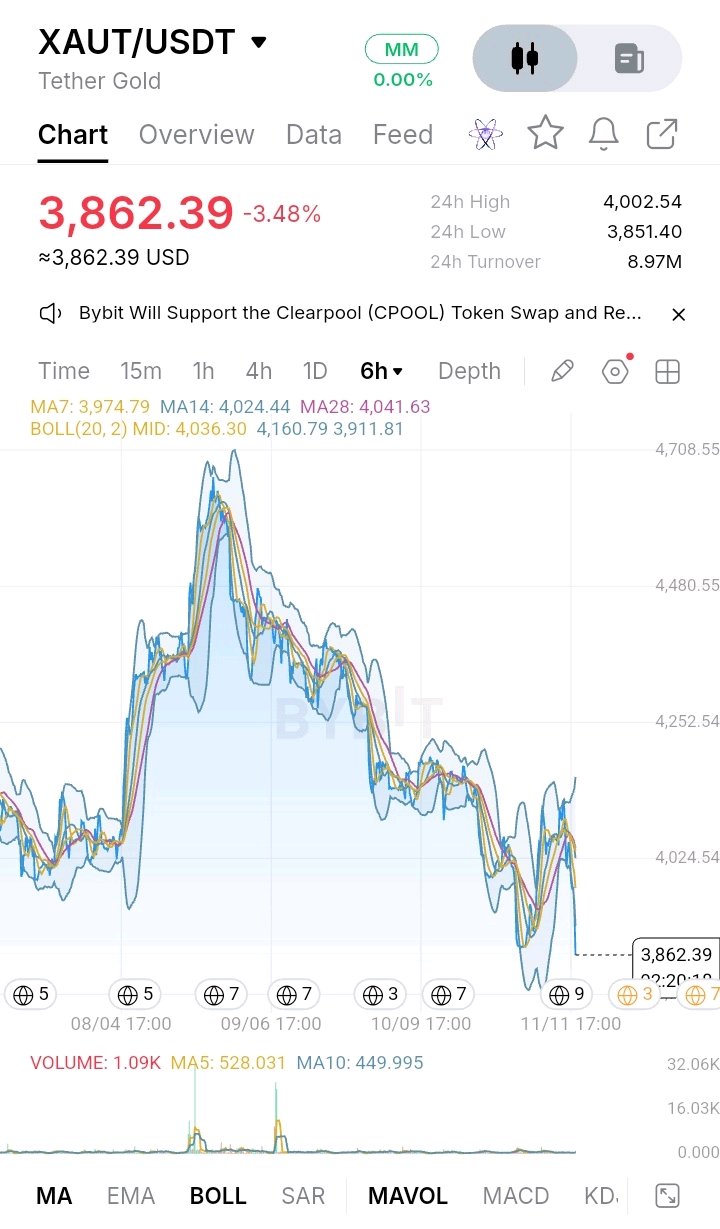
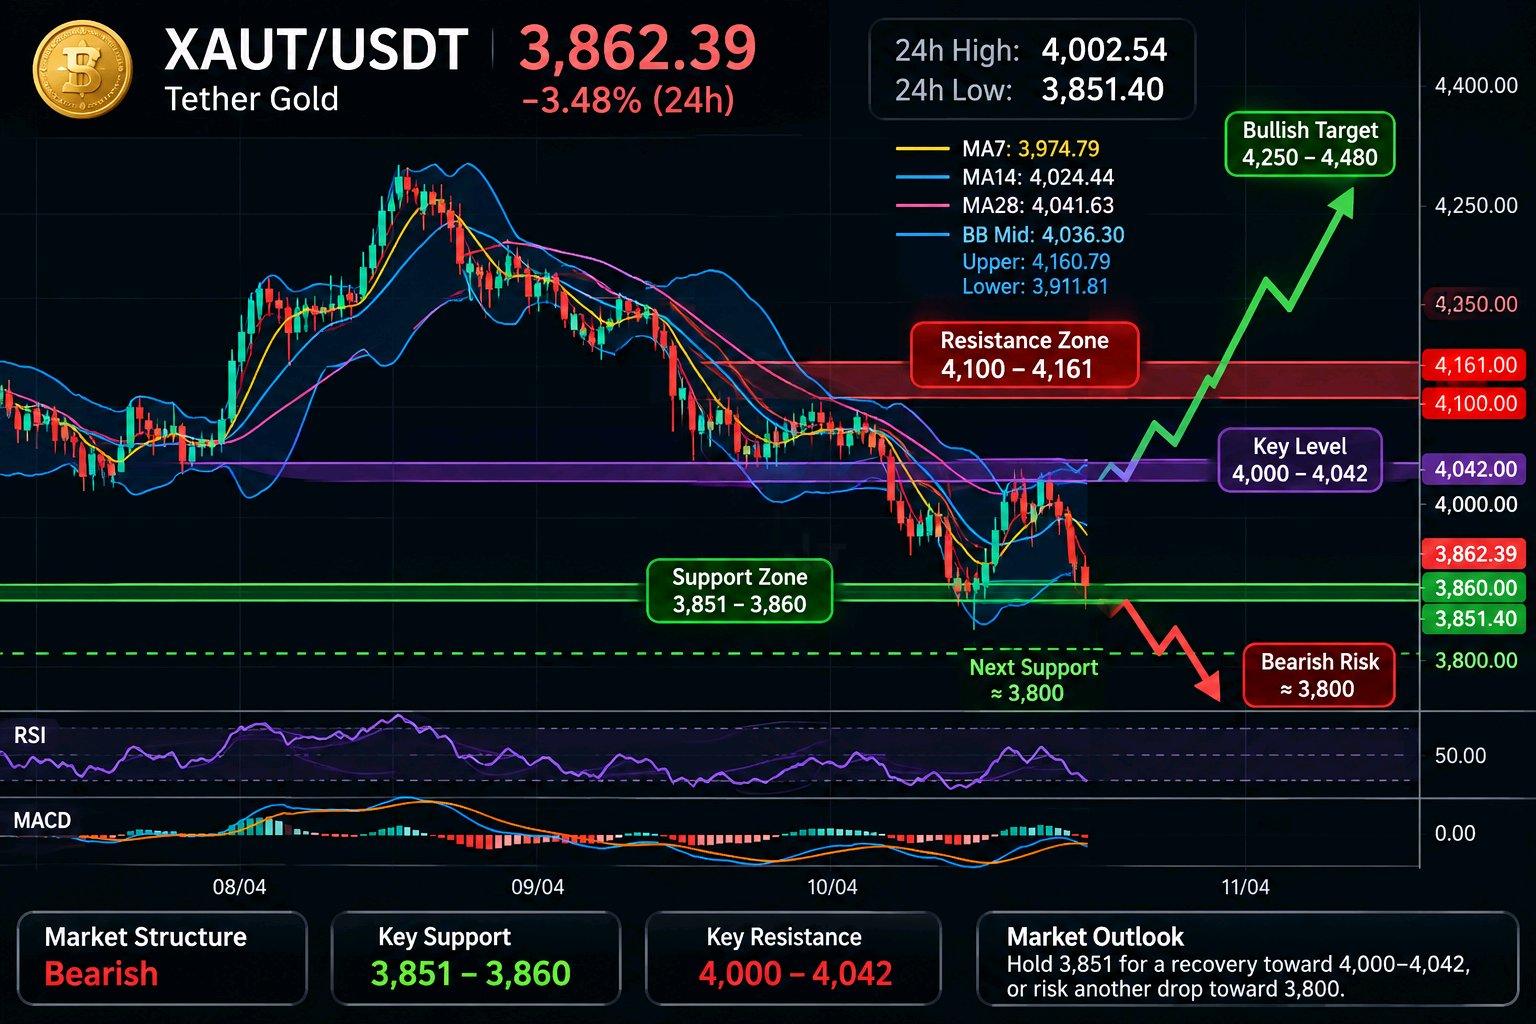
Tether Gold ($XAUTUSDT ) is trading at 3,862.39 USDT in the supplied Bybit snapshot, down 3.48% over 24 hours. The session range is 3,851.40–4,002.54, leaving price close to the daily low and showing that sellers have controlled the latest move. The 6-hour chart shows a broader decline from a visible swing peak near 4,700, followed by lower highs and lower lows. A sharp rebound from the recent trough failed to hold its recovery, and the latest drop back toward 3,860 signals that volatility remains elevated rather than a stable base having formed. The short-term structure is bearish. The displayed MA7 is 3,974.79, MA14 is 4,024.44 and MA28 is 4,041.63; price is below all three, while their clustering around 4,000–4,042 creates an immediate overhead supply zone. The Bollinger midline is 4,036.30, with the upper band at 4,160.79 and lower band at 3,911.81. Trading beneath the lower band suggests strong downside pressure and stretched conditions, but it does not by itself confirm a reversal. The chart does not show the 1-hour EMA200, RSI or MACD values, so their direction or readings cannot be verified. The 1H EMA200 should be treated as a major structural decision level once visible: reclaiming it would strengthen a recovery, while rejection beneath it would keep the broader bias defensive. Immediate support sits at 3,851–3,860, defined by the displayed 24-hour low and current price area. A decisive 6-hour close below this floor would expose the next psychological area around 3,800, with further weakness possible if selling accelerates. Buyers need to defend the low and produce a sustained higher low; a brief wick or intraday bounce is not enough. Above price, 3,912 is the first recovery test because it marks the lower Bollinger band. The 4,000–4,042 region is the key reclaim zone, combining the round-number level, short moving averages and Bollinger midline. A sustained close above it, followed by a successful retest, would be the first convincing sign that buyers are regaining control. If XAUT reclaims 4,042, resistance near 4,100 becomes the next upside test, followed by the upper Bollinger region around 4,161. A stronger continuation would need acceptance above these levels before the market can challenge prior swing supply around 4,250 and then the larger 4,480 area. Failure at 3,912 or rejection from 4,000–4,042 would favor another test of 3,851; losing that support would keep 3,800 in focus. For now, XAUT remains under clear selling pressure, with no confirmed momentum reversal visible in the supplied indicators. The next major move depends on whether buyers can defend 3,851 and reclaim 3,912, or sellers can force a 6-hour breakdown. Until price recovers the moving-average cluster, rallies are vulnerable to renewed selling. #IMPACTbyTrade