Jack09
16775Suka0Pembagian282Penggemar24Ikuti
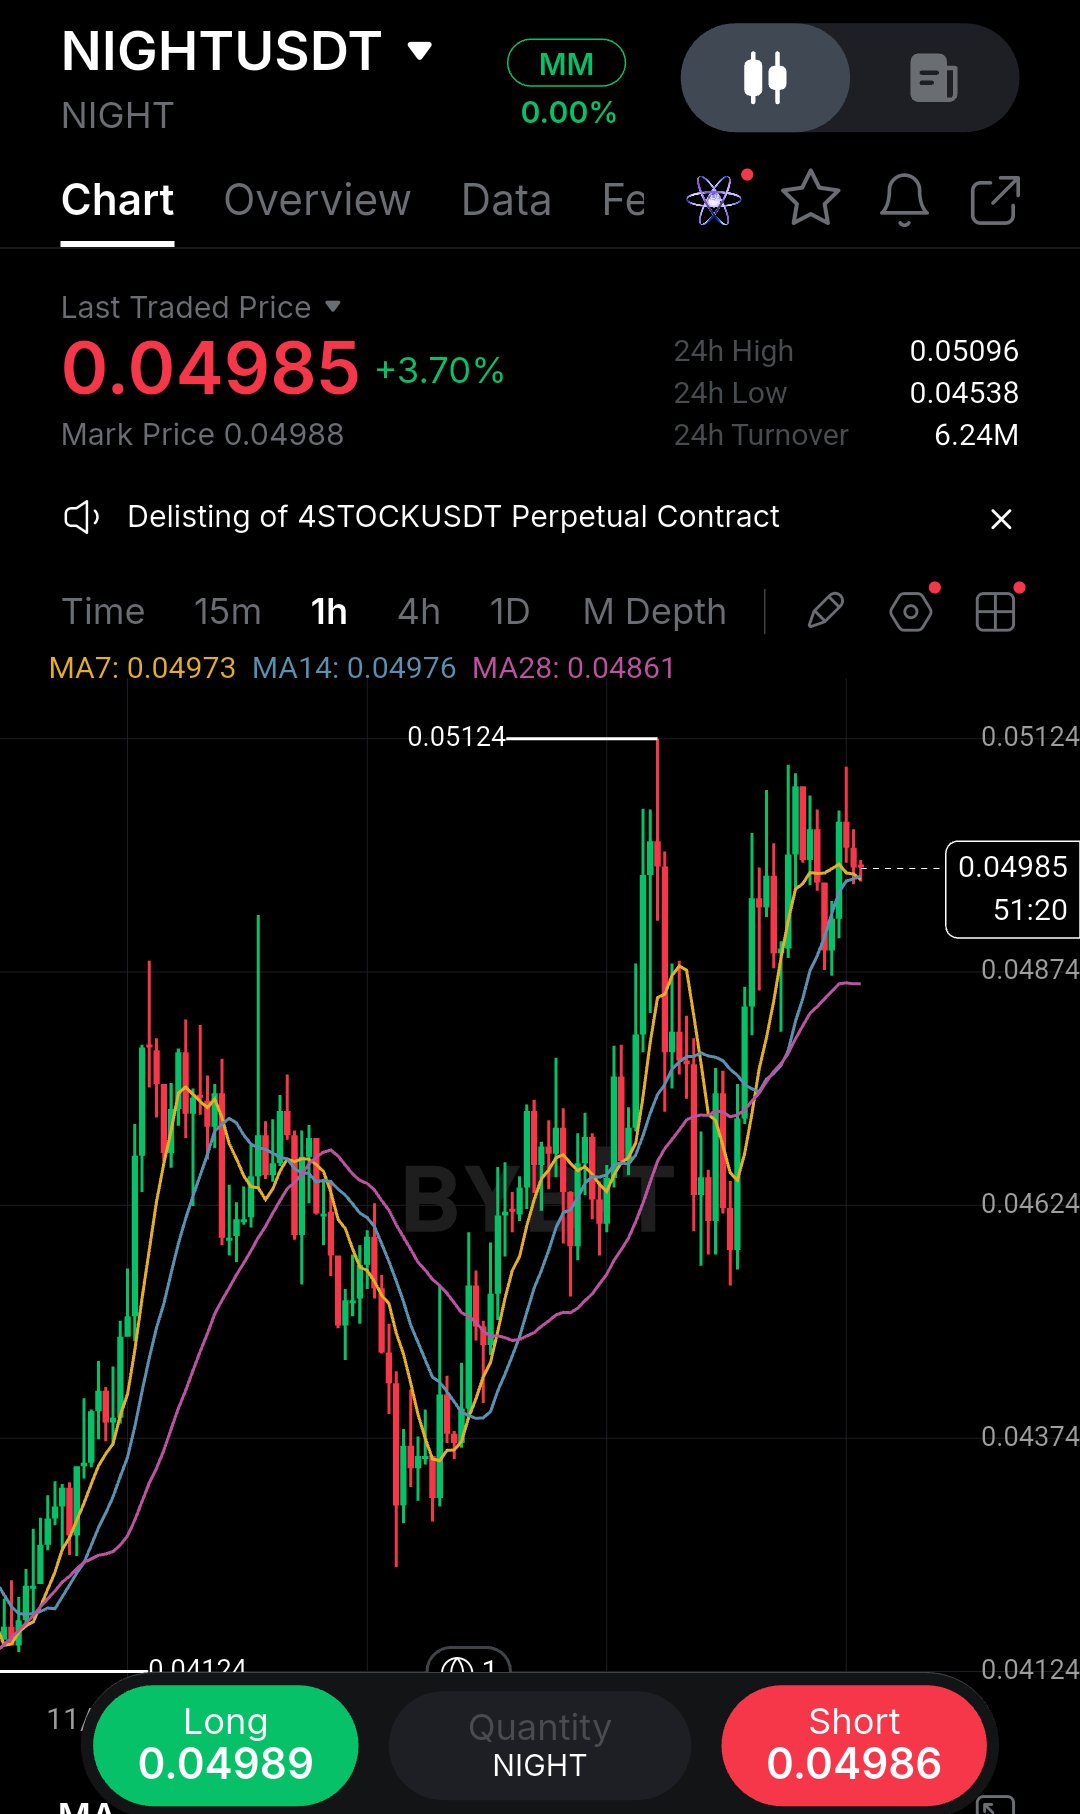
Saya sudah belajar dari pengalaman pahit bahwa membeli tepat di area resistance biasanya berakhir dengan saya menatap candle merah, jadi chart 1 jam NIGHT ini benar-benar menyita perhatian saya. Harga sedang mendorong ke 0,04985, tetapi langsung berhadapan dengan swing high di 0,05124 sementara MA 7 dan 14 mulai mendatar. Cerita sebenarnya ada pada MA 28 yang jauh di bawah pada 0,04861. Momentum mulai melambat, dan pembeli kehilangan dorongan awal mereka. Saya tidak akan mengejar pergerakan vertikal ini. Izinkan saya menguraikan apa yang sebenarnya saya lihat. Pemulihan dari level terendah 0,04124 berlangsung agresif dan bersih, tetapi reli sekarang terhenti tepat di bawah swing high sebelumnya di 0,05124. Itu bukan kebetulan. Level tersebut adalah titik penolakan sebelumnya, dan kemungkinan besar akan kembali berfungsi sebagai area suplai. Sementara itu, MA 7 di 0,04973 dan MA 14 di 0,04976 mulai melengkung ke bawah, yang memberitahu saya bahwa momentum jangka pendek telah mencapai puncaknya. MA 28 di 0,04861 adalah jangkar tren yang sebenarnya, dan masih menanjak, jadi tren naik yang lebih luas belum rusak... hanya saja terlalu panas (overheated). Ini adalah setup pullback klasik yang menunggu untuk terjadi, bukan entri breakout. Apa yang mendukung skenario bullish? Struktur higher low masih utuh, MA 28 miring ke atas, dan level terendah 24 jam di 0,04538 menunjukkan pembeli mempertahankan penurunan secara agresif. Jika harga pullback ke MA 28 dan bertahan, itu akan menjadi setup kelanjutan (continuation) yang sesuai buku teks mengikuti tren. Apa yang mendukung skenario bearish? Level 0,05124 adalah titik penolakan yang jelas, MA jangka pendek mendatar, dan candle saat ini menunjukkan kelelahan di dekat resistance. Jika pembeli gagal di sini, harga bisa berbalik arah dan menguji MA 28 sebagai support atau menembusnya sama sekali. Analisis saya adalah bahwa perdagangan dengan probabilitas tertinggi adalah posisi long saat pullback, bukan mengejar di harga saat ini. Saya lebih memilih menunggu harga datang kepada saya, ke zona 0,04870–0,04900 di mana MA 28 menawarkan dukungan struktural yang nyata. Jika kita mendapatkan candle penolakan bullish yang jelas di sana, saya akan ambil posisi long. Entri: 0,04880 (pada candle konfirmasi) SL: 0,04820 (di bawah MA 28) TP1: 0,05050 TP2: 0,05120 Invalidasi: Penutupan kuat di bawah 0,04820 berarti tren telah rusak dan saya akan mundur. Dulu saya biasa masuk pada candle hijau pertama setelah penurunan, dan itu mengajari saya untuk membiarkan harga membuktikan dirinya sendiri. Jika harga naik tanpa saya, saya menerimanya. Di mana Anda memantau untuk retest? #ByXIMPACT #WSOT2026 $NIGHTUSDT $SPCXXUSDT
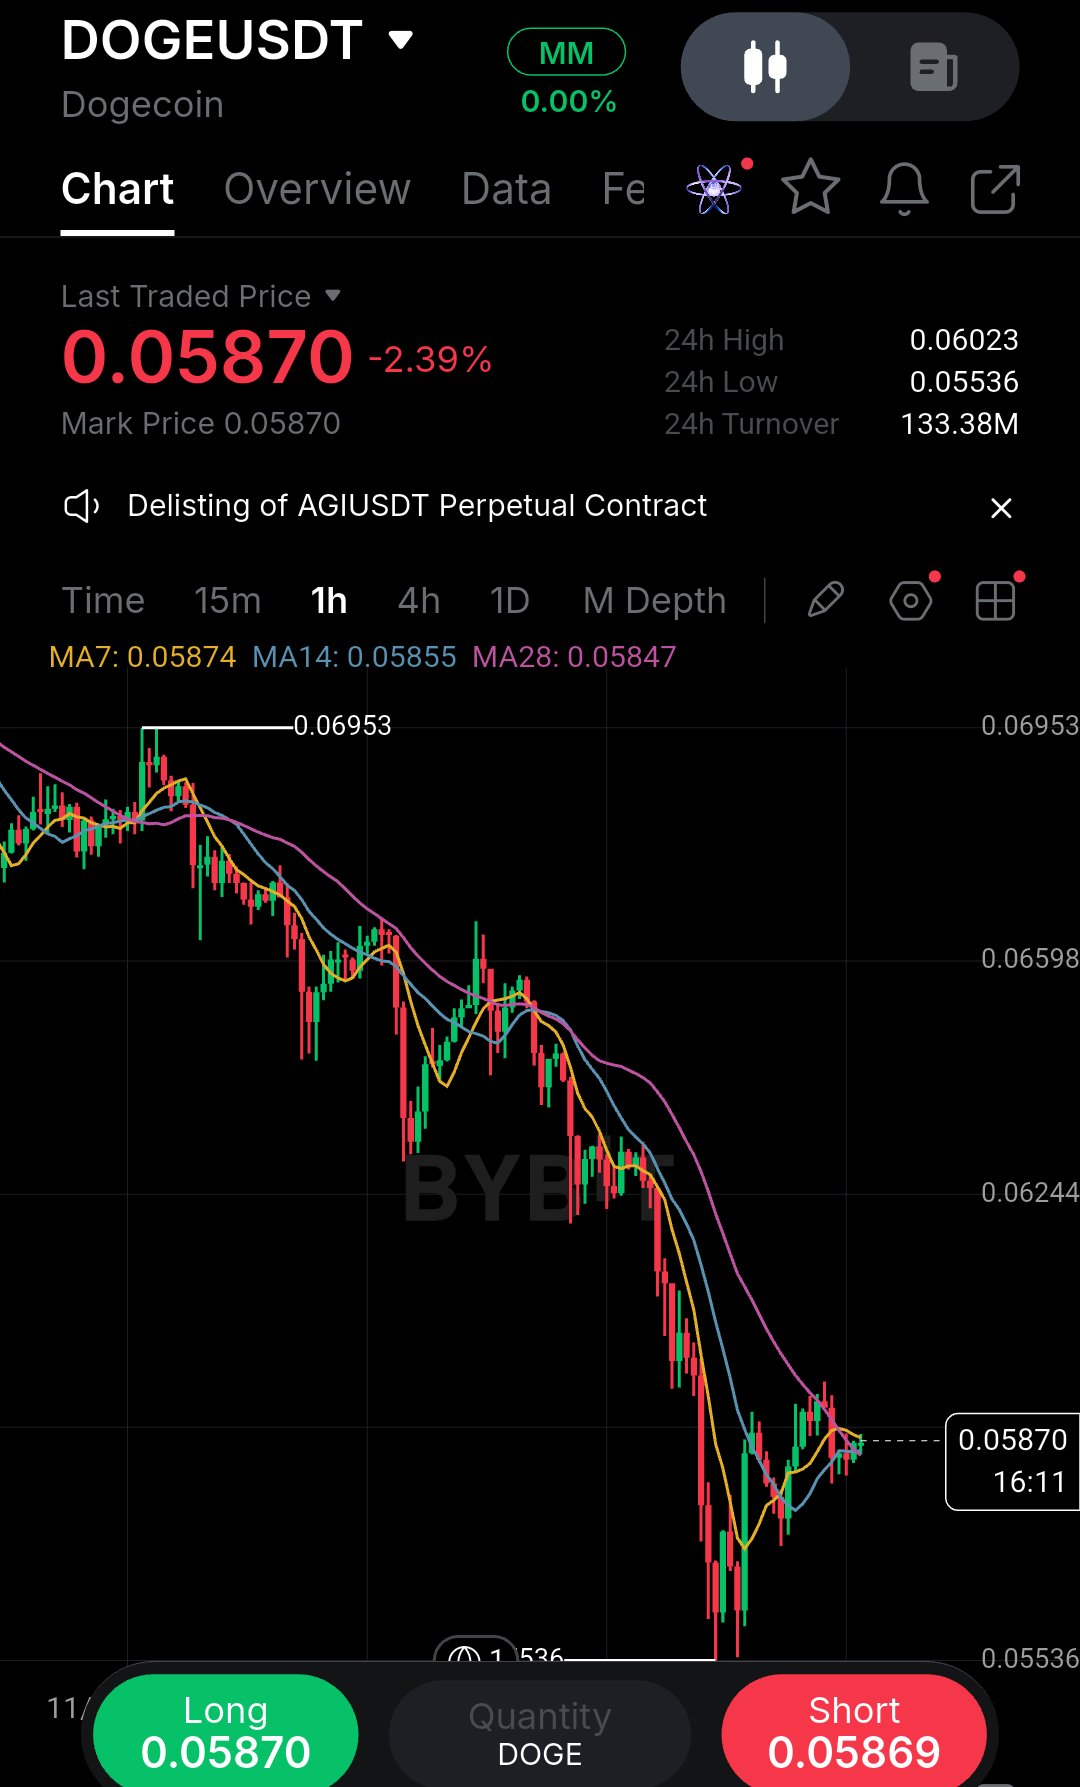
I’ve learned to distrust perfectly clean bounces after a hard dump, so I’m watching this DOGE 1h chart with patience rather than excitement. Price is clinging to 0.0587 after a brutal slide, but the structure is still a series of lower highs. The 7 and 14 MAs are flat, yet the 28 MA at 0.0584 is the real battleground.it’s acting as immediate overhead pressure. I can see the trapped buyers from the 0.062 breakdown, and I have no intention of adding myself to that crowd. Here is the honest read: this is not a reversal yet. It is a bounce inside a downtrend. The drop from 0.06953 to the 0.05536 low was fast and heavy, and fast drops usually leave a trail of unfinished business above. Those buyers who entered near 0.062 are now underwater, and every small rally gives them a chance to exit at break-even or with a smaller loss. That creates a wall of selling pressure right where the 28 MA sits. Until price reclaims that level and holds it, the path of least resistance remains down. What supports the bullish case? The wick at 0.05536 shows buyers defended that zone aggressively, and the short-term MAs are flattening, which means selling momentum is cooling. If price can reclaim 0.0590 with a strong close, the trapped sellers above may start covering, and that fuel could push us toward 0.0620. What supports the bearish case? Everything else. The trend is down, the structure is lower highs, and the bounce is weak relative to the drop. A failure at the 28 MA would likely send price back to test 0.05536, and a break there opens the door to deeper levels. My execution plan is simple. I want a decisive reclaim and close above 0.0590 to confirm buyers are actually stepping in. If that fails, a lower high is the signal to stay out and wait. Entry: 0.0591 (confirmation) SL: 0.0575 (below recent wick) TP1: 0.0620 TP2: 0.0650 Risk/Reward is roughly 1:1.6 to TP1, which is acceptable for a counter-trend bounce but not a trade I would oversize. Invalidation is a clean break below 0.0575.If that happens, the bounce thesis is dead and I step aside. I used to jump on these early reversals and get stopped out by the retest. Now I let the candle close first. Discipline beats FOMO every time. Where’s your line in the sand? #ByXIMPACT #WSOT2026 $DOGEUSDT $SPCXXUSDT
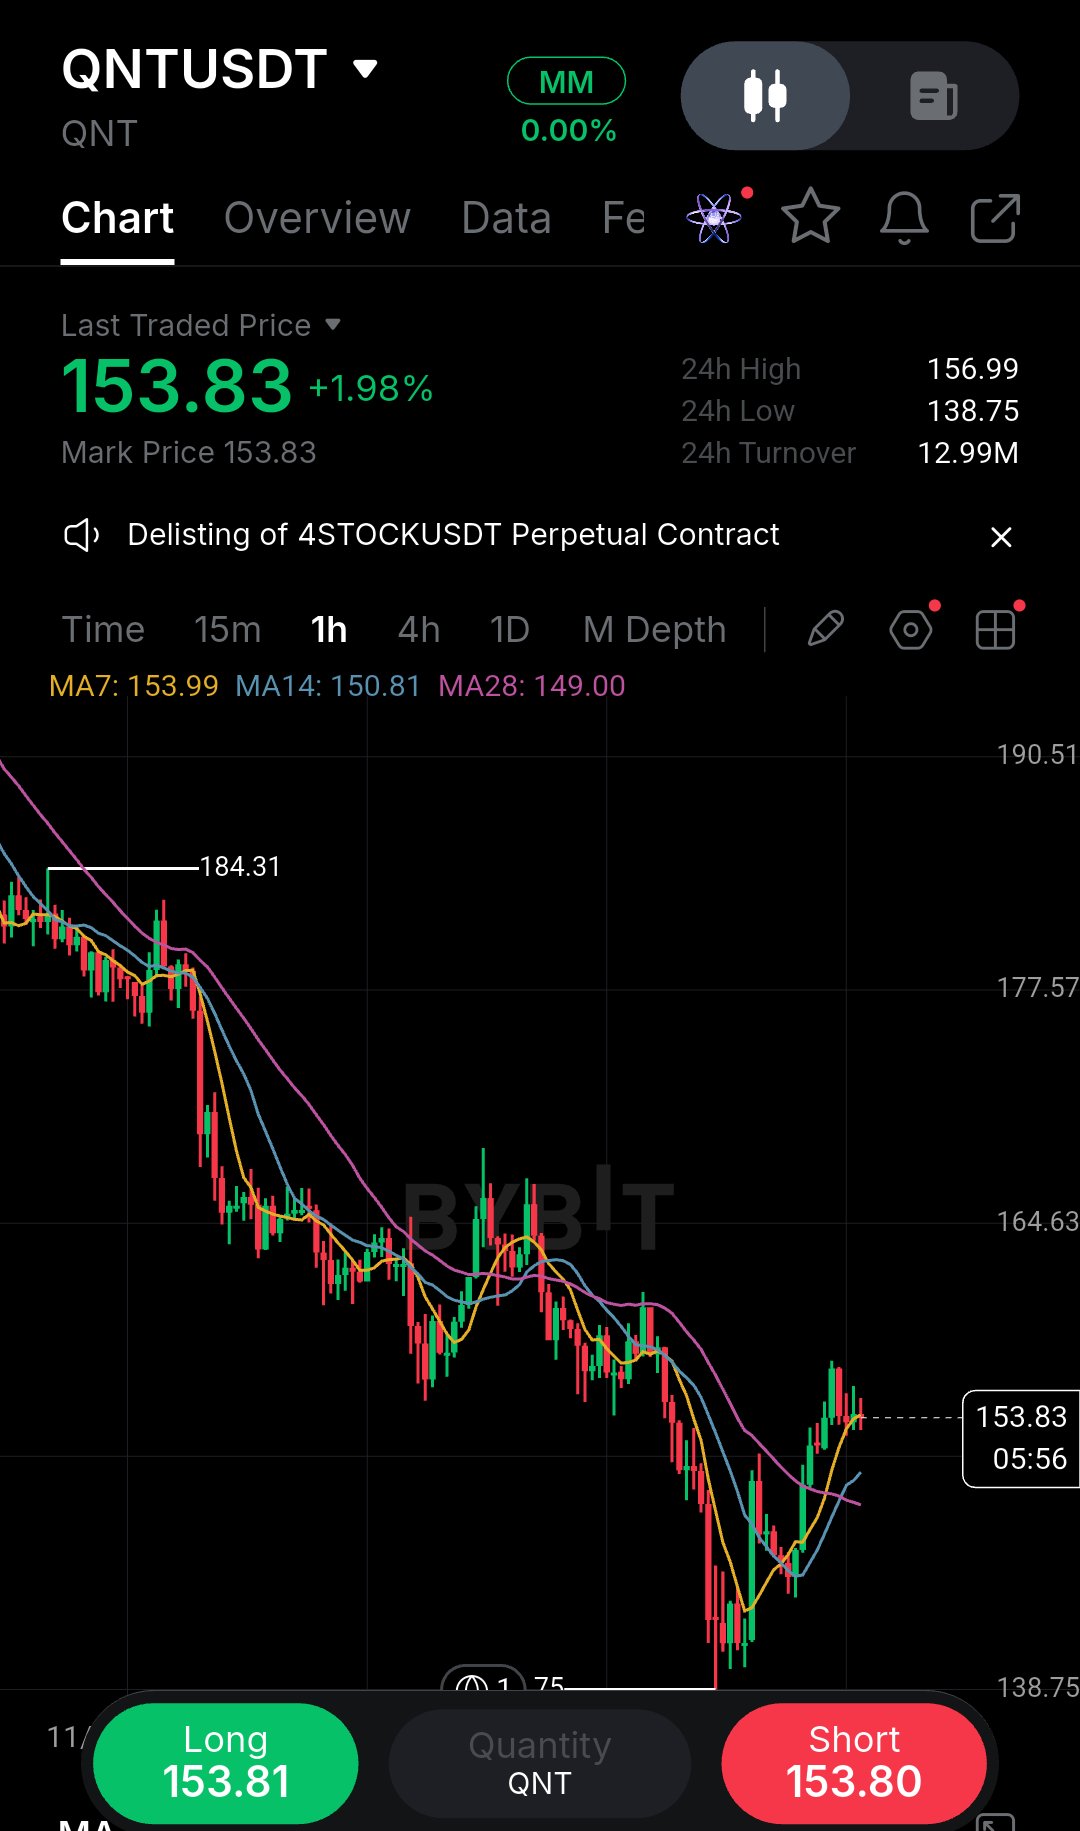
I’ve seen too many traders get chopped up trying to catch falling knives, so I’m approaching this QNT bounce with a lot of caution. Yes, we got a sharp liquidity sweep down to 138.75 and a decent reaction, but look where we are now 153.83, right underneath the MA7 at 153.99. The one thing that matters here is whether this is a genuine reclaim or just a lower high forming in a brutal downtrend. Sellers still control the broader structure, and this little bounce is testing its first real dynamic resistance. The MA14 sits at 150.81 and the MA28 is way down at 149.00, meaning price has already pushed above the slower averages but is struggling to clear the fastest one. That tells me momentum is shifting, but it hasn't fully flipped yet. I’m not stepping in just because it’s green. If price can print a strong 1H close above 154.5, I’ll consider a long for the continuation. Otherwise, I’m just watching. The bearish case is straightforward.This is a classic relief rally after a liquidity grab, and the trend remains down. The bullish case is that the sweep at 138.75 trapped sellers, and the higher low forming now could be the start of a reversal. But "could be" isn't confirmation. I need to see buyers absorb the supply at the MA7 before I risk capital. Entry: Confirmed 1H close above 154.5. SL: 149.0 (below the MA28). TP1: 164.6 (previous breakdown zone). TP2: 177.5 (major structural resistance). The lesson I keep in mind: a bounce isn't a reversal until it proves it can break structure. Don't move your stop if it wiggles. If 154 rejects, I stay flat. How are you playing this retest? #ByXIMPACT #WSOT2026 $QNTUSDT $SPCXXUSDT
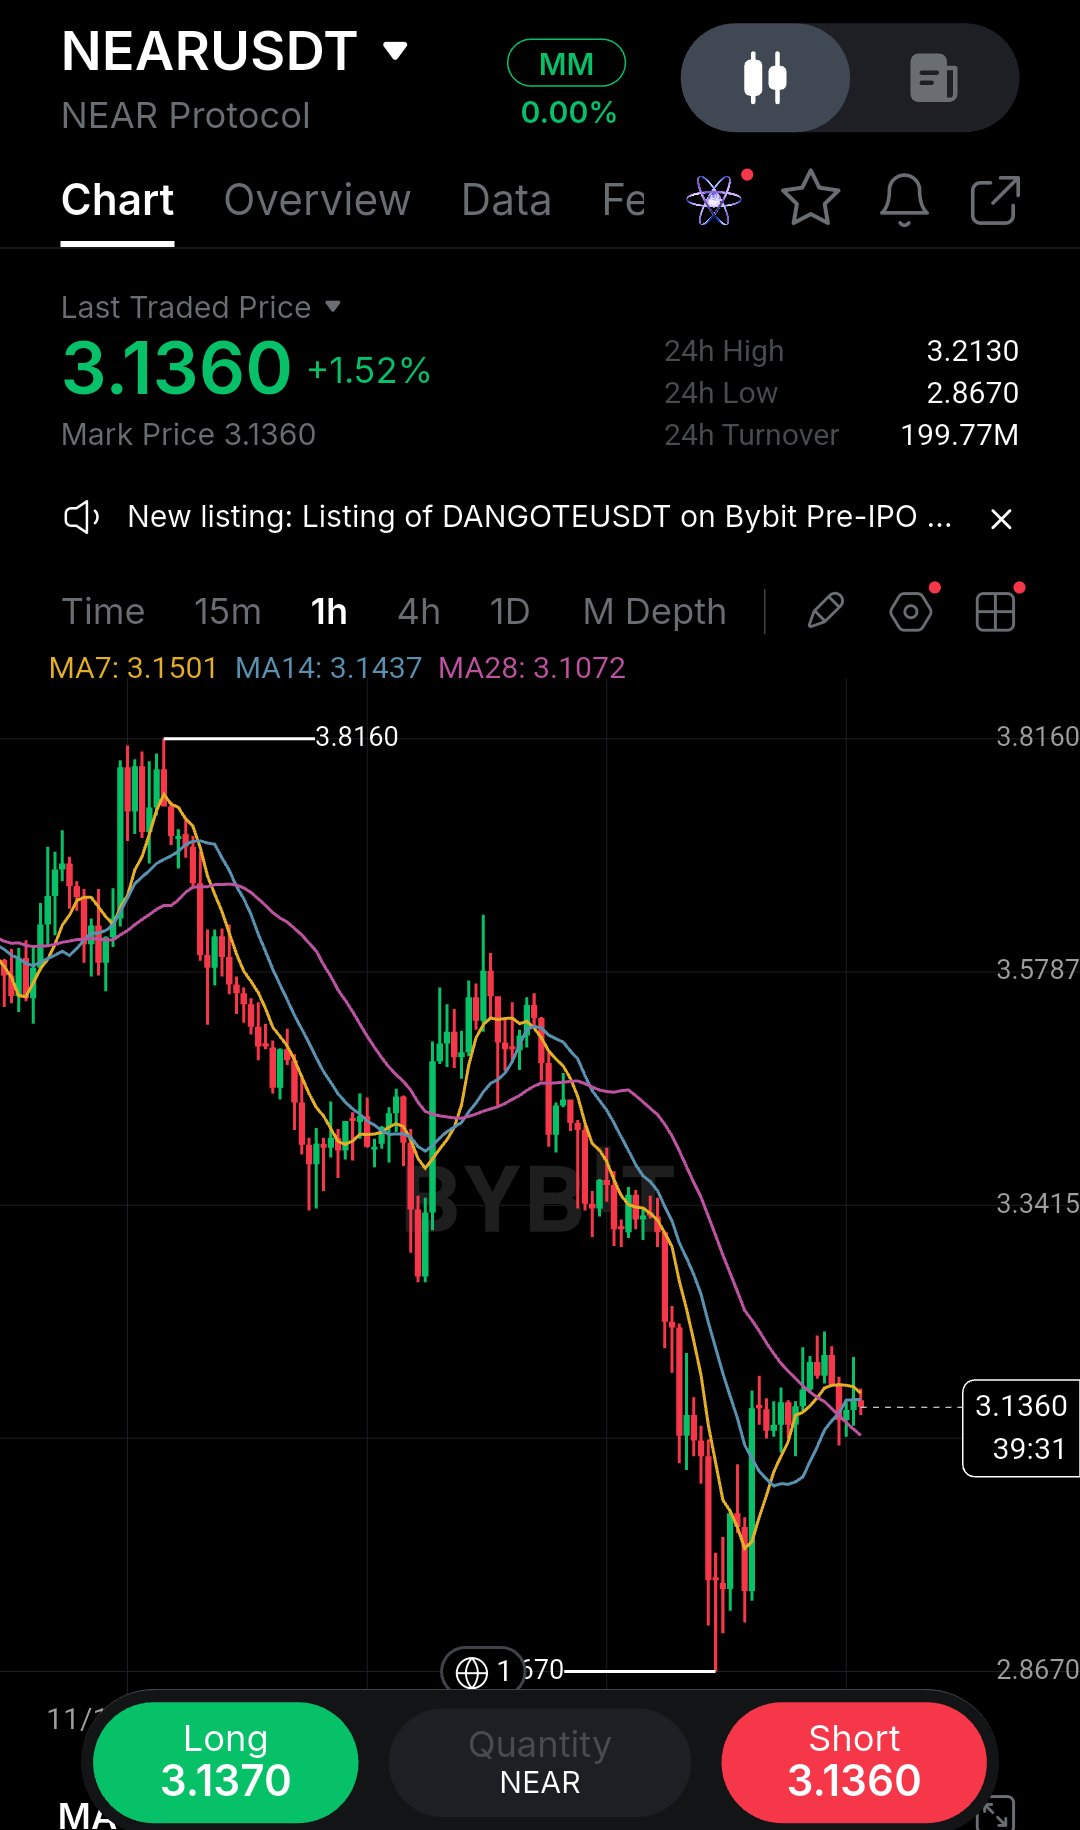
I’ve caught myself forcing longs on charts like this before, so I’m being deliberately patient here. NEAR is printing a clear bounce off the 2.8670 low, but it’s still trapped below the 3.15–3.20 cluster where the shorter MAs sit. Look at the structure carefully. Price sold off hard from the 3.8160 high, printing a series of lower highs and lower lows before finally finding a bid near 2.8670. That low was a sharp wick.A classic liquidity sweep where sellers pushed price below the prior consolidation and then got trapped as buyers absorbed the selling. The bounce we’re seeing now is real, but it’s happening into a very specific supply zone. The 1H chart shows the MA7 at 3.1501, MA14 at 3.1437, and MA28 at 3.1072. Notice how price is currently grinding right into the MA7 and MA14.That’s your first real test. If buyers can’t push through that cluster with conviction, the bounce is just a retest of prior support-turned-resistance. The bearish case is simple: the trend is still down, the moving averages are still sloping lower, and this bounce hasn’t broken any meaningful structure. The bullish case is that the 2.8670 wick shows sellers exhausted, and the higher low forming on the 1H is a potential early reversal signal. But potential isn’t a trade. I need confirmation. That’s why my plan is strict. I’m not entering until I see a clean 1H close above 3.16, which would clear the MA cluster and reclaim the prior support zone. If that happens, the entry is valid. Entry: Only on a confirmed 1H close above 3.16. SL: 3.07 (below the recent swing low and the MA28). TP1: 3.34 (next structural resistance). TP2: 3.58 (previous breakdown zone). Invalidation: A rejection wick at 3.16 followed by a break under 3.10. The lesson I keep learning: a bounce isn’t a reversal until structure confirms it. I’ve chased too many green candles that looked like the bottom, only to watch them fade into the next leg down. Don’t move your stop just because price wiggles. If 3.16 rejects, I’m flat and waiting. What’s your trigger here? #ByXIMPACT #WSOT2026 $NEARUSDT $SPCXXUSDT
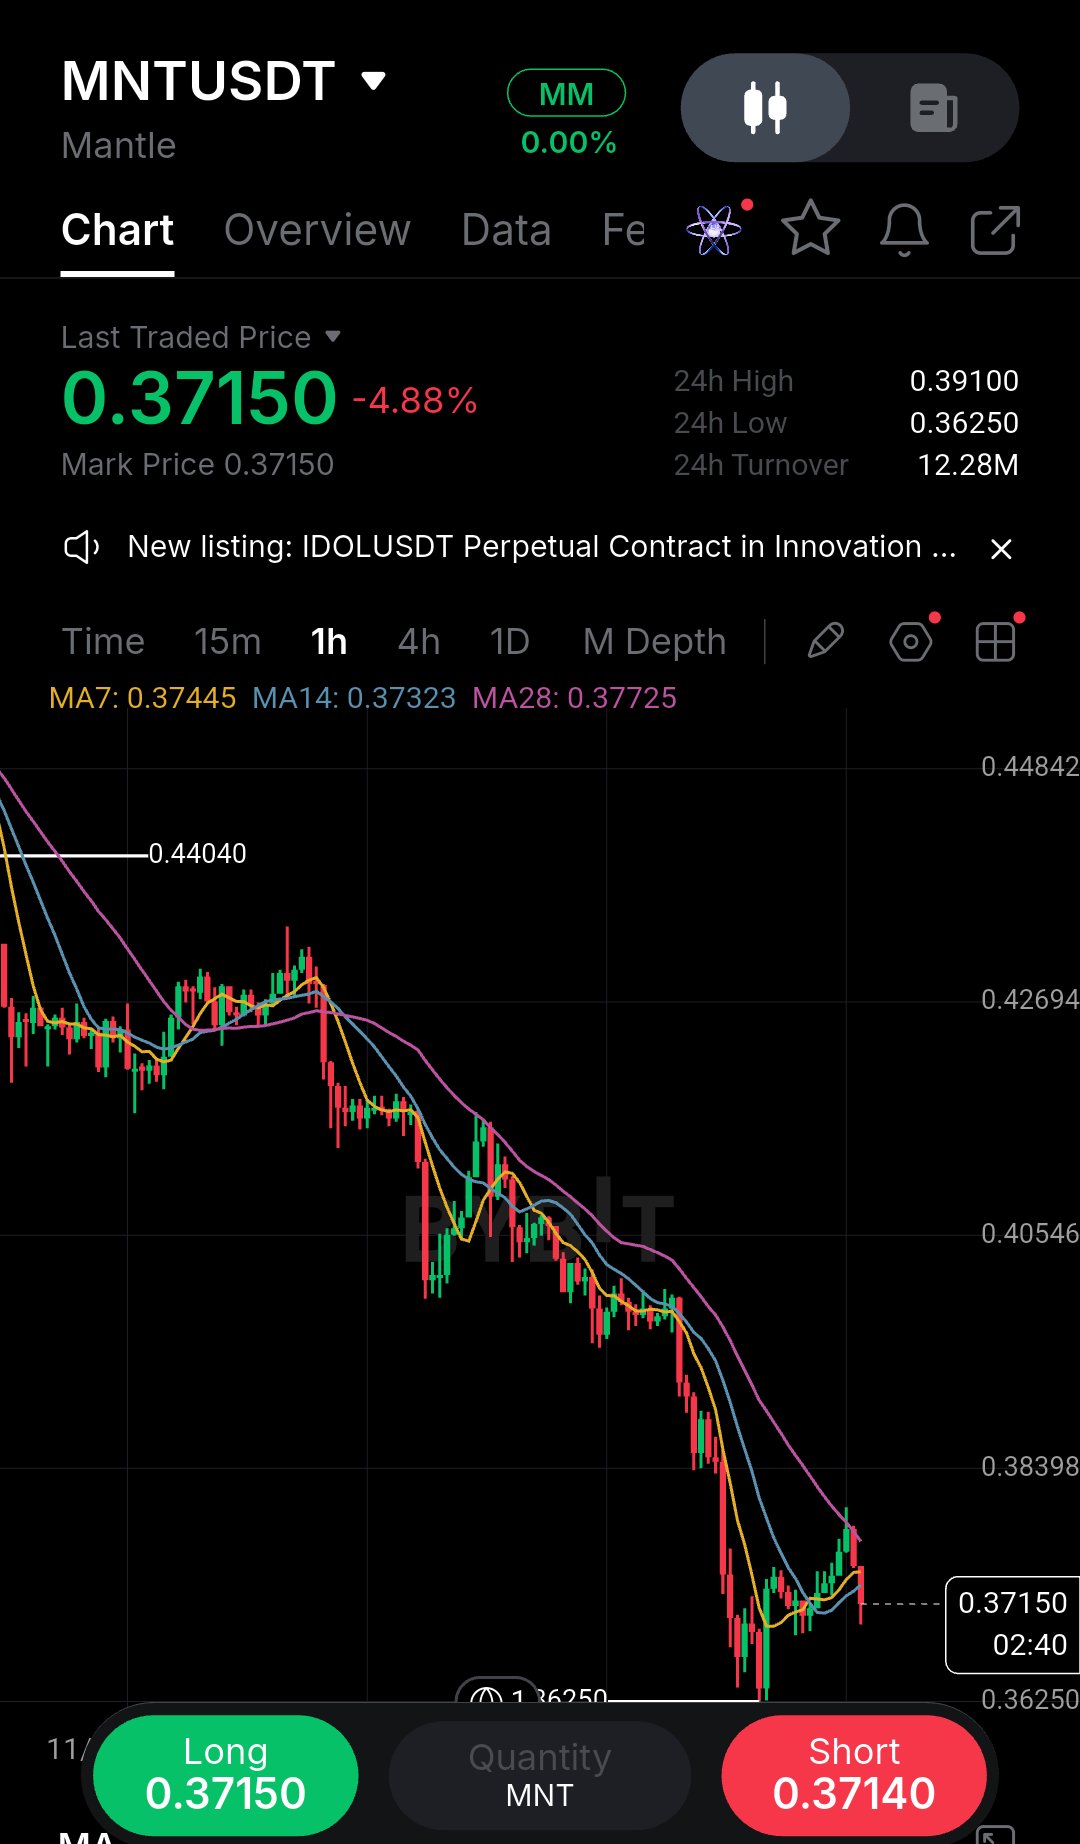
I've learned to be patient with charts that look ready to bounce before they actually confirm. Looking at MNT on the 1h, price is down nearly 5% and bleeding below all key moving averages (MA7, MA14, MA28). The structure is clearly bearish, but the last few candles show a potential liquidity sweep near the 0.3625 low, with buyers stepping in. That wick is interesting, but it is not a reversal yet. I'm not chasing this bounce. The real test is whether price can reclaim the 0.3770 area, where MA28 sits and where prior support turned into resistance. Until that happens, the trend remains heavy, and every green candle is just a bounce inside a downtrend. The 24h high of 0.3910 shows where sellers previously took control, while the 24h low of 0.3625 is the level that matters right now. Entry: Wait for a 1h close above 0.3730. SL: 0.3620, below the recent wick low. TP1: 0.3830, nearest resistance. TP2: 0.3950, structural high. TP3: 0.4050 only if momentum expands. Invalidation: A clean break below 0.3625 without a reclaim cancels the idea. One lesson I've paid for: never treat a green candle as confirmation. I used to enter on the first sign of buying, only to get stopped out as the downtrend resumed. Let the structure prove itself. A bounce becomes a reversal only when price breaks structure and holds above it. Risk management here is simple: if price rejects 0.3730 and rolls over, I stay out. If it closes above and retests, I take the trade with a tight stop. TP1 is where I take partials, not proof the whole trade works. Move the stop only after structure confirms, never because price moves against you. Would you take this bounce, or is the trend too strong to fight? #ByXIMPACT #WSOT2026 $MNTUSDT $NVDAXUSDT
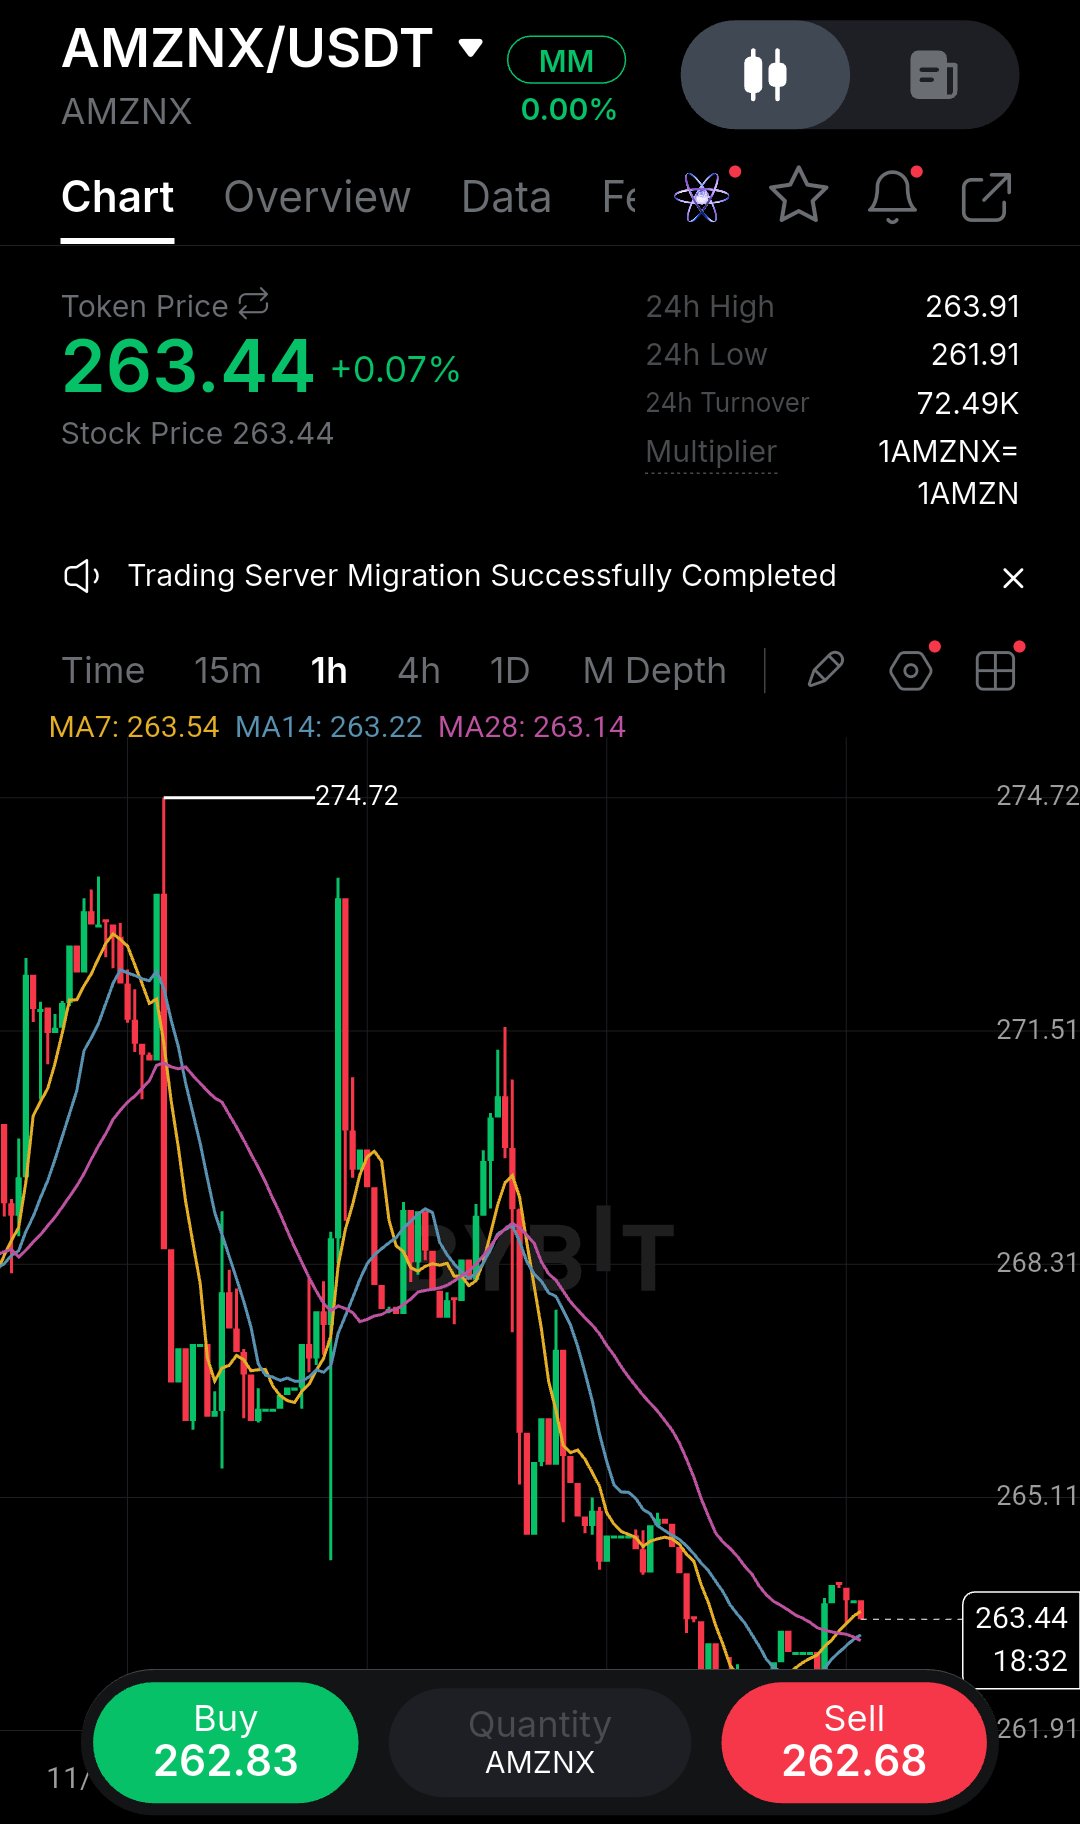
I've been in this exact spot before seeing a brutal downtrend finally pause and trying to guess the exact bottom. AMZNX has bled heavily from 274.72 down to this 263 floor, but the 1h structure is starting to show early exhaustion. The price is resting right at the 263.44 level, and notably, the moving averages are starting to flatten out and compress. This tells me sellers are losing momentum. However, guessing a reversal here is dangerous. I’d rather see buyers actually prove they can push back before risking capital. When a chart looks like this, the temptation is to jump in early and catch the absolute low, but that's a rookie mistake. The market has been in a relentless downtrend, and the bounce we are seeing is still unproven. Notice how the price is hovering around the MA7, MA14, and MA28. These averages are converging, which often indicates a period of consolidation before a larger move. The problem is that the immediate momentum is still bearish, and the recent candles show indecision rather than a strong bullish reversal. If I buy here and the support breaks, I'm immediately underwater and forced to manage a losing position. I’d much rather wait for the market to show its hand. Bias: LONG (on confirmation) Entry: 264.00 – 264.50 (only after a 1h close above the MA cluster) Confirmation: A strong 1h close reclaiming 264.20, signaling a structural shift. SL: 261.90 (just below the 24h low) TP1: 266.00 TP2: 268.50 Invalidation: A 1h candle close below 261.90. If it breaks down instead, don't force it. The key here is to let the market prove itself. If we get that confirmed reclaim, the risk-to-reward becomes much more favorable because the stop loss can be placed tightly below the recent swing low. But if we don't, then the downtrend remains intact, and we simply avoid the trade. This is where patience pays off.There's no shame in missing a move if the setup wasn't confirmed. Wait for the close, respect your invalidation level, and don't let FOMO ruin your risk management. Do you buy the immediate bottom or wait for the trend shift? #ByXIMPACT #WSOT2026 $AMZNXUSDT $SPCXXUSDT
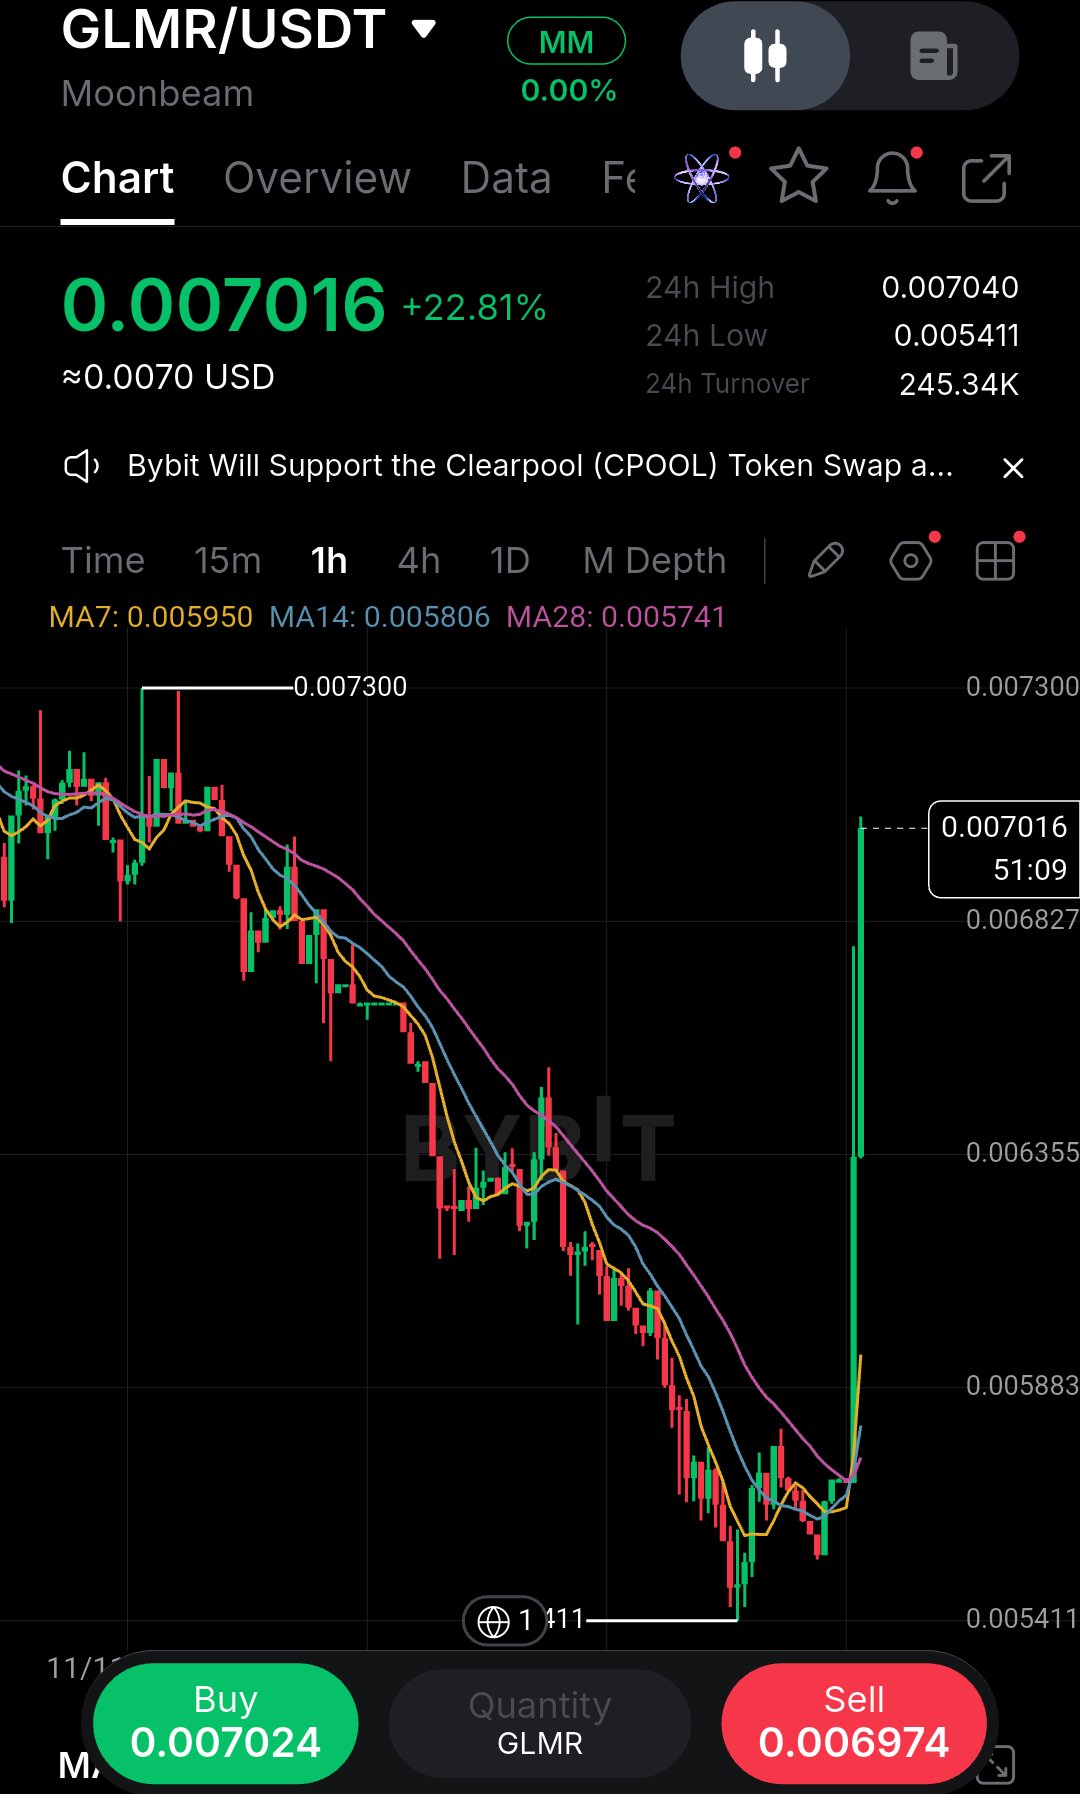
I’ve been burned buying vertical green candles like this before, so my instinct is to wait for the chart to breathe rather than chase the top. GLMR just ripped from the 0.005411 lows straight to 0.007016 on the 1h timeframe, completely clearing the moving averages. The structure shows a massive liquidity sweep, but the problem is the lack of a retest. Shorting this momentum is dangerous, and buying right here is just gambling on a pullback that hasn't happened. When a move is this aggressive, the market rarely gives you a clean entry at the current price. The candles are expanding, volatility is high, and the risk to reward from this exact level is poor because your stop loss has to be incredibly wide to survive normal noise. I’d rather let the initial FOMO cool off. If price pulls back and holds the 0.00650–0.00680 zone (near the moving average cluster), that’s the real confirmation I need. That area represents the origin of the breakout, and a successful retest there proves buyers are still defending the move rather than just chasing a green candle. Entry: 0.00660–0.00680 (on a confirmed hold) SL: 0.00620 (below the local structure) TP1: 0.00730 (prior swing high) TP2: 0.00780 Invalidation: A 1h close below 0.00635. My early mistake was always entering before confirmation. If we lose 0.00635, the pump was likely a trap, and trapped buyers will provide the liquidity for the next leg down. Do you wait for the retest or trade the breakout? #ByXIMPACT #WSOT2026 $GLMRUSDT $SPCXXUSDT
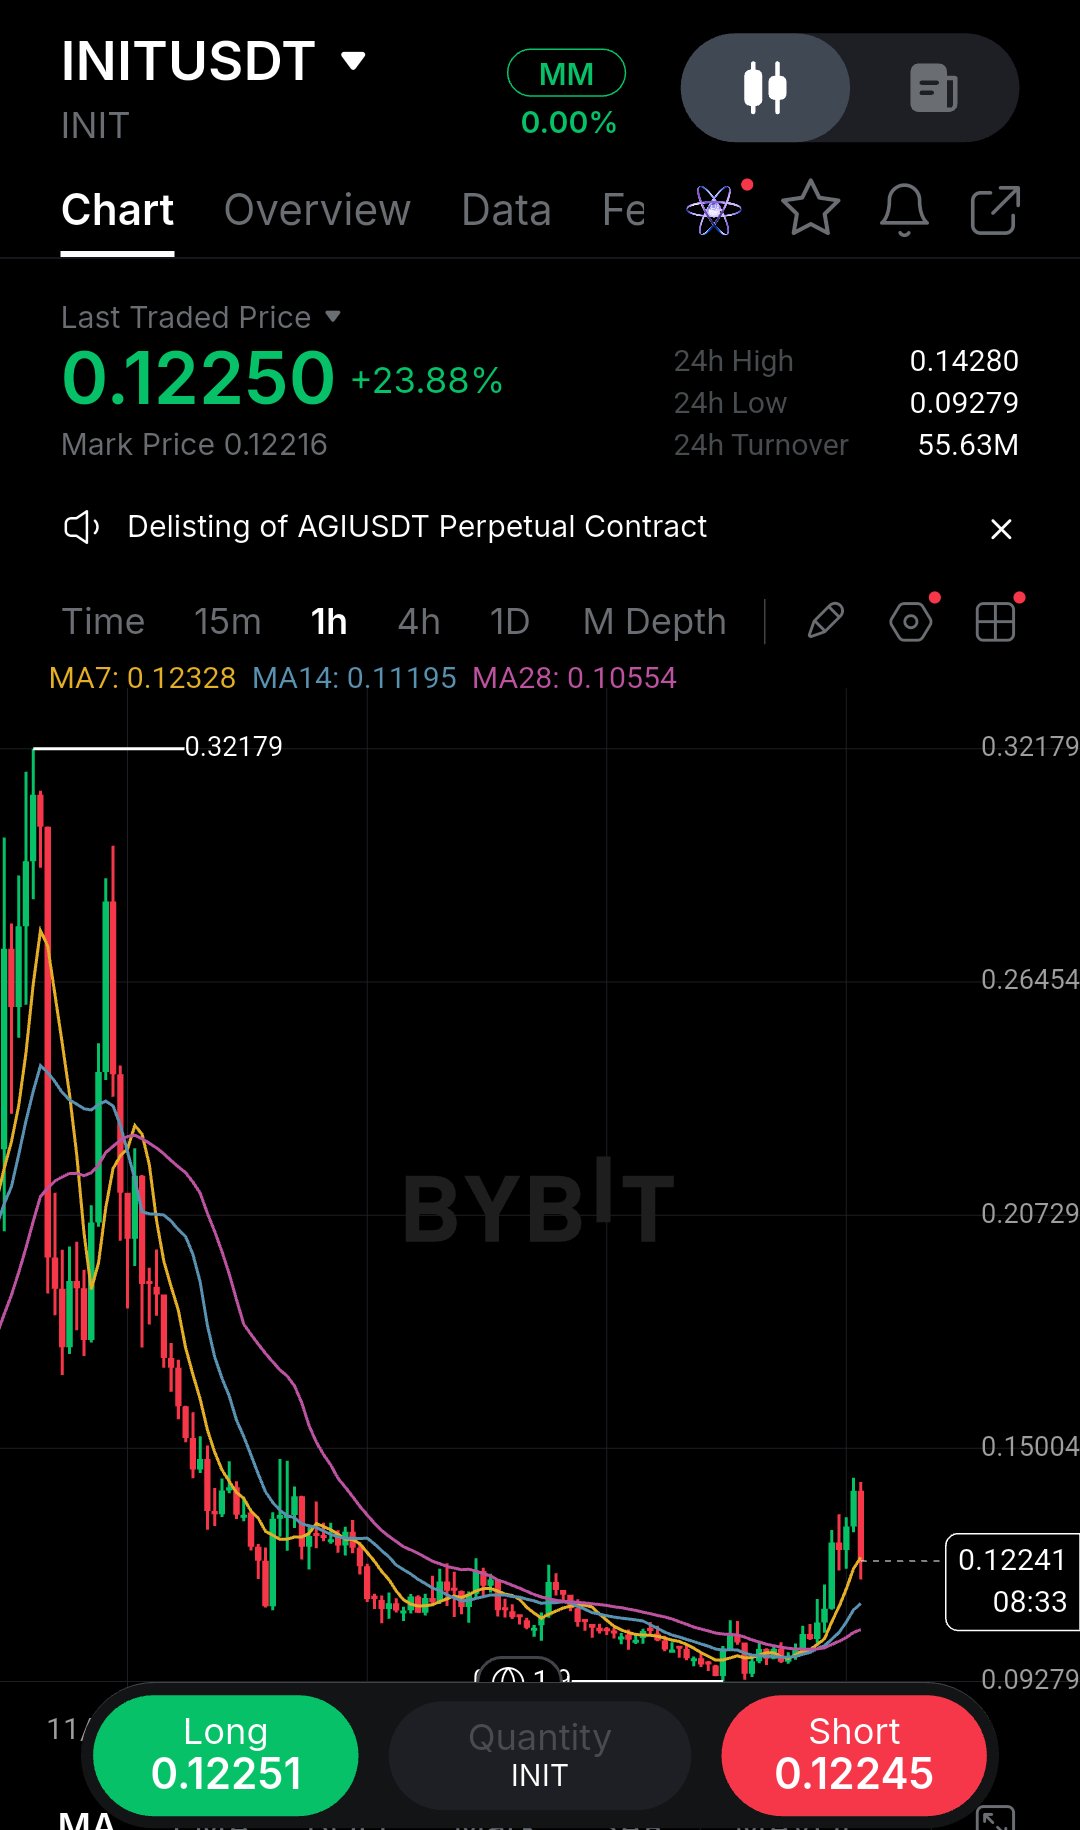
Seeing a chart finally print a strong green candle after a brutal downtrend always makes me check the higher-timeframe context before hitting buy. On this INIT 1h chart, price is up nearly 24% from the $0.09279 low, but look at the wreckage above. We are still trading way below the massive $0.32179 peak, and this current bounce is slamming directly into the MA14 resistance at $0.11195. It's easy to get distracted by the green candles, but perspective is everything in this game. What catches my eye is the pure momentum of this V-shaped recovery. It’s aggressive, but buying right into the MA cluster is usually how you get trapped. I’ve done it before buying the first green candle after a massive dump, only to watch it reject and roll over. The structure is still technically bearish overall, so I’m treating this as a potential relief rally until proven otherwise. The market has a way of luring in impatient buyers right before the next leg down, and I'd rather not be one of them. I’d rather wait for a clean retest. If price pulls back to the $0.1050–$0.1100 zone and holds above the MA28 ($0.10554), that gives us a defined higher low to trade against. The part I like about this approach is that it forces me to be patient. If the bounce is real, it will give us a structural entry. If it’s a fakeout, we avoid the drawdown entirely. Trade Plan Bias: WAIT (Long on pullback) Entry: $0.1070 – $0.1100 Confirmation: 1h bullish rejection candle off the MA28/MA14 cluster SL: $0.10100 (below the MA28) TP1: $0.12328 (MA7) TP2: $0.13500 The main risk is a complete rejection at the MA14, sending us back to the lows. If we lose $0.105 with momentum, the bullish thesis is dead, and I’m out. Do not chase the current candle; wait for the structure to confirm. Are you waiting for the retest, or fading this bounce? #ByXIMPACT #WSOT2026 $INITUSDT $HYPEUSDT
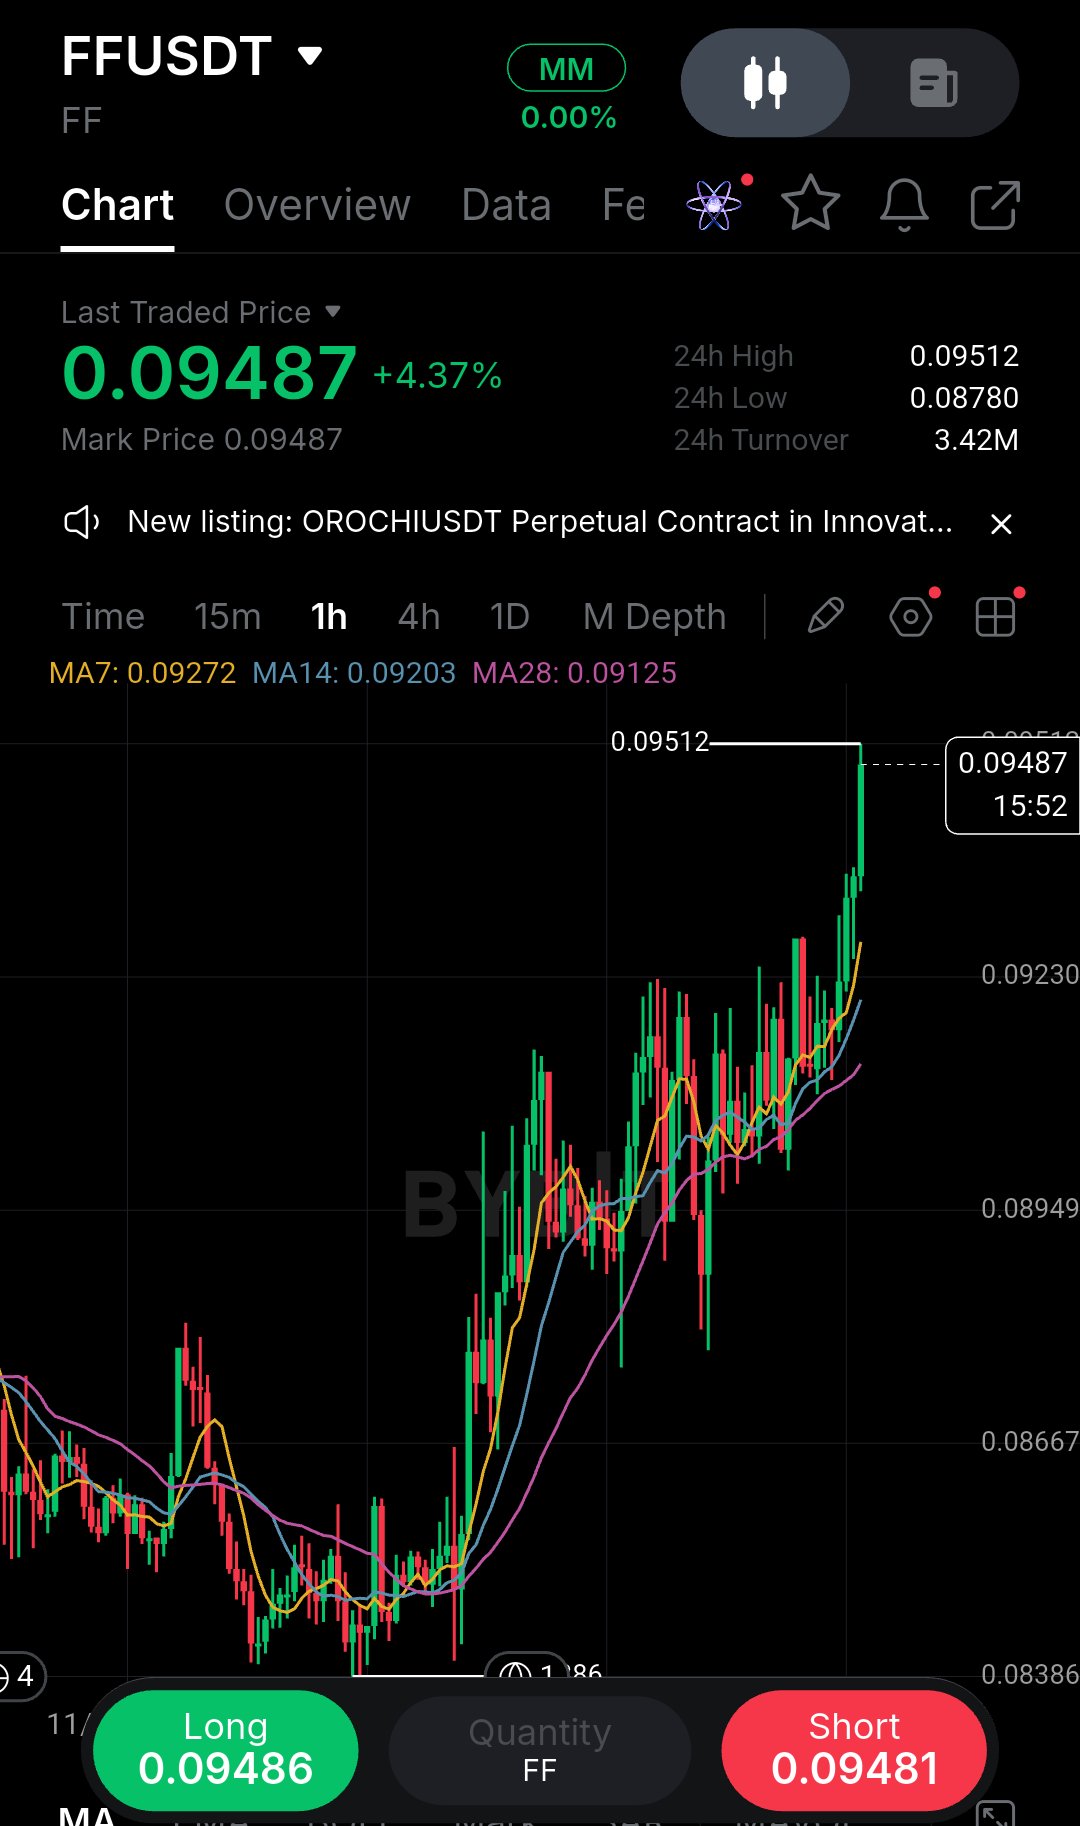
Saya sudah belajar untuk berhati-hati dengan candle hijau vertikal yang terlihat siap sebelum benar-benar terkonfirmasi. Melihat FF pada timeframe 1 jam, trennya jelas bullish, tetapi harga sedang bergerak lurus menuju level tertinggi $0.09512, dan beberapa candle terakhir terlihat agresif. Yang menarik perhatian saya bukan hanya momentum hijaunya. Melainkan celah besar antara harga saat ini dan moving average. MA7 berada di $0.09272, tapi MA14 berada jauh di bawah di $0.09203, dan MA28 bahkan lebih rendah lagi di $0.09125. Itu gap yang besar. Jika Anda mengambil posisi long sekarang, Anda sedang mengejar pergerakan yang sudah terlalu jauh dengan stop loss yang jauh. Saya pernah melakukannya sebelumnya, dan biasanya berakhir dengan stop-out yang ketat saat harga terkoreksi sejenak. Pasar punya kebiasaan menghukum mereka yang terlambat masuk (chaser). Ketika chart merentang terlalu jauh dari support dinamisnya, risk-to-reward untuk entri baru menjadi buruk. Anda pada dasarnya berharap candle terus naik tanpa retracement, yang mana itu adalah perjudian, bukan strategi. Analisis saya adalah menunggu retest. Jika ini adalah breakout sungguhan, harga akan kembali ke zona $0.0920–$0.0930 untuk menguji support MA, membersihkan posisi long yang terlambat masuk, dan memberi kita entri yang bersih. Hal yang saya sukai dari setup ini adalah moving average yang tersusun dalam urutan bullish yang sempurna (MA7 > MA14 > MA28), yang mengonfirmasi tren. Tapi itu tidak berarti saya harus beli di pucuk. Rencana Trading Bias: TUNGGU (Long saat pullback) Zona Entri: $0.0920 – $0.0930 Konfirmasi: Candle penolakan bullish 1H pada cluster MA Stop / Invalidation: $0.09050 (di bawah MA28 dan konsolidasi baru-baru ini) TP1: $0.09510 (level tertinggi saat ini) TP2: $0.09800 Invalidation: Penutupan candle 1H di bawah $0.09125 membatalkan struktur. Risiko terbesar adalah FOMO. Jangan mengejar candle ini. Jika harga naik ke $0.098 tanpa pullback, biarkan saja. Terimalah trade yang terlewat dan lanjut ke peluang berikutnya. Apakah Anda menunggu retest, atau mengambil posisi short di sini? #ByXIMPACT #WSOT2026 $FFUSDT $TSLAXUSDT
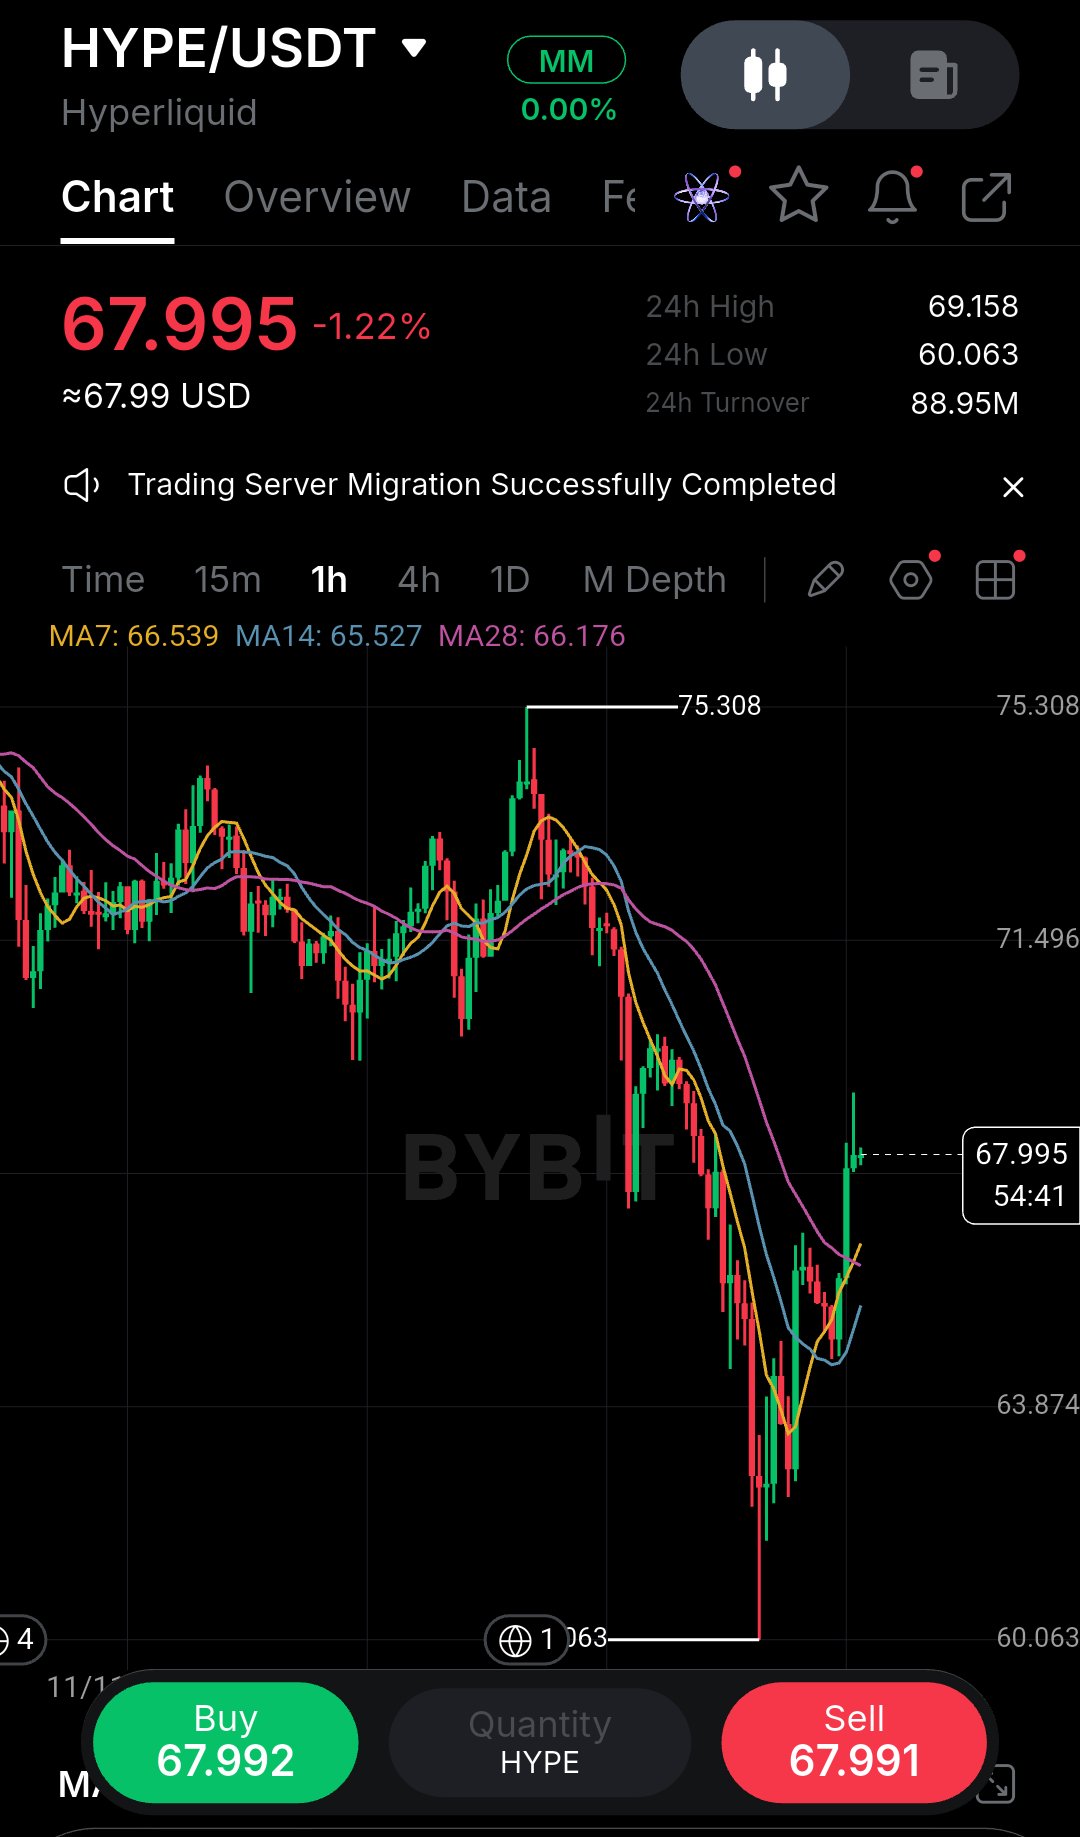
Saya pernah rugi sebelumnya karena mencoba menangkap 'pisau jatuh' hanya karena candle terlihat besar dan hijau. Melihat HYPE pada chart 1 jam, struktur pasar secara fundamental masih bearish meskipun ada pantulan kuat dari level terendah $60,063. Yang menarik perhatian saya adalah bagaimana harga saat ini menghantam area $68–$69, yang sejajar sempurna dengan MA28 di $66,17 dan area breakdown sebelumnya. Menurut pandangan saya, pasar baru saja menyapu likuiditas di bawah, dan sekarang kita melihat reli pelepas lelah (relief rally) menuju suplai overhead yang berat. Swing high di $75,308 tetap menjadi jangkar untuk tren turun ini. Saat ini, ini terlihat seperti reli pelepas lelah jangka pendek, bukan pembalikan arah yang terkonfirmasi. Saya tidak akan mengejar posisi long di sini. Sebaliknya, saya menunggu penolakan dari resistance ini atau pullback untuk melihat apakah level terendah bertahan. Jika harga menolak zona $69 ini dan kembali turun di bawah MA14 ($65,52), saya akan mencari posisi short. Rencana Trading Bias: SHORT (setelah konfirmasi) Zona Entry: $67,50 – $68,50 (setelah penolakan terkonfirmasi) Konfirmasi: Candle penolakan bearish 1 jam (seperti shooting star) atau penutupan kembali di bawah $66,50 Stop / Invalidation: $69,50 (di atas harga tertinggi baru-baru ini) TP1: $64,00 TP2: $60,50 (retest level terendah) R:R: ~1:2 ke TP2 jika entry terisi di dekat $68,00 Risiko yang paling saya khawatirkan adalah penembusan struktur yang sebenarnya di atas $69 yang menjebak para trader short lebih awal. Jika kita mendapatkan penutupan 1 jam yang kuat di atas level itu, saya akan membatalkan ide ini dan menepi. Saya juga akan membatalkan trade jika harga hanya bergerak sideways di sini tanpa penolakan yang jelas, kesabaran adalah kuncinya. Secara pribadi, saya tidak akan masuk sampai saya melihat para bear kembali beraksi. Apakah Anda menunggu reclaim level $70, atau melakukan fade pada pantulan ini? #ByXIMPACT #WSOT2026 $HYPEUSDT $SPCXXUSDT
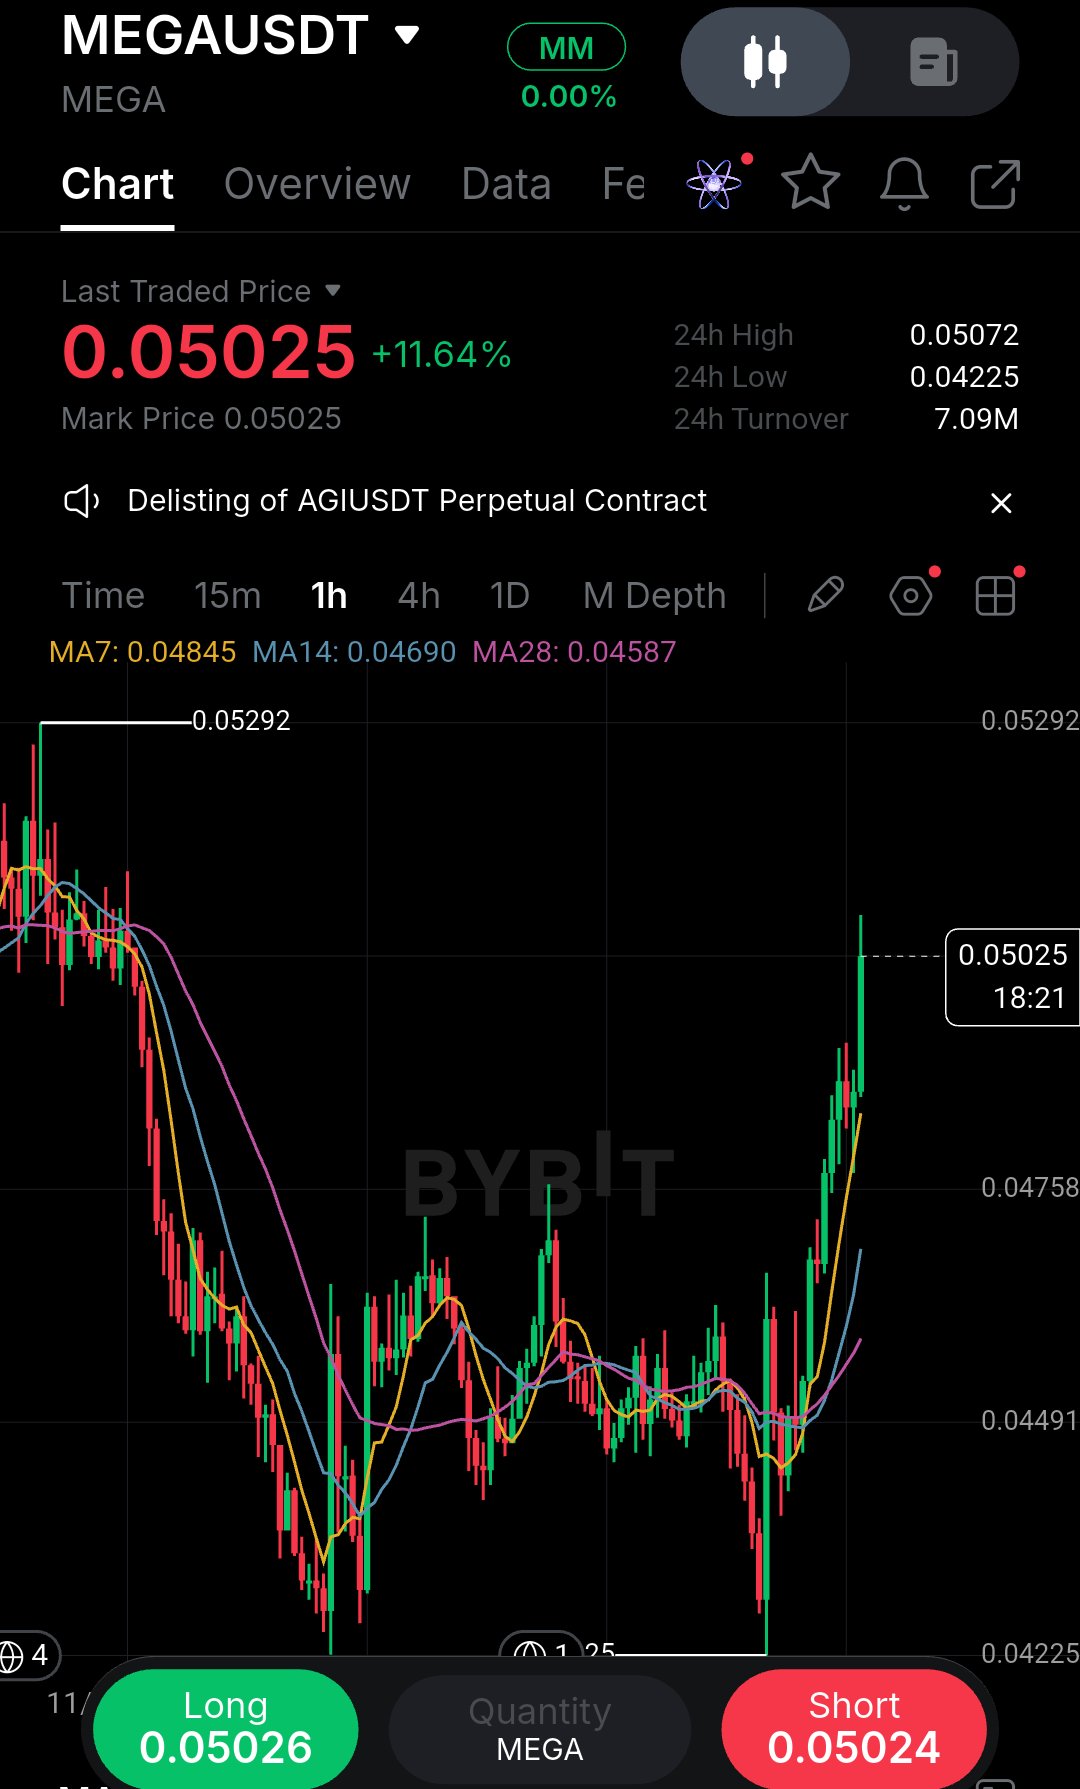
Saya pernah rugi mengejar candle hijau seperti ini sebelumnya, jadi saat melihat chart yang naik vertikal tajam seperti ini, insting saya adalah menunggu koreksi daripada masuk di harga tertinggi. MEGA baru saja melesat dari level terendah $0,042 ke $0,050 dalam pergerakan parabolik yang hampir vertikal pada timeframe 1H. Ekspansi agresif semacam ini memang menarik, tetapi meninggalkan gap struktural yang besar di belakangnya, dan pembeli yang terlambat sangat rentan terhadap pembalikan arah (mean-reversion) yang mendadak. Walaupun momentum saat ini jelas bullish, ini adalah jebakan FOMO klasik. Harga sudah jauh dari moving average 7, 14, dan 28, yang semuanya tertinggal jauh di area $0,045–$0,048. Saat harga sudah terlalu jauh dari support dinamisnya, gravitasi biasanya menang dalam jangka pendek. Membeli di sini adalah setup risk-reward yang buruk karena Anda mempertaruhkan retracement yang dalam hanya untuk mengejar beberapa sen terakhir dari kenaikan. Chart ini memang telah mencetak level tertinggi 24 jam baru di $0,05072, tetapi tidak ada basis, tidak ada higher low, dan tidak ada support yang teruji di bawah harga saat ini. Saya ingin melihat retracement yang sehat agar moving average bisa mengejar dan pasar dapat mencerna pergerakan ini. Jika pembeli masuk dan mempertahankan area $0,048 dengan idealnya membentuk higher low, di situlah saya akan mencari posisi long yang terukur. Jika harga terus naik tanpa retest, saya akan melewatkannya begitu saja. Melewatkan trading tidak merugikan apa-apa; mengejar entry yang buruk justru menguras modal. Rencana Trading (WAIT/TUNGGU) · Bias: Netral / Tunggu · Long Entry: $0,0475 – $0,0485 (retest dari klaster MA 7/14) · Konfirmasi: Wick penolakan 1H atau candle bullish engulfing pada saat retest · Stop / Invalidation: $0,0465 (penembusan support struktural lokal) · TP1: $0,0505 (level tertinggi lokal terkini) · TP2: $0,0529 (major swing high) · R:R: Sekitar 1:2,5 berdasarkan entry retest Risiko utama di sini adalah kegagalan total dari reli tersebut. Jika harga menembus level $0,046 tanpa menunjukkan tanda-tanda permintaan, tren kemungkinan besar berbalik, dan uang momentum yang masuk cepat sudah keluar dari pasar. Kesabaran adalah kunci; tunggu struktur kembali reset dan memberikan entry yang tepat. Apakah Anda menunggu koreksi (pullback), atau Anda membeli saat breakout? #ByXIMPACT #WSOT2026 $MEGAUSDT $SPCXXUSDT
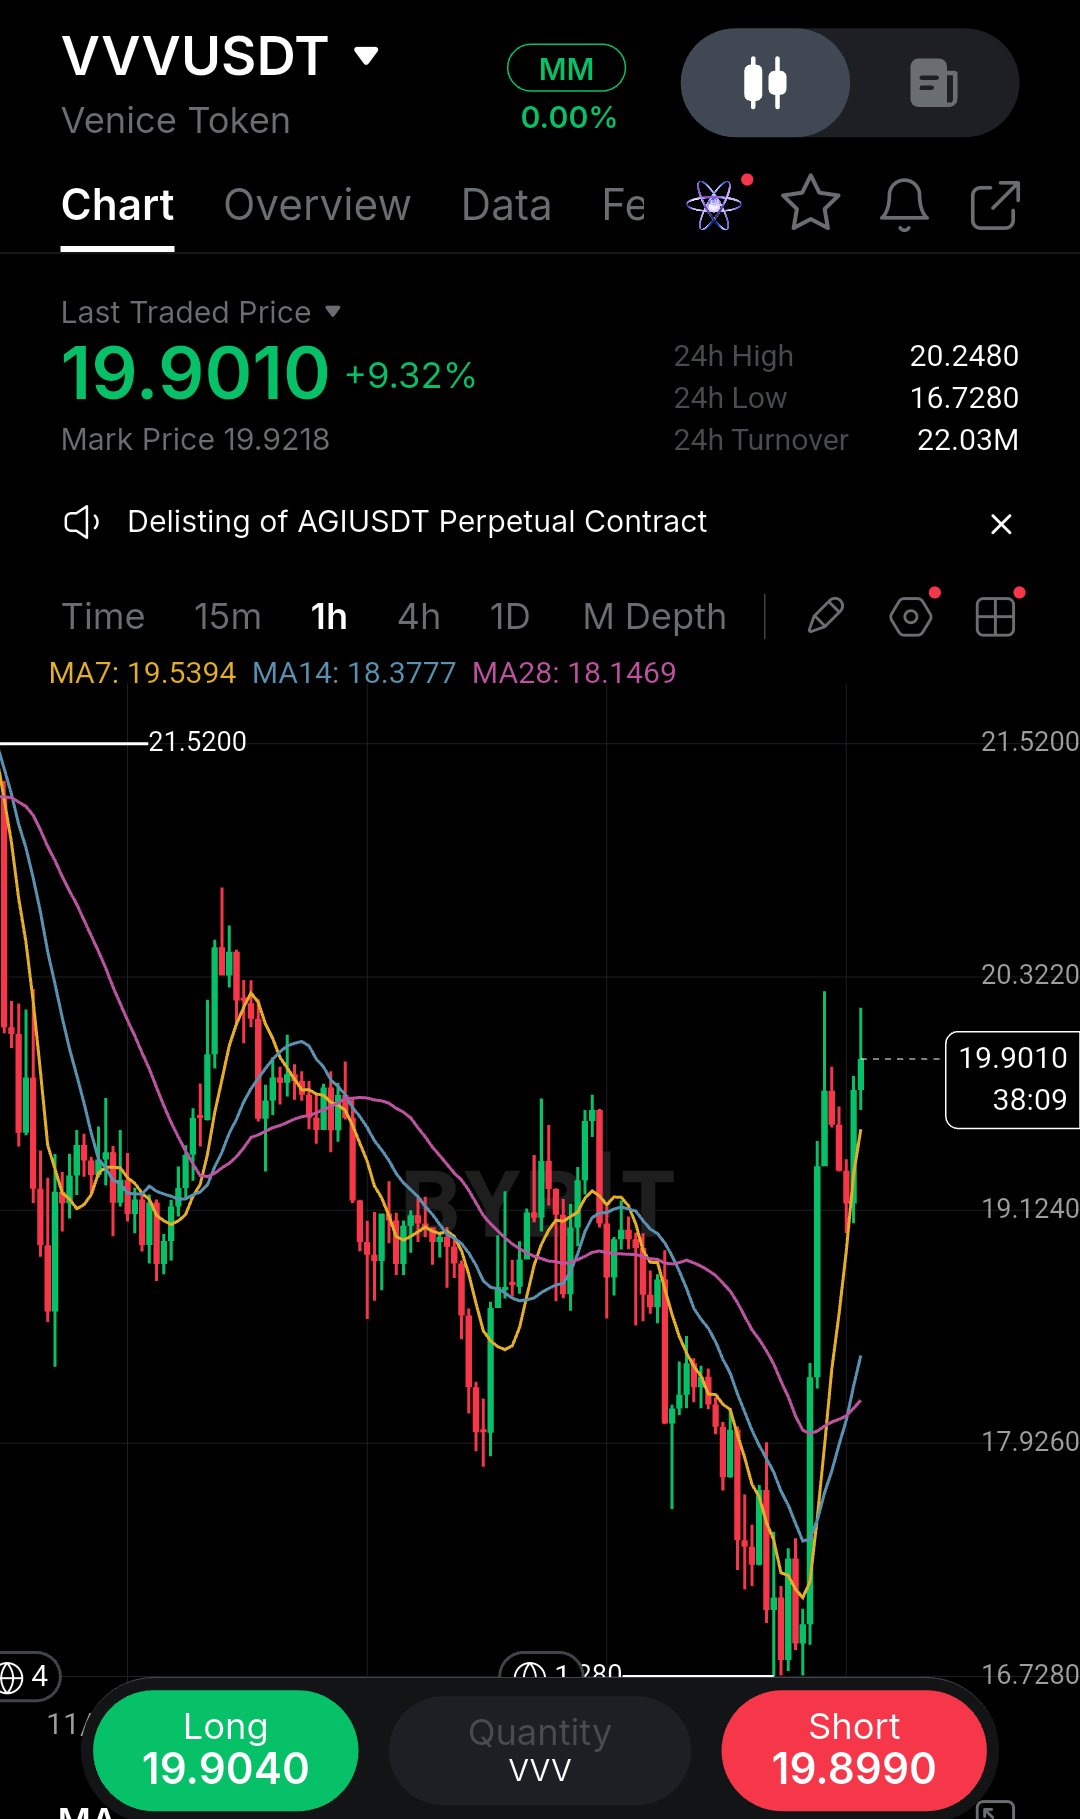
Yang menarik perhatian saya pada grafik 1J VVVUSDT ini adalah betapa kuatnya *bounce* (pemantulan) baru-baru ini. Setelah turun ke *local low* di $16,72, harga mencetak pemulihan berbentuk V yang masif, langsung melesat kembali untuk menguji area $20,20. Ini adalah jenis pergerakan impulsif yang agresif yang memaksa para trader untuk membuat keputusan emosional—entah mengejar *candle* hijau karena FOMO atau mencoba melakukan *short* di puncak tanpa konfirmasi. Saat ini, struktur pasar sedang dalam fase *retracement* yang berat setelah impuls tersebut. Harga sedang mendingin di $19,90, bertahan tepat di atas *moving average* 7-periode ($19,53), sementara MA 14 dan 28 membuntuti di bawahnya masing-masing di $18,37 dan $18,14. *Moving average* tersebut sedang melebar, yang umumnya merupakan tanda *bullish*, tetapi pergerakan harga saat ini sedang tertekan (mengalami konsolidasi). Analisis saya adalah kita berada di titik keputusan kritis. Mengejar posisi *long* di sini berisiko karena Anda membeli tepat di *resistance* atas dari penurunan sebelumnya. Pasar dengan jelas menolak area $20,20–$20,30 pada lonjakan pertama itu, meninggalkan sekumpulan *wick* yang memberi tahu saya bahwa penjual sedang mempertahankan zona tersebut. Sebaliknya, melakukan *short* di pasar dengan momentum *bullish* mentah yang begitu kuat adalah berbahaya kecuali kita melihat penurunan struktural yang jelas. Saya sudah terlalu sering melihat trader mencoba melawan pemulihan yang kuat dan terkena *stop out* pada kenaikan berikutnya. Secara pribadi, saya lebih suka menunggu pasar menunjukkan arahnya daripada menebak pergerakan selanjutnya. Jika para *bull* ingin mengambil kendali, mereka perlu menyerap tekanan jual ini dan mencetak *higher low* yang bersih. Jika para *bear* ingin menjebak posisi *long* yang terlambat masuk, mereka akan mempertahankan $20,20 dan mendorong harga kembali turun ke arah *support* $18,30. Itulah medan pertempurannya. Rencana Trading (TUNGGU / Pengaturan Kondisional) · Bias: Netral / Tunggu · Entry Long: $19,60 – $19,80 (Hanya jika *retest* berhasil bertahan di atas 7-MA) · Konfirmasi: Penutupan *candle* 1J di atas $20,25 (menembus *resistance* lokal) · Stop / Invalidation: $19,10 (hilangnya *support moving average* jangka pendek) · TP1: $20,50 · TP2: $21,50 (*swing high* utama sebelumnya) · TP3: $22,50 (ekstensi) · R:R: Sekitar 1:2 pada TP1 awal Risiko terbesar saat ini adalah *breakout* yang gagal yang berujung pada *lower high*. Ini sering terjadi setelah impuls masif—pembeli ritel terjebak di atas, dan *market maker* menyapu level terendah. Jika harga kehilangan level $19,10, momentum segera bergeser menjadi *bearish*, dan saya memperkirakan adanya *retest* pada zona *support* $18,30. Saya akan tetap bersabar sampai kita melihat penutupan yang menentukan dari konsolidasi saat ini. Apakah kalian mengantisipasi penembusan di level $20, atau apakah kalian memperkirakan *bounce* ini akan dijual kembali turun? #ByXIMPACT #WSOT2026 $VVVUSDT $SPCXXUSDT
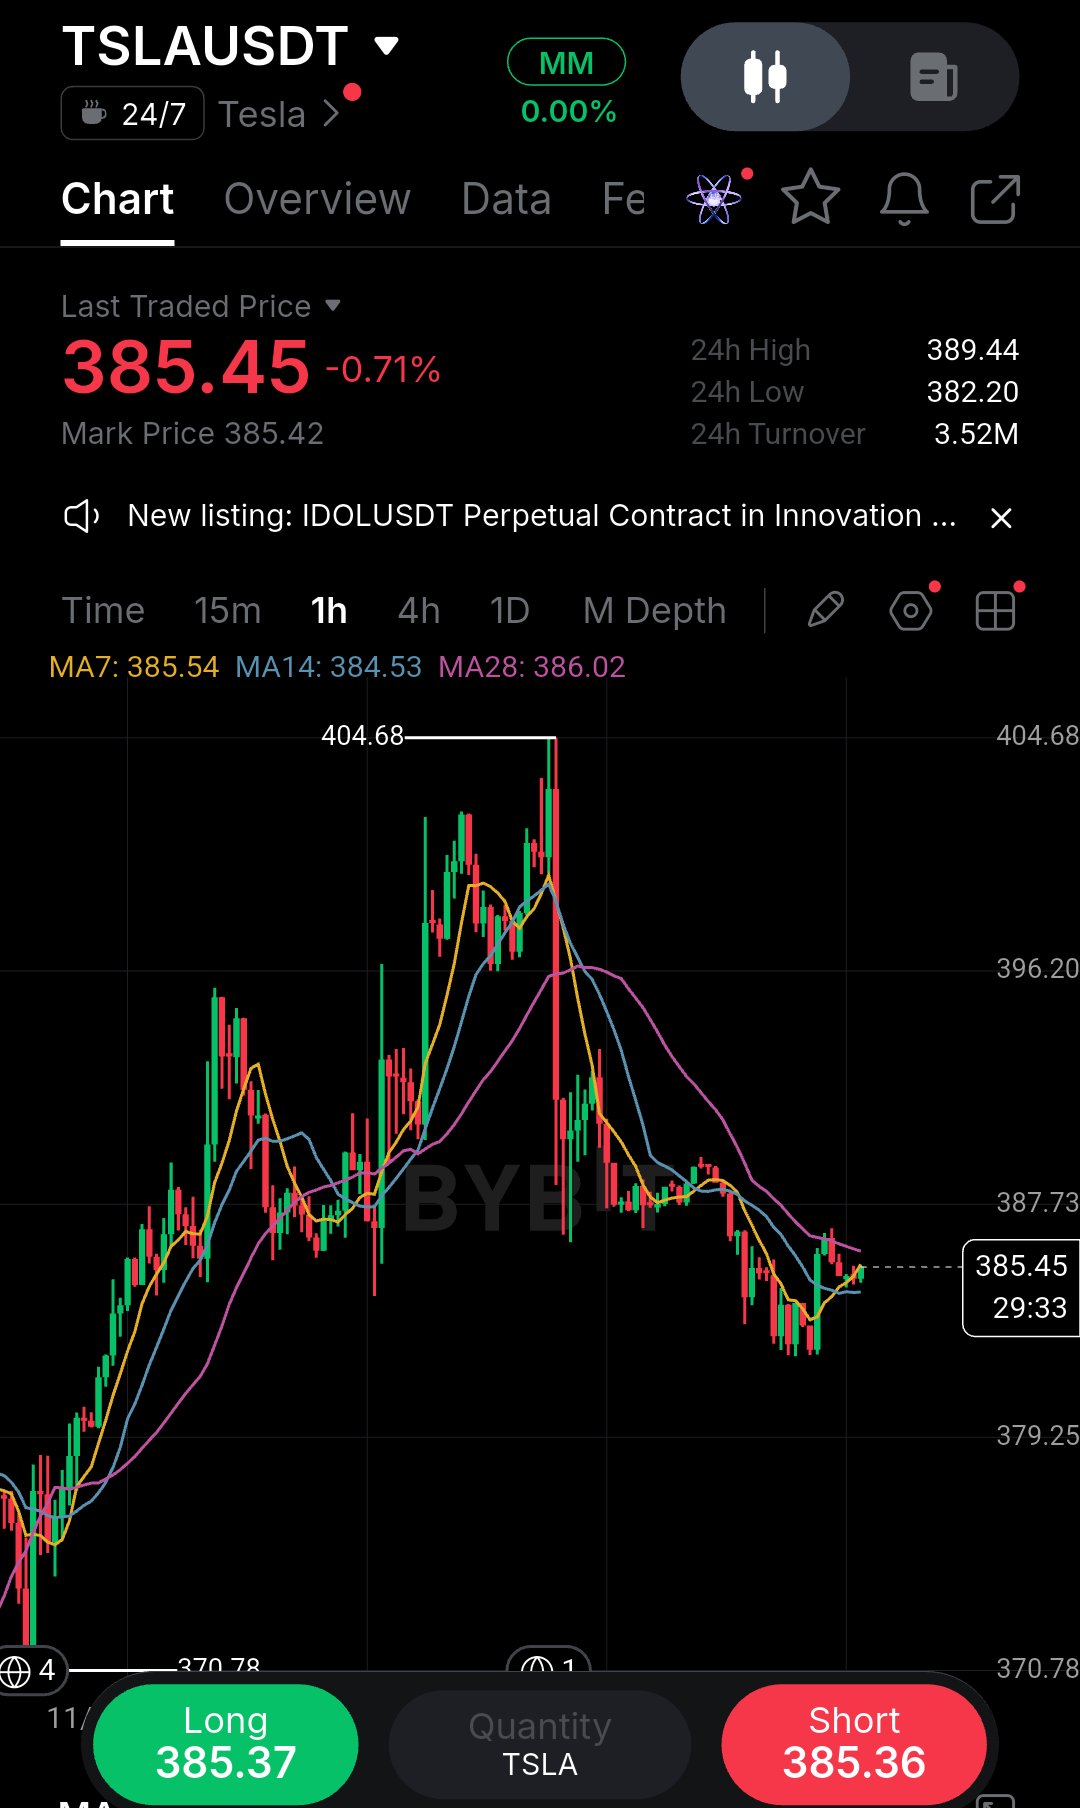
Saya sudah belajar untuk berhati-hati dengan grafik yang terlihat stabil sebelum benar-benar mengonfirmasi perubahan tren yang nyata. Hal yang membuat saya menahan diri pada grafik 1 jam TSLAUSDT ini adalah cara harga berinteraksi dengan moving average setelah penurunan tajam dari puncak 404,68. Kita saat ini melihat pantulan kecil dari level terendah lokal, tetapi MA7 dan MA14 masih tertahan di bawah MA28, menjaga struktur pasar yang lebih luas tetap bearish. Momentum dari aksi jual awal sangat kuat, dan pantulan seperti ini sering kali kesulitan untuk berlanjut ketika moving average menghalangi pergerakan tersebut. Bagian yang tidak ingin saya abaikan adalah level saat ini di sekitar 385,45. Jika Anda melihat ke kiri, area ini bertindak sebagai pivot minor sebelum penurunan besar, yang berarti area ini sekarang kemungkinan besar bertindak sebagai resistance dinamis. Saya tidak akan terburu-buru menyebut ini sebagai pembalikan arah (reversal). Risiko terbesar di sini adalah membeli dead-cat bounce tepat ke arah suplai di atas (overhead supply). Saya pernah melakukan kesalahan yang sama, masuk terlalu dini saat candle hijau hanya untuk melihat harga langsung ditolak oleh moving average. Karena pengalaman itu, saya lebih memilih menunggu perubahan momentum yang jelas dan konfirmasi penembusan struktur sebelum mengambil posisi long. Selain itu, turnover 24 jam berada di 3,52 juta, yang memberi tahu saya bahwa belum ada lonjakan besar dari pembeli agresif yang masuk untuk membalikkan tren ini. Pembalikan yang sesungguhnya biasanya membutuhkan volume dan perebutan kembali level-level kunci secara tegas. Rencana saya adalah tetap bersabar sampai harga merebut kembali level 386,50 dengan keyakinan atau mengalami penolakan bersih dari sini. Entry Long: 386,60 – 386,80 (pada penutupan 1 jam di atas level tersebut) SL: 384,80 TP1: 389,44 TP2: 396,20 Invalidasi: Kehilangan level terendah lokal baru-baru ini di 384,50. Jika harga tertolak di sini, saya akan tetap flat (tidak posisi) dan menghindari memaksakan trading di lingkungan pasar yang tidak menentu (choppy). Apakah Anda menunggu perebutan kembali level atau justru melakukan sell pada pantulan ini? #ByXIMPACT #WSOT2026 $TSLAXUSDT $SPCXXUSDT
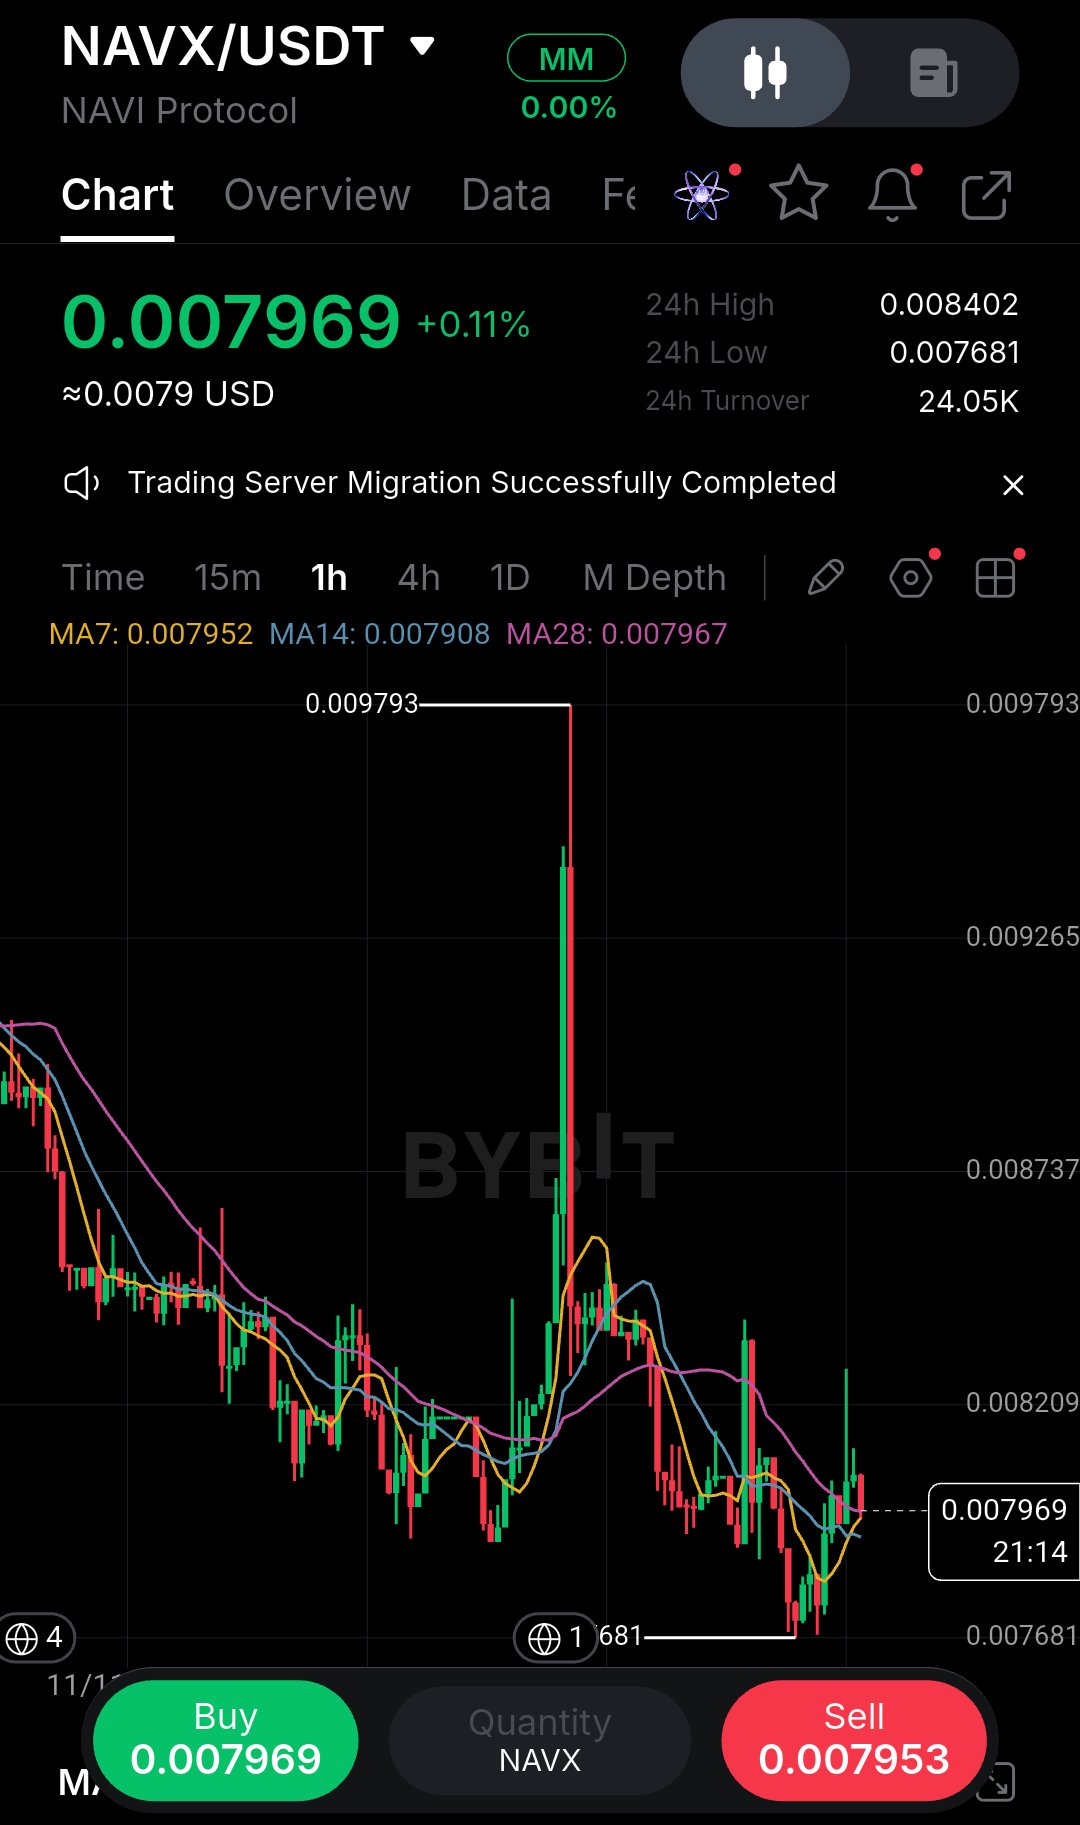
I’ve learned the hard way to be careful with charts that look like they are basing before they actually confirm it. I’ve been trapped by early entries plenty of times, buying a bounce only to watch it get immediately rejected. What made me pause and look closer at this NAVX 1h chart is that massive red wick stretching all the way up to 0.009793. That wasn't a real pump driven by organic spot buying; it looks exactly like a quick liquidity grab to sweep late shorts before price was violently rejected right back down. Since that sharp flush, we’ve seen a slow bleed out to the 0.007681 low. However, the current price action is starting to get interesting. I’m now seeing price reclaim the 7 and 14 moving averages and begin printing a series of higher lows. The local structure is definitely trying to shift, but we have to acknowledge the context: the volume is incredibly thin at just 24K. With such low turnover, it doesn't take much size to push the price around in either direction, which makes this environment highly prone to fakeouts. Because of that low liquidity, I wouldn't chase this current green candle. I’d rather wait for a clear structure retest to manage my risk properly. Direction: Long (on confirmation) Entry: 0.00785 – 0.00795 Confirmation: A strong 1h close above 0.00805, or a successful retest of 0.00785 holding firmly as support. SL: 0.00765 (Just below the recent swing low) TP1: 0.00820 TP2: 0.00840 TP3: 0.00875 Invalidation: A breakdown below 0.00768. The biggest risk here is getting trapped in another fakeout. If we lose that 0.00785 level and break back below the MAs, my thesis is dead, and I'm stepping out. I’d rather miss a move than force a position. Are you waiting for a confirmed breakout, or looking for a lower entry? #ByXIMPACT #WSOT2026 $NAVXUSDT $AAPLXUSDT
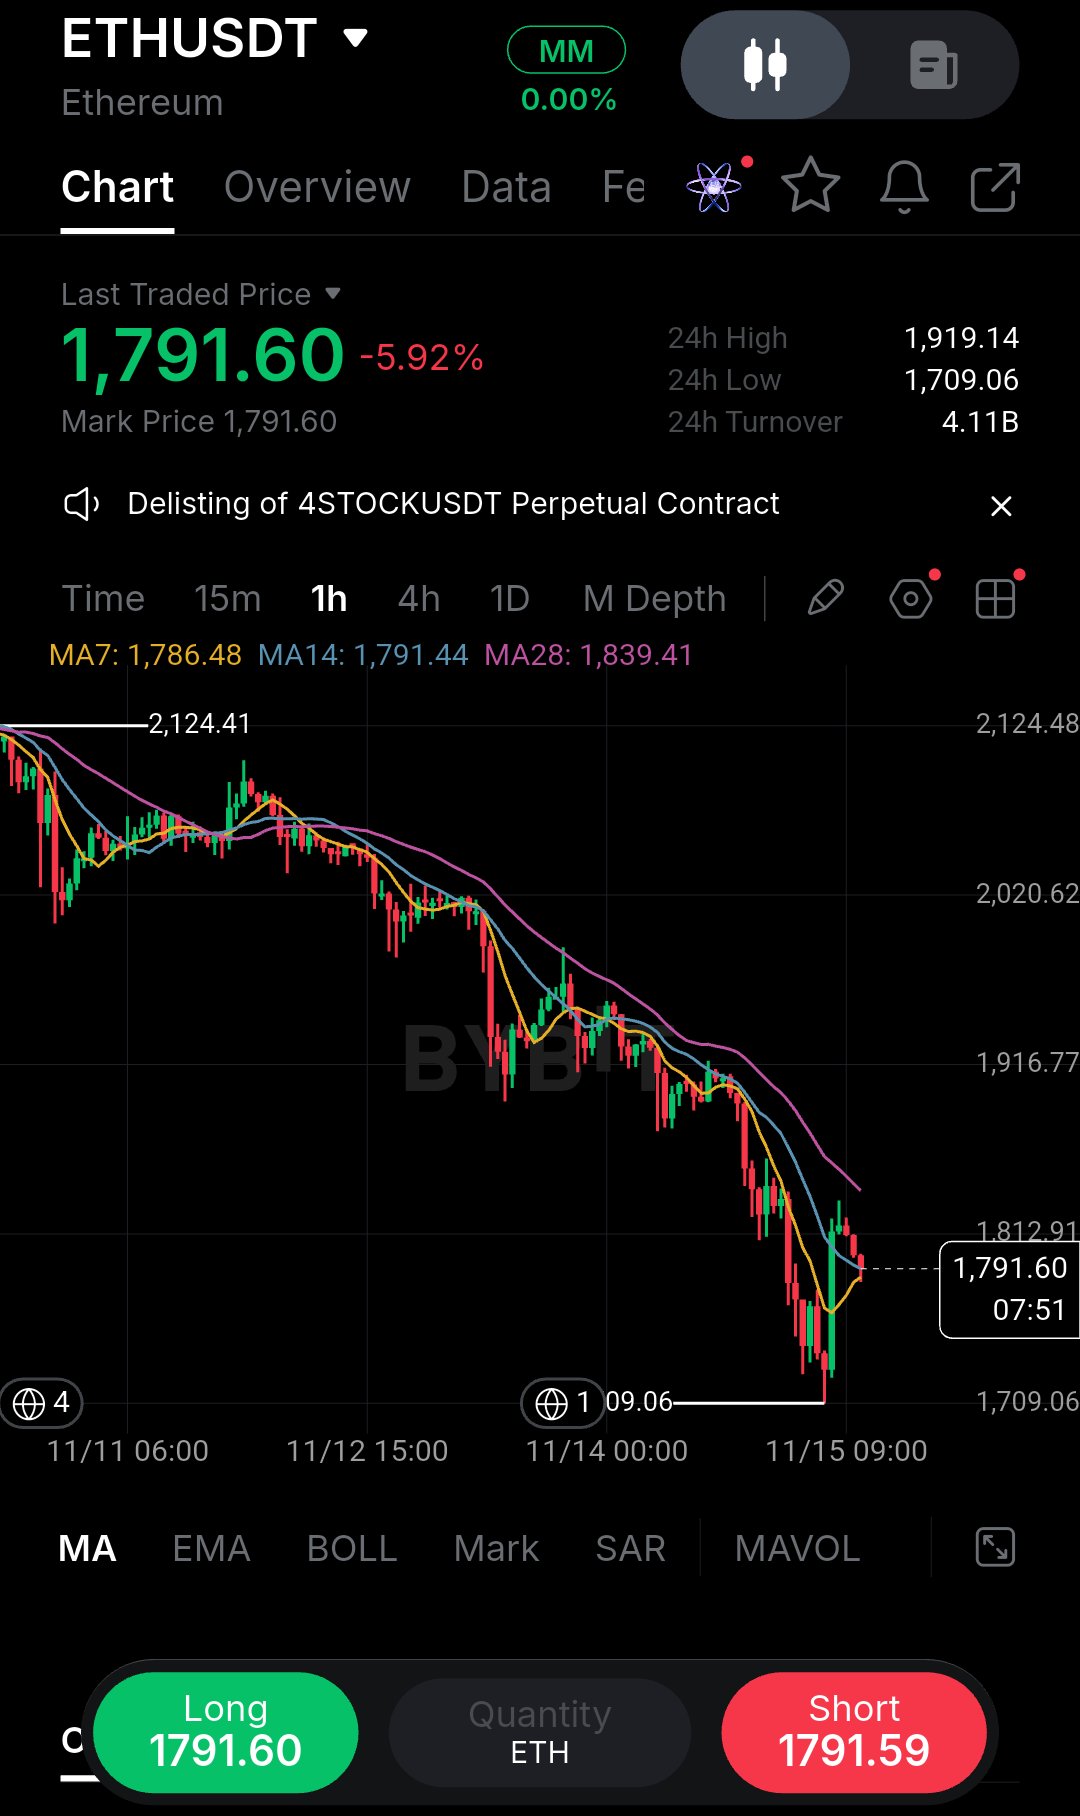
Saya sudah belajar untuk skeptis terhadap pantulan tajam di dalam tren turun yang kuat, jadi grafik ETH ini menarik perhatian penuh saya. Setelah anjlok ke level terendah $1.709, harga mencetak reli pemulihan yang kuat dan sekarang menekan level $1.791,60. Yang mencolok adalah kita sedang membentur resistensi dinamis. MA14 berada tepat di $1.791,44. Itu bukan kebetulan; itu adalah ujian nyata pertama bagi para pembeli. Trennya masih sangat bearish, mengingat penurunan masif dari $2.124, tetapi momentum jangka pendek telah bergeser. Pembeli mencoba merebut kembali posisi, tetapi tepat di sini, pasar berada di titik keputusan. Saya tidak akan terburu-buru untuk melakukan long pada pantulan langsung ini, saya juga tidak akan membabi buta melakukan short pada kekuatan lokal ini. Lilin-lilinnya berwarna hijau, volumenya mulai meningkat, dan saat itulah FOMO muncul. Tapi pantulan bukanlah pembalikan sampai strukturnya terbukti. Saya menunggu penutupan 1 jam (1H) yang bersih di atas $1.800 untuk mengonfirmasi pergeseran struktural, atau penolakan yang jelas di sini untuk melakukan short pada kaki penurunan berikutnya. Level $1.800 bersifat psikologis, dan tepat di atas MA14 dan MA7. Jika harga ditutup di atasnya, tren jangka pendek akan berbalik, dan kita bisa menargetkan MA28 di $1.839. Jika tertolak, tren turun berlanjut, dan kita mencari high yang lebih rendah untuk melakukan short. Jika kita mendapatkan penutupan kuat di atas klaster MA: Entri Long: $1.805 SL: $1.750 (di bawah support lokal) TP1: $1.840 (resistensi MA28) TP2: $1.880 Risikonya: terjebak membeli dead-cat bounce. Saya pernah rugi karena mengejar lilin hijau dalam tren turun sebelumnya, dan itu mengajarkan saya untuk menunggu konfirmasi. Penutupan di atas $1.800 adalah sinyalnya; sampai saat itu, ini hanya noise. Jangan masuk sebelum level tersebut terbukti, dan jangan pindahkan stop loss Anda jika harga bergerak melawan Anda. Jika setup tidak valid, terimalah dan lanjut ke langkah berikutnya. Apakah Anda membeli penurunan ini atau menunggu high yang lebih rendah untuk melakukan short? #ByXIMPACT #WSOT2026 $ETHUSDT $BTCUSDT
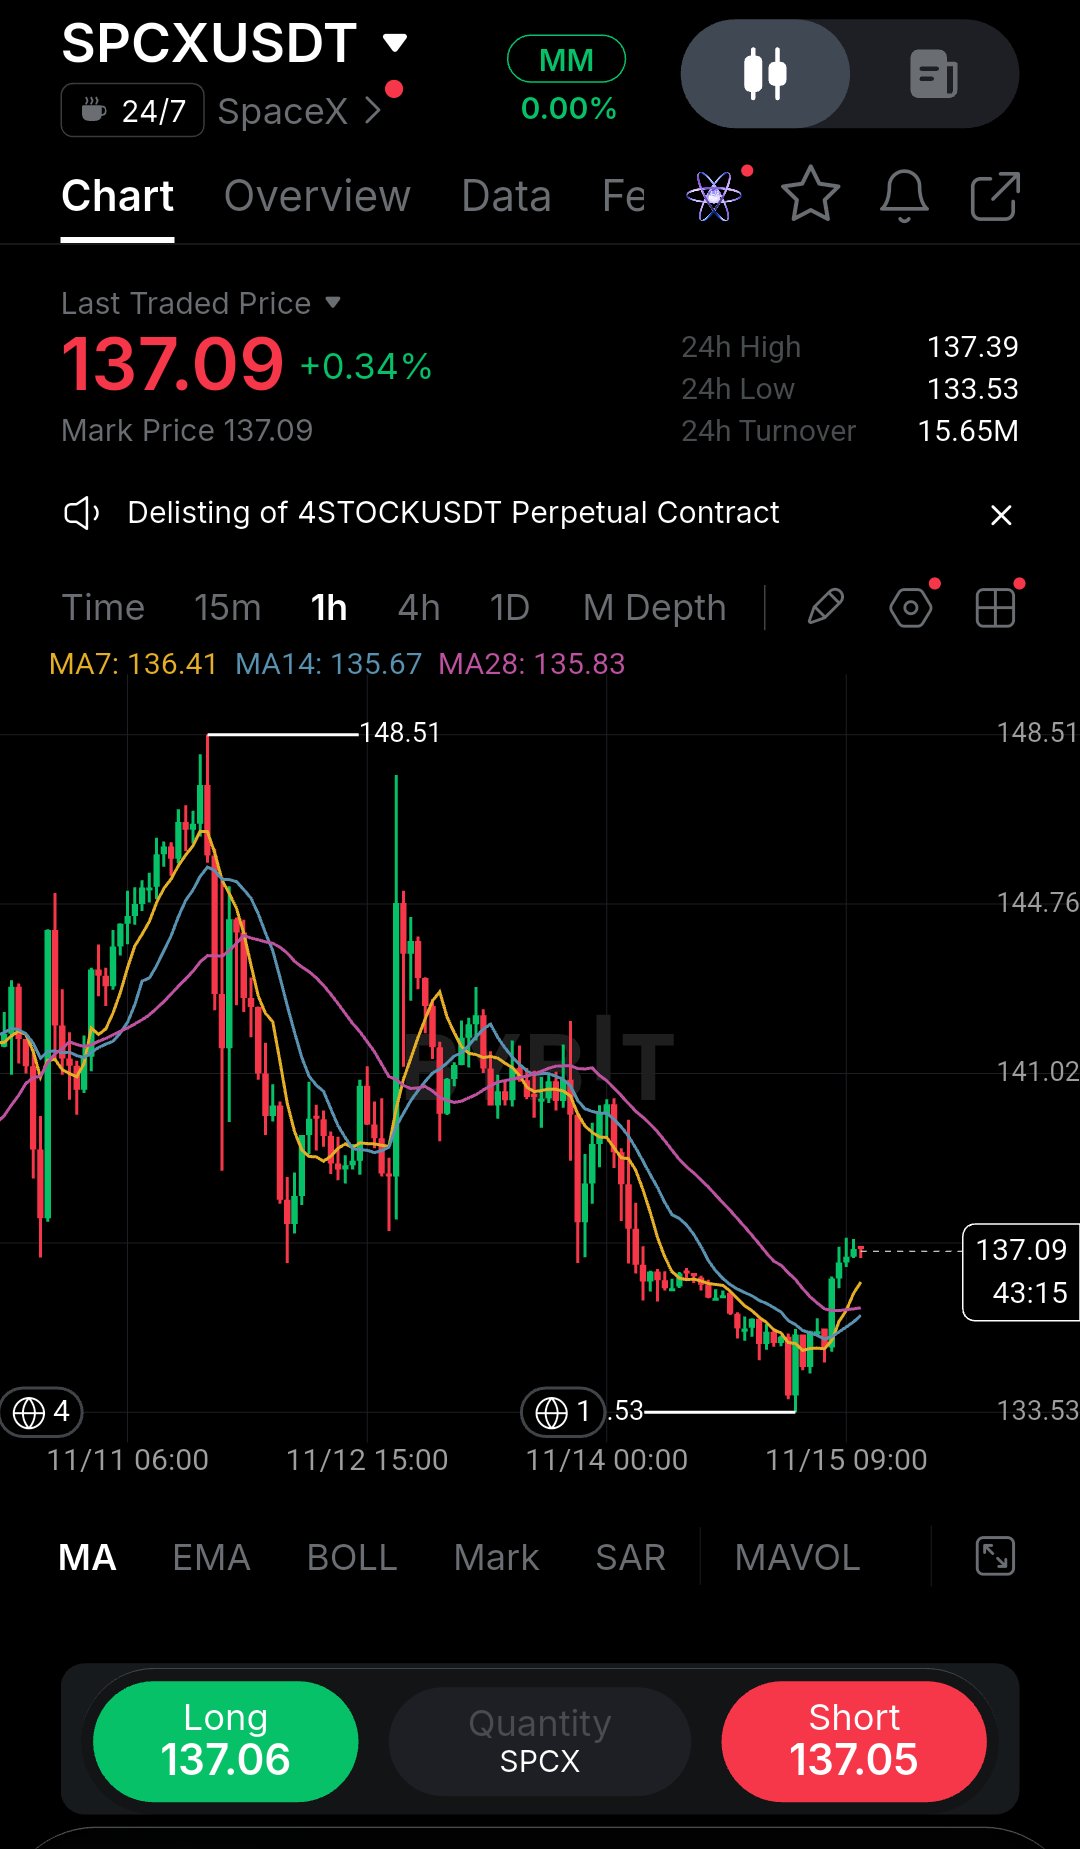
Saya sering terjebak masuk terlalu dini saat *recovery bounce*, jadi saya memantau grafik SpaceX ini dengan lebih sabar. Harga anjlok tajam ke 133,53, tapi bukannya terus turun, harga justru mencatatkan pemulihan yang tajam. Sekarang harga bertahan di atas moving average jangka pendek MA7 di 136,41, MA14 di 135,67, dan MA28 di 135,83 serta sedang menekan level 137,09. Pertahanan agresif di level terendah itu adalah detail kunci di sini. Struktur pasar beralih dari aksi jual yang agresif menjadi tekanan beli yang tiba-tiba, dan itulah jenis transisi yang menjebak trader impulsif di kedua sisi. Mari kita bedah apa yang sebenarnya dikatakan grafik ini kepada kita. Strukturnya terlihat seperti *rebound* kelelahan jangka pendek. Penjual gagal menembus lantai 133,53 secara meyakinkan, dan pergerakan setelahnya menciptakan potensi *liquidity sweep* bagi posisi *short* yang terlambat. Perhatikan bagaimana harga tidak hanya stabil; harga melonjak kembali di atas ketiga *moving average* dalam satu tarikan impulsif. Itu adalah sinyal bahwa momentum penurunan langsung telah terhenti. Namun, kita masih diperdagangkan jauh di bawah *swing high* 148,51, dan tren 1 jam secara keseluruhan masih rusak. Level 141,02 adalah ujian kritis. Level ini sempat menjadi *support* saat turun, dan sekarang menjadi zona suplai utama pertama di atas. Jika pembeli bisa mempertahankan zona yang telah direbut kembali ini, ujian logis berikutnya adalah area 141,02 itu, diikuti oleh 144,76. Tapi kita harus menghormati bahwa ini adalah permainan *counter-trend* sampai terbukti sebaliknya. Begini cara saya memainkannya: Entri: Tunggu penutupan 1H di atas 137,10 untuk mengonfirmasi pemulihan dan menghindari terjebak oleh *wick* (sumbu). SL: 135,50 (di bawah MA dan basis konsolidasi terbaru). TP1: 141,02 TP2: 144,76 Invalidasi: Penutupan 1H yang bersih kembali di bawah 135,50 membatalkan tesis *bounce* ini dan menunjukkan penjual mendapatkan kembali kendali. Pelajaran bagi saya di sini: jangan tertukar antara *relief rally* yang keras dengan pembalikan tren penuh. Saya pernah terbakar sebelumnya dengan masuk di *candle* hijau pertama setelah anjlok, hanya untuk melihat harga berbalik turun di *moving average*. Itulah mengapa saya menunggu penutupan di atas 137,10 daripada membeli saat lonjakan awal. Risikonya ketat karena level terendah jelas ditentukan di 133,53, memberikan kita rasio *risk-to-reward* yang menguntungkan jika *bounce* itu terwujud. Tapi jika ini tidak bertahan, saya keluar tanpa menggeser *stop loss*, tanpa berharap. Psikologi trading di sini sangat krusial. Setelah penurunan seperti itu, FOMO muncul saat Anda melihat *candle* hijau tercetak. Tapi pendekatan profesionalnya adalah membiarkan pasar membuktikan dirinya terlebih dahulu. Penutupan di atas 137,10 menunjukkan pembeli bersedia membayar lebih tinggi, bukan hanya menutup posisi *short*. Jika kita mendapatkan konfirmasi itu, *trade* valid. Jika tidak, kita diam saja. Disiplin itulah yang membedakan *setup* yang bagus dari *trade* yang dipaksakan. Apakah Anda menunggu konfirmasi *breakout* atau melakukan *fade* di resistensi 141? Saya ingin mendengar bagaimana Anda membaca struktur ini. #ByXIMPACT #WSOT2026 $SPCXXUSDT $AAPLXUSDT
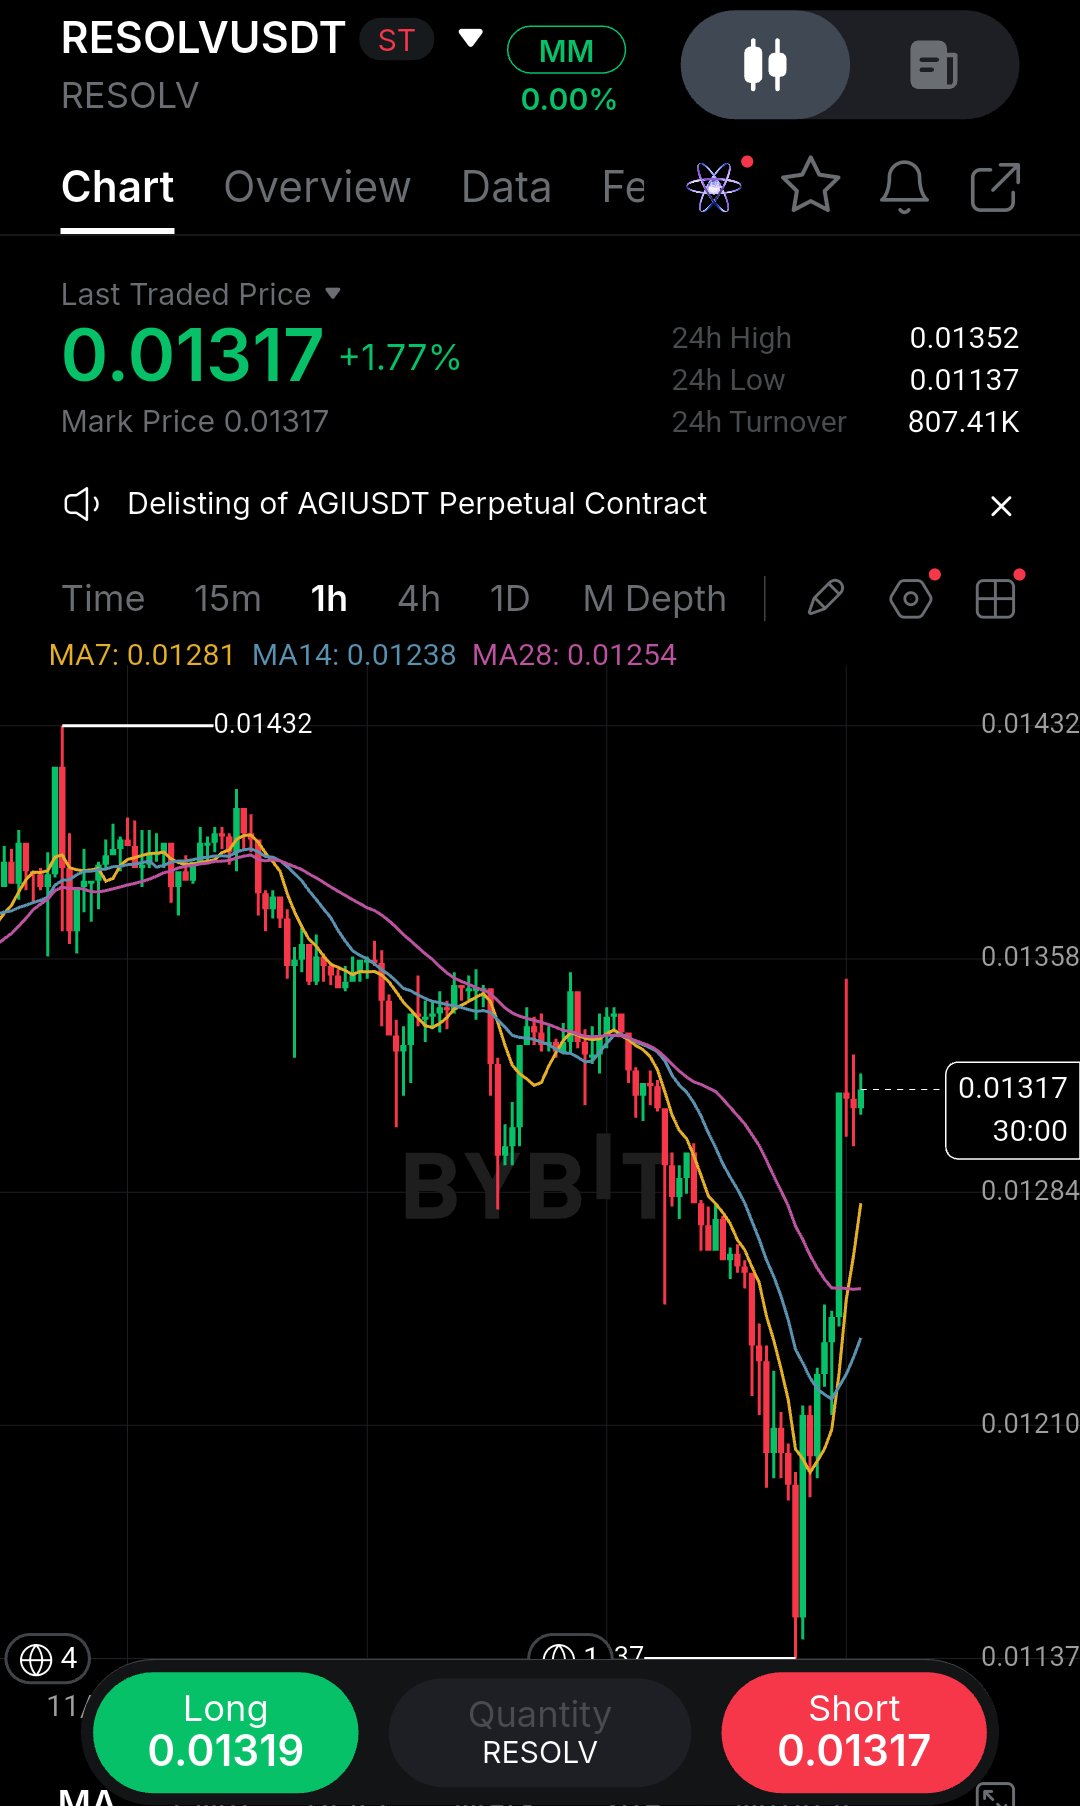
I’ve seen too many traders get chopped up trying to catch a falling knife, which is why I always wait for a clear structural break before acting. What stands out on this RESOLVUSDT 1h chart is the brutal sell-off down to $0.01137, followed by a sudden, aggressive V-shaped bounce. It looks tempting, but recovering from that kind of vertical drop is rarely a straight line. My read is that the market structure is still primarily bearish, and this bounce is likely just a relief rally. Price is currently hovering around $0.01317, pushing directly into the cluster of moving averages (MA7, MA14, MA28) which are acting as dynamic resistance. I’m treating this $0.01330–$0.01350 zone as a potential lower high. Rather than buying this green momentum, I’d prefer to wait for exhaustion and rejection here to target the downside. Execution Plan: Bias: SHORT Entry: $0.01320 – $0.01350 Confirmation: Bearish rejection wick or 15m close back below $0.01300 Stop / Invalidation: $0.01370 TP1: $0.01250 TP2: $0.01210 R:R: Approx 1:2 The biggest risk is a sudden breakout above the moving averages, which would trap shorters and force a squeeze. If price closes above $0.01370, I’m out and reassessing. Don't fade the bounce until it actually stalls and prints a clear lower high. Patience here is crucial because the volatility is extreme. Are you waiting for the rejection, or trying to catch this falling knife? #ByXIMPACT #WSOT2026 $RESOLVUSDT $AAPLXUSDT
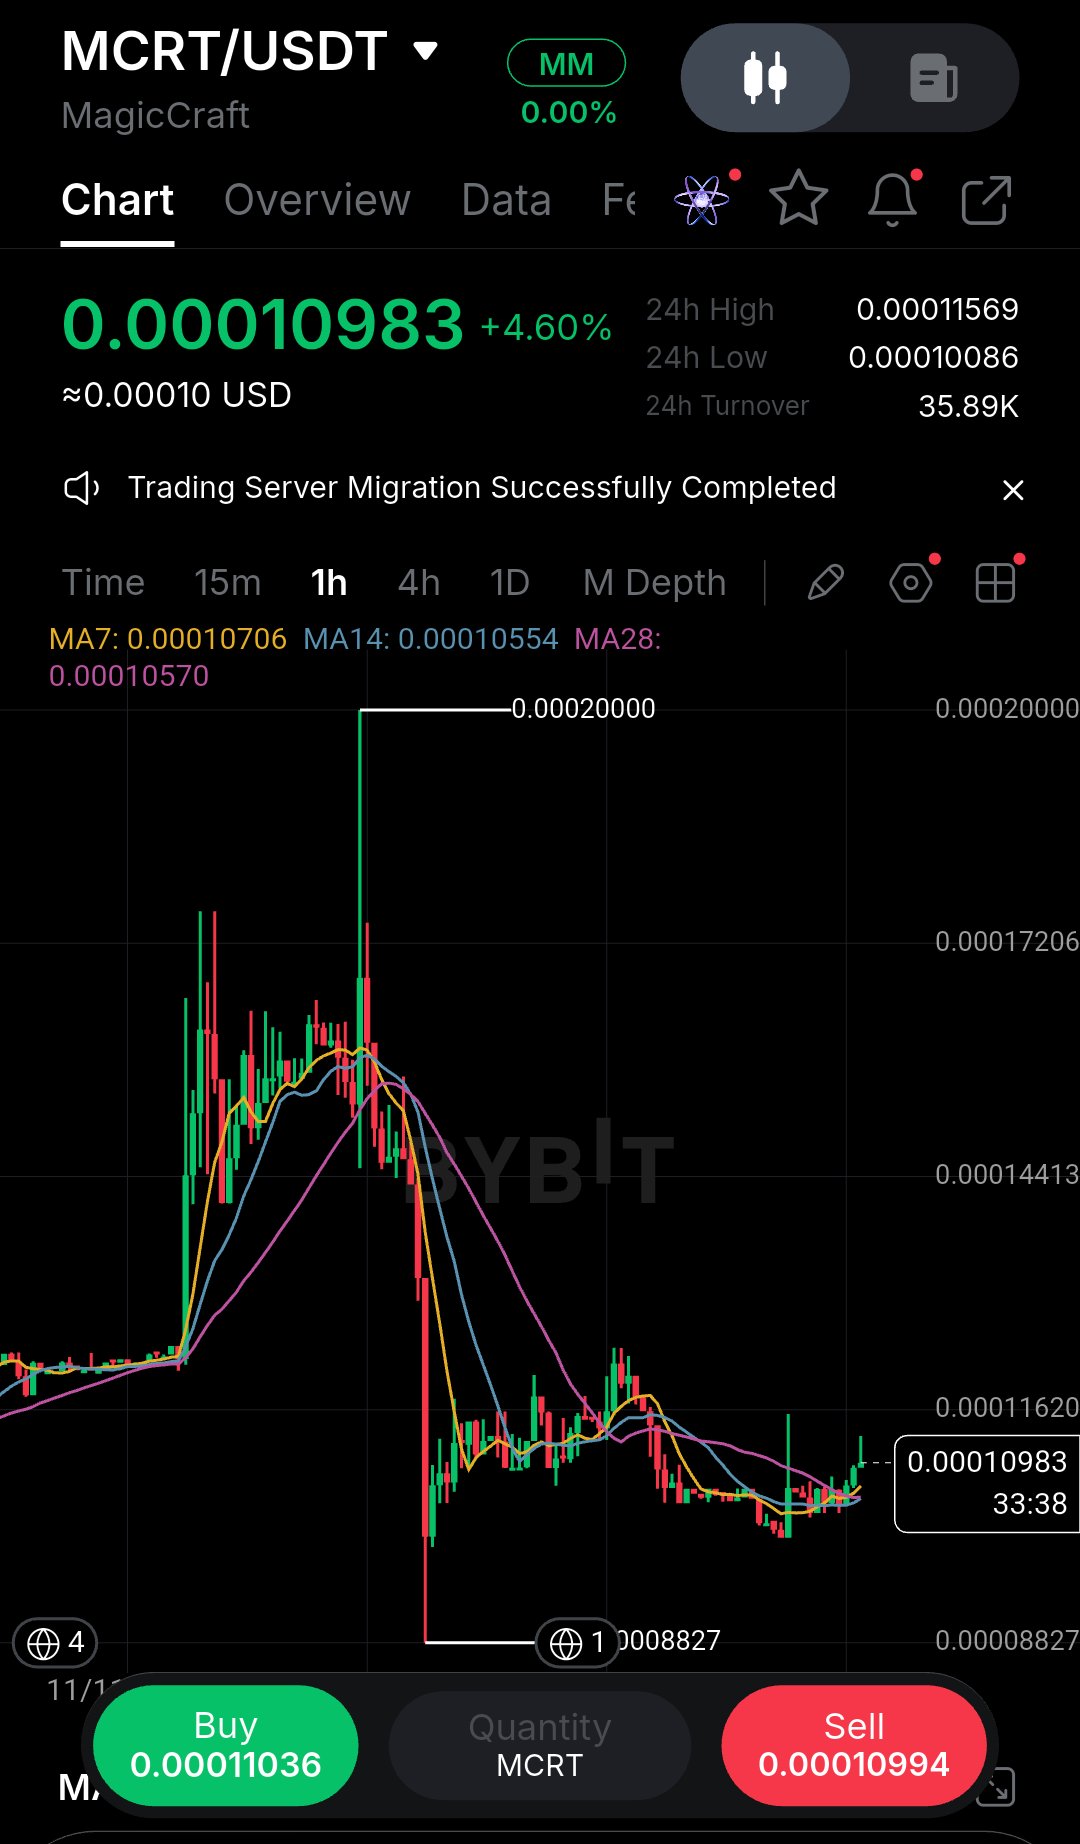
Saya jelas pernah rugi karena mencoba menangkap 'pisau jatuh' (*catching falling knives*), jadi saya sangat memperhatikan saat grafik akhirnya berhenti membuat *lower low*. Hal yang menarik perhatian saya pada grafik 1 jam MCRT ini adalah penurunan drastis ke 0.00008827 yang diikuti oleh pergerakan lambat dan tidak menentu yang kita lihat sekarang. *Candle* merah besar itu melenyapkan banyak pembeli yang terlambat masuk, dan kita saat ini berada di 0.00010983, mencoba mencari pijakan. Struktur pasar rusak parah, tetapi harga saat ini sedang mencoba mencari lantai (*floor*). *Moving average* mulai mendatar di dekat 0.00010554, yang memberi tahu saya bahwa tekanan jual yang intens akhirnya mulai mereda. Saya memperlakukan ini sebagai potensi pembalikan jangka pendek daripada kelanjutan tren. Alih-alih melakukan *short* saat harga di *support*, saya lebih memilih mencari pantulan (*relief bounce*) jika pembeli bisa masuk di sini. Kunci bagi saya adalah *resistance* lokal di sekitar 0.00011620; penembusan yang bersih dan bertahan di atas level tersebut akan mengonfirmasi perubahan struktur pasar dan memberi ruang napas bagi para *bull*. Rencana eksekusi: Bias: LONG (Scalp) Entri: 0.00010800 – 0.00010980 Konfirmasi: Penutupan 1 jam *bullish* di atas MA14 SL: 0.00010086 (Di bawah *support* lokal) TP1: 0.00011620 TP2: 0.00014413 Invalidasi: Penembusan di bawah *sweep low* baru-baru ini di 0.00008827. Risiko terbesarnya adalah ini hanya *dead cat bounce* dan penjual memanfaatkannya untuk menambah posisi *short*. Jangan mengejar *candle* hijau; tunggu pemulihan struktur yang jelas. Jika harga kesulitan menembus MA14 dan mulai mencetak *lower high* lagi, saya akan keluar. Ukuran posisi di sini harus konservatif karena volatilitas tinggi dan likuiditas tipis. Apakah Anda sedang menunggu *higher low* yang terkonfirmasi, atau hanya melawan momentum saat ini? #ByXIMPACT #WSOT2026 $MCRTUSDT $AAPLXUSDT
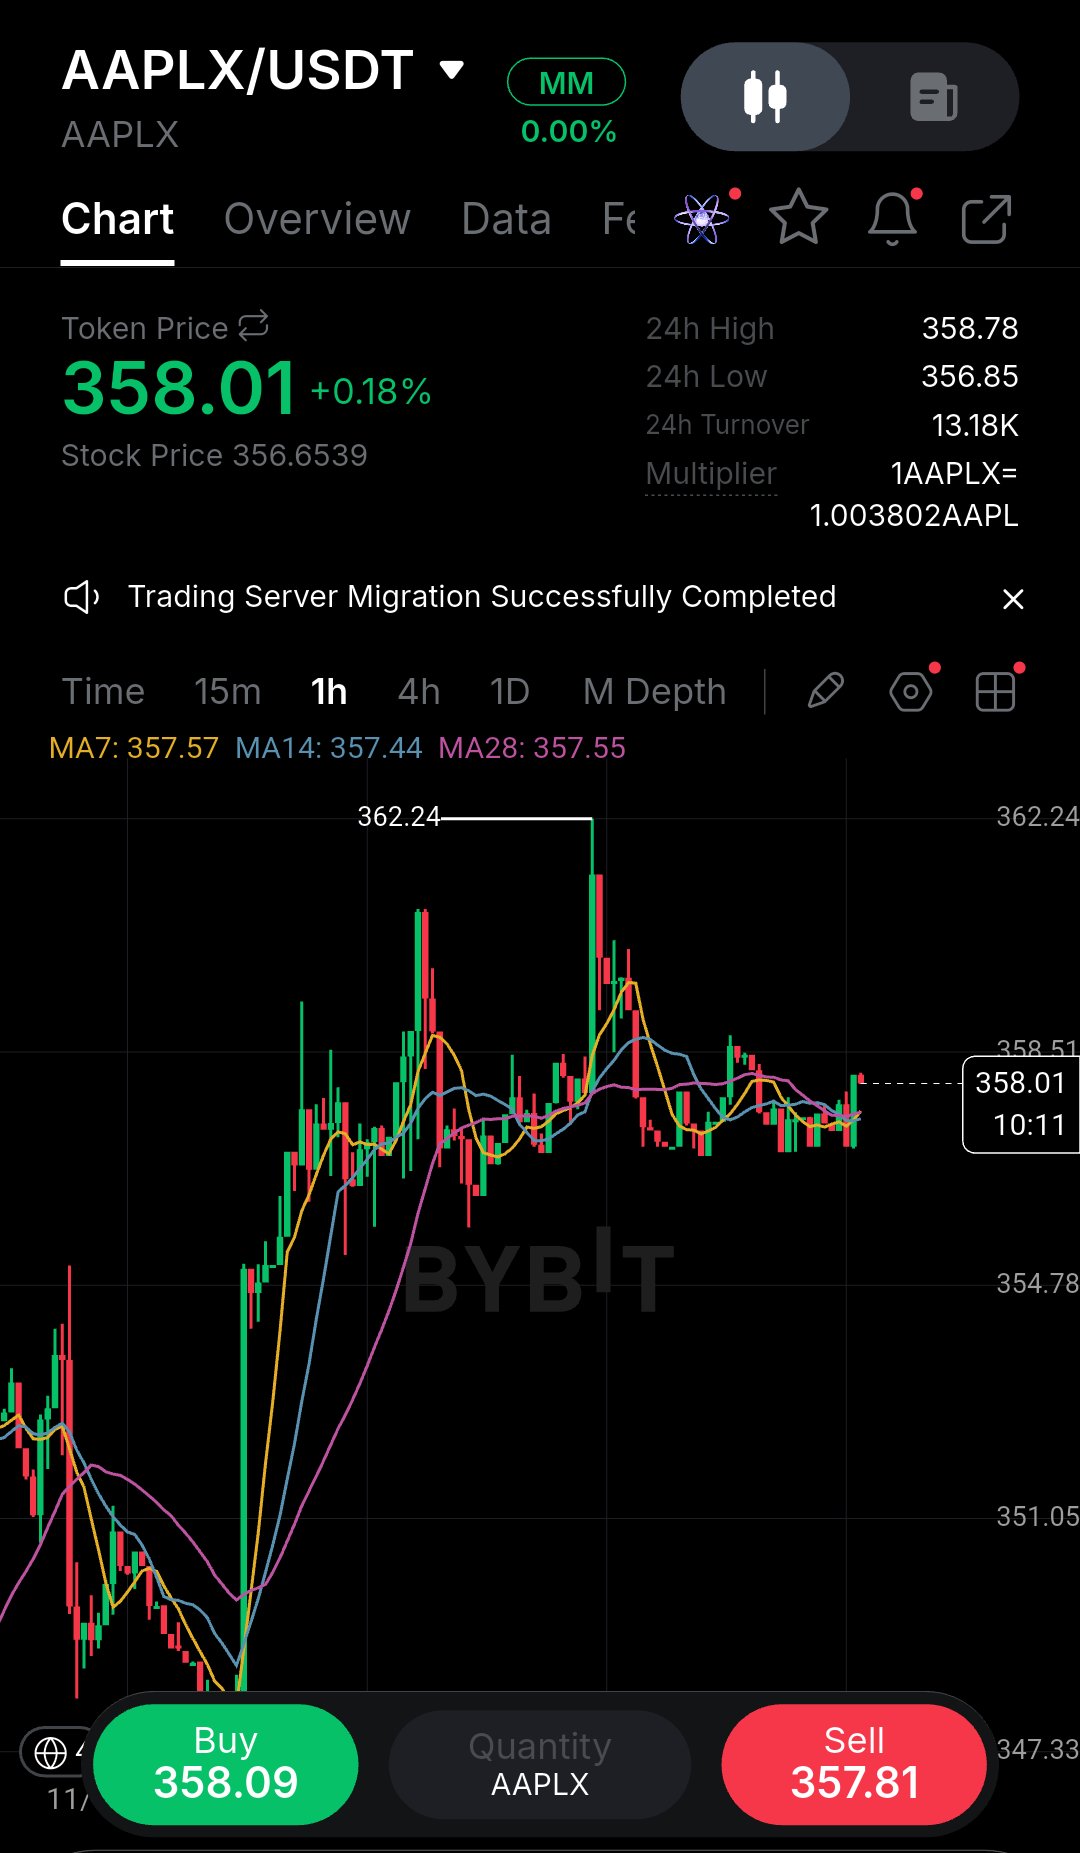
I’ve learned to be cautious when price hovers in a tight cluster because that’s usually where impatient traders get chopped up. What caught my eye on this AAPLX 1h chart is the heavy rejection from the $362.24 high followed by a slow, grinding drift down to the $357–$358 zone. The market structure looks heavy. Price is currently pinned right on the moving averages (MA7, MA14, MA28), all tangled around $357.50. This tight compression suggests a volatile expansion is near, but the momentum favors the downside. That $362 rejection left a lot of trapped buyers who are now underwater. I’m watching the $358.50 local lower high as immediate resistance. I’d rather wait for a breakdown retest than jump in right here. If price breaks below $356.80 and retests it as resistance, I’ll look for a short scalp. Execution Plan: Bias: SHORT Entry: $357.40 – $358.00 (on a failed retest) Confirmation: 15m close below $356.80, followed by a weak bounce SL:$358.80 TP1: $355.50 TP2:$354.00 Invalidation: A clean 1h close above $358.80 The risk here is getting chopped up if volume stays flat and price just ranges. Don't chase the breakdown; wait for the retest to prove sellers are still in control. Are you waiting for the range to break, or fading this compression? #ByXIMPACT #WSOT2026 $AAPLXUSDT $SOLUSDT
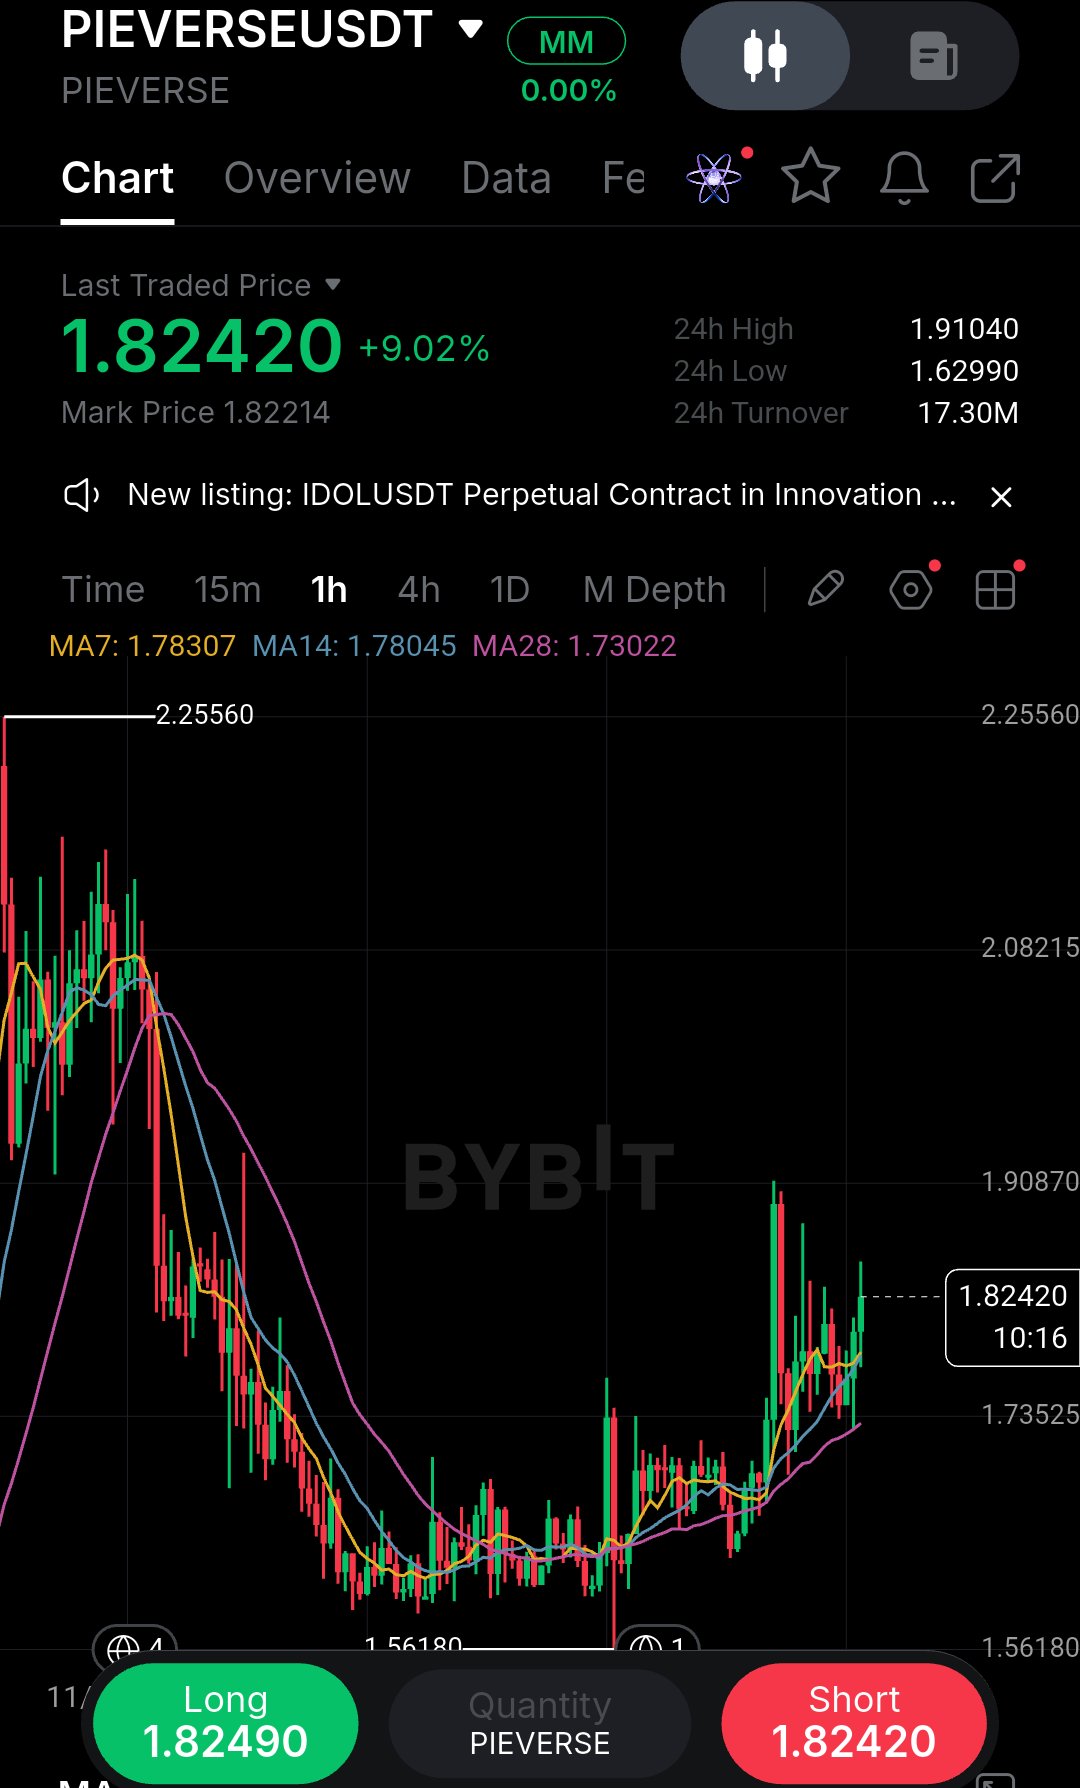
I've chased enough of these post-reversal bounces to know that entering right after a massive green candle usually ends in a quick drawdown. It is easy to get caught up in the excitement of a 9% move, but what stands out on this PIEVERSEUSDT 1h chart isn't just the size of the bounce, but the aggressive defense of the $1.56 low. The market completely rejected lower prices and has since reclaimed all major moving averages, which is a very encouraging sign for the bulls. The broader structure has shifted to the upside, but I have to be realistic about the immediate price action. Price is currently stalling right below the $1.91 local resistance level. My read is that chasing here at $1.82 is risky because buyers are likely to face a natural pullback after such a sharp run-up. Retail traders often get trapped buying the top of these initial impulses. I’d much rather wait for the market to prove the new support holds before risking my capital. The $1.78 zone, where the MA7 and MA14 sit, is the key battleground. This area is perfect for a "break and retest" setup. If price pulls back to this zone and prints a clear bullish rejection candle like a hammer or a strong green engulfing candle.That’s the confirmation I need to enter. It gives us a much tighter stop loss and a better risk-to-reward ratio. · Entry: $1.78 – $1.80 · SL: $1.73 (Below the MA28) · TP1: $1.86 · TP2: $1.91 · Invalidation: A 1h close below $1.73. The main risk is a fake breakout where price wicks up to $1.85 before dumping hard. Wait for the retest rather than FOMOing into the current candle. Are you waiting for that $1.78 pullback, or looking for a direct breakout above $1.91? #ByXIMPACT #WSOT2026 $PIEVERSEUSDT $BRUSDT