
Ansarweb3
15577Suka0Pembagian698Penggemar603Ikuti
Web3 / Crypto Trader | Graphic Designer | Open to work: CM / Mod / Ambassador | Bybit Creator
Web3 / Crypto Trader | Graphic Designer | Open to work: CM / Mod / Ambassador | Bybit Creator
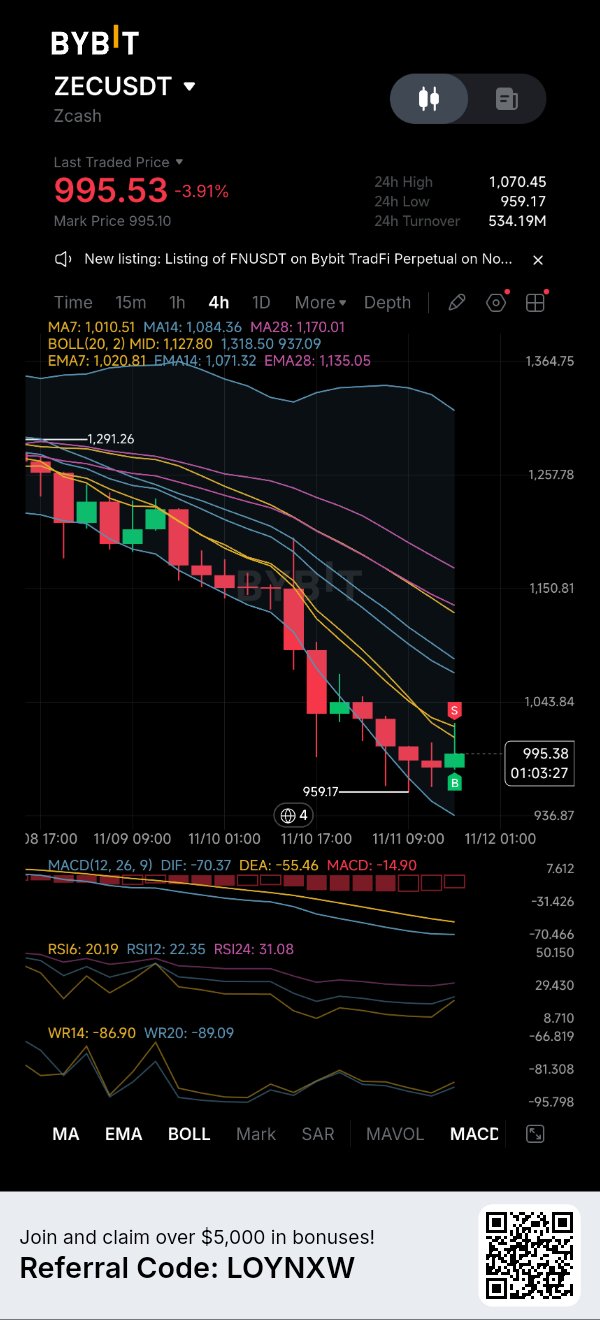
ZEC di Bawah $1.000: Apakah $959 Support Terakhir?
Zcash ($ZEC) sedang berjuang untuk stabil setelah aksi jual agresif mendorong harga dari atas $1.290 ke wilayah $959. Saat ini diperdagangkan di kisaran $995,53, ZEC masih berada di bawah tekanan, dengan grafik 4 jam menunjukkan struktur bearish yang jelas. Apa yang diungkapkan indikator: • Harga berada di bawah MA7 ($1.010,51), MA14 ($1.084,36), dan MA28 ($1.170,01). • MACD tetap bearish, dengan DIF di -70,37 di bawah DEA di -55,46. • Histogram MACD negatif di -14,90, mengonfirmasi momentum jual yang berlanjut. • RSI6 berada di 20,19, RSI12 di 22,35, dan RSI24 di 31,08, menunjukkan kondisi jenuh jual (oversold) yang dalam. Level kunci yang perlu diperhatikan: - Support terdekat: $959,17 - Zona support berikutnya: $937–$936, di sekitar Bollinger Band bawah - Resistance pertama: $1.010–$1.021 - Resistance kedua: $1.043–$1.071 - Resistance utama: $1.084–$1.135 Pertahanan yang berkelanjutan di level $959,17 dapat menciptakan ruang untuk rebound ke arah $1.010. Namun, penembusan tegas di bawah support ini dapat membuka jalan ke wilayah $937. Bagi para pembeli (bulls), merebut kembali level $1.021 akan menjadi sinyal pemulihan awal. Reversal yang lebih kuat memerlukan kemampuan untuk melewati zona resistance moving-average yang lebih tinggi. Pengamatan utama: ZEC sudah sangat jenuh jual (oversold), tetapi kondisi jenuh jual bisa bertahan lama selama tren turun yang kuat. Tekanan beli harus muncul sebelum struktur bearish dapat berubah. Perhatikan support $959, hindari mengejar rebound spekulatif, dan tentukan invalidasi Anda sebelum mempertimbangkan trading. Bisakah ZEC mempertahankan $959, atau apakah penjual sedang bersiap untuk penurunan lebih lanjut? #ZEC #Zcash #Bybit Bukan nasihat keuangan. DYOR (Lakukan riset Anda sendiri). #WSOT2026 #InflasiASMelonjakDanTaruhanKenaikanSukuBungaMeningkat #BitcoinMencapaiTitikTerendahDuaBulanSetelahPemiluParuhWaktuAS #Penjualan Massal Saham Teknologi AI Menghapus 2,5 Triliun dari Nasdaq 100 #DeutscheBankMeluncurkanPenyimpananAsetDigital $BTCUSDT $ETHUSDT
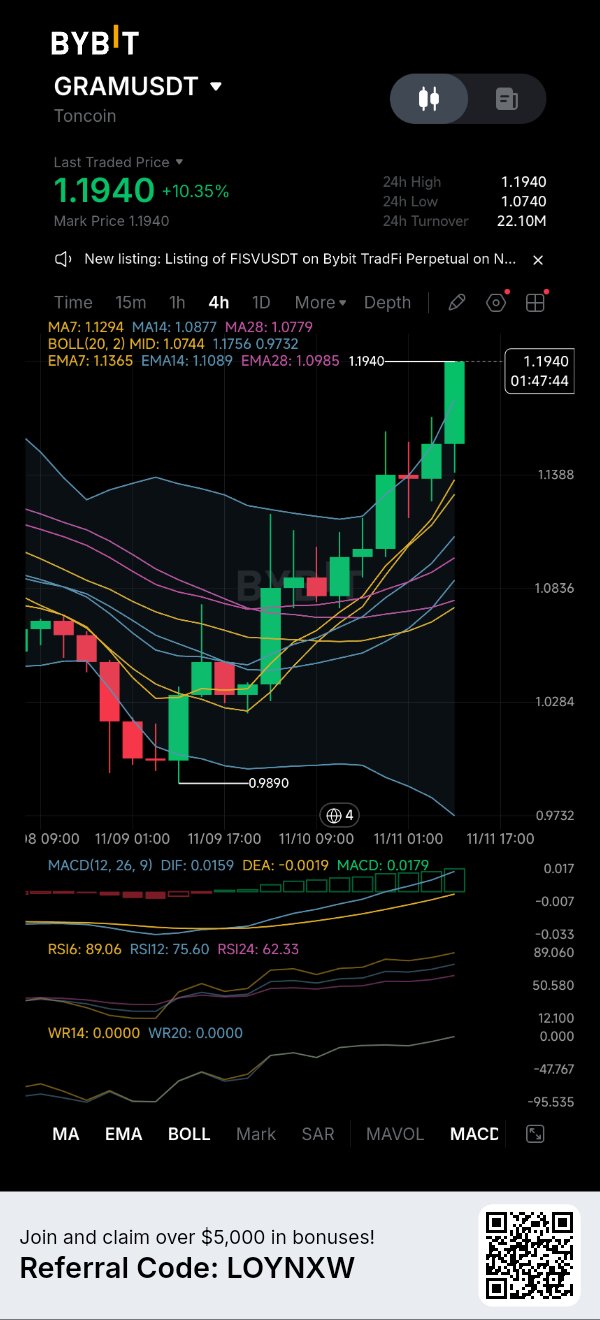
GRAM Gains 10%: Can Bulls Break $1.20?
$GRAMUSDT is showing impressive momentum after recovering from its recent $0.9890 low. Price is now trading around $1.1940, up 10.35%, with consecutive bullish candles pushing toward the $1.20 psychological resistance. The 4H structure has turned decisively bullish: • Price is above MA7 ($1.1294), MA14 ($1.0877) and MA28 ($1.0779). • MACD is bullish, with DIF at 0.0159 above DEA at -0.0019. • The MACD histogram has expanded to 0.0179, confirming strengthening momentum. • RSI6 stands at 89.06, while RSI12 is at 75.60, indicating an extremely overbought market. There is strong buying pressure, but the distance between price and the moving averages suggests that the rally may need a cooling-off period. Key levels to watch: - Immediate resistance: $1.1940 - Psychological resistance: $1.2000 - First support: $1.1756 - Secondary support: $1.1365–$1.1294 - Stronger support: $1.1089–$1.0985 A sustained breakout above $1.1940 could bring $1.20 into focus. However, rejection near this level could trigger profit-taking, with $1.1756 becoming the first important support to monitor. The bullish momentum is clear, but an RSI above 89 is a warning against chasing the current candle. Trading focus: Watch for consolidation, a controlled pullback or a confirmed breakout retest. Check liquidity, define invalidation and assess risk-to-reward before considering a position. Can GRAM sustain its momentum above $1.20, or will buyers take a breather first? Not financial advice. DYOR. #WSOT2026 #NovUSCPIWatch #WSOTPicktoEarn10U #USPayrollsAndRateDecisionsDriveMacroWeek #OilVolatilityTracksIranPeaceTalks $GRAMUSDC

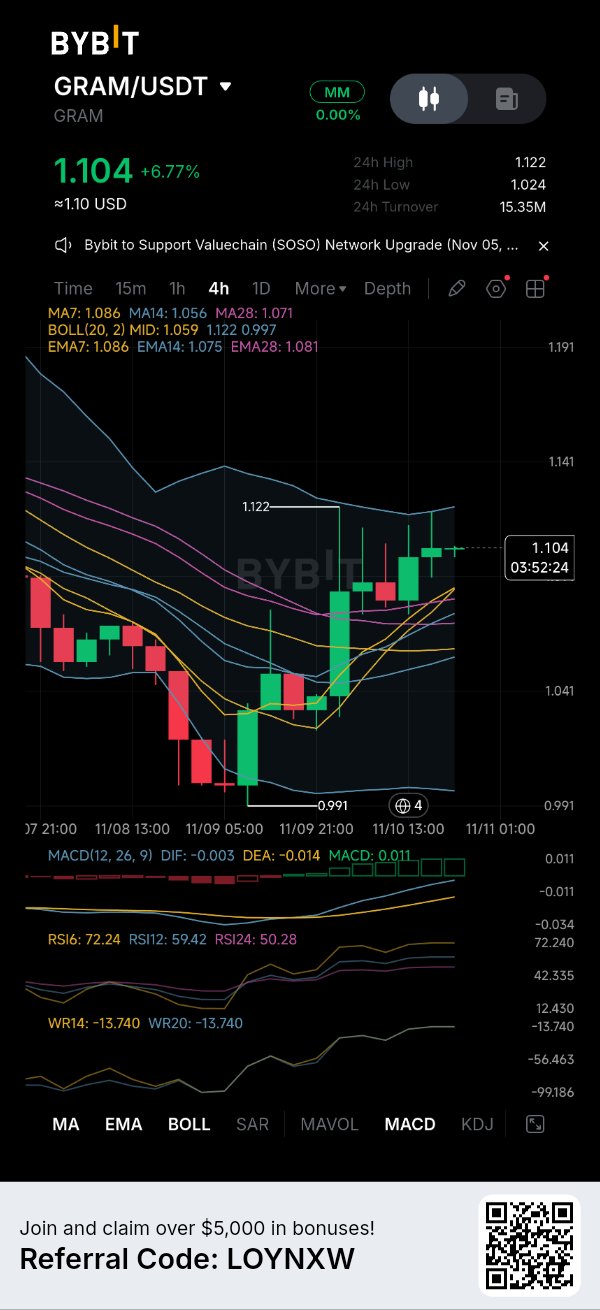
GRAM Presses the Upper Band at 1.122
$GRAMUSDT is 1.104. 24h high 1.122, low 1.024, turnover 15.35M on this pair. The marked high on the window is 1.122. The marked low is 0.991. Price is above the averages. MA7 is 1.086, MA14 1.056, MA28 1.071. EMAs sit nearby: 1.086, 1.075, 1.081. Bollinger mid is 1.059, edges 1.122 / 0.997. Spot is through the cluster and under the upper band at 1.122, which is also the session high. The 0.991 low is the base below. That is a push into the lid, not a close above it. MACD has a green histogram: DIF −0.003, DEA −0.014, MACD 0.011. DIF is above DEA. RSI6 is 72.24, RSI12 59.42, RSI24 50.28. Fast clock is elevated. The slower clock has not broken. $GRAM is the native token of The Open Network (TON), formerly Toncoin. It is used to pay transaction fees and for staking on the network. Circulating supply is around 2.85 billion. Total supply is higher, with no hard cap listed on major trackers. That is the structure. It does not rewrite the 4h levels on the chart. Levels on $GRAM: - 1.122 — upper band and session high - 1.086 — MA7 and EMA7 - 1.059 — mid-band - 0.997 / 0.991 — lower band and marked low Bullish case: 1.086 holds and $GRAM closes above 1.122. Bearish case: a 4h reject under 1.122, with RSI6 at 72, sends it back through 1.086 toward the mid-band. Would you treat the 1.122 band as the line that has to clear, or wait for a close back under 1.086 before calling the push done? Not financial advice. DYOR. #WSOT2026 #NovUSCPIWatch #WSOTPicktoEarn10U #USPayrollsAndRateDecisionsDriveMacroWeek #OilVolatilityTracksIranPeaceTalks $BTCUSDT

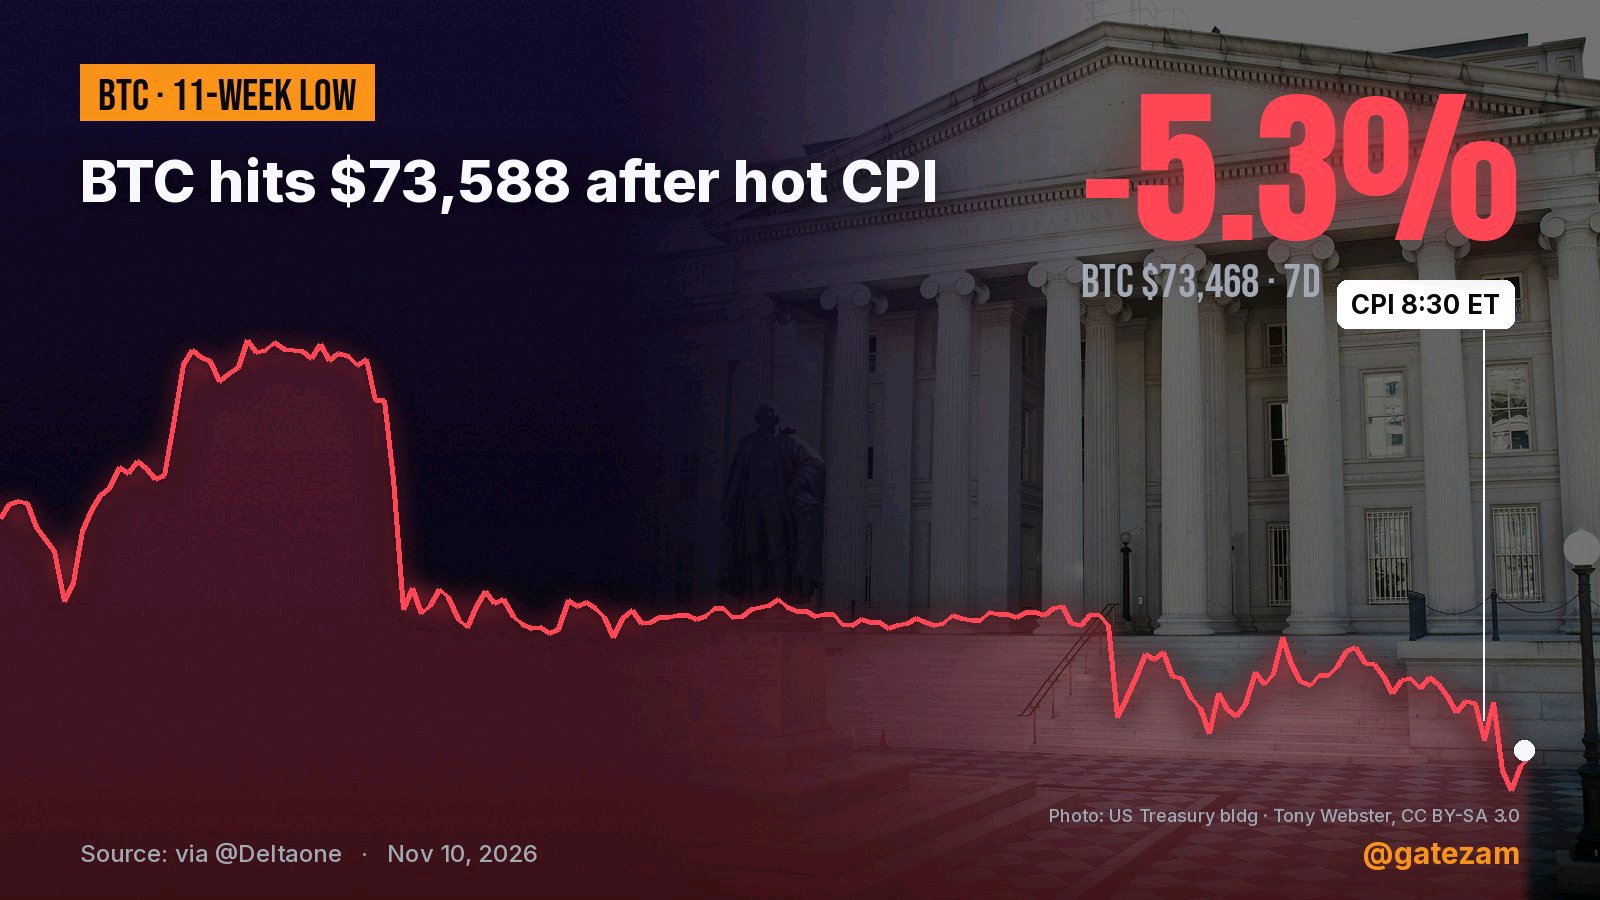
BTC Bertahan di $73,4K: CPI yang Tinggi Memicu Pertahanan Band
Bitcoin sedang menguji support Bollinger Band bawah setelah rilis data CPI AS yang lebih panas dari perkiraan, yang mendorong inflasi MoM utama ke 0,4% dibandingkan estimasi 0,3%. Meskipun volatilitas intramenit melonjak pada kisaran $1.250, harga spot menemukan penyerapan segera di dekat batas pita bawahnya karena volume 24 jam sebesar $5,43 miliar mempertahankan level support lokal di $72,6 ribu. Di Bybit, $BTC diperdagangkan di dekat $73.456,10 (-1,59%), bertahan tepat di atas level terendah intraday $72.686,60 setelah menolak level tertinggi $75.408,00 dengan turnover sebesar $5,43 miliar. Apa yang diungkapkan grafik 4H Bybit: * Perpanjangan pita bawah: Harga menembus ke arah Bollinger Band bawah ($73.321,66) untuk menguji wick support di $72.686,60 sebelum stabil. * Overhead moving average: Resistance dinamis overhead menumpuk di MA7 ($74.359,52), MA14 ($74.698,89), dan MA28 ($75.285,03), yang berlabuh pada mid-band periode 20 ($75.046,29). * Kompresi momentum: RSI(6) harian turun ke wilayah oversold di 32,61 (RSI12 di 35,06) dengan WR14 di -77,94. Histogram MACD berada di -94,59 dengan DIF (-733,40) melacak di bawah DEA (-638,81), yang menandakan perlambatan momentum jangka pendek. Katalis inflasi makro & likuiditas: Data inflasi yang lebih panas (Headline MoM +0,4%, Core MoM +0,3%) yang didorong oleh energi (+0,7%) dan rekreasi (+0,8%) memperkuat kehati-hatian kebijakan suku bunga federal. Namun, penyerapan likuiditas tetap kuat karena Bybit mengumumkan pembaruan fungsi pembayaran otomatis untuk akun UTA, menjaga turnover derivatif yang tinggi di seluruh meja perdagangan utama. Dua pengaturan eksekusi yang perlu diperhatikan: * Pertahanan support: Mempertahankan batas bawah pita di $73.321 dan merebut kembali MA7 ($74.359) membuka pergerakan mean-reversion yang menargetkan mid-band di $75.046. * Kelanjutan breakdown: Penutupan 4H yang terkonfirmasi di bawah $72.686 membatalkan support jangka pendek, membuka penurunan sekunder menuju level permintaan makro di $70.500. Periksa kedalaman order book langsung, kluster likuidasi, dan tingkat pendanaan di kartu Bybit di bawah ini sebelum melakukan pemosisian. #ByXIMPACT Bukan nasihat keuangan. Lakukan riset Anda sendiri (DYOR). #WSOT2026 #Pantauan IHK AS November #WSOTPicktoEarn10U #Data Penggajian AS dan Keputusan Suku Bunga Mendorong Pekan Makro #Volatilitas Minyak Melacak Pembicaraan Perdamaian Iran $BTCUSDT $BTCUSDC

CAP Holds Above the Mid Band Under 0.106
$CAPUSDT is 0.10281. 24h high 0.12862, low 0.09854, turnover 11.01M on this pair. The marked high on the window is 0.12862. The marked low is 0.09236. Price is above the averages. MA7 is 0.10070, MA14 0.10098, MA28 0.10122. EMAs sit nearby: 0.10132, 0.10091. Bollinger mid is 0.10086, edges 0.10608 / 0.09563. Spot is through the cluster and under the upper band at 0.10608, well below the 0.12862 high. The 0.09236 low is the base below. That is a hold above the mid-band, not a break of the lid. MACD is still soft: DIF 0.00155, DEA 0.00195. DIF is under DEA and the histogram is red. RSI6 is 64.22, RSI12 57.31, RSI24 56.89. Fast clock is rising but not extreme. $CAP is the governance and utility token of Cap, an Ethereum-based covered credit protocol. The protocol issues cUSD (a dollar stablecoin) and stcUSD (its yield-bearing version). Depositors supply stablecoins; underwriters post collateral to cover loans to institutional borrowers. Total supply is fixed at 10 billion. A large portion remains in a timelock. That is the structure. It does not rewrite the 4h levels on the chart. Levels on $CAP: - 0.10608 — upper band - 0.10132 / 0.10070 — EMA7 and MA7 - 0.10086 — mid-band - 0.09563 / 0.09236 — lower band and marked low - 0.12862 — session high Bullish case: 0.1007 holds and $CAP closes above 0.106. Bearish case: a 4h reject under 0.106, with MACD still red, sends it back through 0.1007 toward the lower band. Would you treat the 0.106 upper band as the line that has to clear, or wait for a close back under 0.1007 before calling the hold done? Not financial advice. DYOR. #WSOT2026 #NovUSCPIWatch #WSOTPicktoEarn10U #USPayrollsAndRateDecisionsDriveMacroWeek #OilVolatilityTracksIranPeaceTalks
NEAR memangkas emisinya. Harganya tidak terpengaruh.
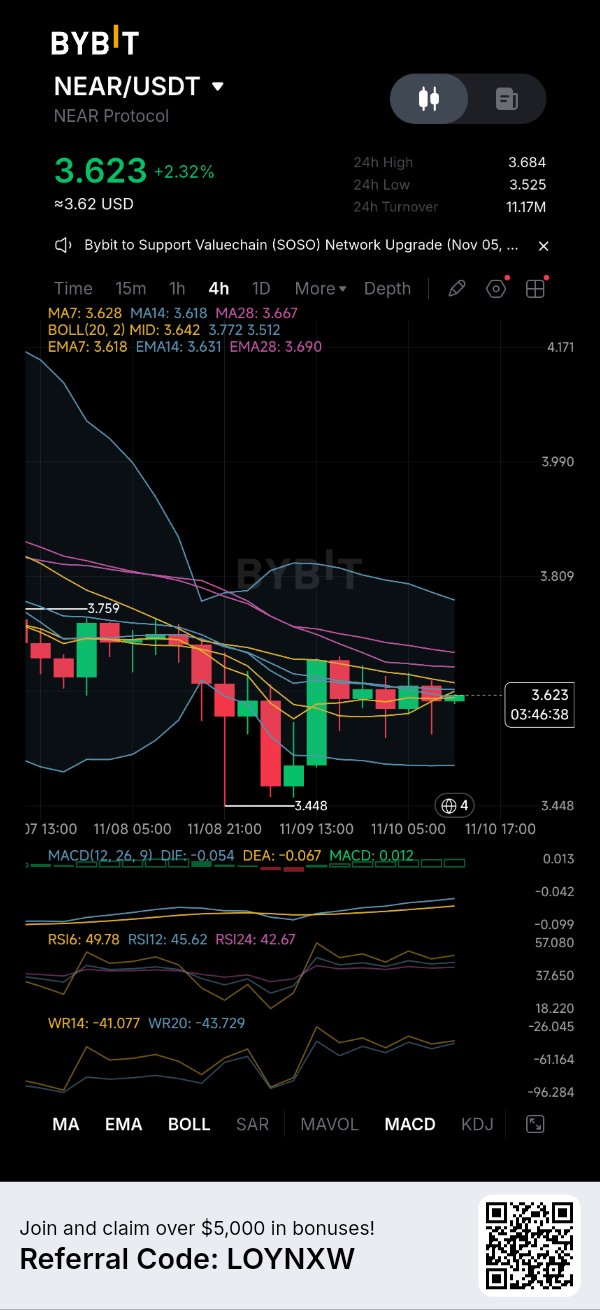
$NEARUSDT baru saja menyetujui pemangkasan penerbitan maksimalnya dari 2,5% menjadi 1,6% selama 24 bulan. Harga tidak bereaksi. Inilah alasannya. Pemangkasannya nyata tapi belum berlaku. Masih perlu peninjauan Dewan Keamanan, masa tenggang sekitar 90 hari, dan adopsi validator. Ini juga menurunkan proyeksi imbal hasil staking dari sekitar 5,3% menjadi 3,4%, jadi ini adalah pertukaran, bukan kemenangan gratis. Sementara itu, permintaan melemah: open interest futures turun menjadi 230 juta NEAR dari 318 juta pada 22 Oktober, dan NEAR turun sekitar 39% dari puncaknya di bulan Oktober. Tampilan 4H: 3,623 tertahan di MA7/MA14 (3,628 / 3,618), dengan MA28 dan EMA28 di atas level 3,667-3,690. Band menyempit dan MACD datar di dekat nol. Itu adalah kondisi squeeze. Bull: Penutupan 4H di atas 3,690, lalu 3,759 (swing high terakhir). Bear: Penutupan 4H di bawah 3,448 (swing low, dekat support 3,40 yang ditandai analis). Berita pasokan penting dalam jangka panjang. Harga ditentukan dalam hitungan hari. Apakah Anda akan membeli NEAR karena perubahan tokenomics yang belum aktif? Bukan saran keuangan. Lakukan riset sendiri (DYOR). #WSOT2026 #Pantauan IHK AS November #WSOTPicktoEarn10U #Data Penggajian AS dan Keputusan Suku Bunga Mendorong Pekan Makro $NEARUSDC

Leverage SOL sudah bersih. Pembeli belum kembali.
$SOLUSDT turun sekitar 30% dari level tertinggi akhir September di dekat $124, dan leverage sepertinya sudah bersih. Open interest futures turun ke $5,10Miliar, terendah sejak 19 Agustus. Jadi, kenapa harganya tidak memantul? Karena penawaran spot hilang. ETF SOL telah mengalami arus keluar selama lima minggu berturut-turut (hampir $170Juta), dengan sekitar $8,8Juta lagi diperkirakan keluar pada hari Senin. Tampilan 4H: harga 85,15 berada di bawah MA7/14/28 (86,33 / 87,30 / 88,61), tepat di atas pita bawah (84,52). RSI6 di angka 31 dan WR di -95, jadi sudah oversold. Tapi semua MA melandai ke bawah dan rebound terus tertahan di bawahnya. Saya belum melihat adanya basis. Bull: Penutupan 4H di atas 88,61 (MA28/EMA28), kemudian trendline yang rusak di dekat 90-92 adalah ujian sesungguhnya. Bear: Penutupan 4H di bawah 84,89 membuat level 82 mungkin tercapai, lalu zona demand 77,60. Leverage hilang, pembeli tidak ada. Apakah Anda menunggu arus ETF berbalik, atau membeli saat oversold? Bukan saran keuangan. DYOR. #IMPACTbyTrade #WSOT2026 #Pantauan IHK AS November #WSOTPicktoEarn10U #Data Penggajian AS dan Keputusan Suku Bunga Mendorong Pekan Makro #Volatilitas Minyak Melacak Pembicaraan Perdamaian Iran $BTCUSDT
INIT +65% on a halted chain. Not a thesis.
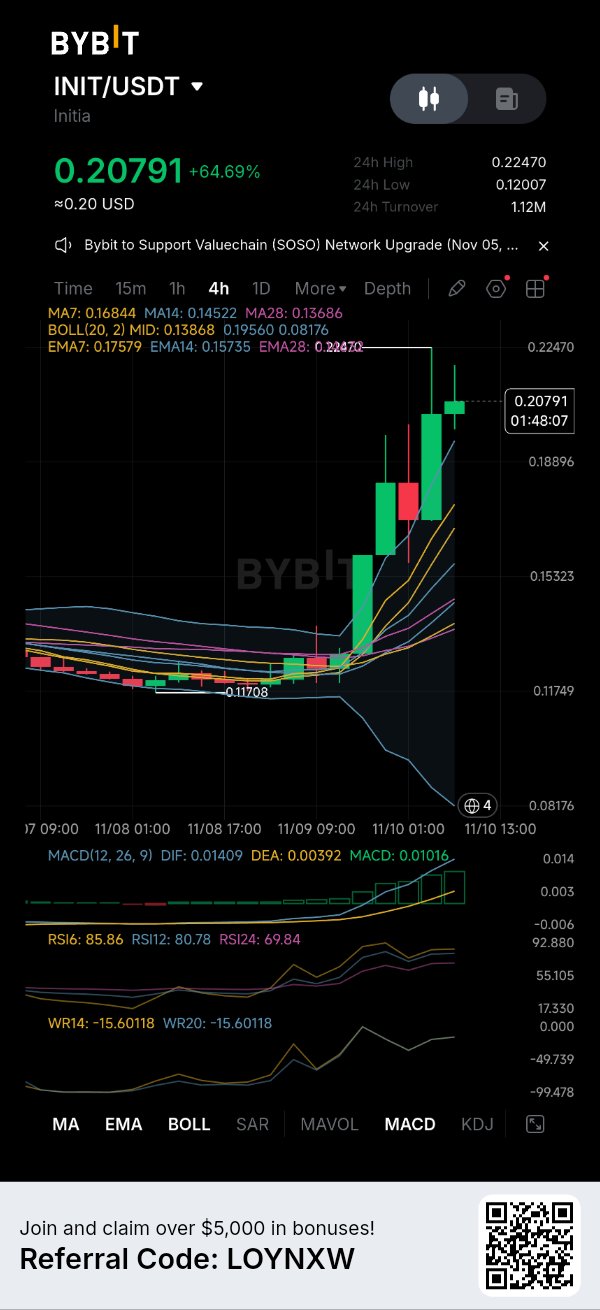
$INITUSDT is up 65% while its own chain is paused after an exploit. Read that again before you chase. Reported facts: attackers used compromised rollup keys to forge IBC transfers and drain about $605K in USDC, and the L1 paused block production. That follows an Oct 23 exploit of about $2.7M. Yet price ripped, with spot volume around $33M against futures volume near $883M, and funding deeply negative (about -1.8%). Negative funding means shorts were paying longs. That reads like a squeeze, not adoption. 4H view: 0.20791 is above the upper band (0.1956), RSI6 is 85.9, and price sits 23% above the MA7 (0.1684). The 0.2247 spike got rejected. Bull: 4H close above 0.2247, squeeze continues. Bear: a close under 0.1756 (EMA7) opens the fade zone down toward 0.1387 (mid band), near where the move started. Paused chain, thin liquidity, possible exchange restrictions. Size like it can gap both ways. Is this a squeeze you'd trade, or a trap you'd skip? Not financial advice. DYOR. #IMPACTbyTrade #WSOT2026 #NovUSCPIWatch #WSOTPicktoEarn10U #USPayrollsAndRateDecisionsDriveMacroWeek #OilVolatilityTracksIranPeaceTalks $BTCUSDT
ETF sedang menjual ETH. BitMine sedang membeli.
$ETHUSDT spot ETF telah mencatat penjualan selama enam minggu berturut-turut: $365 juta keluar minggu lalu dan $185 juta lagi pada hari Senin. Sementara itu, BitMine membeli lagi 9.587 ETH dan kabarnya para whale sedang mengakumulasi. Salah satu pihak pasti salah. Tampilan 4H: ETH berada di 2.099,80, di bawah setiap MA (MA7 2.122, MA14 2.155, MA28 2.197), dengan RSI6 di 28 dan WR di -83. Memang oversold (jenuh jual), ya. Tapi oversold dalam tren turun hanya berarti jenuh, bukan berarti selesai. Level terendah 2.070,26 adalah garis yang perlu dipertahankan oleh para bull. 2.100 adalah angka yang diperhatikan semua orang. Jika jebol pada penutupan harian, target berikutnya yang disebut orang-orang adalah 2.000, lalu 1.850. Bull: Penutupan 4H di atas 2.155 (MA14), bukti pertama bahwa pantulan ini punya potensi. Bear: Penutupan 4H di bawah 2.070,26, dan 2.000 akan menjadi target berikutnya. US CPI akan rilis pada pukul 14.30 waktu Nigeria. Pasang posisi kecil sebelum rilis data itu, kawan-kawan. Penjual ETF atau pembeli saat harga turun (dip buyers), siapa yang benar? Pilih satu sisi dan tentukan di mana posisi Anda salah. Bukan nasihat keuangan. DYOR (Lakukan riset sendiri). #IMPACTbyTrade #WSOT2026 #Pantauan IHK AS November #WSOTPicktoEarn10U #Data Penggajian AS dan Keputusan Suku Bunga Mendorong Pekan Makro #Volatilitas Minyak Melacak Pembicaraan Perdamaian Iran $ETHUSDC


Saham meroket. BTC tidak. Itu tandanya.
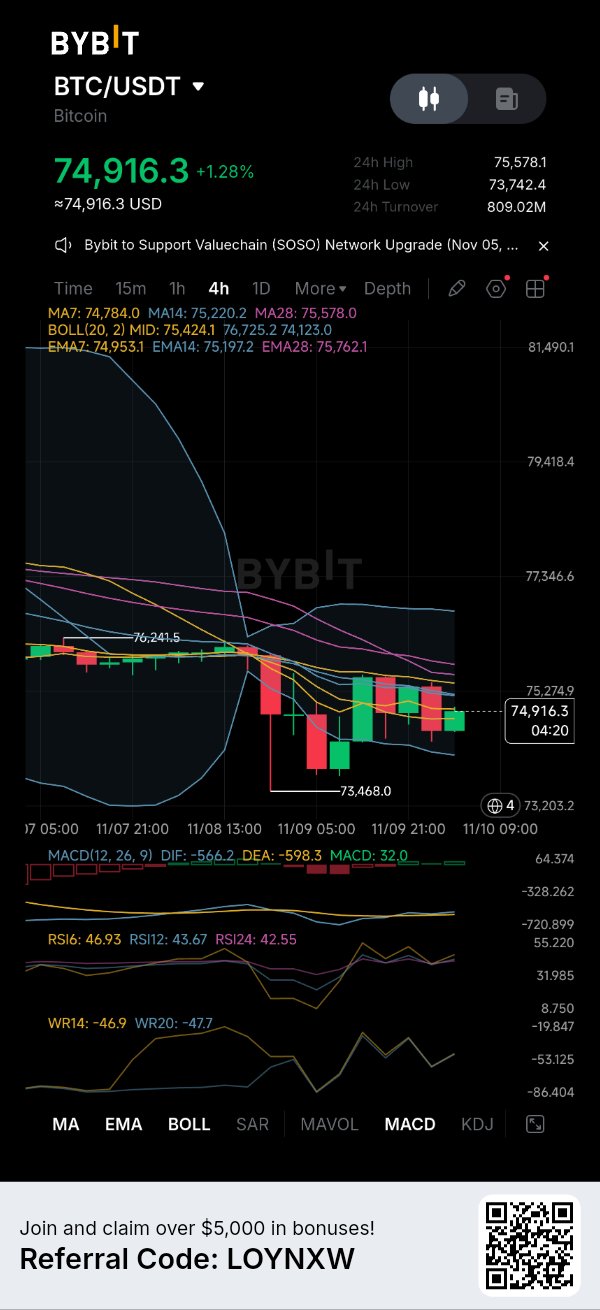
Saham AS mencatatkan hari terbaiknya sejak April kemarin (S&P +2,3%). $BTCUSDT ? Hampir tidak bergerak, masih di kisaran 75K. Saat BTC tidak bisa mengikuti hari *risk-on* (optimisme pasar), saya jadi waspada. Sebagian penyebabnya adalah arus modal. ETF Spot BTC telah mengalami *outflow* sekitar $1,48 Miliar di bulan November sejauh ini, dengan tambahan $201 juta keluar pada laporan terbaru. Pembeli marjinal belum terlihat. Tampilan 4H: BTC berada di 74.916, terjepit di antara level terendah 73.742 dan level tertinggi 75.578. Di atas ada tumpukan *resistance* (MA14, EMA14, mid band, MA28, EMA28 di 75.197-75.762), dan MACD masih di bawah nol. *Band* semakin menyempit, jadi pergerakan besar sedang bersiap. Bull: Penutupan 4H di atas 75.762, target berikutnya 76.241. Bear: Penutupan 4H di bawah 73.468 dan level terendah akhir pekan akan jebol. Data CPI AS akan dirilis pukul 14:30 waktu Nigeria, setelah kenaikan suku bunga The Fed bulan September. Jangan terlalu terpaku pada level harga sebelum data itu keluar, kawan-kawan. Apakah BTC yang tertinggal dari saham merupakan peringatan, atau justru seperti pegas yang sedang tertekan? Bukan nasihat keuangan. Lakukan riset mandiri (DYOR). #WSOT2026 #Pantauan IHK AS November #WSOTPicktoEarn10U #Data Penggajian AS dan Keputusan Suku Bunga Mendorong Pekan Makro #Volatilitas Minyak Melacak Pembicaraan Perdamaian Iran $BTCUSDC

$HYPEUSDT Bangkit dari $72,47: Bisakah Bulls Merebut Kembali $77? Hyperliquid ($HYPE) sedang berupaya stabil setelah penurunan tajam yang mendorong harganya ke $72,474. Saat ini diperdagangkan di kisaran $75,17, HYPE telah bangkit dari level terendah barunya, namun grafik 4 jam menunjukkan bahwa penjual masih memegang kendali yang lebih luas. Apa yang diungkapkan oleh indikator: • Harga berada di atas MA7 ($74,536) tetapi tetap di bawah MA14 ($75,965) dan MA28 ($77,245). • Histogram MACD telah berubah positif di 0,082, yang menunjukkan momentum bearish mungkin mulai mereda. • DIF di -1,675 telah bergerak di atas DEA di -1,758, meskipun keduanya masih berada di bawah nol. • RSI6 berada di 45,89, sementara RSI12 dan RSI24 tetap berada di sekitar 40. Level kunci yang perlu diperhatikan: - Support terdekat: $74,536 - Support utama: $73,010–$72,474 - Resistance pertama: $75,965–$76,736 - Resistance utama: $77,245–$77,582 - Resistance lebih tinggi: $80,461 Pergerakan berkelanjutan di atas $76,736 dapat memperkuat upaya pemulihan, dengan area $77,245–$77,582 menjadi rintangan besar berikutnya. Namun, penolakan di sekitar $76 dapat mengirim HYPE kembali ke arah $74,536. Kehilangan support tersebut akan membuat level terendah $72,474 kembali menjadi fokus. Perbaikan pada MACD patut diperhatikan, tetapi persilangan bullish di bawah nol tidak secara otomatis mengonfirmasi pembalikan tren. Fokus trading: Perhatikan bagaimana HYPE bereaksi di sekitar $76,7. Reclaim (pengambilan kembali) yang terkonfirmasi dapat meningkatkan prospek bullish, sementara penolakan lainnya akan lebih condong pada sikap berhati-hati. Tentukan titik invalidasi dan nilai risk-to-reward sebelum mempertimbangkan sebuah posisi. Bisakah HYPE merebut kembali $77, atau akankah penjual mempertahankan zona pemulihan tersebut? #HYPE #Hyperliquid #Bybit Bukan nasihat keuangan. DYOR (Lakukan riset sendiri). #WSOT2026 #Pantauan IHK AS November #WSOTPicktoEarn10U #Data Penggajian AS dan Keputusan Suku Bunga Mendorong Pekan Makro #Volatilitas Minyak Melacak Pembicaraan Perdamaian Iran
BNB at 686: Pricing the Platform Risk
$BNBUSDT is sitting at 686.67, and the market is doing something more important than watching a support line. It is repricing platform risk in real time. The chart shows the damage clearly. On the 1D timeframe, every moving average is above price: MA7 at 695.81, MA14 at 706.59, MA28 at 720.34. Price is pinned below the lower Bollinger Band at 719.97. MACD is negative (DIF -13.91, DEA -11.40, histogram -2.50). RSI6 is 35.83, RSI12 is 38.25. WR14 is -84.90. The structure is bearish, but the oscillators are stretched to the downside. The catalyst is not a normal correction. On October 29, Binance suffered a $6.3 billion security breach. The FBI linked the attack to North Korea's TraderTraitor group, and CZ confirmed US law enforcement helped freeze a significant portion of the stolen assets. Binance reported $3.64 billion in net outflows during the crisis window before resuming withdrawals. That is the event the chart is digesting. But here is what matters for the next move. Tonight, November 9 at 20:00, Binance co-CEO Richard Teng, Yi He, and CSO Jimmy Su are holding a public dialogue. This is not a routine update. After an incident of this size, the market is waiting to hear how the platform prices the risk, how users are compensated, and what the security failure actually was. The executives' answers will be the next input for the chart. The tokenomics side is quieter but still relevant. BNB completed its 37th quarterly burn on October 19, removing 1,646,196 BNB from circulation. Total supply is now 131,512,085, still working toward the 100 million floor. There are no scheduled unlocks. But the burn did not move price, which tells you the market is focused on the hack, not supply. Levels: · 673.21 (24h low): the immediate floor. Price is fighting here now. · 670–640: the demand zone buyers are trying to hold. Losing this opens the door toward 617–600. · 695.81 (MA7) and 706.59 (MA14): the reclaim zone. A close above this would suggest the panic is exhausting. · 719.97 (BB lower) and 720.34 (MA28): the level that would change the short-term trend. Bullish case: The oversold readings, the frozen stolen funds, and a clear public explanation tonight could stabilize the platform-risk premium. Reclaiming 695 and then 706 would be the first sign that buyers are looking past the hack. Bearish case: A daily close below 673 keeps the bearish stack intact. If the executives fail to provide clear answers on compensation or security, the 640 demand zone becomes the real test. Not financial advice. DYOR. Would you treat tonight's executive dialogue as a buying catalyst if the answers are clear, or does the chart need to reclaim 706 first before you trust it? #WSOT2026 #NovUSCPIWatch #WSOTPicktoEarn10U #USPayrollsAndRateDecisionsDriveMacroWeek #OilVolatilityTracksIranPeaceTalks $BNBUSDC


PEPE Reclaims $0.0000052: Upper Band Test Active
$PEPEUSDT has staged a strong multi-day recovery off its $0.00000421 baseline, pressing into upper Bollinger Band resistance as 24-hour volume holds firm at $18.44M. But bidding market orders directly into a structural supply cap without waiting for a daily close confirmation is how aggressive buyers risk catching pullbacks. On Bybit, $PEPE trades near $0.000005201 (+2.99%), consolidating near its 24h high of $0.000005392 after defending the $0.000004777 floor on 18.44M daily turnover. What the 1D Bybit chart reveals: * Upper band penetration: Spot price pierced above the $0.000005251 upper Bollinger Band to print a local wick high of $0.000005392 before pulling slightly back. * Moving average stack: The fast dynamic trend stack turned bullish, with price holding cleanly above MA7 ($0.000004947), MA14 ($0.000004881), and MA28 ($0.000004571), anchored by the 20-day mid-band ($0.000004751). * Momentum expansion: Daily RSI(6) expanded to 68.25 (RSI12 at 62.81) with WR14 sitting at -33.80. The MACD histogram printed green at +0.00000016 as DIF (0.000000202) holds above DEA (0.000000185). Market catalysts & ecosystem updates: PEPE’s breakout momentum follows a technical exit from its long-term descending channel, with daily trading volume expanding across major exchanges. In parallel, overall platform connectivity remains steady as Bybit confirmed active support for ecosystem network upgrades, including the Valuechain (SOSO) infrastructure maintenance. Two execution setups on watch: * Trend continuation: A confirmed daily close clearing $0.00000539 opens an expansion runway targeting the $0.00000568–$0.00000600 overhead liquidity shelf. * Support retest: Rejection at $0.00000539 opens an orderly pullback toward the $0.00000494 (MA7) or $0.00000475 mid-band floor to reset 6-period RSI conditions. Check live order book depth, meme coin liquidity, and funding rates on the Bybit card below before entering positioning. Not financial advice. DYOR. #WSOT2026 #NovUSCPIWatch #WSOTPicktoEarn10U #USPayrollsAndRateDecisionsDriveMacroWeek #OilVolatilityTracksIranPeaceTalks $PEPEUSDC


PIEVERSE Surges Hard, Catch The Trend Early 📈
$PIEVERSEUSDT is delivering an aggressive rally, climbing 40.19% to $2.0930 after breaking out of a prolonged consolidation around $1.35–$1.50. The 4H chart shows a clear shift in momentum: • Price is trading above MA7 ($1.6945), MA14 ($1.5592) and MA28 ($1.4497). • MACD is strongly bullish, with DIF at 0.1575 above DEA at 0.0981. • The MACD histogram has expanded to 0.0593. • RSI6 stands at 93.99, while RSI12 is 88.76, indicating extreme overbought conditions. • Price is trading significantly above the upper Bollinger Band at $1.9150. The breakout is impressive, but the distance from the moving averages suggests that chasing the rally at current levels carries substantial pullback risk. Key levels to watch: - Immediate resistance: $2.1821 - Psychological resistance: $2.20 - First support: $1.9150 - Secondary support: $1.7770 - Stronger support: $1.6945–$1.6294 A sustained breakout above $2.1821 could extend the bullish momentum. However, rejection near $2.18 could trigger profit-taking, with $1.9150 becoming an important level to monitor. The bigger question is whether this breakout can develop into sustained price discovery or whether buyers will need a cooling-off period first. Trading focus: Avoid chasing an extended candle. Watch for consolidation, a controlled pullback or a confirmed breakout retest. Check liquidity and define invalidation before considering any position. Is $PIEVERSE preparing for another leg higher, or is a cooldown approaching? Not financial advice. DYOR. #IMPACTbyTrade #WSOT2026 #NovUSCPIWatch #WSOTPicktoEarn10U #USPayrollsAndRateDecisionsDriveMacroWeek


SOL Rebounds From $85: Reclaiming $90 📈
$SOLUSDT is attempting to recover after a sharp sell-off pushed price down to $85.06. SOL is currently trading around $87.75, but the recovery still needs confirmation before a bullish reversal can be considered. What the 4H indicators reveal: • Price has reclaimed MA7 at $87.53 but remains below MA14 at $88.57 and MA28 at $89.98. • MACD remains negative, with DIF at -1.43 below DEA at -1.29. • RSI6 has recovered to 47.69, while RSI12 and RSI24 remain around 41. • The Bollinger midline sits at $89.09, making it an important recovery hurdle. Key levels to watch: - Immediate support: $87.46–$86.11 - Major support: $85.06 - First resistance: $88.33–$88.57 - Next resistance: $89.09–$90.00 - Higher resistance: $91.39 A sustained move above $88.57 could strengthen the recovery attempt, with $89.09–$90 becoming the next major test. However, rejection around $88.33–$89.09 could send SOL back toward $86.11. A breakdown below $85.06 would invalidate the immediate recovery scenario. The interesting development is that RSI is recovering while MACD remains bearish. Buyers are showing up, but they haven't established full control yet. Trading focus: Watch the $88.57 reclaim and the $86.11 support. Wait for confirmation, define invalidation and assess risk-to-reward before considering a position. Can SOL reclaim $90, or will sellers force another support test? Not financial advice. DYOR. #WSOT2026 #NovUSCPIWatch #WSOTPicktoEarn10U #USPayrollsAndRateDecisionsDriveMacroWeek #OilVolatilityTracksIranPeaceTalks $SOLUSDC


ARB Breakout And Approaching $0.188 Resistance
Arbitrum ($ARBUSDT ) is showing strong buying pressure after recovering from $0.15963. Price has climbed to $0.18405, approaching the recent high of $0.18792. The 4H technical structure has turned constructive. • Price is above MA7 ($0.17254), MA14 ($0.17050) and MA28 ($0.16705). • MACD is bullish, with DIF at 0.00344 above DEA at 0.00224. • The MACD histogram is positive at 0.00120, confirming improving momentum. • RSI6 is at 83.34, RSI12 at 74.20 and RSI24 at 64.33. However, there's a warning traders shouldn't ignore: ARB is trading above the upper Bollinger Band at $0.17820. This reflects aggressive buying but also increases the possibility of a short-term cooldown. Key levels to watch: - Immediate support: $0.17820 - Secondary support: $0.17254–$0.17050 - Stronger support: $0.16930 - First resistance: $0.18792 - Next psychological resistance: $0.19000 A sustained breakout above $0.18792 could extend the bullish move toward $0.19000. However, rejection around the recent high could trigger profit-taking and a retest of $0.17820. The momentum is impressive, but buying strength and chasing an extended candle are two different things. Trading focus: Watch for a confirmed breakout or a controlled pullback toward support. Define invalidation and assess risk-to-reward before considering a position. Can ARB clear $0.188, or is a cooldown coming first? Not financial advice. DYOR. #WSOT2026 #NovUSCPIWatch #WSOTPicktoEarn10U #USPayrollsAndRateDecisionsDriveMacroWeek #OilVolatilityTracksIranPeaceTalks $ARBUSDC


SUI Defends $0.80: Can Bulls Reclaim $0.85?
$SUIUSDT is attempting to stabilise after a sharp sell-off pushed price to $0.8011. Currently trading around $0.8294, SUI has recovered from its recent low, but the broader 4H structure remains under pressure. The technical picture is mixed: • Price remains below MA7 ($0.8313), MA14 ($0.8439) and MA28 ($0.8606). • MACD remains negative, with DIF at -0.0154 below DEA at -0.0131. • RSI6 has recovered to 42.49, while RSI12 and RSI24 remain below 42. • The Bollinger midline sits at $0.8518, leaving another resistance hurdle for buyers. Key levels to watch: - Immediate support: $0.8154 - Major support: $0.8011 - First resistance: $0.8313–$0.8439 - Next resistance: $0.8518–$0.8606 - Higher resistance: $0.8881 A sustained move above $0.844 could improve the recovery outlook, with $0.852–$0.861 becoming the next test. However, rejection around the moving averages could send SUI back toward $0.8154. A breakdown below $0.8011 would invalidate the immediate support-recovery scenario. The important distinction is between a temporary bounce and a genuine change in market structure. Trading focus: Watch whether buyers can reclaim $0.844 or whether sellers force another support test. Set alerts, define invalidation and assess risk-to-reward before considering a position. Can $SUIUSDC reclaim $0.85, or are sellers still in control? Not financial advice. DYOR. #WSOT2026 #NovUSCPIWatch #WSOTPicktoEarn10U #USPayrollsAndRateDecisionsDriveMacroWeek #OilVolatilityTracksIranPeaceTalks


ETH Retests $2,103: Support Compression In Play
$ETHUSDT is retesting the critical $2,103 demand floor as selling pressure compresses lower band volatility across intraday timeframes. Bidding market orders directly into dynamic overhead moving average resistance without waiting for structural defense confirmation risks catching secondary liquidity sweeps. On Bybit, $ETH trades near $2,103.44, testing its intraday baseline low after pulling back from local resistance. What the chart structure reveals: * Demand floor test: Spot price is battling to hold the $2,100–$2,105 zone, which serves as the primary line of defense against extended down-trending expansion. * Dynamic moving average resistance: Overhead trend resistance remains anchored by short-term moving averages, keeping pressure on the lower Bollinger Band boundary. * Momentum reset: Short-period RSI and MACD indicators are pressing into oversold territory, signaling an impending expansion or mean-reversion move off current price compression. Fundamental & institutional context: Ethereum network liquidity continues to adjust following exchange ecosystem developments, including Bybit's verified support for active L2 token migrations like Aerodrome (AERO) and ongoing Layer-2 settlement activity across Base and mainnet DeFi infrastructure. Two execution setups on watch: * Support defense: Holding the $2,100 support floor and reclaiming dynamic 4H MA resistance opens a mean-reversion move targeting the upper band ceiling. * Breakdown continuation: A confirmed close below $2,100 clears the path for a liquidity sweep toward key lower macro demand zones. Check live order book depth and funding rates on the Bybit card below before entering positioning. Not financial advice. DYOR. #WSOT2026 #NovUSCPIWatch #WSOTPicktoEarn10U #USPayrollsAndRateDecisionsDriveMacroWeek #OilVolatilityTracksIranPeaceTalks $ETHUSDC


$BTCUSDT Blok Mencapai 11,2 Ribu Transaksi: Tonggak Sejarah Lapisan dasar Bitcoin baru saja mencetak tonggak sejarah yang langka. AntPool berhasil menambang blok 974961, memuat 11.255 transaksi yang mencengangkan dalam satu blok—jumlah transaksi tertinggi kedua dalam sejarah Bitcoin. Blok tersebut hanya terpaut 984 transaksi untuk memecahkan rekor jaringan sepanjang masa sebanyak 12.239 yang dibuat lebih dari satu dekade lalu pada 1 Agustus 2015. Beroperasi pada ukuran ~1,1 MB yang efisien (mengisi 99,85% batas berat blok), ini menyoroti lingkungan throughput yang sangat padat. Apa yang diungkapkan oleh tonggak sejarah on-chain ini: * Permintaan lapisan dasar yang berkelanjutan: Peristiwa ini menggarisbawahi tren makro 2026 yang ditentukan oleh jumlah transaksi harian yang konsisten tinggi dan aktivitas mempool dengan kepadatan tinggi. * Efisiensi biaya: Meskipun membawa beban besar 11.255 transfer, total biaya blok tetap sangat ringan sekitar 0,0024 BTC, yang mencerminkan pemrosesan transaksi batch yang dioptimalkan. * Ketahanan jaringan: Para penambang terus mendorong efisiensi ruang blok maksimum tanpa mengganggu irama konfirmasi atau parameter keamanan. Dua perspektif eksekusi yang perlu diperhatikan: * Ekspansi throughput: Metrik blok dengan kepadatan tinggi yang berkelanjutan menunjukkan adopsi penskalaan struktural di seluruh protokol sekunder dan batching. * Sensitivitas pasar biaya: Jumlah transaksi tinggi yang persisten menempatkan fokus lebih besar pada pelacakan kemacetan mempool selama jendela pasar dengan volatilitas tinggi. Periksa kedalaman order book langsung, hashrate jaringan, dan suku bunga pendanaan di kartu Bybit di bawah ini sebelum mengelola posisi spot atau derivatif Anda. Bukan nasihat keuangan. DYOR. #WSOT2026 #Pantauan IHK AS November #WSOTPicktoEarn10U #Data Penggajian AS dan Keputusan Suku Bunga Mendorong Pekan Makro #Volatilitas Minyak Melacak Pembicaraan Perdamaian Iran $BTCUSDC


XAUT Reclaims $4,078: Can Bulls Break $4,120?
Tether Gold ($XAUTUSDT ) is showing renewed strength after recovering from its recent $3,872.10 low. Price is now trading around $4,078.96, up 0.57% on the day, with buyers gradually rebuilding the daily structure. There are encouraging technical signals: • Price has reclaimed MA7 ($4,043.31), MA14 ($4,000.63) and MA28 ($4,047.49). • MACD histogram has turned positive at 20.37, suggesting improving bullish momentum. • RSI6 stands at 66.83, while RSI12 is at 55.43, showing stronger buying pressure. • Price is trading above the Bollinger midline at $4,008.32. However, the recovery is approaching a significant resistance zone. Key levels to watch: - Immediate support: $4,043–$4,008 - Stronger support: $3,944 - Major support: $3,872 - First resistance: $4,120 - Major resistance: $4,145–$4,147 A sustained daily breakout above $4,120 could open the way toward the upper Bollinger Band around $4,145. However, rejection around this region could trigger a pullback toward $4,043 or the $4,008 support area. The recovery is gaining strength, but the next resistance test will determine whether buyers can extend the move. Trading focus: Watch the $4,120 breakout level and the $4,008 support zone. Look for confirmation, assess risk-to-reward and avoid chasing an extended candle. Can XAUT reclaim $4,145, or will sellers defend the resistance zone? Not financial advice. DYOR. #WSOT2026 #NovUSCPIWatch #WSOTPicktoEarn10U #USPayrollsAndRateDecisionsDriveMacroWeek #OilVolatilityTracksIranPeaceTalks

