BITPIA
3484Suka0Pembagian48Penggemar77Ikuti
Full Time Trader
Full Time Trader
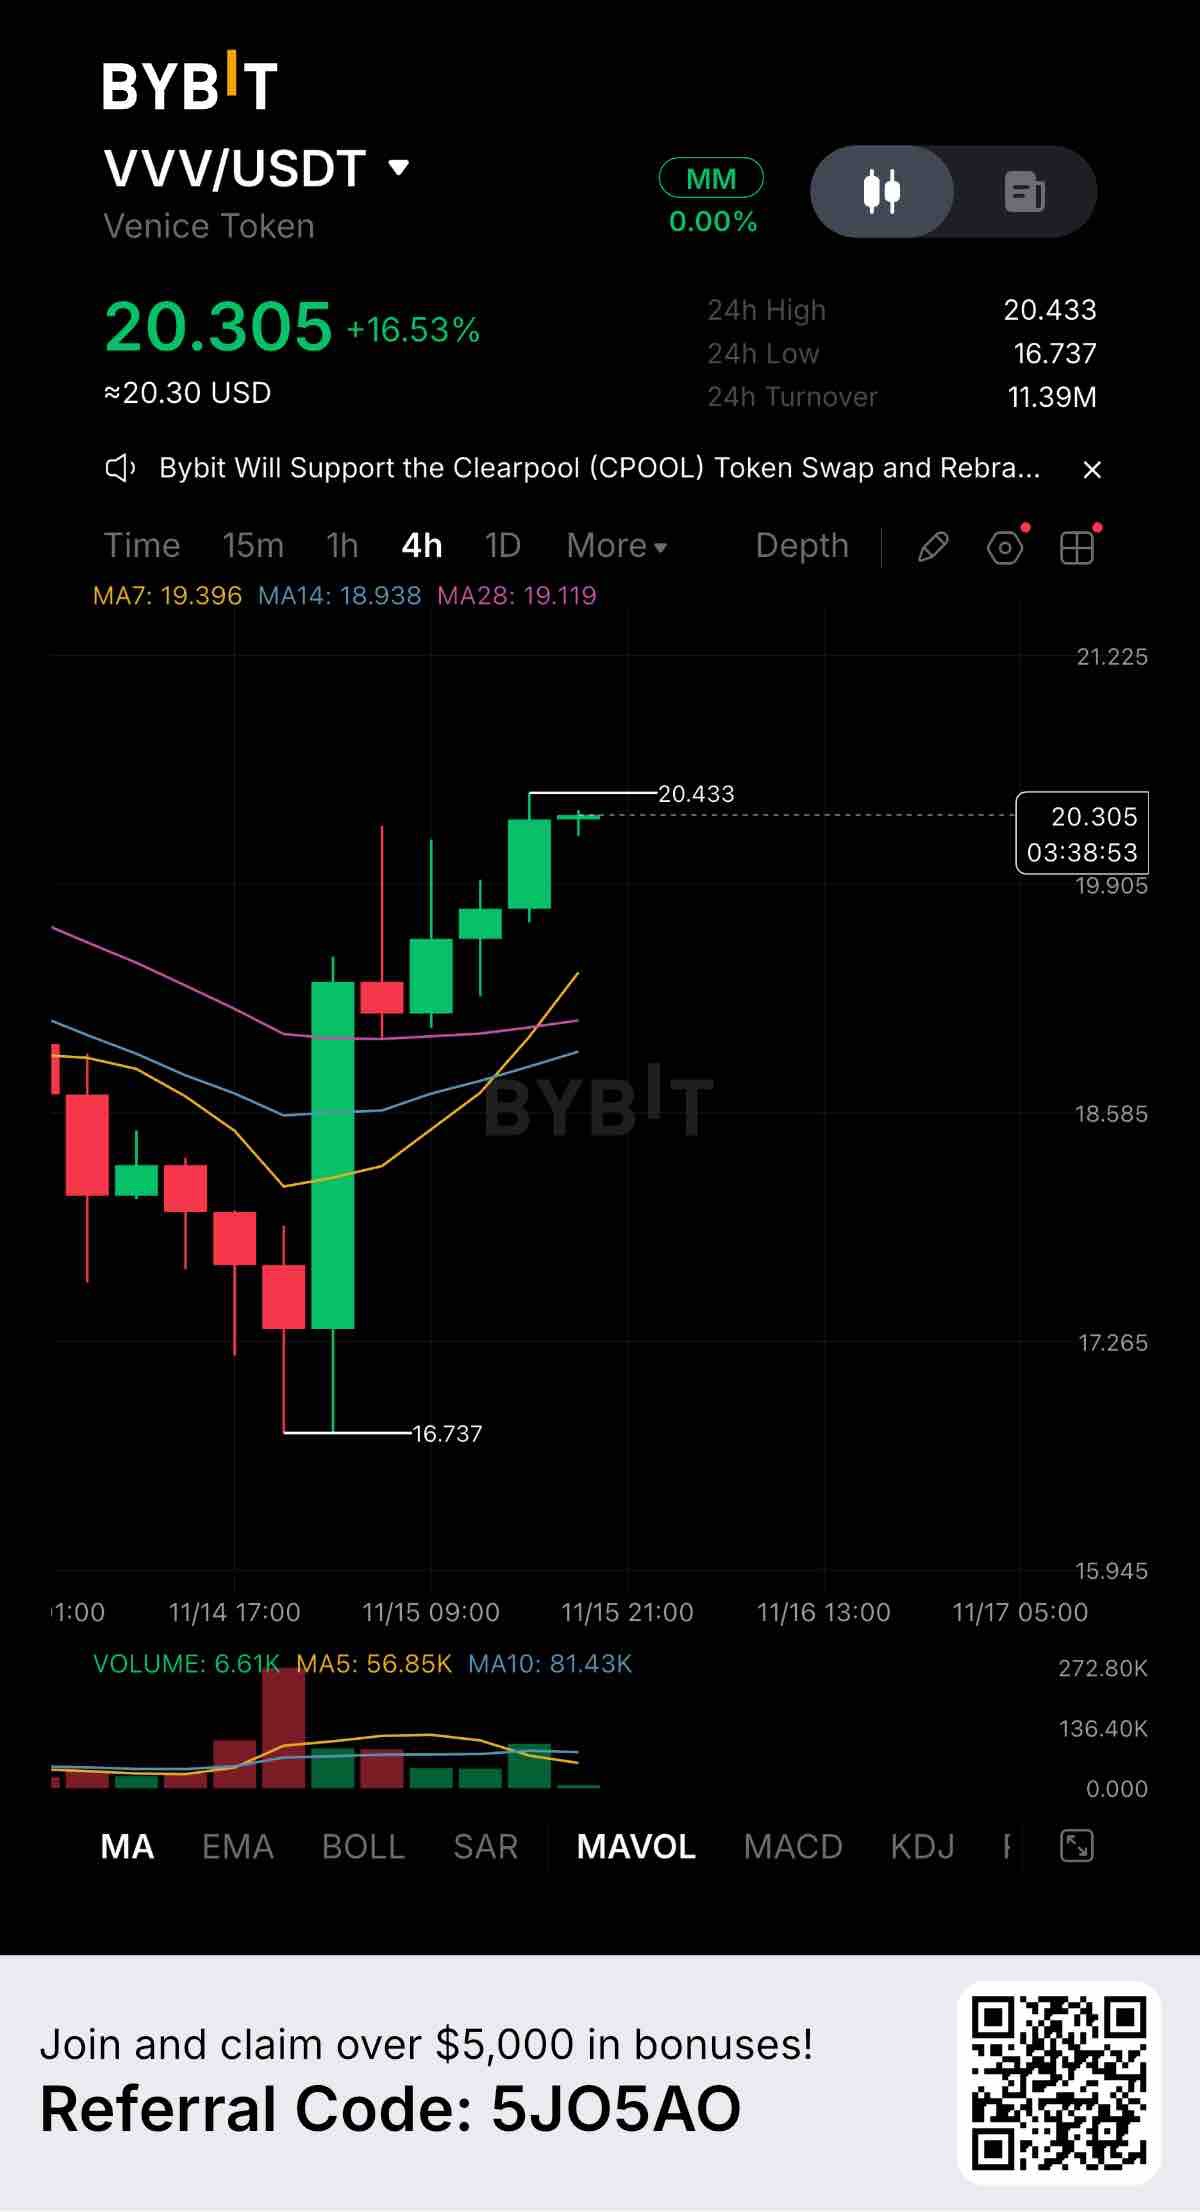
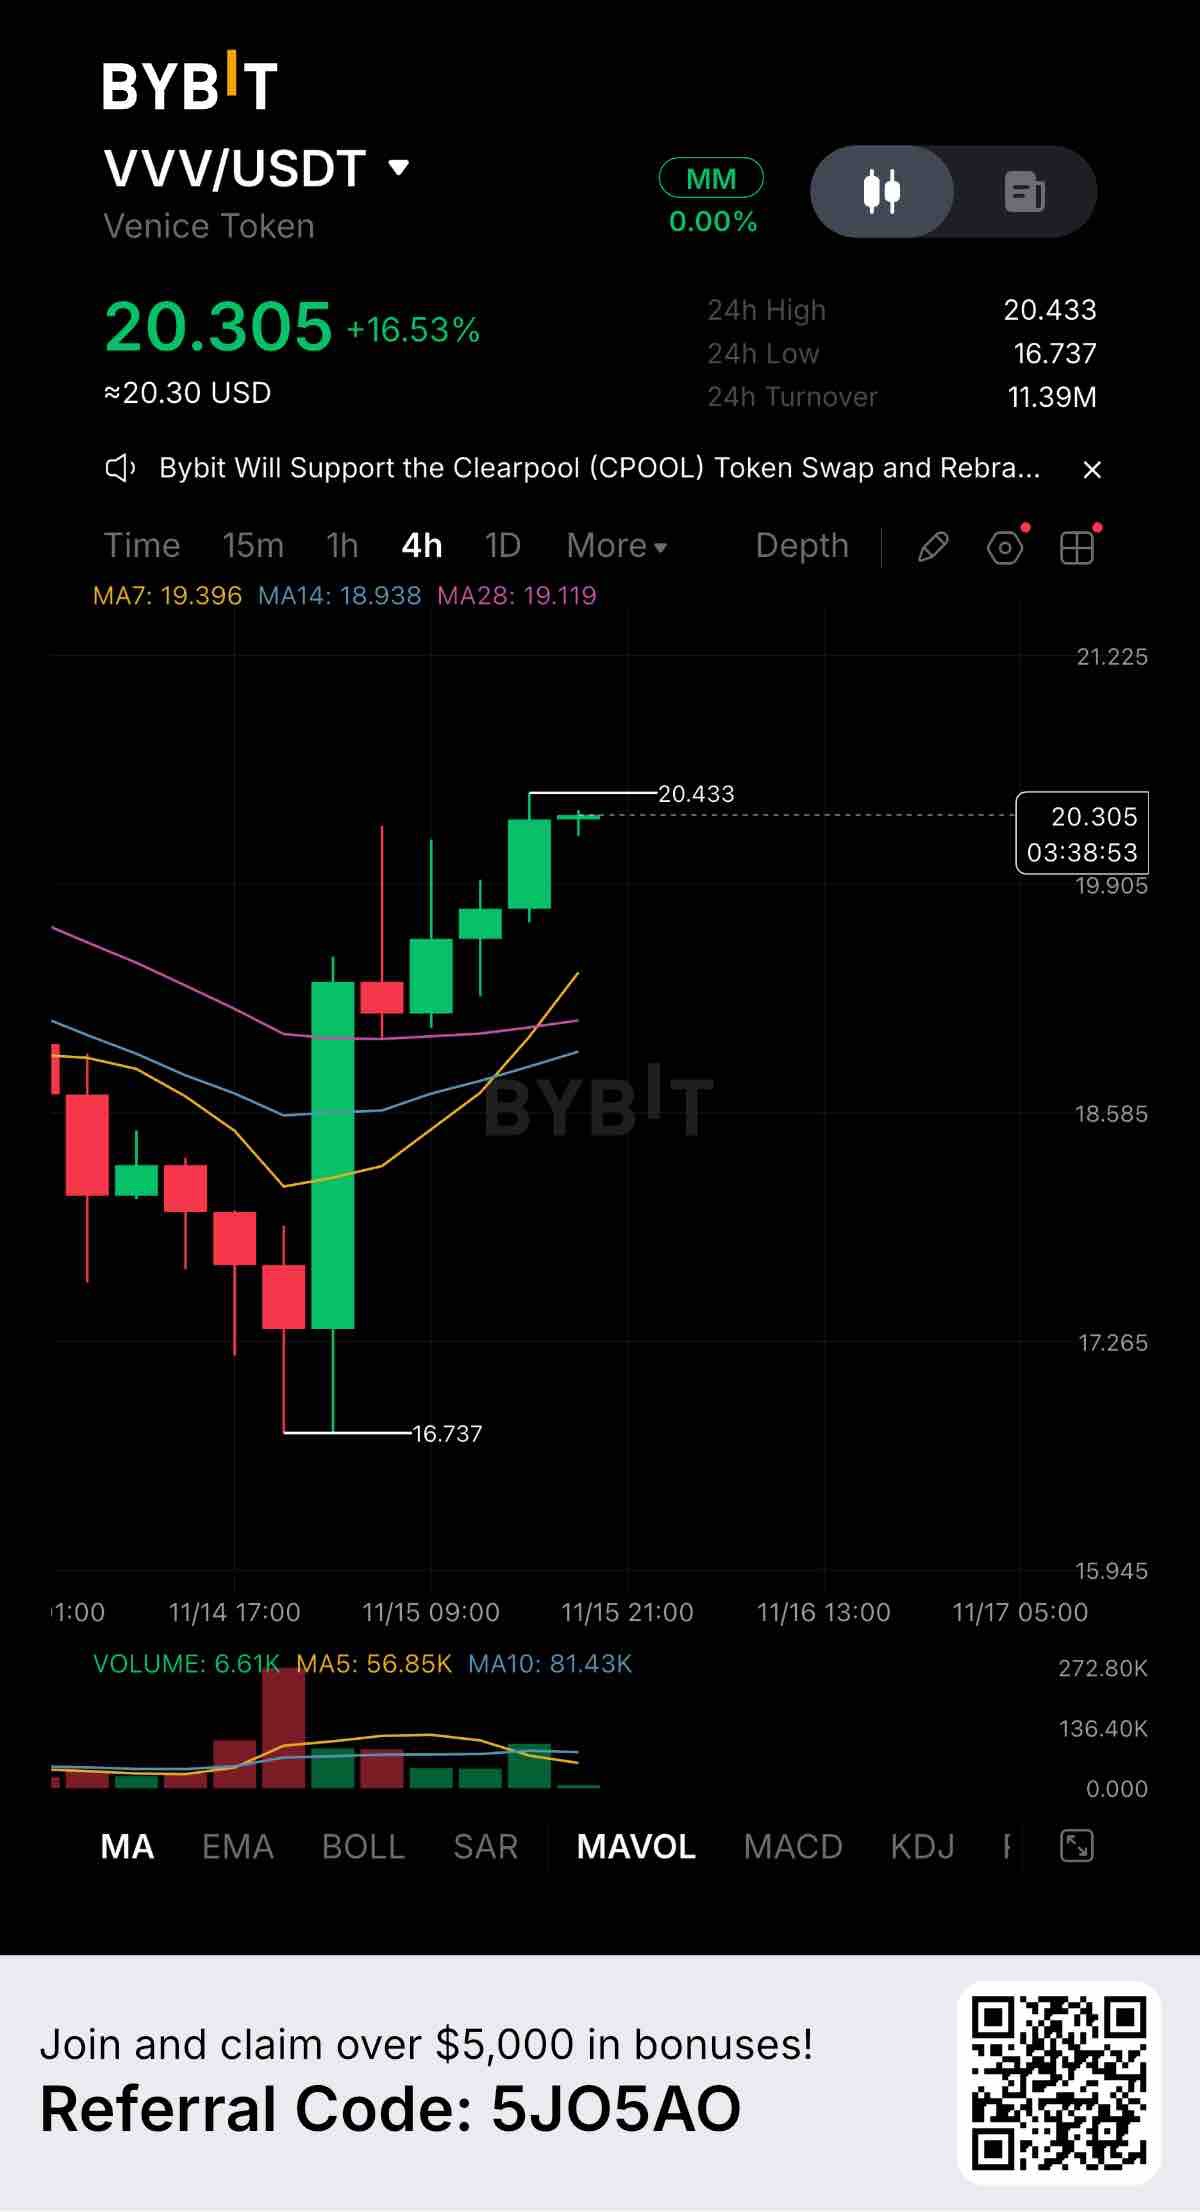
$VVVUSDT is showing a powerful recovery on the 4-hour chart, currently trading at 20.305 with an impressive +16.53% gain. After a steep drop down to 16.737, buyers stepped in aggressively with a massive green candle, completely reversing the trend and pushing the price into a strong, steady uptrend. Key Levels to Watch: Resistance: 20.433 (The current 24-hour high, acting as the immediate ceiling) Support 1: 19.396 (7-day MA, the first dynamic support zone) Support 2: 16.737 (24-hour low, the major structural floor) The moving averages are fully aligned with the bulls. Price is trading well above MA7, MA14, and MA28. The chart shows a textbook series of higher highs and higher lows, with buyers confidently stepping in to support every minor pullback. Volume is a major factor here. 24-hour turnover is a massive 11.39M USDT. While the initial bounce had explosive volume, the steady climb since then shows sustained buying pressure rather than just a quick squeeze. Fundamentally, Venice Token (VVV) is clearly in high demand right now. This kind of V-shaped recovery usually signals strong conviction from buyers who are eager to accumulate on dips. If buyers manage to break and hold above 20.433, we could see a push into price discovery. However, because the price is getting extended, waiting for a slight pullback toward the 19.396 support might offer a safer entry. Are you riding this VVV momentum, or waiting for a retest? Let’s hear your strategy in the comments. #ByXIMPACT #WSOT2026
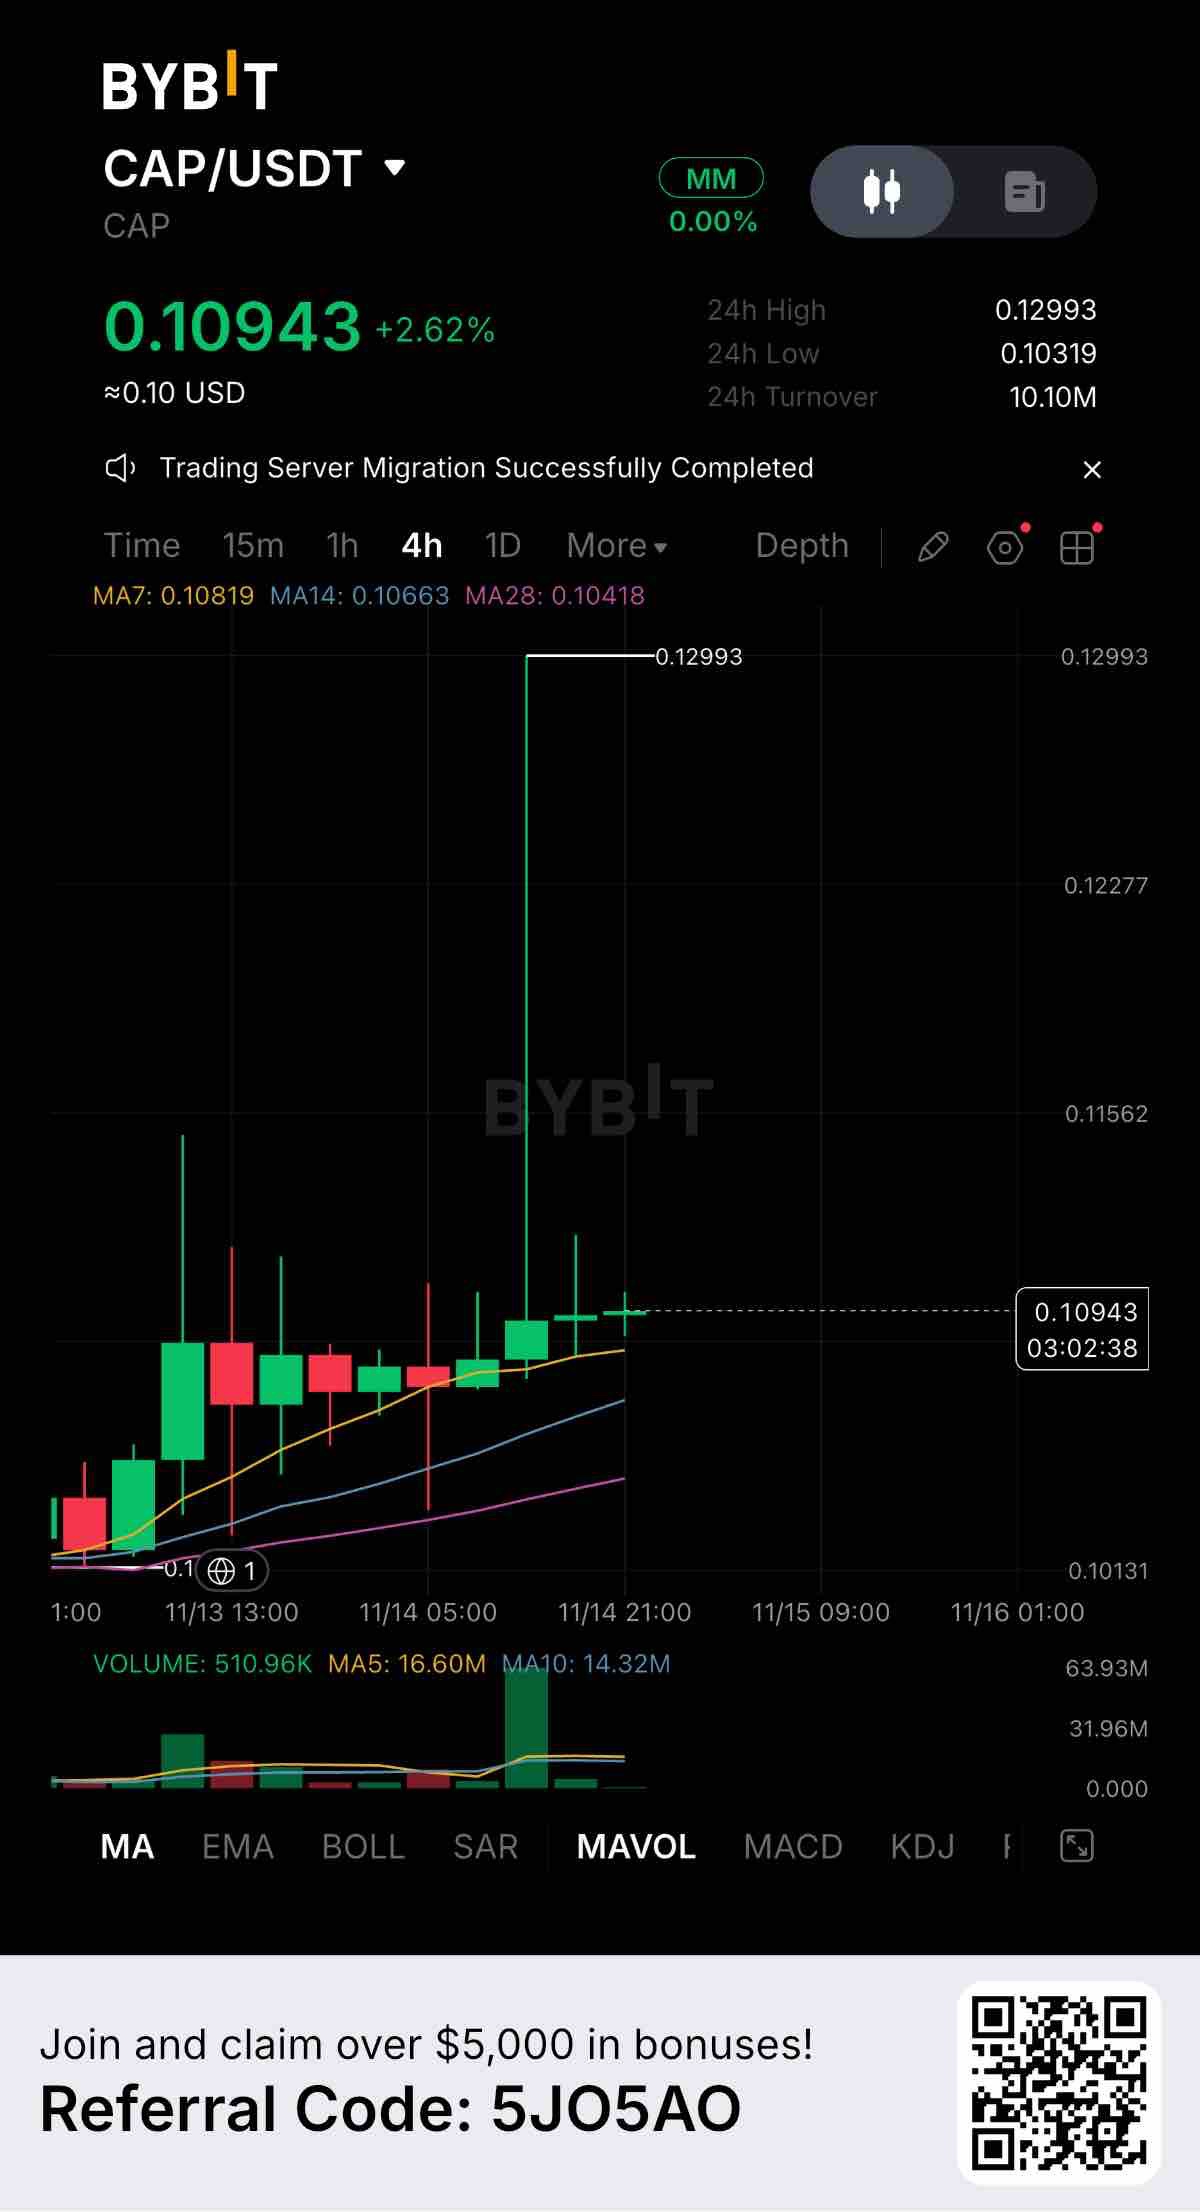
$CAPUSDT is showing extreme volatility on the 4-hour chart, currently trading at 0.10943 with a +2.62% gain. While the daily percentage looks modest, the chart itself tells a wild story. We just witnessed a massive liquidity spike with a huge green volume bar that sent the price skyrocketing to 0.12993, only for it to be immediately rejected and pushed all the way back down. Key Levels to Watch: Resistance: 0.12993 (The massive 24-hour high and the top of the rejection wick) Support 1: 0.10819 (7-day MA, currently acting as the immediate floor) Support 2: 0.10319 (24-hour low, the structural base) Looking at the moving averages, the broader trend is still pointing up. Price is holding above the MA7, MA14, and MA28. However, that massive upper wick is a clear warning sign that sellers are heavily defending the higher prices. The price is now consolidating and trying to stabilize above the 7-day MA. The volume is the most critical factor here. 24-hour turnover is a massive 10.10M USDT. The spike in volume confirms that big players are active in this market, but the rejection means the bulls lost that specific battle. If buyers can hold this 0.10819 support level and build a base, a retest of the highs is possible. But if this support breaks, we could see a sharp drop back toward the 0.10319 lows. How are you reading this CAP setup? Are you waiting for a confirmed breakout, or is that rejection wick a warning to stay away? Let’s discuss below. #ByXIMPACT #WSOT2026
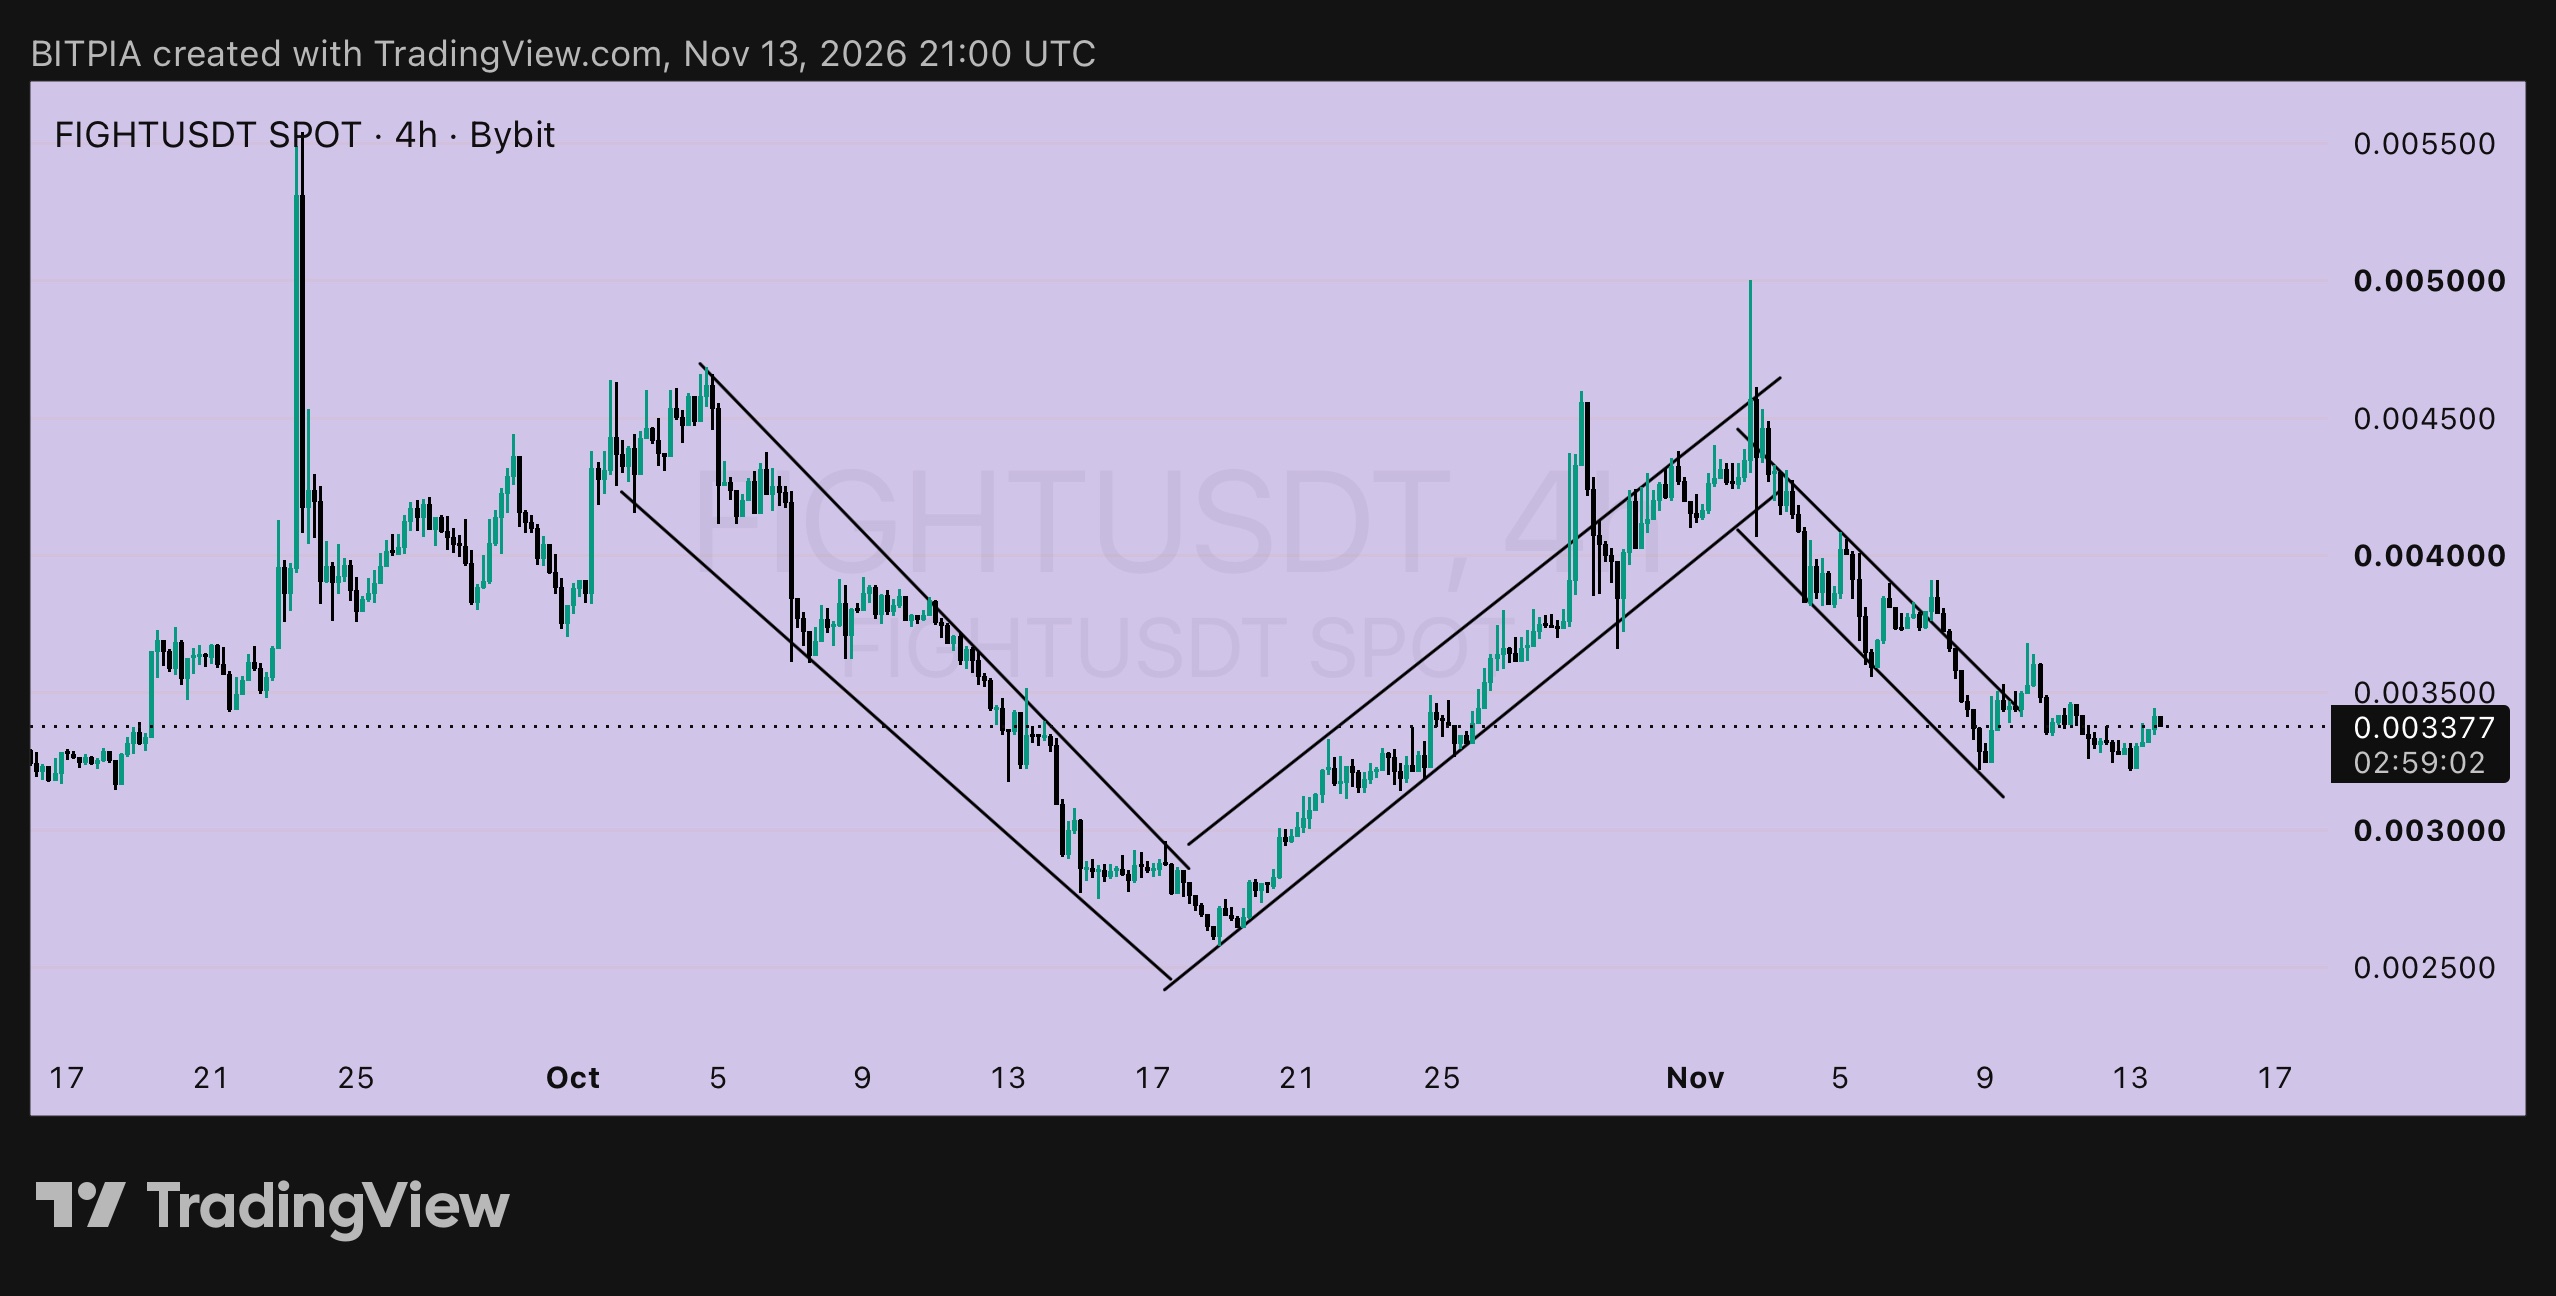
$FIGHTUSDT 4j: double low di 0.00322? 🔍 Pada 10 Nov, saya memposting $FIGHT di 0.003553 setelah berhasil menembus falling channel, dengan dua rencana: penutupan di atas 0.00358 (entry 0.00360, stop 0.00330) atau retest di dekat 0.00345 (stop 0.00322). Berikut adalah apa yang terjadi dan apa yang saya lihat sekarang. ➤ Apa yang terjadi ▸ Harga mencapai sekitar 0.00367 pada 11 Nov, tapi tidak bertahan lama di atas 0.00358, jadi high tersebut adalah lower high ▸ Harga kemudian turun kembali dan membuat low di dekat 0.00322 kemarin, pada dasarnya low yang sama dengan 9 Nov ▸ Jika Anda mengambil entry retest di dekat 0.00345 dan menggunakan stop 0.00322, Anda sudah atau hampir terkena stop-out, sekitar -1R. Jika Anda menunggu penutupan 4j, stop Anda mungkin masih aktif. Apa pun itu, saya tidak menutupi fakta bahwa pergerakan naik tersebut gagal ➤ Apa yang saya lihat sekarang ▸ Double low di sekitar 0.00322, terbentuk dengan jeda empat hari ▸ Harga berada di 0.003377, memantul, tapi masih di dalam falling channel pada chart 4j ▸ Pola zigzag sebelumnya dari Oktober belum terulang. Pasar justru memberikan lower high Double low bisa menjadi awal dari base, atau hanya jeda sebelum penurunan berikutnya. Saya ingin bukti, bukan harapan. ➤ Rencana A: the floor ▸ Entry: sekitar 0.00330, hanya jika level 0.00322 bertahan untuk ketiga kalinya ▸ Stop-loss: di bawah 0.00310 ▸ Risiko per unit: 0.00020 ▸ Target 1: 0.00360, +0.00030, sekitar 1.5R ▸ Target 2: 0.00385, +0.00055, sekitar 2.75R ▸ Target 3: 0.00420, +0.00090, sekitar 4.5R ➤ Rencana B: tunggu breakout ▸ Pemicu: penutupan 4j di atas 0.00350 ▸ Entry: sekitar 0.00355 ▸ Stop-loss: di bawah 0.00330 ▸ Risiko per unit: 0.00025 ▸ Target: 0.00385 (sekitar 1.2R) dan 0.00420 (+0.00065, sekitar 2.6R) ➤ Apa yang membatalkan skenario ini Penutupan 4j di bawah 0.00310 berarti double low telah gagal. Jika demikian, 0.0030 dan area 0.0026 dari Oktober adalah level berikutnya yang perlu diperhatikan, dan saya akan menunggu. Gunakan ukuran posisi kecil, dan leverage rendah jika Anda menggunakan perps. Bukan saran keuangan. Lakukan riset Anda sendiri dan hanya ambil risiko dengan dana yang Anda siap untuk kehilangan. #ByXIMPACT #WSOT2026
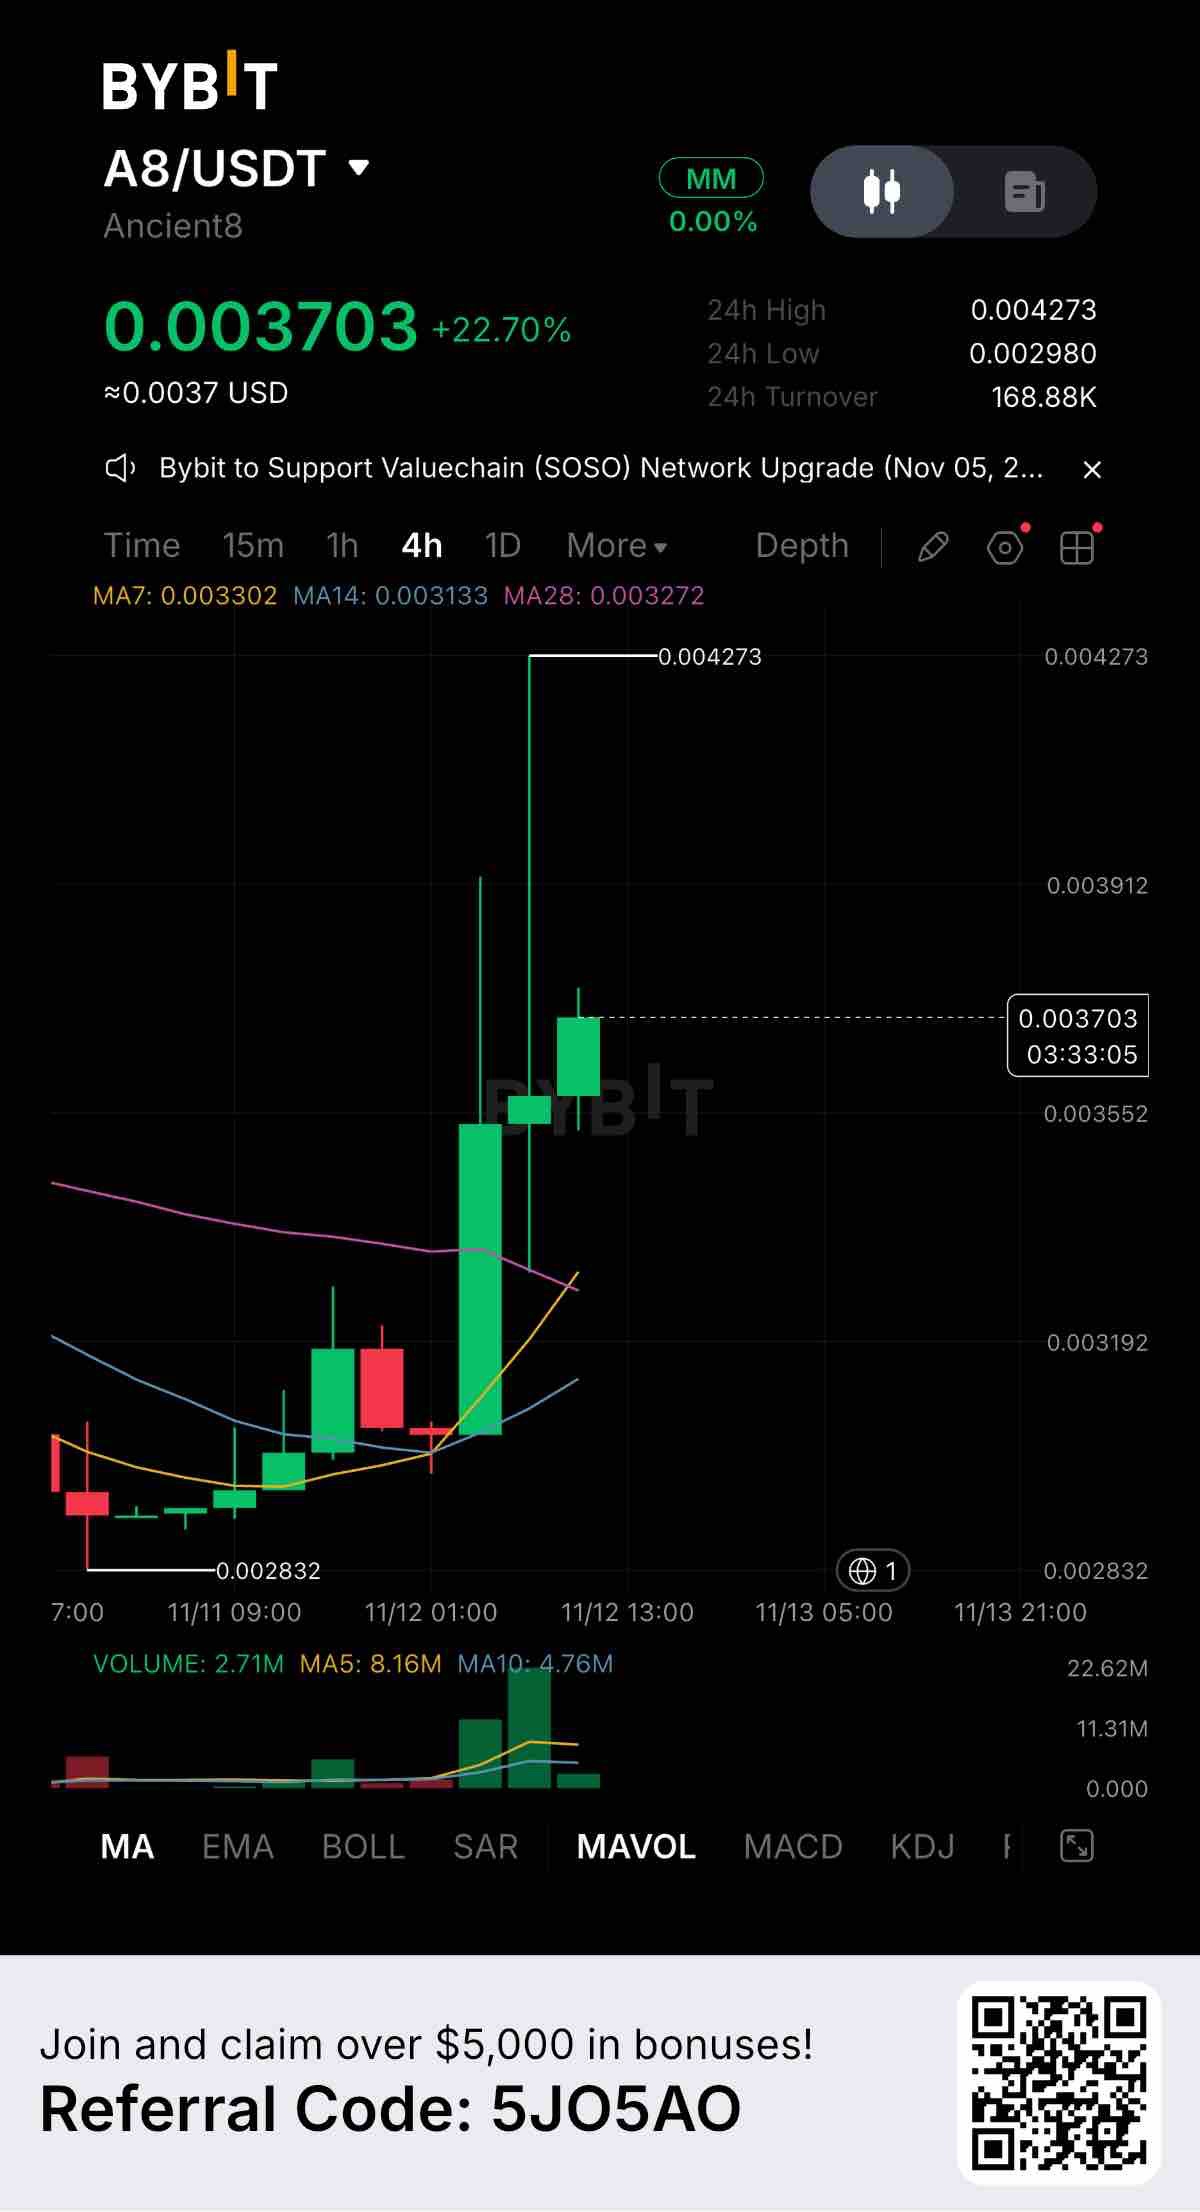
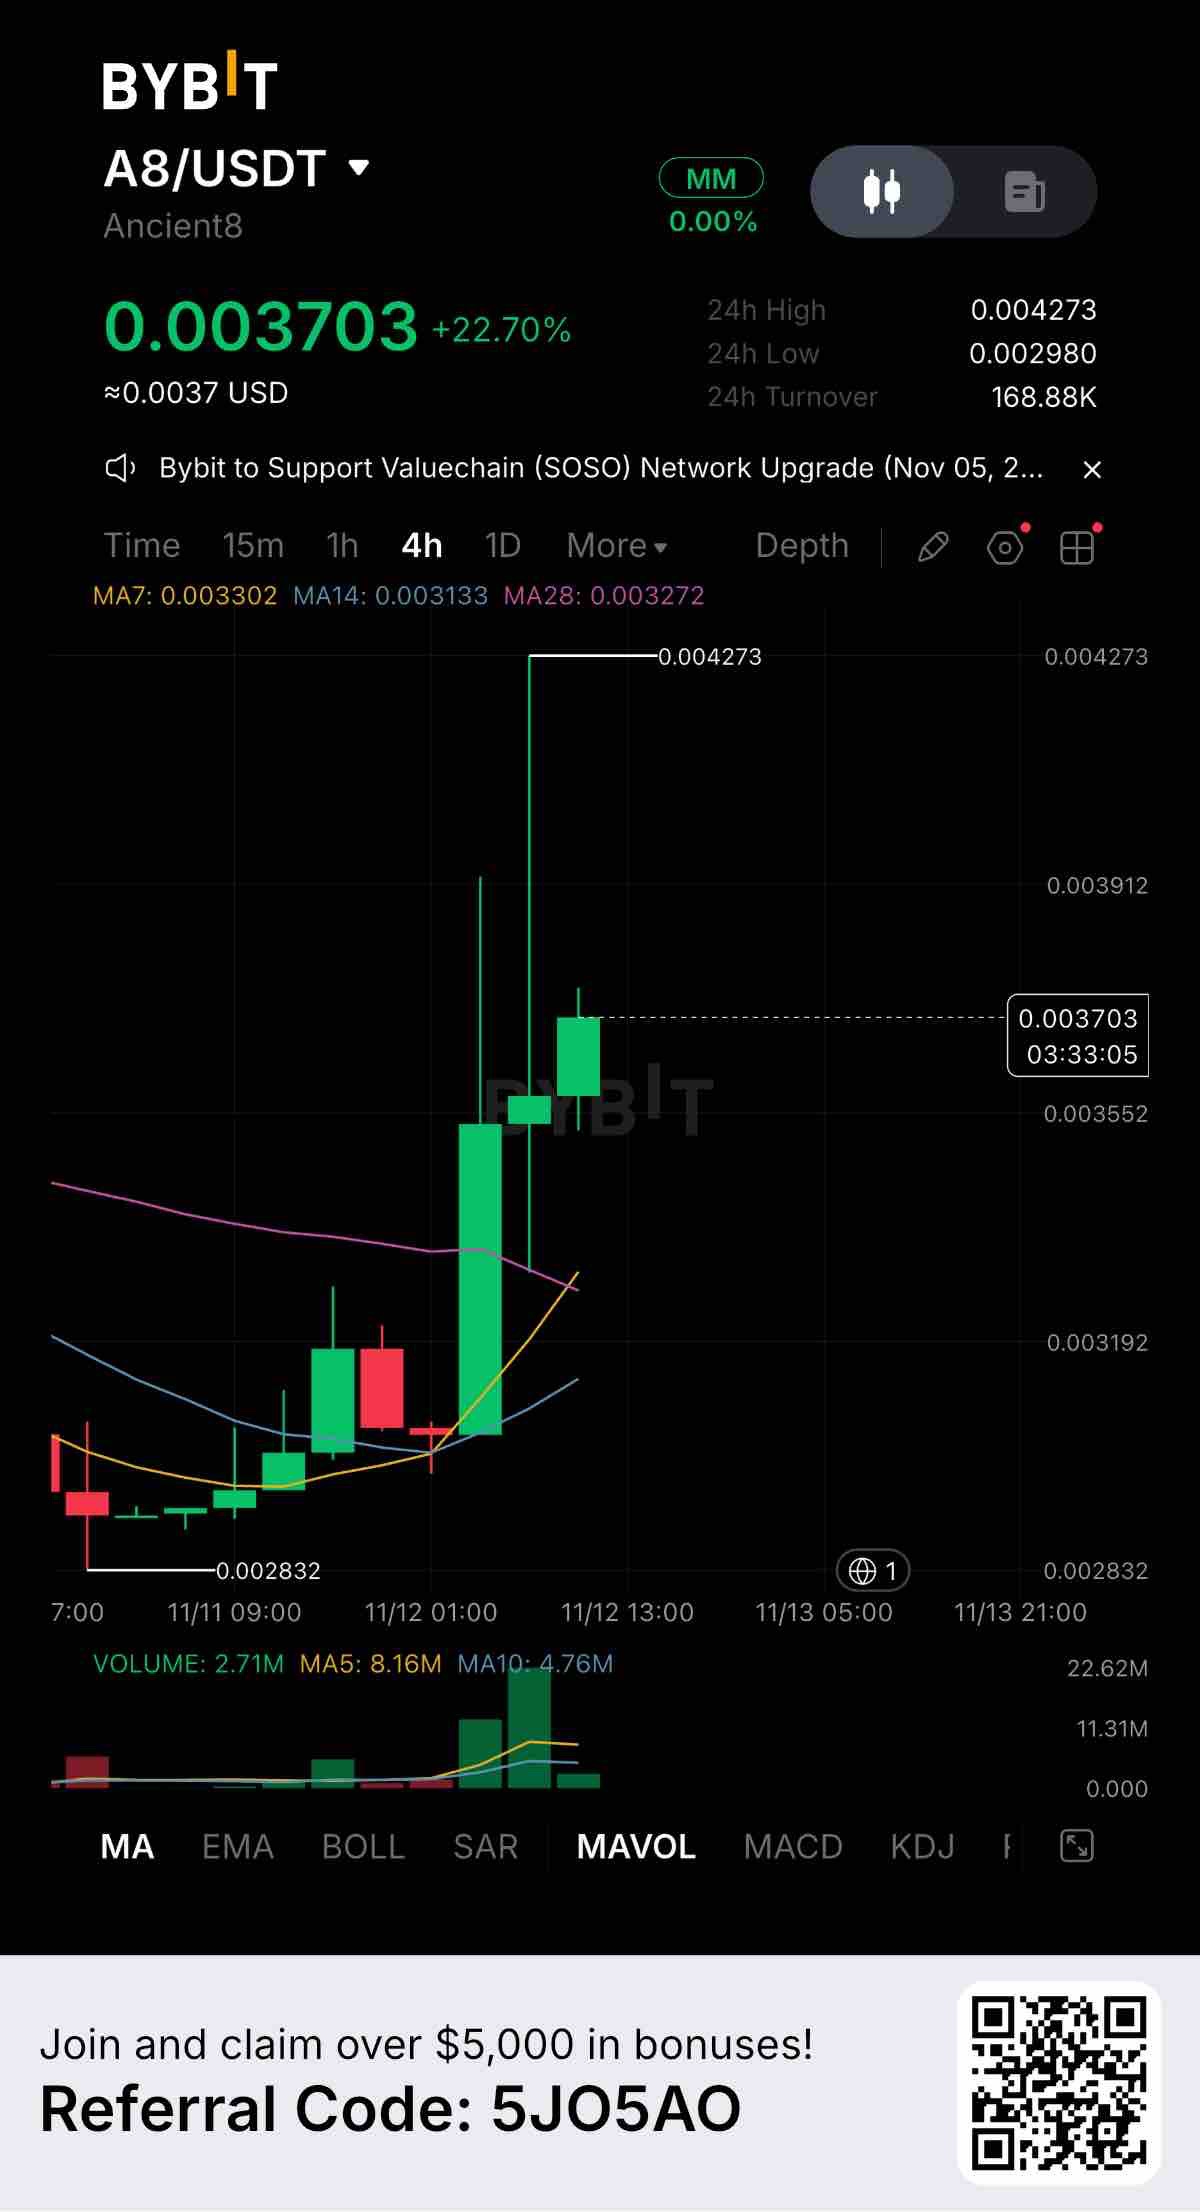
$A8USDT is putting on a wild show on the 4-hour chart, currently trading at 0.003703 with a massive +22.70% gain. This chart is a textbook example of extreme volatility. We saw an aggressive pump that left a massive upper wick stretching all the way to 0.004273 before sellers forcefully pushed the price back down. Key Levels to Watch: Resistance: 0.004273 (The top of the massive wick and the clear 24-hour high) Support 1: 0.003302 (7-day MA, the immediate dynamic support holding the current price) Support 2: 0.002980 (24-hour low, the structural floor) The moving averages are starting to cross over bullishly, and price is currently holding above MA7, MA14, and MA28. After that violent rejection at the highs, the price is now trying to stabilize. We are seeing a smaller green candle forming, indicating that buyers are attempting to build a base and defend the current levels. Volume is the main story here. The volume spike during the initial pump was massive, but 24-hour turnover has settled at 168.88K USDT. The key now is whether we see a surge of buying volume to push back up, or if the momentum is fading after that huge rejection. Fundamentally, Ancient8 (A8) is experiencing a sudden surge in market interest. Spikes like this often come from ecosystem news, but the heavy wick proves that sellers are very active at the top. If buyers can hold the 0.003302 support and build momentum, a retest of the highs is possible. But be careful: if support breaks, we could easily slide back down to the 0.002980 base. How are you playing this A8 volatility? Are you buying the dip or waiting for the dust to settle? Let me know below. #ByXIMPACT #WSOT2026
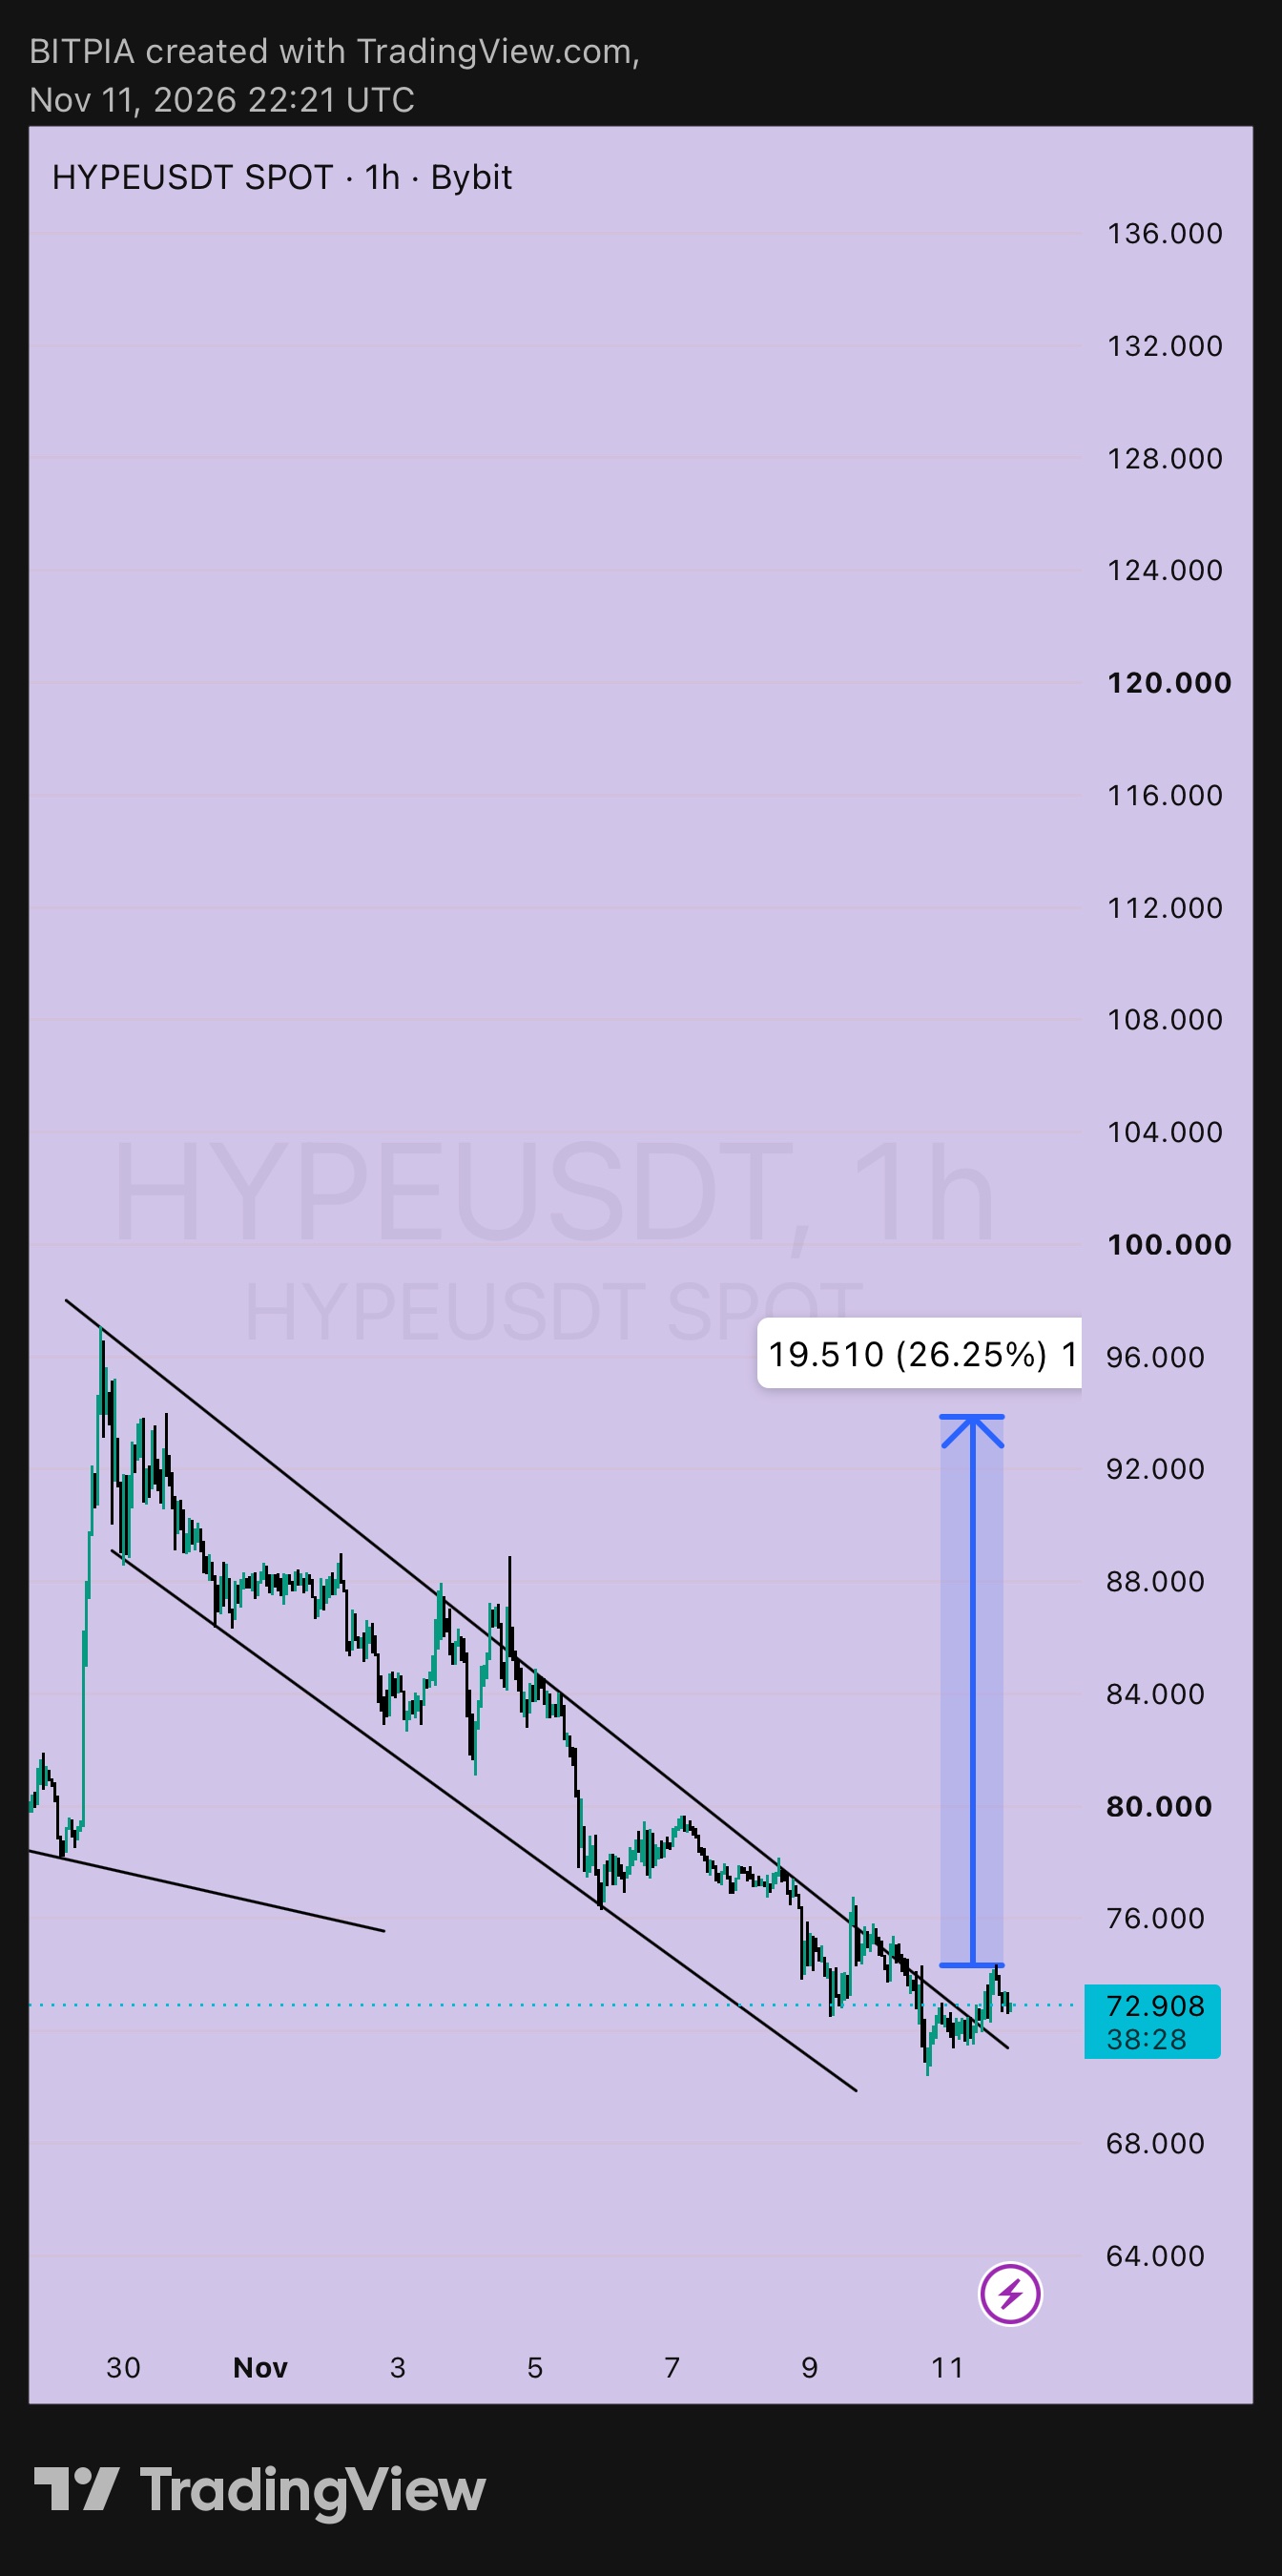
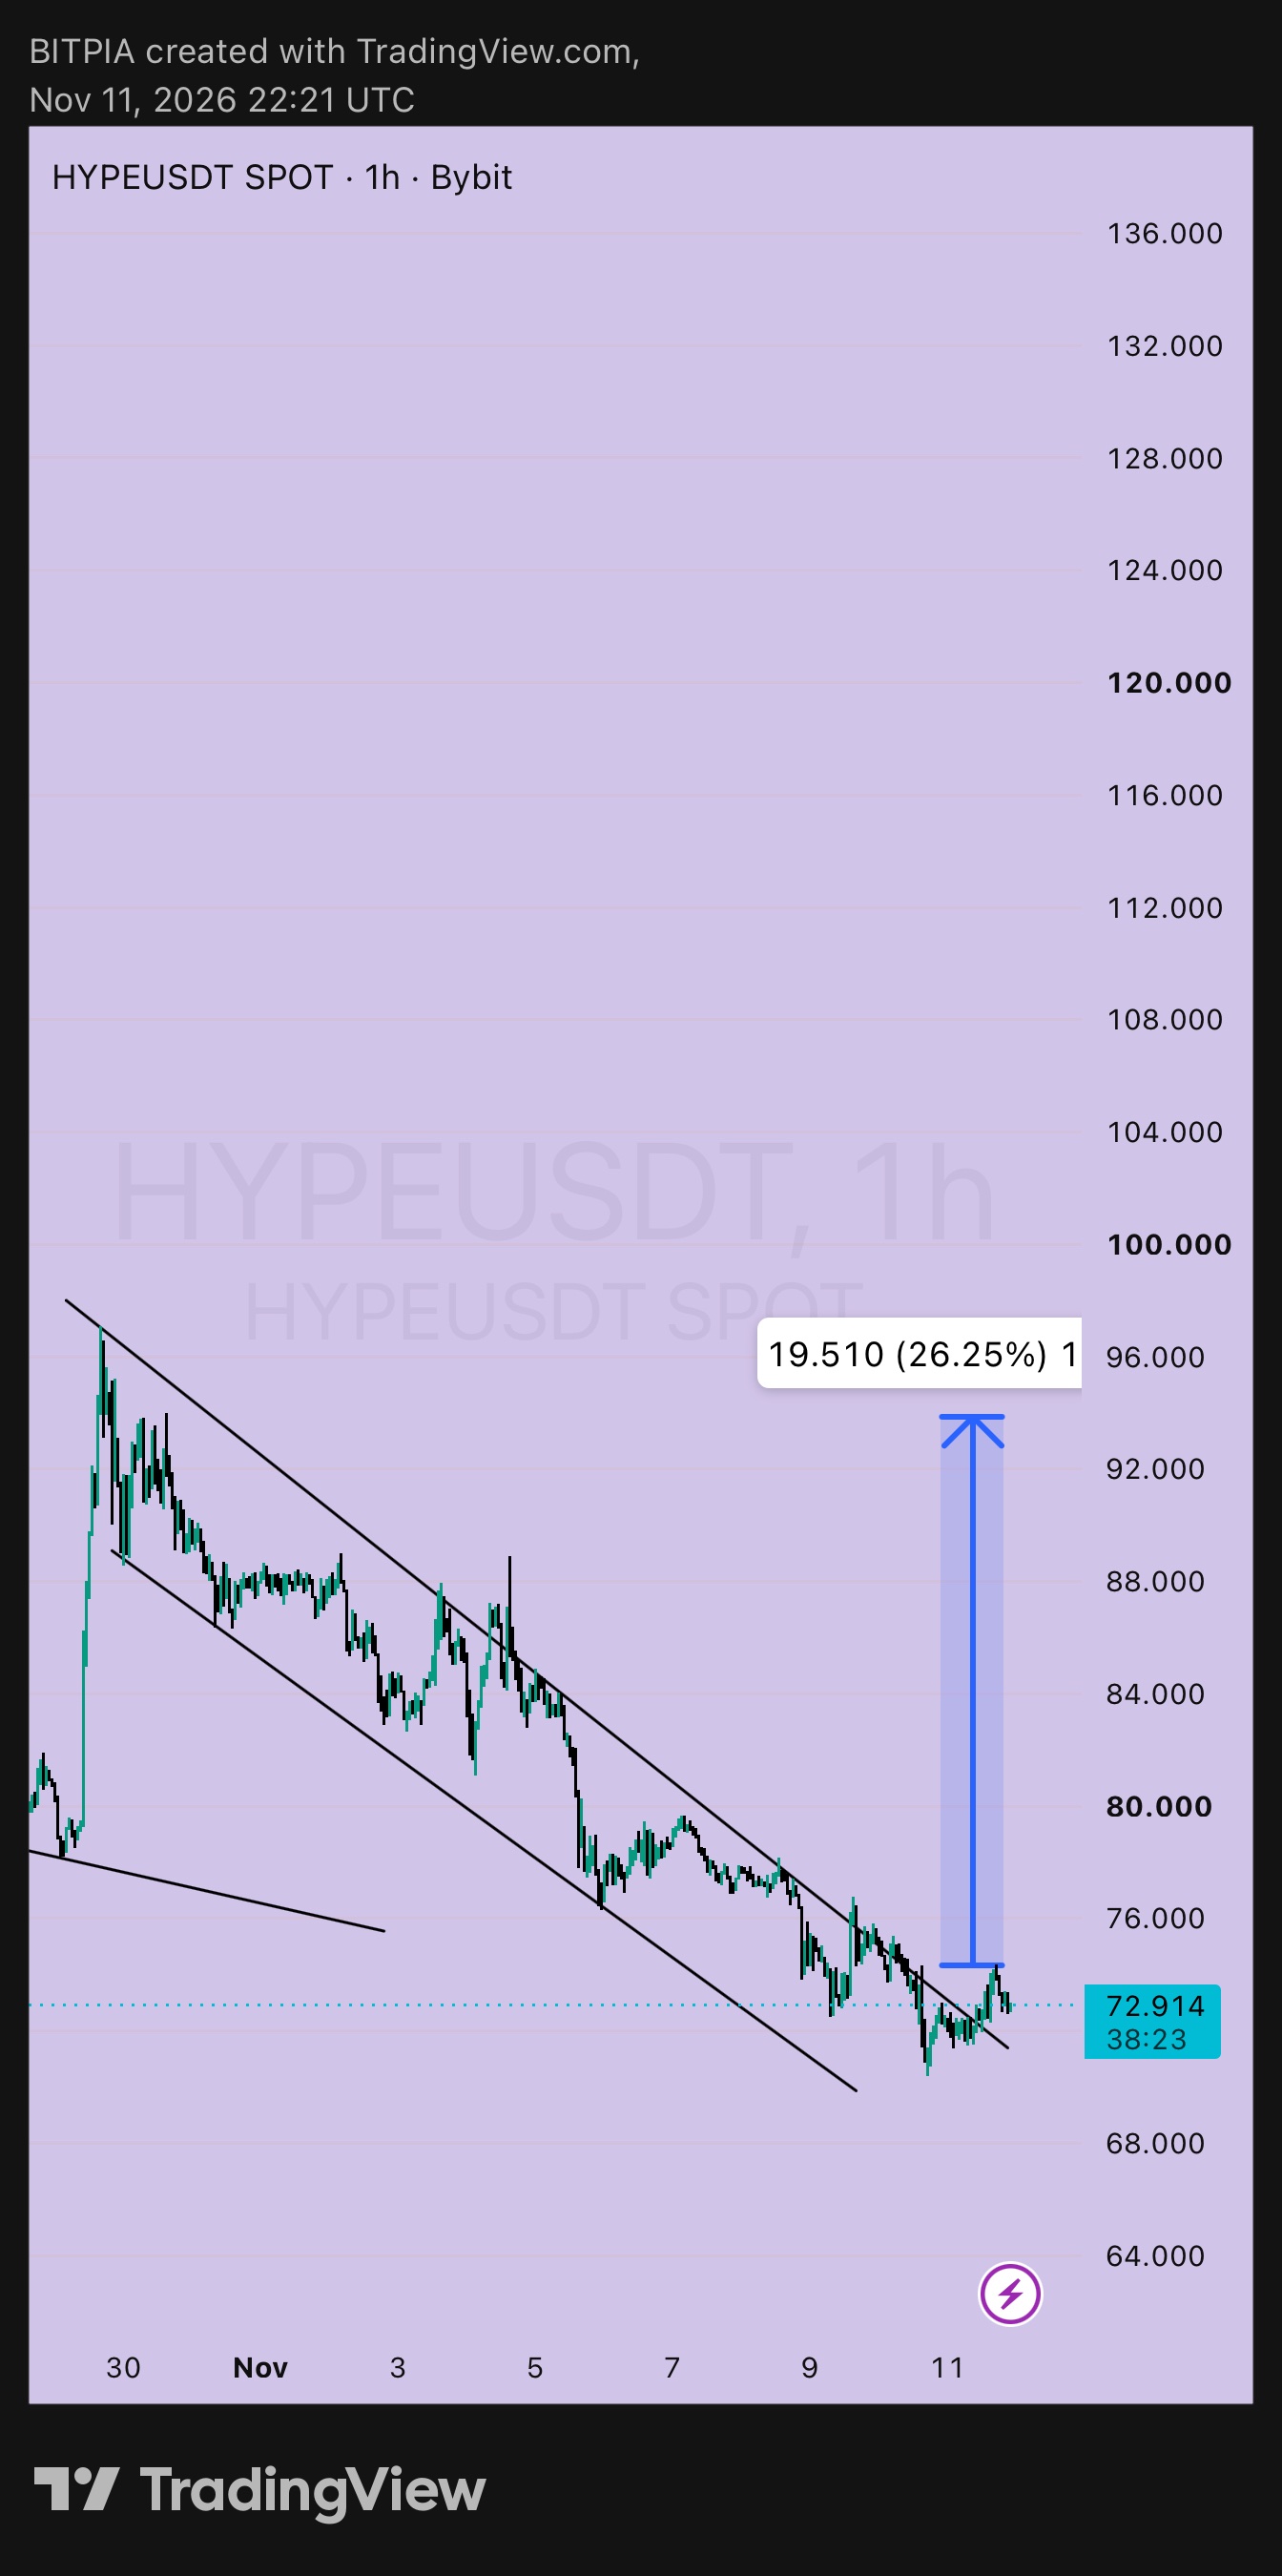
$HYPEUSDT 1j: catatan untuk diri sendiri ➤ Catatan 1: posisi saya saat ini Pada 9 Nov saya memposting HYPE di 73,802 di dalam falling channel, dengan Rencana A untuk beli di dekat 72,0 dan stop di bawah 69,5. Harga turun ke sekitar 70,3 dan kembali lagi, jadi entri itu kemungkinan besar sudah terisi. Sekarang di 72,914, sekitar +0,9 per unit, kurang lebih 0,4R profit. ➤ Catatan 2: apa yang berubah ▸ Harga telah bergerak di atas garis channel atas, yang berada di dekat 72 hingga 73, dan saat ini sedang retest ▸ Low di dekat 70,3 bertahan di atas stop saya di 69,5, jadi rencananya masih utuh ▸ Measured move di chart saya masih mengarah ke sekitar 94, sekitar 26% di atas batas bawah channel ➤ Catatan 3: apa yang saya lakukan dengan trade yang sedang berjalan ▸ Pertahankan stop di 69,5 sampai ada 1h close di atas 76 ▸ Setelah itu, naikkan ke breakeven di dekat 72 ▸ Target: 77 (+5, sekitar 2R), 82,5 (+10,5, sekitar 4,2R), 94 (+22, sekitar 8,8R, ini target jauh, jadi saya hanya akan menyisakan sebagian kecil) ➤ Catatan 4: apa yang saya lakukan jika saya belum masuk posisi ▸ Entri: sekitar 72,5, pada retest garis channel yang ditembus dan bertahan ▸ Stop-loss: di bawah 69,8 ▸ Risiko per unit: 2,7 ▸ Target: 77 (+4,5, sekitar 1,7R) dan 82,5 (+10, sekitar 3,7R) ▸ Membeli di 72,9 dengan stop yang sama berarti risiko 3,1, dan 77 berjarak sekitar 1,3R. Mungkin saja, tapi retest memberikan angka yang lebih baik ➤ Catatan 5: Rencana B masih menunggu ▸ Pemicu: 1h close di atas 77,5 ▸ Entri: sekitar 78, stop di bawah 74, risiko 4 ▸ Target: 82,5 (sekitar 1,1R), 90 (sekitar 3R), 94 (sekitar 4R) ➤ Catatan 6: apa yang membatalkannya 1h close di bawah 69,5 berarti breakout gagal, dan saya menepi. Gunakan ukuran kecil, dan leverage rendah jika Anda menggunakan perps. Sekarang tidurlah. 🌙 Bukan saran keuangan. Lakukan riset Anda sendiri dan hanya risikokan apa yang Anda mampu untuk kehilangan. #ByXIMPACT #WSOT2026
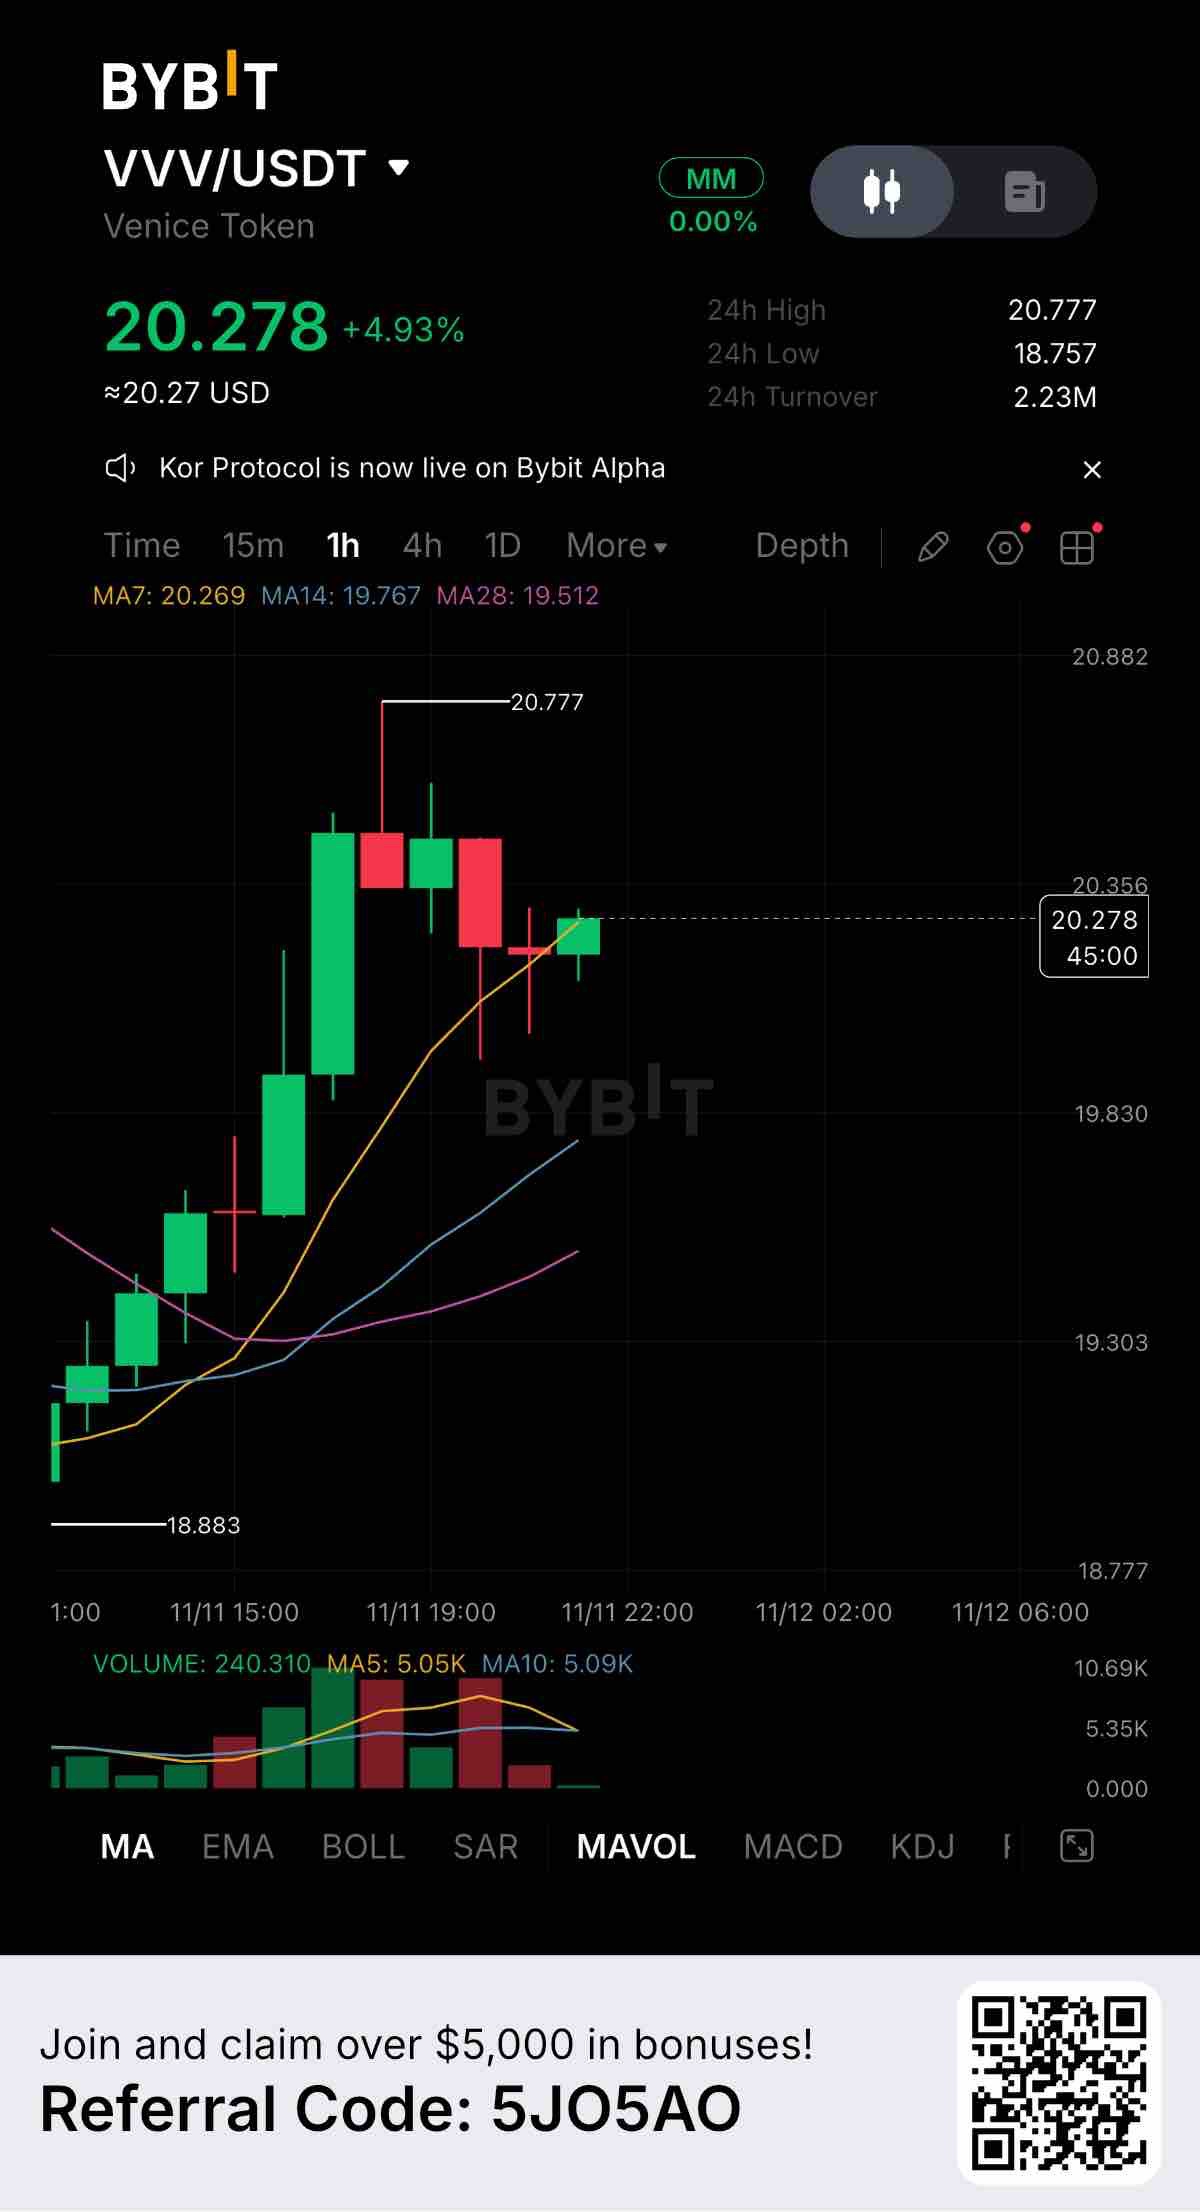
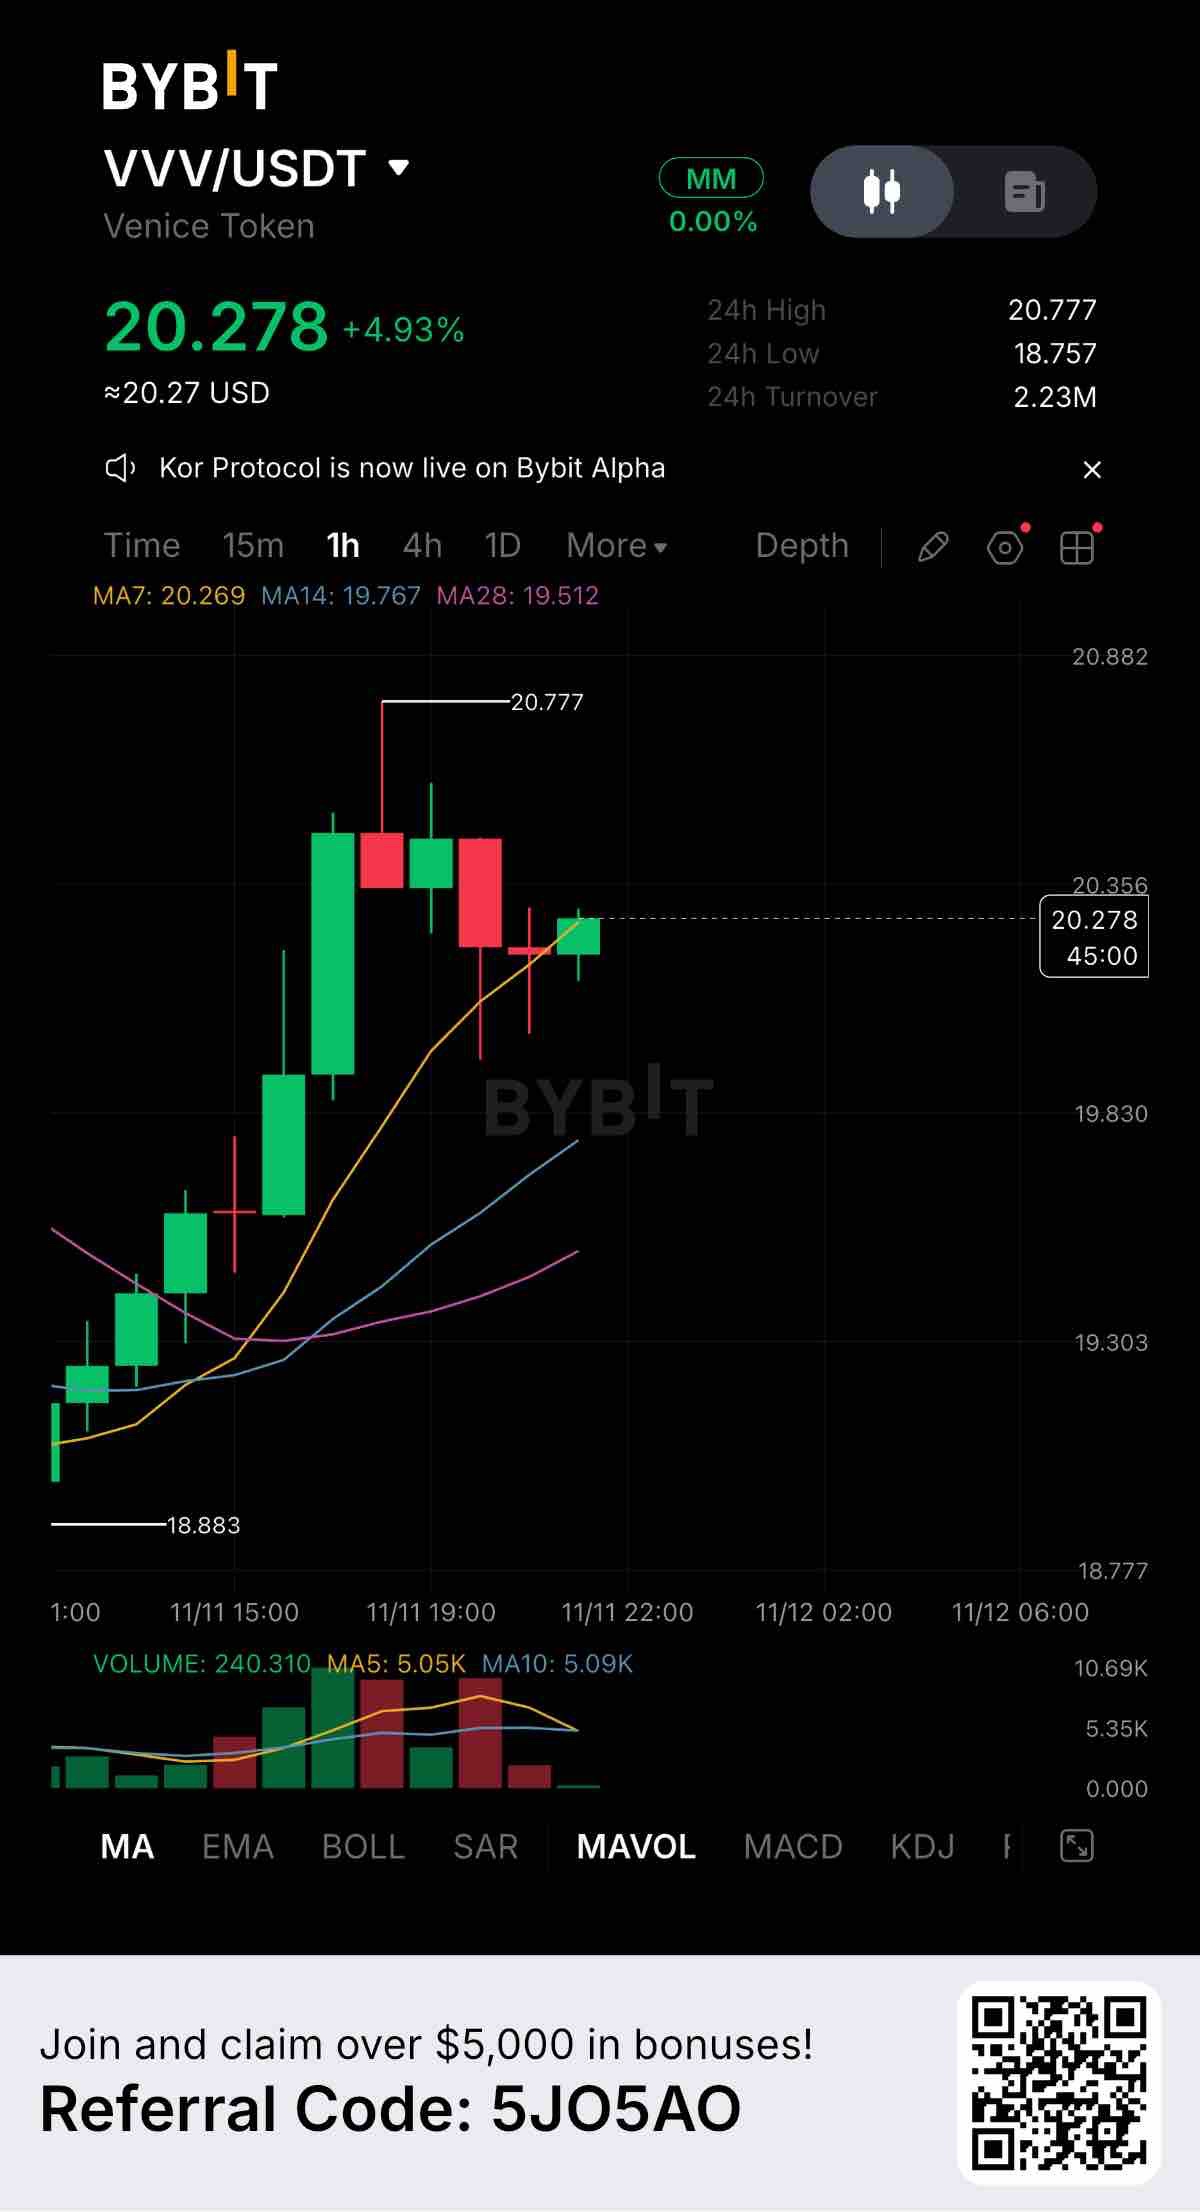
$VVVUSDT is showing classic market behavior on the 1-hour chart, currently trading at 20.278 with a +4.93% gain. After a sharp rally that pushed the price to a 24-hour high of 20.777, we are now seeing a healthy pullback as early buyers take some profits. Key Levels to Watch: Resistance: 20.777 (The recent peak where sellers stepped in) Support 1: 20.269 (7-day MA, acting as the immediate battleground right now) Support 2: 18.757 (24-hour low, the stronger structural support below) Looking at the moving averages, the trend is still overall bullish. Price is holding right on the 7-day MA (20.269) and remains well above MA14 (19.767) and MA28 (19.512). The current test is whether the 7-day MA will hold as support or break. Volume is healthy, with 2.23M USDT in 24-hour turnover. The chart shows that the selling volume during this pullback is much lower than the buying volume during the initial push, which is a good sign for the bulls. Fundamentally, Venice Token (VVV) is holding its recent gains well. Pullbacks like this are often necessary to cool off overheated indicators and allow new buyers to step in. If the price bounces off this 20.269 support level, we could see another attempt at the 20.777 high. However, if it loses this level, a drop toward the 19.800 area (near MA14) is very possible. Are you buying this dip on VVV, or waiting to see if the support holds? Let’s hear your thoughts below. #ByXIMPACT #WSOT2026
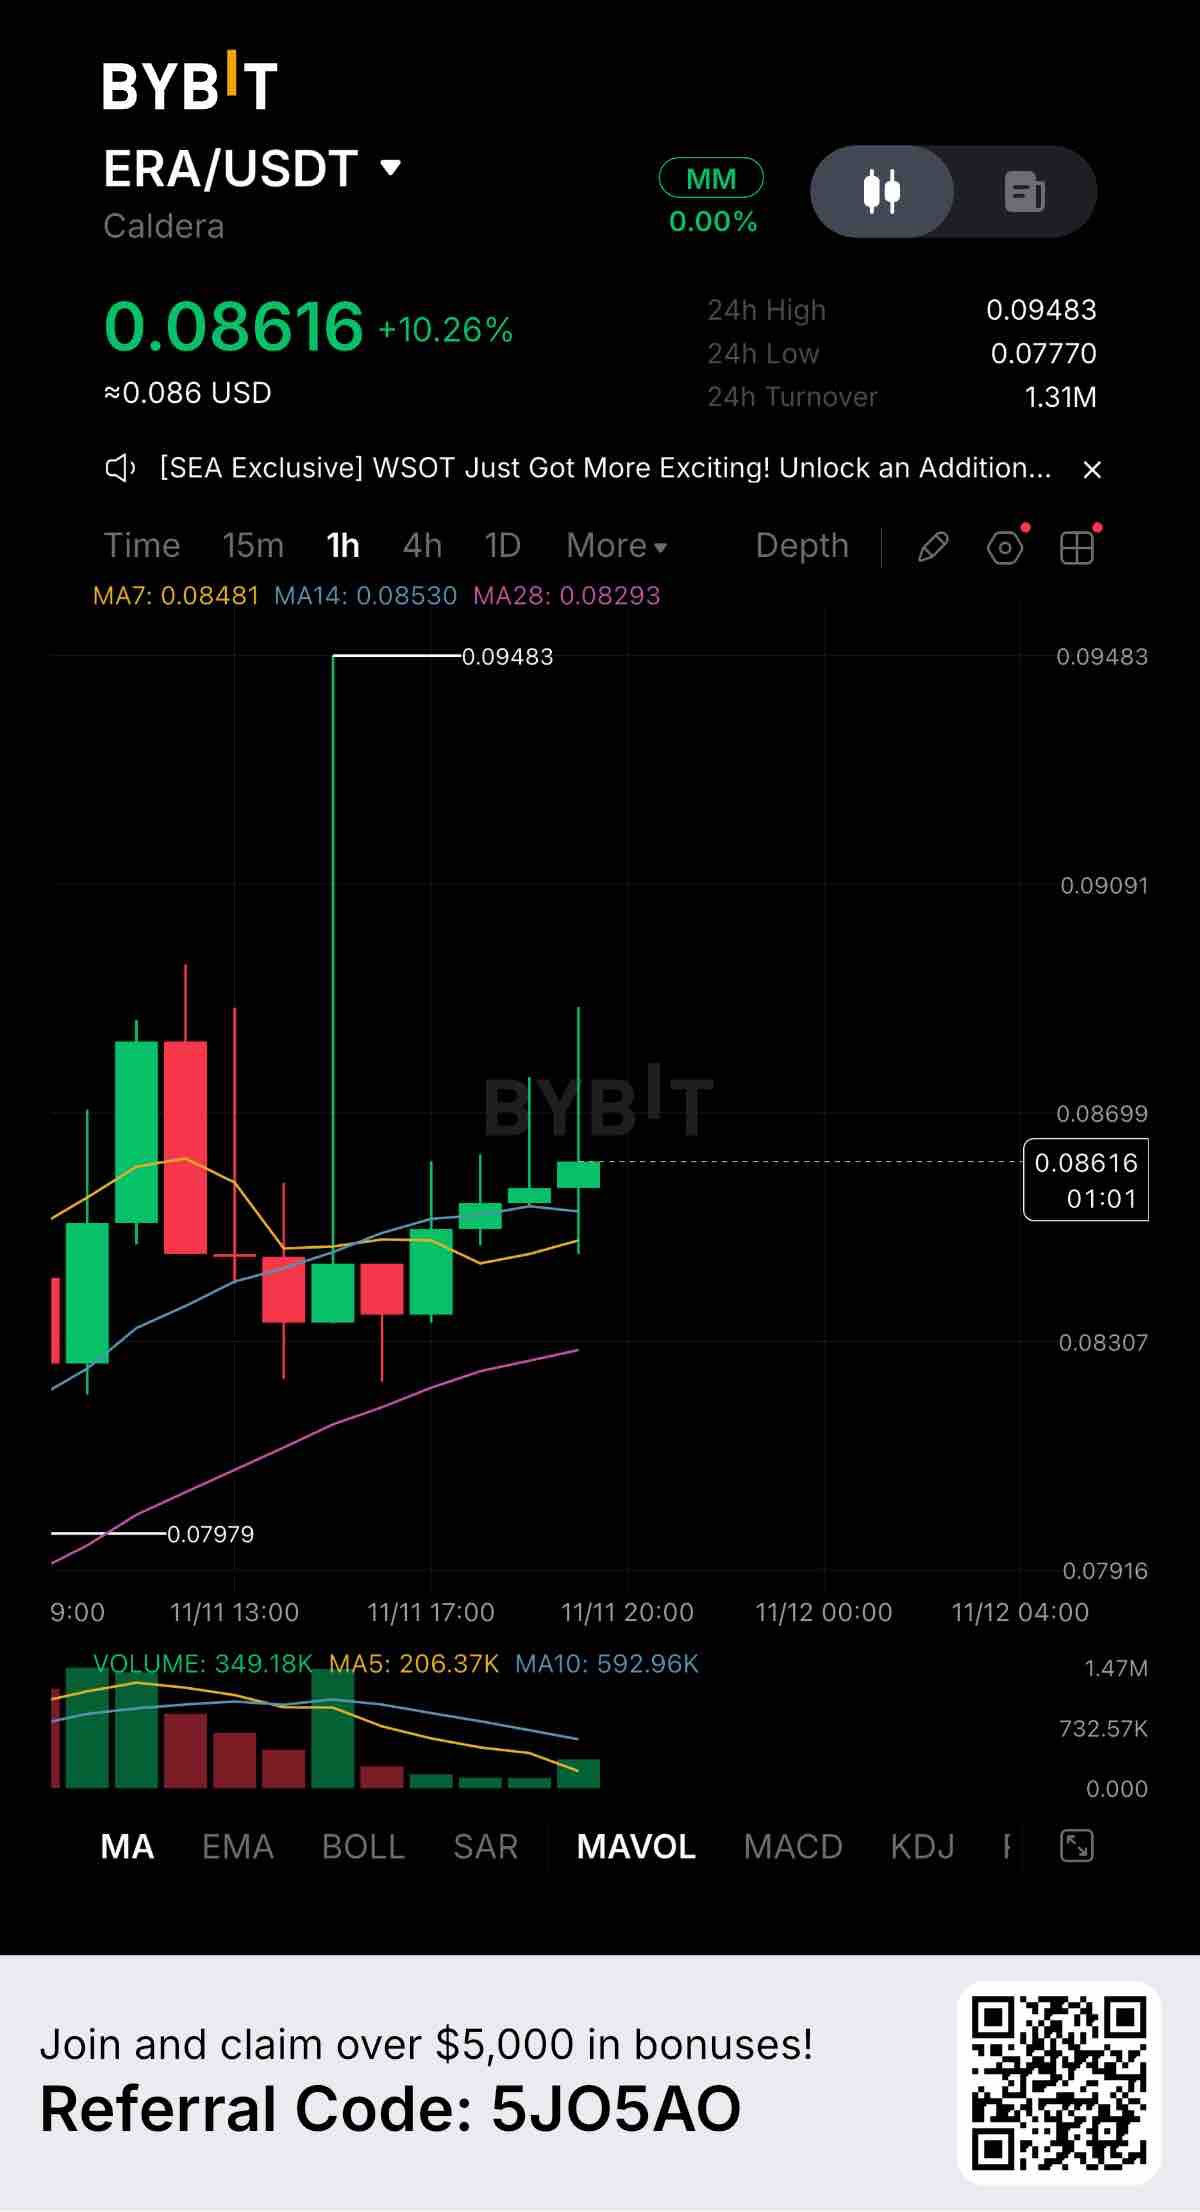
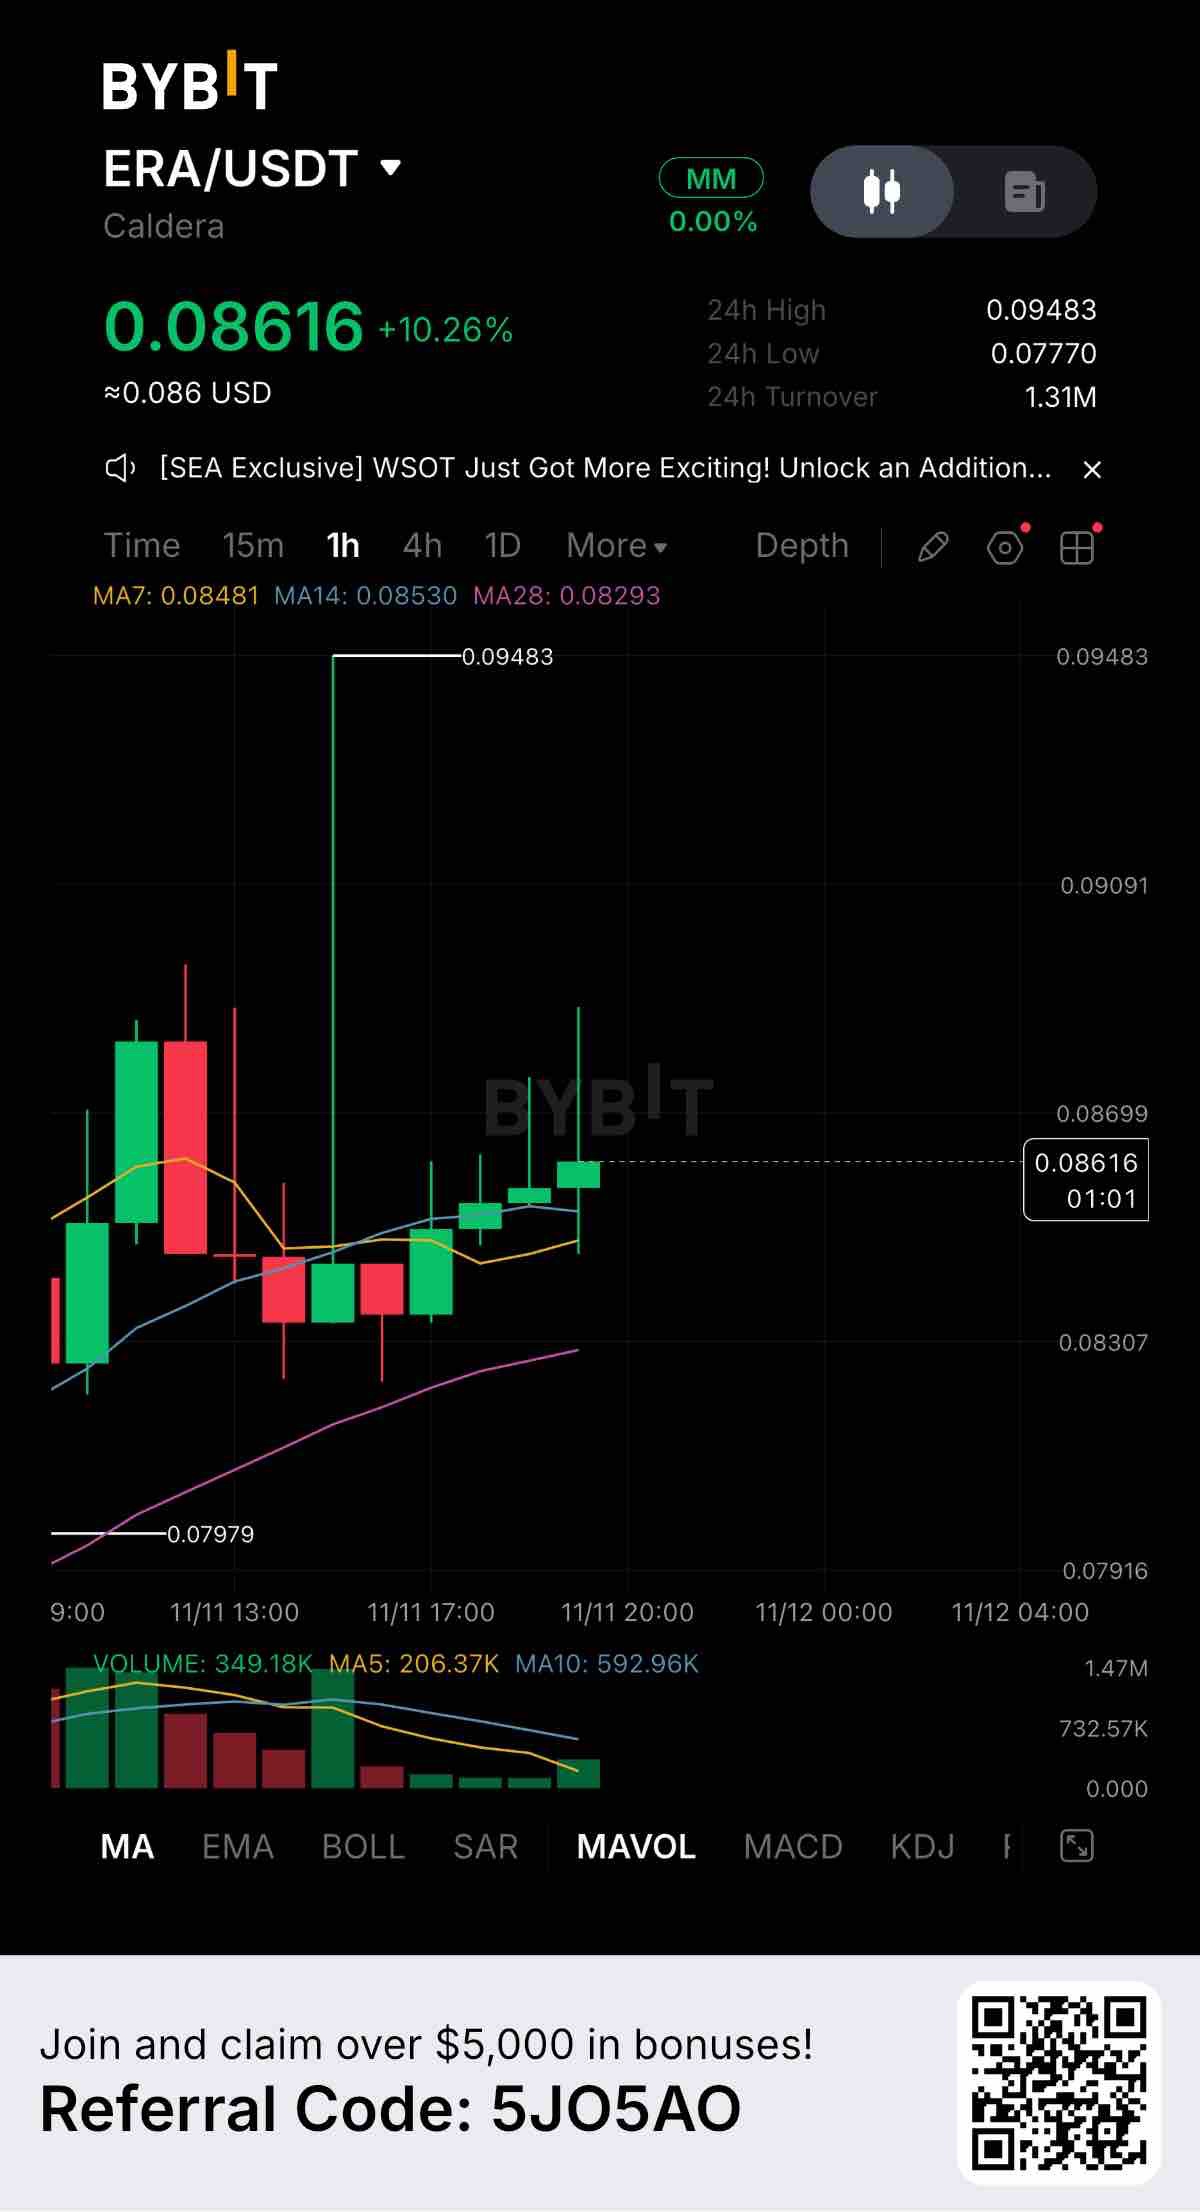
$ERAUSDT is showing interesting price action on the 1-hour chart, currently trading at 0.08616 with a solid +10.26% gain. However, looking closely at the chart, this isn't a simple straight line up. We saw a massive volatility spike that left a huge upper wick reaching all the way to 0.09483 before sellers pushed the price back down. Key Levels to Watch: Resistance: 0.09483 (The massive 24-hour high and the top of the recent wick) Support 1: 0.08481 (7-day MA, acting as immediate dynamic support) Support 2: 0.07770 (24-hour low, the structural floor) The moving averages are currently pinching together, but price is holding above MA7, MA14, and MA28. After that massive spike and rejection, the price is now consolidating and forming a series of smaller green candles. This suggests buyers are trying to build a base and regain control. Volume is a key factor here. The initial spike was met with heavy selling pressure, but the 24-hour turnover remains strong at 1.31M USDT. We need to see if buying volume can step back in to push through the previous rejection zone. Fundamentally, Caldera (ERA) is getting attention, and the sudden volatility spike often points to a reaction to news or a liquidity grab by larger players. If buyers can build enough momentum to test 0.09483 again, a breakout could follow. But right now, the safer play is watching to see if the 0.08481 support holds. If it does, we might have a solid setup for the next leg up. If it breaks, we could retest the lows. What is your read on ERA after that massive wick? Are you buying this consolidation? Let’s discuss in the comments. #ByXIMPACT #WSOT2026
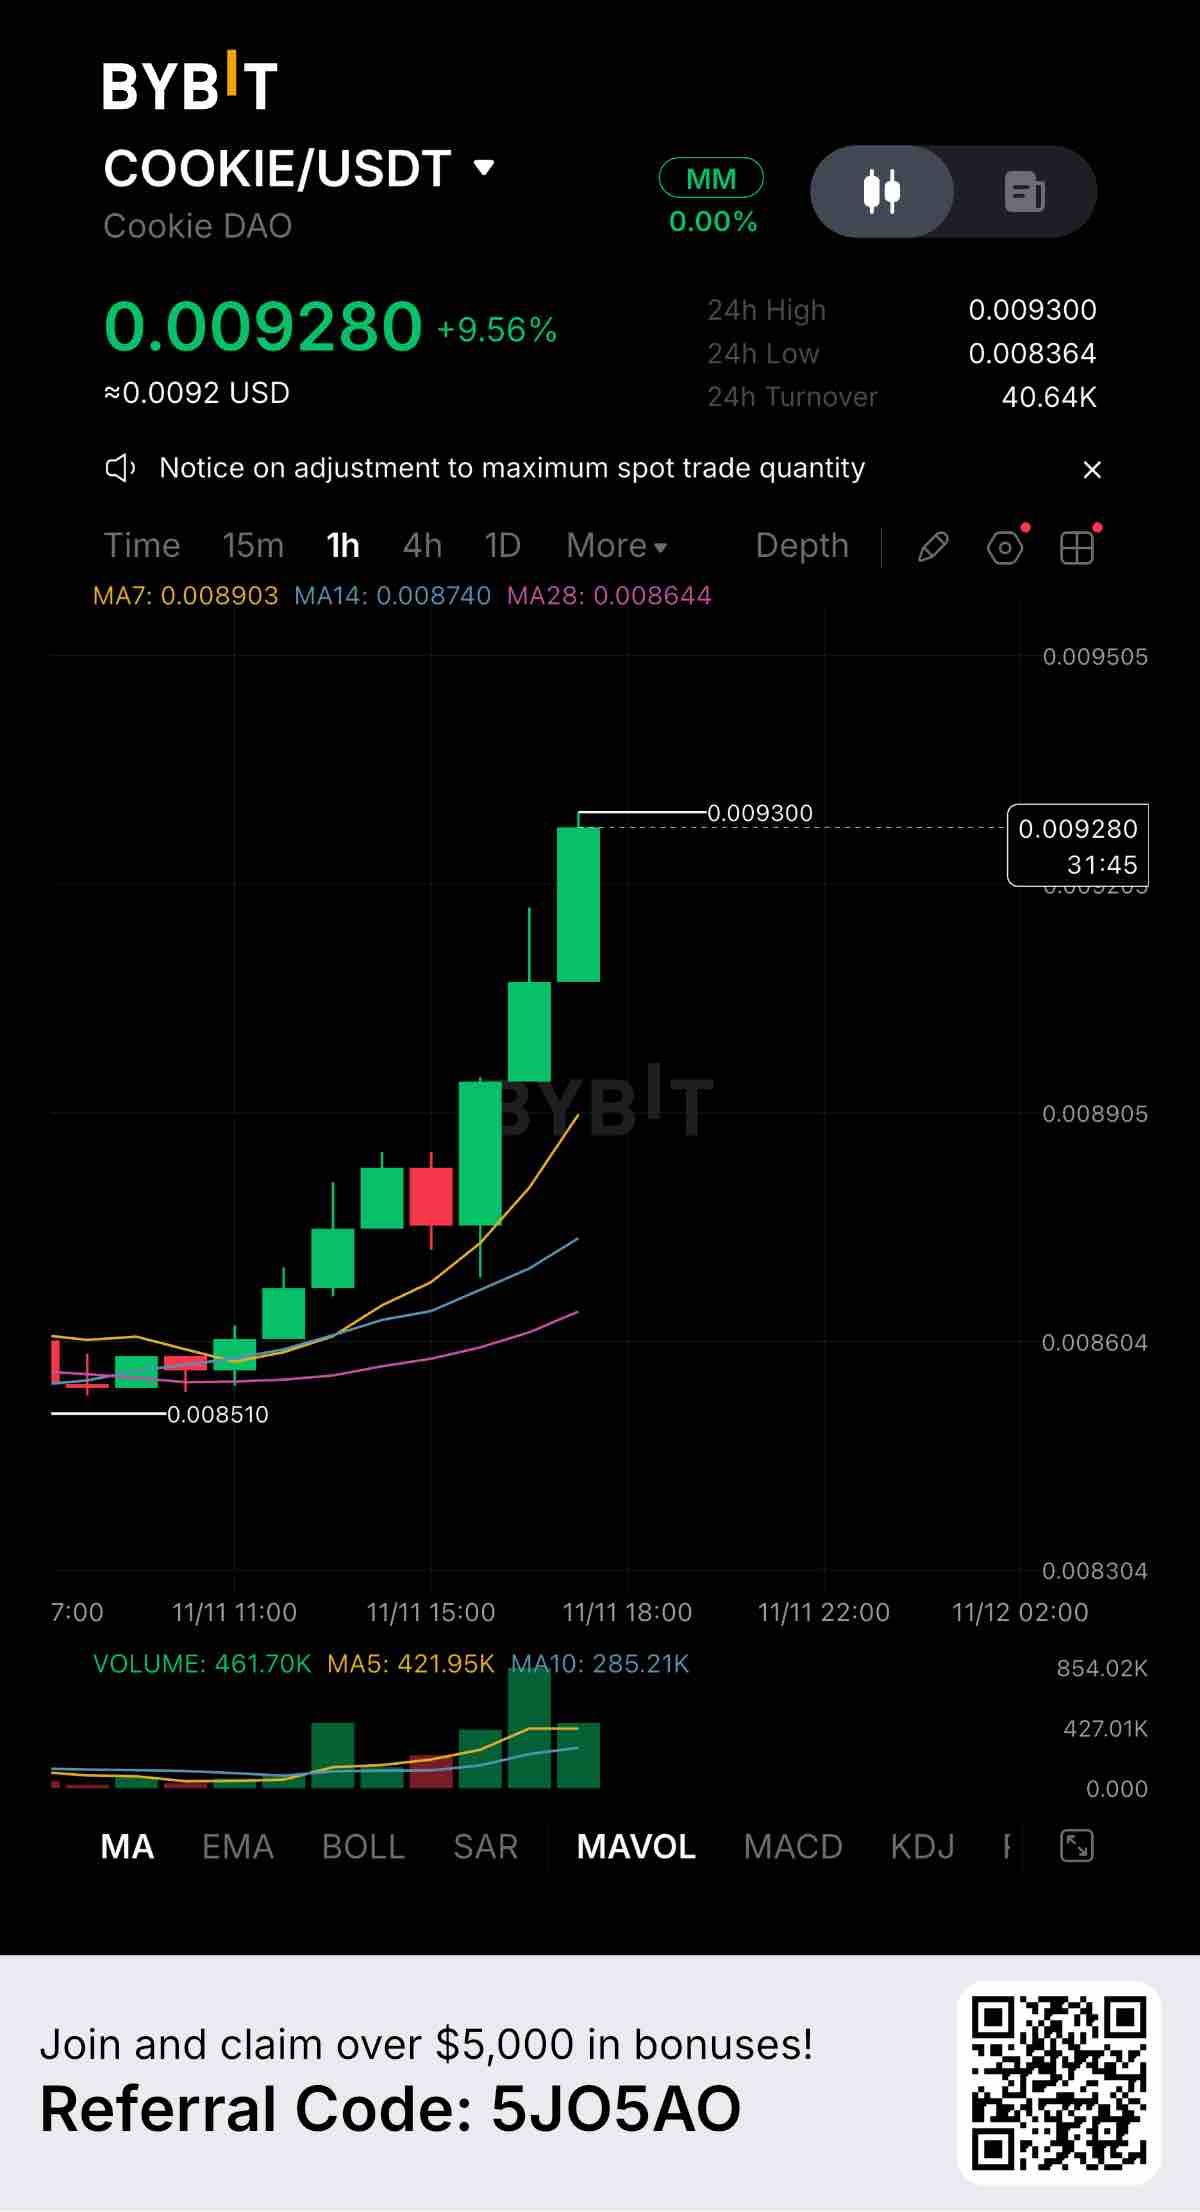
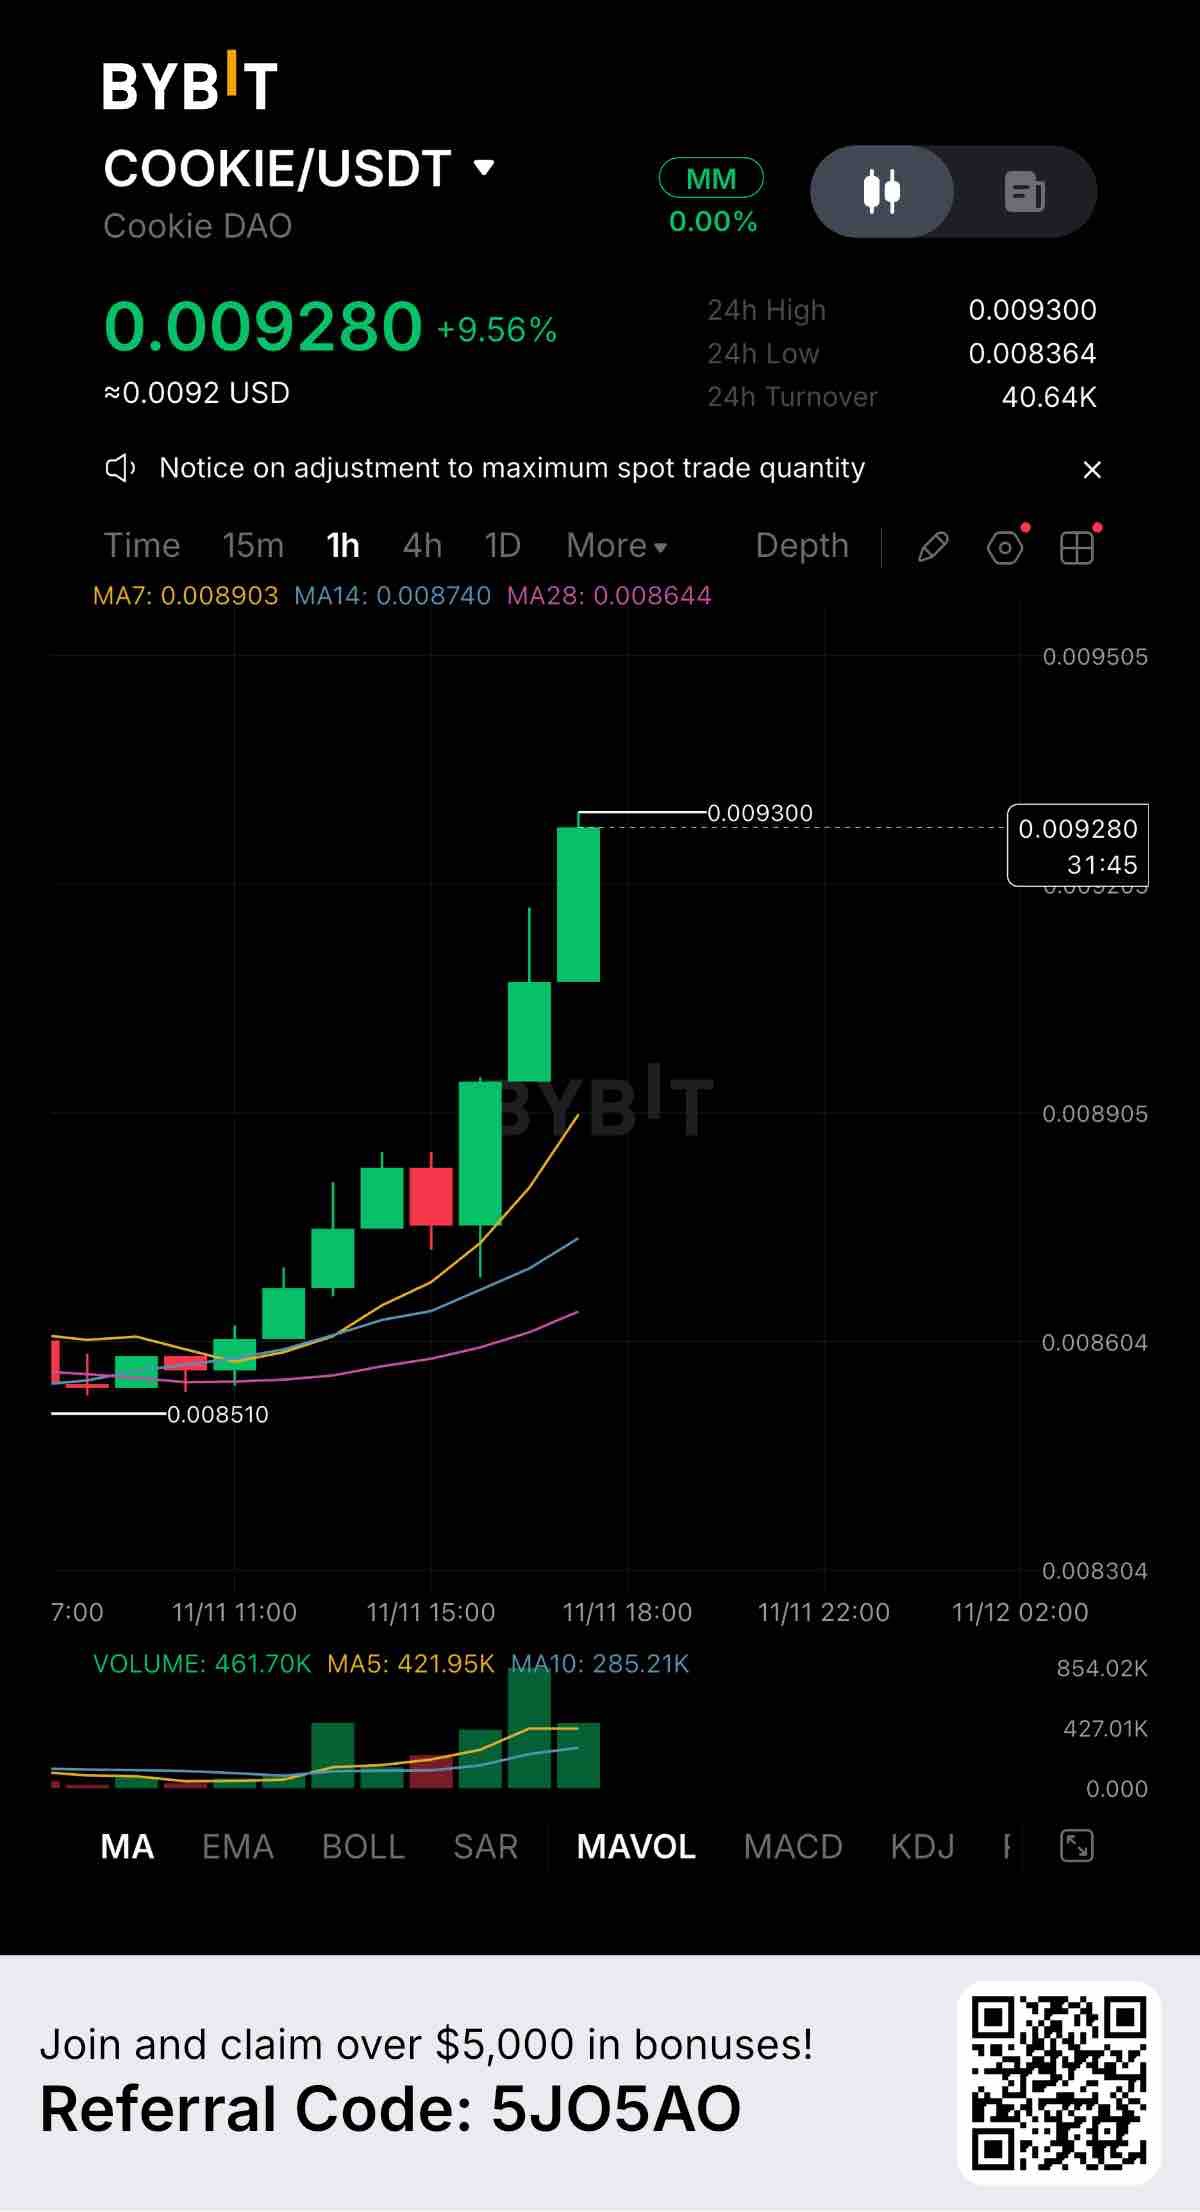
$COOKIEUSDT is putting in serious work on the 1-hour chart, currently trading at 0.009280 with a strong +9.56% gain. The price action is showing a relentless staircase pattern, with buyers stepping in aggressively on every pullback. Key Levels to Watch: Resistance: 0.009300 (The current 24-hour high, acting as the immediate ceiling) Support 1: 0.008903 (7-day MA, the first dynamic support zone) Support 2: 0.008364 (24-hour low, the stronger structural floor) The moving averages are perfectly fanned out. Price is trading well above MA7, MA14, and MA28, confirming a highly aggressive short-term uptrend. The chart shows almost no selling resistance, with only minor red candles before the next leg up. Volume is the real confirmation here. The green volume bars are expanding as the price pushes higher, backed by 40.64K USDT in 24-hour turnover. This indicates genuine buying pressure, not just low-liquidity spikes. Fundamentally, Cookie DAO (COOKIE) is capturing heavy attention. Steady, stair-step moves like this usually indicate strong community momentum and active accumulation. If buyers manage to break and hold above 0.009300, price discovery is likely. However, because the price is extended from the 7-day MA, chasing here carries risk. A retest of 0.008903 is the safer setup if you are looking to enter. Are you holding COOKIE or waiting for a pullback? Let’s hear your thoughts below. #ByXIMPACT #WSOT2026
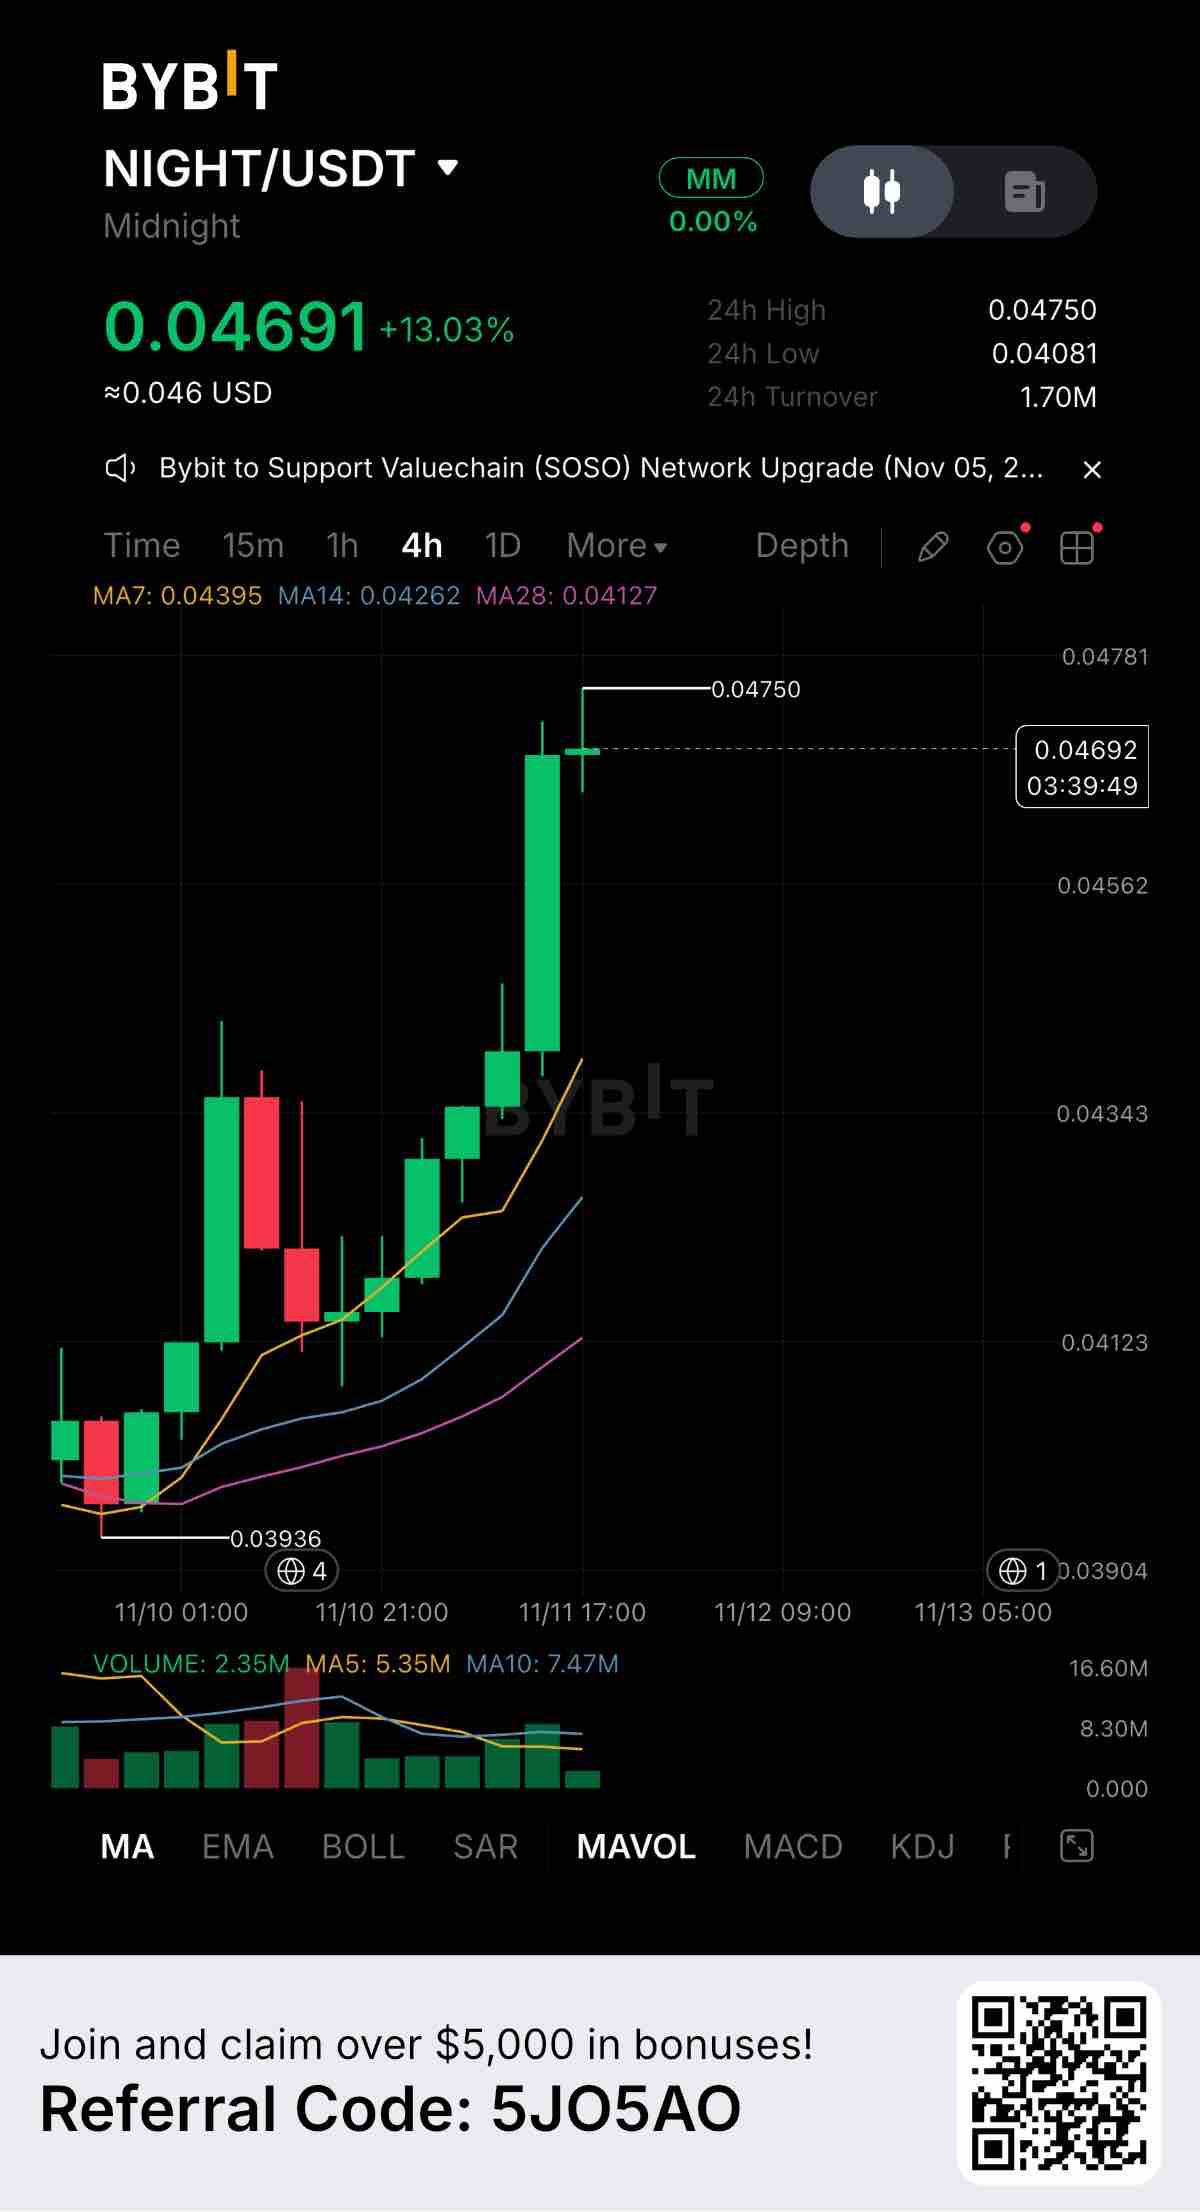
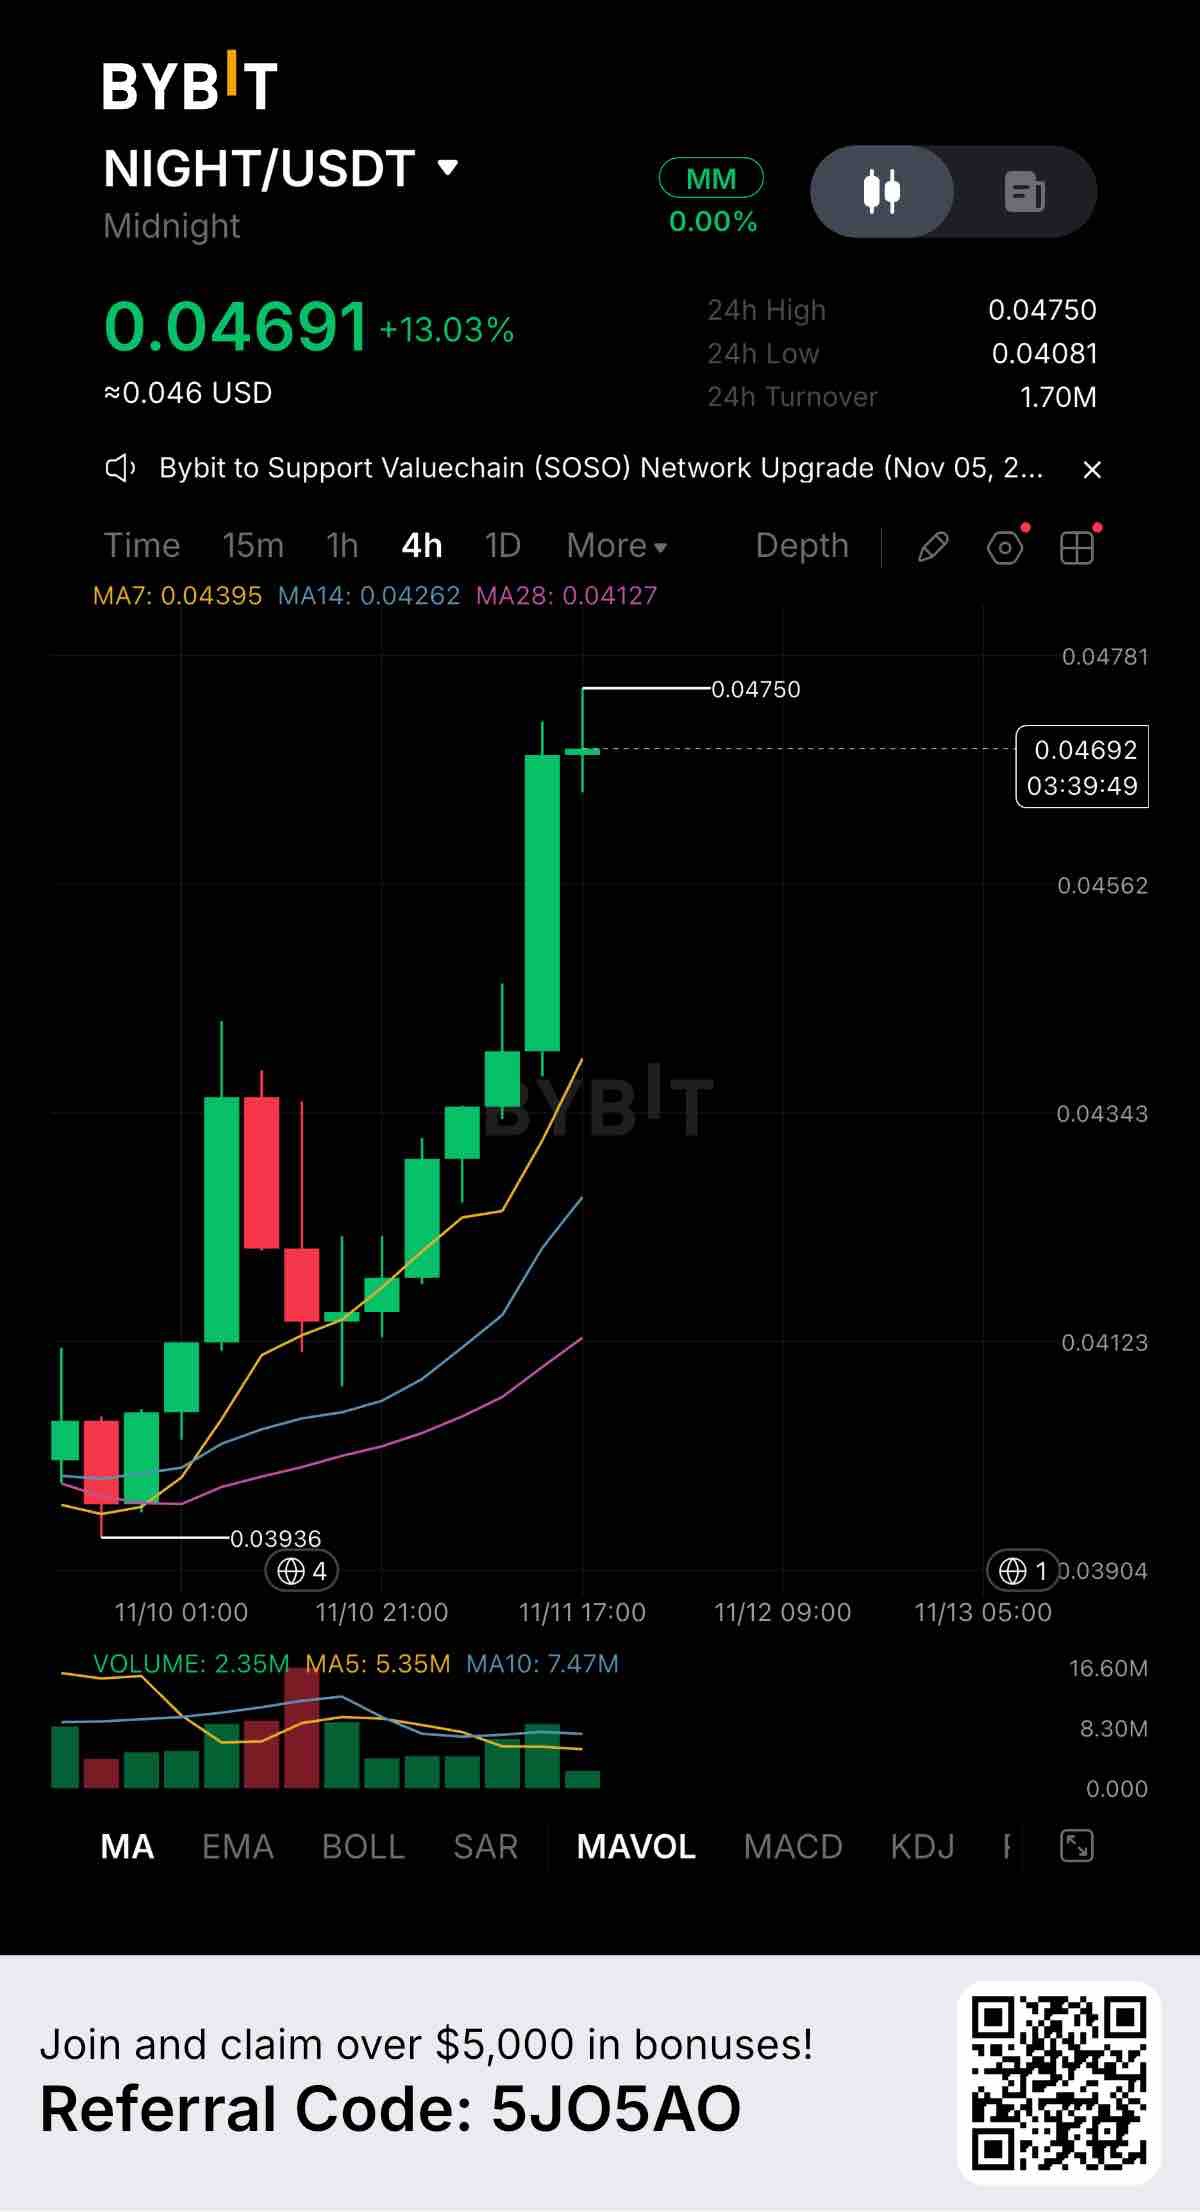
$NIGHTUSDT menunjukkan momentum bullish yang kuat hari ini, saat ini diperdagangkan di 0,04691 dengan kenaikan solid +13,03% selama 24 jam terakhir. Grafik 4 jam menunjukkan tren naik yang klasik, dan pembeli jelas memegang kendali. Level Kunci untuk Diperhatikan: Resistance: 0,04750 (Tertinggi 24 jam saat ini, bertindak sebagai langit-langit langsung) Support 1: 0,04395 (MA 7 hari, garis pertahanan pertama jika terjadi pullback) Support 2: 0,04081 (Terendah 24 jam, lantai struktural yang lebih kuat) Moving average tersusun dengan sempurna. Harga diperdagangkan jauh di atas MA7, MA14, dan MA28, yang mengonfirmasi tren jangka pendek tetap sangat kuat. Namun, harga sedikit menjauh dari MA 7 hari, jadi periode pendinginan singkat tidak akan mengejutkan. Volume sehat, dengan turnover 24 jam sebesar 1,70 juta USDT. Grafik menunjukkan tekanan beli yang konsisten mendukung pergerakan naik ini. Secara fundamental, Midnight (NIGHT) sedang menarik perhatian pasar yang solid. Momentum seperti ini biasanya menunjukkan meningkatnya minat ekosistem atau trader yang beralih ke narasi baru. Jika pembeli berhasil menembus dan bertahan di atas 0,04750, kita bisa melihat discovery harga terus berlanjut. Namun, jika penjual menolak level ini, menunggu retest ke arah 0,04395 adalah strategi yang jauh lebih aman daripada mengejar harga di puncak. Apakah Anda sedang trading NIGHT saat ini? Beri tahu saya strategi Anda di kolom komentar. #ByXIMPACT #WSOT2026
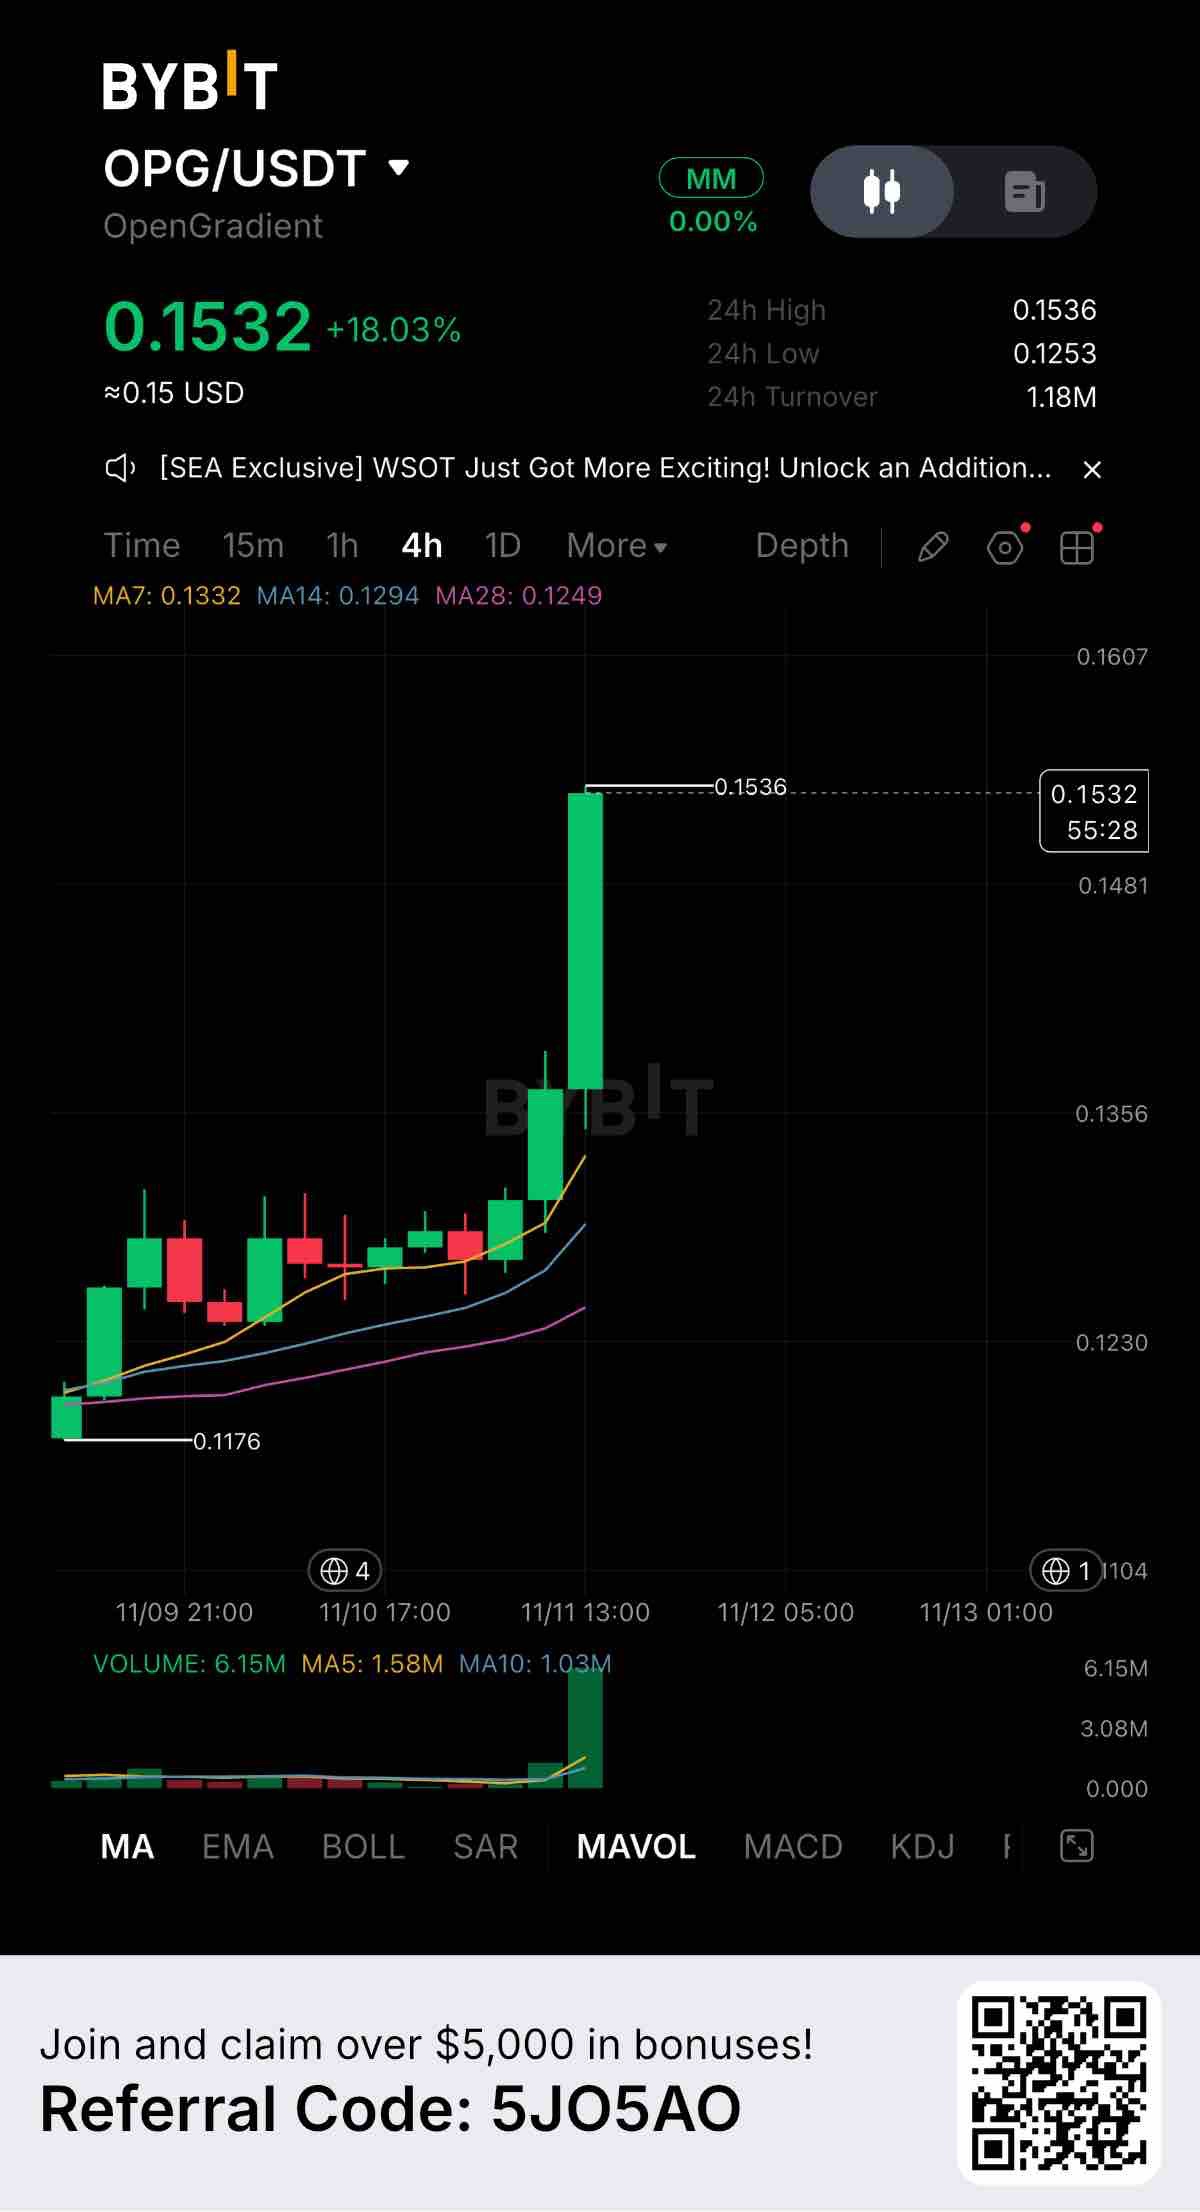
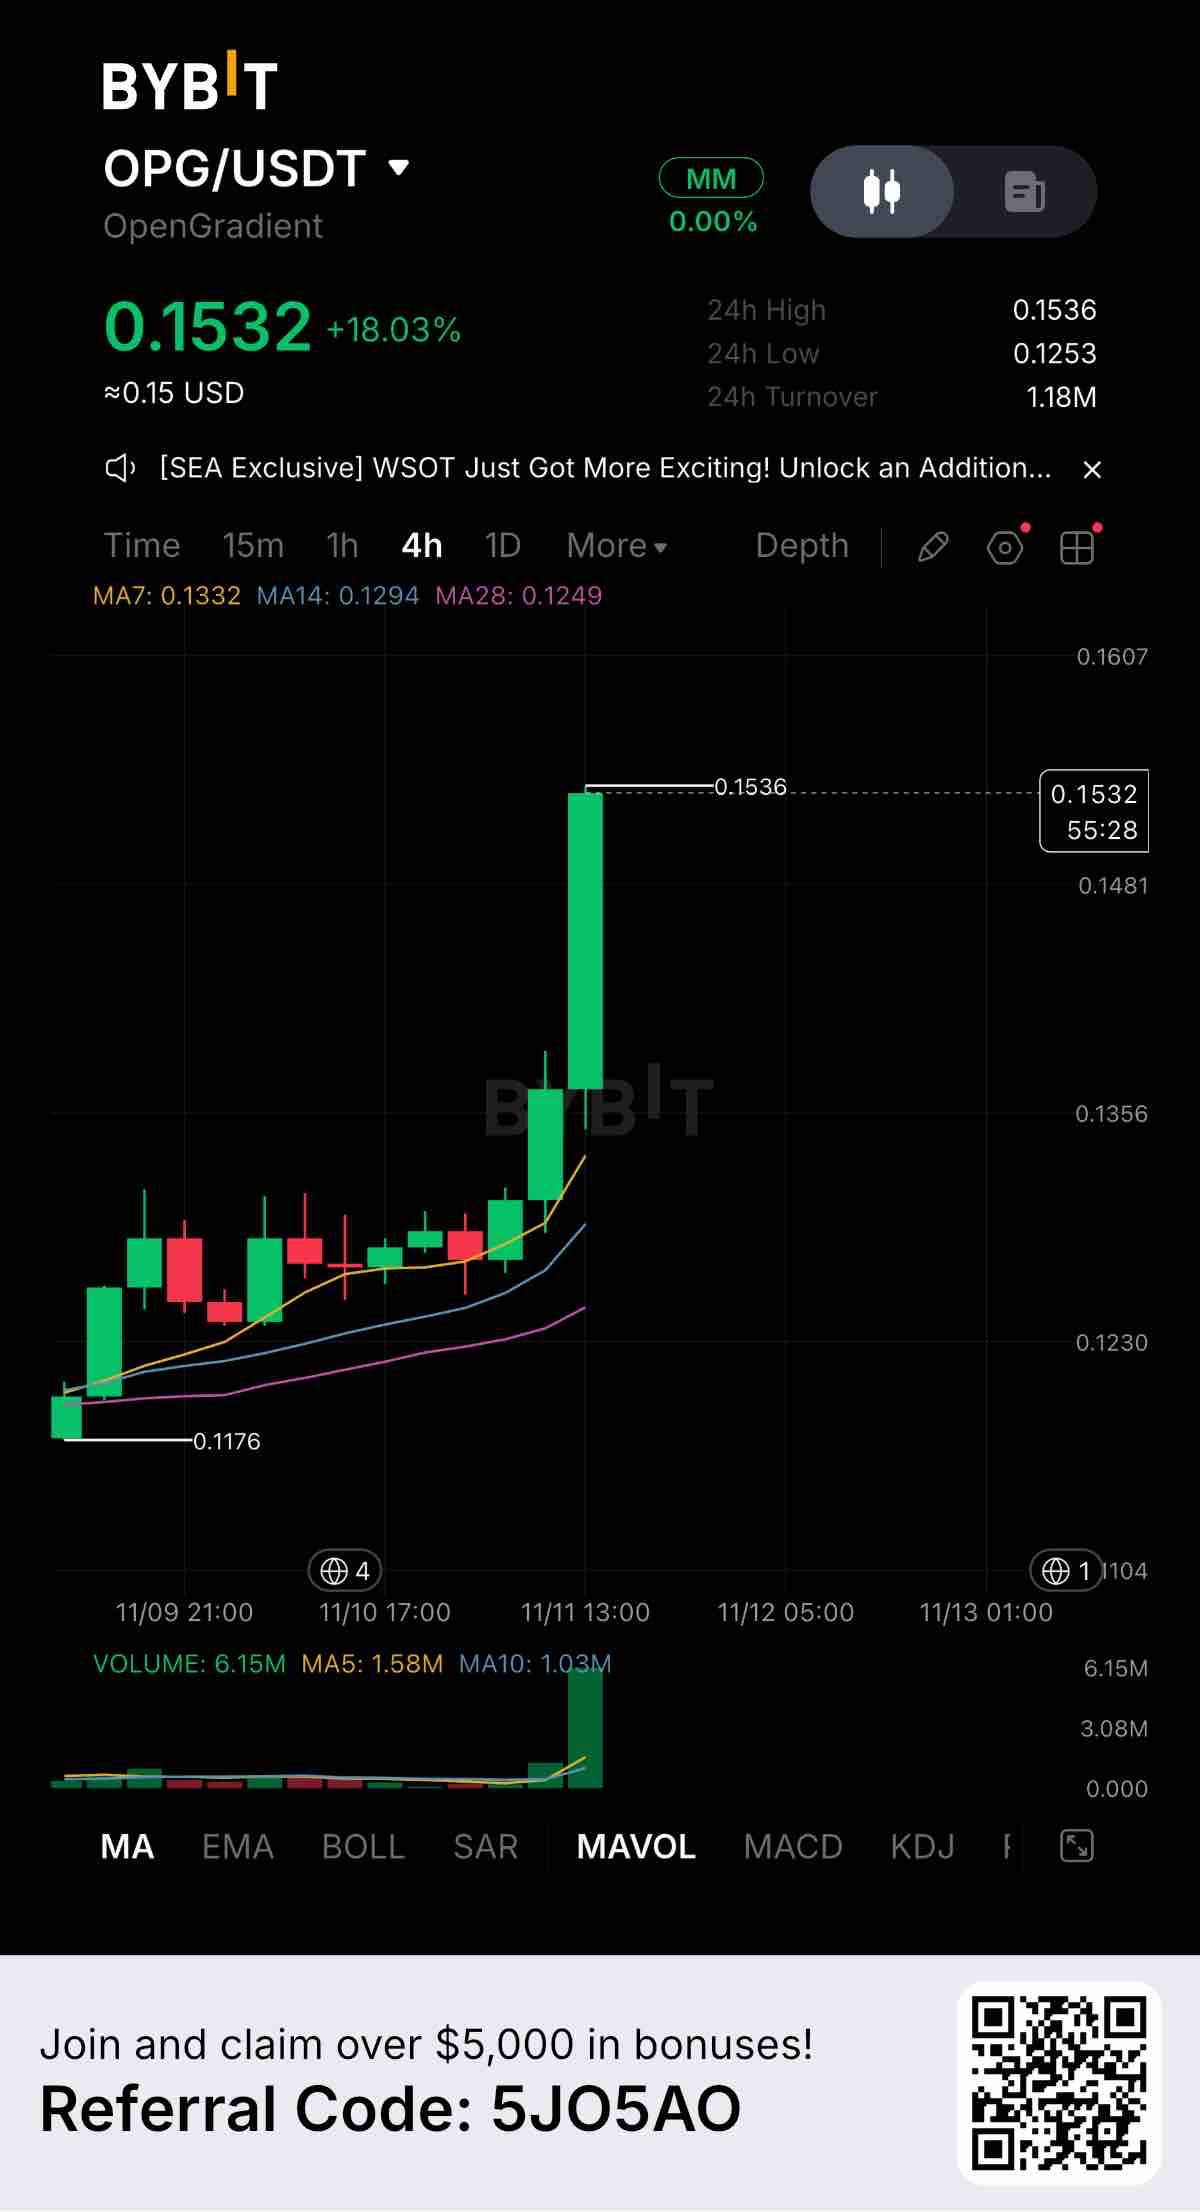
$OPGUSDT is making a massive statement today, currently trading at 0.1532 with an explosive +18.03% gain over the past 24 hours. The 4-hour chart is showing a textbook vertical breakout, and the volume confirms real money is entering the market. Key Levels to Watch: Resistance: 0.1536 (The current 24-hour high, being tested right now) Support 1: 0.1332 (7-day MA, first downside cushion) Support 2: 0.1253 (24-hour low, stronger structural floor) Looking at the moving averages, price is trading far above MA7, MA14, and MA28. This tells us momentum is incredibly fierce, but also means the asset is highly extended. Chasing a green candle this big carries risk. Volume is the real story here. The massive spike on the 4-hour chart shows strong buying pressure, backed by 1.18M USDT in 24-hour turnover. Fundamentally, OpenGradient (OPG) is capturing heavy market attention right now. Moves like this are usually driven by ecosystem developments or community momentum, and the volume proves capital is rotating in. If buyers manage to break and hold above 0.1536, we could see immediate price discovery. However, if sellers reject this level, waiting for a retest toward 0.1332 is the safer play. Are you riding this momentum or waiting for a pullback? Drop your thoughts below. #ByXIMPACT #WSOT2026
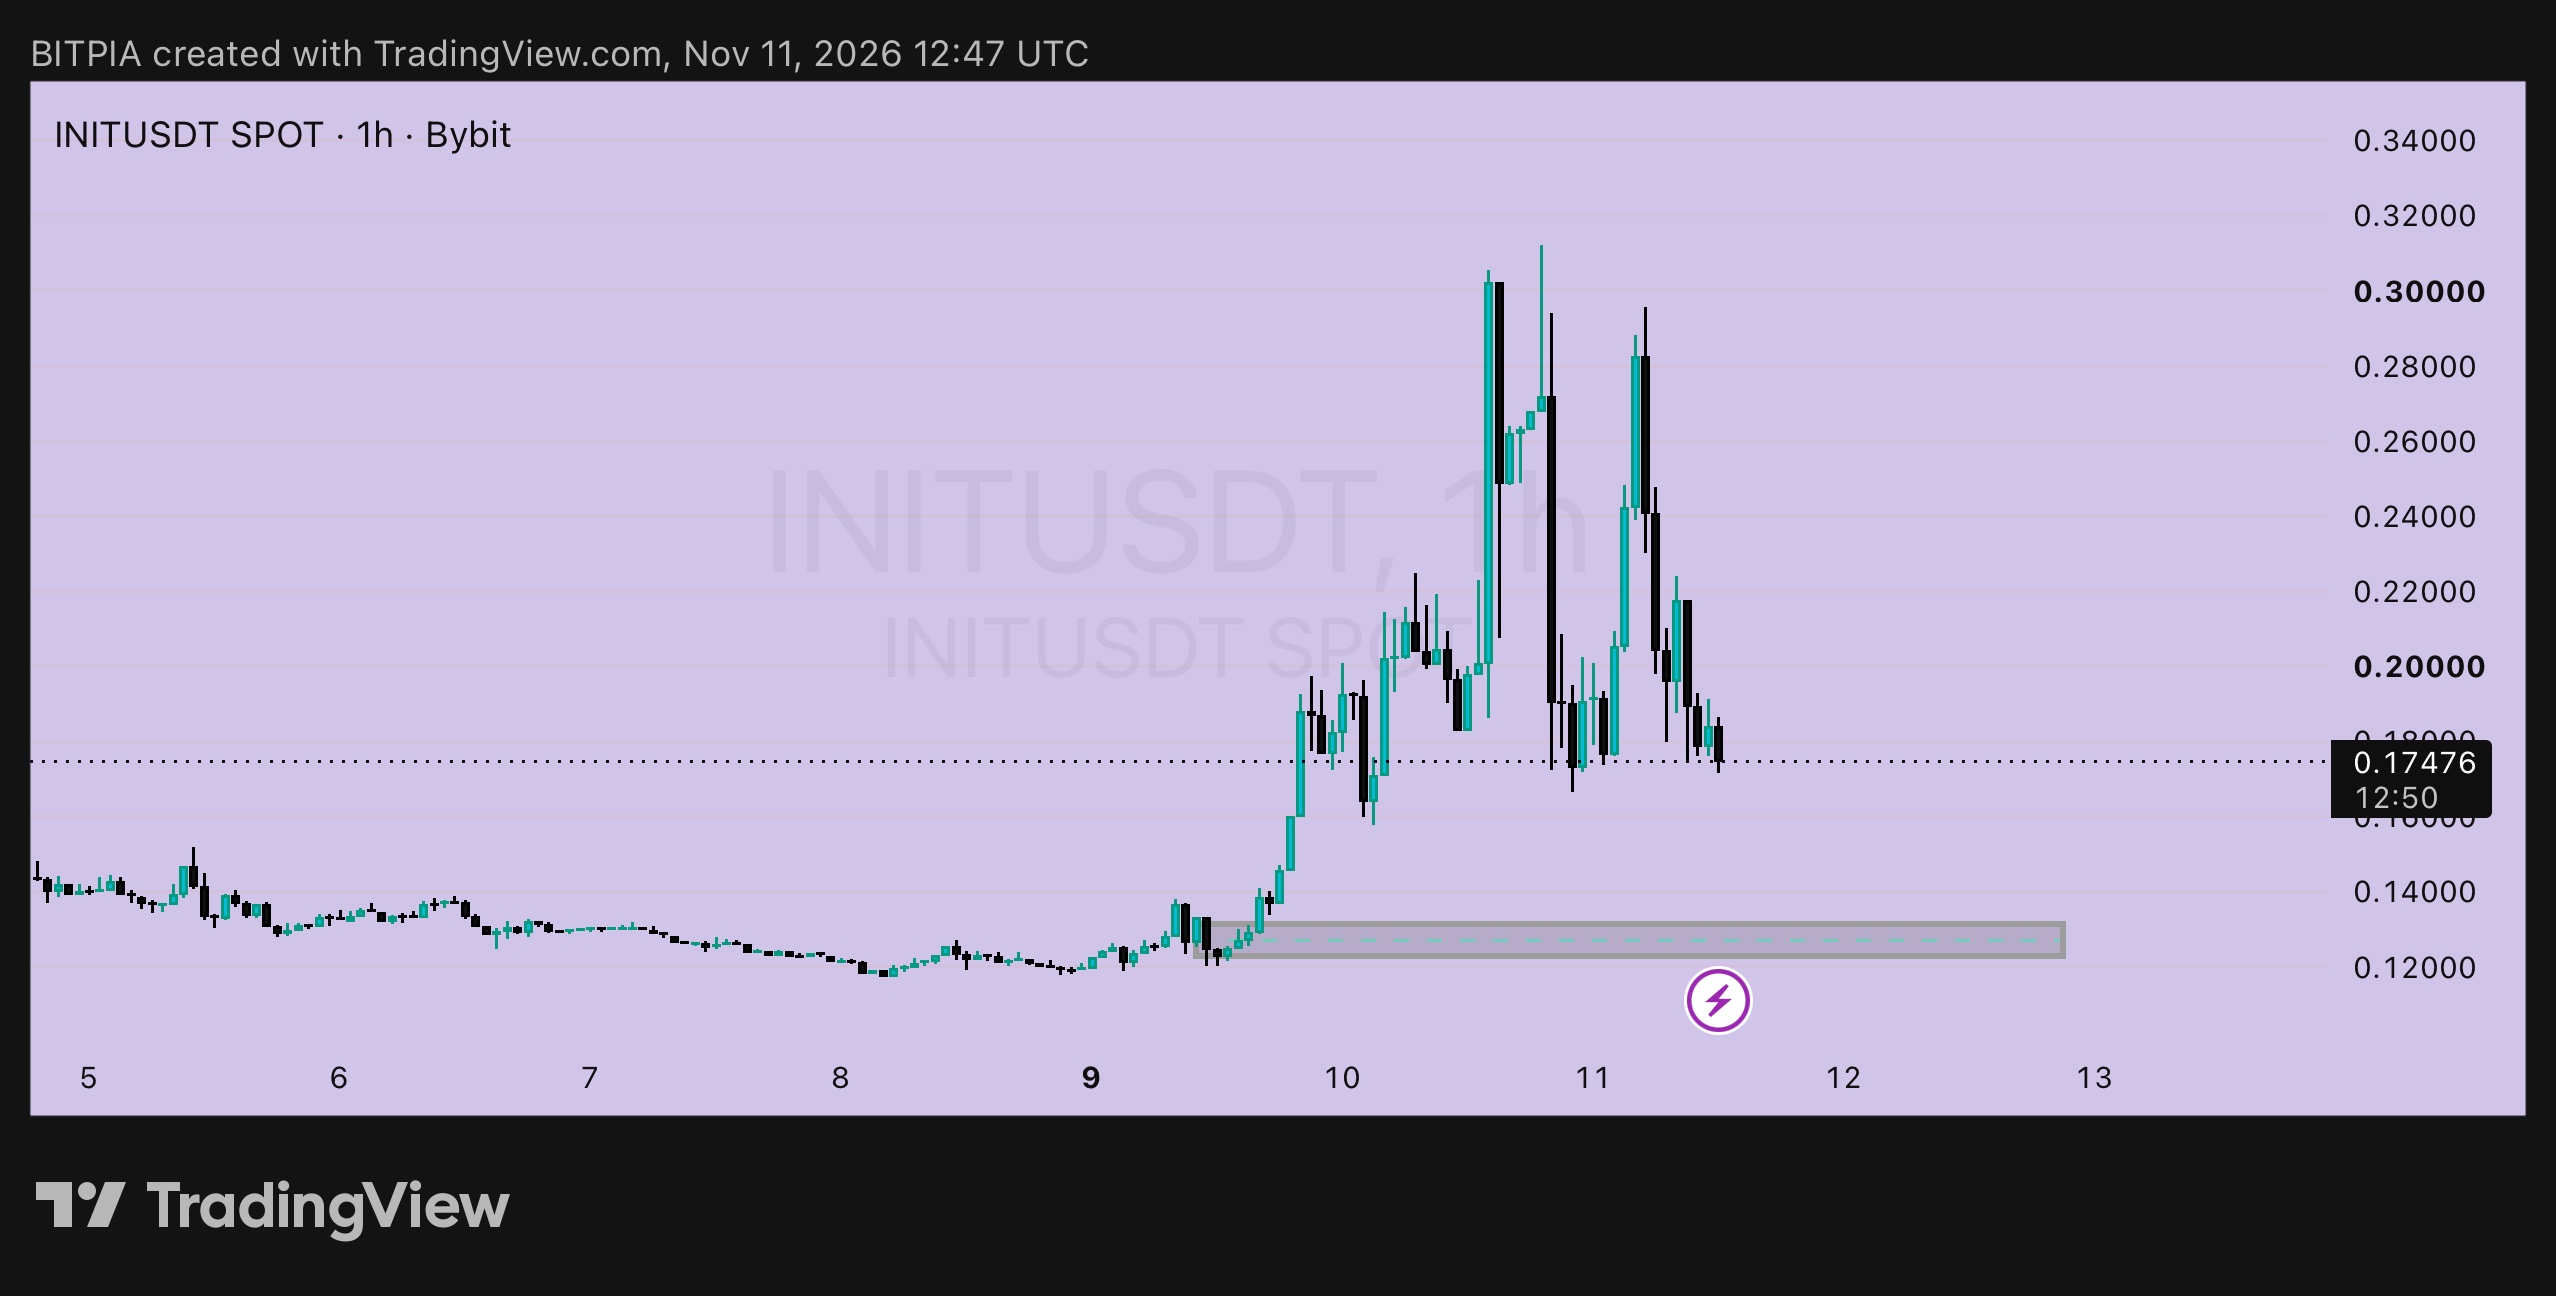
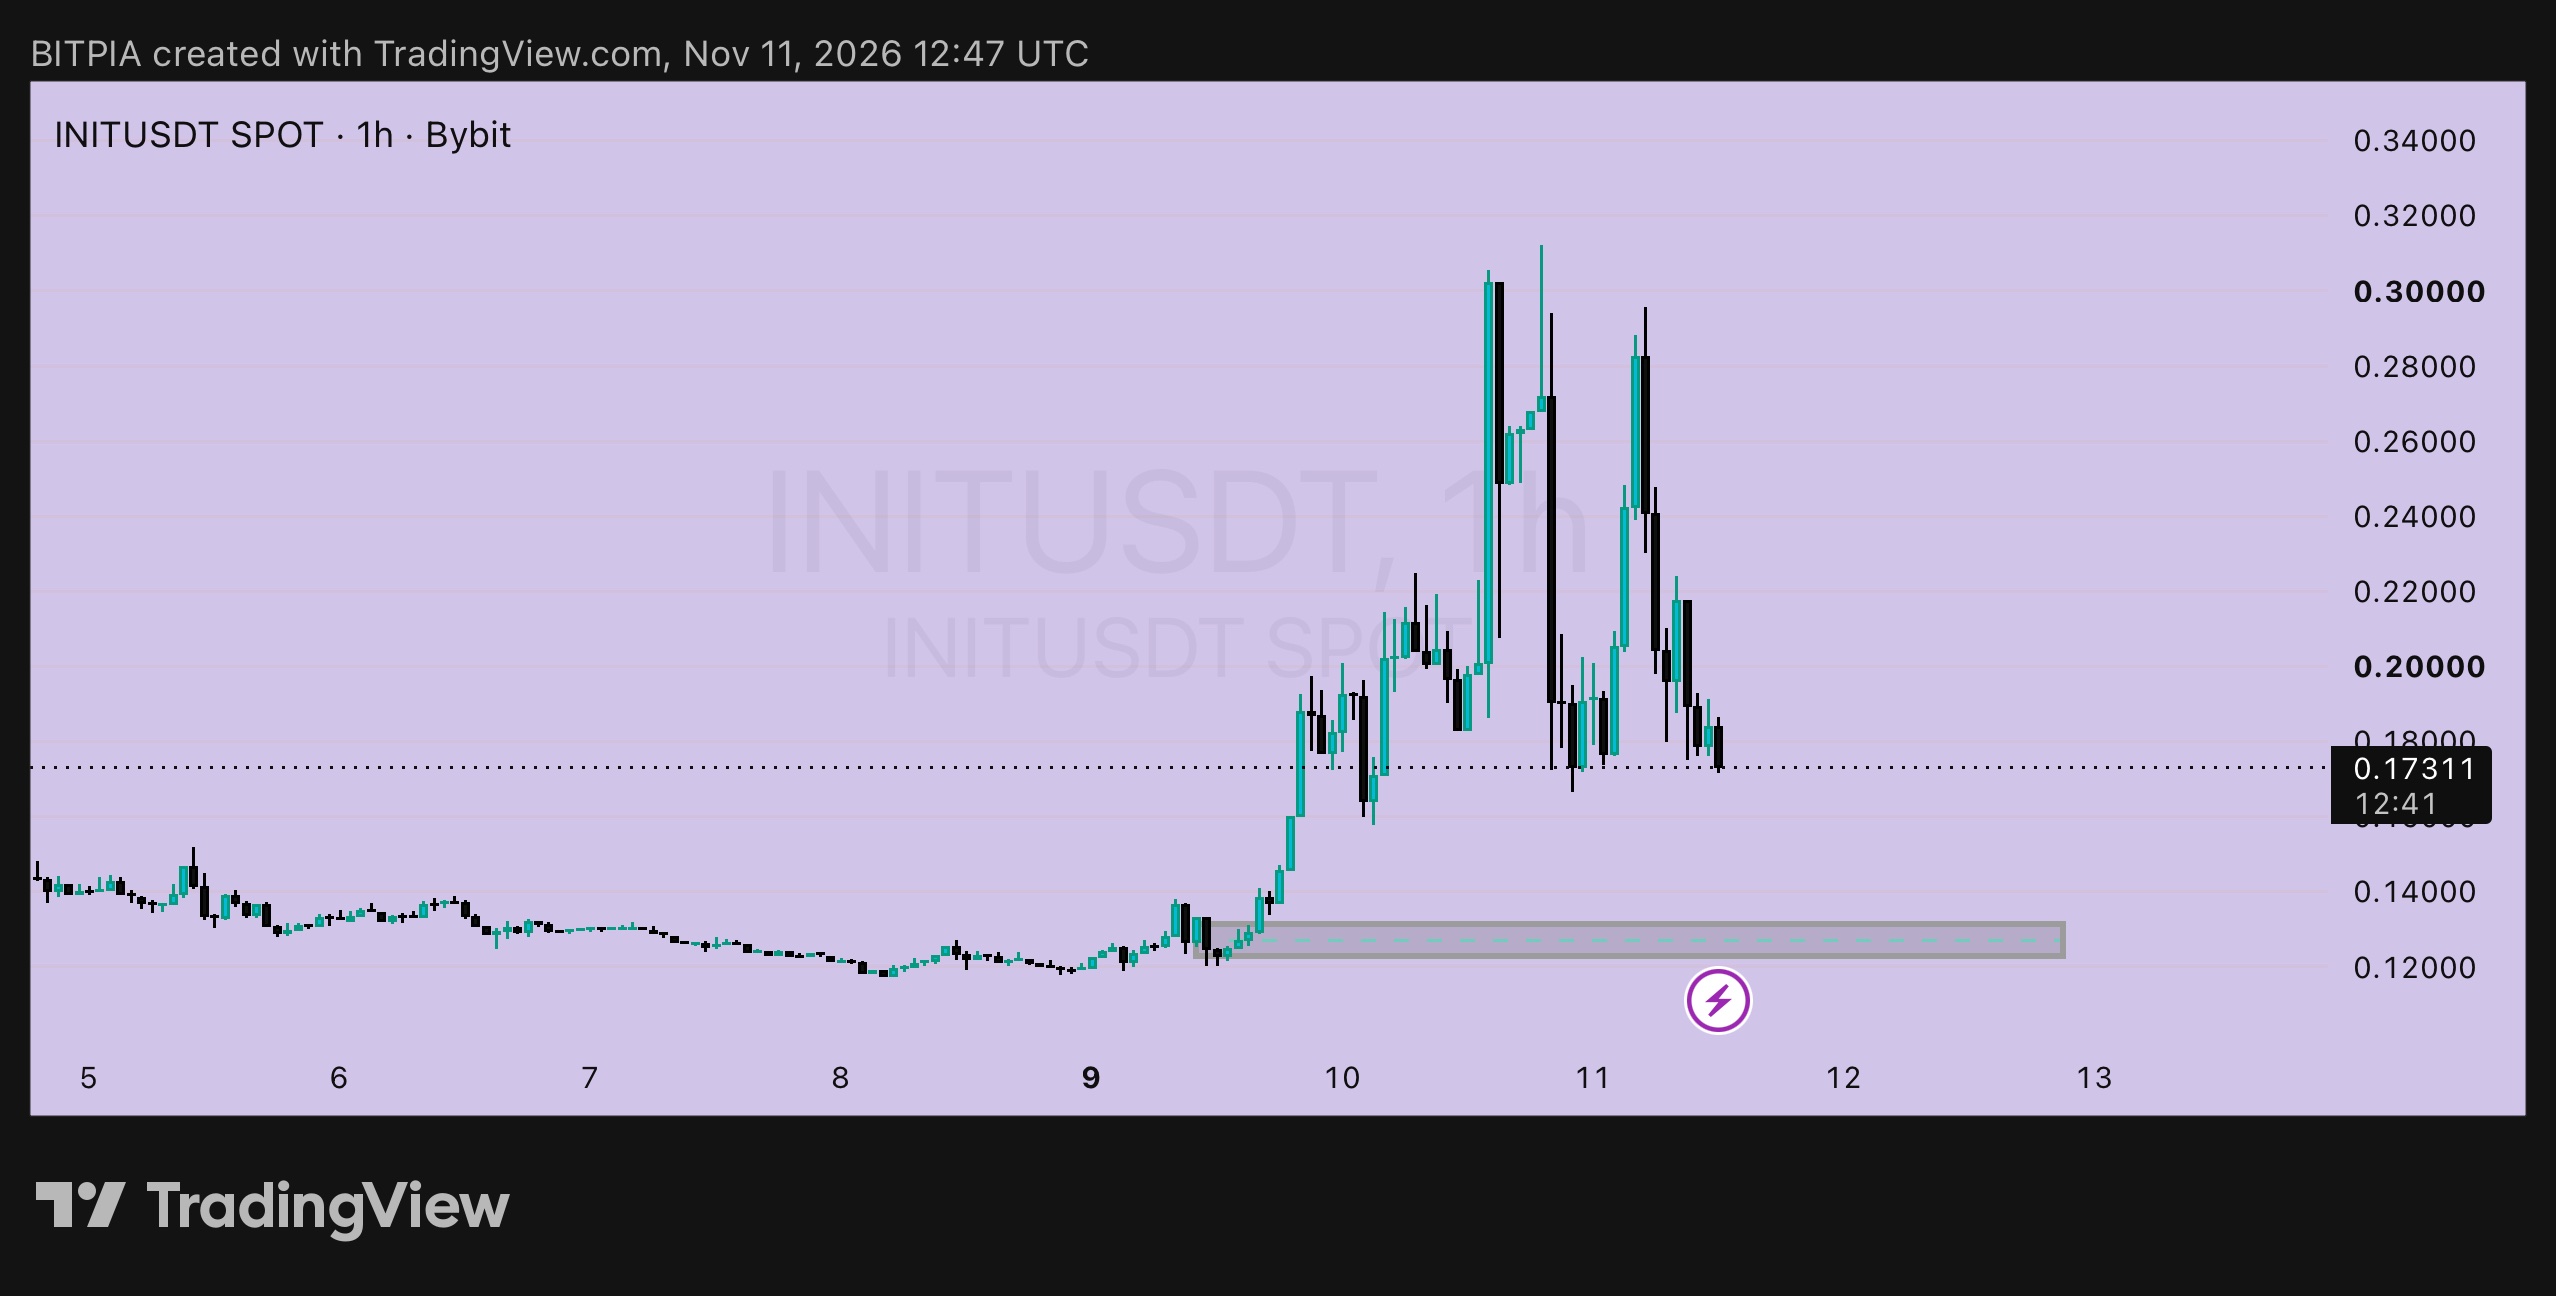
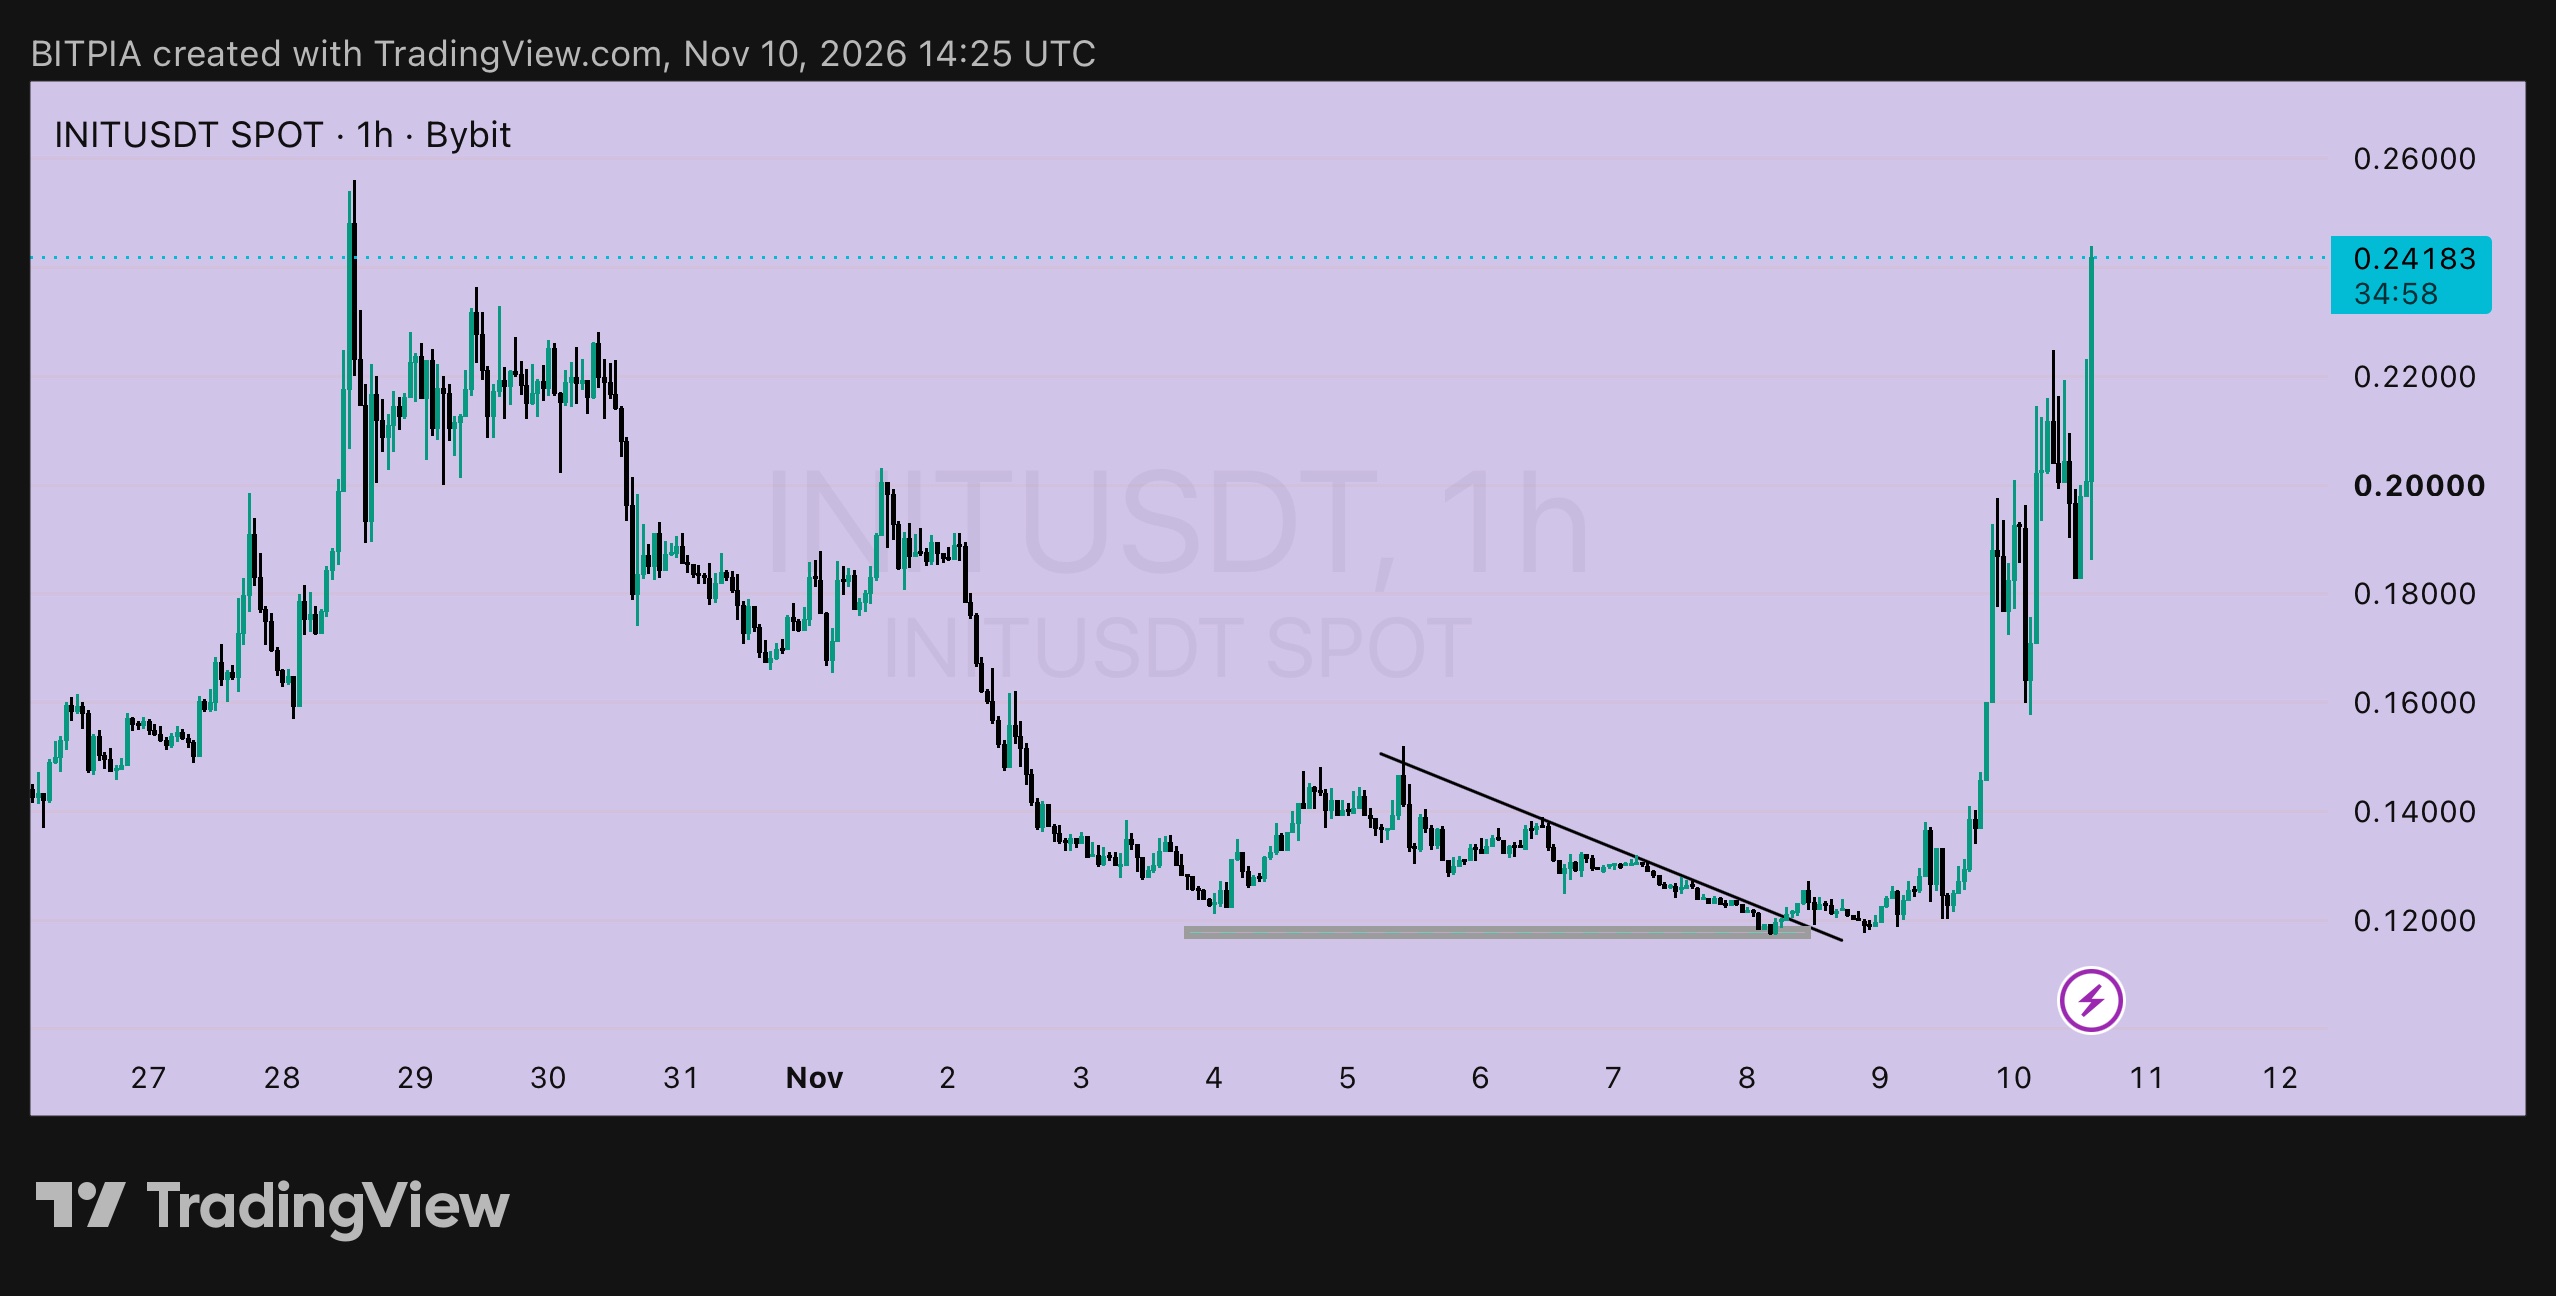
INIT 1j: menutup buku 🧾 Postingan $INITUSDT terakhir saya ada di 0,24183 pada 10 Nov, dengan rencana untuk menjual setengahnya di dekat 0,2400 hingga 0,2500 dan memasang trailing stop untuk sisanya di sekitar 0,1800. Harga sempat naik ke sekitar 0,312, turun kembali, membuat puncak kedua di dekat 0,295, dan sekarang berada di 0,17311, di bawah trailing stop. Ini rekapannya. ➤ Trading-nya ▸ Entry (Door 2): 0,1200, risiko 0,0050 ▸ Setengah pertama: terjual di dekat 0,2400 hingga 0,2500, kira-kira 24R hingga 26R untuk bagian itu ▸ Setengah kedua: kena stop di dekat 0,1800, kira-kira 12R untuk bagian itu ▸ Hasil gabungan: sekitar 18R untuk keseluruhan posisi. Hasil yang luar biasa, bahkan dengan trailing stop yang terkena penurunan ➤ Bagian jujurnya Harga sempat melampaui zona jual pertama saya, naik hingga sekitar 0,312, jadi menjual di dekat 0,2400 berarti ada profit yang tidak terambil. Itulah harga yang harus dibayar karena mengambil untung sebelum mencapai puncak. Saya tidak tahu puncaknya di depan, begitu juga orang lain. Trade 12R hingga 26R bukanlah sesuatu yang saya sesali. ➤ Apa kata grafik sekarang ▸ Dua puncak tinggi di dekat 0,30 sudah berlalu, dan setiap puncak itu ada aksi jual ▸ Harga berada di 0,1731, dengan low terbaru di dekat 0,160 ▸ Zona peluncuran di dekat 0,125 hingga 0,132 berada jauh di bawah, dan harga mungkin kembali ke sana atau mungkin tidak ➤ Jika Anda ingin masuk lagi Rencana pullback: ▸ Entry: di sekitar 0,1650, hanya jika area 0,160 bertahan ▸ Stop-loss: di bawah 0,1500 ▸ Risiko per unit: 0,0150 ▸ Target: 0,2000 (+0,0350, sekitar 2,3R) dan 0,2400 (+0,0750, sekitar 5R) Rencana reclaim: ▸ Pemicu: close 1j di atas 0,2000 ▸ Entry: di sekitar 0,2050 ▸ Stop-loss: di bawah 0,1800 ▸ Risiko per unit: 0,0250 ▸ Target: 0,2400 (sekitar 1,4R) dan 0,2950 (+0,0900, sekitar 3,6R) ➤ Apa yang membatalkan ide pullback Close 1j di bawah 0,1500 berarti area 0,160 telah gagal, dan saya akan menunggu zona 0,125 hingga 0,132 sebelum mempertimbangkannya lagi. Pergerakan seperti ini sangat liar di kedua arah, jadi gunakan ukuran posisi kecil, dan leverage rendah jika Anda menggunakan perp. Bukan nasihat keuangan. Lakukan riset Anda sendiri dan hanya risikokan apa yang Anda sanggup jika rugi. #ByXIMPACT #WSOT2026
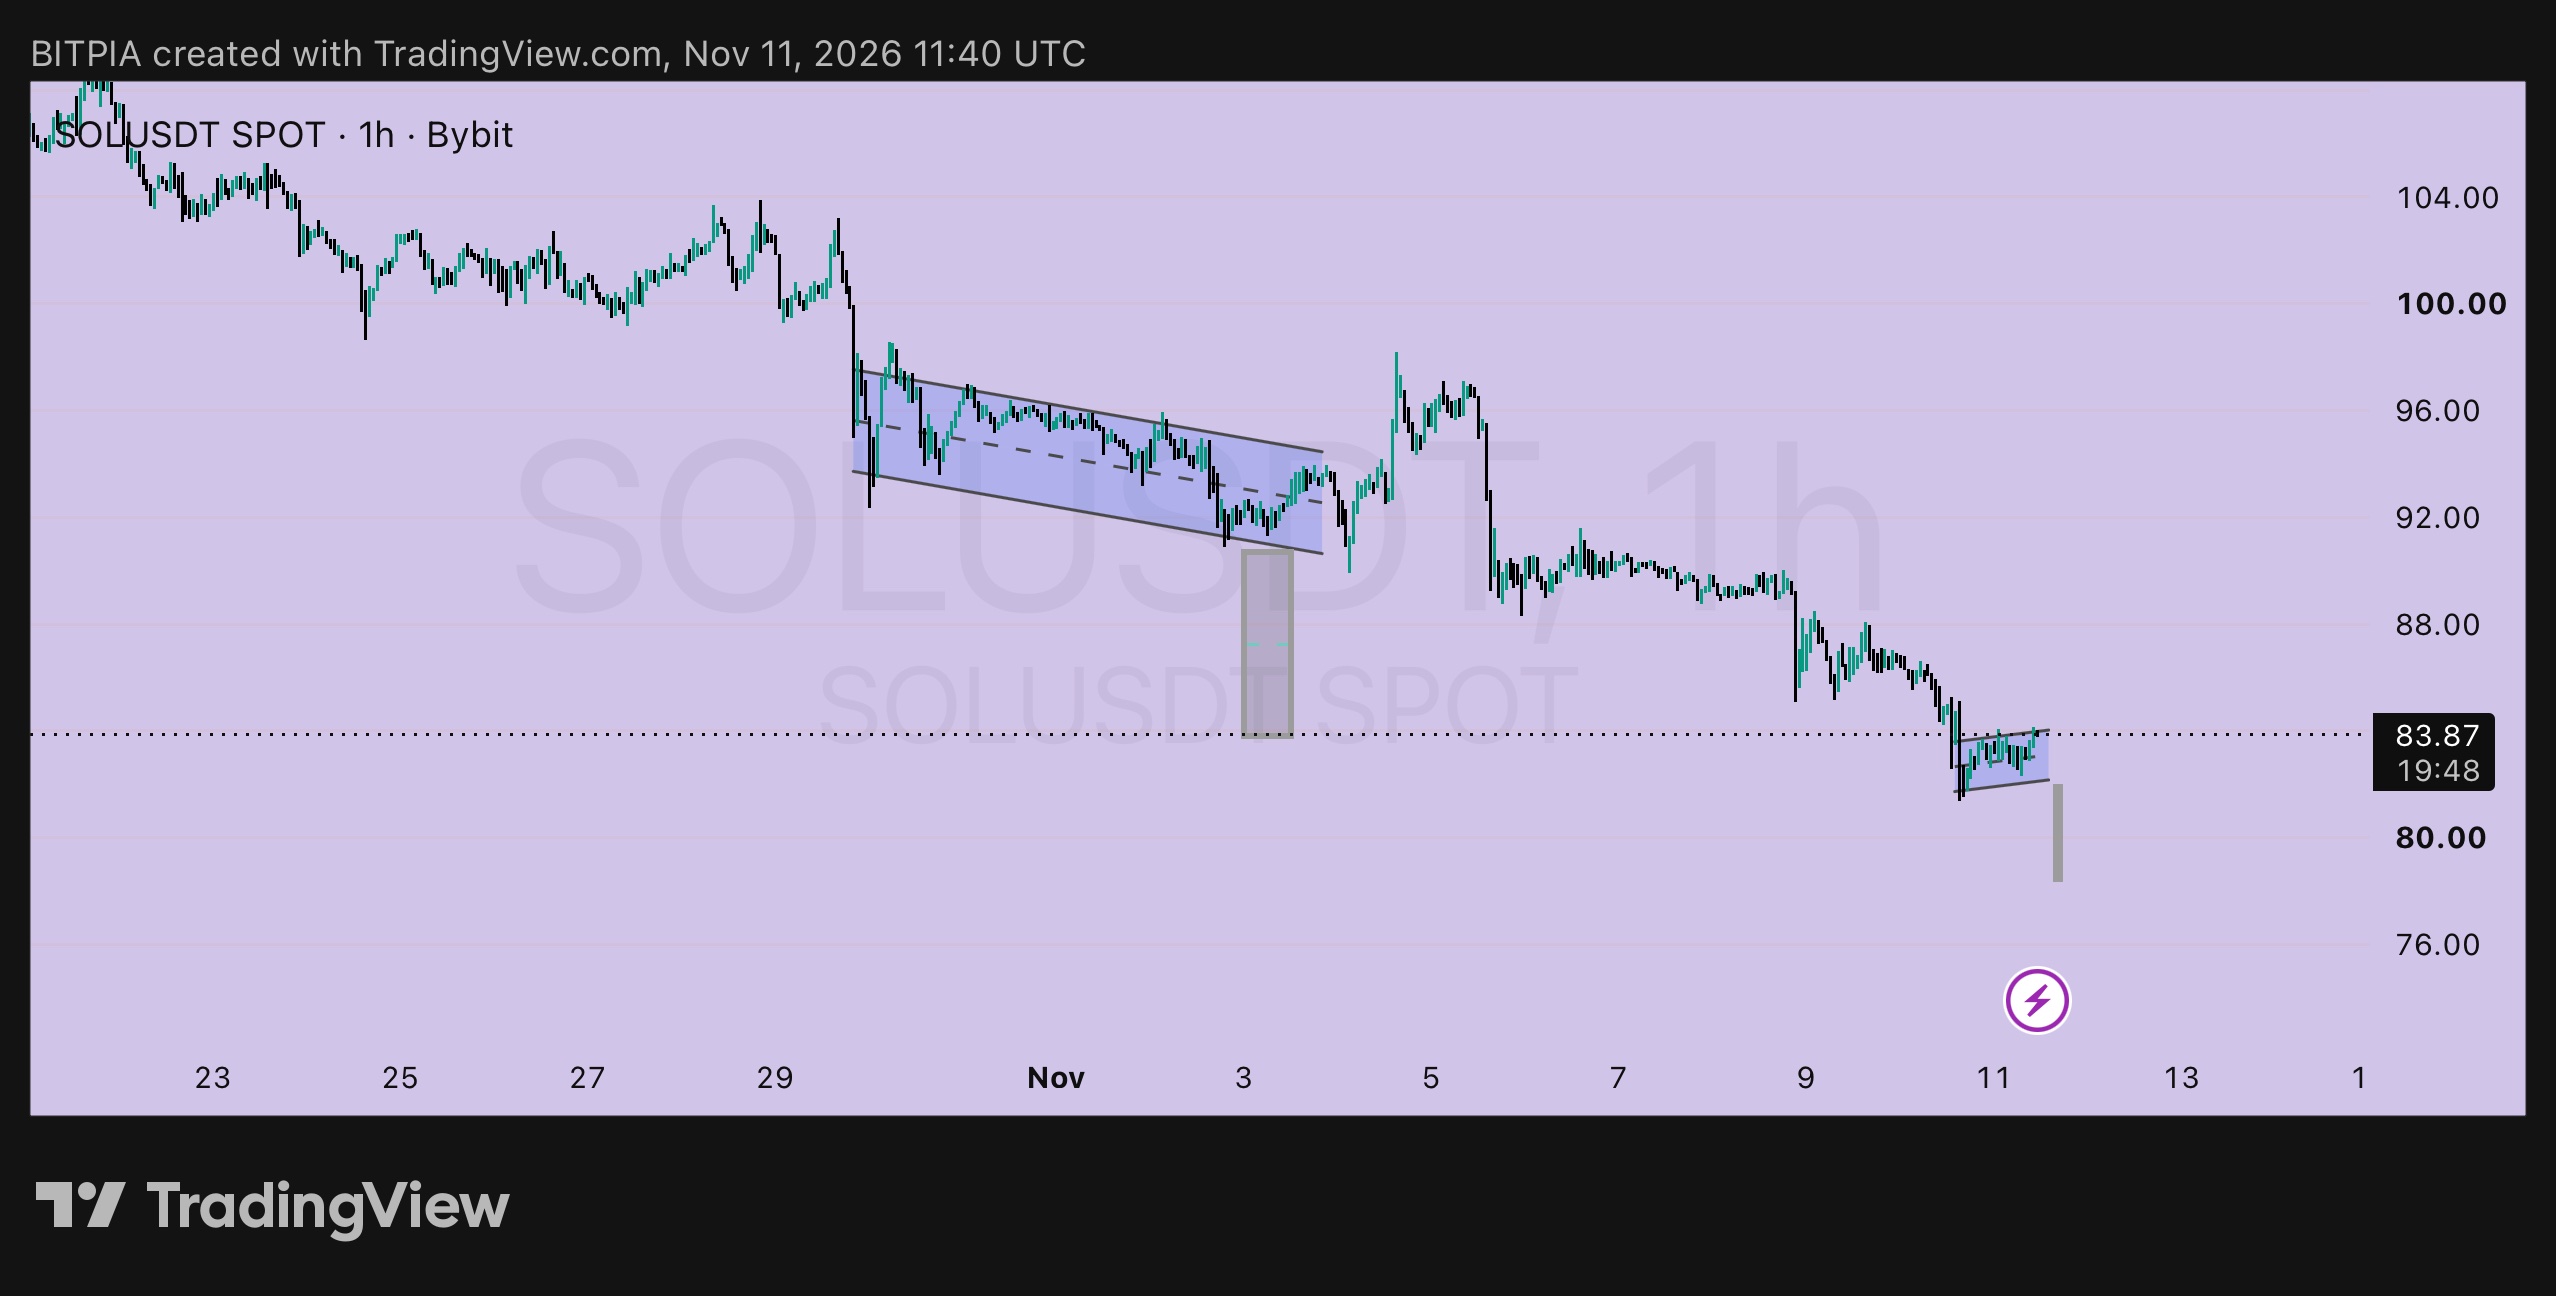
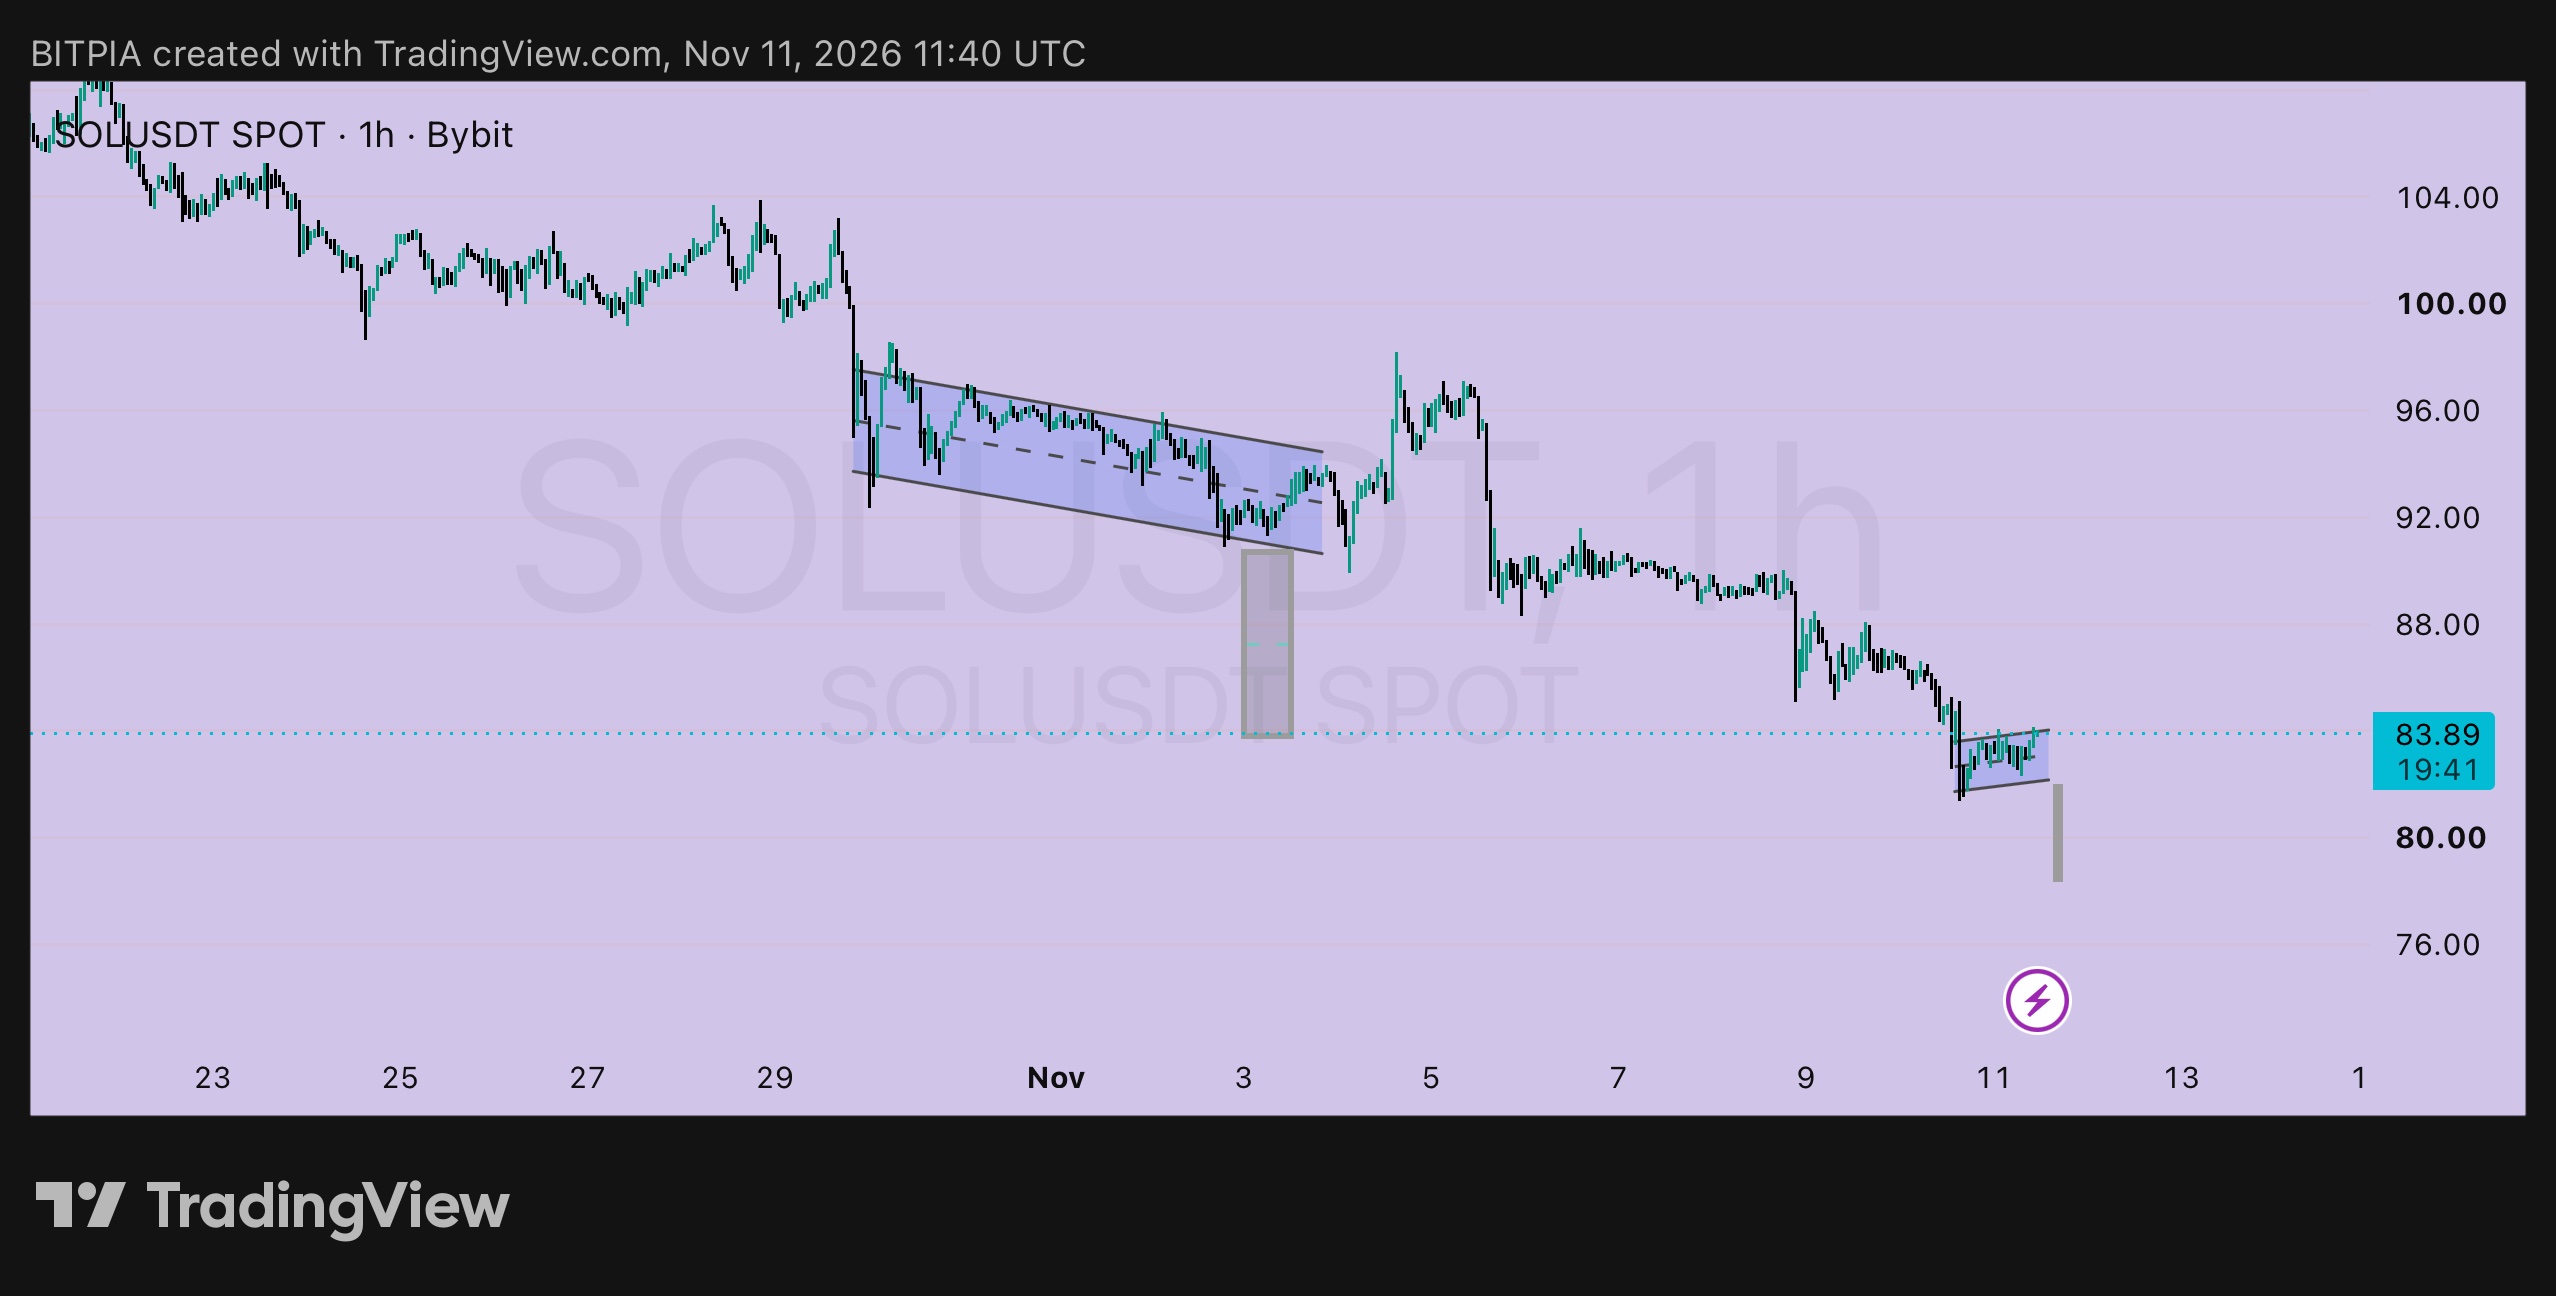
$SOLUSDT 1h: mirror review of my last plan 🪞 On Nov 6 I posted SOL at 89.77 with two sides. Here's what each one did. ➤ Side 1: short on a retest of 91.5 ▸ Plan: entry 91.5, stop above 94.0, targets 86 and 84 ▸ Result: price retested the area, then rolled over, and now trades at 83.89 ▸ Both targets were reached, about 3R from the entry for anyone who took it on a perp ➤ Side 2: long near 85 ▸ Plan: entry 85, stop below 82.5 ▸ Result: price went through 85 and made a low near 81.5, so the stop was hit ▸ Loss: about 1R. The 84 to 86 zone I expected didn't hold One side paid and the other cost me a small, planned loss. That's the reason I post both. ➤ What the chart says now ▸ Price is in a small flag on the 1h chart, roughly 82 to 84, after the move down ▸ The measured move from that flag points to about 78 ▸ The older channel and the Nov 3 flag target at 84 are both behind us ➤ Plan from here: short side, perps only ▸ Entry: around 84.0, on a retest of the flag top ▸ Stop-loss: above 85.5 ▸ Risk per unit: 1.5 ▸ Targets: 80 (+4, about 2.7R) and 78 (+6, about 4R) ➤ Plan from here: long side ▸ Trigger: a 1h close above 88 ▸ Entry: around 88.5 ▸ Stop-loss: below 86 ▸ Risk per unit: 2.5 ▸ Targets: 92 (+3.5, about 1.4R) and 96 (+7.5, about 3R) ➤ What cancels the short idea A 1h close above 85.5 means the flag is breaking up, and I'd drop it. For spot traders, the better move is to wait for a base to form, not to catch the move down. Small size, and low leverage on perps. Not financial advice. Do your own research and only risk what you can afford to lose. #ByXIMPACT #WSOT2026
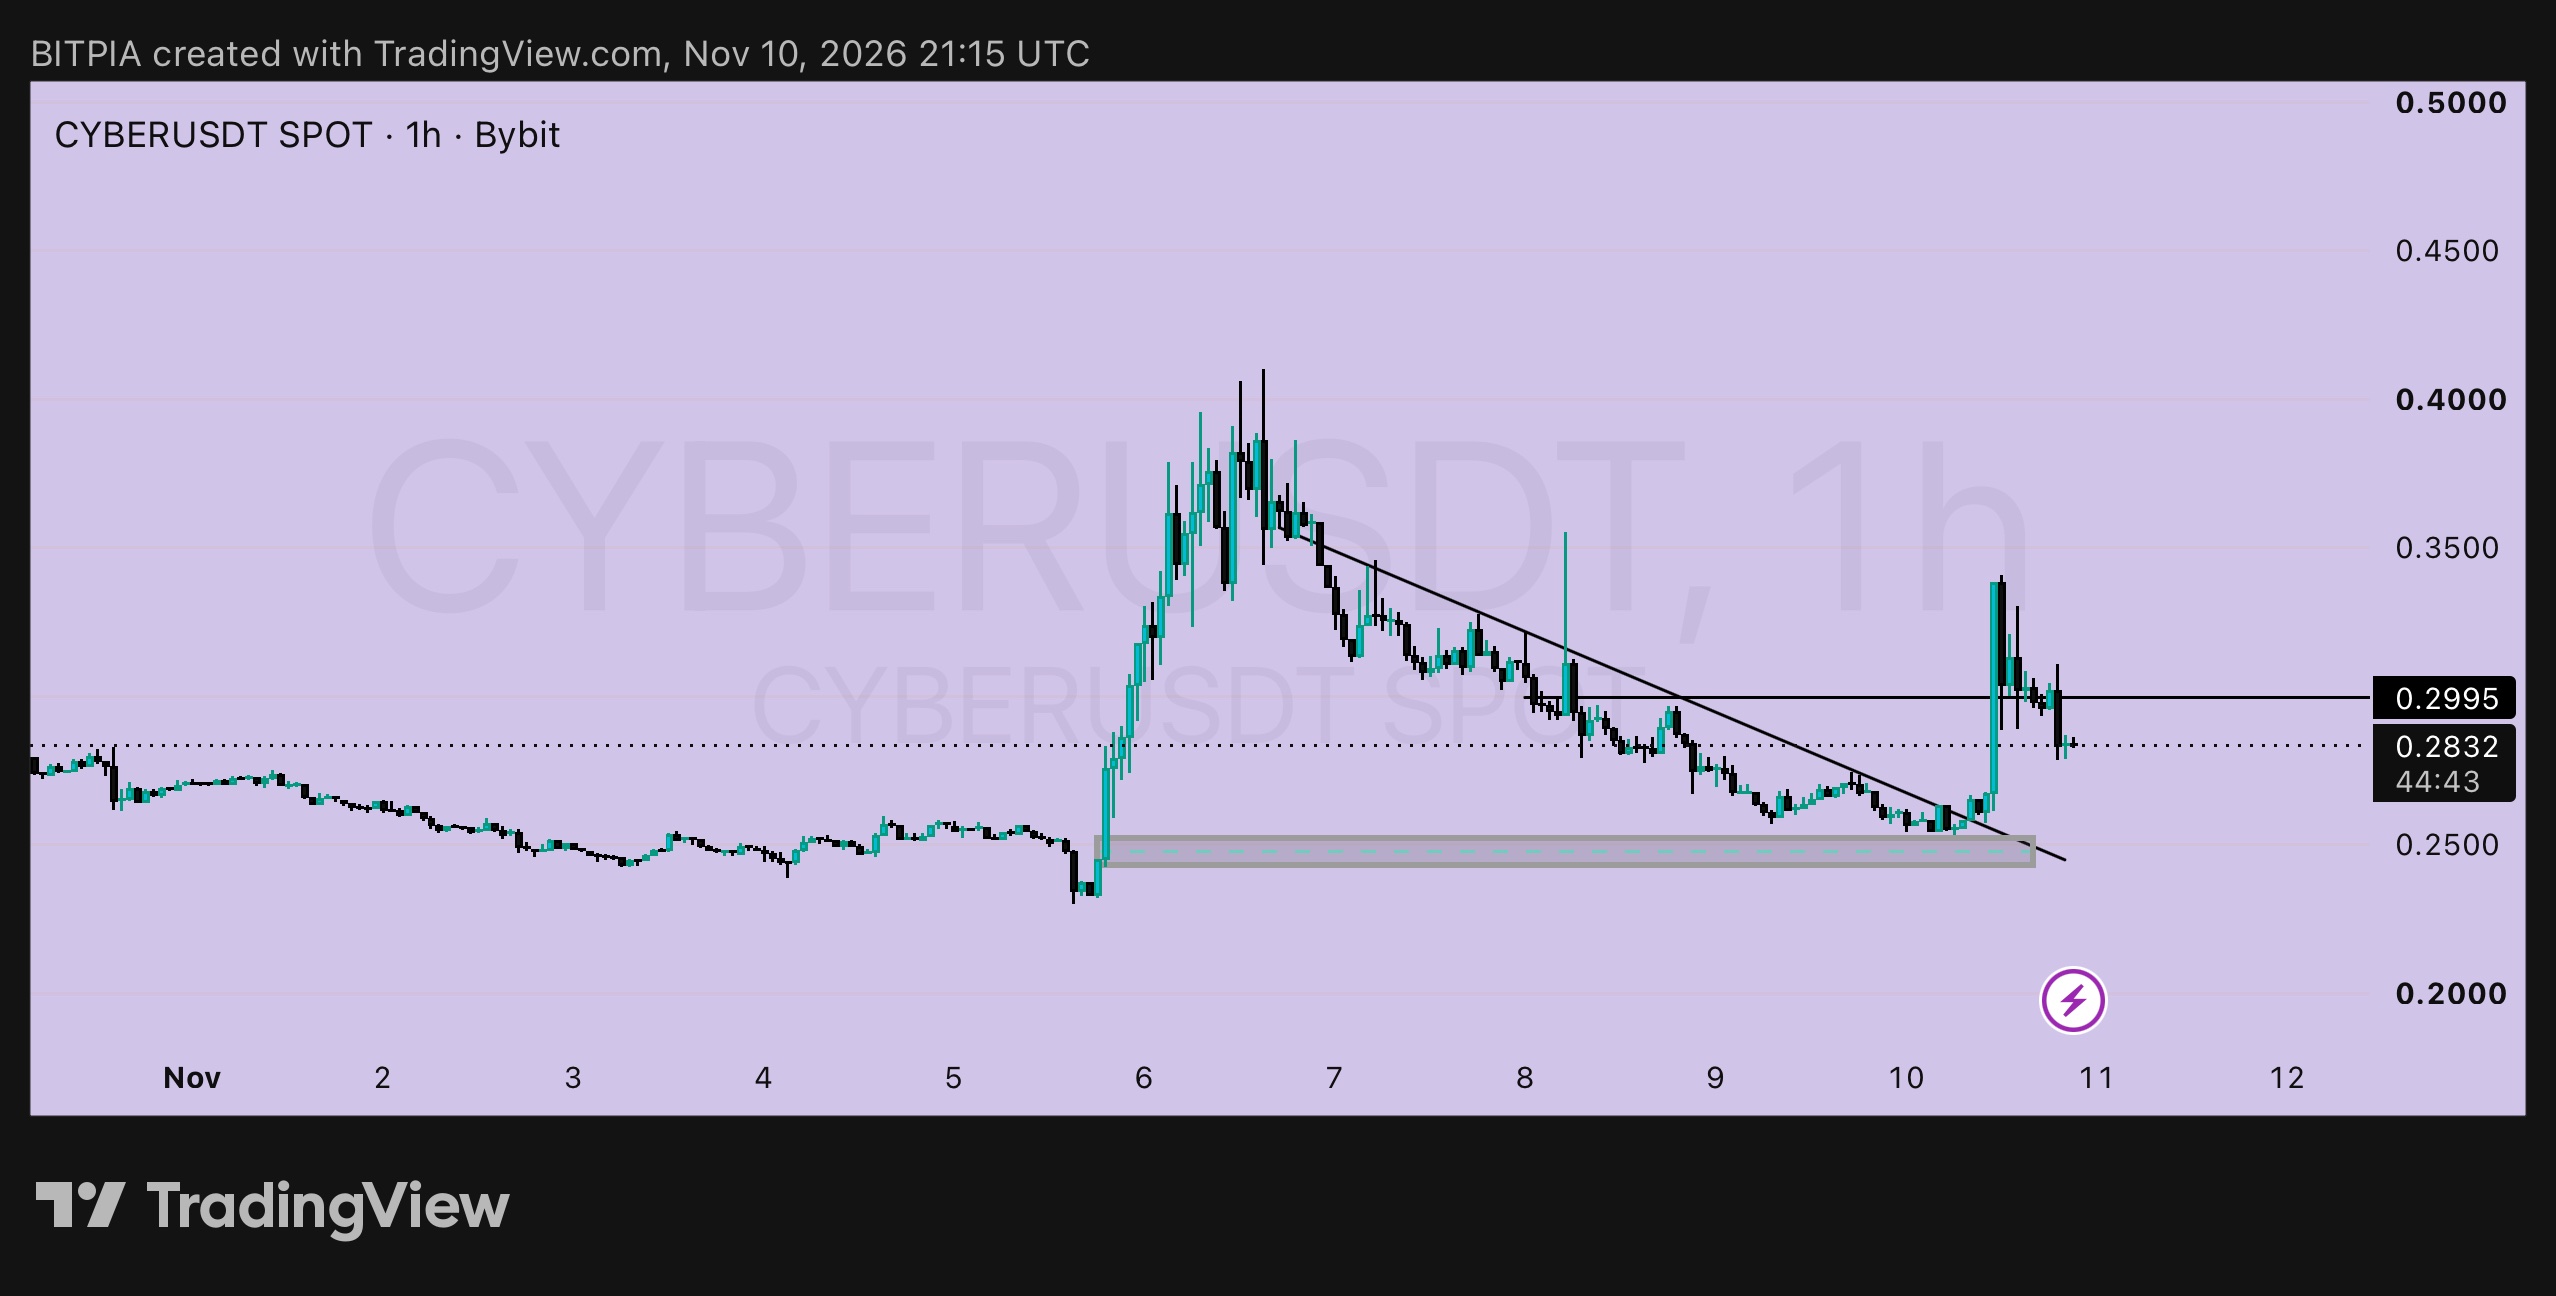
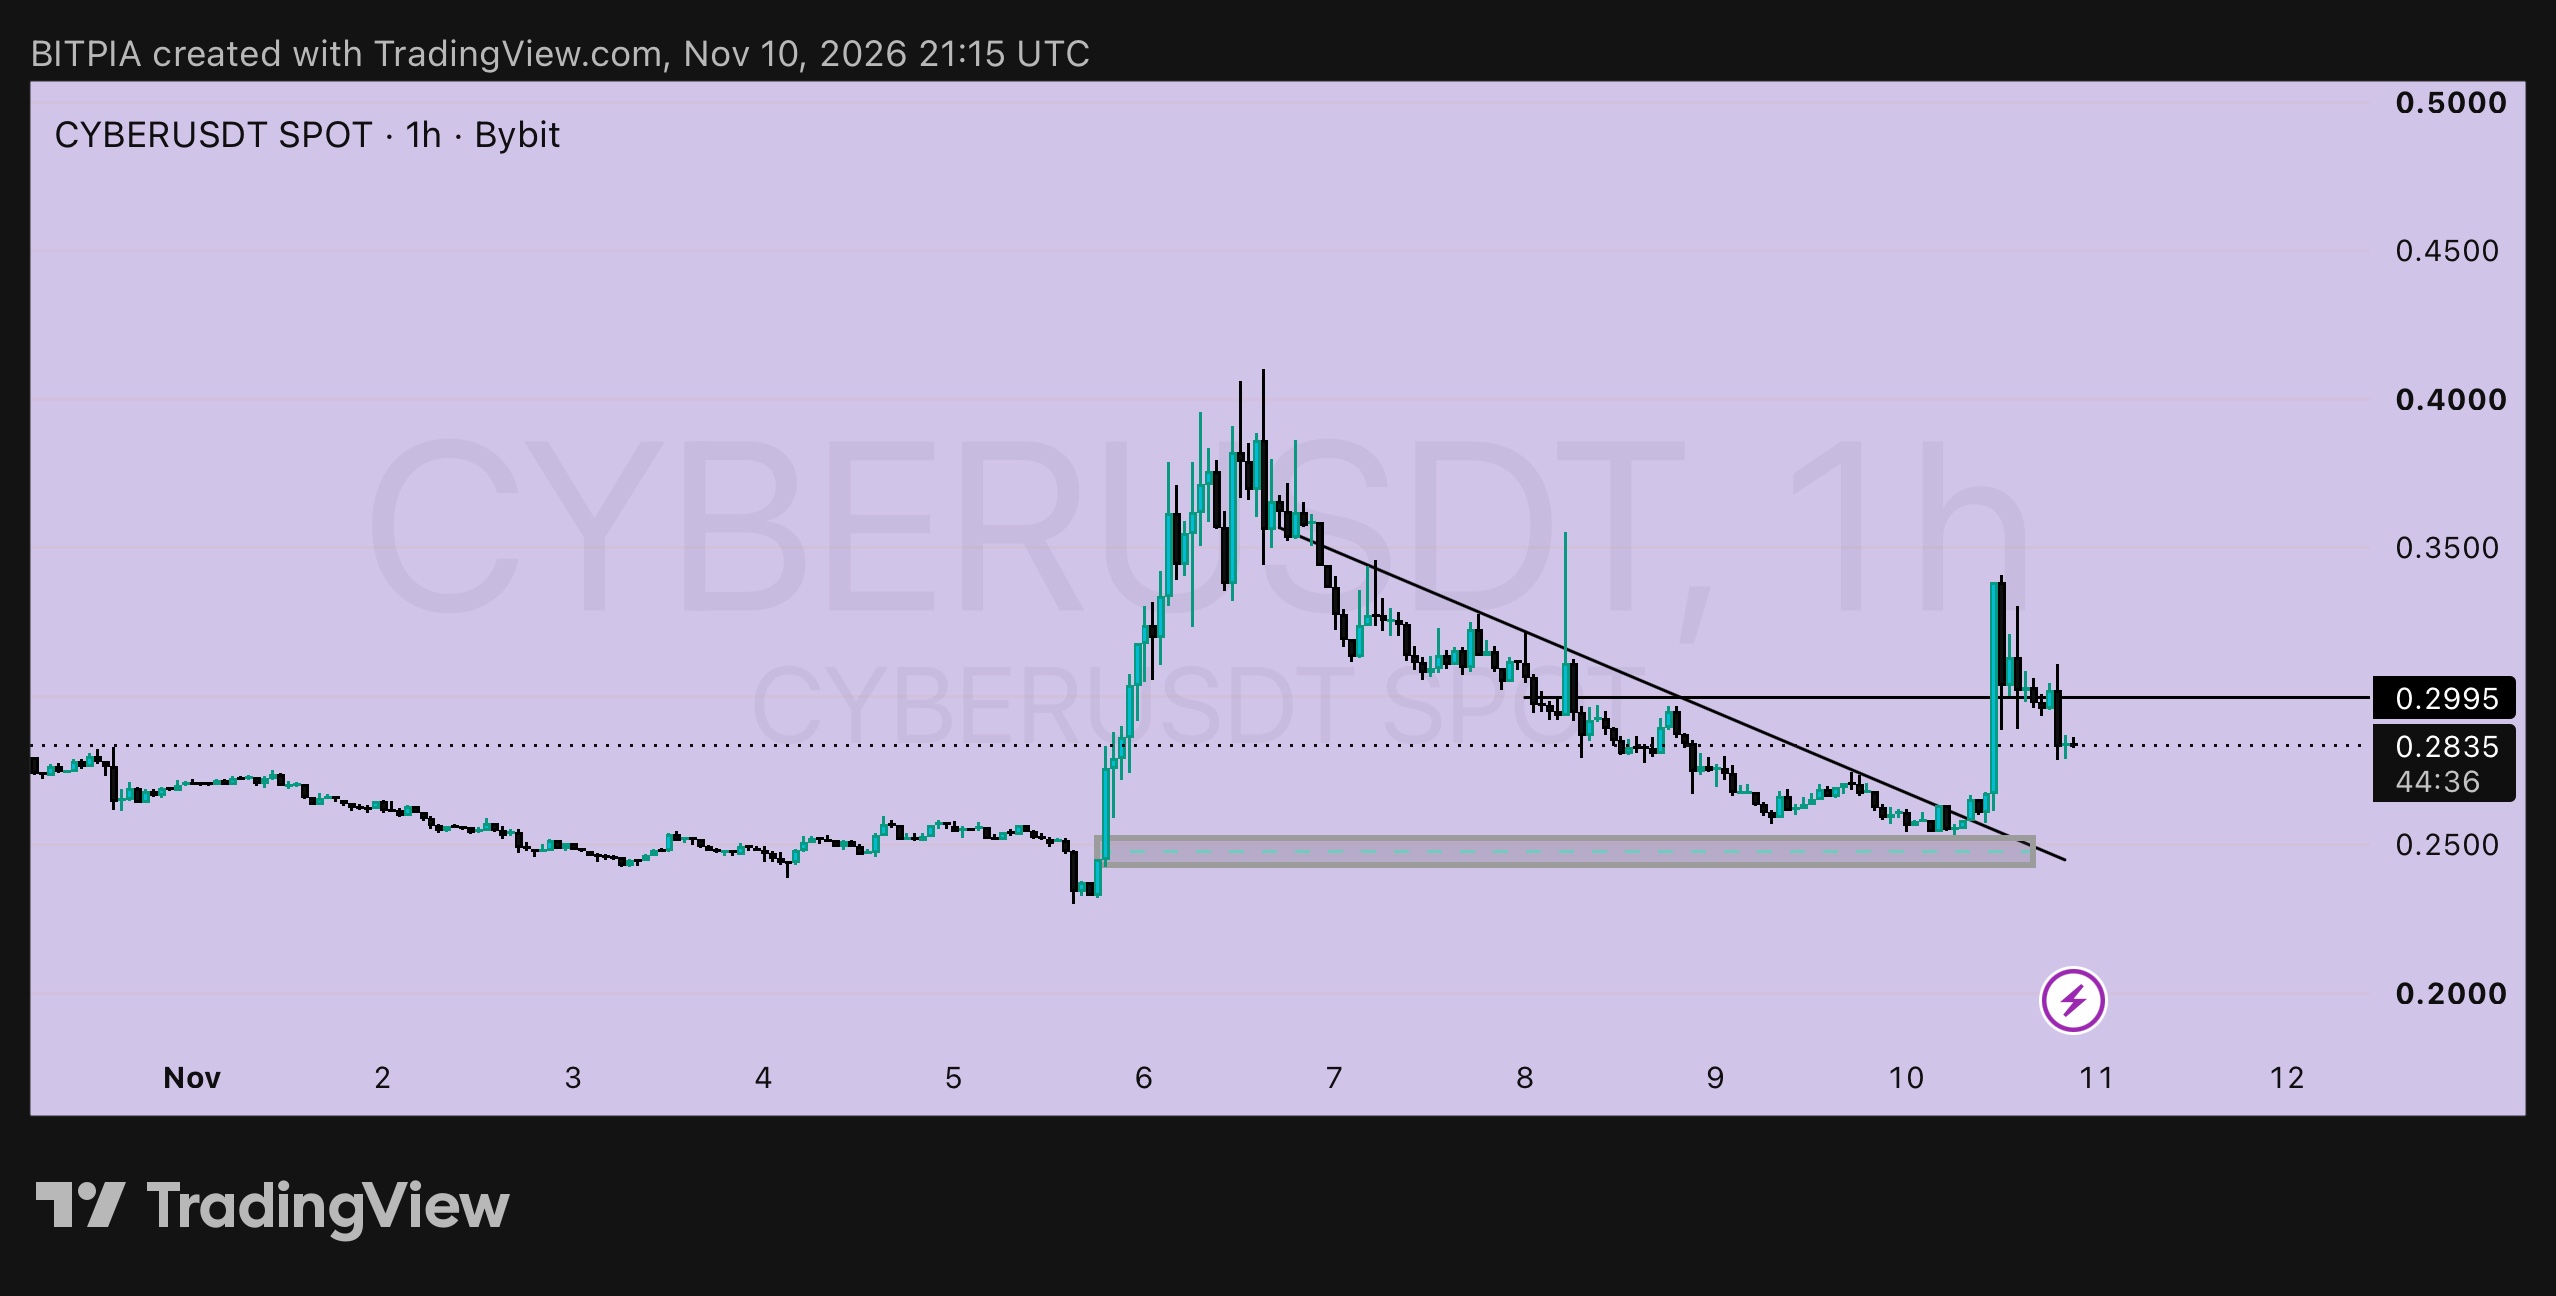
CYBER 1j: singkat dan padat 🍬 $CYBERUSDT berhasil menembus garis tren turunnya pagi ini dan melonjak ke sekitar 0,345, tetapi kemudian mengembalikan sebagian besar kenaikannya dan merosot ke bawah 0,2995. Harga saat ini berada di 0,2835. Penembusan yang tidak bisa bertahan di atas resistance pertama adalah sebuah peringatan, bukan kegagalan sepenuhnya. Saya akan menunggu salah satu dari dua sinyal yang jelas. ➤ Sinyal 1: retest lantai harga (support) ▸ Entri: di sekitar 0,2600, dekat zona support 0,245 hingga 0,255 dan garis tren lama ▸ Stop-loss: di bawah 0,2420 ▸ Risiko per unit: 0,0180 ▸ Target 1: 0,2995, +0,0395, sekitar 2,2R ▸ Target 2: 0,3450, +0,0850, sekitar 4,7R ➤ Sinyal 2: penutupan harga yang bersih di atas 0,2995 ▸ Entri: di sekitar 0,3030 ▸ Stop-loss: di bawah 0,2800 ▸ Risiko per unit: 0,0230 ▸ Target: 0,3450 (+0,0420, sekitar 1,8R) dan 0,4000 (+0,0970, sekitar 4,2R) ➤ Kenapa tidak sekarang Di harga 0,2835 dengan stop-loss di 0,2420, risikonya adalah 0,0415, dan level pertama di atasnya hanya berjarak 0,0160. Itu kurang dari setengah unit keuntungan untuk satu unit risiko. ➤ Apa yang membatalkan skenario ini Penutupan candle 1 jam di bawah 0,2420 berarti zona support telah gagal, dan saya akan menarik diri. Level tertinggi 6 Nov di dekat 0,41 menunjukkan seberapa cepat koin ini bergerak, ke kedua arah. Gunakan ukuran posisi kecil dan leverage rendah jika Anda menggunakan perps. Bukan nasihat keuangan. Lakukan riset Anda sendiri dan hanya ambil risiko dengan dana yang Anda siap untuk kehilangan. #ByXIMPACT #WSOT2026
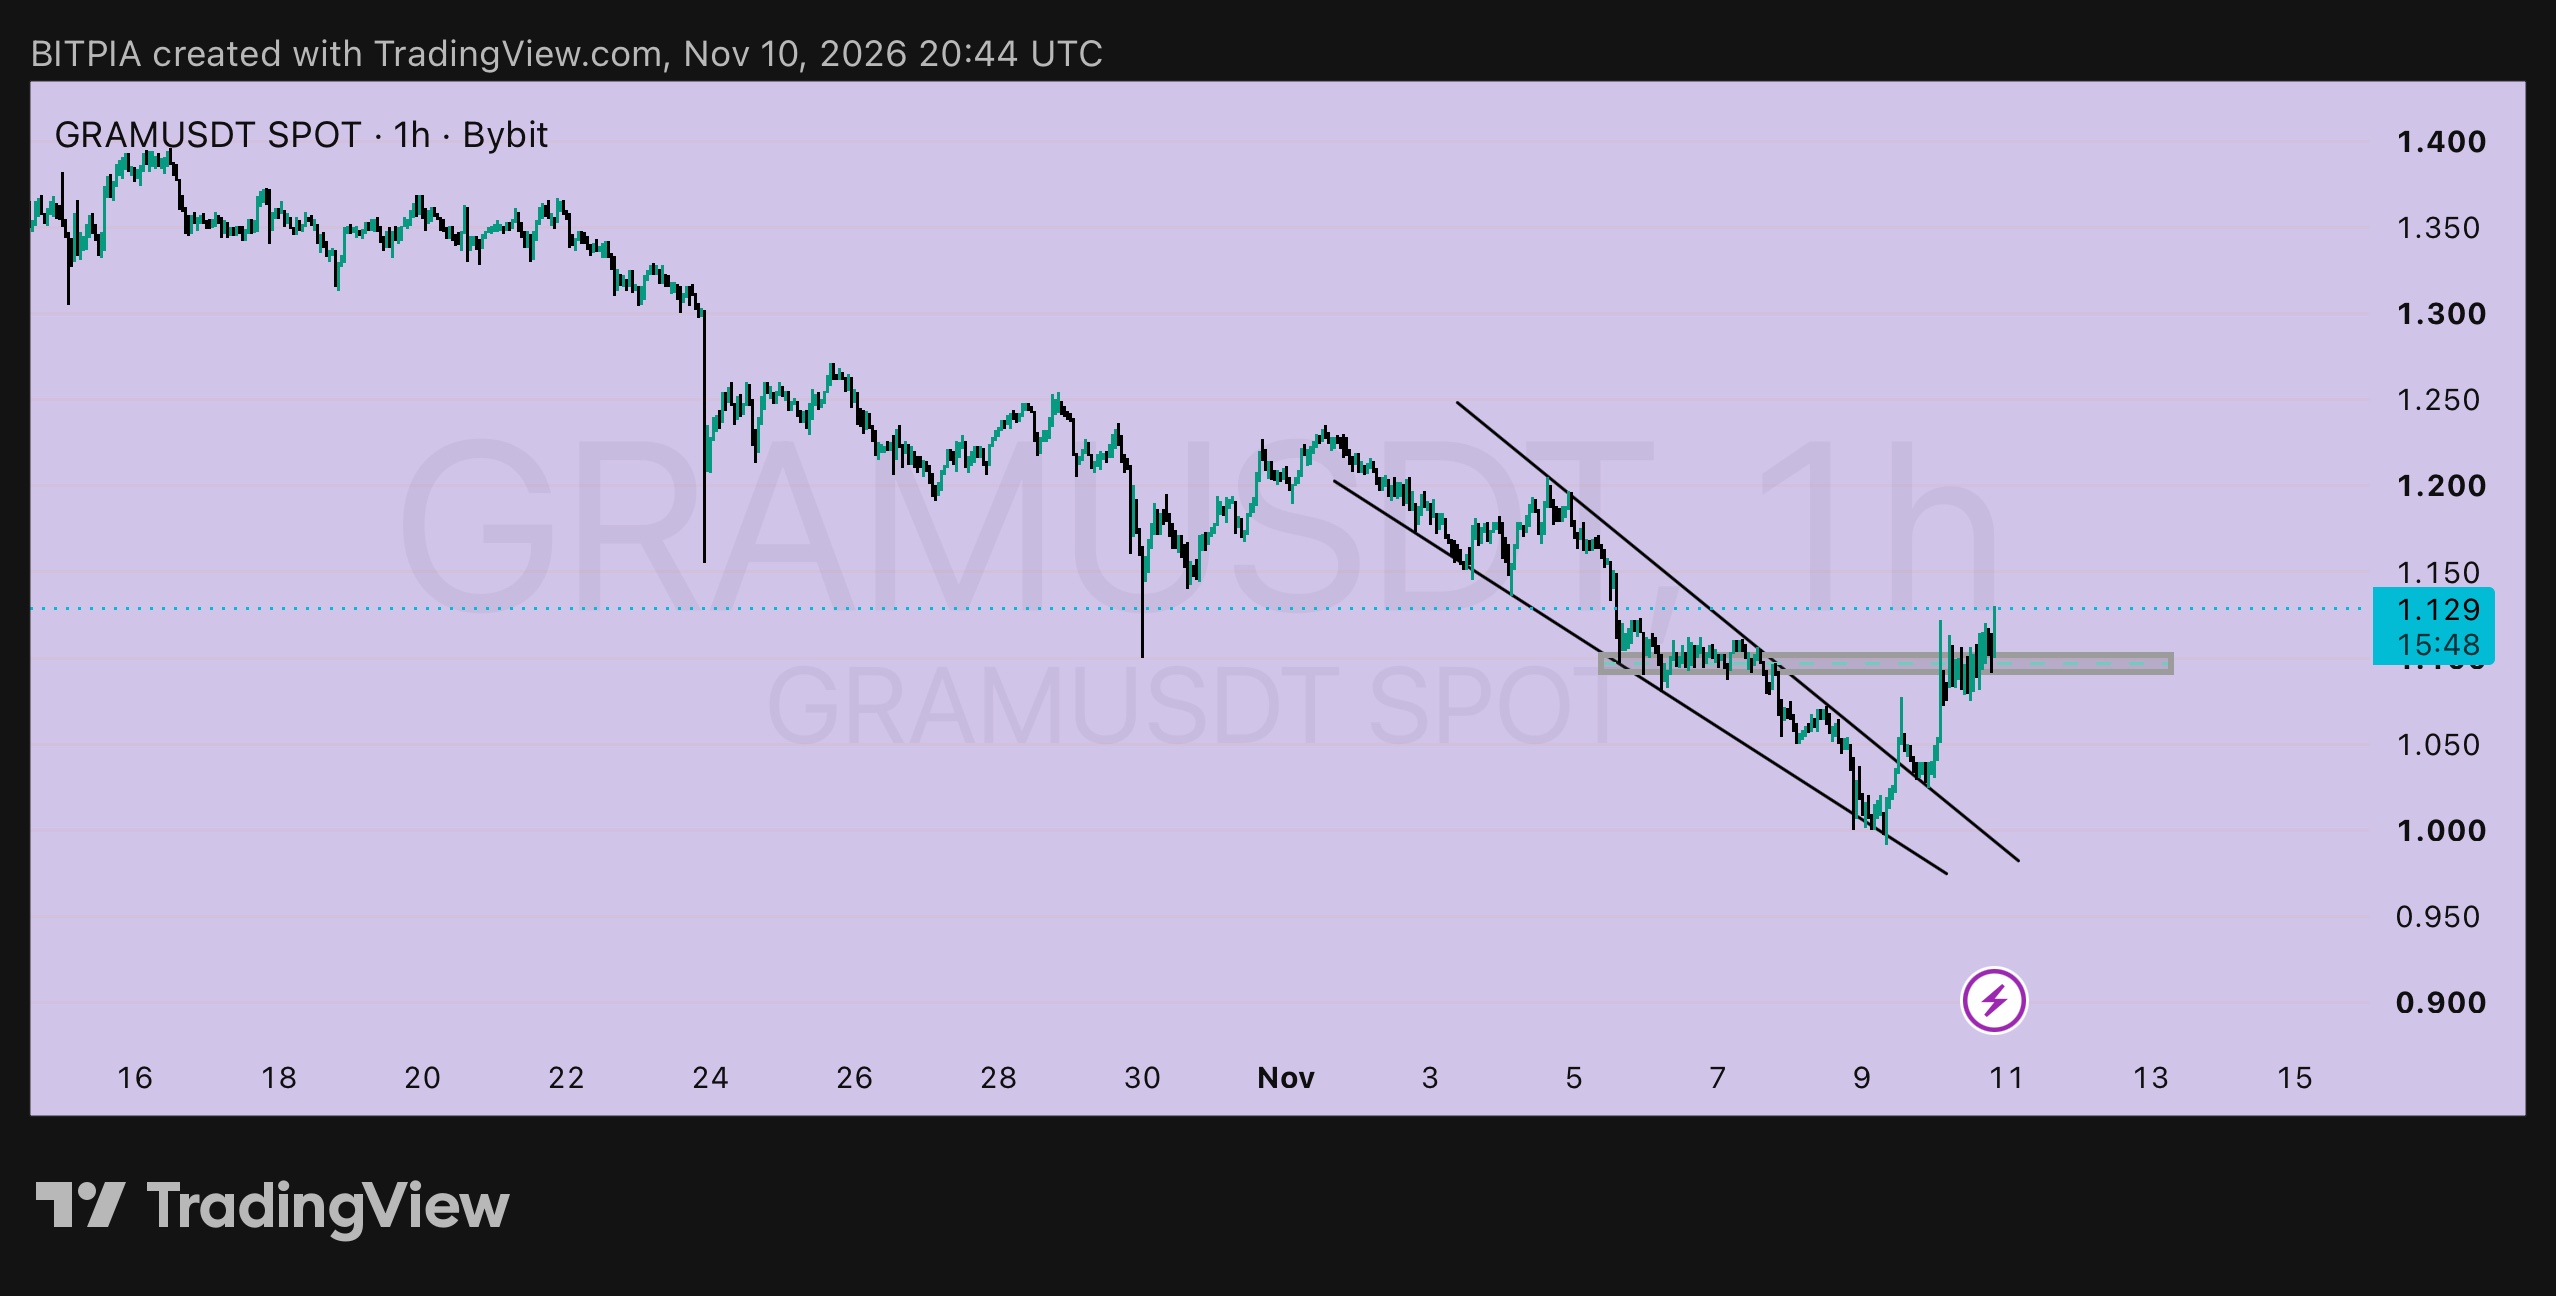
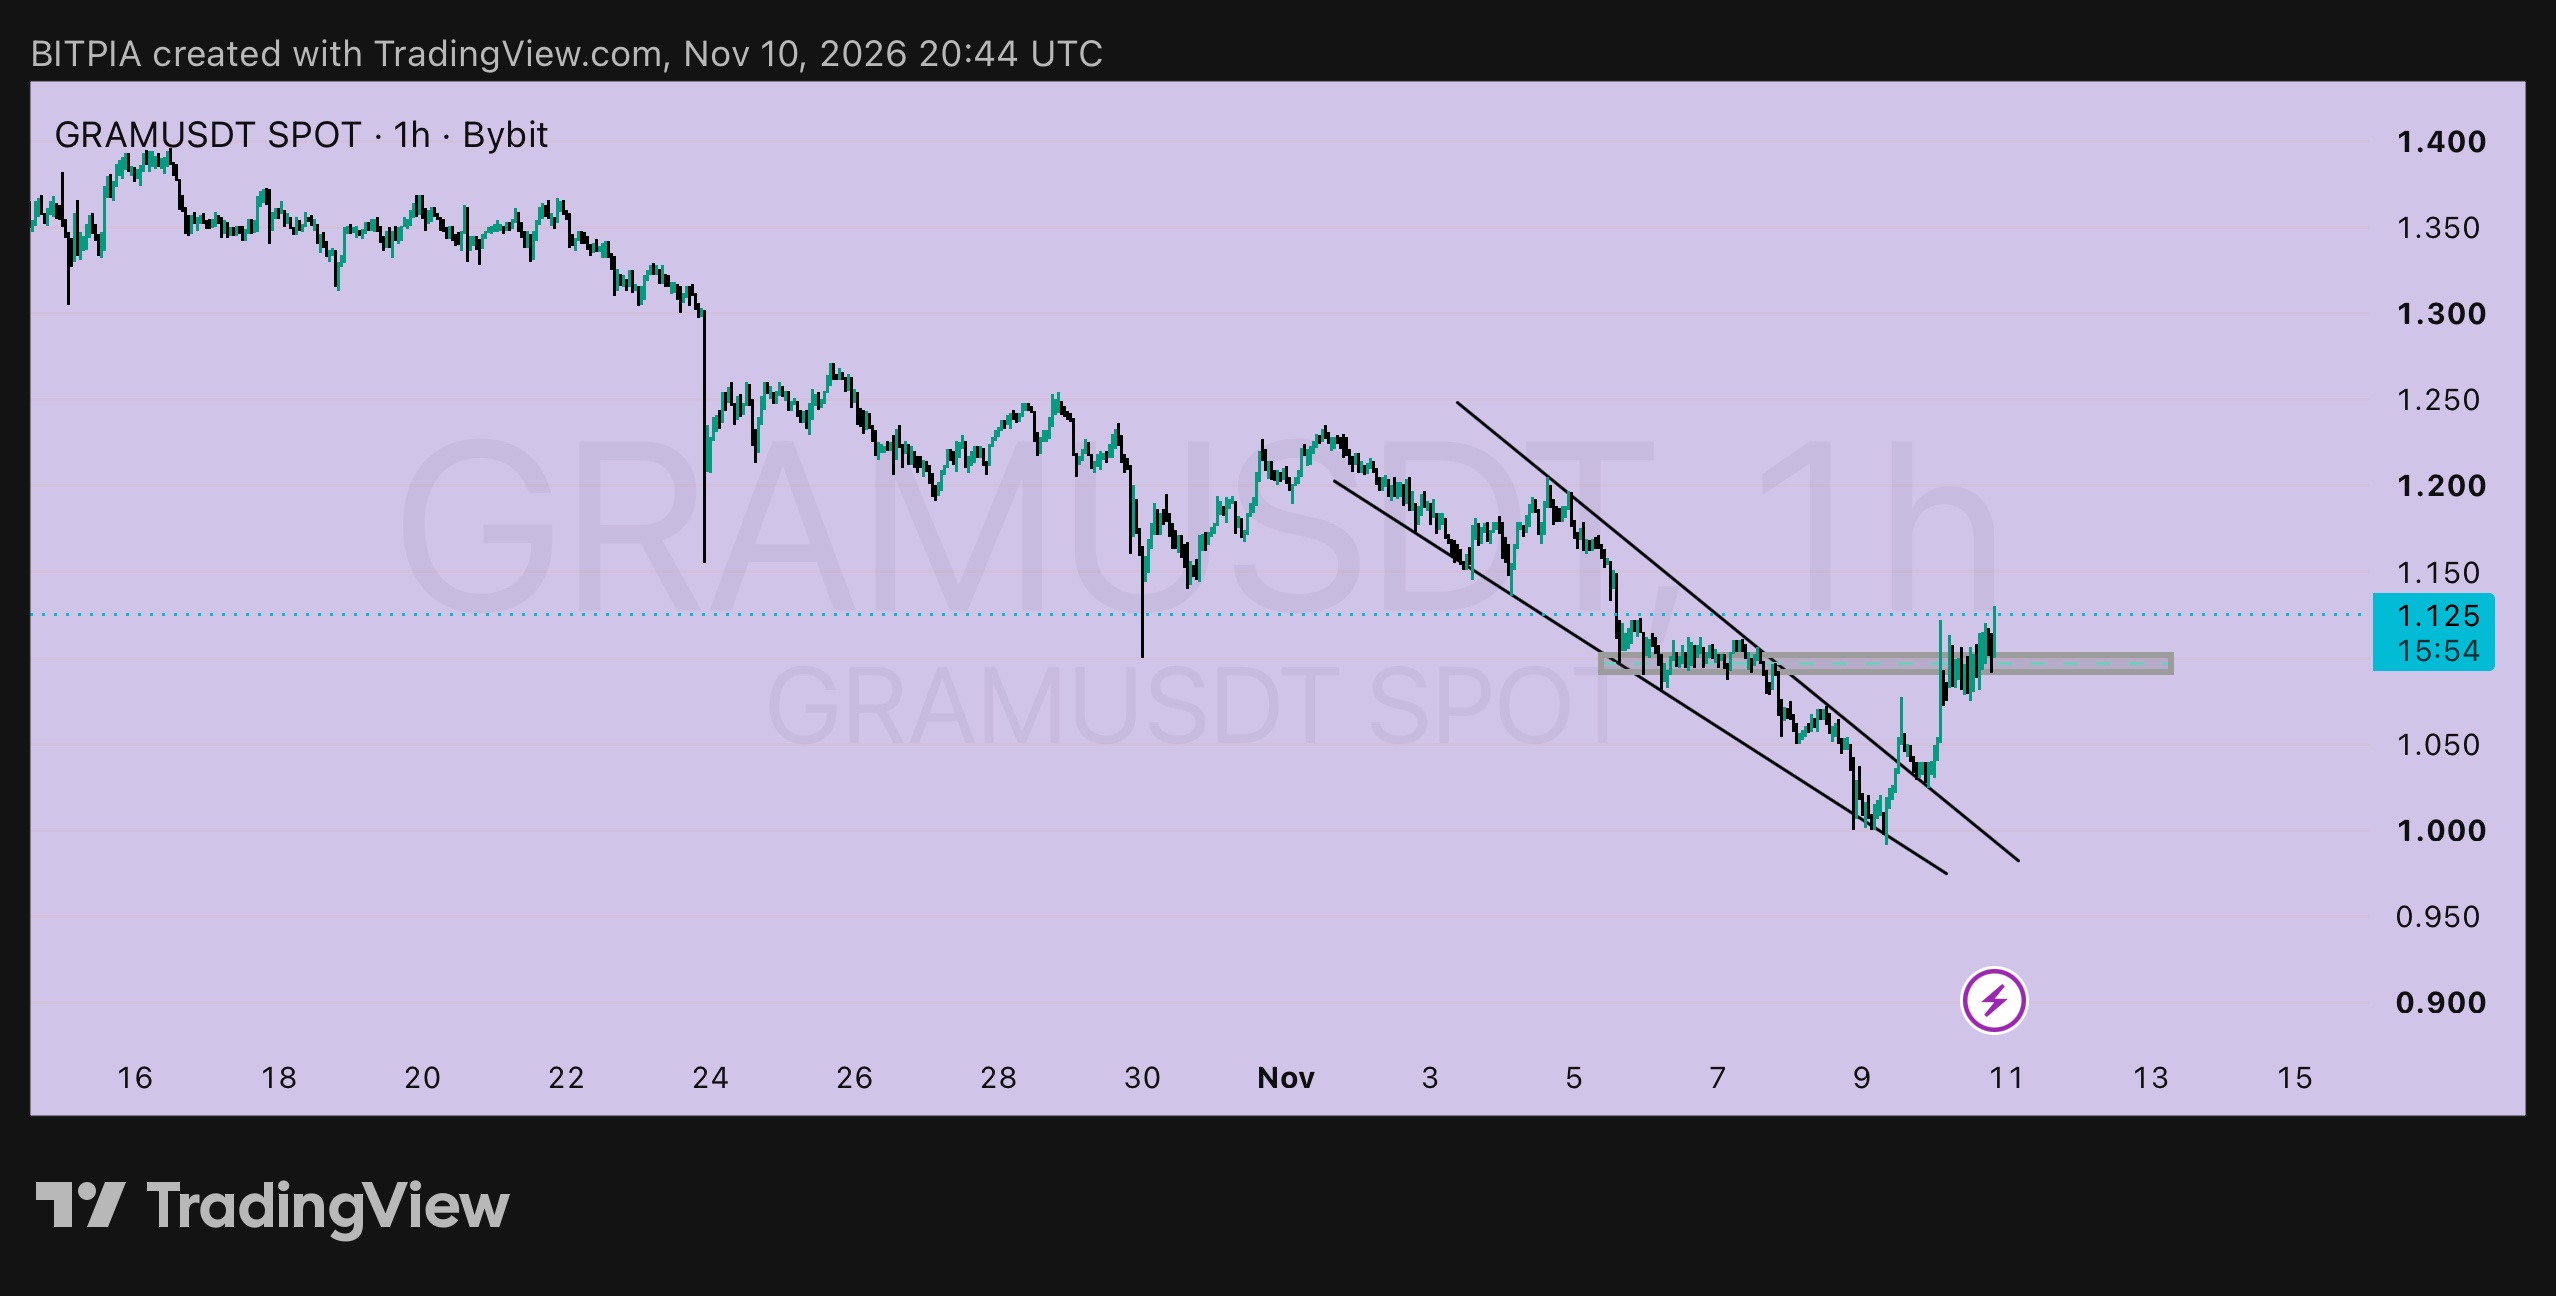
$GRAMUSDT 1j: di mana posisi kita dalam siklus breakout? Breakout biasanya melalui tiga tahap: break (penembusan), retest (pengujian ulang), dan continuation (kelanjutan). Inilah posisi GRAM saat ini, dengan harga di 1,129. ➤ Tahap 1: break ✅ selesai ▸ Harga keluar dari falling channel pada 9 Nov setelah titik terendah di dekat 0,99 ▸ Break-nya bersih, dengan candle kuat menembus garis atas ➤ Tahap 2: retest ✅ hampir selesai ▸ Harga berhasil reclaim zona 1,095 hingga 1,105, yang sebelumnya menjadi support sebelum penurunan terakhir ▸ Harga bertahan di zona tersebut sejauh ini, yang merupakan hal yang ingin saya lihat ➤ Tahap 3: continuation ⏳ belum ▸ Penutupan candle 1 jam di atas 1,150 akan menjadi konfirmasi pertama ▸ Setelah itu, target berikutnya adalah 1,210 (tertinggi 3-4 Nov), lalu 1,250 (area akhir Oktober) ➤ Rencana saya ▸ Entry: di sekitar 1,105, saat koreksi ke zona yang bertahan ▸ Stop-loss: di bawah 1,055, di bawah garis channel yang ditembus ▸ Risiko per unit: 0,050 ▸ Target 1: 1,150, +0,045, sekitar 0,9R ▸ Target 2: 1,210, +0,105, sekitar 2,1R ▸ Target 3: 1,250, +0,145, sekitar 2,9R ➤ Perhitungan chase Di harga 1,129 dengan stop yang sama, risikonya adalah 0,074. Ke 1,210 itu sekitar 1,1R, dan ke 1,250 sekitar 1,6R. Tidak buruk, tidak luar biasa. Membeli saat koreksi (dip) lebih baik, tapi tidak ada jaminan harga akan kembali ke sana. ➤ Apa yang membatalkan skenario ini Penutupan candle 1 jam di bawah 1,055 berarti retest gagal dan harga kembali ke dalam channel lama, dan saya akan menepi (tidak ambil posisi). Tren yang lebih besar masih menurun dari 1,40 awal bulan ini, jadi gunakan size kecil, dan jaga leverage tetap rendah jika Anda menggunakan perps. Bukan nasihat keuangan. Lakukan riset Anda sendiri dan hanya risikokan apa yang Anda sanggup untuk kehilangan. #ByXIMPACT #WSOT2026
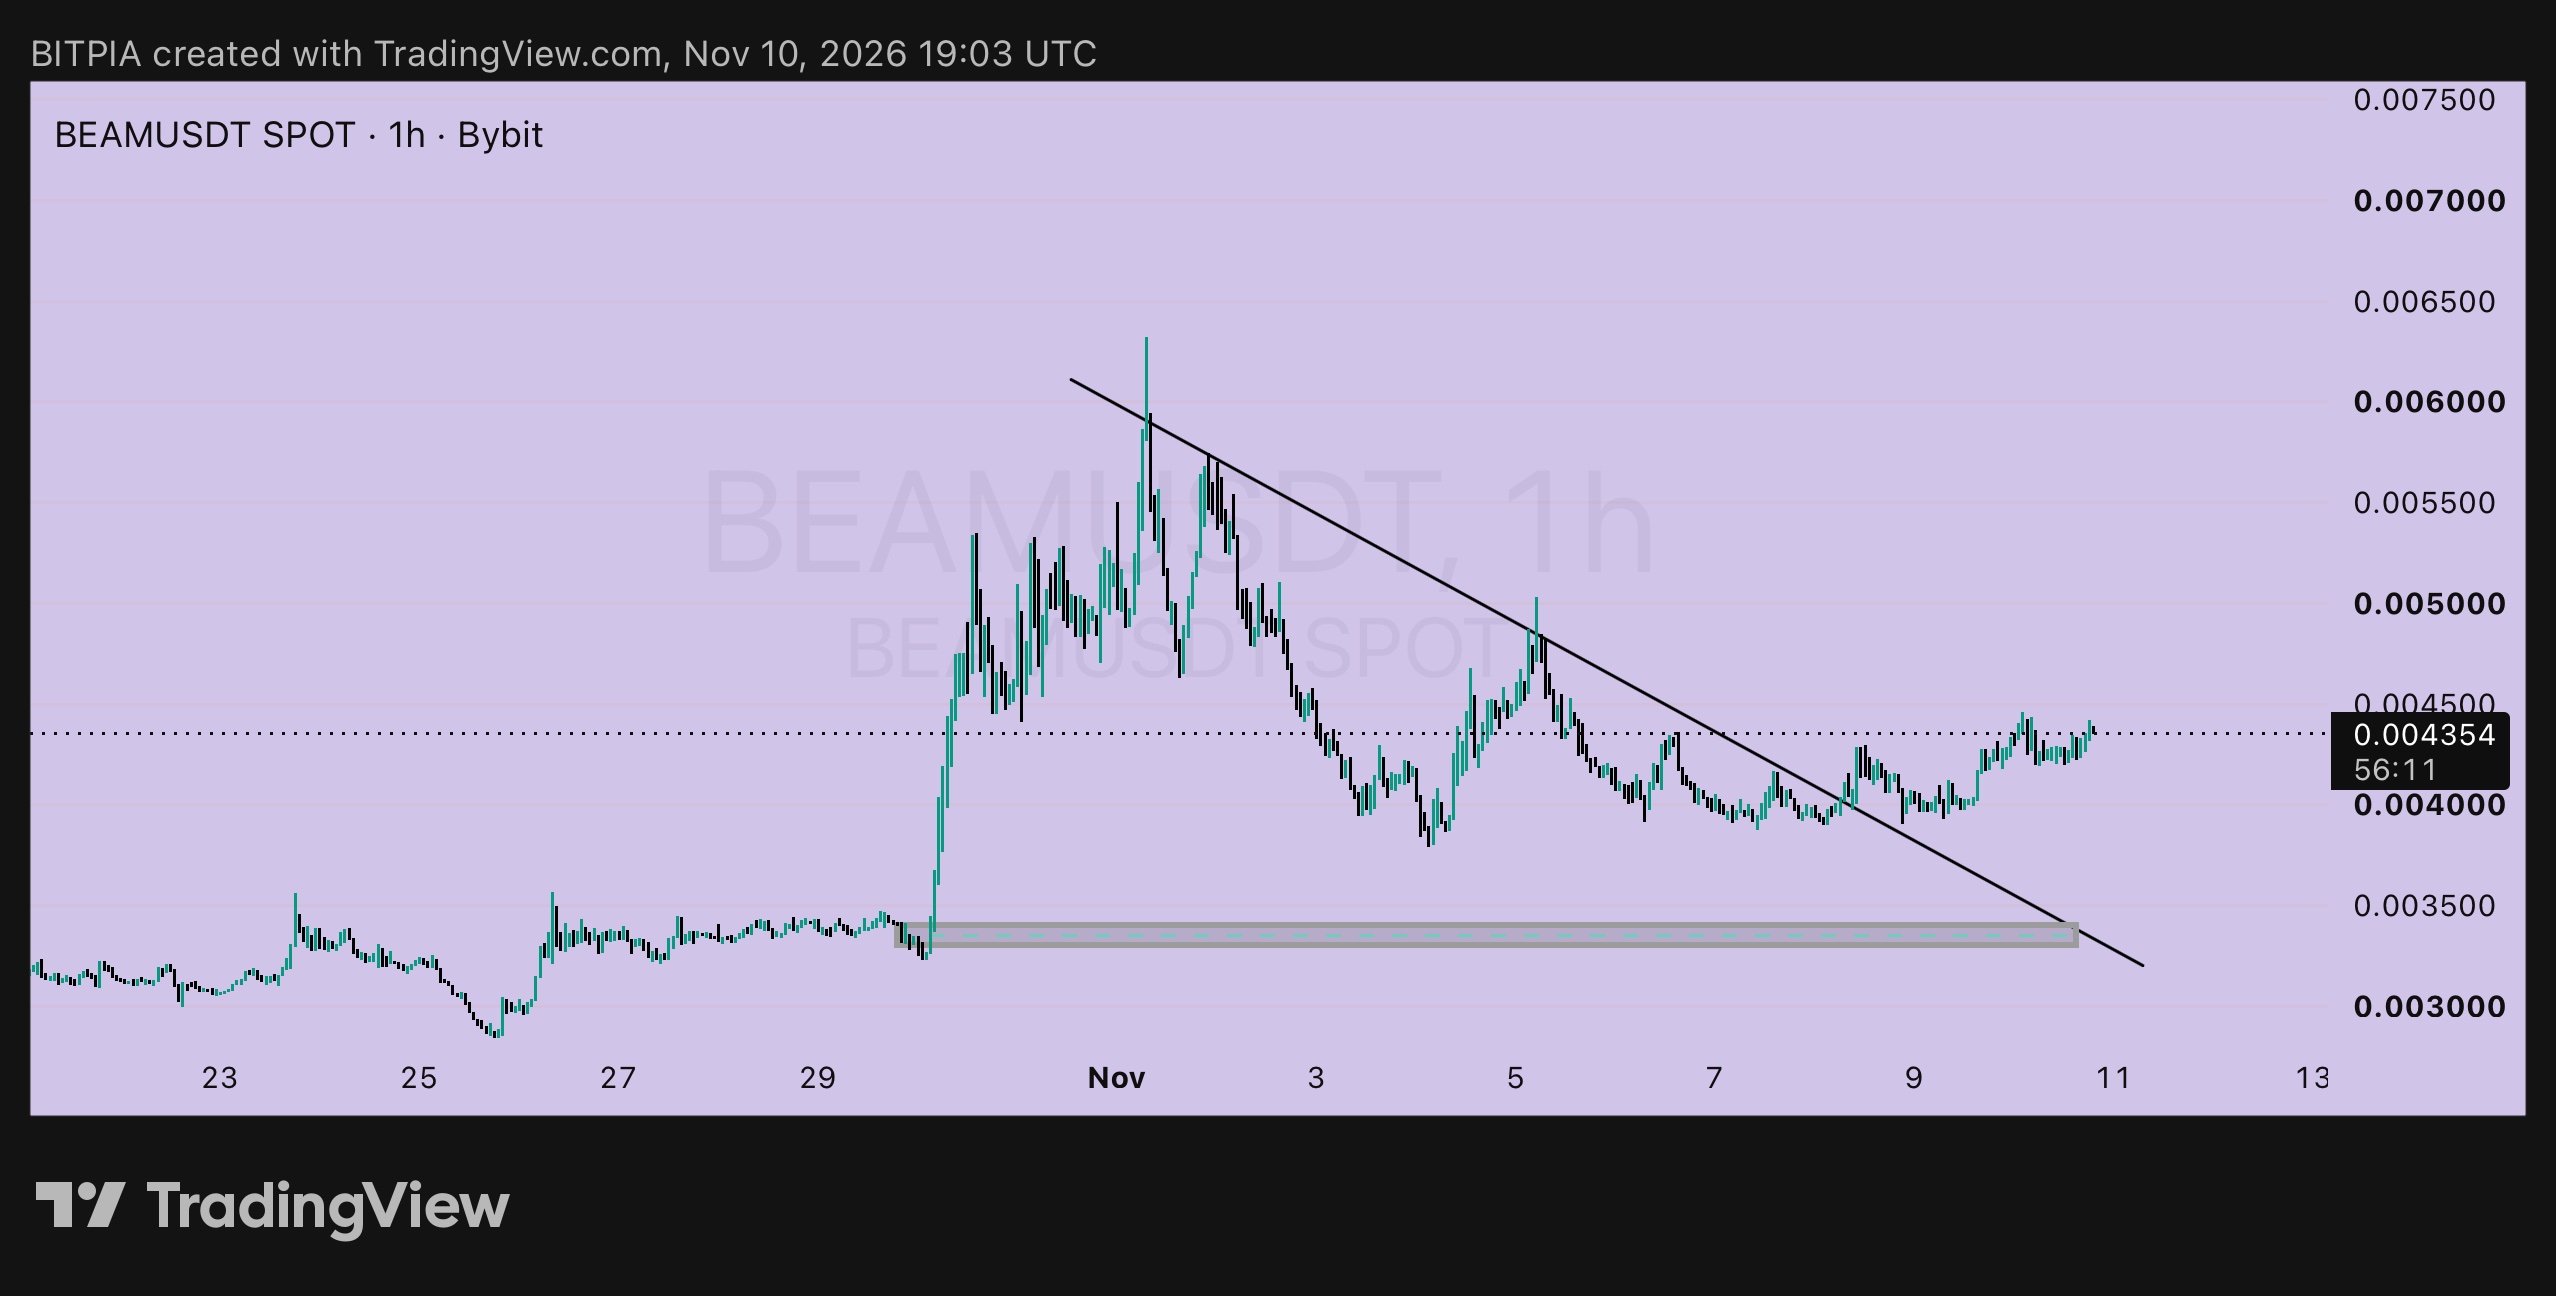
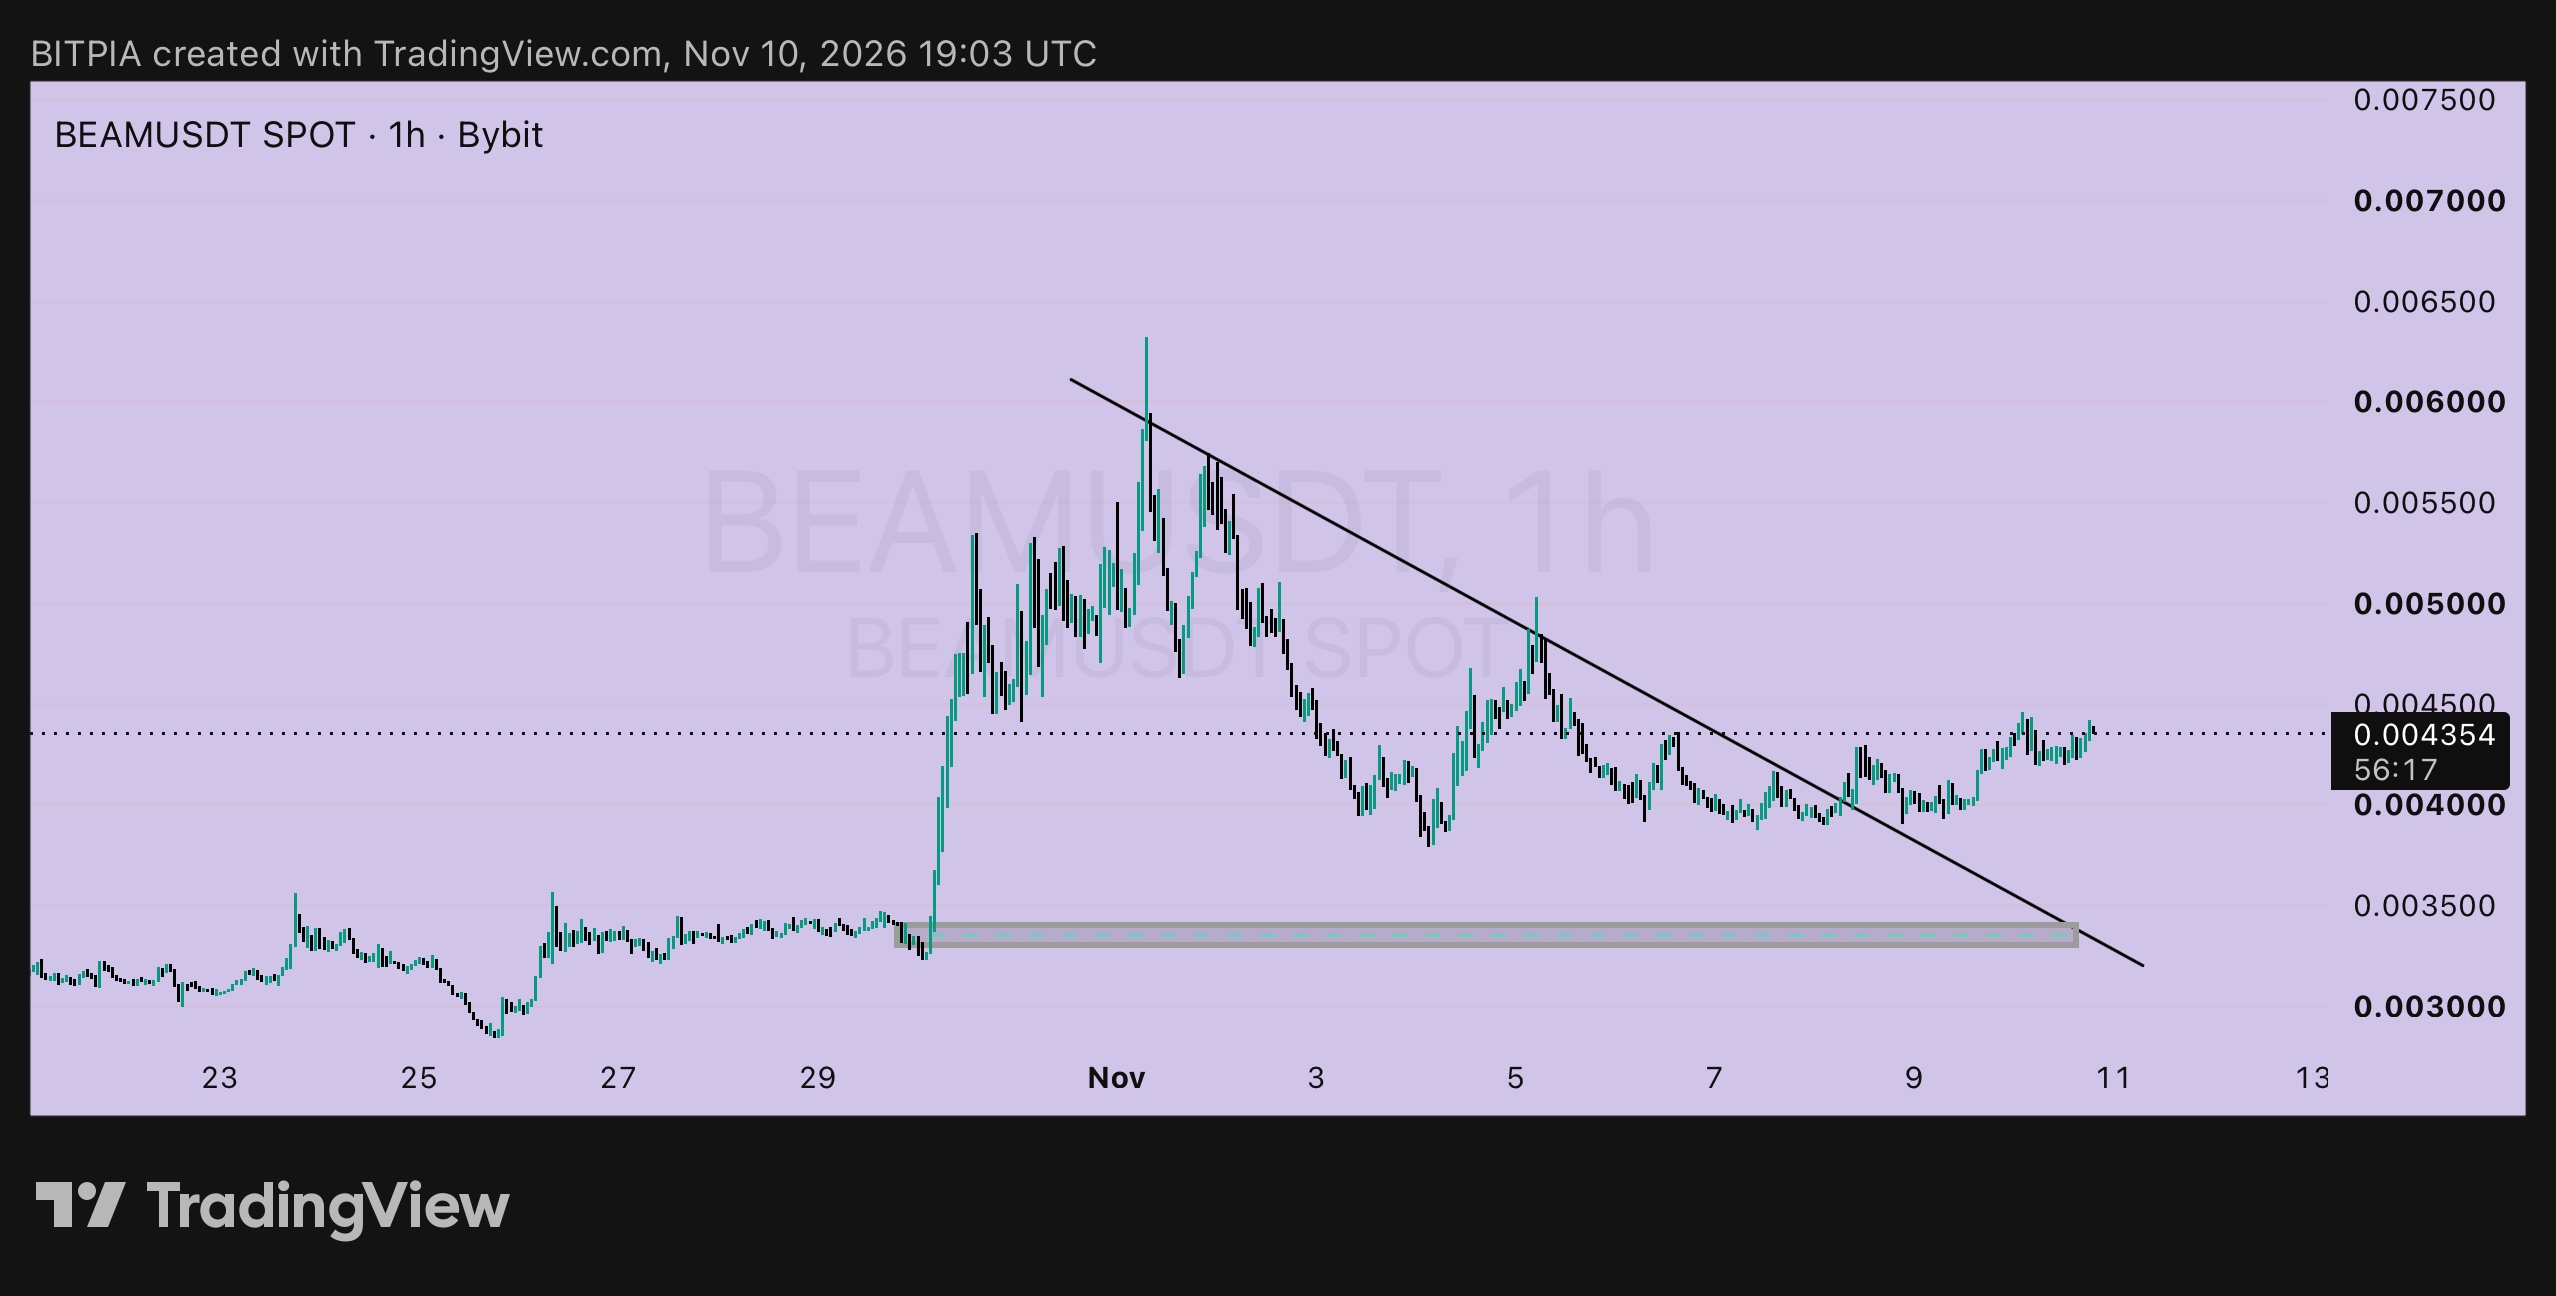
$BEAMUSDT 1h: the news ticker 📰 ➤ Breaking: the trendline is broken ▸ Price cleared the falling line from the Nov 1 high on Nov 8 and has stayed above it for two days ▸ It's at 0.004354 now, up from 0.004041 when I posted on Nov 7 ➤ Plan check: Plan A, the breakout entry at 0.00425 ▸ Status: triggered, with price closing above the line ▸ Stop-loss was 0.00385, risk 0.00040 ▸ Now about +0.0001, roughly 0.25R in profit. Not much yet, but the break held ➤ Plan check: Plan B, the early entry at 0.00395 ▸ Status: the Nov 9 low reached about 0.0039, so it likely filled ▸ Stop-loss was 0.00370, risk 0.00025 ▸ Now about +0.0004, roughly 1.6R in profit ➤ Developing: what I'd do next ▸ For open trades, raise the stop to just under 0.00385, below the Nov 9 low and the broken line ▸ Target 1: 0.00500, the area where price was rejected on Nov 5 ▸ Target 2: 0.00550 ▸ Target 3: 0.00600, close to the Nov 1 high area From the Plan A entry (0.00425), those are about 1.9R, 3.1R and 4.4R. ➤ If you're not in ▸ Entry: a dip toward 0.00415, if the old line holds as support ▸ Stop-loss: below 0.00385 ▸ Risk per unit: 0.00030 ▸ Targets: 0.00500 (+0.00085, about 2.8R) and 0.00550 (+0.00135, about 4.5R) ➤ Weather report The base zone near 0.0033 to 0.0034 is far below, so there's plenty of room between price and the launch base if things reverse. ➤ What cancels it A 1h close under 0.00385 means the break has failed, and I'd step aside. Small size, and low leverage if you use perps. Not financial advice. Do your own research and only risk what you can afford to lose. #ByXIMPACT #WSOT2026
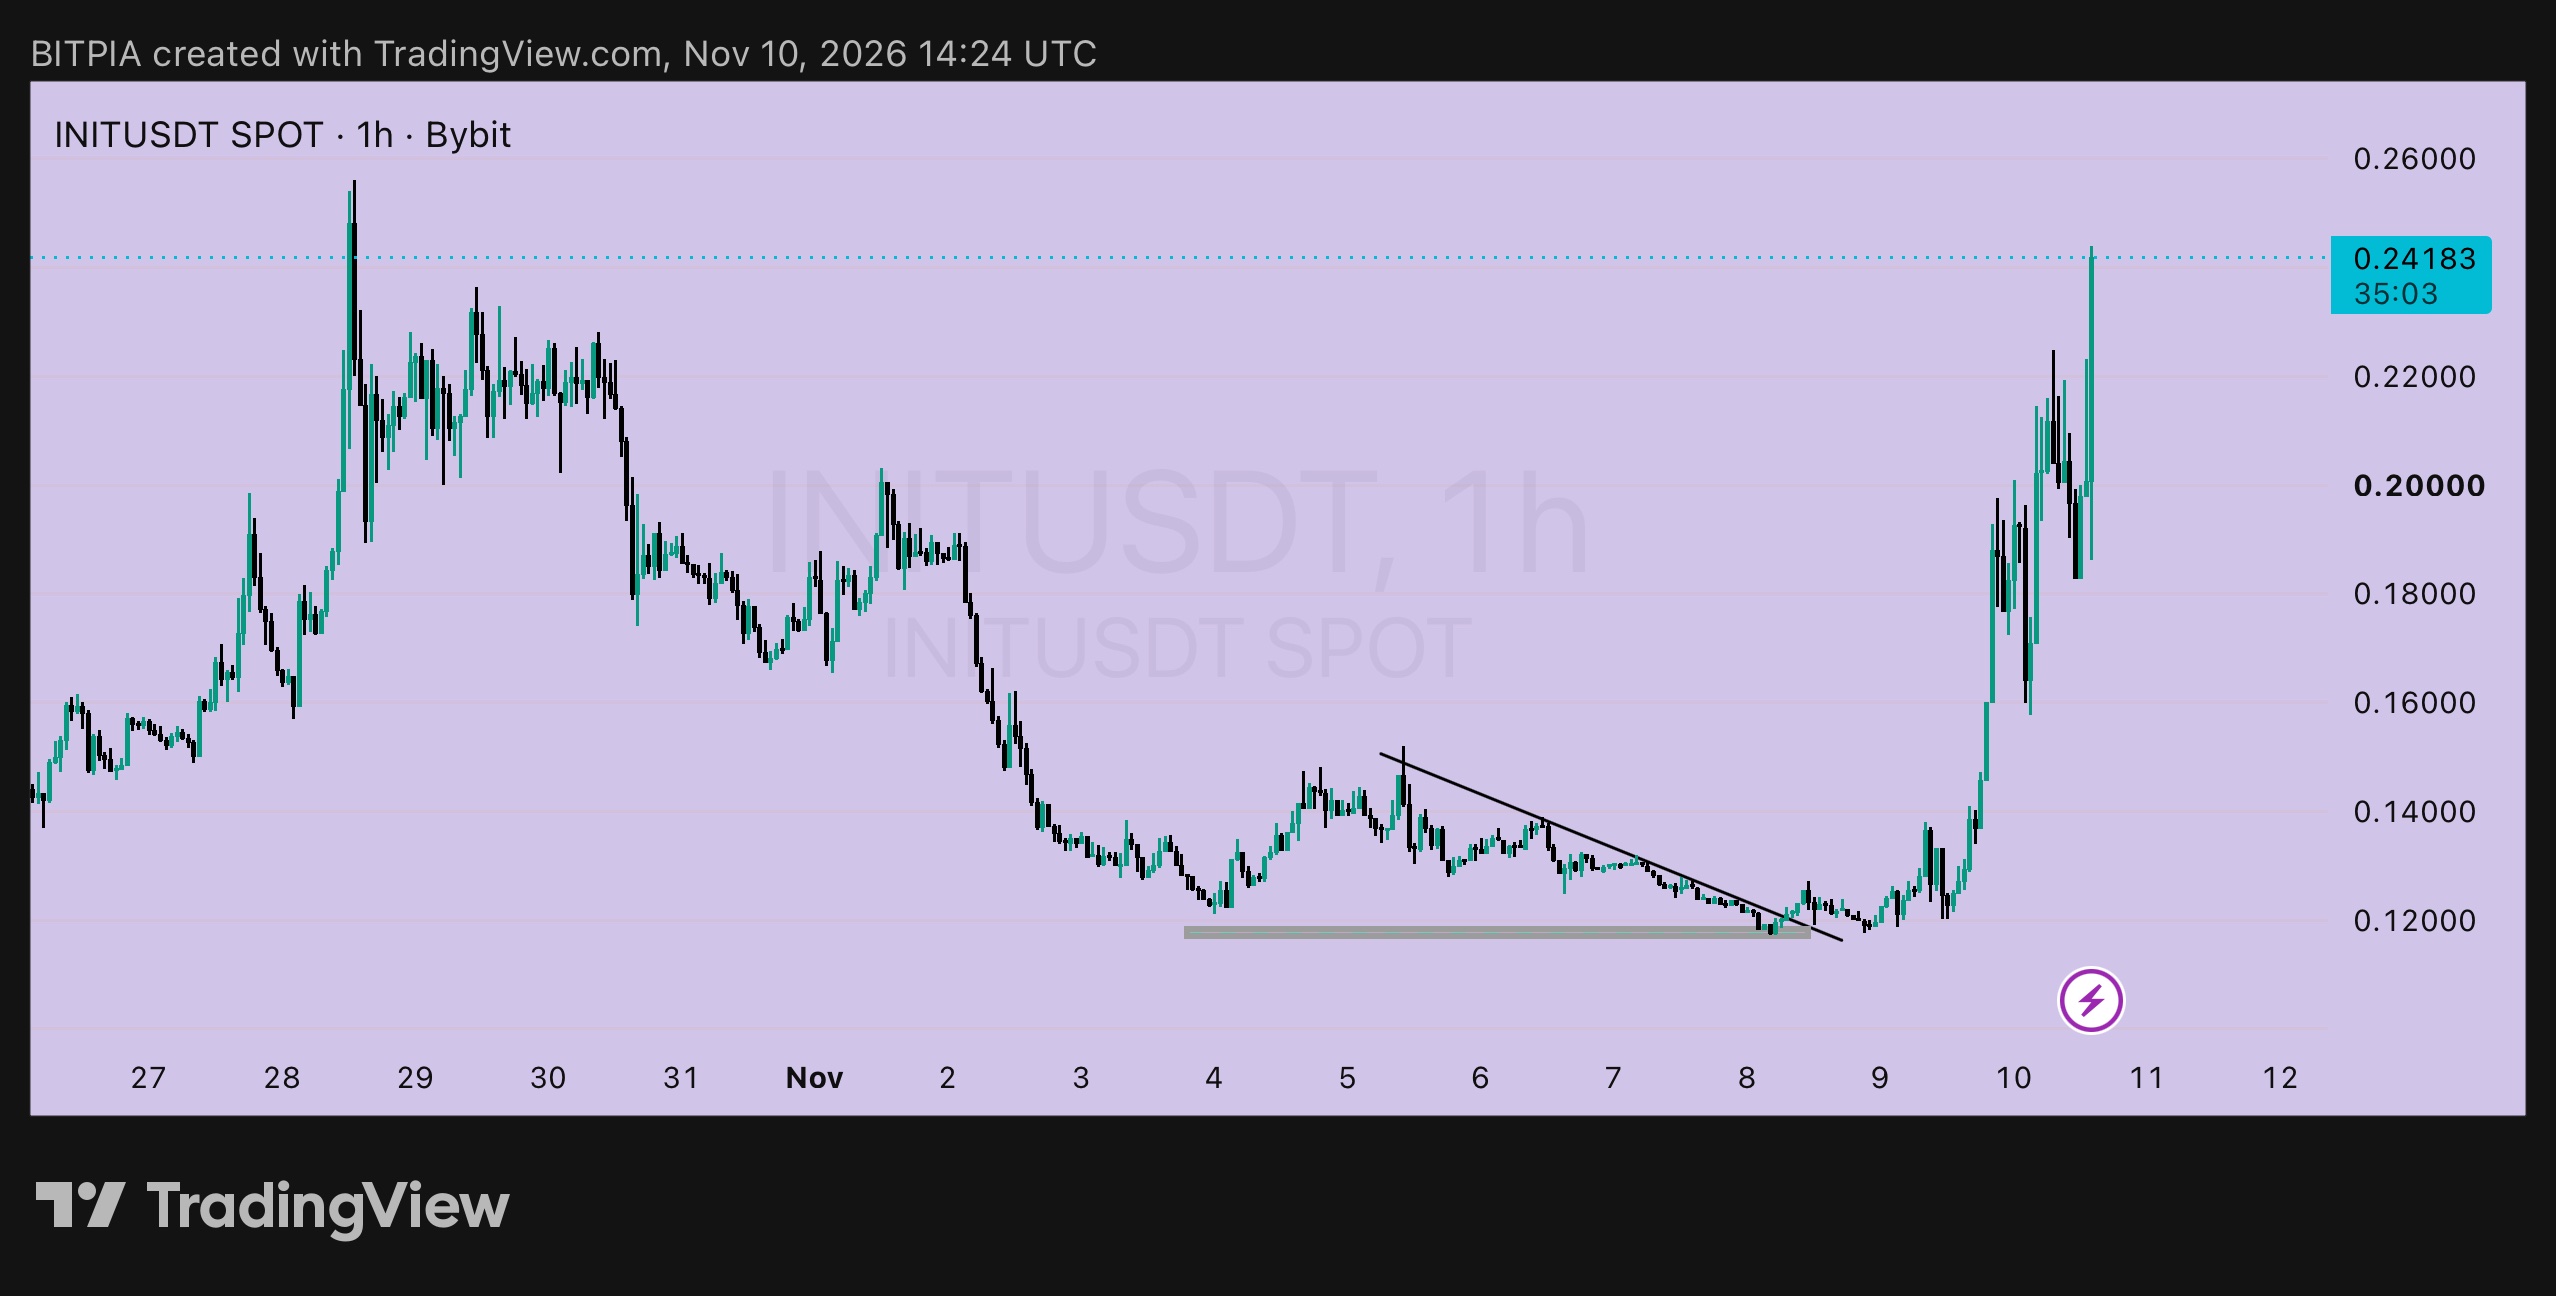
INIT 1j: ambil profitmu 💰 $INITUSDT berada di 0,24183. Dua hari lalu saya mempostingnya di 0,12304 dan mengatakan Pintu 2, retest di dekat 0,1200 dengan stop di bawah 0,1150, adalah pilihan saya. Kemarin saya memindahkan stop ke 0,1200. Harga hampir naik dua kali lipat sejak saat itu, dan inilah saatnya melihat hitungannya. ➤ Angka-angkanya ▸ Entri Pintu 2: 0,1200, risiko 0,0050 ▸ Sekarang: sekitar +0,1218 per unit, kira-kira 24R ▸ Pintu 1 (0,1230, risiko 0,0080) juga sudah jauh di depan, sekitar 14R ▸ Kedua target yang saya posting (0,1390 dan 0,1520) sudah terlewati sejak lama Keuntungan seperti ini adalah alasan untuk memiliki rencana sebelum hal itu terjadi. ➤ Cara saya mengambil profit ▸ Ambil sekitar setengahnya di dekat area 0,2400 hingga 0,2500, dekat dengan level tertinggi 28 Oktober di 0,2550, di mana penjual muncul sebelumnya ▸ Geser stop pada sisanya ke atas hingga sekitar 0,1800, di bawah level terendah pullback pagi ini ▸ Setelah 0,2550 tidak ada level lama di grafik ini untuk dijadikan target, jadi saya biarkan trailing stop yang bekerja ➤ Mengapa saya tidak menambah posisi ▸ Candle sangat besar. Harga berayun dari sekitar 0,158 ke 0,225 dan kembali ke 0,183 dalam hitungan jam ▸ Di 0,2418 dengan stop di 0,1780, risiko adalah 0,0638, dan 0,2550 hanya berjarak sekitar 0,2R. Itu bukan trading, itu harapan ➤ Jika Anda belum masuk ▸ Saya akan menunggu pullback menuju 0,2050 dan bertahan di atas 0,2000 ▸ Stop-loss: di bawah 0,1780 ▸ Risiko per unit: 0,0270 ▸ Target: 0,2550, +0,0500, sekitar 1,9R ▸ Jika tidak pernah kembali, tidak apa-apa. Pergerakan ini sudah selesai ➤ Apa yang membatalkannya Penutupan 1j di bawah 0,1800 berarti pergerakan telah mendingin. Untuk trading yang terbuka, trailing stop melakukan tugasnya. Setelah pergerakan sebesar ini, gunakan ukuran kecil, dan leverage rendah jika Anda menggunakan perp. Bukan nasihat keuangan. Lakukan riset Anda sendiri dan hanya risikokan apa yang Anda mampu untuk kehilangan. #ByXIMPACT #WSOT2026
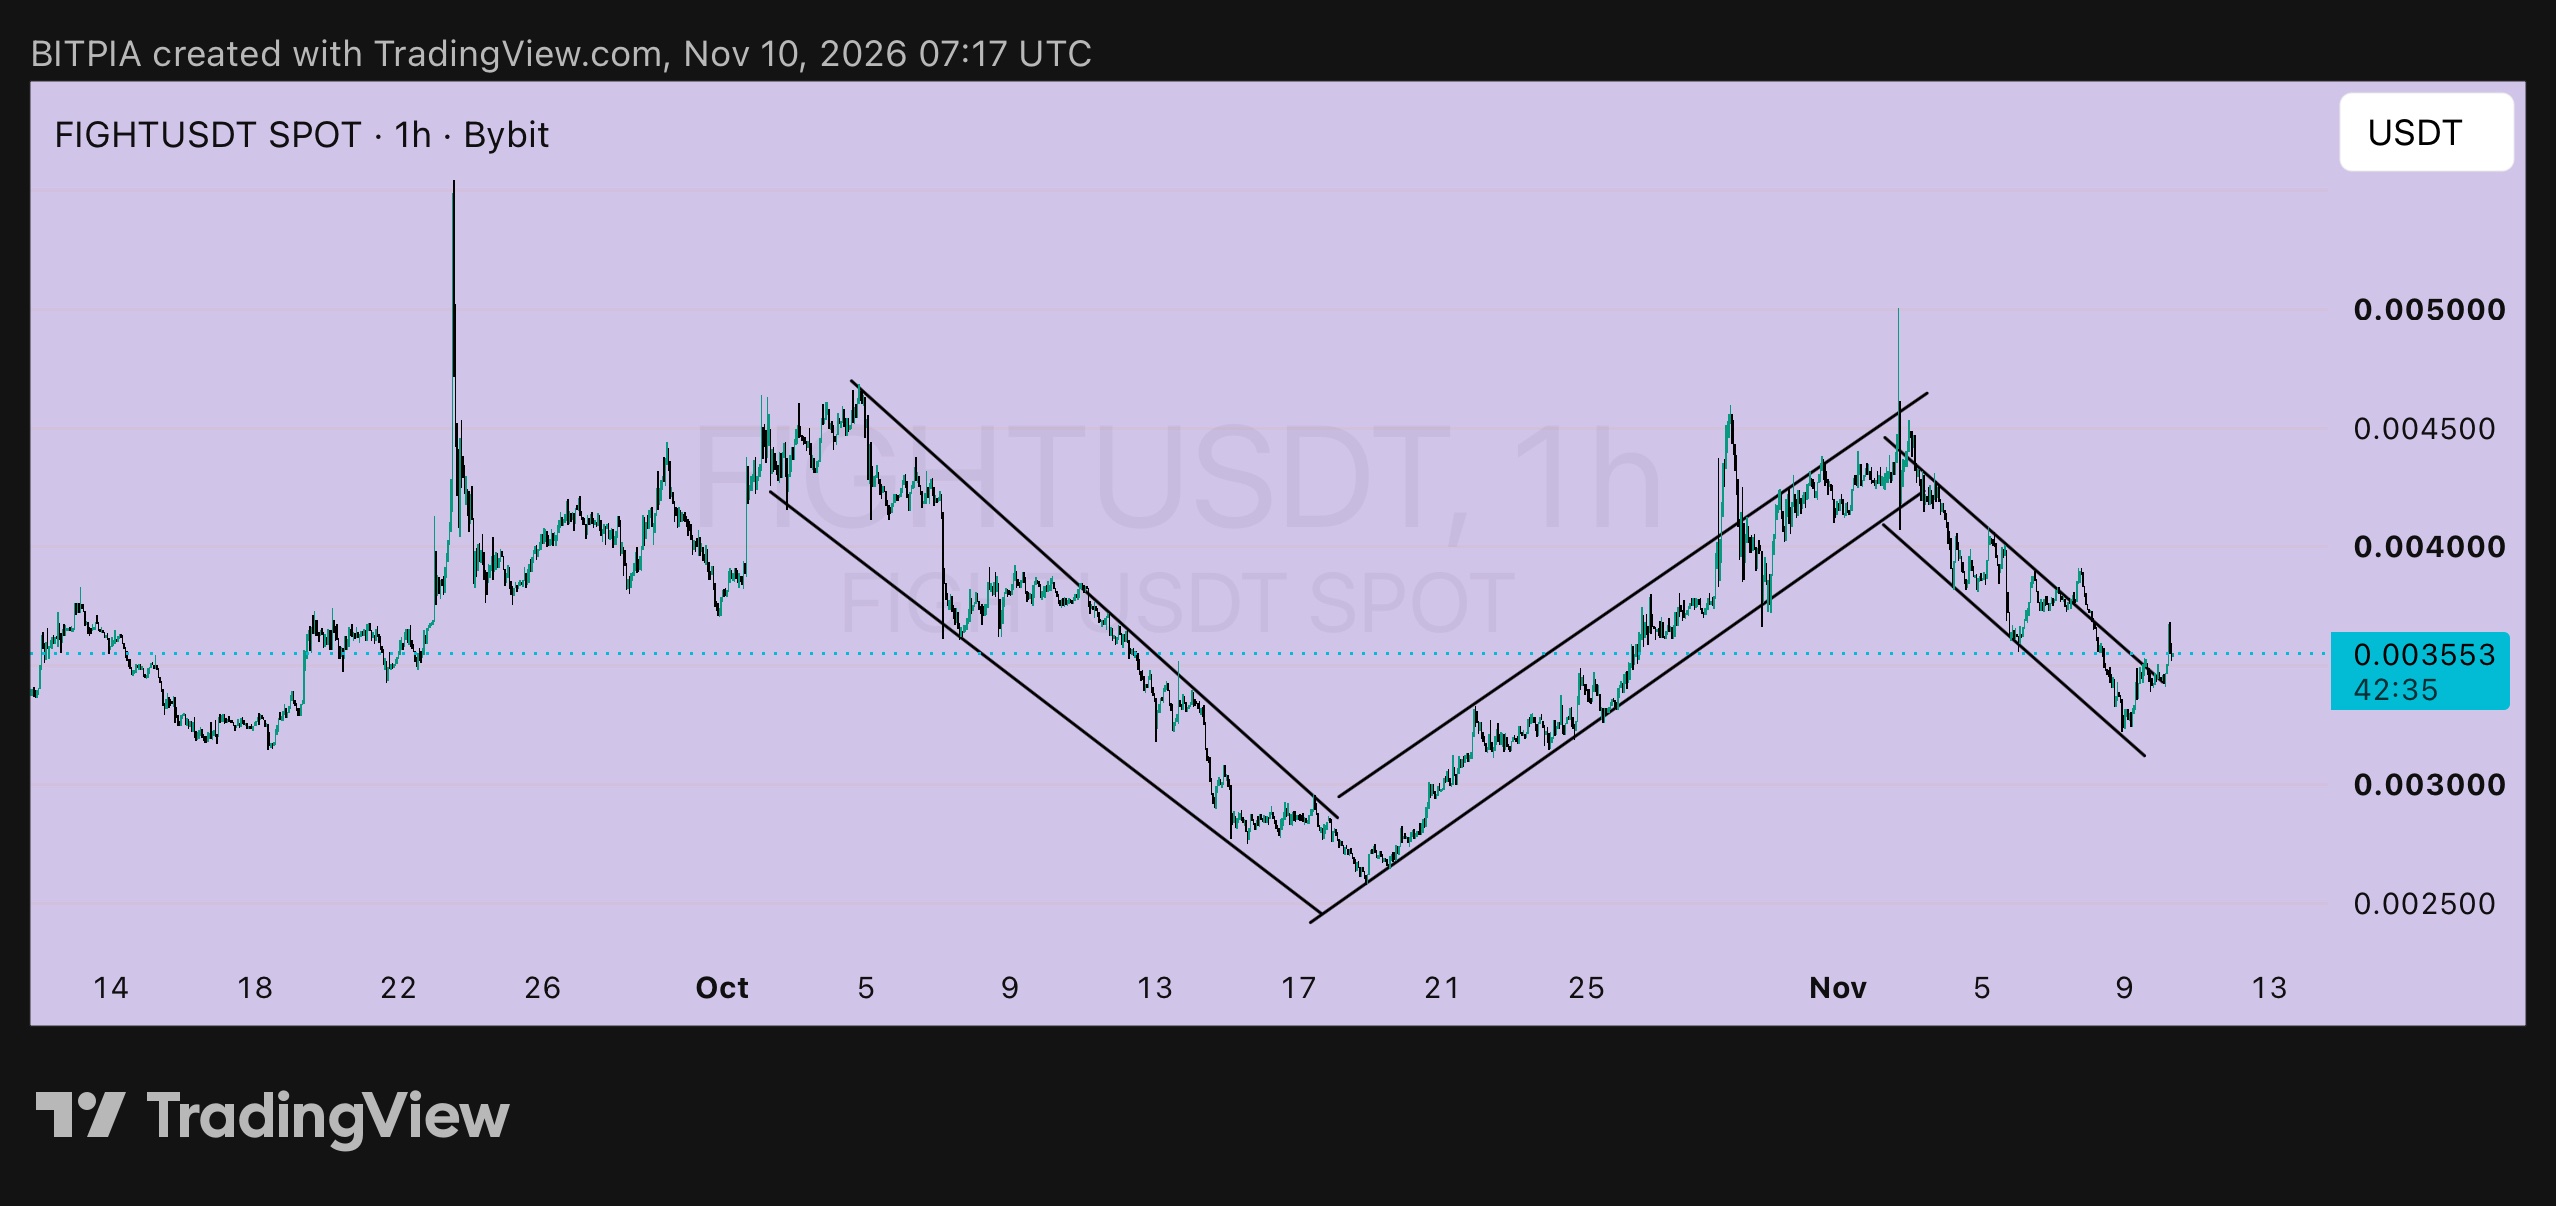
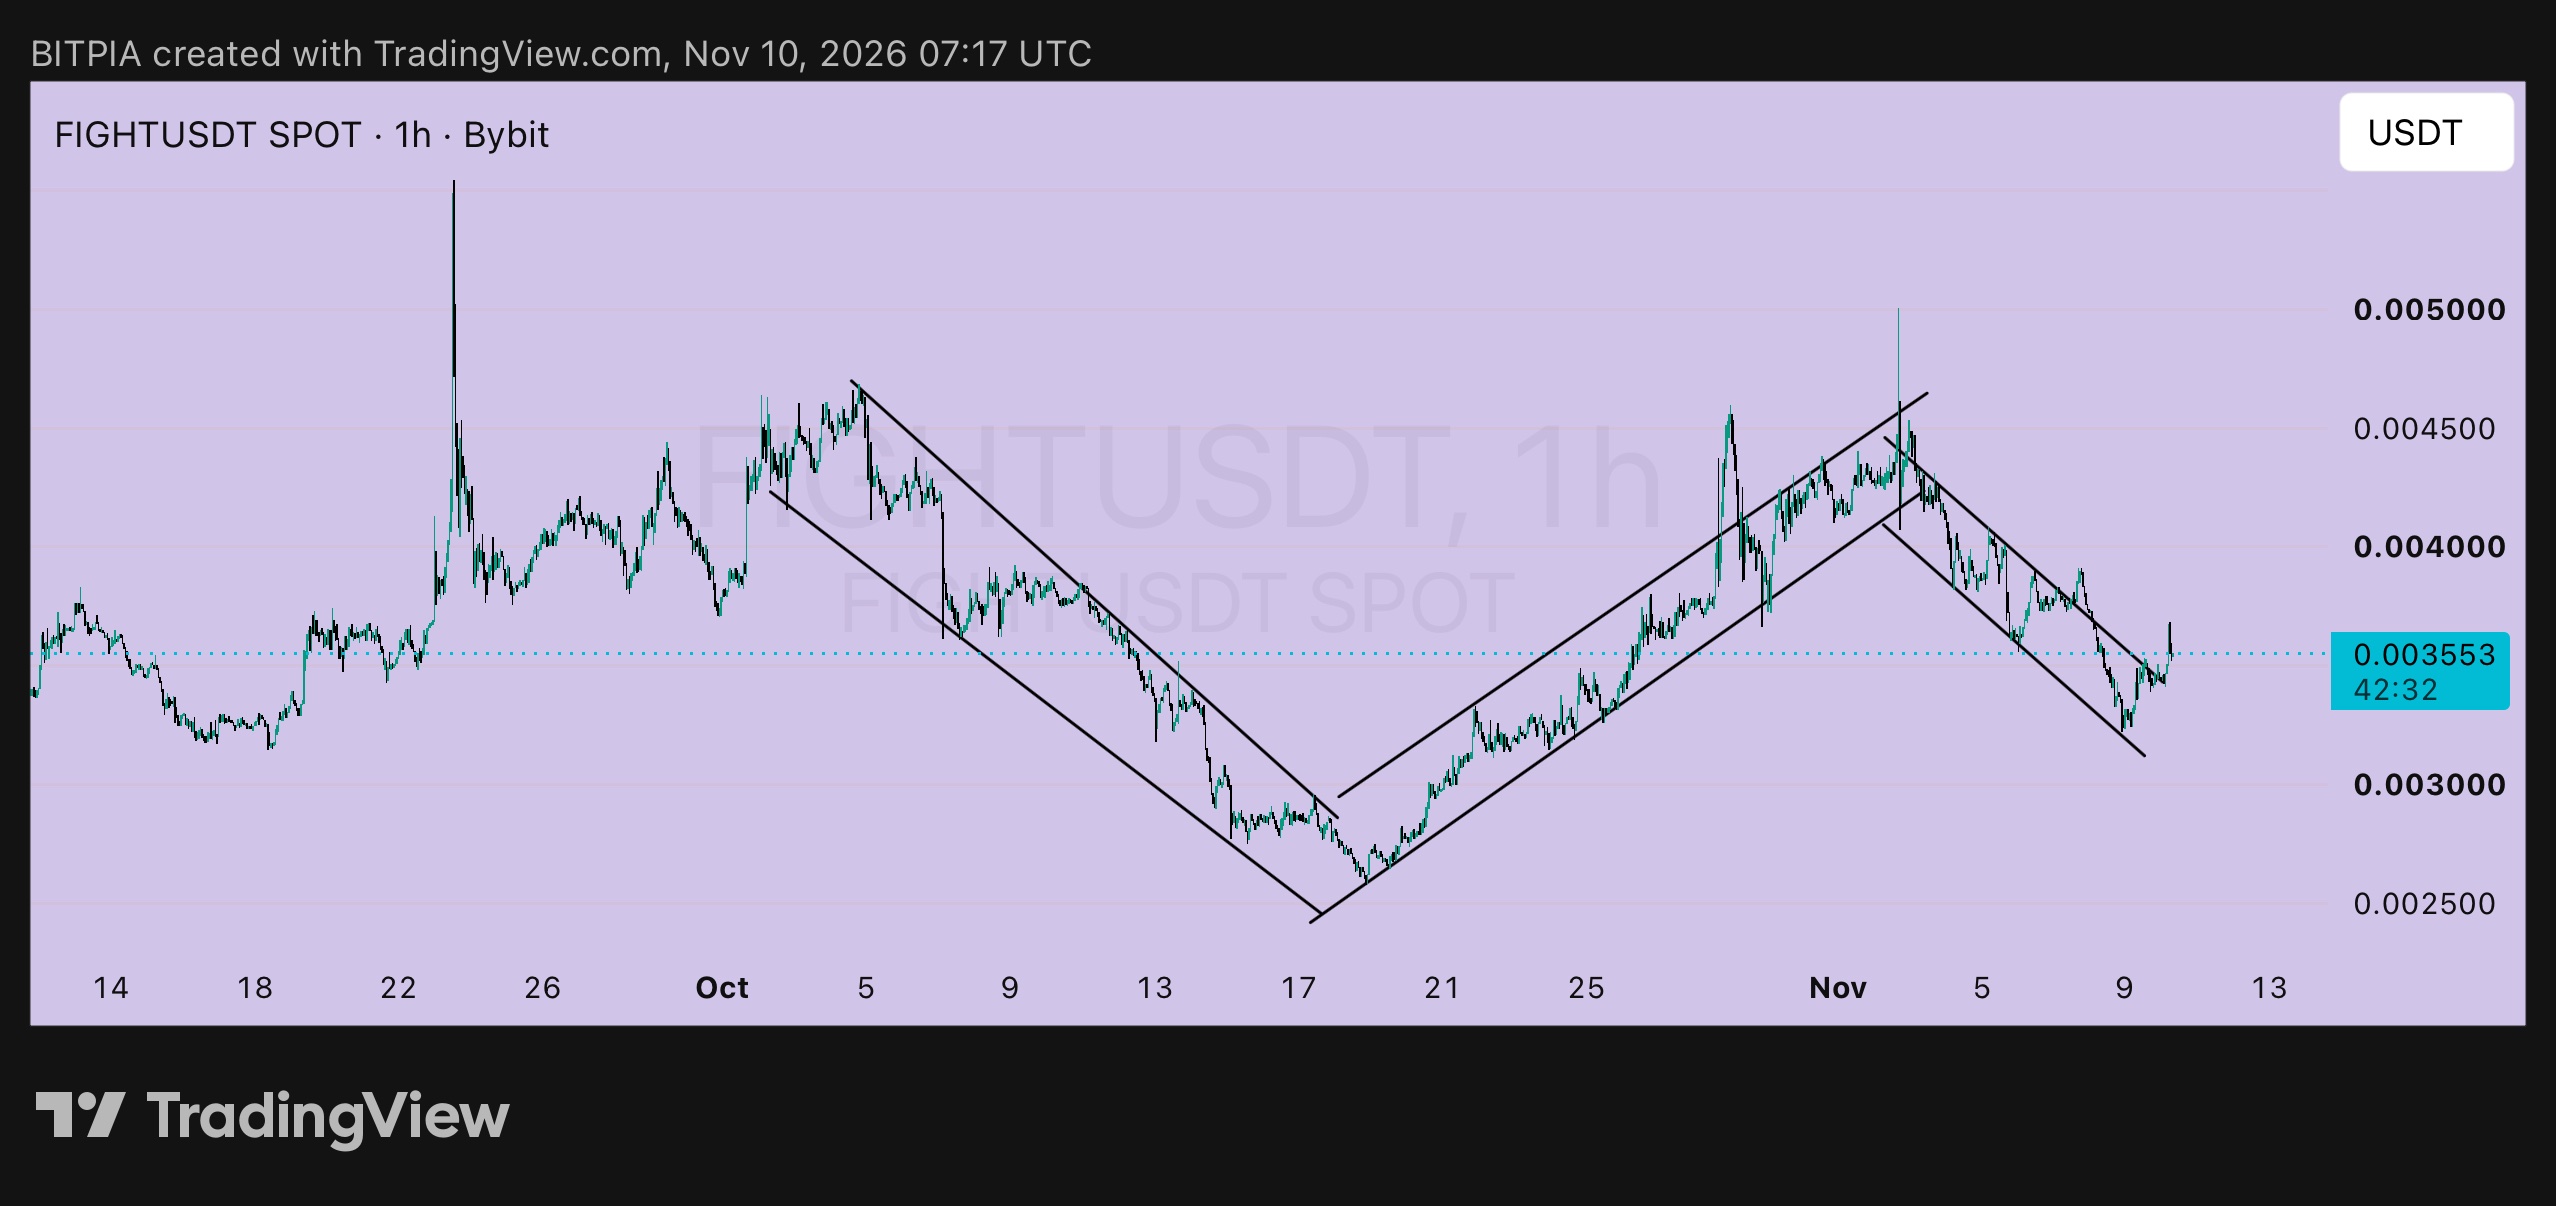
$FIGHT 1h: the zigzag 〰️ Since October, $FIGHTUSDT has been moving in clean legs, and this is the picture I like to keep in mind. ➤ The legs so far ▸ Oct 5 to 18: a falling channel down to about 0.0026 ▸ Oct 18 to Nov 2: a rising channel up to about 0.0046 to 0.0050 ▸ Nov 2 to 9: another falling channel, down to a low near 0.00322 ▸ Now: price is at 0.003553, and it has just moved above the top line of that last falling channel If the pattern repeats, a new leg up may be starting. I'm not counting on it, because legs can fail and the 0.00375 floor from last week has turned into resistance. ➤ Where I stand on my Nov 9 plan ▸ Trigger: a 1h close above 0.00358 ▸ Status: not confirmed yet. Price touched about 0.00367 this morning, then eased back ▸ Nothing has been triggered, so nothing lost ➤ Plan A: wait for the close ▸ Entry: around 0.00360 ▸ Stop-loss: below 0.00330 ▸ Risk per unit: 0.00030 ▸ Target 1: 0.00385, +0.00025, about 0.8R ▸ Target 2: 0.00420, +0.00060, about 2R ▸ Target 3: 0.00455, +0.00095, about 3.2R ➤ Plan B: a retest ▸ Entry: around 0.00345, if price returns to the broken channel line and holds ▸ Stop-loss: below 0.00322, under the last low ▸ Risk per unit: 0.00023 ▸ Targets: 0.00385 (+0.00040, about 1.7R) and 0.00420 (+0.00075, about 3.3R) Plan B has better numbers, and it only works if price gives it to me. ➤ What cancels it A 1h close under 0.00322 means the new leg has failed, and I step aside. The 0.0030 area would be the next level I'd watch. Small size, and low leverage if you use perps. Not financial advice. Do your own research and only risk what you can afford to lose. #WSOT2026
FIGHT 1h: the floor failed, and I'm saying it plainly On Nov 7 I posted $FIGHTUSDT at 0.003873 and said the 0.00375 to 0.00385 floor was the level to watch, with a stop under 0.00352. It didn't hold. Price slid to a low near 0.00322 and is now bouncing at 0.003442. ➤ What it means for the trade ▸ If you entered near 0.00385 and used the 0.00352 stop, you were stopped out for roughly a 1R loss ▸ If you added at 0.00375 with the 0.00355 stop, the loss is about the same size, a full 1R ▸ That's the job of a stop: it kept a wrong idea small. I'd rather show you this than hide it ➤ What the chart shows now ▸ Since October, FIGHT has been moving in clean swings: a falling channel, then a rising one, and now a falling one again ▸ Price is trading under the old floor, which has turned into resistance near 0.00375 ▸ The top line of the current channel sits near 0.00352 to 0.00358, and that's the first thing to clear ➤ Plan A: wait for the channel to break up ▸ Trigger: a 1h close above 0.00358 ▸ Entry: around 0.00360 ▸ Stop-loss: below 0.00330 ▸ Risk per unit: 0.00030 ▸ Targets: 0.00385 (+0.00025, about 0.8R), 0.00420 (+0.00060, about 2R), 0.00455 (+0.00095, about 3.2R) ➤ Plan B: the next real floor ▸ Entry: around 0.00305, only if buyers show up near 0.0030 ▸ Stop-loss: below 0.00285 ▸ Risk per unit: 0.00020 ▸ Targets: 0.00345 (+0.00040, about 2R) and 0.00380 (+0.00075, about 3.75R) ➤ What I'm not doing Not buying at 0.003442 in the middle of the channel. I have no close stop there and no confirmation. ➤ What cancels it Under 0.0028, I'd look at the 0.0025 to 0.0026 area from October and wait. Small size, and low leverage if you use perps. Not financial advice. Do your own research and only risk what you can afford to lose. #ByXIMPACT #WSOT2026
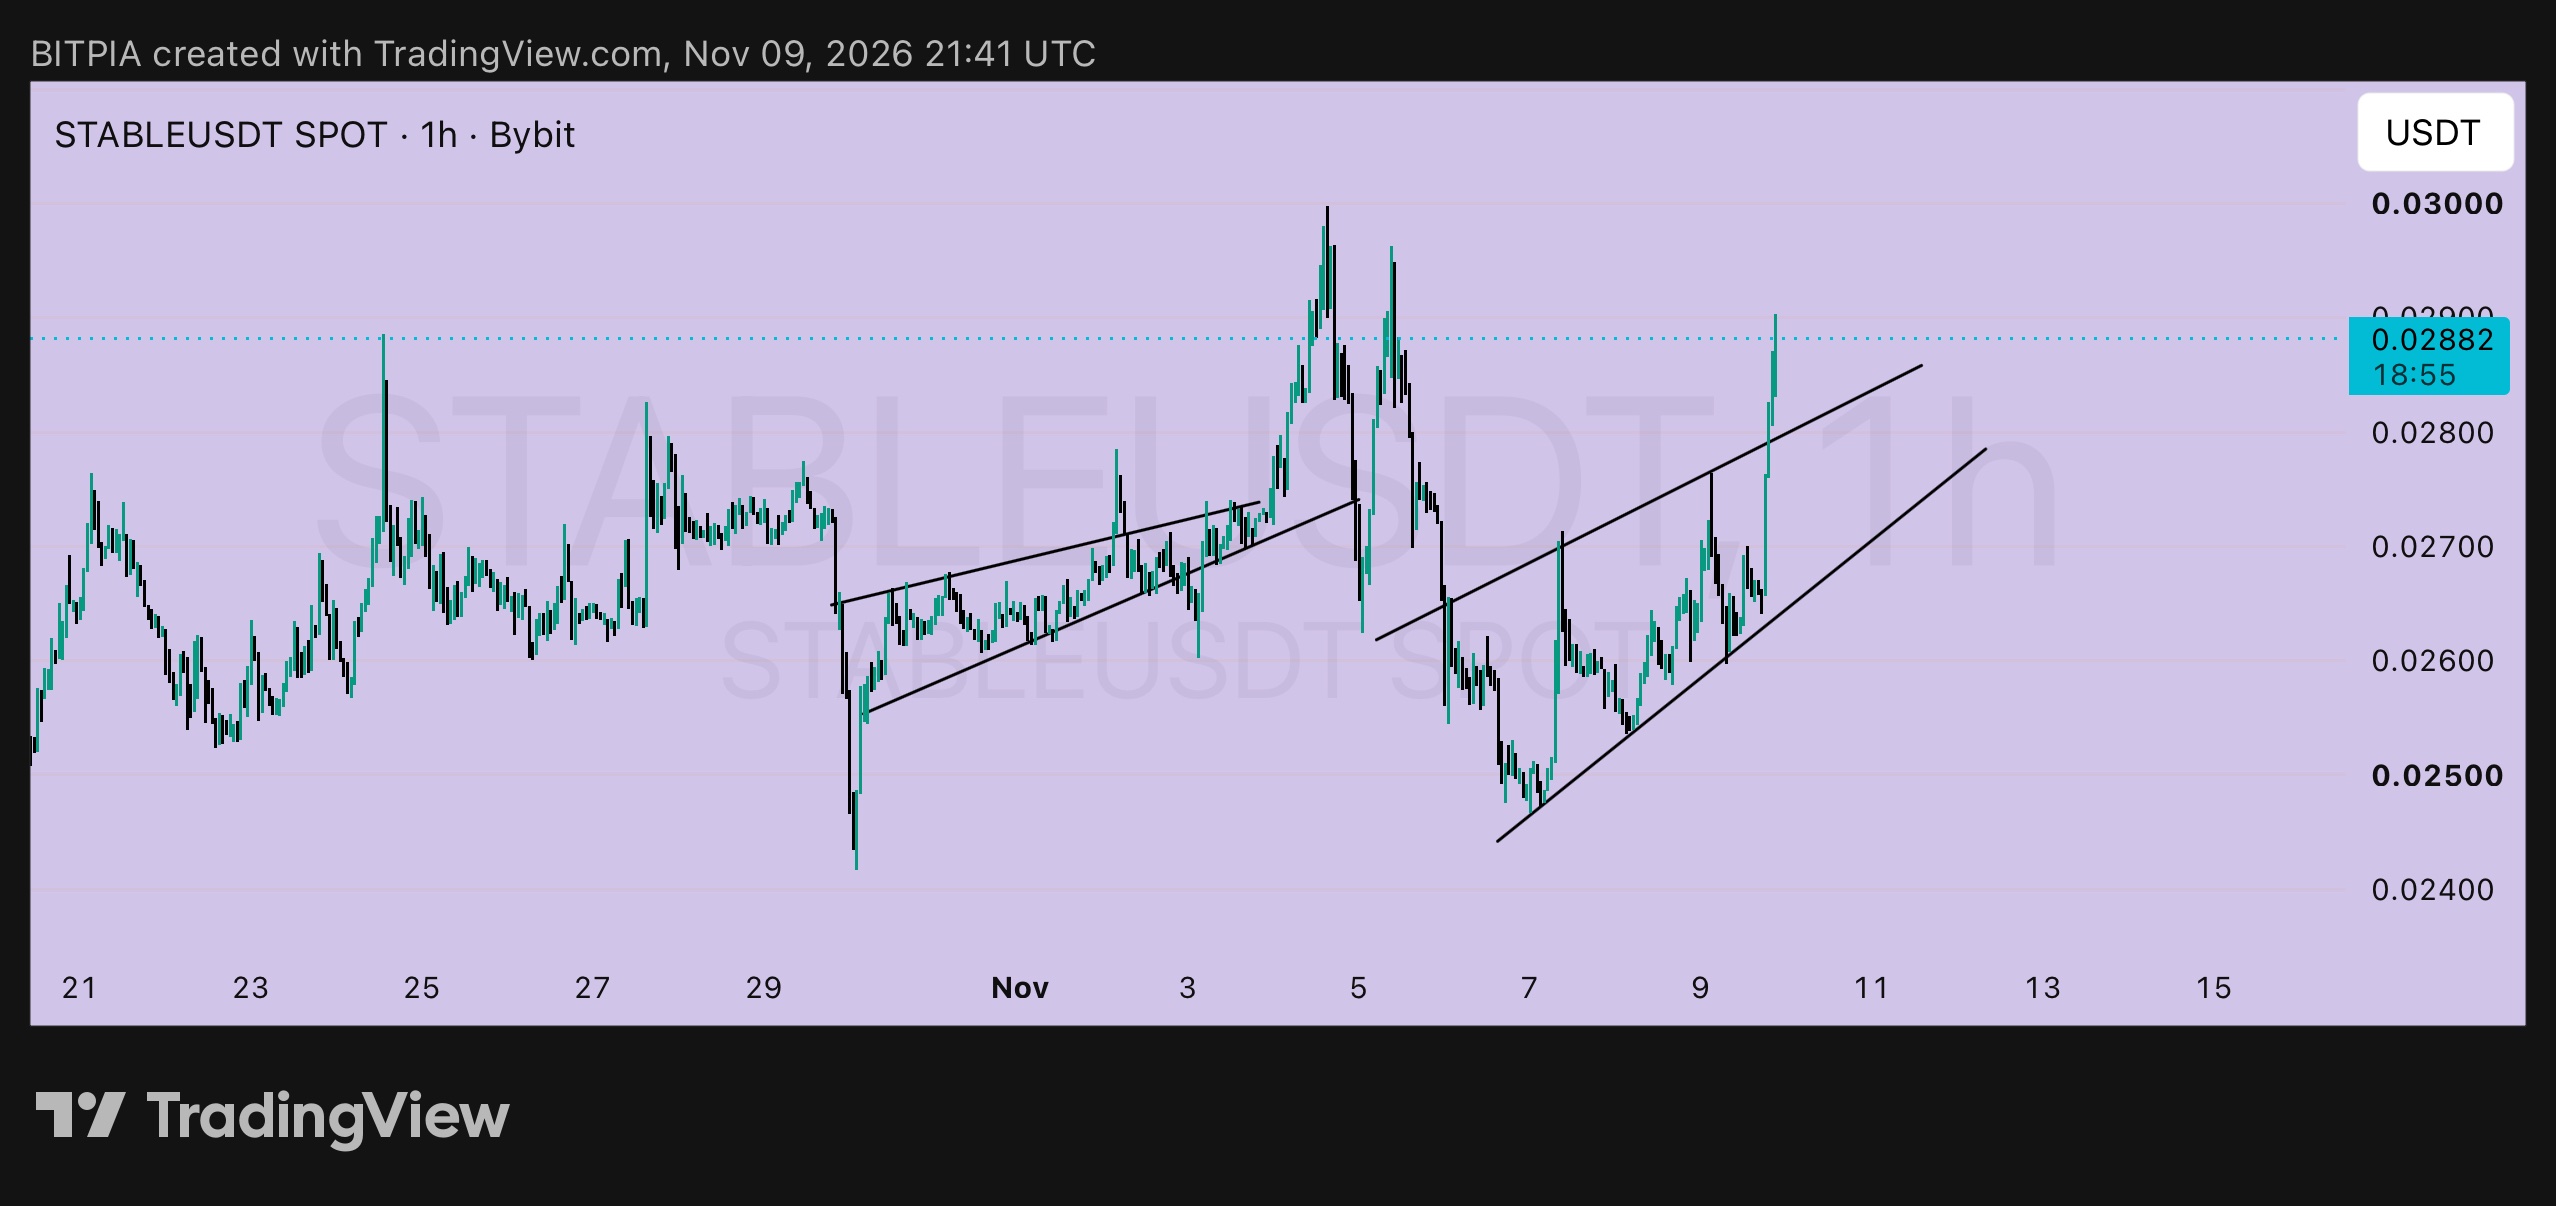
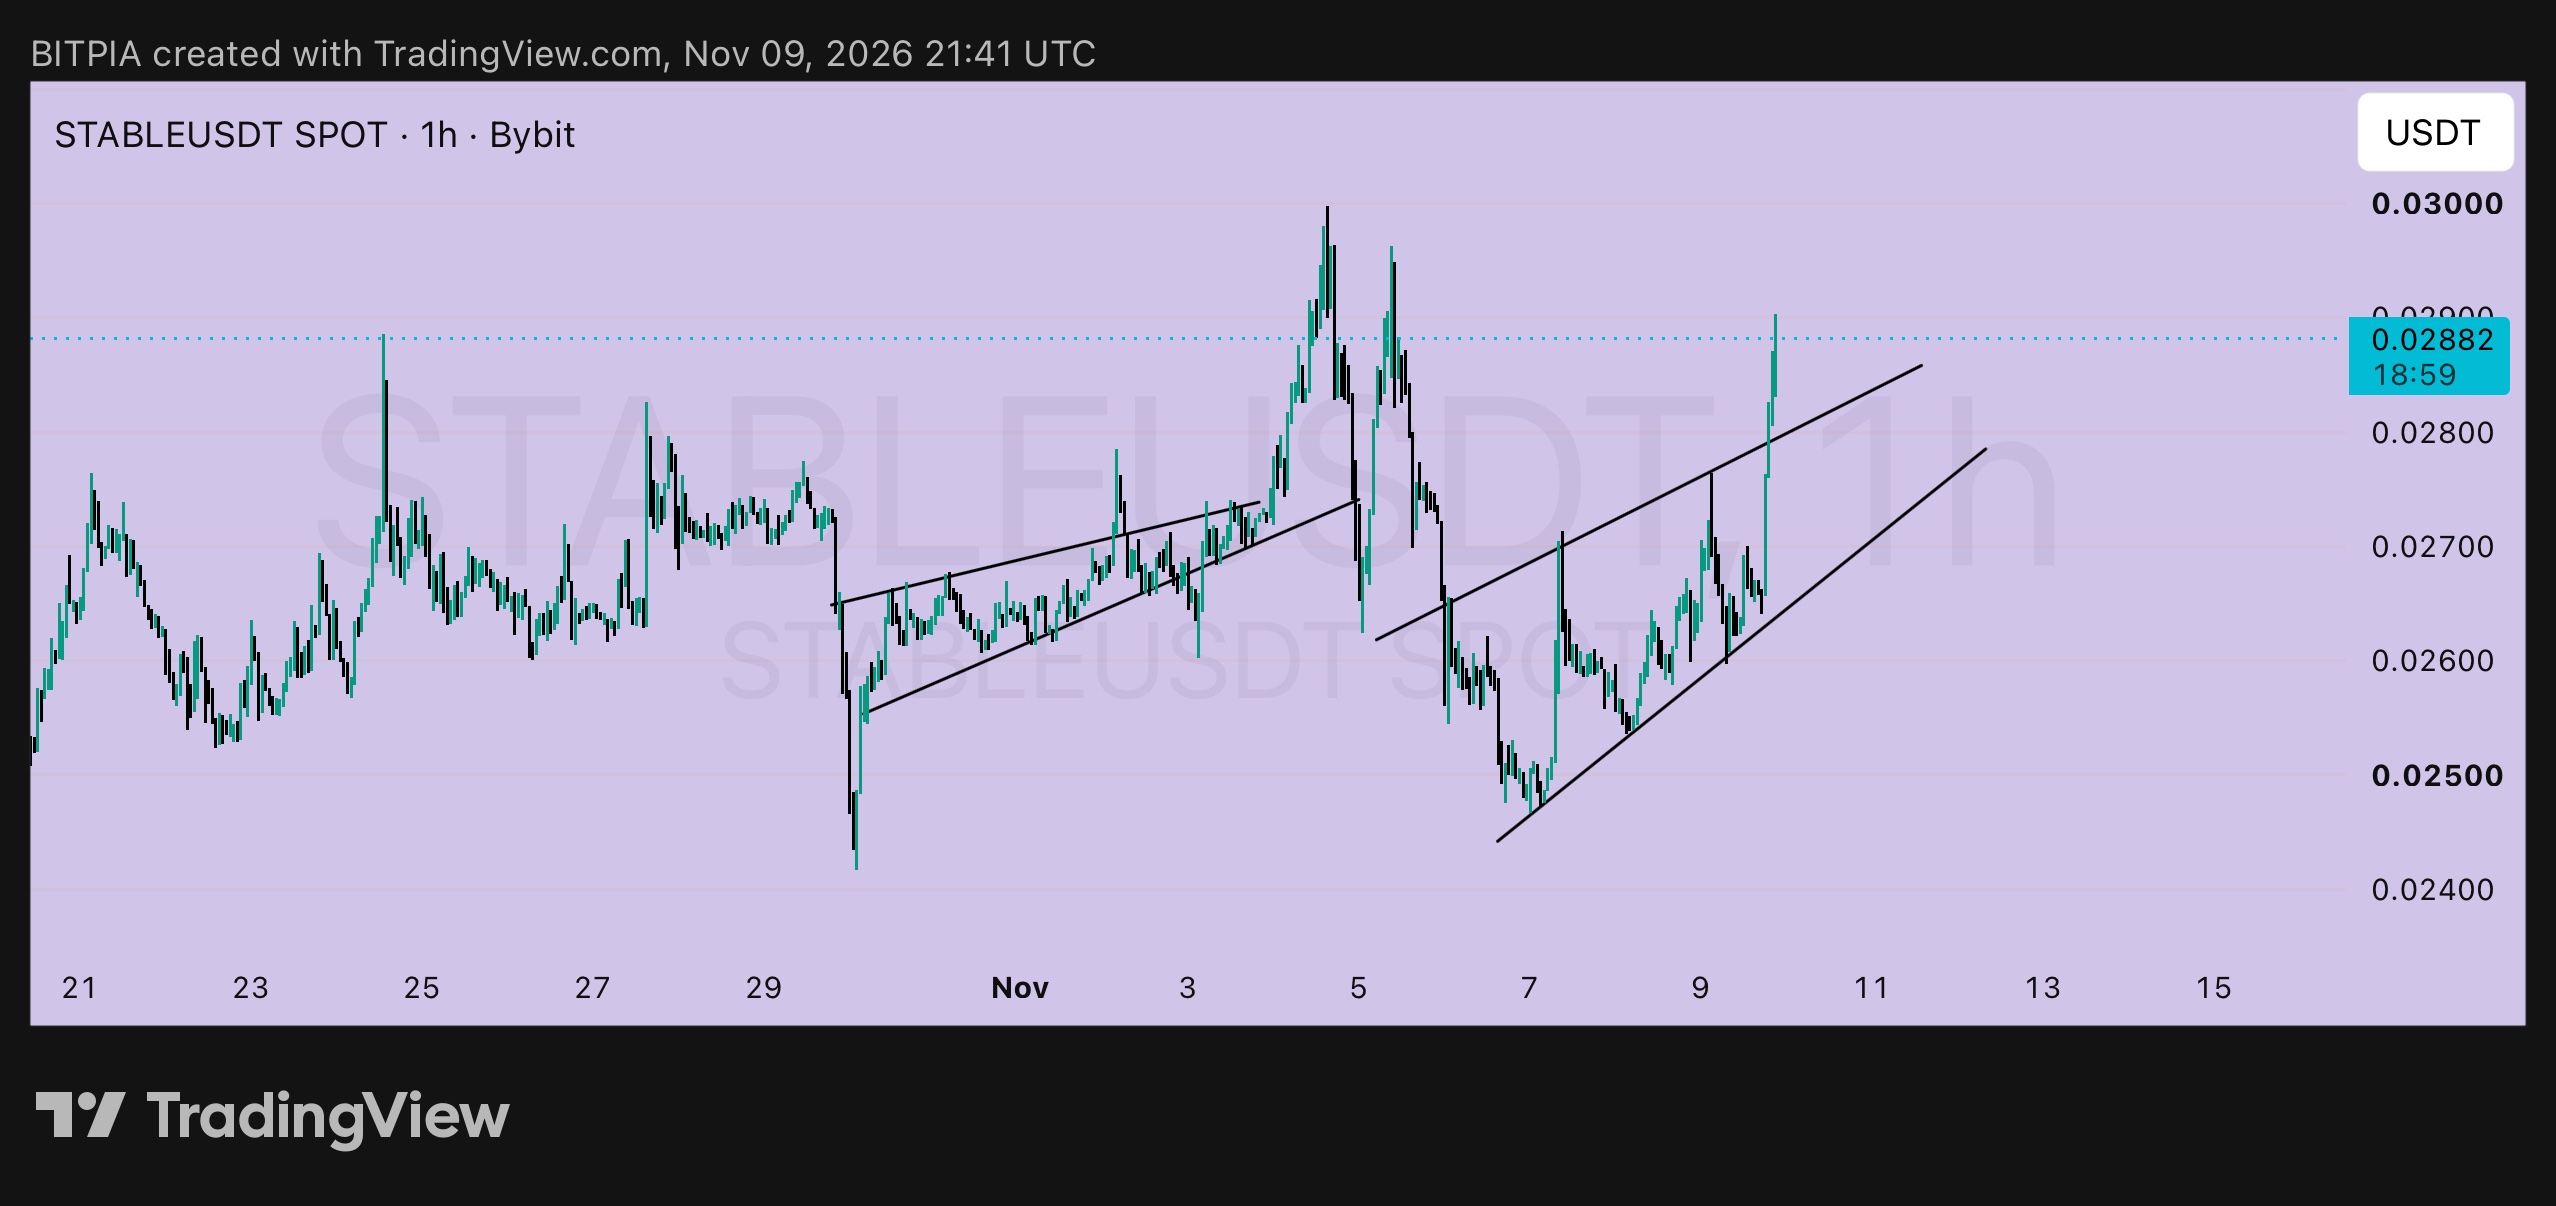
STABLE 1h: the bedtime plan 🌙 It's late in Lagos, so here's a set-and-forget version for $STABLEUSDT. Price is 0.02882 after breaking out of its rising channel, with the upper line, now near 0.0280, behind it. No need to watch the screen all night if you set these three things. ➤ Alert 1: 0.0290 ▸ The level of the Oct 24 high and a close rejection on Nov 5 ▸ If price closes above it on the 1h chart, momentum is real ➤ Alert 2: 0.0300 ▸ The Nov 4 high, and the next big round number ▸ A close above it is my breakout trigger ➤ Order idea: the retest ▸ Entry: around 0.0278, near the old channel line, if price comes back and holds ▸ Stop-loss: below 0.0262, under the channel's lower line ▸ Risk per unit: 0.0016 ▸ Target 1: 0.0300, +0.0022, about 1.4R ▸ Target 2: 0.0330, +0.0052, about 3.25R ➤ Breakout version ▸ Entry: around 0.0302, after a 1h close above 0.0300 ▸ Stop-loss: below 0.0286 ▸ Risk per unit: 0.0016 ▸ Targets: 0.0330 (+0.0028, about 1.75R) and 0.0350 (+0.0048, about 3R) ➤ Why not buy now At 0.02882 with the 0.0262 stop, risk is 0.0026, and 0.0330 is only about 1.6R away. Price is also just under 0.0290, which has stopped it before. I'd rather wait for either the retest or the clean break. ➤ What cancels it A 1h close back inside the channel and under 0.0262 means the breakout has failed, and I'd step aside. Small size, and low leverage if you use perps. Then sleep well. 💙 Not financial advice. Do your own research and only risk what you can afford to lose. #ByXIMPACT #WSOT2026
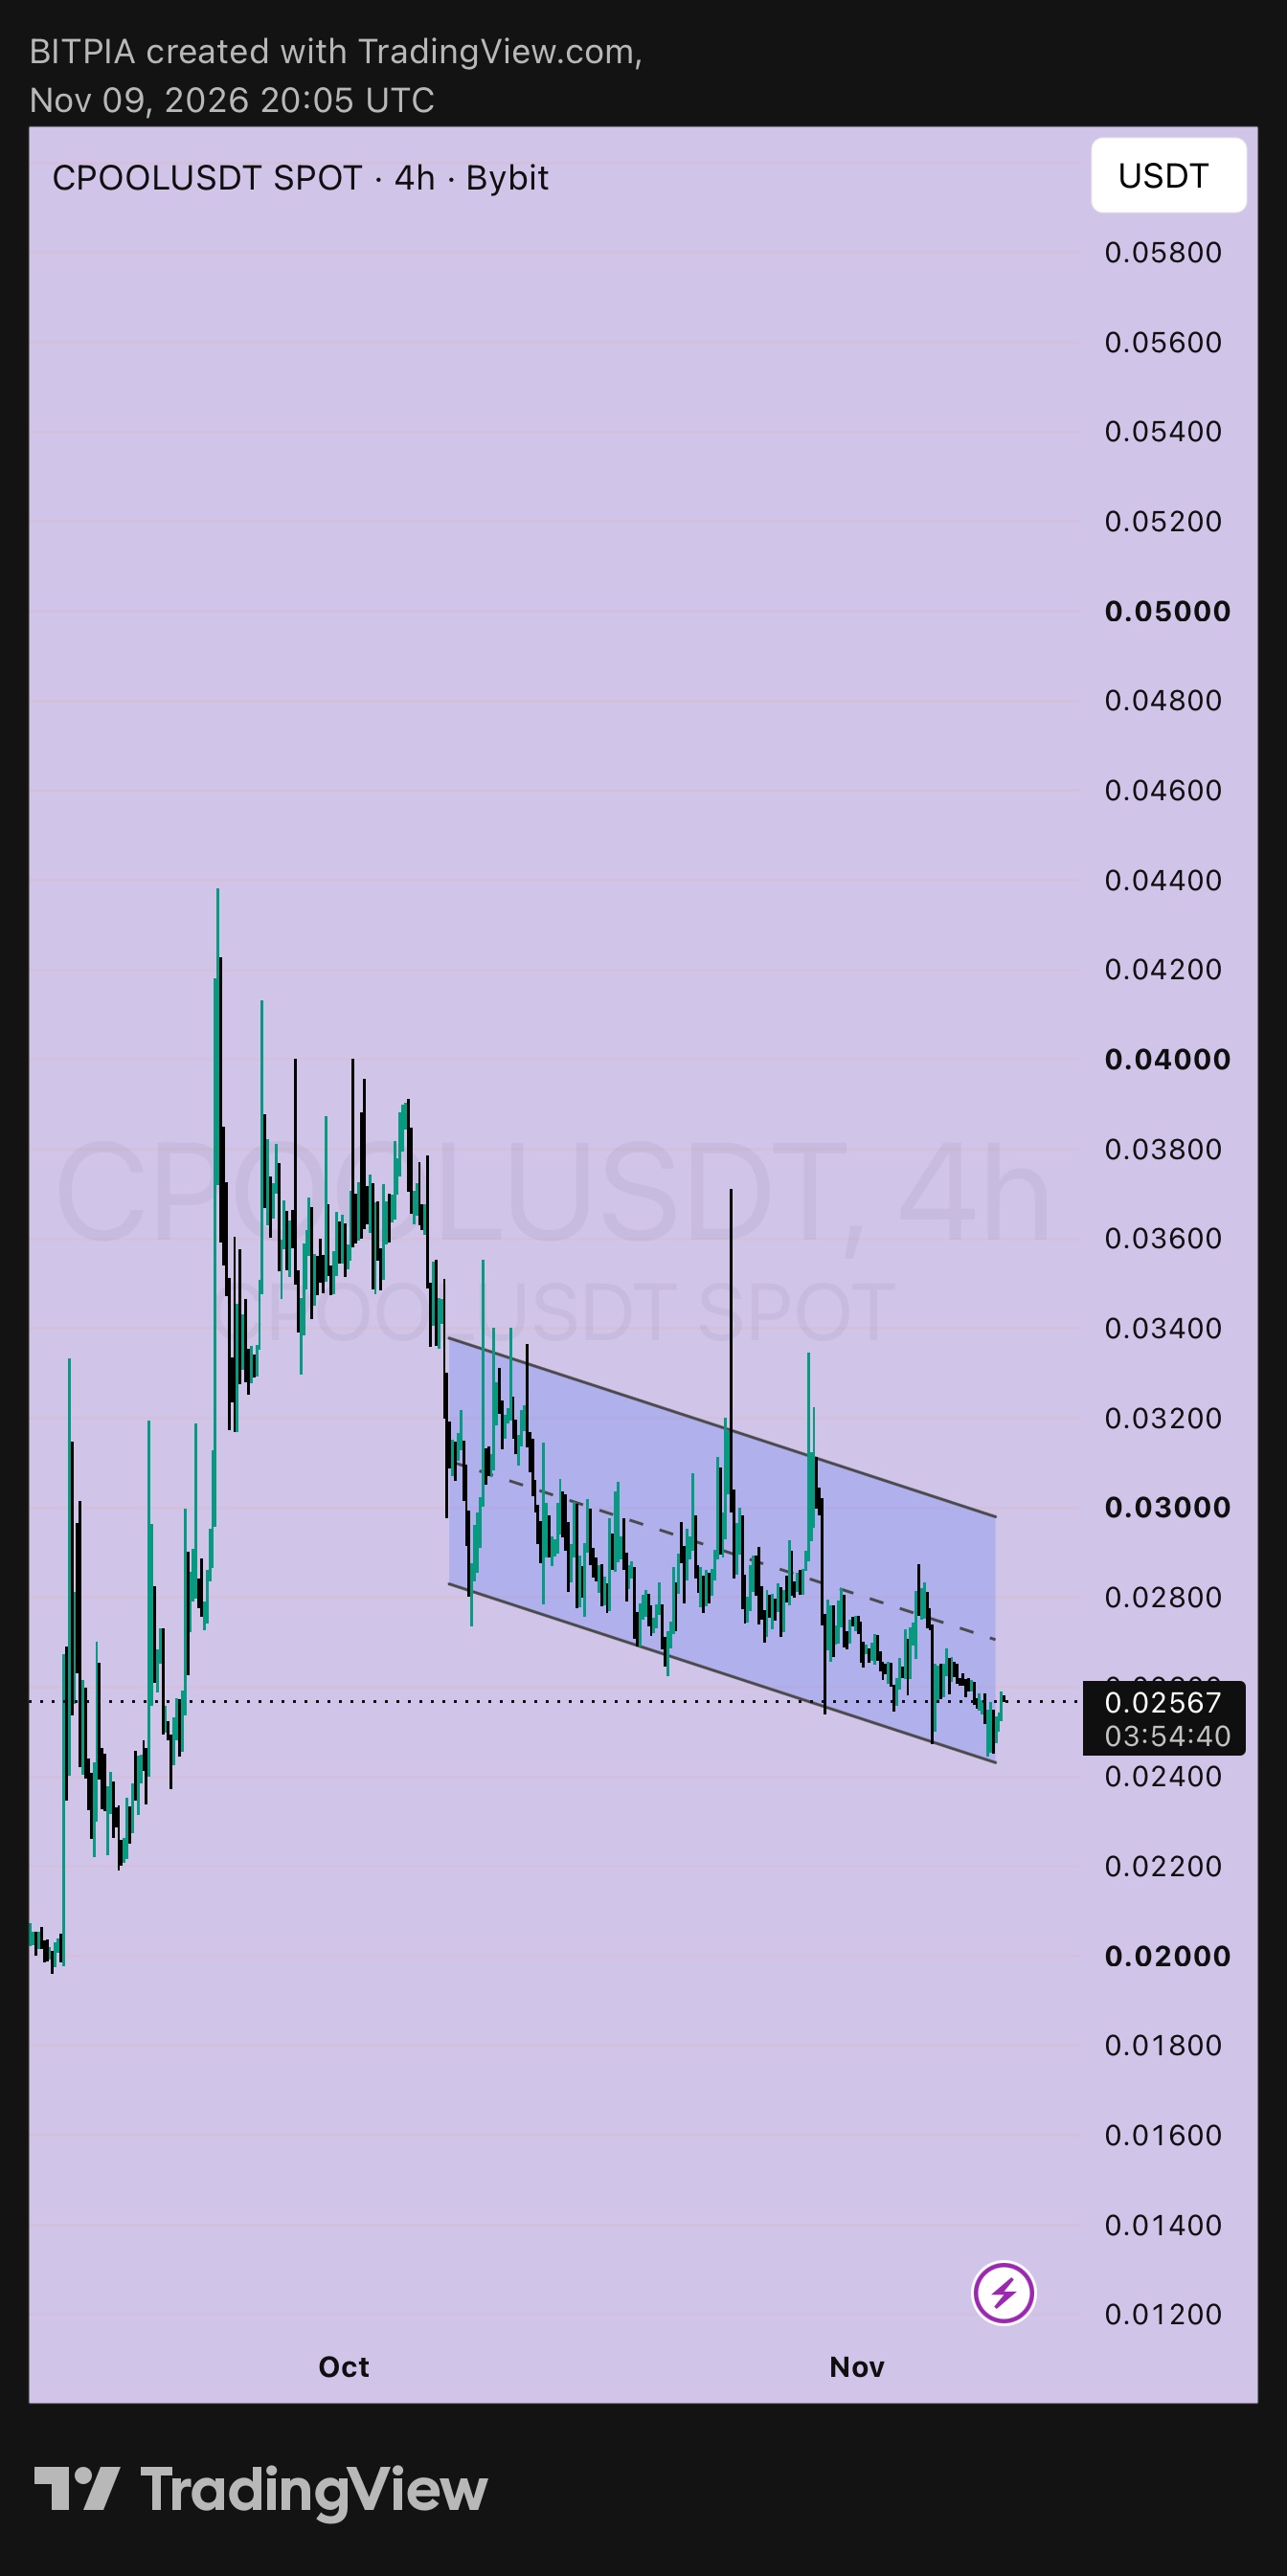
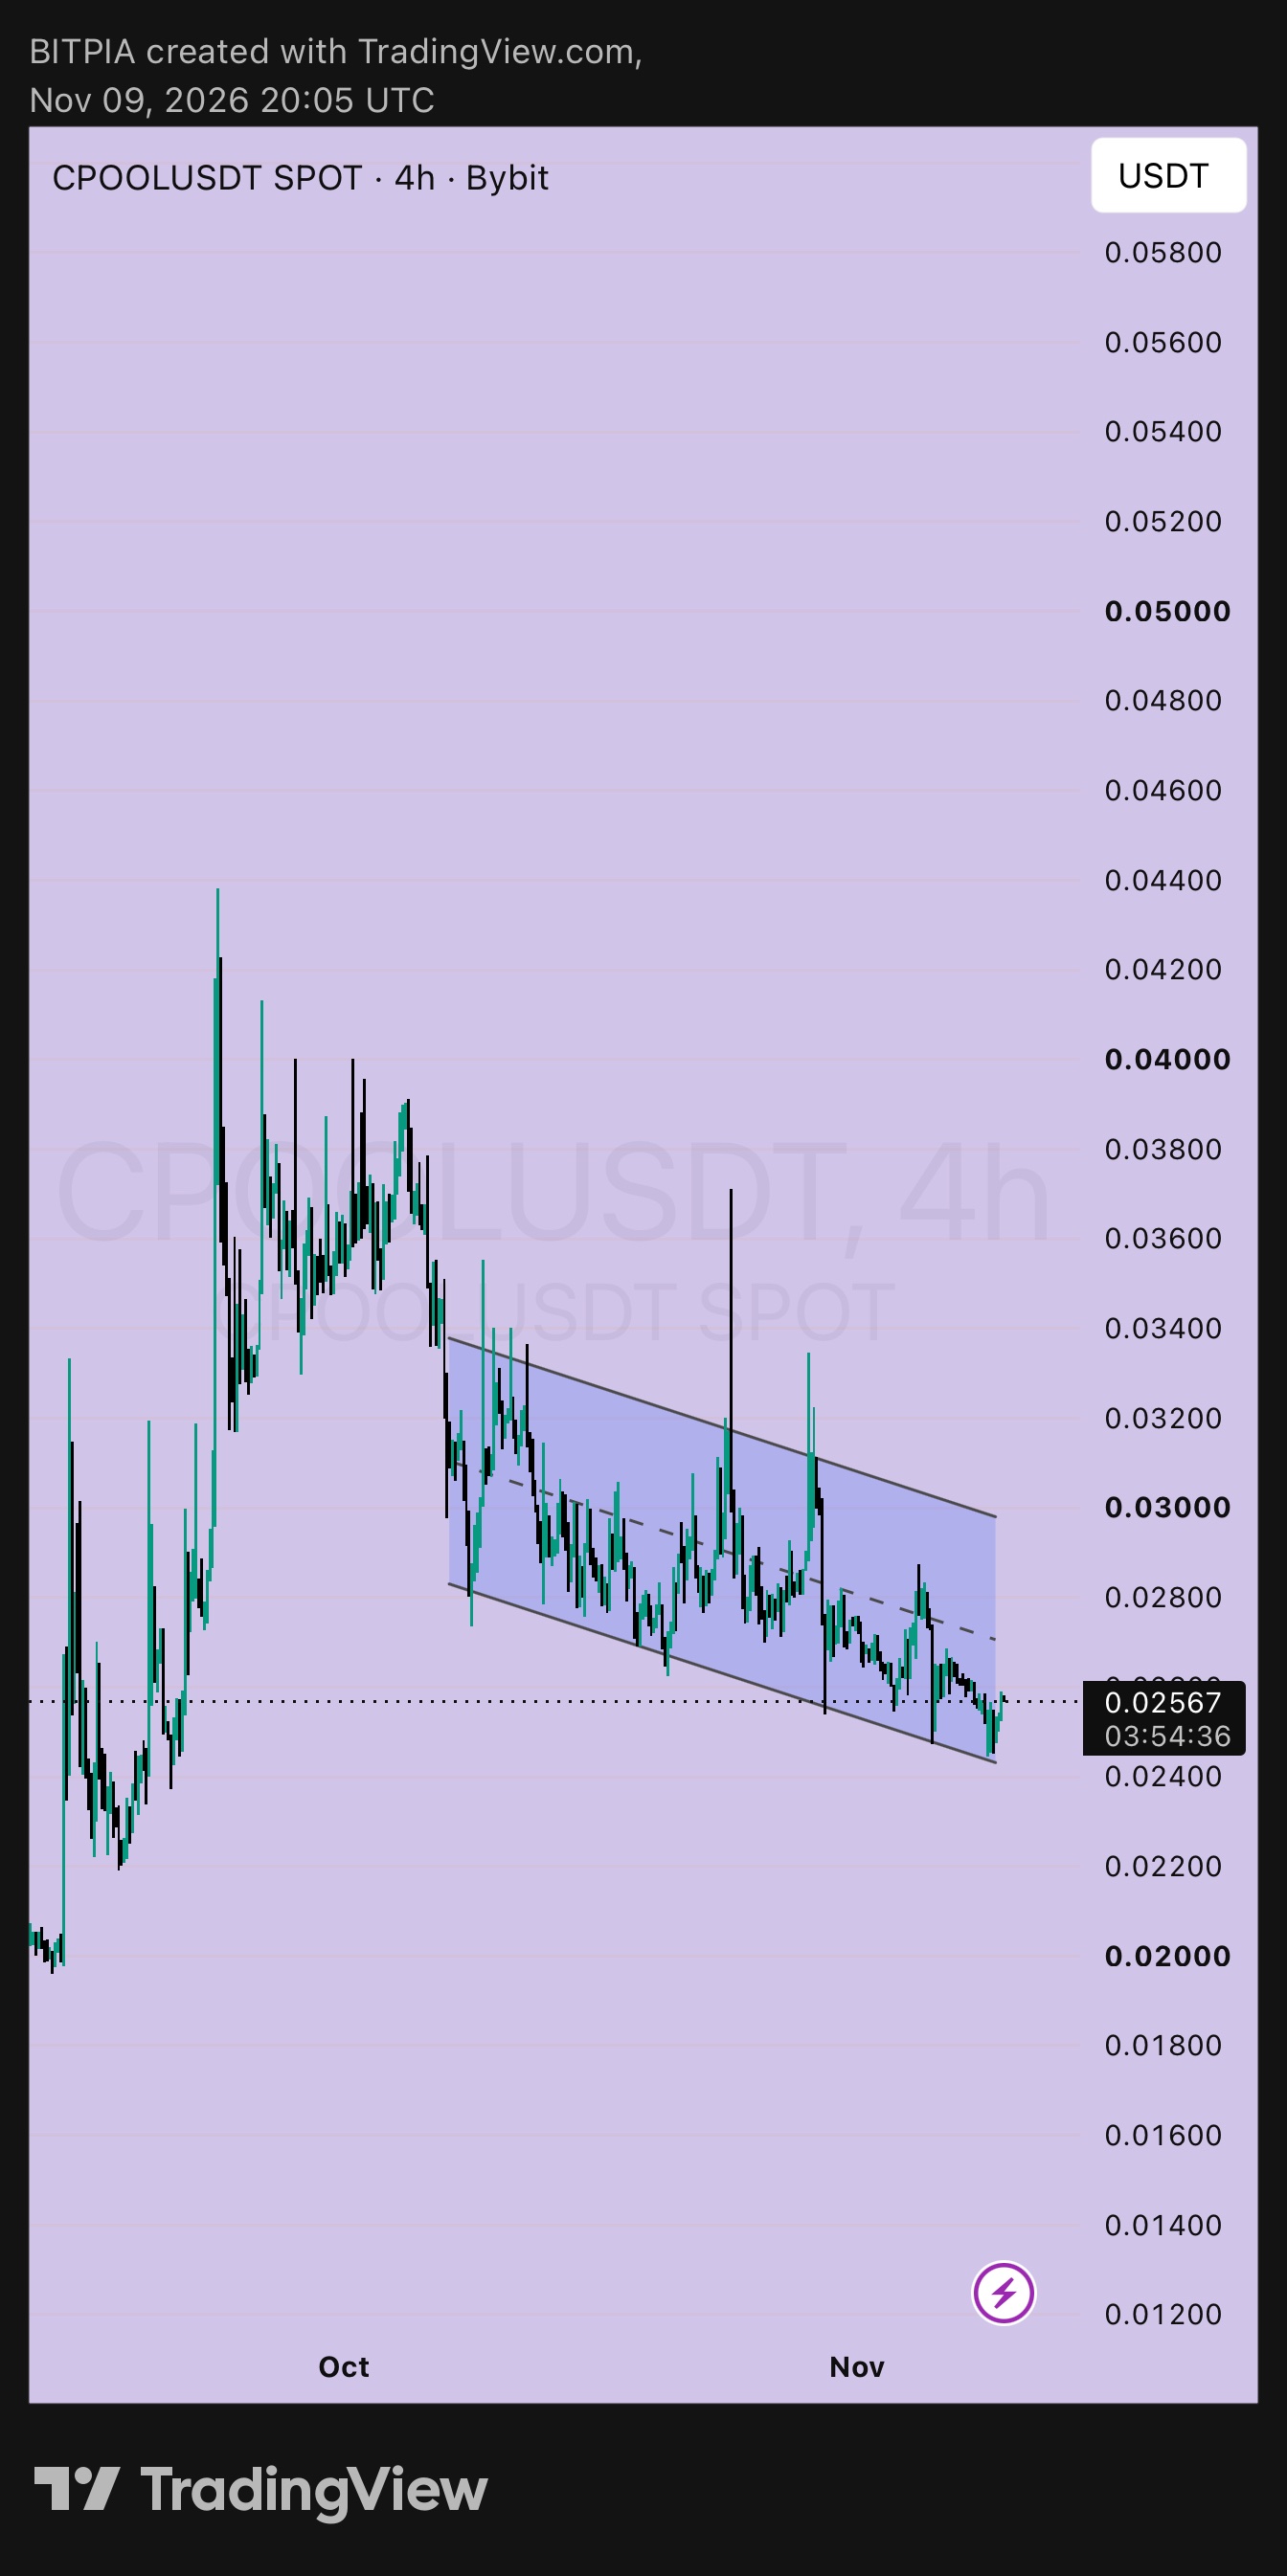
CPOOL 4h: three prices to remember 🔑 I used the latest of your two charts, with price at 0.02567. $CPOOLUSDT has been drifting down inside a falling channel since early October, and price is back near the lower line. If you remember only three prices on this chart, make it these. ➤ 0.0245: the floor ▸ The lower line and the recent lows, which buyers have defended several times ▸ Below it, the next area is the 0.0200 to 0.0220 base from September ➤ 0.0270: the middle ▸ The dashed centre line of the channel, and the first place I'd expect sellers ▸ It's also my first target ➤ 0.0300: the ceiling ▸ The upper line of the channel, with the older highs sitting above it at 0.0336 and 0.0370 ▸ A 4h close above it would be the first real sign that the channel is over ➤ Plan A: near the floor ▸ Entry: around 0.0250 ▸ Stop-loss: below 0.0235 ▸ Risk per unit: 0.0015 ▸ Target 1: 0.0270, +0.0020, about 1.3R ▸ Target 2: 0.0300, +0.0050, about 3.3R ▸ Target 3: 0.0340, +0.0090, about 6R ➤ Plan B: after the breakout ▸ Entry: around 0.0305, after a 4h close above 0.0300 ▸ Stop-loss: below 0.0280 ▸ Risk per unit: 0.0025 ▸ Targets: 0.0340 (about 1.4R) and 0.0370 (+0.0065, about 2.6R) ➤ Chase math At 0.02567 with the same stop, risk is 0.0022, and 0.0300 is about 2R away. Not terrible, but Plan A gives a better price if the floor is retested. ➤ What cancels it A 4h close under 0.0235 means the channel's lower line has failed. I'd step aside and watch the 0.0200 to 0.0220 base instead of guessing. Small size, and low leverage if you use perps. Not financial advice. Do your own research and only risk what you can afford to lose. #ByXIMPACT #WSOT2026
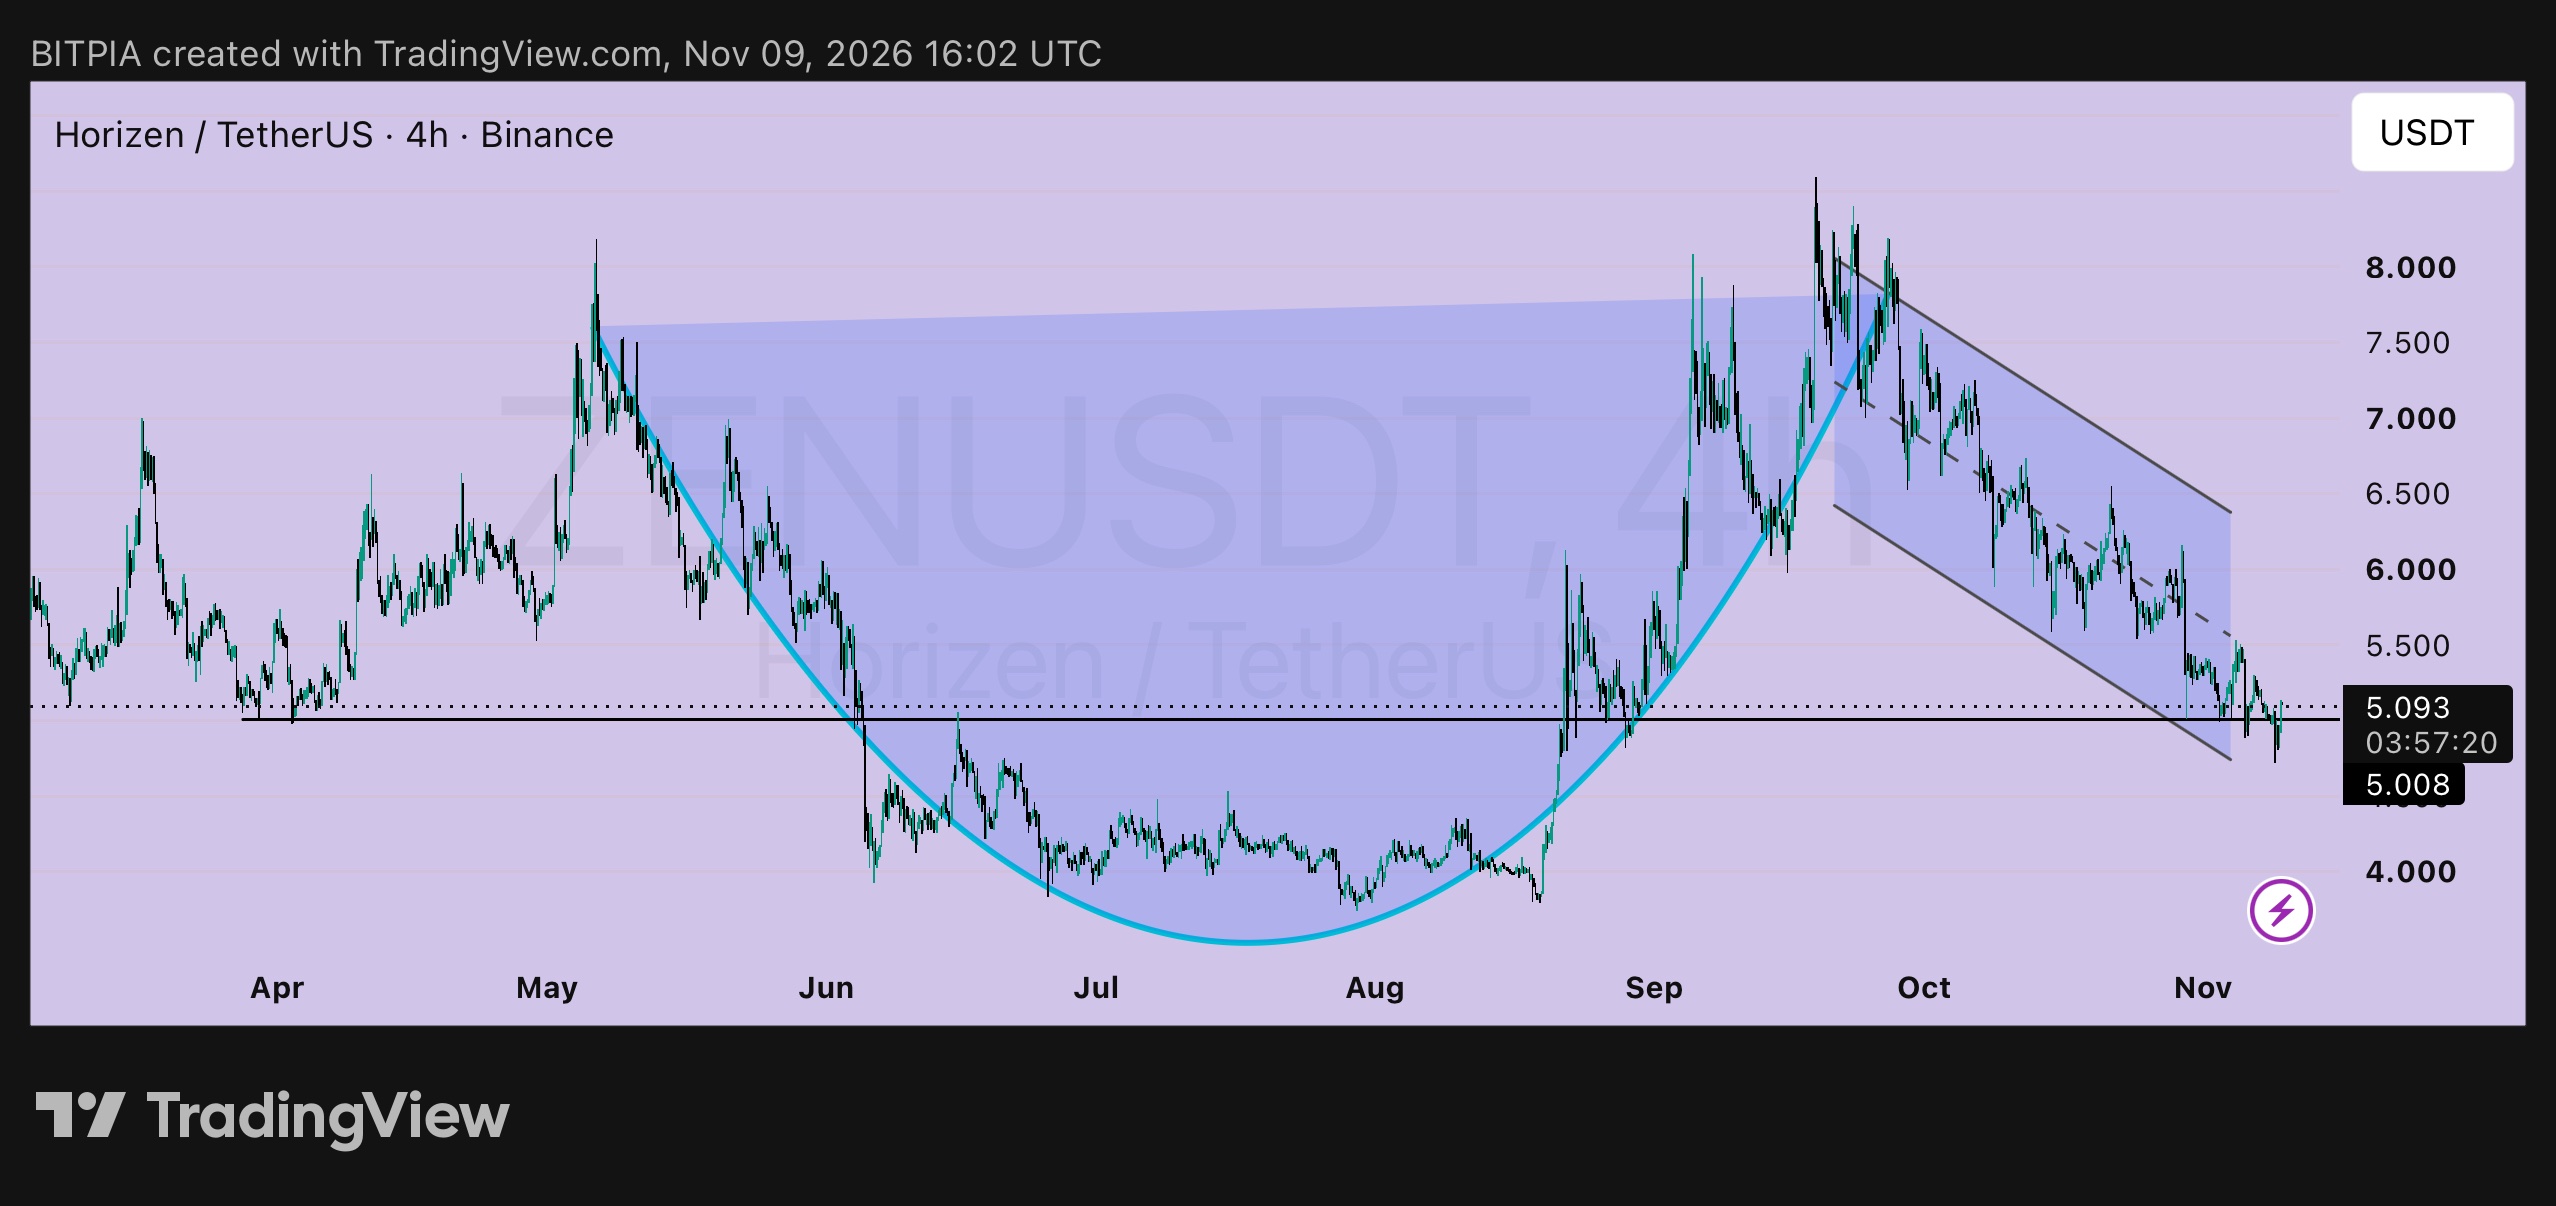
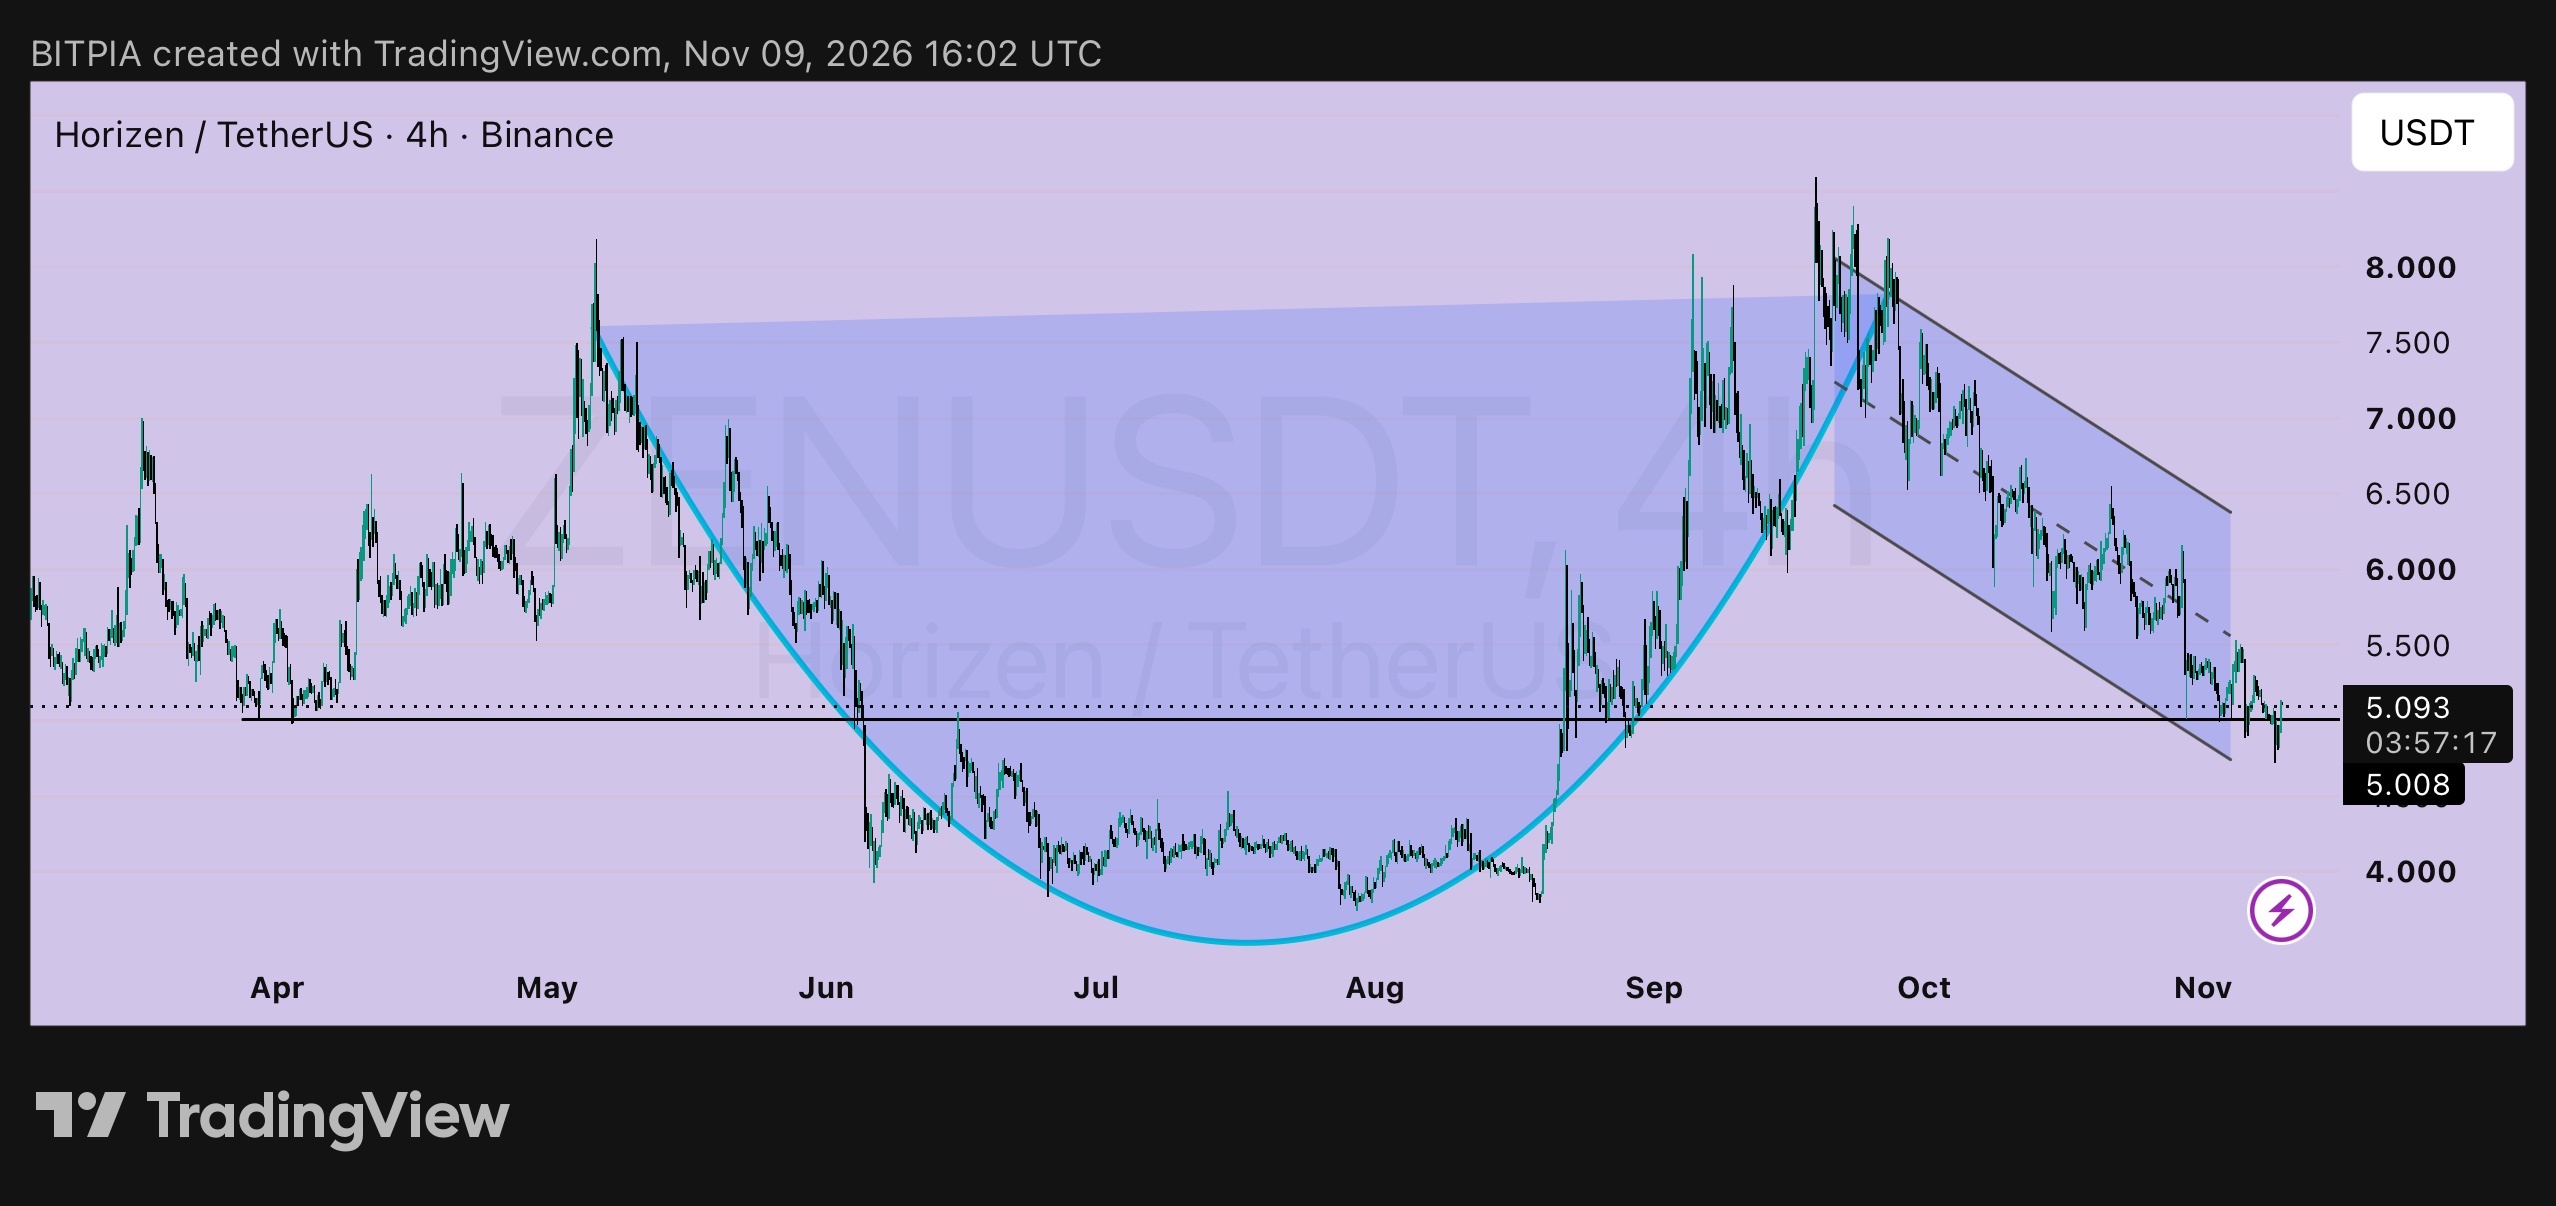
$ZEN: two timeframes, one story 🔭 I posted the daily $ZENUSDT chart on Nov 6 at 5.231 with a cup and handle plan. Now the 4h chart is at 5.093, so here's how the two views fit together. ➤ The daily view (the big picture) ▸ A rounded base from May to September, then a handle drifting down in a falling channel ▸ The cup rim sits near 7.8, and a daily close above the channel top near 6.4 would be the first sign of a breakout ▸ My early plan: entry 5.05, stop 4.65, risk 0.40 ➤ The 4h view (the details) ▸ Price is sitting on 5.008, the horizontal level that held in April and again in early September ▸ The dip this session reached about 4.97 and recovered, so buyers defended the level once more ▸ The channel's lower line sits just under, near 4.85 to 4.90 ➤ How they fit The handle looks like it's testing its lower end. If 5.008 holds and the 4h chart starts making higher lows, the early entry is working. If it doesn't, the 4.65 stop is there to keep the loss small. ➤ If you entered at 5.05 ▸ About +0.04, essentially flat ▸ Stop-loss stays at 4.65. I'm not tightening it just because price is near the level ▸ Targets: 6.40 (+1.35, about 3.4R) and 7.80 (+2.75, about 6.9R) ➤ If you're waiting for proof ▸ Trigger: a 4h close above 5.50 ▸ Entry: around 5.55 ▸ Stop-loss: below 5.00 ▸ Risk per unit: 0.55 ▸ Targets: 6.40 (about 1.5R) and 7.80 (+2.25, about 4.1R) ➤ What cancels it A 4h close under 4.85 would mean the 5.008 level and the channel's lower line have both failed, and I'd step aside. The daily plan fails below 4.65. Daily patterns take weeks, so small size, and low leverage if you use perps. Not financial advice. Do your own research and only risk what you can afford to lose. #ByXIMPACT #WSOT2026