Mdleganttop1
40567Suka10Pembagian862Penggemar6Ikuti
💹 Bybit Square | Trade Smart, Earn Big 🚀 Crypto Moves | Bybit Square Hustler 💎 Trade 💰 Learn 📚 Grow 🌱 | Bybit Square 📈 Market Insights & Smart Trading | Bybit S
💹 Bybit Square | Trade Smart, Earn Big 🚀 Crypto Moves | Bybit Square Hustler 💎 Trade 💰 Learn 📚 Grow 🌱 | Bybit Square 📈 Market Insights & Smart Trading | Bybit S
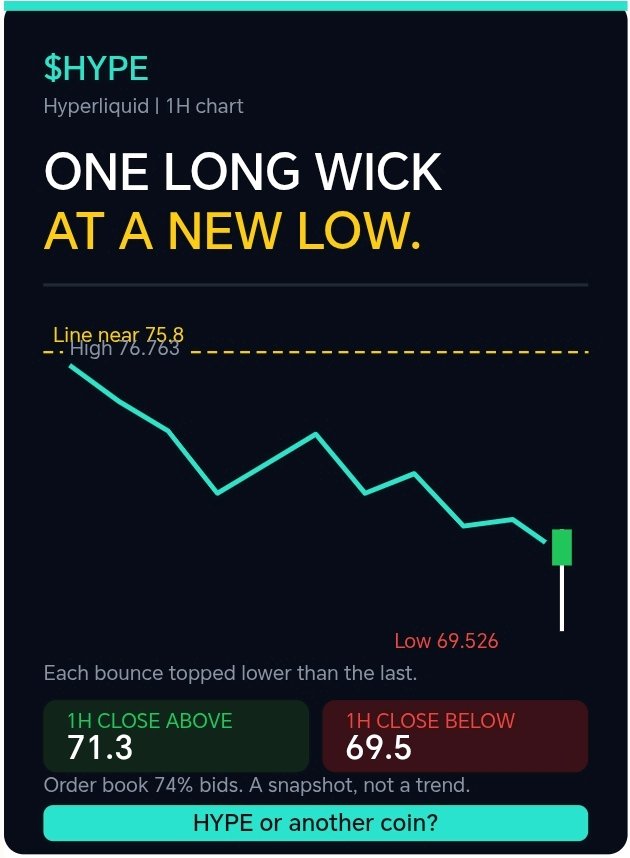
🔨 Satu wick panjang di harga terendah baru. Sekarang kita lihat apakah itu berarti sesuatu. Saya tidak ingin terlalu menyimpulkan dari satu candle di $HYPE. Saya ingin melihat penutupan 1 jam (1H) di atas 71,3, karena di situlah wick berubah menjadi pantulan yang sebenarnya. Inilah yang ditunjukkan chart 1H: 🔹 Wick tersebut: Candle terbaru turun ke 69,526, titik terendah baru di bawah yang sebelumnya, lalu kembali naik ke 70,68. Wick bawah yang panjang itu menunjukkan pembeli masuk di posisi ekstrem. 🔹 Tangga turun (staircase): Dari level tertinggi 76,763, setiap pantulan puncaknya selalu lebih rendah dari yang sebelumnya, dan setiap penurunan selalu sedikit lebih dalam. Trennya masih turun. 🔹 Garis di atas: Level horizontal di dekat 75,8 telah menahan pergerakan sejak level tertinggi. Harganya masih jauh, sekitar 7% lagi. 🔹 Order book: Bids sekitar 74% vs 26% asks. Book yang condong ke pembeli mendukung wick tersebut, tapi ini hanya snapshot, bukan perubahan tren. 🔹 Range: Tertinggi 24 jam di 74,352 dan terendah 69,526, dengan turnover 25,42 juta. Laju pergerakan stabil, tidak panik. 🟢 Bullish: penutupan 1H di atas 71,3, lalu 73,1 dan 75,8. Low yang lebih tinggi setelah wick tersebut akan menjadi tanda pertama bahwa tren tangga turun mulai patah. 🔴 Bearish: penutupan 1H di bawah 69,5 menghapus wick tersebut dan melanjutkan tren lower lows (titik terendah yang semakin rendah). Satu wick bukanlah pembalikan arah. Dua atau tiga penutupan candle yang lebih tinggi setelahnya baru mulai terlihat seperti itu. Apakah Anda sedang memantau $HYPE atau koin lain? #HYPE #Kripto #BinanceSquare #WSOT2026 #InflasiASMelonjakDanTaruhanKenaikanSukuBungaMeningkat #SanDiskMengumumkanPecahSaham8Untuk1 #AnthropicIPOValuationTest #BitcoinMencapaiTitikTerendahDuaBulanSetelahPemiluParuhWaktuAS $HYPEUSDT $BTCUSDT
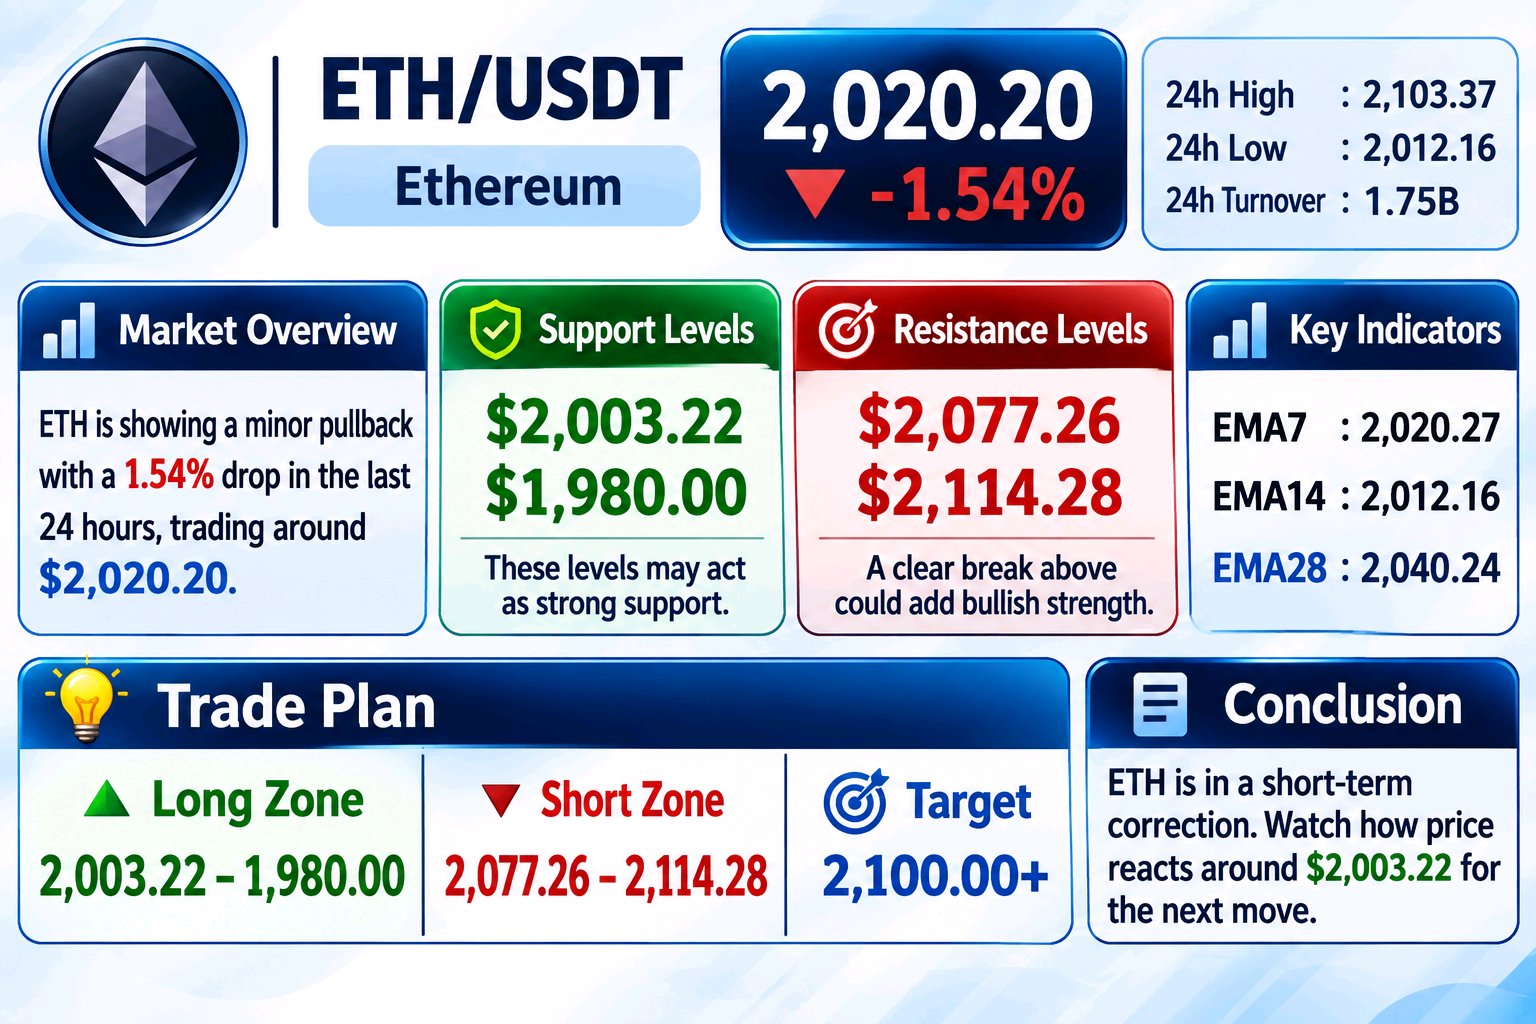
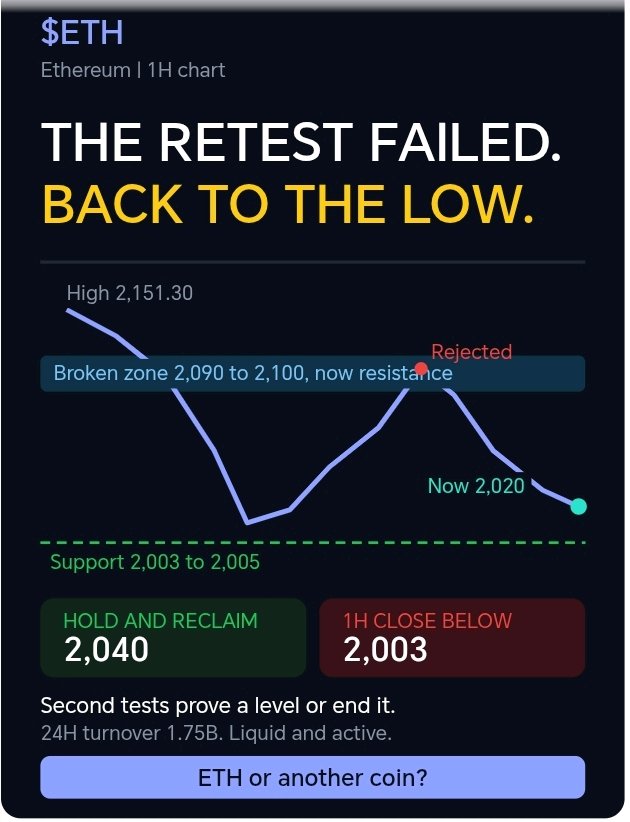
🧲 Retest gagal, dan $ETH sedang ditarik kembali menuju level terendahnya. Saya tidak ingin menyebut level terendah pada $ETH sementara setiap pantulan harga terus dijual. Saya ingin melihat support 2.003 hingga 2.005 bertahan pada kunjungan kedua ini, kemudian harga kembali naik ke 2.040. Berikut adalah apa yang ditunjukkan oleh grafik 1H: 🔹 Penurunan: Dari level tertinggi 2.151,30, ETH meluncur menembus zona biru di sekitar 2.090 hingga 2.100 dan mencetak level terendah di 2.003,22. 🔹 Retest: Harga memantul dan naik kembali ke zona tersebut dari bawah, melonjak sedikit di atasnya. Itu adalah retest klasik dari support yang telah ditembus. 🔹 Penolakan: Retest langsung ditolak, diikuti oleh serangkaian level tertinggi yang semakin rendah (lower highs). Support lama kini bertindak sebagai resistance. 🔹 Kunjungan kedua: Harga sekarang berada di 2.020,20, hanya sekitar 0,8% di atas level terendah 2.003 hingga 2.005. Dasar yang sama sedang diuji untuk kedua kalinya. 🔹 Rentang: Tertinggi 24 jam 2.103,37 dan terendah 2.012,16, dengan volume perdagangan 24 jam sebesar 1,75 Miliar. Pasar likuid dan aktif di sini. 🟢 Bullish: jika dasar 2.003 hingga 2.005 bertahan dan harga kembali ke 2.040, lalu 2.077. Double bottom akan menunjukkan pembeli mempertahankan level tersebut. 🔴 Bearish: penutupan 1H di bawah 2.003 akan menembus dasar tersebut. Angka bulat 2.000 berada tepat di sana, dan hanya ada sedikit support yang terlihat di bawahnya pada grafik ini. Uji coba kedua entah membuktikan suatu level atau justru mengakhirinya. Beberapa penutupan 1H berikutnya akan menentukan yang mana ini. Apakah Anda sedang memantau $ETH atau koin lain? #ETH #Ethereum #Crypto #BinanceSquare #WSOT2026 #InflasiASMelonjakDanTaruhanKenaikanSukuBungaMeningkat #SanDiskMengumumkanPecahSaham8Untuk1 #AnthropicIPOValuationTest #BitcoinMencapaiTitikTerendahDuaBulanSetelahPemiluParuhWaktuAS $ETHUSDT $BTCUSDT
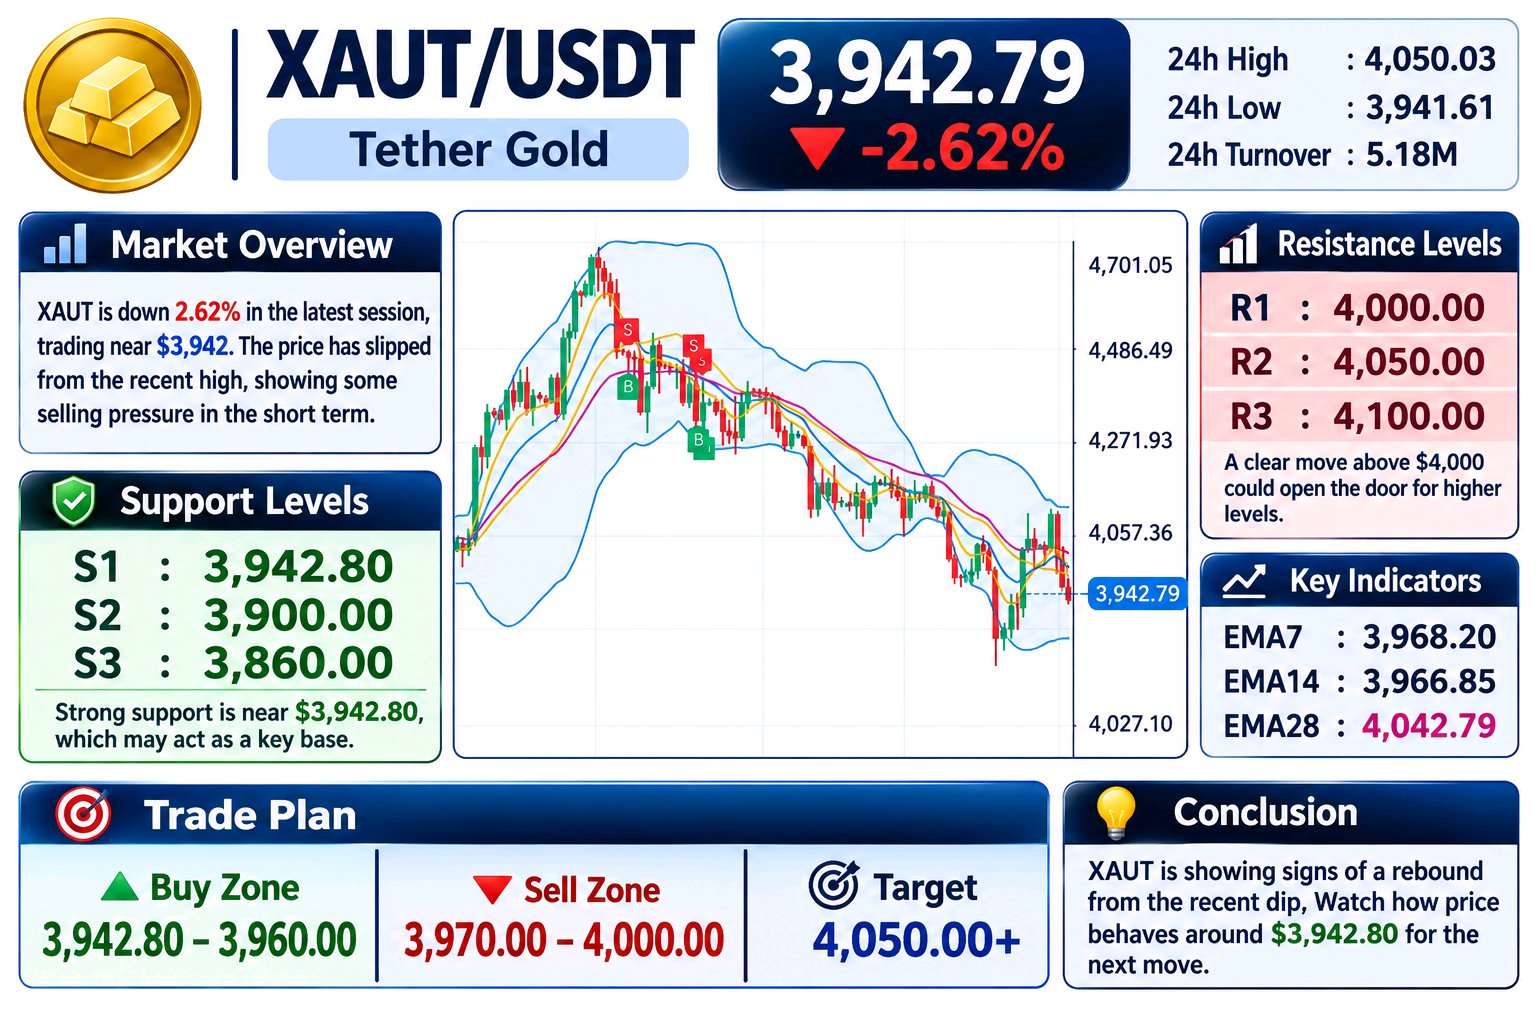
🕳️ Emas baru saja menembus batas bawah range harganya. Saya tidak ingin terburu-buru menyebut ini sebagai rebound untuk $XAUT saat harganya sedang berada di titik terendah hari ini. Saya ingin melihat harga ditutup kembali di atas 3.968, karena di situlah rata-rata pergerakan jangka pendek (short averages) menanti. Berikut yang ditunjukkan oleh angka-angkanya: 🔹 Penembusan: Emas telah bergerak di antara kisaran 4.005 hingga 4.128 selama beberapa hari. Sekarang harganya diperdagangkan di dekat 3.942,79, di bawah batas bawah range tersebut. 🔹 Range hari ini: Tertinggi 24 jam di 4.050,03 dan terendah 3.941,61, dengan fluktuasi sekitar 2,7%. Harga saat ini berada tepat di dasar range tersebut, jadi penjual mendominasi sesi sejauh ini. 🔹 Rata-rata: EMA7 berada di 3.968,20 dan EMA14 di 3.966,85, keduanya berada tepat di atas harga. EMA28 di 4.042,79 berada sekitar 2,5% di atasnya. 🔹 Lantai yang terbalik: Zona support lama di dekat 4.000 sekarang menjadi resistance di atas. Setelah penembusan, support lama biasanya berubah menjadi ceiling (plafon) pada retest pertama. 🔹 Bantalan di bawah: Tidak banyak support yang terlihat di dekat sini. 3.900 adalah angka bulat, dan basis 3.872,51 dari sebelumnya berada sekitar 1,8% di bawahnya. 🔹 Aktivitas: Turnover 24 jam sebesar 5,18 juta, jadi ini adalah penurunan yang tenang, bukan kepanikan. 🟢 Bullish: penutupan kembali di atas 3.968, kemudian 4.000 dan 4.050. Merebut kembali 4.000 akan mengubah ini menjadi breakdown yang gagal. 🔴 Bearish: penutupan di bawah 3.941 membuka peluang ke 3.900, lalu ke level dasar 3.872,51. Begitu batas bawah range ditembus, retest pertama akan memberi tahu Anda apakah penembusan itu nyata atau tidak. Apakah Anda sedang memperhatikan $XAUT atau koin lain? #XAUT #Gold #Crypto #BinanceSquare #InflasiASMelonjakDanTaruhanKenaikanSukuBungaMeningkat #BitcoinMencapaiTitikTerendahDuaBulanSetelahPemiluParuhWaktuAS #Penjualan Massal Saham Teknologi AI Menghapus 2,5 Triliun dari Nasdaq 100 #DeutscheBankMeluncurkanPenyimpananAsetDigital #Pantauan IHK AS November $XAUTUSDT $HYPEUSDT
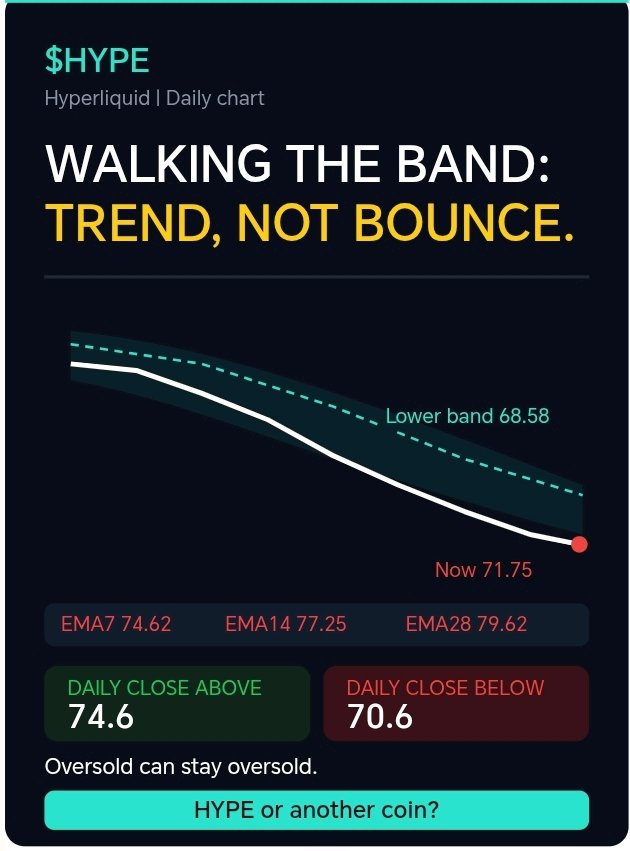
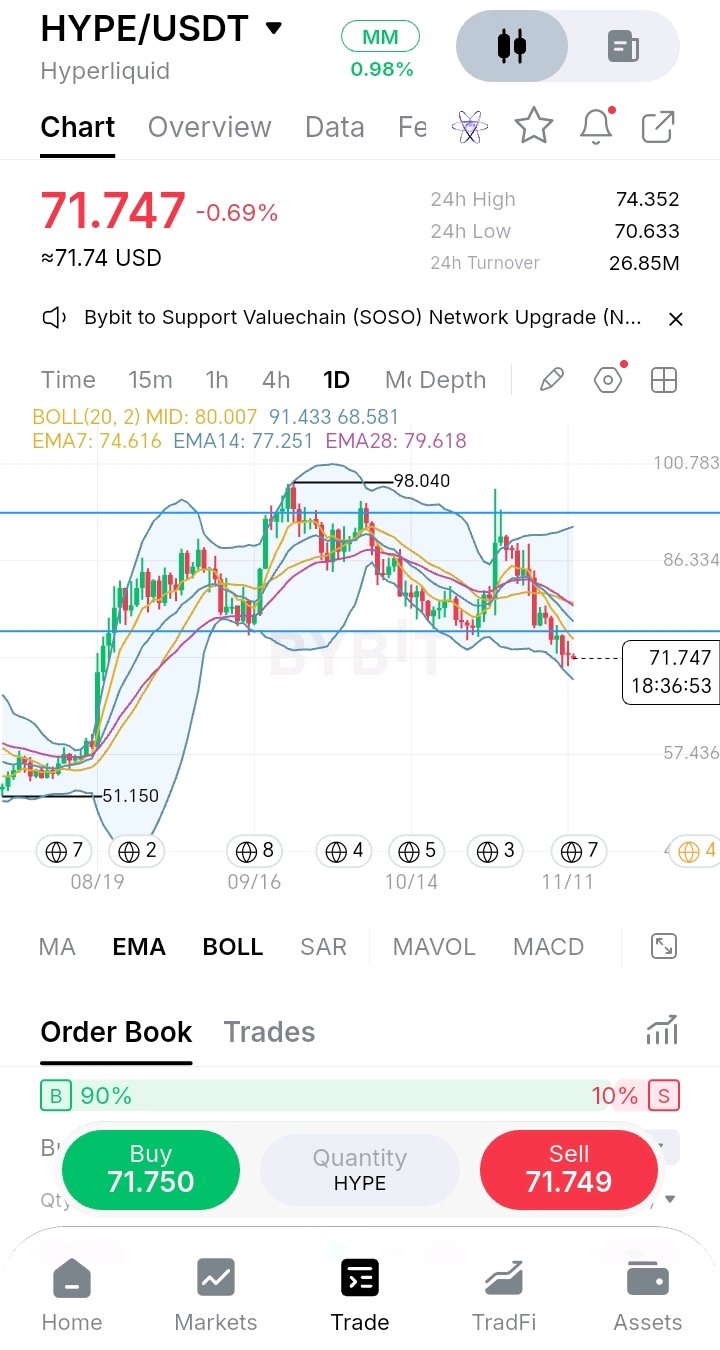
🚶 Saat harga menyusuri band bawah, itu biasanya sebuah tren, bukan pantulan. Saya tidak ingin membeli $HYPE hanya karena terlihat jenuh jual (oversold). Saya ingin melihat penutupan harian kembali di atas 74.6 (EMA7), karena itulah yang akan menarik harga kembali ke dalam band. Inilah yang ditunjukkan oleh grafik harian: 🔹 Pergerakan band (band walk): Selama beberapa candle harian berturut-turut, harga terus menempel atau turun di bawah Bollinger Band bawah (68.58). Itu adalah tanda momentum yang kuat, bukan kelelahan. 🔹 Tangga (ladder): Setiap rata-rata tersusun dalam urutan bearish. EMA7 74.62, EMA14 77.25, EMA28 79.62 dan mid-band di 80.01, semuanya miring ke bawah di atas harga. 🔹 Support yang hilang: Garis horizontal di dekat 76 jebol sebelumnya dan belum berhasil ditembus kembali (reclaimed). Harga sekarang sekitar 5.6% di bawahnya. 🔹 Bids: Order book masih condong sekitar 90% bids. Namun harga terus merosot bahkan dengan kondisi tersebut, jadi order book yang penuh belum cukup untuk menghentikan kejatuhan. 🔹 Rentang (range): Tertinggi 24 jam 74.352 dan terendah 70.633, dengan turnover 26.85M. Penjualan telah melambat dibandingkan hari-hari saat breakdown. 🟢 Bullish: penutupan harian di atas 74.6, kemudian 76 dan 77.25. Itu akan mengakhiri pergerakan band dan menarik harga kembali ke dalam channel. 🔴 Bearish: penutupan harian di bawah 70.6 membuat band bawah di 68.6 menjadi aktif, dengan level grid 57.4 sebagai referensi yang lebih besar. Jenuh jual bisa tetap jenuh jual. Penutupan kembali di atas rata-rata itulah yang mengubah gambarannya. Apakah Anda sedang memantau $HYPE atau koin lain? #HYPE #Crypto #BinanceSquare #InflasiASMelonjakDanTaruhanKenaikanSukuBungaMeningkat #BitcoinMencapaiTitikTerendahDuaBulanSetelahPemiluParuhWaktuAS #Penjualan Massal Saham Teknologi AI Menghapus 2,5 Triliun dari Nasdaq 100 #DeutscheBankMeluncurkanPenyimpananAsetDigital #Pantauan IHK AS November $HYPEUSDT $BTCUSDT
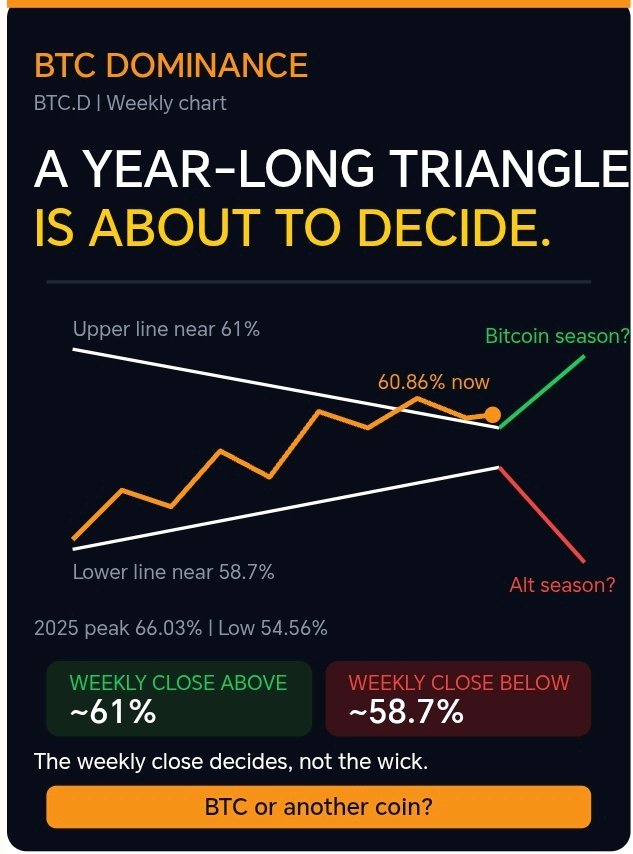
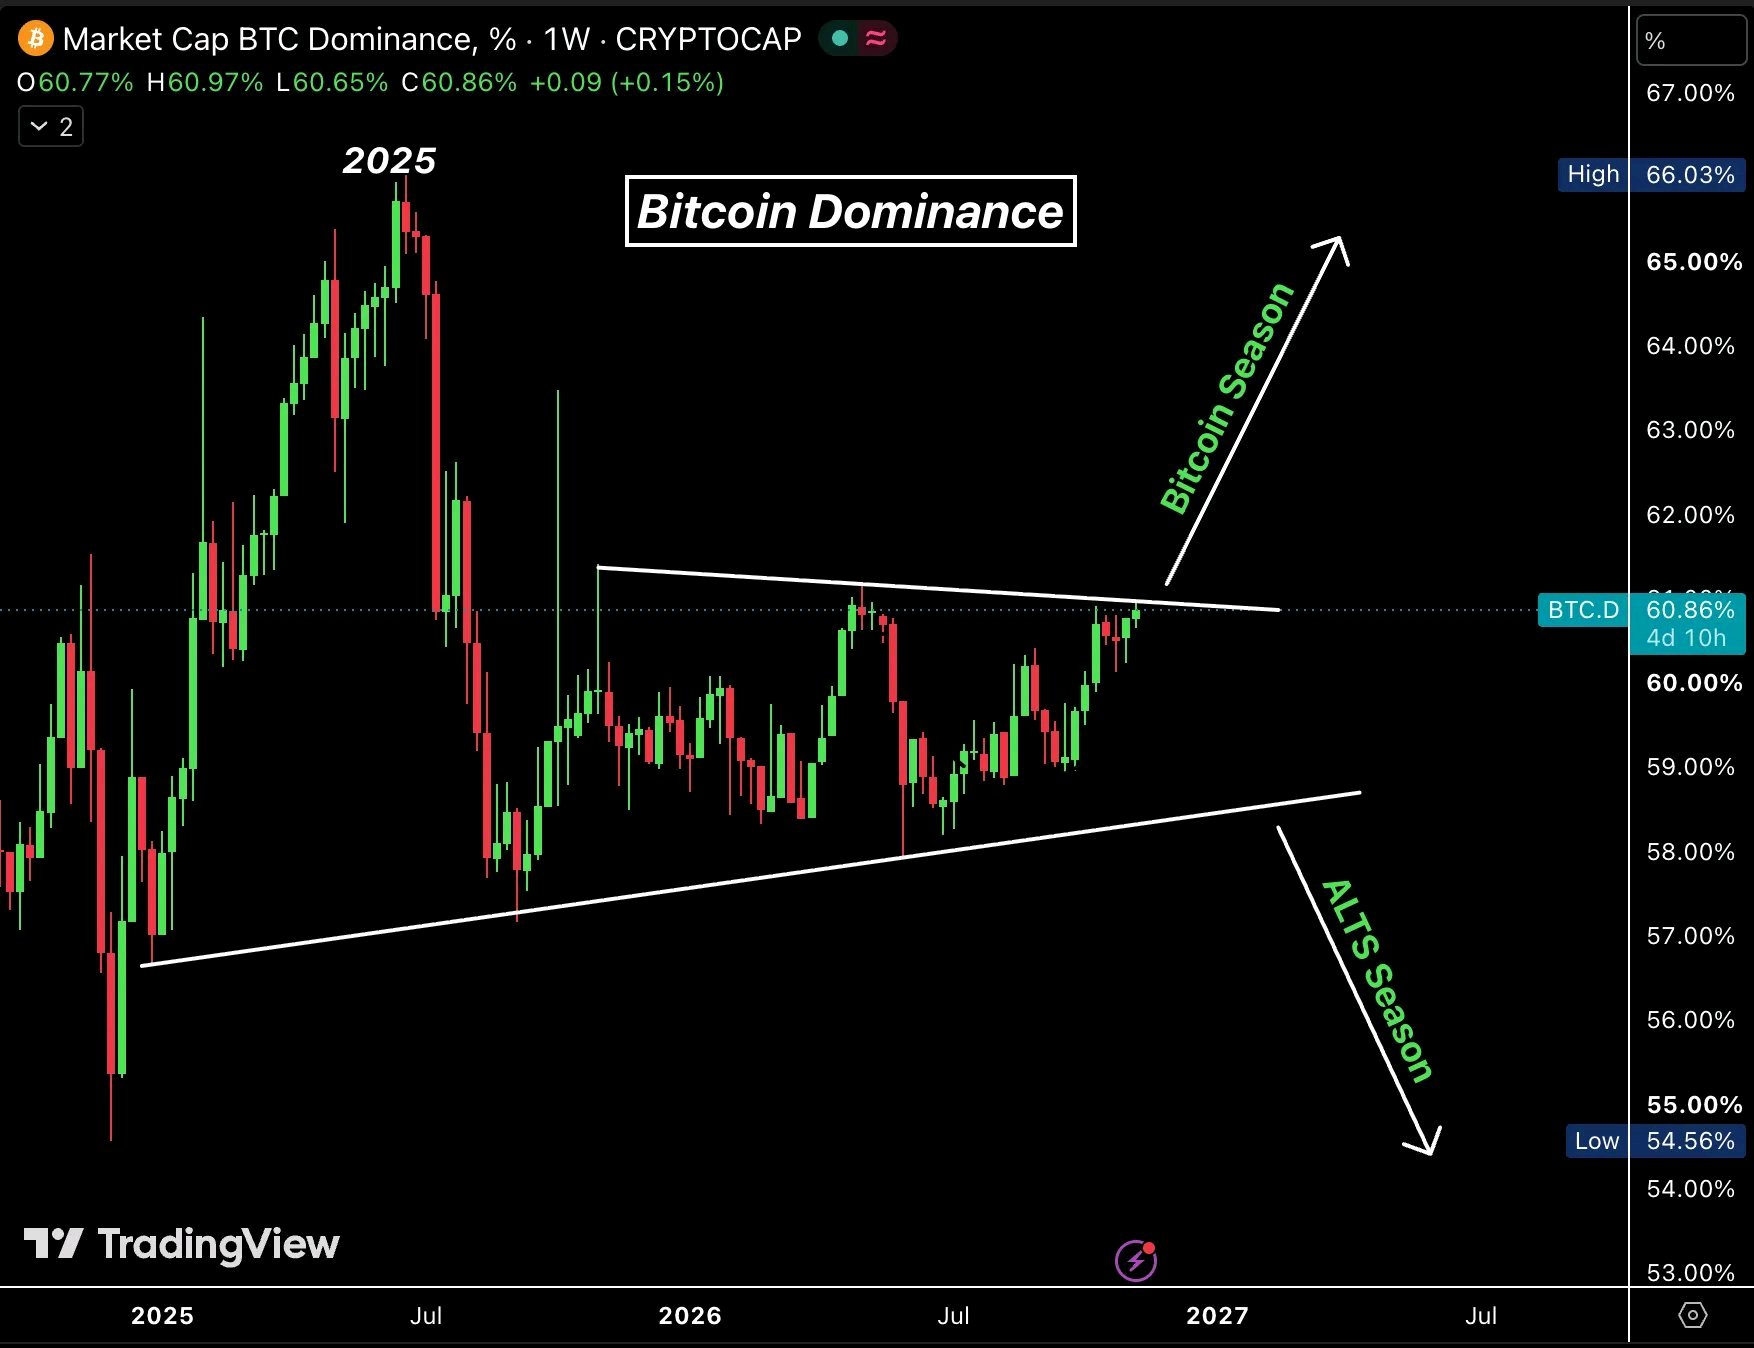
🧭 Bitcoin Dominance is pressing the top of a year-long triangle. I don't want to call Bitcoin season or alt season before the chart decides. I want to see a weekly close outside this triangle, because that's the signal that tells us where the money is rotating. Here's what the weekly BTC.D chart shows: 🔹 The big picture: BTC Dominance peaked at 66.03% in 2025, dropped hard toward the mid 50s (low 54.56%), and has been rebuilding since. 🔹 The triangle: A falling upper line and a rising lower line are squeezing the range. Lower highs on top, higher lows on the bottom. It has been tightening for about a year. 🔹 The test right now: Dominance is at 60.86%, right at the upper line around 61%. The last two weekly candles have pushed into it. 🔹 The lower line: It sits around 58.7% now. That's the floor of the triangle, and it has held every time it's been tested. 🔹 Why it matters: Rising dominance usually means Bitcoin is outperforming the rest of the market. Falling dominance usually means altcoins are catching up. 🟢 Break up: a weekly close above about 61% would suggest Bitcoin is taking more share, with 62% to 63% as the next reference. 🔴 Break down: a weekly close under about 58.7% would suggest money rotating into alts, with the mid 50s as the larger target. Triangles end in a breakout. A weekly close decides it, and this week's close is still a few days away. Are you watching $BTC or another coin? #BTC #Bitcoin #Crypto #BinanceSquare #USInflationRunsHotAndRateHikeBetsRise #BitcoinHitsTwoMonthLowAfterUSMidterms #AITechSelloffErases2Point5TrillionFromNasdaq100 #DeutscheBankLaunchesDigitalAssetCustody #NovUSCPIWatch $BTCUSDT $ETHUSDT
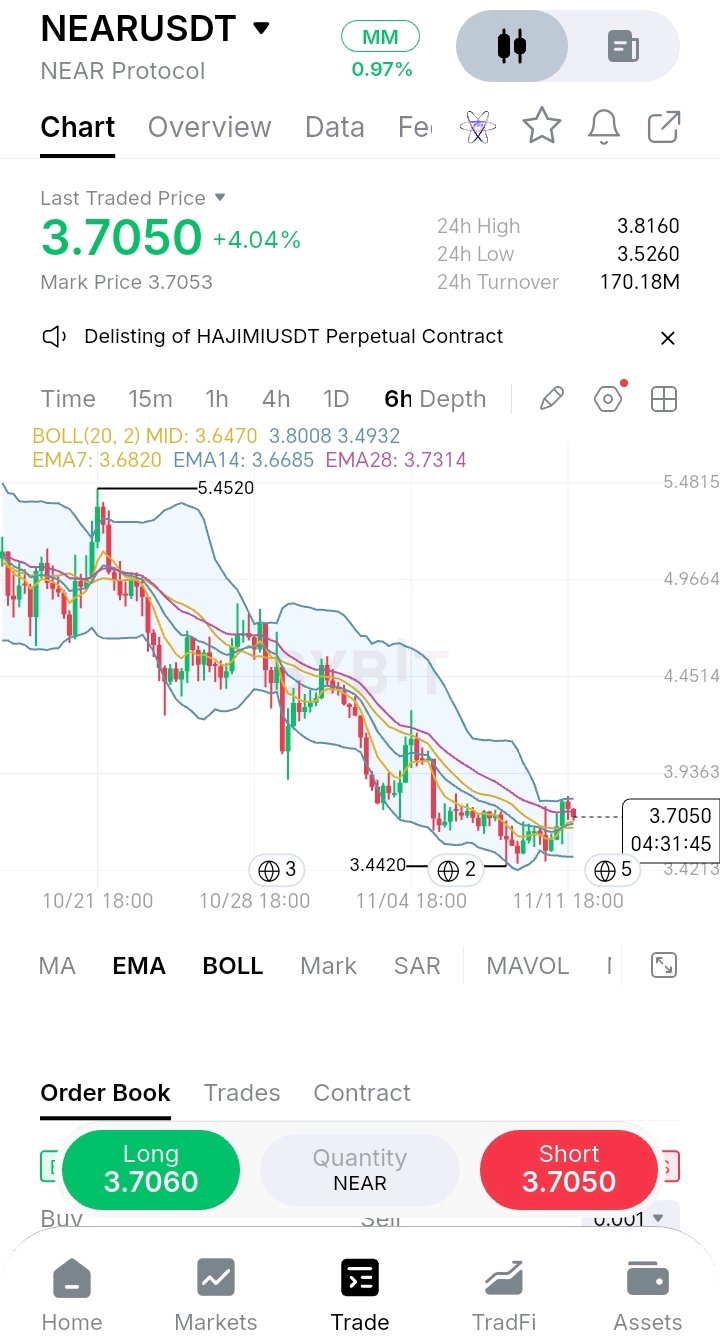
NEAR IS TRYING TO CHANGE ITS DIRECTION A falling market does not reverse in a single candle. It needs to show that buyers are willing to defend a higher price—and NEAR is beginning to show that possibility. On the 6-hour chart, NEAR has recovered to $3.705, gaining around 4.04% over 24 hours. The bigger picture, however, still carries the weight of a decline from the $5.45 region. The recent floor near $3.442 is important because price has bounced from that area rather than continuing lower. There are encouraging signs: price has moved above the Bollinger middle line at $3.647 and the short EMAs around $3.67–$3.68. But the longer EMA near $3.731 is still overhead, making this a test rather than a confirmed trend reversal. THE NEXT PRICE DECISION The $3.80 area is the first serious ceiling. A convincing 6-hour close above it could open a route toward $3.936. If buyers fail there, NEAR may return to the $3.65 region. Below that, $3.493–$3.442 forms the important support area. Losing the recent low would weaken the recovery and bring the broader bearish structure back into focus. My view: NEAR is showing early recovery signals, but confirmation matters more than the green percentage. Watch how price behaves around $3.80 before assuming the downtrend is over. #USInflationRunsHotAndRateHikeBetsRise #BitcoinHitsTwoMonthLowAfterUSMidterms #AITechSelloffErases2Point5TrillionFromNasdaq100 #DeutscheBankLaunchesDigitalAssetCustody #NovUSCPIWatch $NEARUSDT $HYPEUSDT

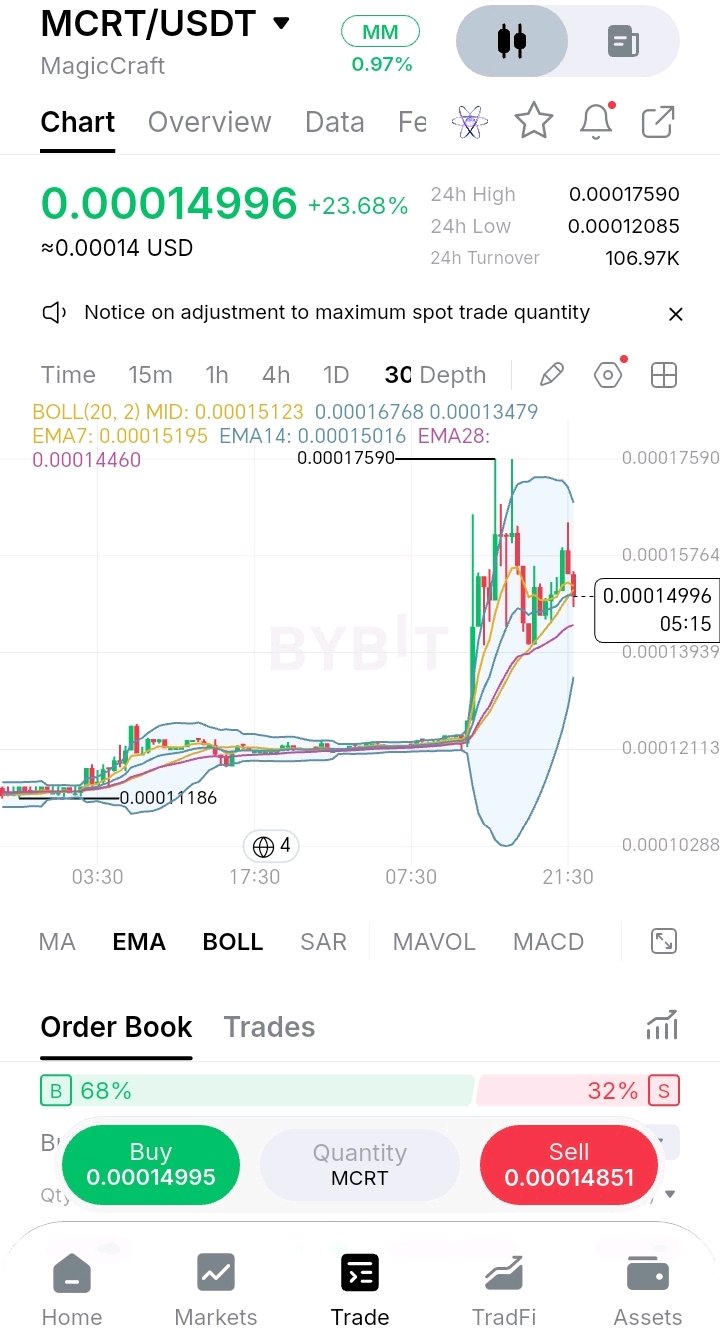
⚡ Pump, pullback, and now the hard part. I don't want to chase a vertical candle on $MCRT, especially on a market this thin. I want to see how price handles the 0.000145 area, because that's where the post-pump structure either holds or cracks. Here's what the 30m chart shows: 🔹 The pump: After hours of sleepy sideways trading around 0.000112 to 0.000125, price shot straight up to 0.00017590. That's a move of roughly 40%+ from the base, in a handful of candles. 🔹 The pullback: Price gave back about 15% from the top and has been chopping between roughly 0.000135 and 0.000157 with large wicks in both directions. 🔹 The averages: EMA7 0.00015195, EMA14 0.00015016, EMA28 0.00014460. Price is sitting right on top of the short ones and slightly above EMA28, so it's testing short-term support. 🔹 Bollinger: Upper 0.00016768 | Mid 0.00015123 | Lower 0.00013479. The bands flared hard during the spike and are still wide, which means volatility is high. 🔹 The order book: Bids are around 68% vs 32% asks, a buyer-leaning lean, but on a coin this small it can flip in minutes. 🔹 The liquidity: 24H turnover is only 106.97K. That's very thin, so price can move fast in both directions and slippage can be large. 🟢 Bullish: a 30m close above 0.00016768, then a retest of the 0.00017590 high. 🔴 Bearish: a close under 0.00014460 (EMA28), then 0.00013479 (lower band). A full round trip would target the 0.000112 to 0.000125 base. Pumps on thin markets give back as fast as they arrive. Size small, and respect the stop. Are you watching $MCRT or another coin? #MCRT #Crypto #BinanceSquare #WSOT2026 #USInflationRunsHotAndRateHikeBetsRise #BitcoinHitsTwoMonthLowAfterUSMidterms #AITechSelloffErases2Point5TrillionFromNasdaq100 #DeutscheBankLaunchesDigitalAssetCustody $MCRTUSDT $BTCUSDT

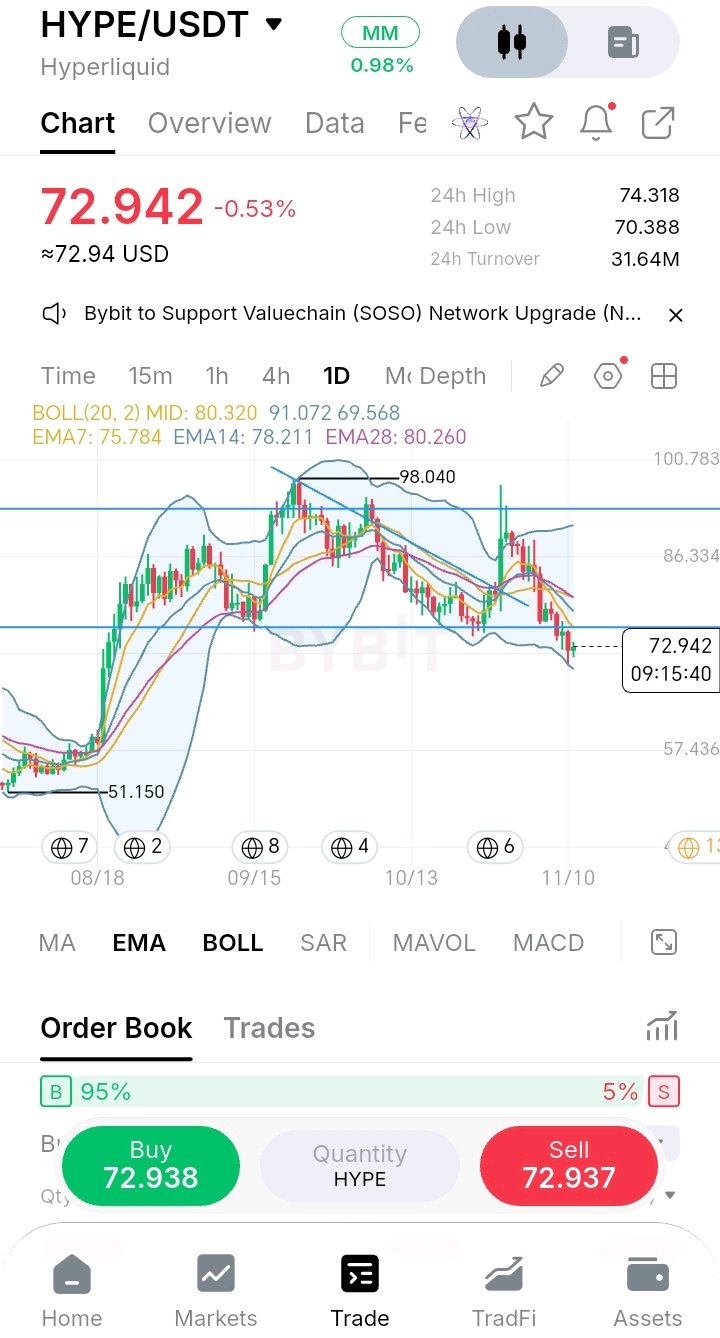
👀 Buku order menunjukkan 95% pembeli. Namun, grafik harian tetap menyarankan untuk berhati-hati. Saya tidak ingin hanya mengandalkan buku order yang timpang pada $HYPE. Saya ingin melihat harga merebut kembali area 75,8 pada penutupan harian, karena di situlah grafik akan mulai sejalan dengan penawaran (bids). Inilah yang ditunjukkan oleh grafik harian: 🔹 Buku order: Penawaran (bids) sekitar 95% vs 5% permintaan (asks). Itu terlihat bullish, tetapi buku order hanyalah sebuah snapshot. Order yang sedang menunggu (resting orders) dapat ditarik atau terpenuhi dalam hitungan detik, jadi itu hanyalah petunjuk, bukan sinyal. 🔹 Tren: Harga berada di bawah setiap rata-rata. EMA7 adalah 75,78, EMA14 78,21, EMA28 80,26, dan pita tengah Bollinger berada di 80,32. Semuanya melandai ke bawah. 🔹 Pita (Band): Bollinger bawah berada di 69,57 dan harga diperdagangkan mendekatinya. Harga terendah 24 jam adalah 70,388, dengan pemantulan ke 72,94 sejak saat itu. 🔹 Struktur: Setelah puncak 98,04, harga membuat lower high (titik tertinggi yang lebih rendah), menembus di bawah support horizontal di dekat 76, dan belum berhasil merebutnya kembali. Garis itu sekarang menjadi resistance (overhead). 🔹 Aktivitas: Turnover 24 jam adalah 31,64 juta, jauh lebih tenang daripada sesi-sesi berat saat breakdown terjadi. Tekanan jual telah mendingin. 🟢 Bullish: penutupan harian di atas 75,8 (EMA7), lalu 76 dan 78,2. Itu akan menjadi tanda grafik akhirnya sejalan dengan penawaran. 🔴 Bearish: penutupan harian di bawah 70,4 dan pita bawah di dekat 69,6 membuka jalan menuju level grid 57,4. Ketika buku order dan grafik tidak sejalan, penutupan grafik biasanya yang menang. Apakah Anda sedang memantau $HYPE atau koin lainnya? #HYPE #Kripto #BinanceSquare #Penjualan Massal Saham Teknologi AI Menghapus 2,5 Triliun dari Nasdaq 100 #InflasiASMelonjakDanTaruhanKenaikanSukuBungaMeningkat #BitcoinMencapaiTitikTerendahDuaBulanSetelahPemiluParuhWaktuAS #DeutscheBankMeluncurkanPenyimpananAsetDigital #Pantauan IHK AS November $HYPEUSDT $BTCUSDT

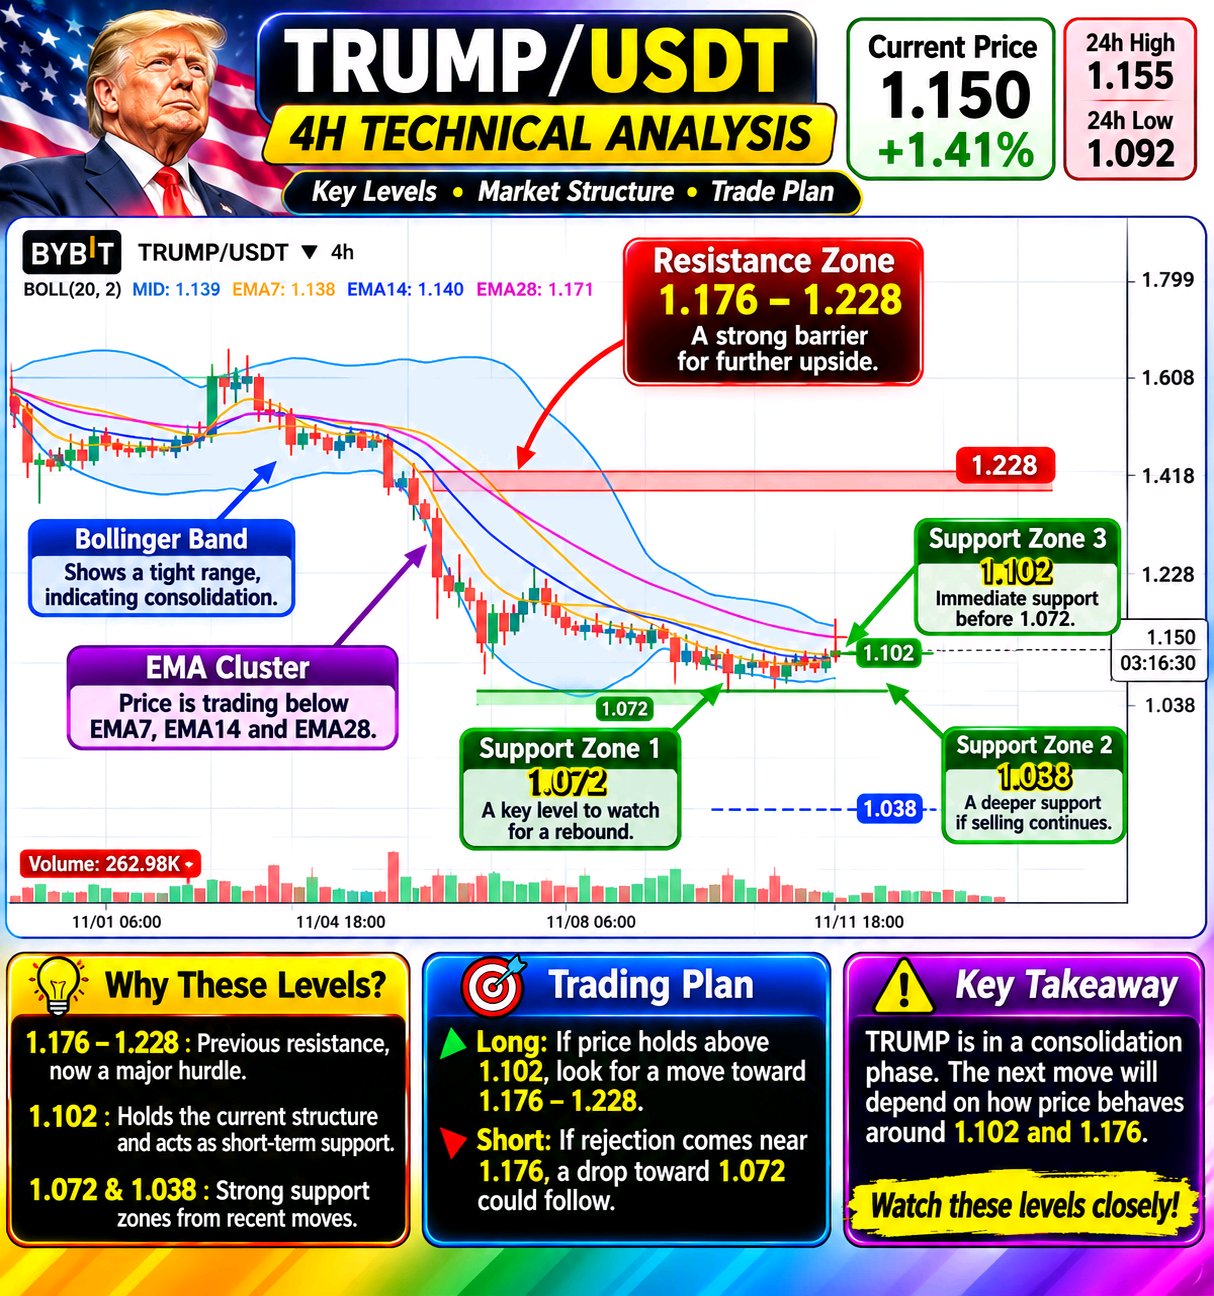
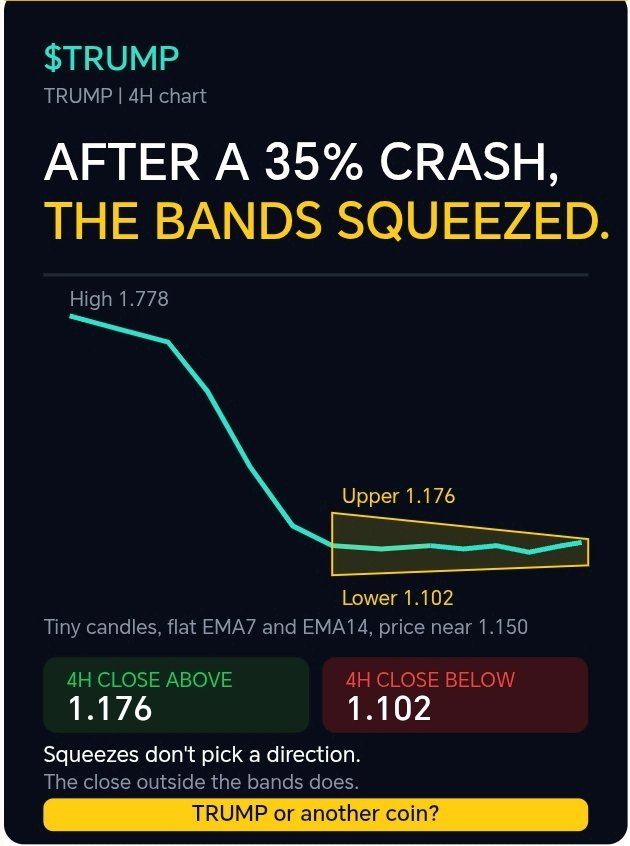
🗜️ After a 35% crash, the Bollinger Bands have squeezed to almost nothing. I don't want to guess the direction of $TRUMP while it's this compressed. I want to see a 4H close outside the bands, because that's usually where the next real move starts. Here's what the 4H chart shows: 🔹 The crash: $TRUMP fell from 1.778 down to the 1.09 area, about 35%, in a sharp slide with only small bounces. 🔹 The silence: Since then, candles have turned tiny and price has crawled sideways for days. The big drop has been followed by almost no movement. 🔹 The squeeze: Bollinger Bands are very tight. Upper 1.176 | Mid 1.139 | Lower 1.102. That's less than a 7% gap between the top and bottom band, which is narrow after such a big move. 🔹 The averages: EMA7 1.138 and EMA14 1.140 are flat and nearly overlapping, with price just above them. EMA28 at 1.171 sits slightly overhead and is the first real hurdle. 🔹 The range: 24H high 1.155 and low 1.092, with turnover at 19.91M. The 1.092 wick is the floor of the last few days. 🔹 The distance up: The old resistance zone near the 1.70s is far above, so any recovery has a long way to go. 🟢 Bullish: a 4H close above 1.171 to 1.176 breaks the squeeze to the upside, with 1.228 as the next marked level. 🔴 Bearish: a 4H close under 1.102 and then 1.092 would break the floor, with 1.038 on the chart below. Squeezes don't pick a direction. The close outside the bands does. Are you watching $TRUMP or another coin? #TRUMP #Crypto #BinanceSquare #WSOT2026 #USInflationRunsHotAndRateHikeBetsRise #BitcoinHitsTwoMonthLowAfterUSMidterms #AITechSelloffErases2Point5TrillionFromNasdaq100 #DeutscheBankLaunchesDigitalAssetCustody $TRUMPUSDT $HYPEUSDT
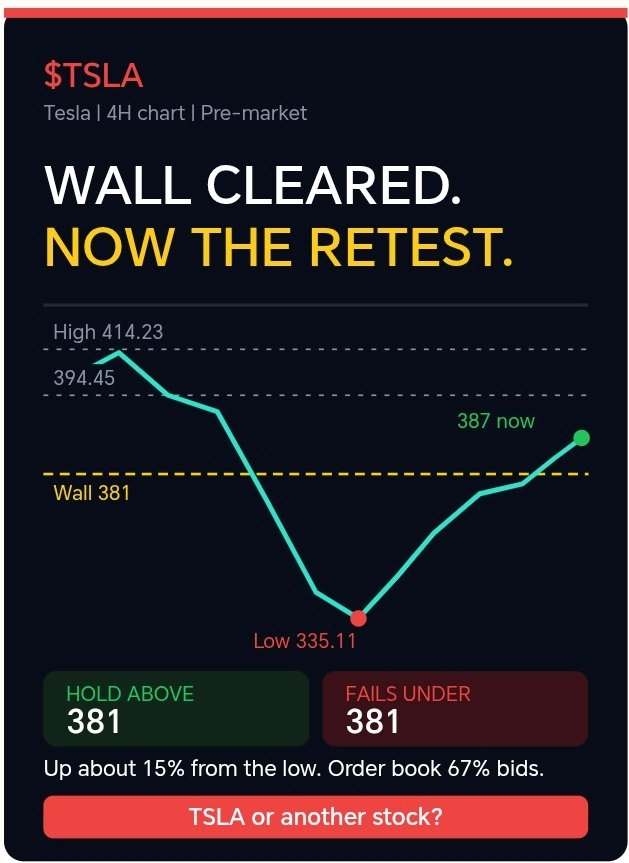
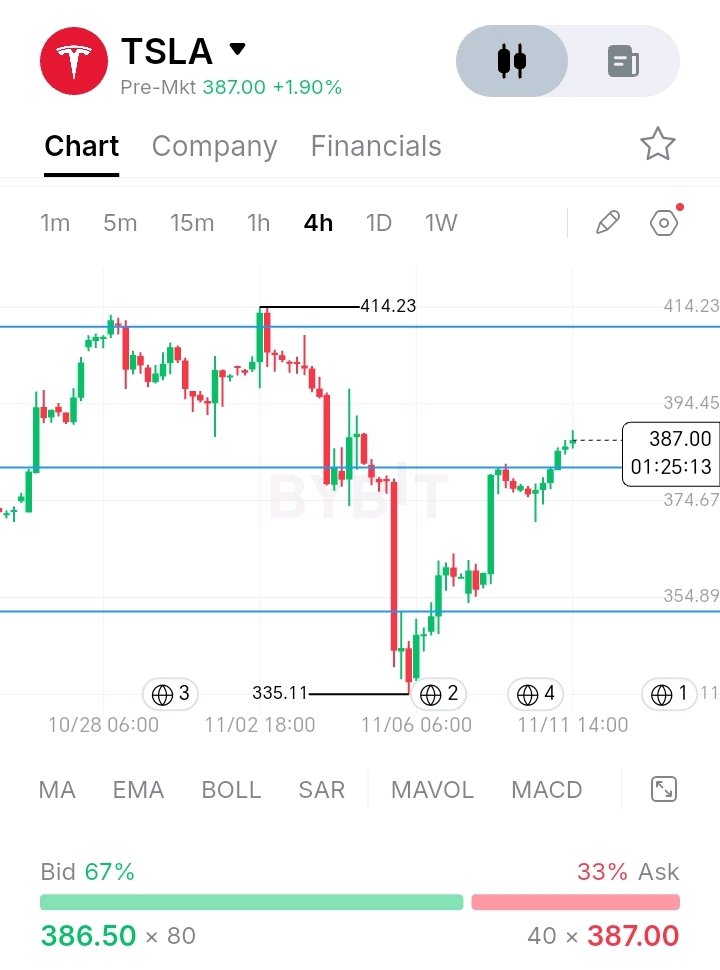
🧗 The wall is cleared in pre-market. Now comes the harder part. I don't want to celebrate $TSLA's recovery before it proves itself. I want to see 4H closes holding above the 381 line, because a level only turns into support after it survives a retest. Here's what the 4H chart shows: 🔹 The recovery: From the 335.11 low, $TSLA has climbed about 15%, higher lows and strong green candles the whole way. It has regained about two-thirds of the drop from 414.23. 🔹 The wall: The 381 line stopped price several times before. Pre-market price is now above it, and that's the first real break of the recovery. 🔹 The next levels: 394.45 sits just above on the chart, with the 414.23 high as the larger reference. That's about 7% above the current pre-market price. 🔹 The order book: Bids are around 67% vs 33% asks, a buyer-heavy lean. Pre-market books are thin, so it's a hint rather than proof. 🔹 The risk: After a fast 15% rebound, price often pulls back to test the level it just cleared. That retest is what decides whether 381 is now support. 🟢 Bullish: 4H closes holding above 381, then 394.45 and 414.23. A shallow pullback to 381 that holds would be a strong sign. 🔴 Bearish: a 4H close back under 381 makes this a failed reclaim, with 352 and the 335.11 low below. The breakout is the first step. The retest is the real test. TSLA or another stock? #TSLA #Stocks #BinanceSquare #WSOT2026 #WSOTPicktoEarn10U #USPayrollsAndRateDecisionsDriveMacroWeek #OilVolatilityTracksIranPeaceTalks #BybitAIEvolving $TSLAXUSDT$BTCUSDT
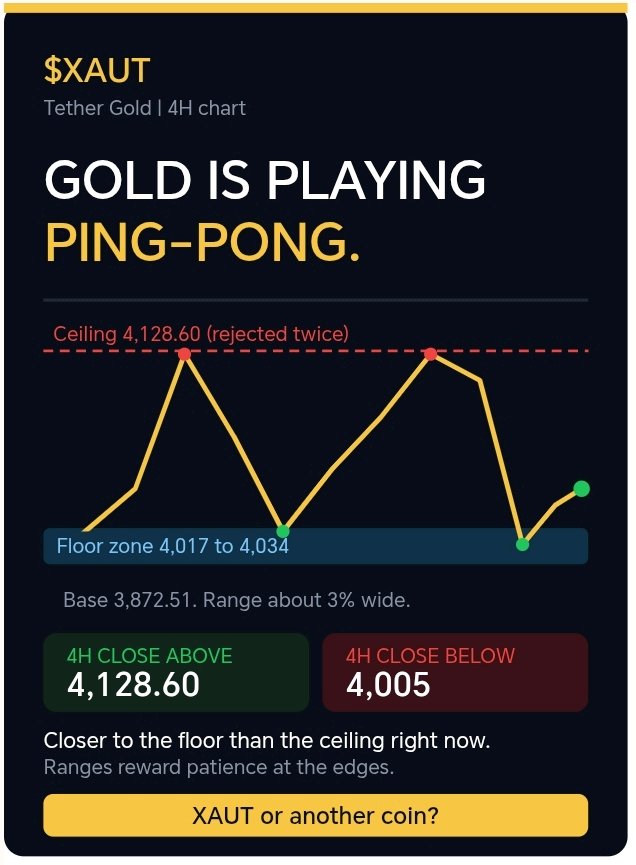
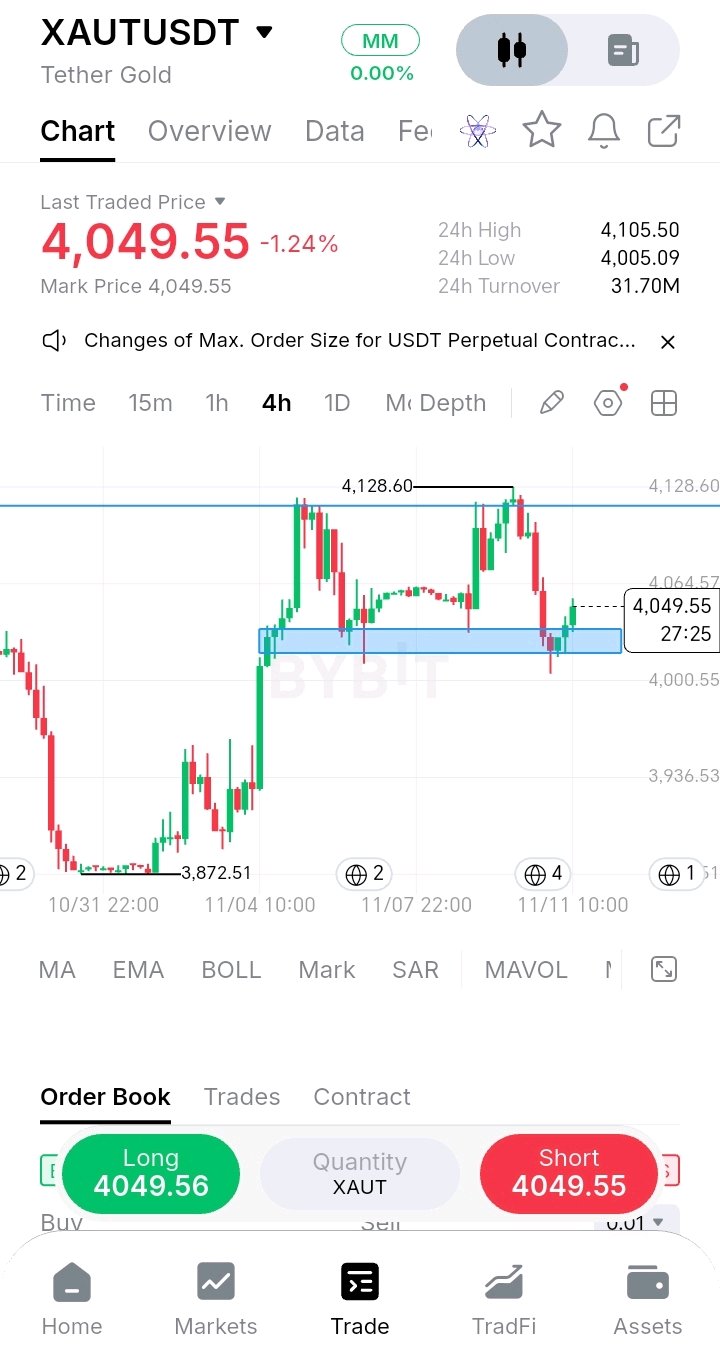
🏓 Emas sedang main ping-pong, dan kedua batasnya terus tersentuh. Saya tidak mau trading di tengah rentang $XAUT ini. Saya ingin melihat batas mana yang tembus duluan pada penutupan candle 4 jam: di atas 4.128,60 atau di bawah 4.005. Inilah yang ditunjukkan oleh chart 4 jam: 🔹 Batas atas: Emas bergerak dari 3.872,51 naik ke level 4.120-an dan telah dua kali ditolak di dekat langit-langit, dengan harga tertinggi terakhir di 4.128,60. 🔹 Batas bawah: Setelah setiap penolakan, harga turun ke zona biru di sekitar 4.017 hingga 4.034, di mana pembeli mulai masuk. Sumbu candle terakhir bahkan sempat turun ke 4.005,09 sebelum kembali pulih. 🔹 Rentang: Sekitar 4.005 hingga 4.128, lebarnya sekitar 3%. Emas telah bergerak bolak-balik di dalamnya beberapa kali. 🔹 Pantulan: Harga berada di 4.049,55, sekitar 1% di atas zona tersebut dan 2% di bawah langit-langit. Harganya lebih dekat ke batas bawah, jadi risiko dan imbal hasilnya condong ke arah lantai saat ini. 🔹 Aktivitas: Turnover 24 jam sebesar 31,70 juta dengan rentang 24 jam di 4.005,09 hingga 4.105,50. Pergerakannya cepat namun tertahan. 🟢 Bullish: penutupan 4 jam di atas 4.128,60 menembus langit-langit untuk pertama kalinya. Swing high 4.208,90 dari sebelumnya akan menjadi referensi berikutnya. 🔴 Bearish: penutupan 4 jam di bawah 4.005 menembus lantai, dan level 3.936 serta 3.872 akan terlihat. Rentang harga menghargai kesabaran di batas-batasnya. Breakout adalah tempat di mana pergerakan sebenarnya dimulai. Apakah Anda sedang memantau $XAUT atau koin lain? #XAUT #Emas #Kripto #BinanceSquare #WSOT2026 #WSOTPicktoEarn10U #Data Penggajian AS dan Keputusan Suku Bunga Mendorong Pekan Makro #Volatilitas Minyak Melacak Pembicaraan Perdamaian Iran #BybitAIEvolving $XAUTUSDT $BTCUSDT
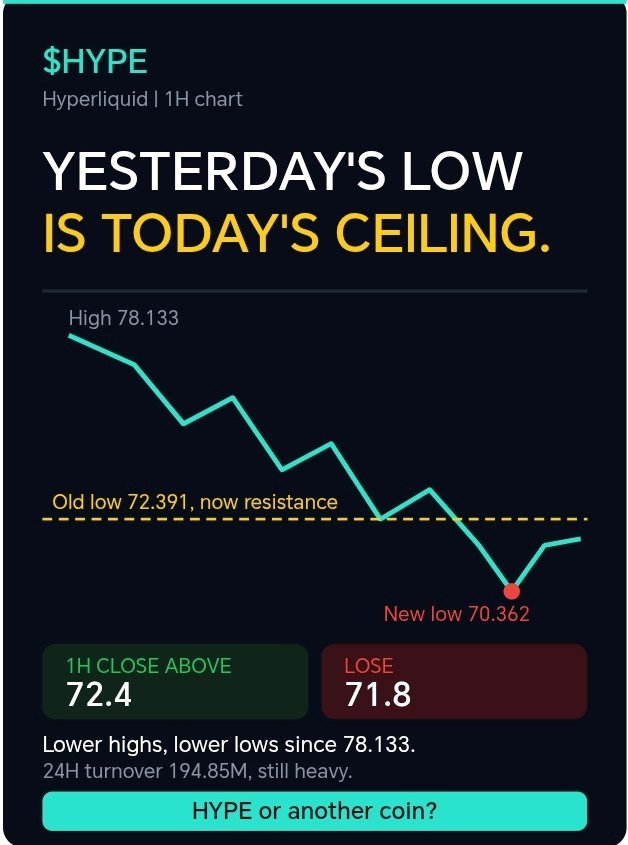
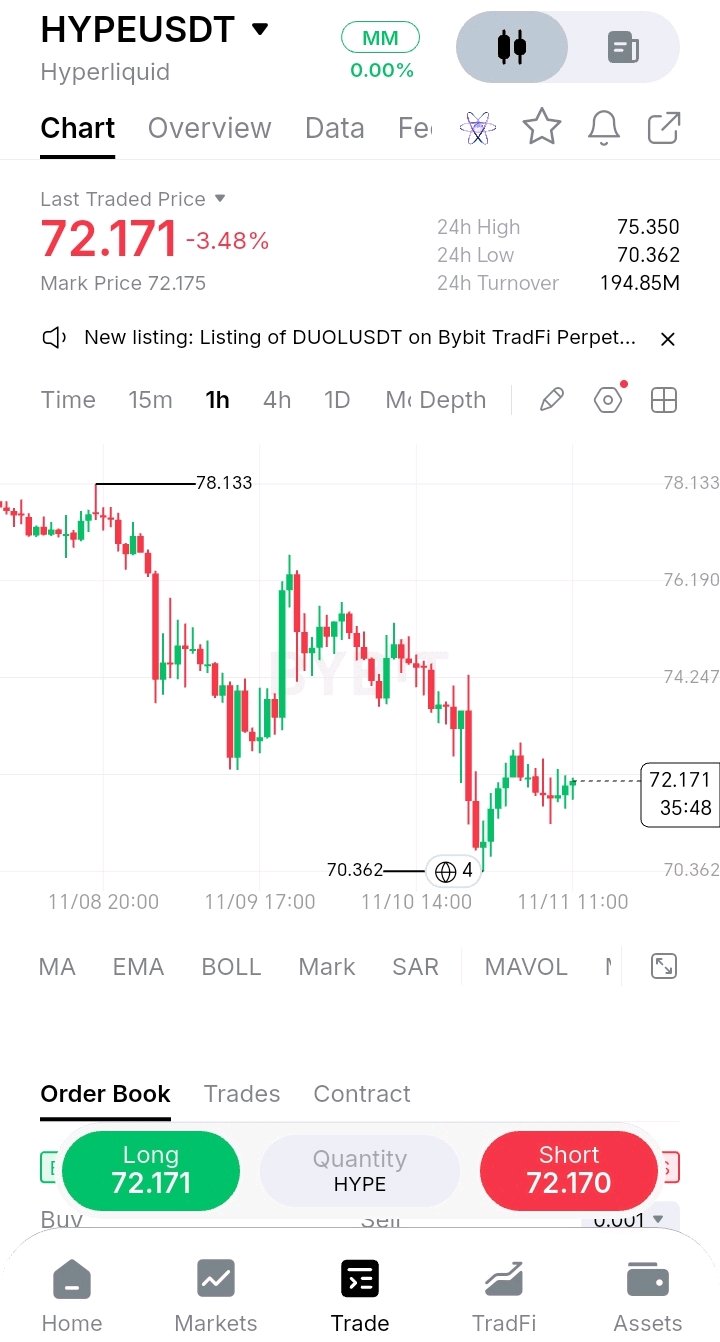
🔄 Low kemarin adalah langit-langit hari ini. Saya tidak mau membeli $HYPE hanya karena harganya memantul dari low baru. Saya ingin melihat close 1 jam di atas 72.4, karena di situlah low sebelumnya kini bertindak sebagai resistance. Inilah yang ditunjukkan chart 1 jam: 🔹 Pola tangga: Dari 78.133, $HYPE membentuk rangkaian jelas lower highs dan lower lows. Pantulan menuju 76.5 di-sell, dan pantulan berikutnya di dekat 75.4 juga di-sell kembali. 🔹 Low baru: Harga tertekan turun ke 70.362, di bawah low 72.391 dari hari sebelumnya. Itu adalah penembusan bersih dari lantai sebelumnya. 🔹 Pantulan: Setelah low baru, harga pulih ke sekitar 72.9 dan bergerak sideways dalam candle-candle kecil antara kisaran 71.8 dan 72.9. 🔹 Tumpang tindih (Overlap): Low lama di 72.391 berada tepat di dalam kisaran tersebut, tepat di atas harga saat ini. Itu adalah level pertama yang perlu direbut kembali oleh pembeli. 🔹 Aktivitas: Turnover 24 jam sebesar 194.85M, masih berat. Pasar memperhatikan area ini. 🟢 Bullish: close 1 jam di atas 72.4, lalu 73.0 dan 74.2. Hal itu akan mengubah pantulan dari sekadar jeda menjadi upaya pemulihan yang nyata. 🔴 Bearish: penurunan di bawah 71.8 membuat low 70.362 kembali dalam jangkauan, dan penembusan di level itu memperpanjang pola tangga. Lantai yang tembus sering kali kembali menjadi langit-langit. Retest pertama memberitahu Anda pihak mana yang memegang kendali. Apakah Anda sedang memantau $HYPE atau koin lain? #HYPE #Crypto #BinanceSquare #WSOT2026 #WSOTPicktoEarn10U #Data Penggajian AS dan Keputusan Suku Bunga Mendorong Pekan Makro #Volatilitas Minyak Melacak Pembicaraan Perdamaian Iran #BybitAIEvolving $HYPEUSDT $BTCUSDT
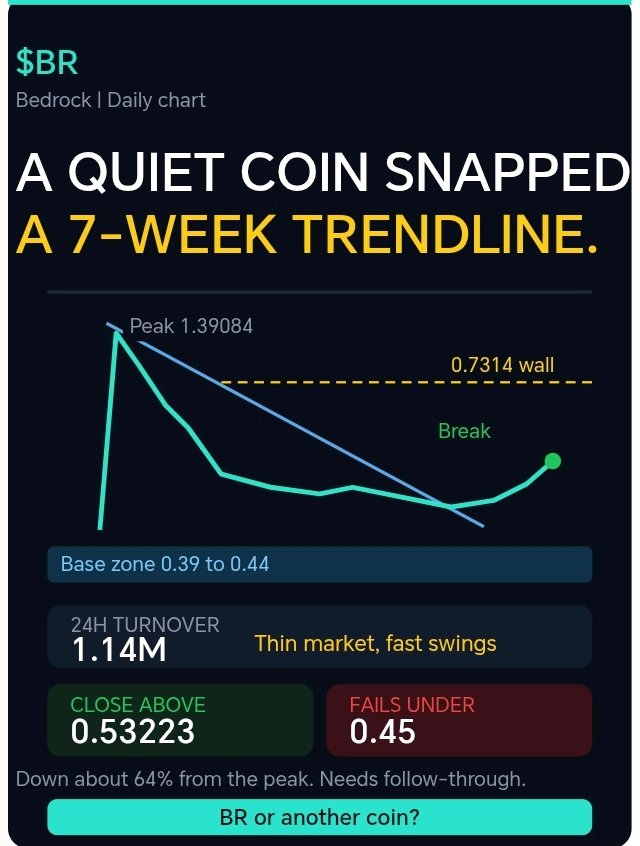
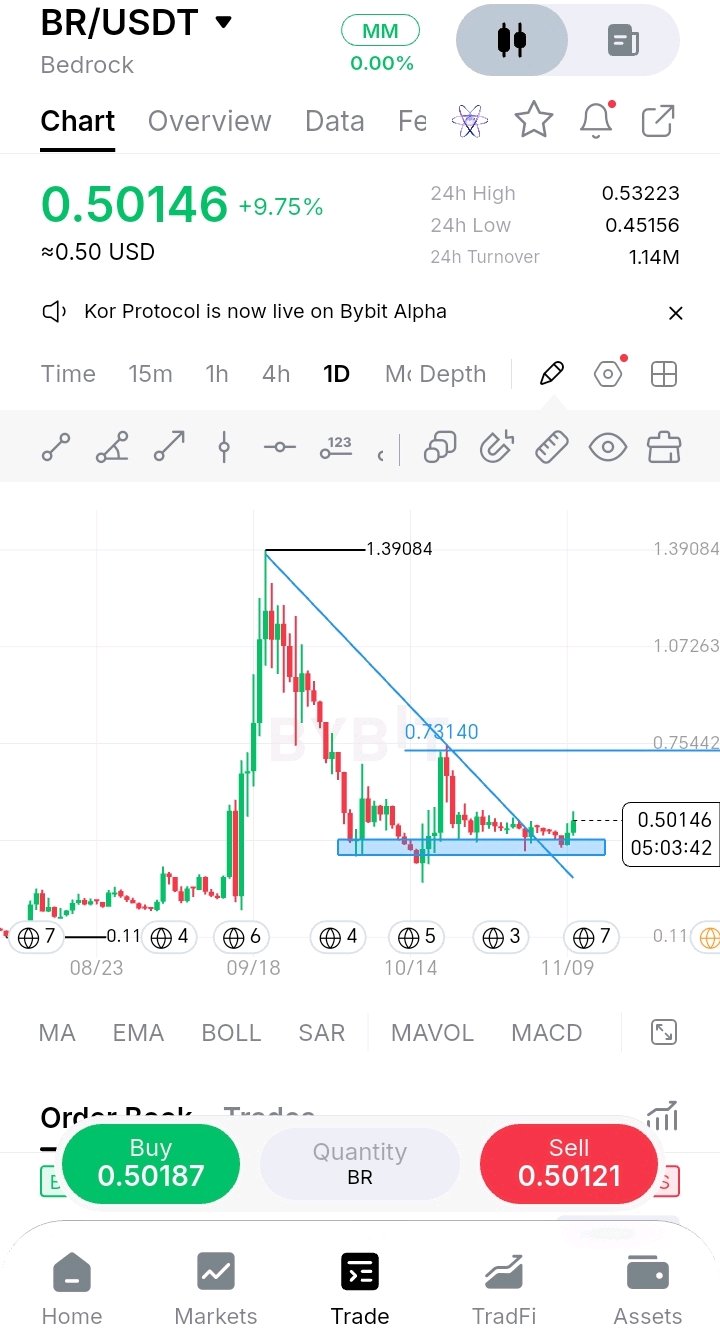
🧨 A quiet coin just snapped a 7-week trendline. I don't want to chase a +9.75% candle on $BR without checking the context. I want to see price hold above the broken trendline on a daily close, and then clear 0.53 with real follow-through. Here's what the daily chart shows: 🔹 The crash: $BR peaked at 1.39084 in September, then dropped about 64% in a steady slide. 🔹 The base: Since mid-October, price has moved sideways in a blue zone roughly between 0.39 and 0.44, with a deeper wick near 0.30 that was bought back fast. That kind of base means sellers are running out of steam. 🔹 The break: Today's green candle pushed through the descending trendline drawn from the 1.39 peak. It's the first break of that downtrend structure. 🔹 The range today: 24H high 0.53223 and low 0.45156, so the move came from a clean bounce off the base. 🔹 The liquidity: 24H turnover is only 1.14M. That's a thin market, which means price can swing fast in both directions. 🔹 The wall above: The 0.7314 level is the previous rejection high and sits roughly 46% above here. A lot has to go right before price gets there. 🟢 Bullish: a daily close above 0.53223 with the trendline break holding. Then 0.7314 becomes the next big reference. 🔴 Bearish: a close back under the 0.45 area would turn this into a failed breakout, with the 0.39 to 0.44 zone and the 0.30 wick below. A trendline break after a long base can matter, but on a thin market it needs follow-through. Are you watching $BR or another coin? #BR #Bedrock #Crypto #BinanceSquare #NovUSCPIWatch #WSOTPicktoEarn10U #USPayrollsAndRateDecisionsDriveMacroWeek #OilVolatilityTracksIranPeaceTalks #BybitAIEvolving $BRUSDT $BTCUSDT
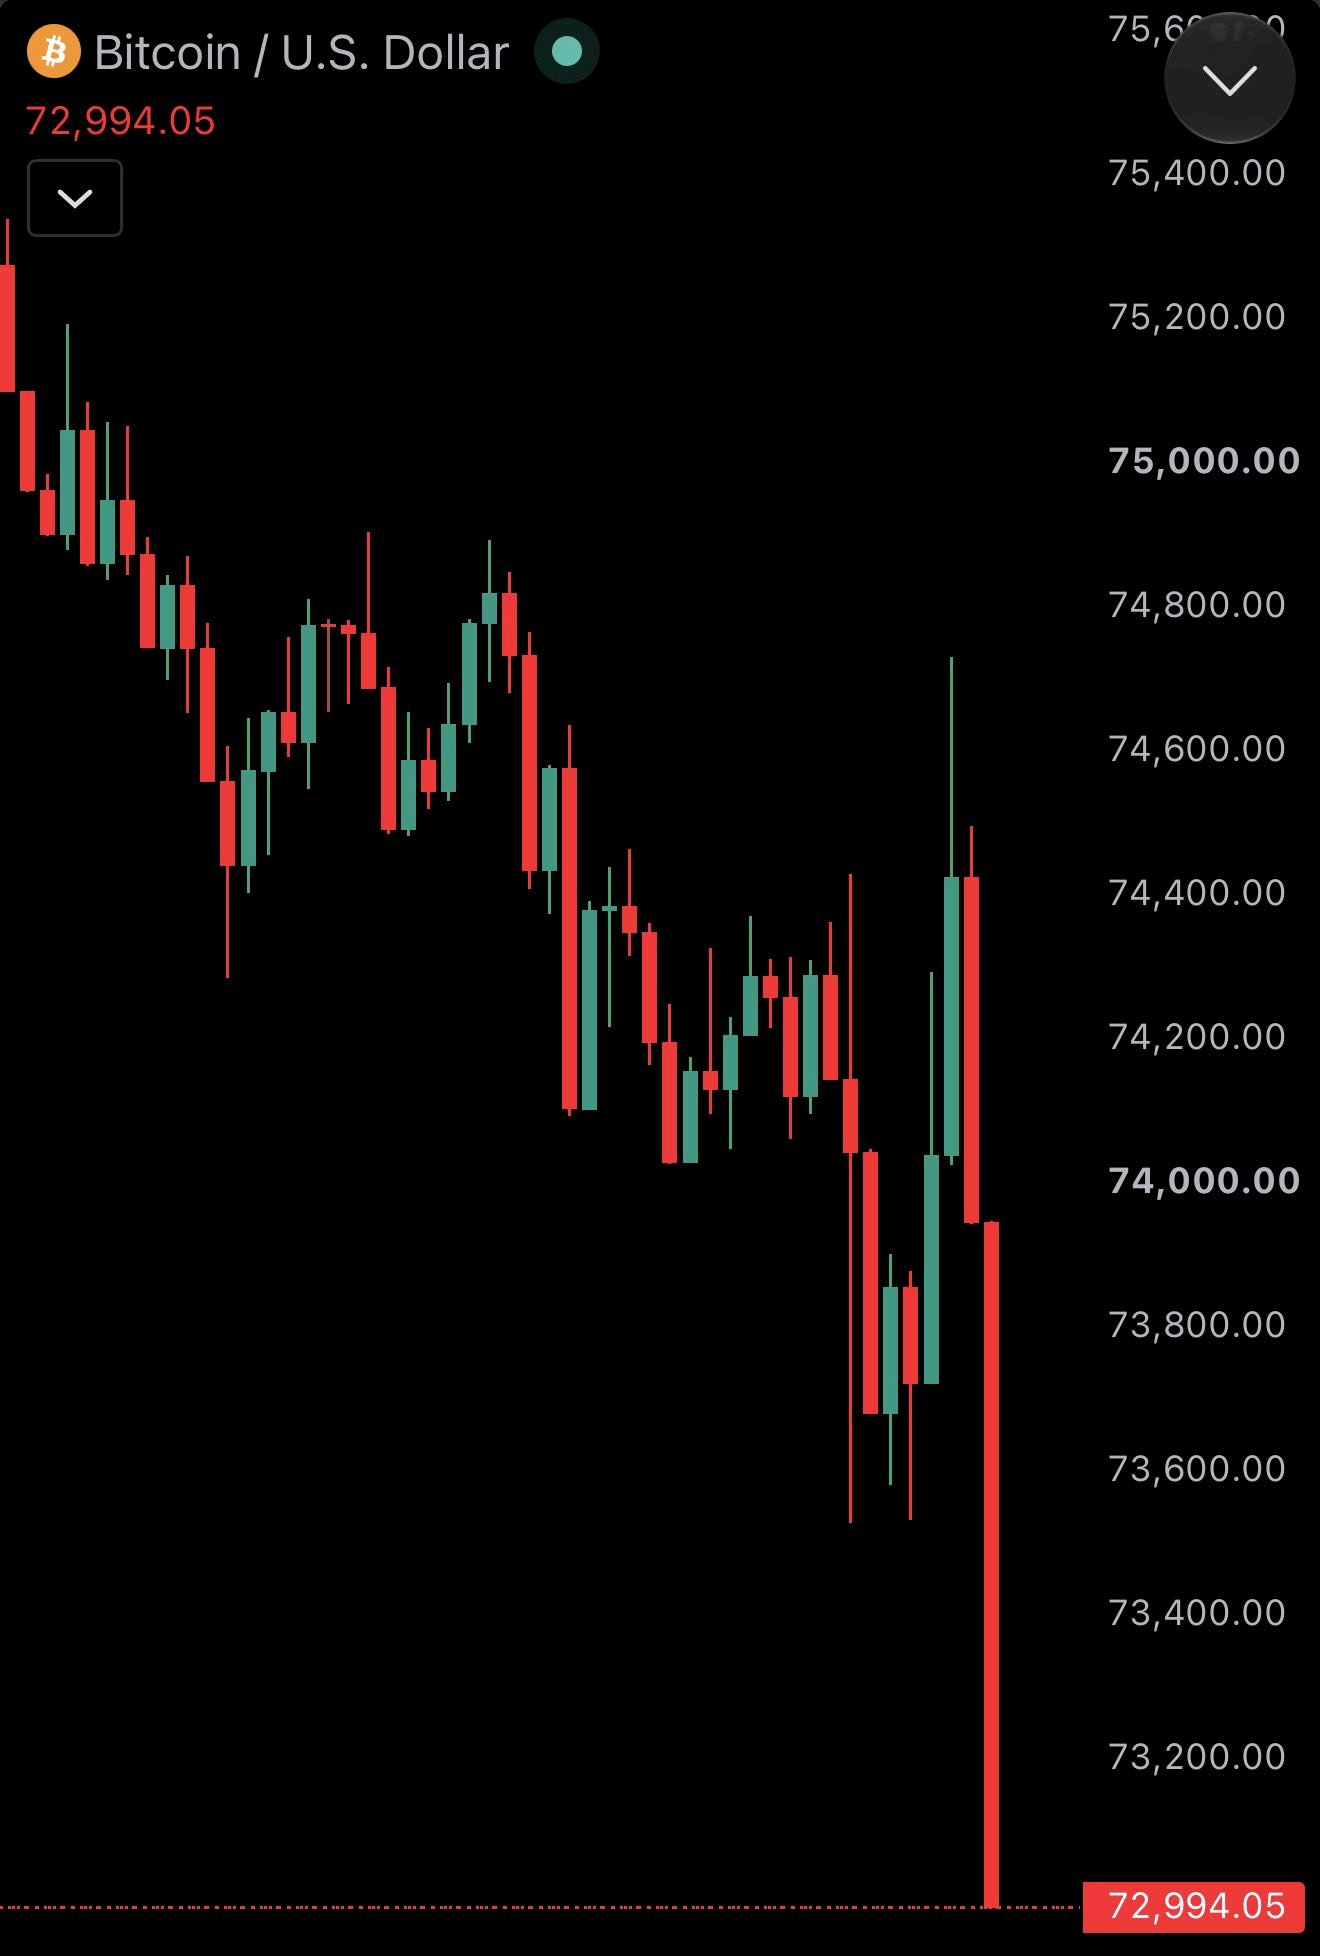
TERBARU: Bitcoin jatuh di bawah $73.000 Posisi long kripto senilai $200.000.000 dilikuidasi dalam 15 menit terakhir. #Pantauan IHK AS November #WSOTPicktoEarn10U #Data Penggajian AS dan Keputusan Suku Bunga Mendorong Pekan Makro #Volatilitas Minyak Melacak Pembicaraan Perdamaian Iran #BybitAIEvolving $BTCUSDT $SOLUSDT
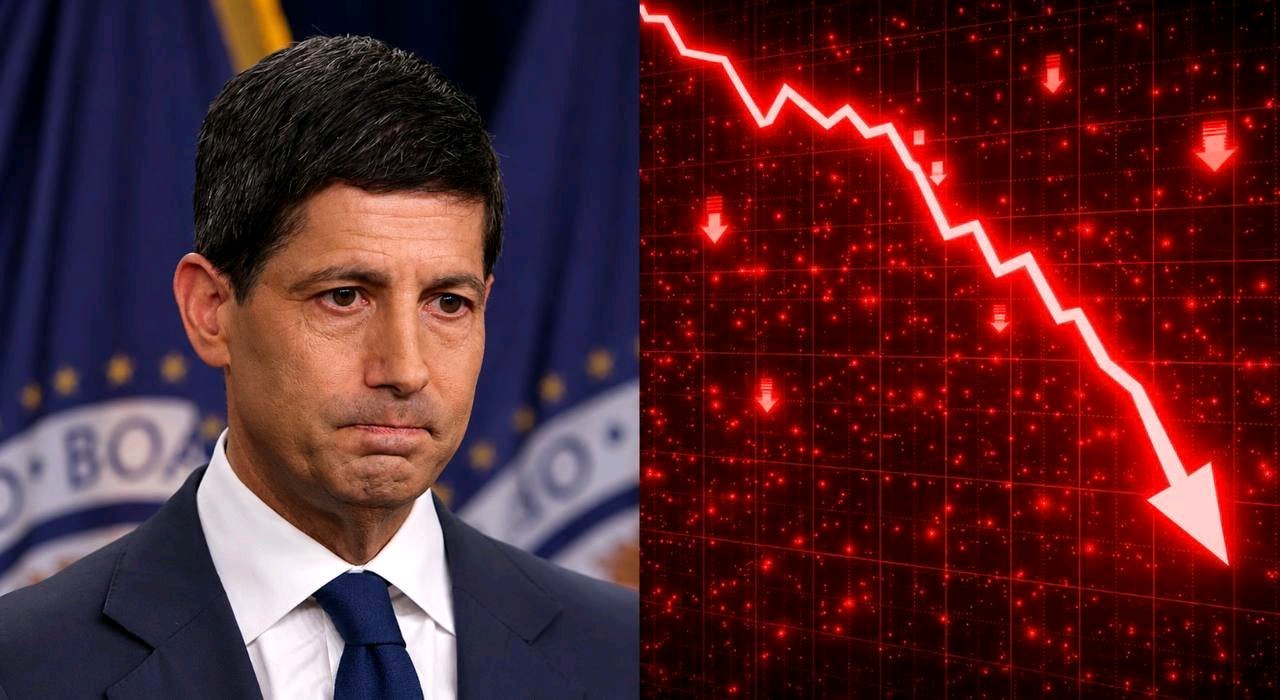
🚨 KENAIKAN SUKU BUNGA FED KINI HAMPIR PASTI Data inflasi AS telah dirilis, dan sekali lagi angkanya lebih tinggi dari perkiraan. CPI AS naik 0,4% MoM, sementara CPI Inti naik 0,3% MoM. Minggu lalu, data pekerjaan sudah keluar lebih baik dari perkiraan, yang berarti kekhawatiran terbesar The Fed saat ini adalah inflasi. Jadi, kenaikan suku bunga sudah pasti, dan satu-satunya hal yang harus dipikirkan The Fed sekarang adalah apakah kenaikannya 25 bps atau 50 bps. #Pantauan IHK AS November #WSOTPicktoEarn10U #Data Penggajian AS dan Keputusan Suku Bunga Mendorong Pekan Makro #Volatilitas Minyak Melacak Pembicaraan Perdamaian Iran #BybitAIEvolving $ETHUSDT $HYPEUSDT
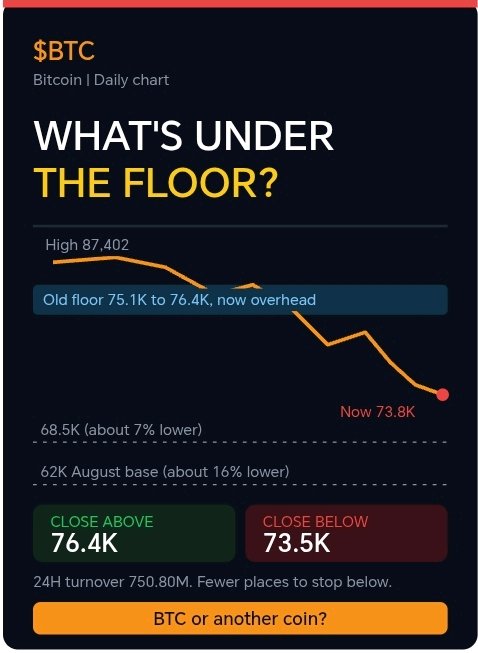
🕳️ What's under the floor? I don't want to guess where $BTC bottoms. I want to see how price reacts around 73.5K, and whether it can reclaim the 75.1K to 76.4K zone on a daily close. Here's what the daily chart shows: 🔹 The old floor: The blue zone around 75.1K to 76.4K is where the big August rally launched from. It held through September and most of October, with buyers stepping in every time. 🔹 The break: Price is now trading below it, and the last few daily candles sit under the zone without reclaiming it. A three-month floor has become overhead supply. 🔹 The pressure: The 24H range is 73,522.9 to 75,578.1, with turnover at 750.80M. That's more activity than the previous sessions, so sellers have conviction. 🔹 The distance: From 73.8K, the next marked grid level on the chart is around 68.5K, roughly 7% lower. The August base sits near 62K, about 16% lower. Very little structure sits in between. 🔹 The peak: Price is about 15% below the 87,401.9 high, and the structure has made lower highs since. 🟢 Bullish: a daily close back above 76.4K turns this into a failed breakdown and can force a fast bounce. 🔴 Bearish: a daily close under 73.5K opens the road toward 68.5K, with the August base near 62K as the larger reference. Below a floor, the chart has fewer places to stop. That's why this zone matters so much. Are you watching $BTC or another coin? #BTC #Crypto #BinanceSquare #WSOT2026 #WSOTPicktoEarn10U #USPayrollsAndRateDecisionsDriveMacroWeek #OilVolatilityTracksIranPeaceTalks #BybitAIEvolving $BTCUSDT $HYPEUSDT
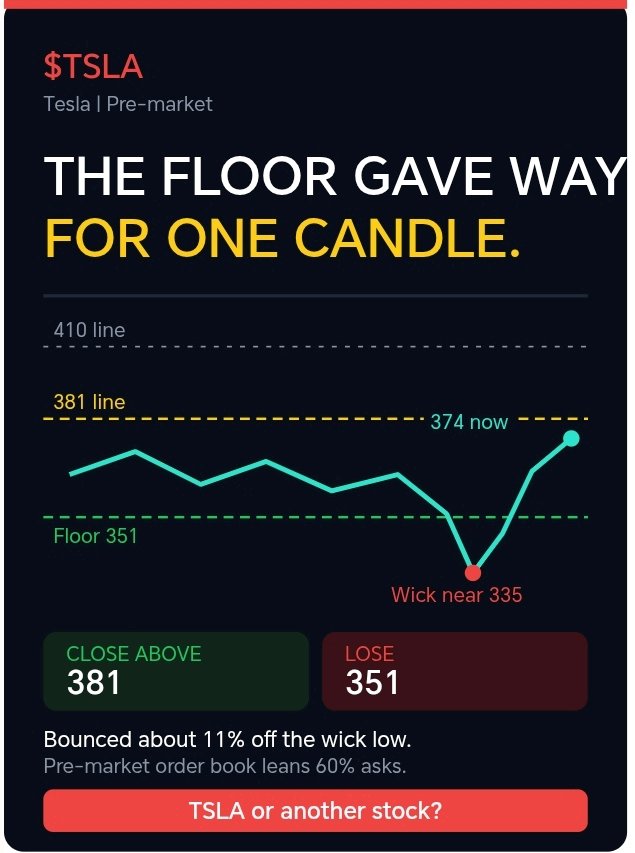
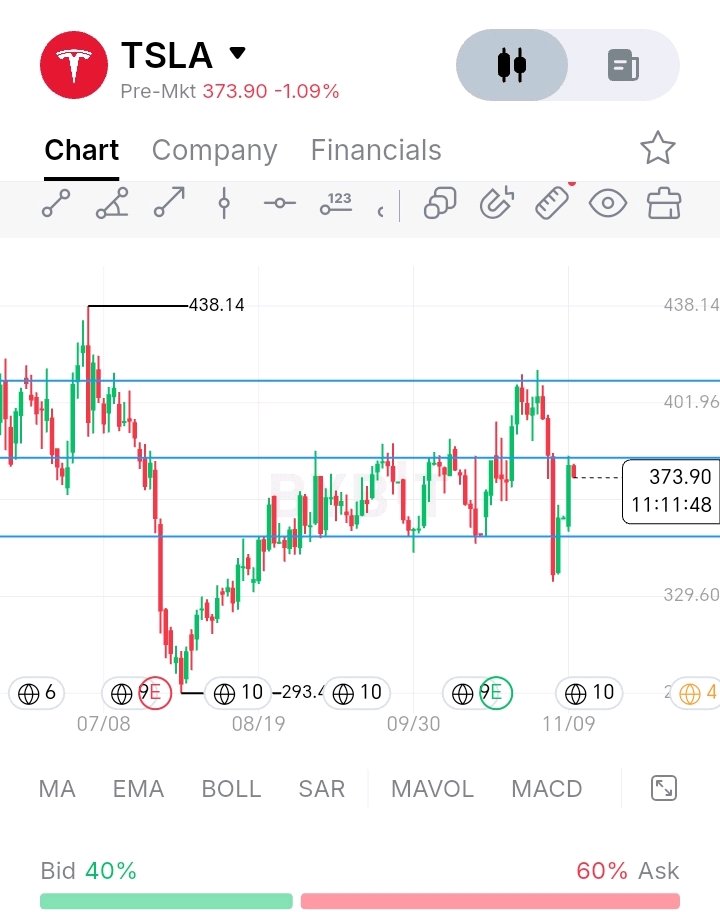
🪤 The floor gave way for one candle. Then it snapped right back. I don't want to chase $TSLA just because it recovered fast. I want to see price clear the 381 line and hold it, because that's the next test after reclaiming the floor. Here's what this chart shows: 🔹 The range: Since the 438.14 high in July and the 293.4 low in August, $TSLA has traded inside a wide range. Three horizontal levels have framed it: roughly 351, 381 and 410. 🔹 The failed breakdown: The recent drop pushed under the 351 line and bottomed near 335. But price didn't stay below. It reclaimed the line within days. 🔹 The recovery: From that 335 area, price has bounced about 11% to the 374 level in pre-market. That's a strong response to a break. 🔹 The next wall: The 381 line is right overhead. It has acted as both support and resistance several times, so it's a busy level. 🔹 The pre-market: Price is slightly red (-1.09%) at 373.90, and the order book leans about 60% asks. Thin pre-market flows can fade, so the open matters. 🟢 Bullish: a clean close above 381 opens the way toward the 410 line, with the 438.14 high as the big reference. 🔴 Bearish: slipping back under 351 would turn the failed breakdown into a real one, with 335 and then the 329.6 area below. A failed breakdown is a good sign, but it only counts if price keeps the floor it just reclaimed. TSLA or another stock? #TSLA #Stocks #BinanceSquare #WSOT2026 #WSOTPicktoEarn10U #USPayrollsAndRateDecisionsDriveMacroWeek #OilVolatilityTracksIranPeaceTalks #BybitAIEvolving $TSLAXUSDT $HYPEUSDT
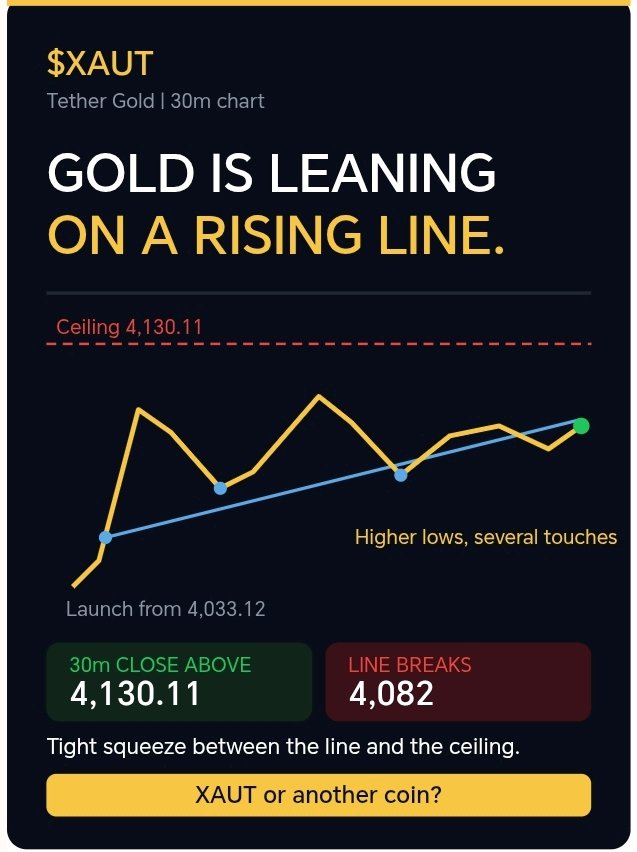
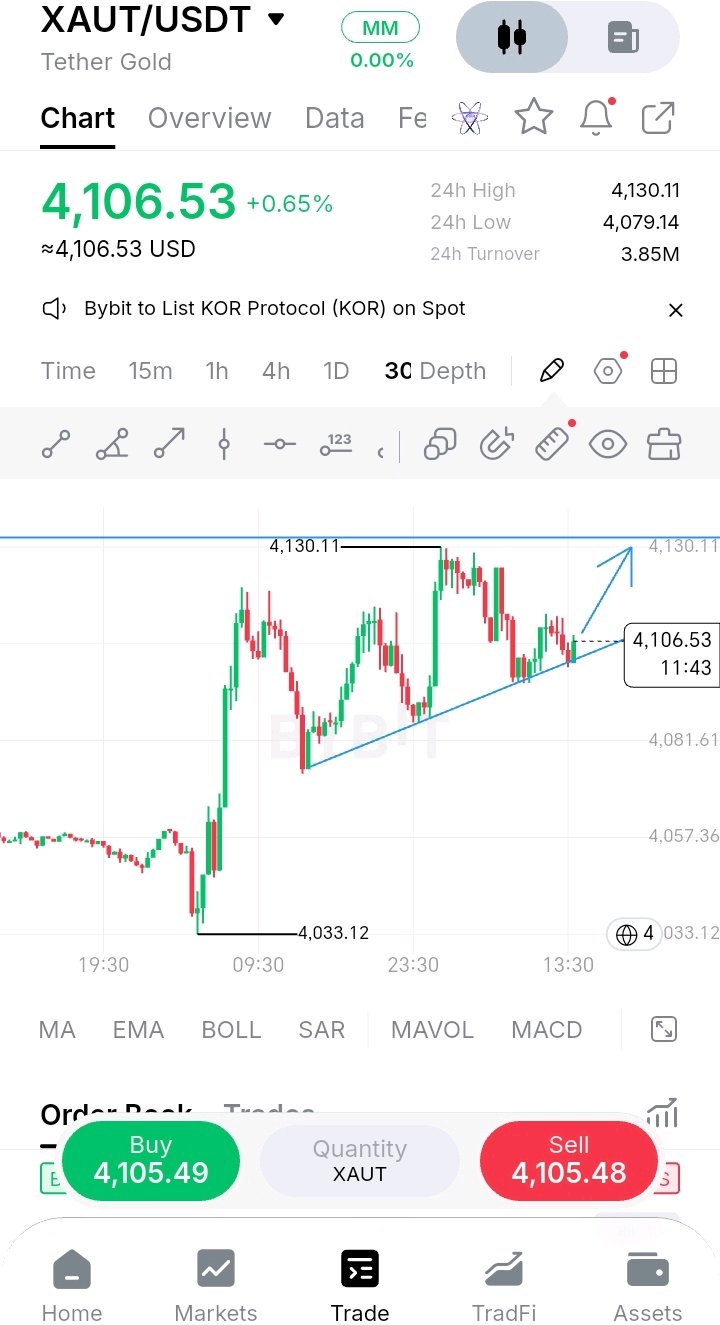
📐 Emas sedang bersandar pada garis kenaikan, dan sejauh ini masih bertahan. Saya tidak ingin memprediksi pergerakan berikutnya pada $XAUT selagi harganya masih menekan salah satu garis tren. Saya ingin melihat support kenaikan ini bertahan pada penutupan 30 menit, dan kemudian dorongan yang bersih menembus 4.130,11. Inilah yang ditunjukkan grafik 30 menit: 🔹 Lompatan: Emas meluncur dari 4.033,12 ke area 4.130, sekitar 2,4%, dalam satu gerakan kuat. Bahkan sempat menembus plafon 4.121,66 yang sempat menahannya sebelumnya. 🔹 Tangga: Sejak harga tertinggi, setiap penurunan selalu berakhir lebih tinggi dari sebelumnya. Menghubungkan titik-titik terendah tersebut menghasilkan garis tren naik yang bersih dengan beberapa sentuhan. 🔹 Ujian saat ini: Harga sedang berada tepat di garis itu. Ini adalah titik yang tepat di mana pembeli akan mempertahankannya lagi atau menyerah. 🔹 Squeeze: Ruang antara garis kenaikan dan plafon 4.130,11 semakin menyempit. Segitiga seperti ini cenderung terselesaikan dengan pergerakan yang tegas. 🔹 Rentang: Tertinggi 24 jam 4.130,11 dan terendah 4.079,14, dengan turnover 3,85 juta. Ini rentang yang sempit untuk logam yang baru saja reli. 🟢 Bullish: penutupan 30 menit di atas 4.130,11 memecahkan squeeze ke sisi atas, dengan garis kenaikan yang masih utuh. 🔴 Bearish: penutupan di bawah garis kenaikan membuat level terendah 4.082 menjadi pertimbangan, dan di bawah 4.079, level terendah 24 jam akan jebol. Level terendah yang lebih tinggi hanya berguna sampai salah satunya gagal. Beberapa penutupan 30 menit berikutnya yang akan menentukannya. Apakah Anda sedang memperhatikan $XAUT atau koin lain? #XAUT #Gold #Crypto #BinanceSquare #WSOT2026 #WSOTPicktoEarn10U #Data Penggajian AS dan Keputusan Suku Bunga Mendorong Pekan Makro #Volatilitas Minyak Melacak Pembicaraan Perdamaian Iran #BybitAIEvolving $XAUTUSDT $BTCUSDT
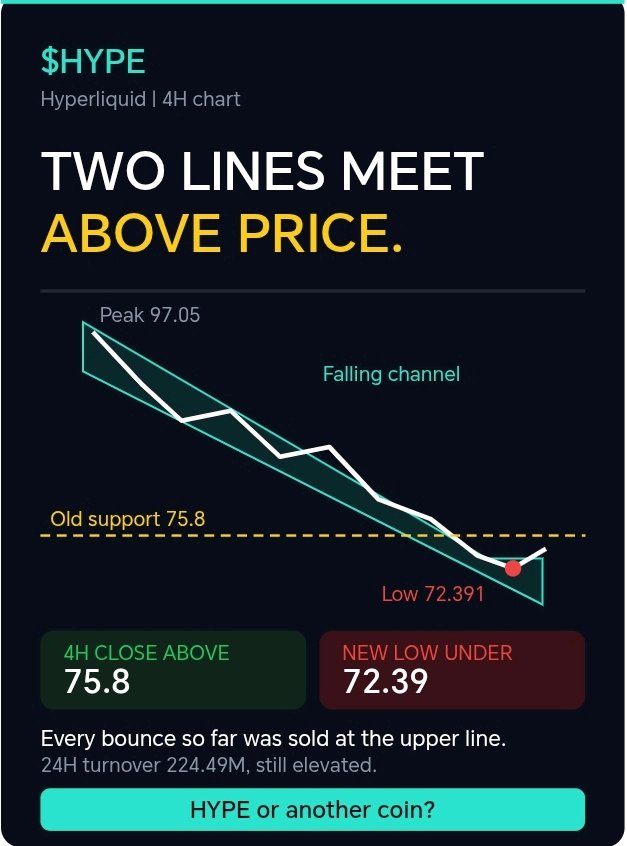
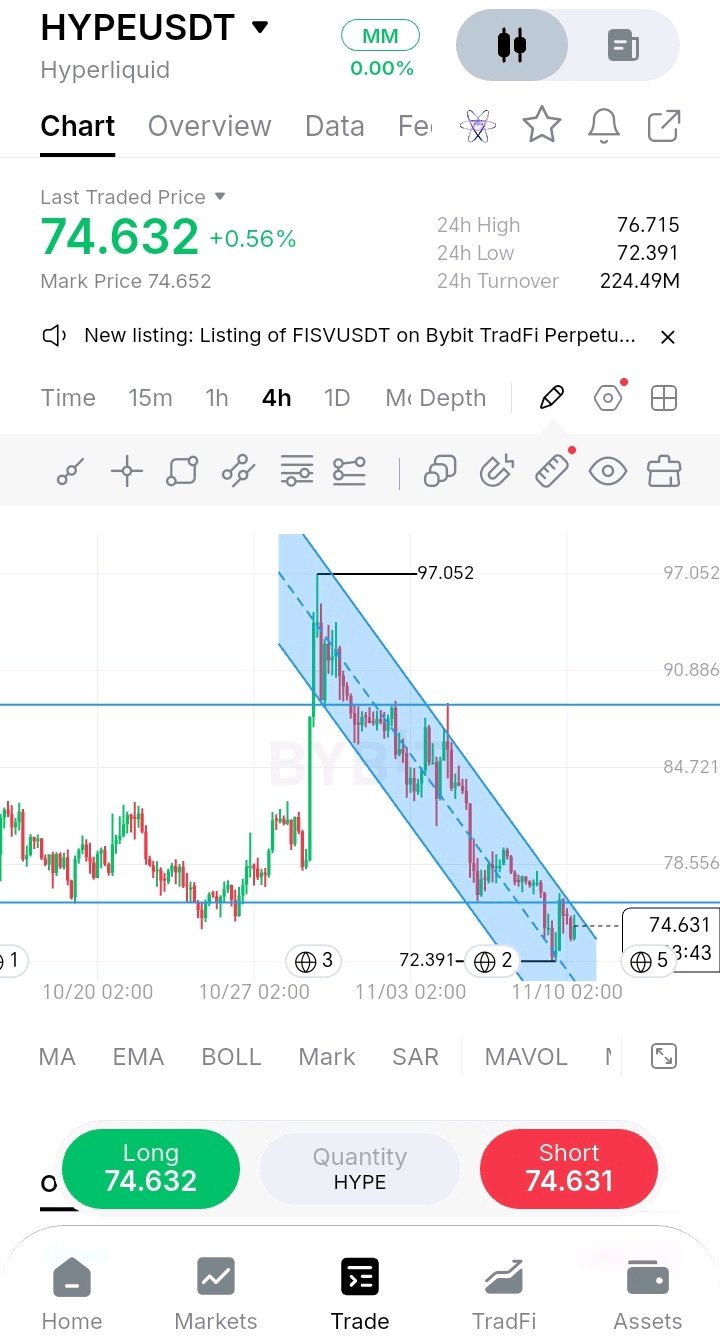
🎯 Dua garis bertemu tepat di atas harga, dan candle berikutnya sangat menentukan. Saya tidak ingin menyebut pantulan ini sebagai pembalikan pada $HYPE. Saya ingin melihat penutupan 4H di atas 75,8, karena di situlah garis support lama dan bagian atas falling channel tumpang tindih. Berikut yang ditunjukkan oleh grafik 4H: 🔹 Channel: Sejak puncak 97,052, $HYPE telah turun sekitar 25% di dalam channel menurun yang rapi, terus membuat lower high dan lower low sepanjang jalan. 🔹 Pola: Setiap pantulan di dalam channel telah dijual di dekat garis atas, termasuk lonjakan menuju 88,6 yang berbalik arah sepenuhnya. Itu adalah tren yang terus menghormati batas-batasnya. 🔹 Pantulan sekarang: Setelah mencetak 72,391, harga pulih ke sekitar 74,6. Sekarang sedang menekan ke tepi atas channel. 🔹 Tumpang tindih: Garis channel atas dan support lama di sekitar 75,8 berada di tempat yang hampir sama. Harga perlu menembus keduanya untuk mengubah struktur. 🔹 Aktivitas: Turnover 24H adalah 224,49M, masih tinggi, jadi pasar memperhatikan level ini. 🟢 Bullish: penutupan 4H di atas 75,8, kemudian diikuti pergerakan menuju 78,6 dan 84,7. Itu akan mematahkan channel dan pola lower high yang lama. 🔴 Bearish: penolakan lain di puncak channel membuat tren tetap utuh, dan posisi terendah baru di bawah 72,39 akan memperpanjangnya. Channel hanya pecah ketika harga ditutup di luarnya dan bertahan di sana. Sampai saat itu tiba, pantulan dianggap bersalah sampai terbukti sebaliknya. Apakah Anda sedang memantau $HYPE atau koin lain? #HYPE #Crypto #BinanceSquare #WSOT2026 #WSOTPicktoEarn10U #Data Penggajian AS dan Keputusan Suku Bunga Mendorong Pekan Makro #Volatilitas Minyak Melacak Pembicaraan Perdamaian Iran #BybitAIEvolving $HYPEUSDT $BTCUSDT
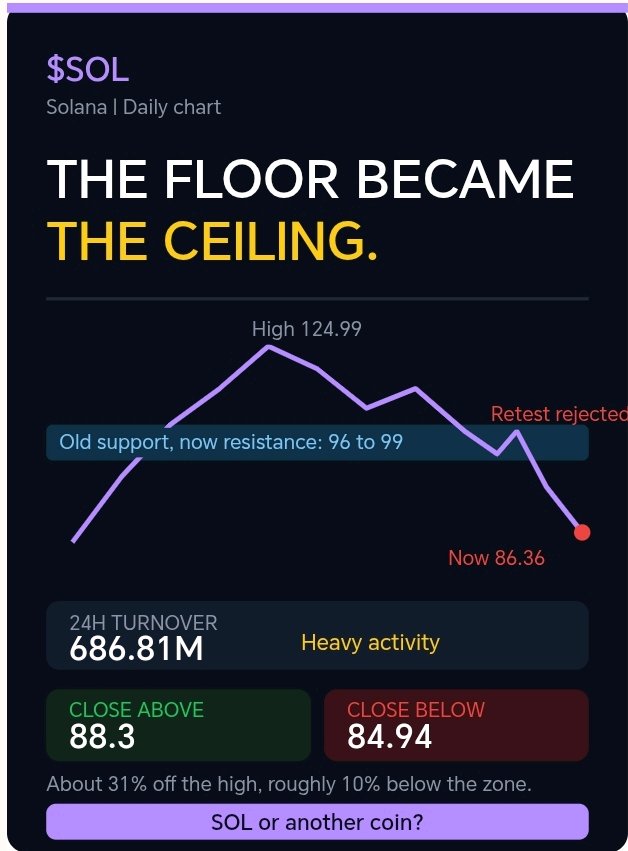
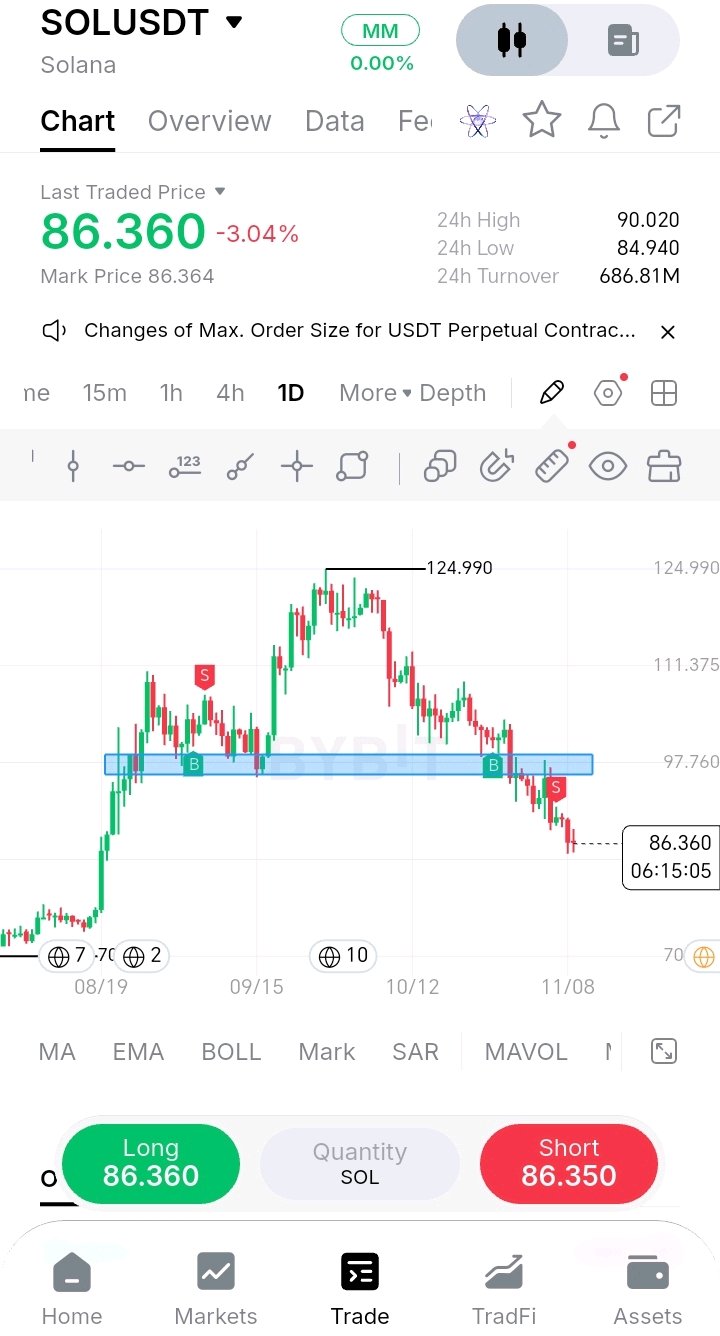
🏚️ The floor became the ceiling. I don't want to buy $SOL just because it's down about 31% from its high. I want to see a daily close back above 88.3 first, and then a real push through the old support zone near 96 to 99. Here's what the daily chart shows: 🔹 The old floor: The blue zone around 96 to 99 held as support through most of August, September and October. Every dip into it was bought. 🔹 The break: In late October, price finally closed below it. The retest from underneath was rejected, which is the classic sign that support has flipped to resistance. 🔹 The slide since: $SOL has fallen from 124.99 to 86.36 in a steady staircase of red candles. The 24H low is 84.94, so the 88.30 low from earlier has also been lost. 🔹 The participation: 24H turnover is 686.81M. That's heavy activity, which means the move has real weight behind it. 🔹 The gap above: Price is roughly 10% below the old zone, so even a strong bounce has a lot of overhead supply to work through. 🟢 Bullish: reclaim 88.3 and then 90 on daily closes. A move back into the 96 to 99 zone would show buyers are taking control again. 🔴 Bearish: a daily close under 84.94 keeps the downtrend intact, with the low 70s on the chart as the next reference. Once a floor turns into a ceiling, it usually takes real strength to flip it back. Are you watching $SOL or another coin? #SOL #Solana #Crypto #BinanceSquare #WSOT2026 #WSOTPicktoEarn10U #USPayrollsAndRateDecisionsDriveMacroWeek #OilVolatilityTracksIranPeaceTalks #BybitAIEvolving $SOLUSDT $BTCUSDT