ZENBIOA
6540Suka0Pembagian238Penggemar95Ikuti
Crypto trader | Charts, setups, & market psychology in one place..
Crypto trader | Charts, setups, & market psychology in one place..
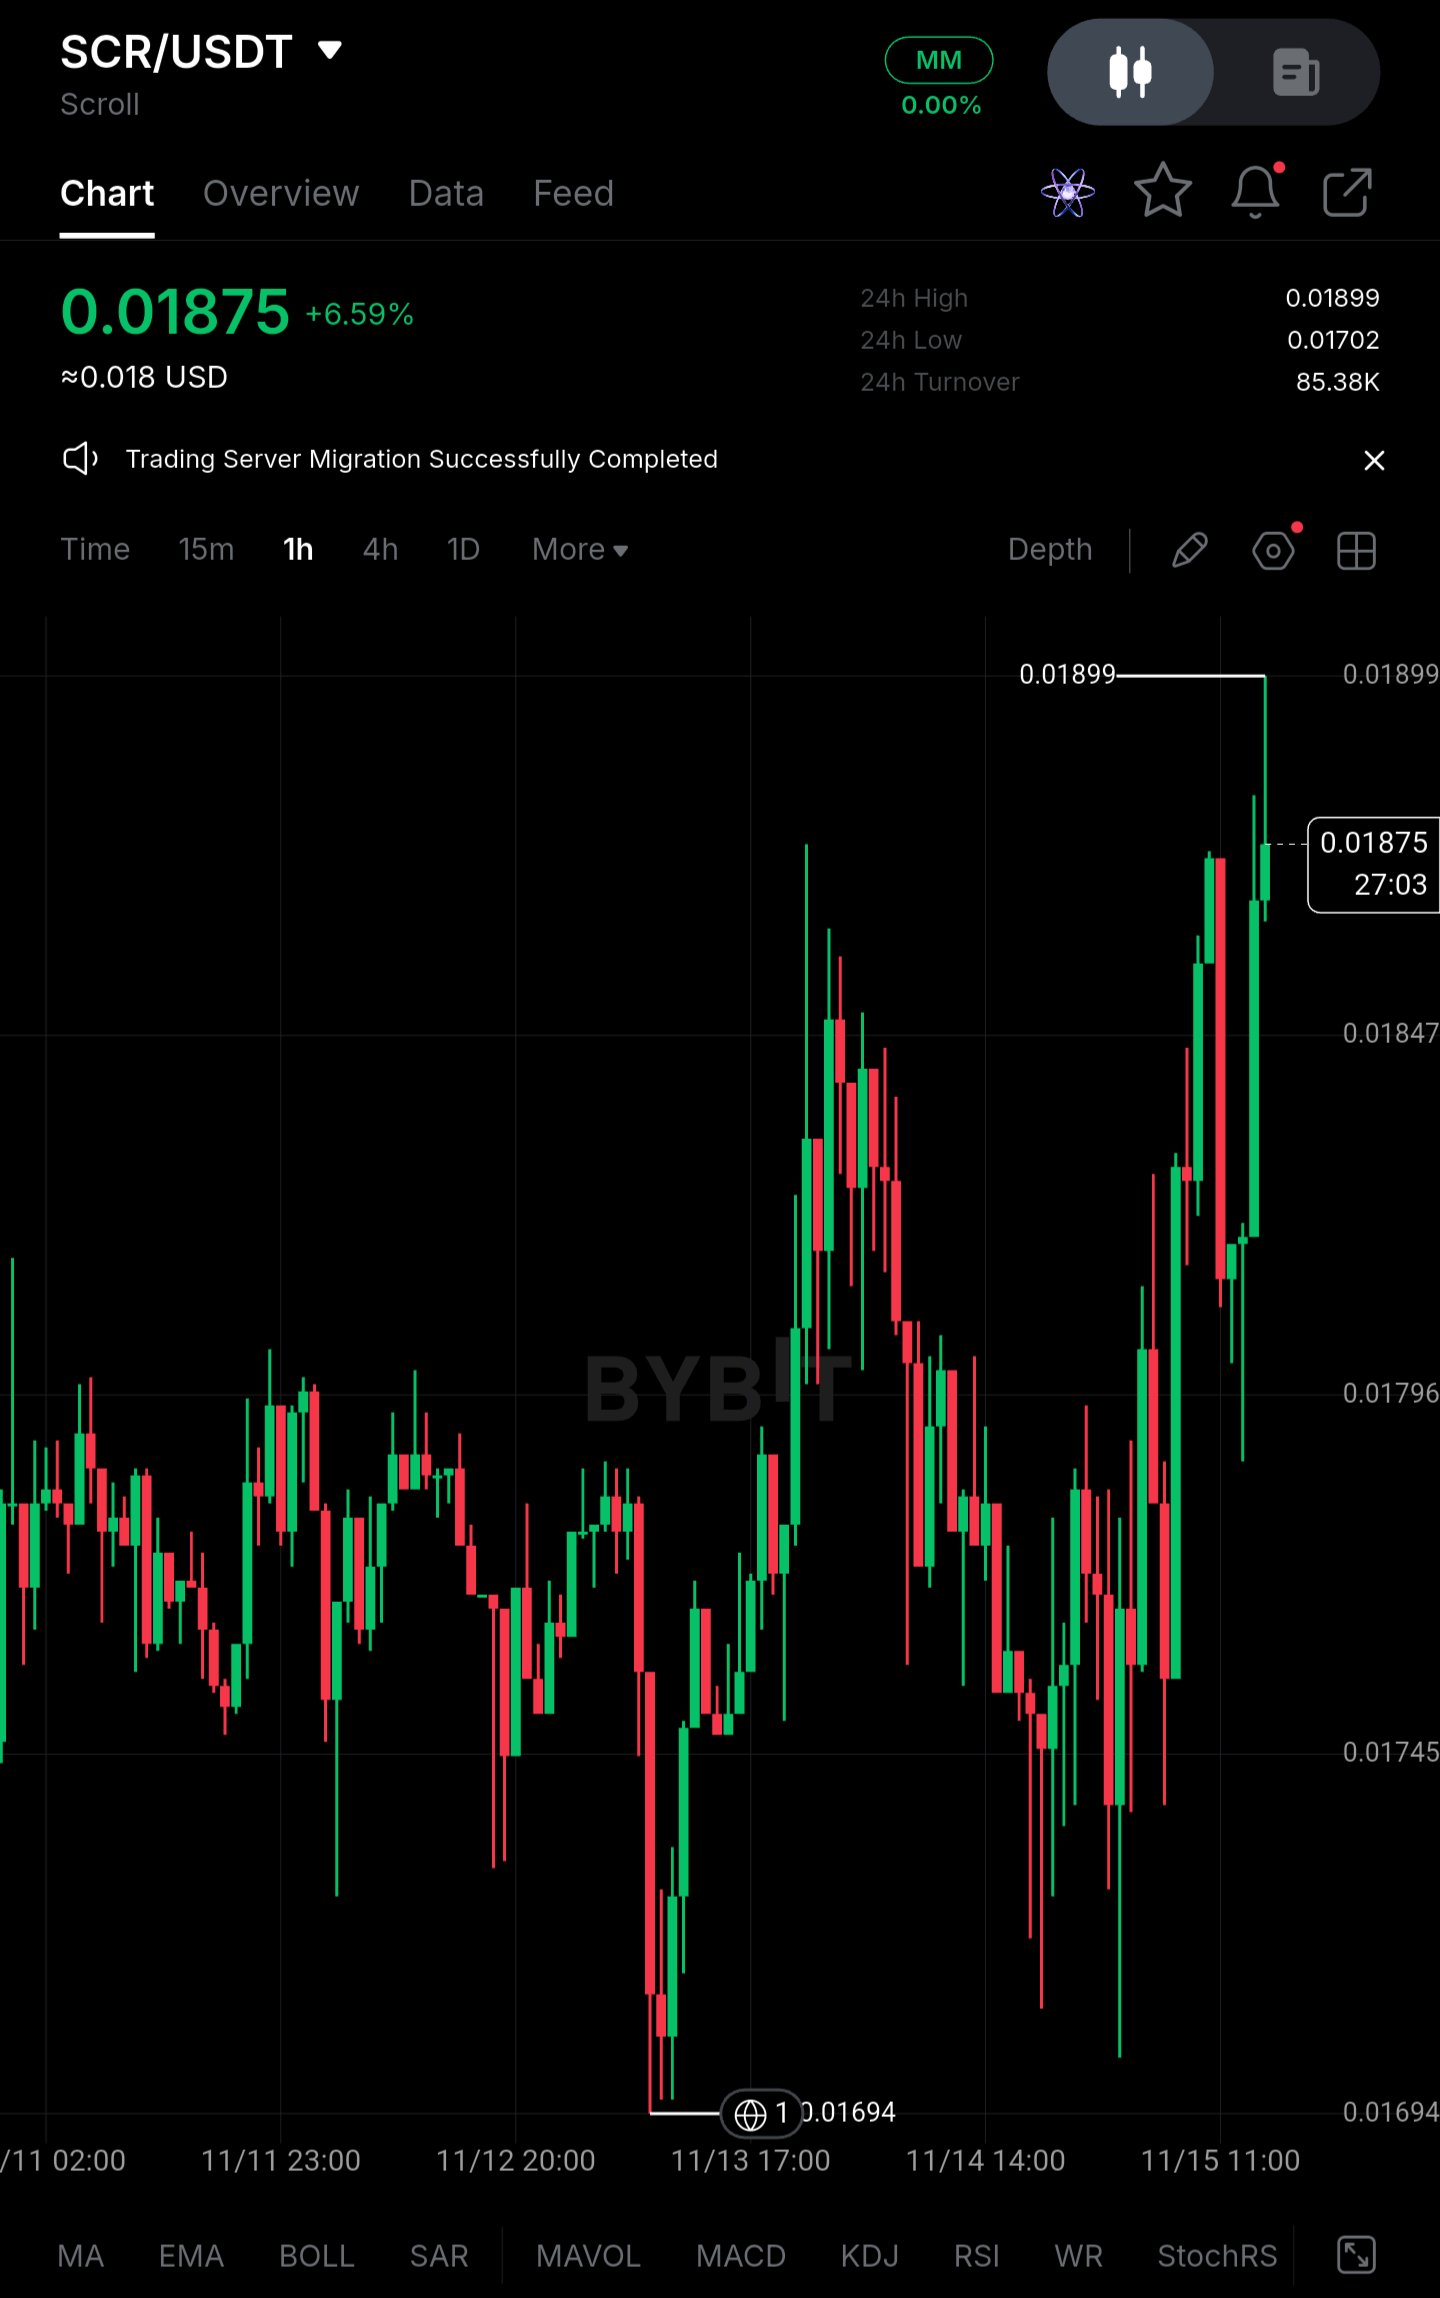
$SCRUSDT | Scroll holds near $0.0188 after a $0.01694 low, but this is not a recovery yet** Scroll (SCR) is trading around $0.01875 on the 1h chart, roughly 10% above the $0.01694 low printed on 11/13. I am not treating the current bounce as a recovery. The larger concern is the combination of institutional-scale selling pressure and a derivatives market that still leans heavily long. Whether spot demand can absorb supply, or another liquidity sweep is still ahead, remains unresolved. **Price Action** SCR is up 6.59% over the last 24 hours, within a 24h range of $0.01702 to $0.01899. The rebound off $0.01694 was sharp, but the structure since then is a series of higher lows with repeated rejection near $0.01899. The latest push into that level left a long upper wick, which signals supply at the highs. Immediate resistance sits at $0.01899, with $0.01847 as the first intraday level to defend. First support is $0.01796, followed by the $0.01745 to $0.01694 demand zone. A clean hourly close above $0.01899 would shift short-term structure, but it would not by itself reverse the broader trend, which remains under pressure. **Institutional / Large Capital Picture** SCR is a small-cap Layer 2 token, so there is no ETF channel to track. Large-wallet distribution, unlock-related supply and exchange inflows are the relevant signals. Demand has been inconsistent: the 11/12 to 11/13 sell-off printed heavy red candles with little immediate absorption, and the rebound was driven by thin, fast moves rather than steady accumulation. 24h turnover of roughly 85.38K is modest, which means a few large orders can move price in either direction. The move to $0.01694 had the character of a liquidity-driven flush rather than organic selling alone. **Liquidity & Range Conditions** Price has compressed into a relatively narrow band between $0.0180 and $0.0190 after the decline. A narrow range after a sharp drop is not evidence of accumulation. Without a clear rise in spot volume, it more often reflects pause and positioning before the next directional move. Stronger spot participation is still required to validate any bullish read. **Derivatives Positioning** Exact figures are not visible on the chart, so these are estimates based on price behavior and typical positioning for this asset: - Open interest: elevated relative to spot turnover, likely in the low-to-mid single-digit millions USD - Funding rate: positive, around +0.01% per 8h, meaning longs are paying shorts - Long/short ratio: roughly 60% of accounts long Positive funding combined with a long-tilted ratio creates vulnerability. If $0.01796 breaks, stop clusters and leveraged longs would likely unwind quickly, extending the move toward the prior low. **Key Figures** - Current price: ~$0.01875 - Immediate resistance: $0.01899 - Intermediate level: $0.01847 - Support zone: $0.01796 to $0.01745 - Recent low: $0.01694 - 24h turnover: ~85.38K - Funding: positive (~+0.01%, estimated) - Long share: ~60% (estimated) **Confirmation Levels** - Bullish: a sustained hourly close above $0.01899 with rising spot volume opens a move toward $0.0195 to $0.0200. - Bearish: a break below $0.01796 exposes $0.01745, and a loss of that level reopens a retest of $0.01694 with a risk of a lower low and fresh long liquidations. **Closing** SCR has stabilized, but stabilization is not the same as recovery. Selling pressure from larger holders and crowded long positioning are still competing with the rebound attempt. The decisive signal is whether spot buyers return while leverage stays controlled, or whether another support breakdown triggers a new wave of long liquidations. #ByXIMPACT
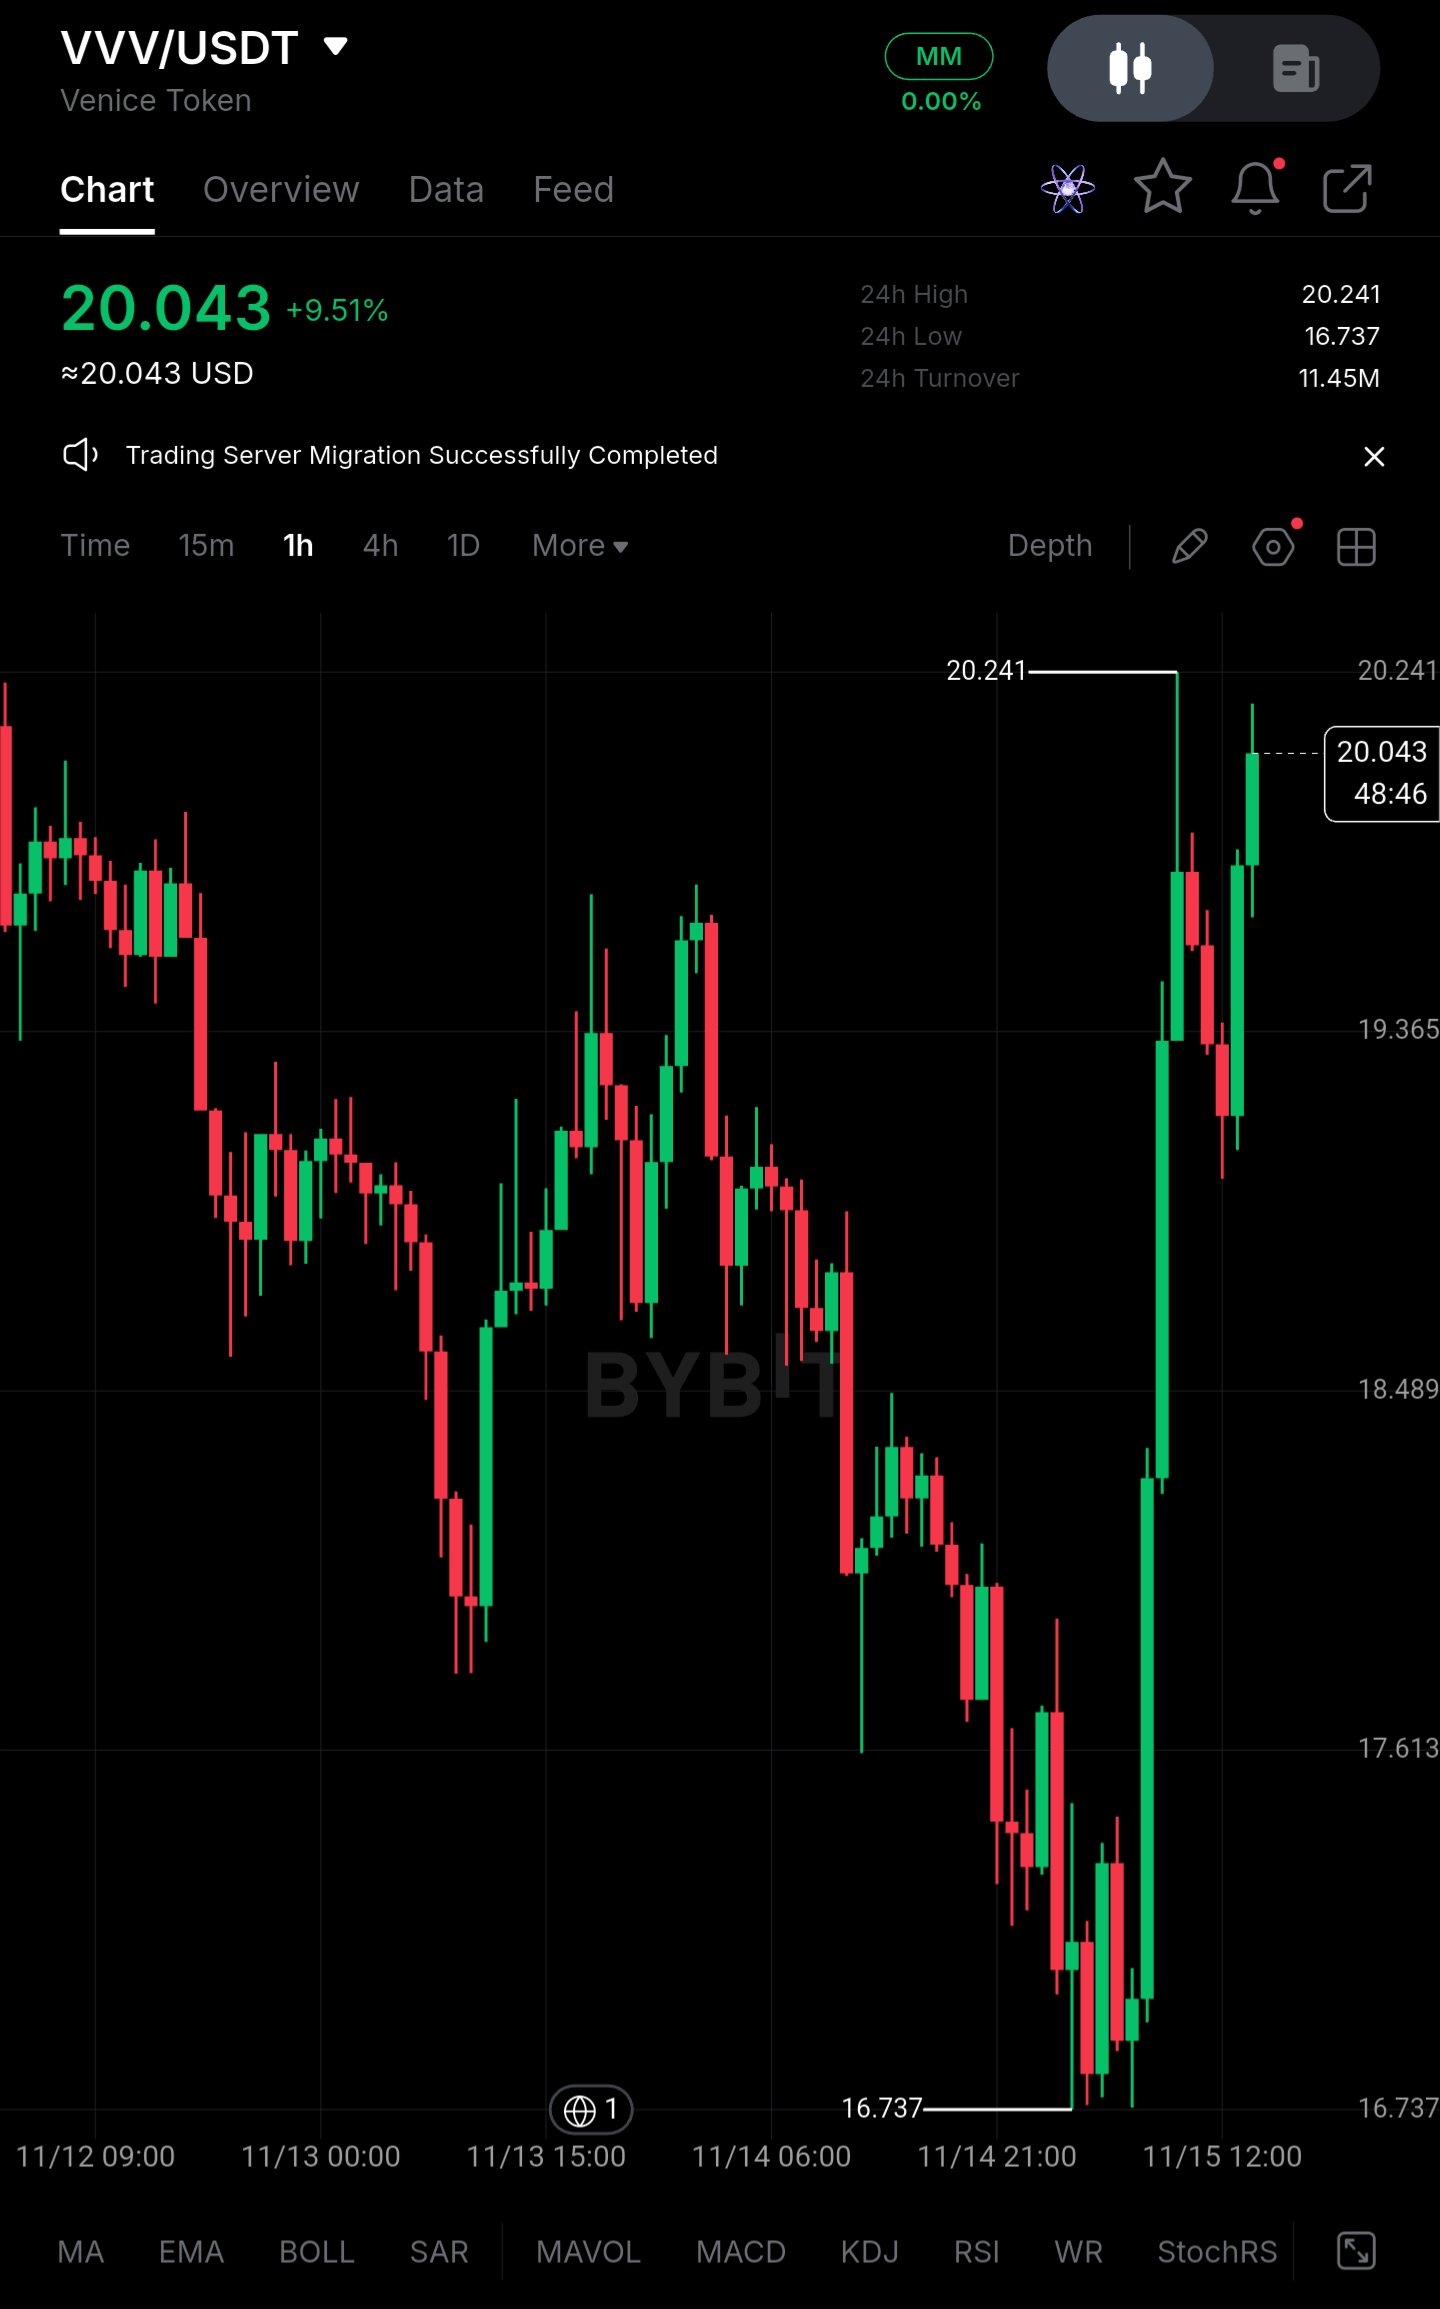
$VVVUSDT – Higher Timeframe Overview | Long on Pullback** Pair: $VVVUSDT (1H chart, Bybit) Looking at the 1H chart, VVV spent most of the last few days drifting lower and chopping around, with a clear sequence of lower highs from 11/13 into 11/14. Price bottomed at 16.737, then reversed with one of the strongest candles on the chart and pushed all the way to 20.241. It's now trading around 20.04, up roughly 9.5% on the day. I didn't catch the bounce from the lows, so I'd rather wait for a proper pullback than chase this. **Current Outlook and Key Levels** **Buying Zone: 18.489 – 19.365** This is the area where the vertical rally started to accelerate, so it's the first place I'd expect buyers to defend if price cools off. It's also a sensible retracement area for a move this extended. I'm looking for the pullback to slow down, wicks to get absorbed, and a 1H candle to close back up from the zone. A touch alone isn't enough. **Resistance Zone: 20.04 – 20.241** The 24h high at 20.241 is the obvious overhead level, and price is already pressing into it. Sellers who bought the way down may use this as a chance to exit. A clean break and sustained consolidation above 20.241 would suggest the rally is more than a one-off squeeze and that the structure is shifting higher. **Trading Setup** **Position:** Long on pullback **Entry Zone:** 18.489 – 19.365 (only after a buyer reaction, not as a blind limit) **Stop-Loss:** Below 17.613 **Invalidation:** A 1H close below 17.613 would mean the pullback is no longer a healthy retracement. It would put price back into the lower part of the previous range, and the reversal would be suspect. **Take-Profits:** - TP1: 20.241 (24h high) - TP2: No verified level above 20.241 yet. If price breaks and holds above it, I'd trail the stop and reassess instead of forcing a target. **Why This Setup Makes Sense** Buying near 20.0 means entering right under the local high after an impulsive move, with a stop that would have to sit far away. Even a small retracement would hurt the risk-to-reward. A pullback into 18.489 – 19.365 gives a more structured entry, with the stop below 17.613 and the first target at the recent high, which is a much better ratio. The reaction matters as much as the level. If buyers step in and hold, the zone is doing its job. If price slices through without a bounce, the setup isn't there and I stay out. Patience costs very little here, while chasing after a +9.5% day often means buying someone else's exit. **Risk Management** Stick to the plan. Don't move or remove the stop-loss, and size the position so a stop-out is an acceptable loss. A bullish reversal can still fail, and no setup guarantees a profit. This is not financial advice. #ByXIMPACT
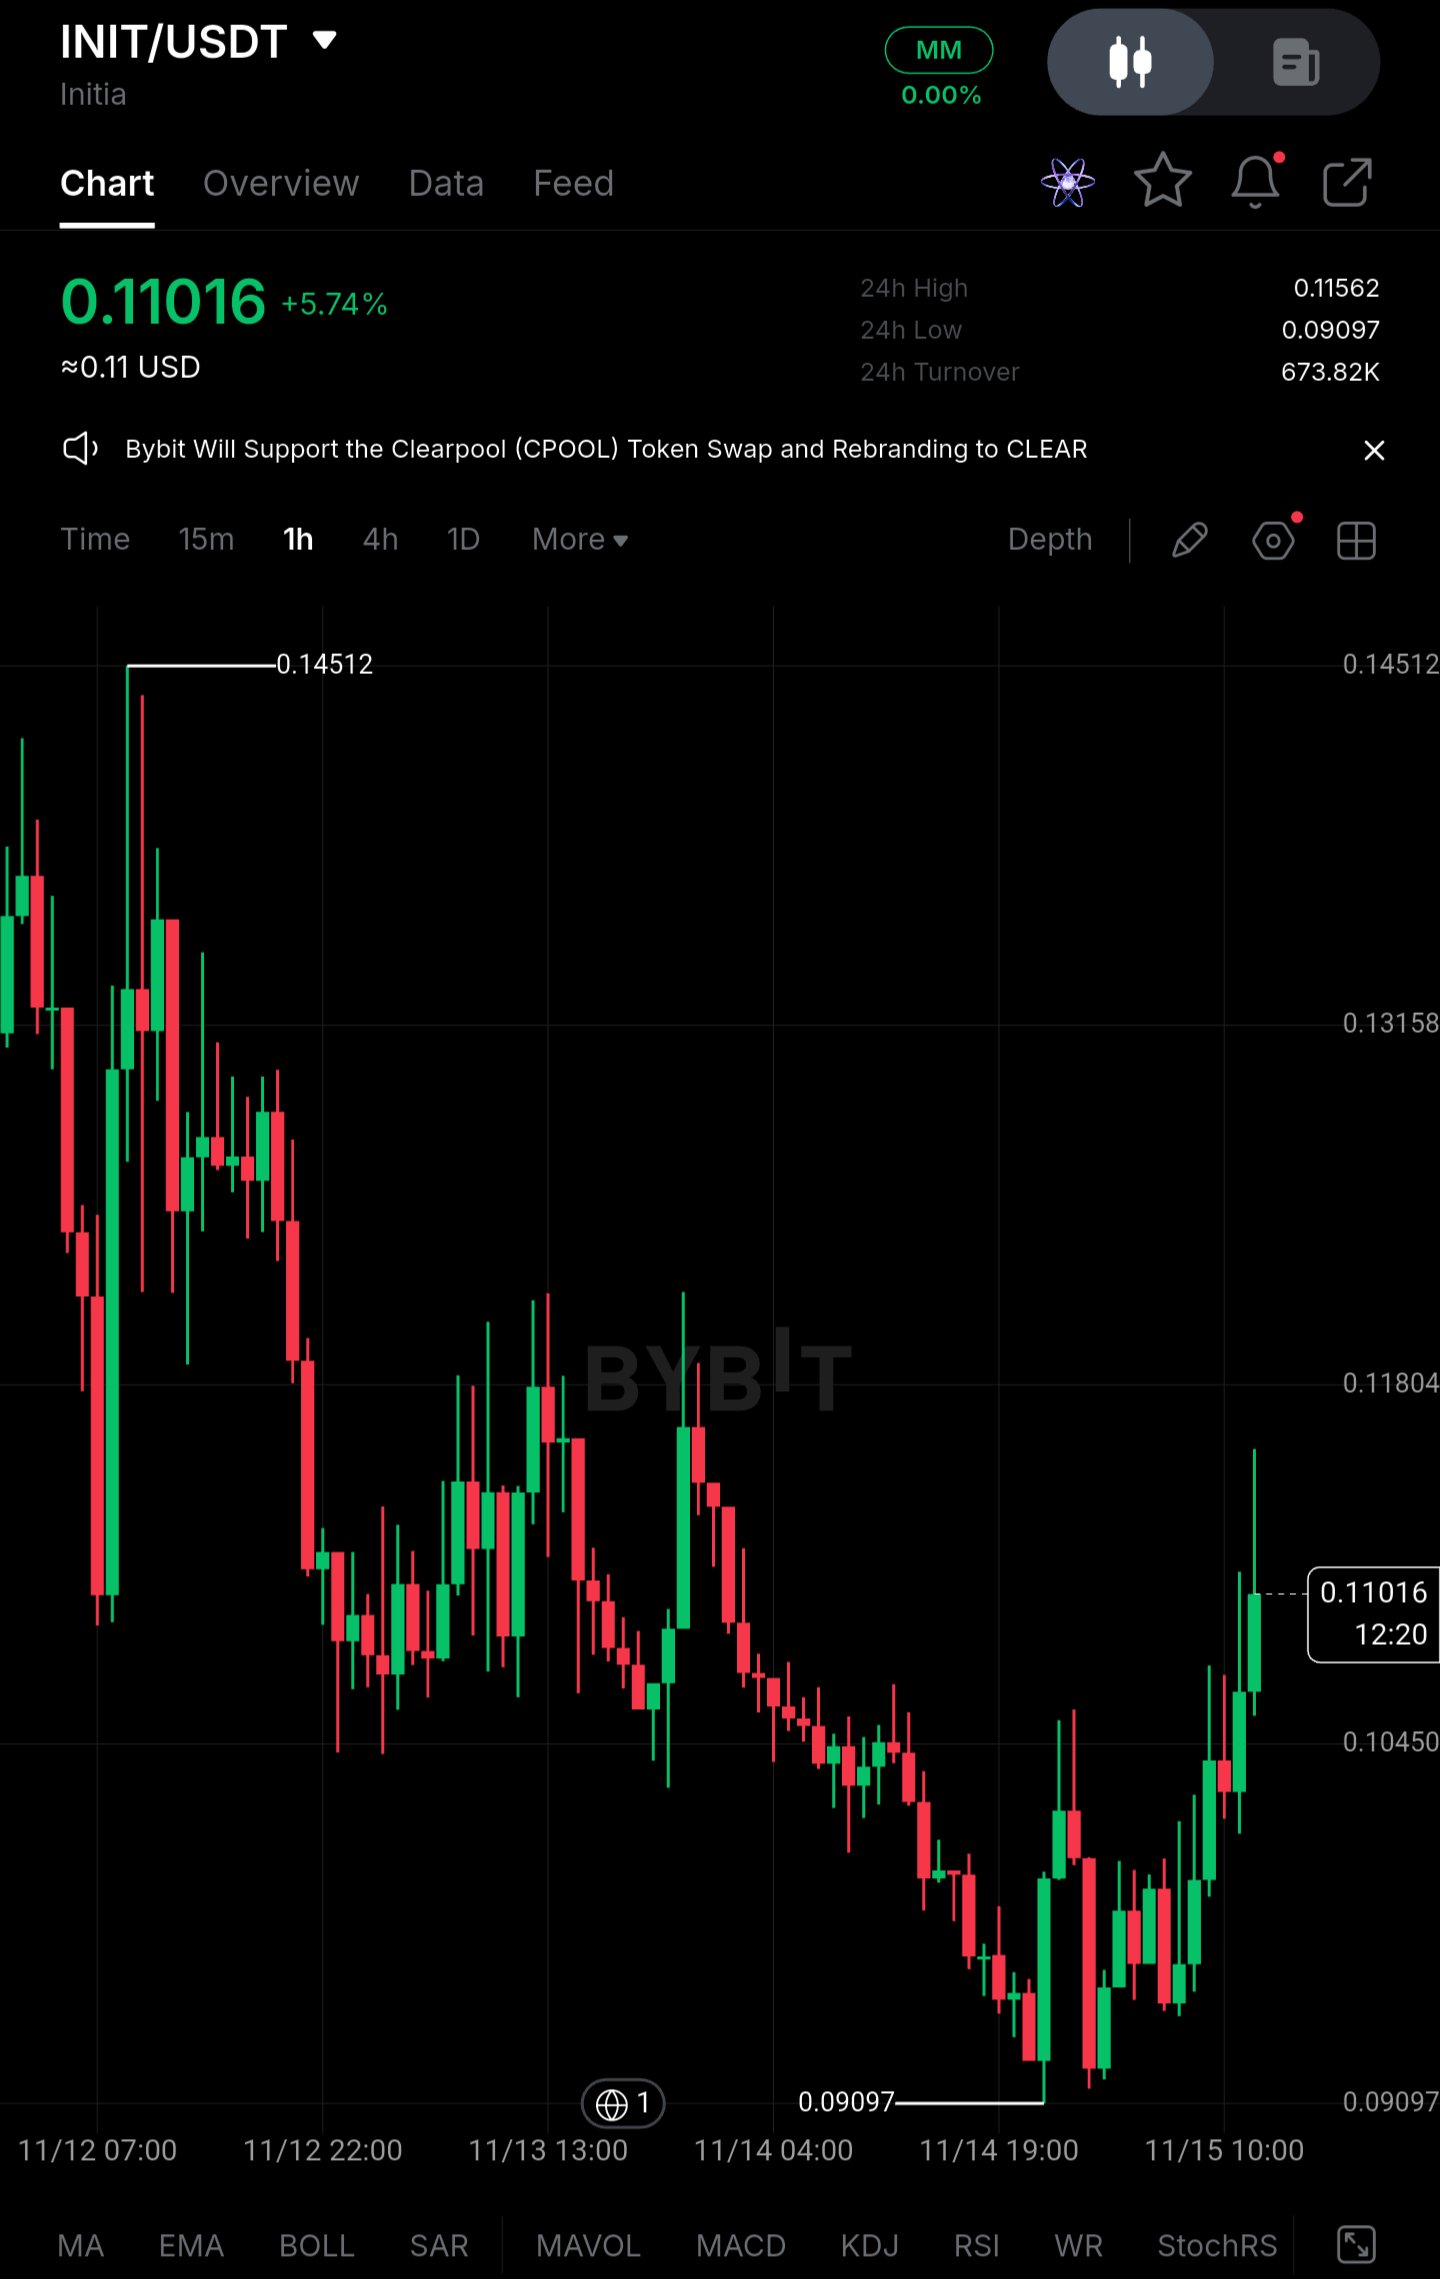
$INITUSDT – Higher Timeframe Overview | Long on Pullback** Pair: $INITUSDT INIT has spent the last few sessions in a steady downtrend, sliding from the 0.14512 high to a low of 0.09097. I didn't have any interest in catching that fall. Price has since bounced sharply, now around 0.11016 (+5.74% on the day), with the last few 1h candles pushing up and a long wick printing near the top of the move. One strong green run after a long decline doesn't tell me the trend has changed. It tells me buyers showed up at the lows, and now I want to see whether they defend higher prices. **Current Outlook and Key Levels** **Buying Zone: around 0.10450** This level sits roughly midway between the 0.09097 low and the bounce high, and it's where price consolidated before the recent push. A pullback into this area would be a retest of the breakout base. I'd want to see the selling slow down, lower wicks form, and buyers close candles back above the level. If price just slices through it on heavy red candles, there's nothing to buy. **Resistance Zone: 0.11562 – 0.11804** 0.11562 is the 24h high, and 0.11804 is the next level above it, where earlier price action found sellers on the way down. Sellers have a reason to respond here. A clean break and sustained consolidation above 0.11804, with candles holding above it instead of wicking back under, would suggest the downtrend is losing control and open the way toward the higher levels on the chart. **Trading Setup** **Position:** Long on pullback **Entry Zone:** around 0.10450 (only on buyer confirmation, not by default) **Stop-Loss:** below 0.09097 **Invalidation:** A break below the 0.09097 low means the bounce has failed and the downtrend is resuming. At that point the setup no longer has structure behind it. **Take-Profits:** - TP1: 0.11804 - TP2: 0.13158 - TP3: 0.14512 **Why This Setup Makes Sense** After a bounce this sharp, buying near 0.11 puts you right under the 24h high, with resistance close overhead and a long way to the stop. That's a poor risk profile, and it's how people end up buying the top of a relief move. Waiting for a retest of 0.10450 gives a more defined entry. If buyers defend it, the structure of higher lows starts to build. If they don't, you've lost nothing and the plan stays unchanged. The targets follow the levels visible on the chart. TP1 is the first real resistance, TP2 and TP3 are the next levels on the way back toward the previous high. The stop below 0.09097 is wide, which keeps the trade honest about what would actually invalidate it, but it also means TP1 only offers roughly 1:1 from the entry. The setup gets better with TP2 and TP3, so partial profits at TP1 make sense. **Risk Management** Stick to the plan and don't move the stop because price feels like it will turn. Because the stop is wide, position size should be smaller than usual. A recovery bounce can fail just as easily as it can continue, and no setup guarantees a profit. *Levels are taken from the 1h Bybit chart and are not financial advice.* #ByXIMPACT
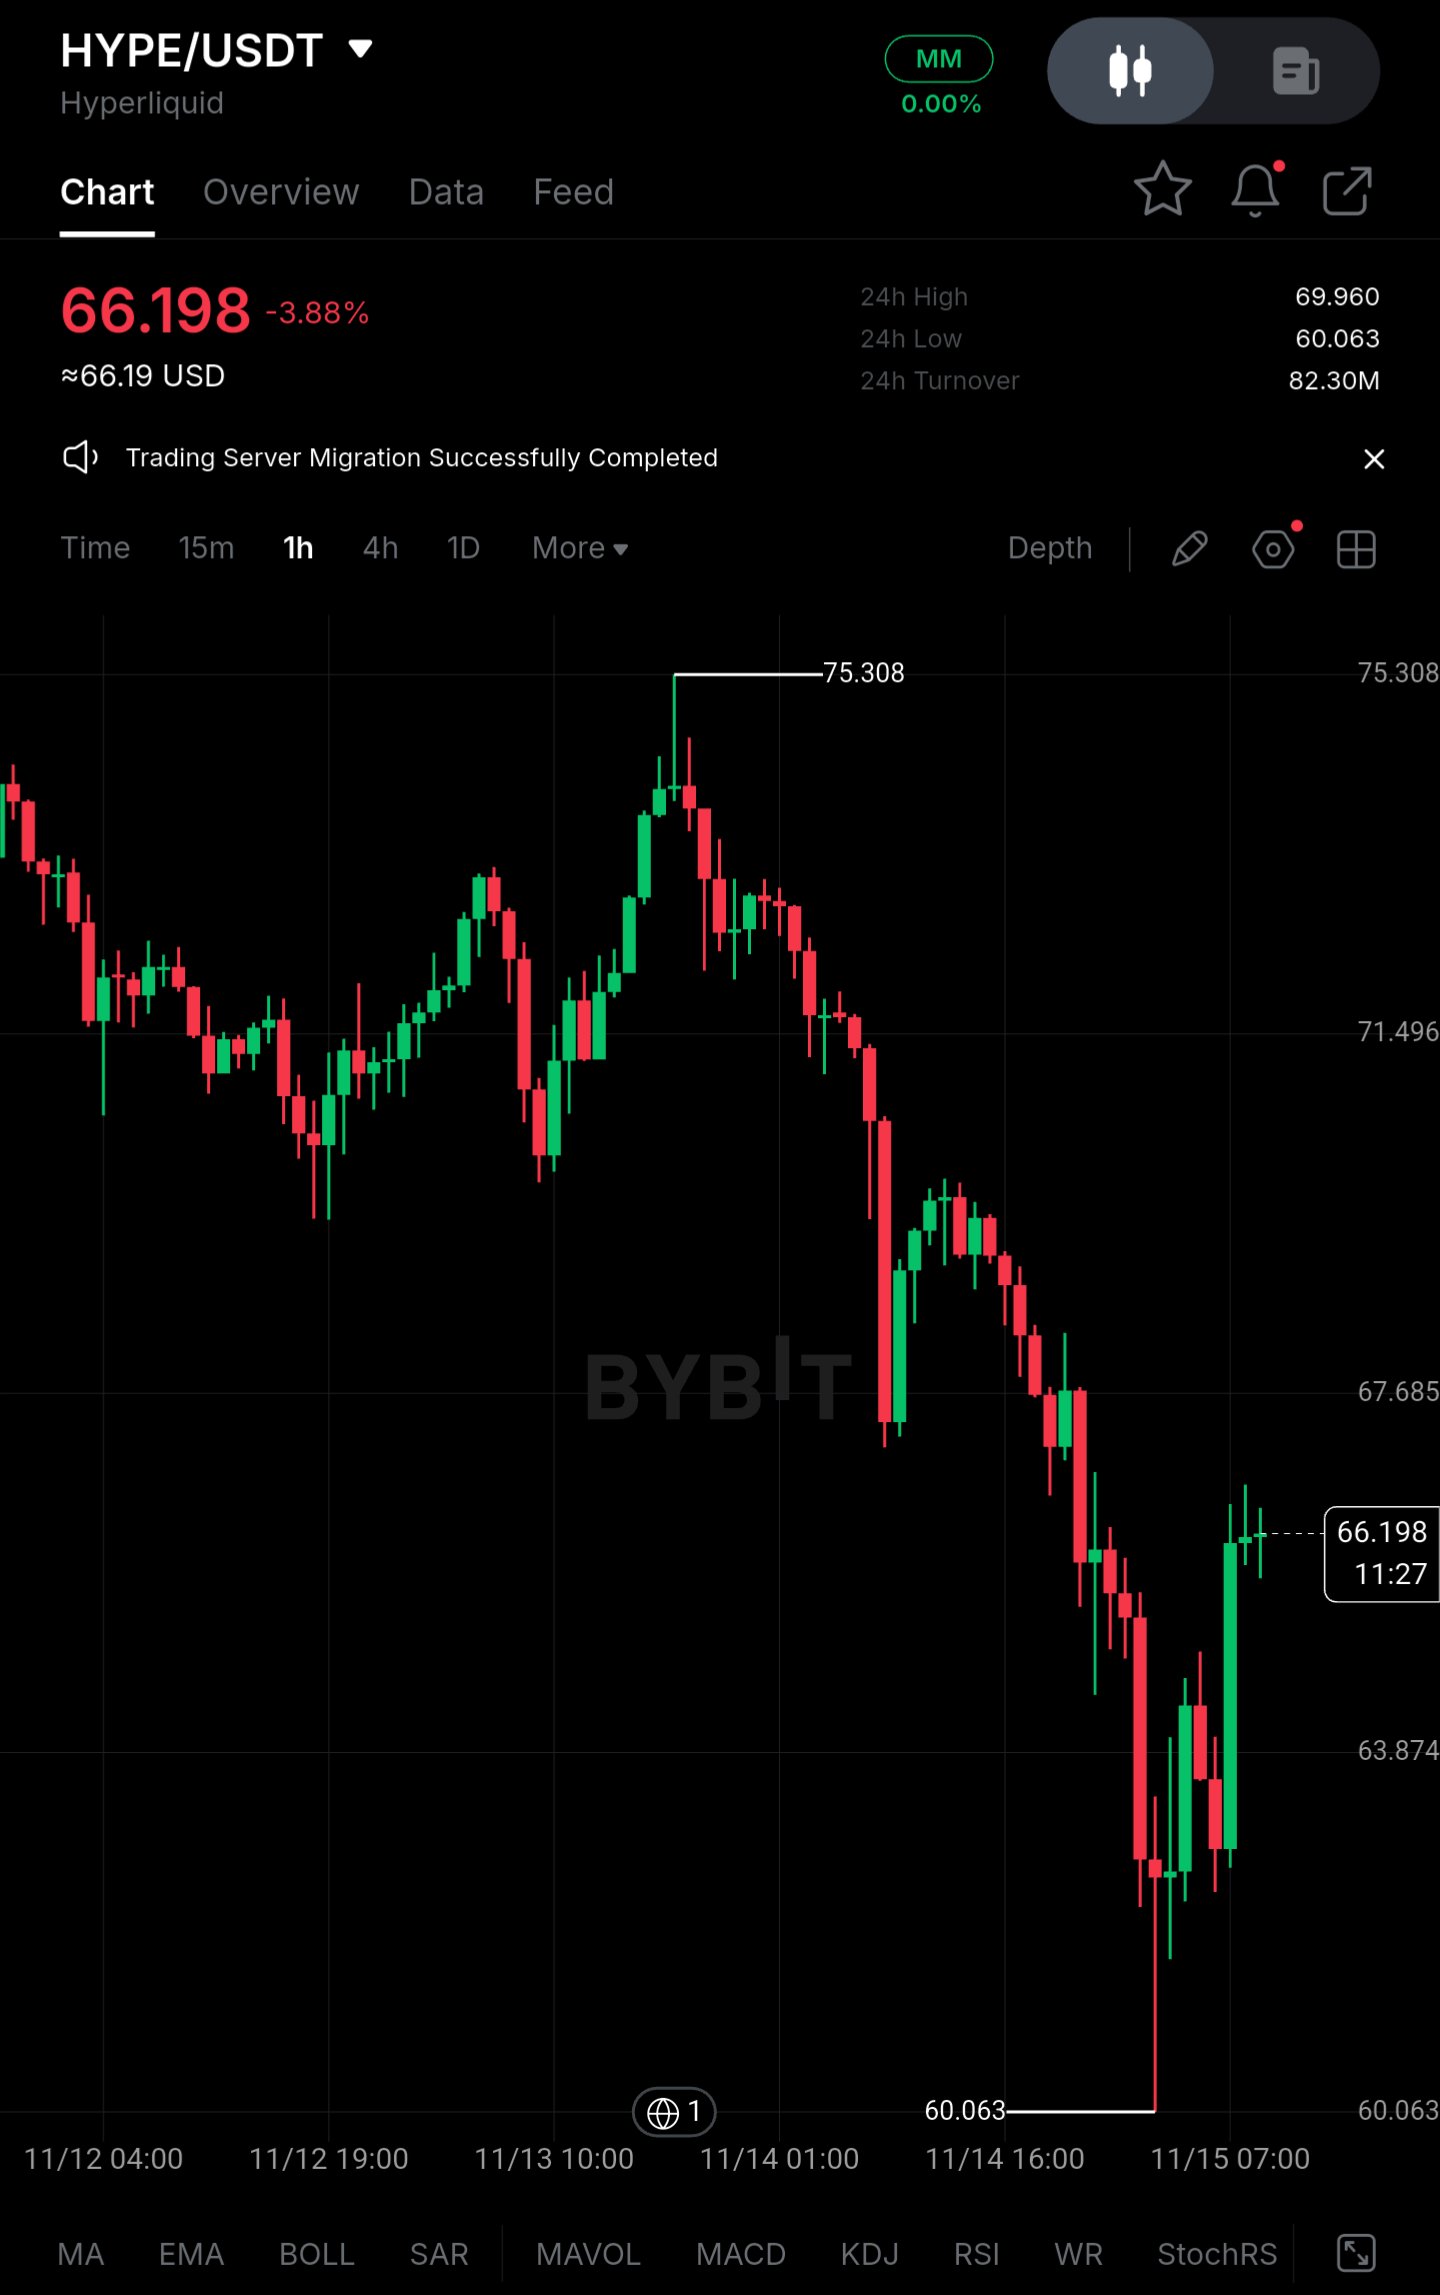
$HYPEUSDT holds near $66 after a sweep to $60.06, but I'm not treating this as a recovery yet** HYPE/USDT is trading around $66.20 (-3.88% on the day) after wicking to $60.06, its lowest print in the window. The hourly structure is a bounce inside a downtrend, not a trend change. The larger concern is large-wallet distribution combined with derivatives positioning that is still tilted long. **Price Action** - Current price: ~$66.20, about 10% above the $60.06 low and 12% below the $75.31 swing high. - Drawdown: about -20% from high to low over roughly three sessions, with a market cap of about $22B at current levels (approximate). - Immediate resistance: $67.70–$69.96. The 24h high at $69.96 is the first real test. - First support: $63.87, then the $60.06 sweep low. - The bounce has produced one strong hourly green candle off the low, followed by small-bodied candles. That is relief, not a confirmed reversal. The sequence of lower highs from $75.31 remains intact. **Large Capital Picture** - HYPE lacks the ETF flow data that BTC and ETH have, so the read comes from exchange flows and large-wallet behavior. The impulsive sell-off candles, followed by a long lower wick, are consistent with forced selling plus opportunistic dip buying. - Demand looks inconsistent. Green candles on the bounce are not matched by sustained follow-through volume. 24h turnover of ~$82.3M is modest relative to the size of the drop. - The exchange-side notice about trading server migration is a reminder that infrastructure and liquidity events can amplify moves in either direction. **Liquidity & Range Conditions** - Price has compressed into a narrow range just under $67 after the sharp decline. A narrow range after a decline is not evidence of accumulation. It more often reflects sellers pausing while liquidity rebuilds. - Stronger spot participation is still required before this range can be read constructively. **Derivatives Positioning** - Open interest: elevated relative to spot volume, estimated at the upper end of its recent range (approximate; verify on a derivatives dashboard). - Funding: estimated mildly positive, meaning longs are still paying shorts. - Long/short: roughly 55–60% of accounts long (estimate). - This positioning is the vulnerability. If $63.87 fails, crowded longs that survived the first sweep become fuel for a second leg lower. **Key Figures** - Current price: ~$66.20 - Immediate resistance: $67.70–$69.96 - Support: $63.87 - Recent low: $60.06 - 24h range: $60.06–$69.96 - 24h turnover: ~$82.3M - OI / funding: elevated / mildly positive (estimated) - Long share: ~55–60% (estimated) **Confirmation Levels** - **Bullish:** A hourly close and hold above $69.96 would be the first sign of strength. It would open $71.50, with $75.31 as the larger target. - **Bearish:** A close below $63.87 exposes a retest of $60.06. A break below that opens a deeper liquidity pocket and likely triggers a fresh round of long liquidations. **Closing** The market is stable for now, but stability is not demand. Large-wallet selling and crowded long positioning are competing with the recovery attempt. The decisive signal is whether spot buyers return while leverage stays controlled, or whether another support breakdown triggers fresh long liquidations. Until the first happens, rallies into resistance deserve skepticism. *Not financial advice. Derivatives figures are estimates, not live data.* #ByXIMPACT
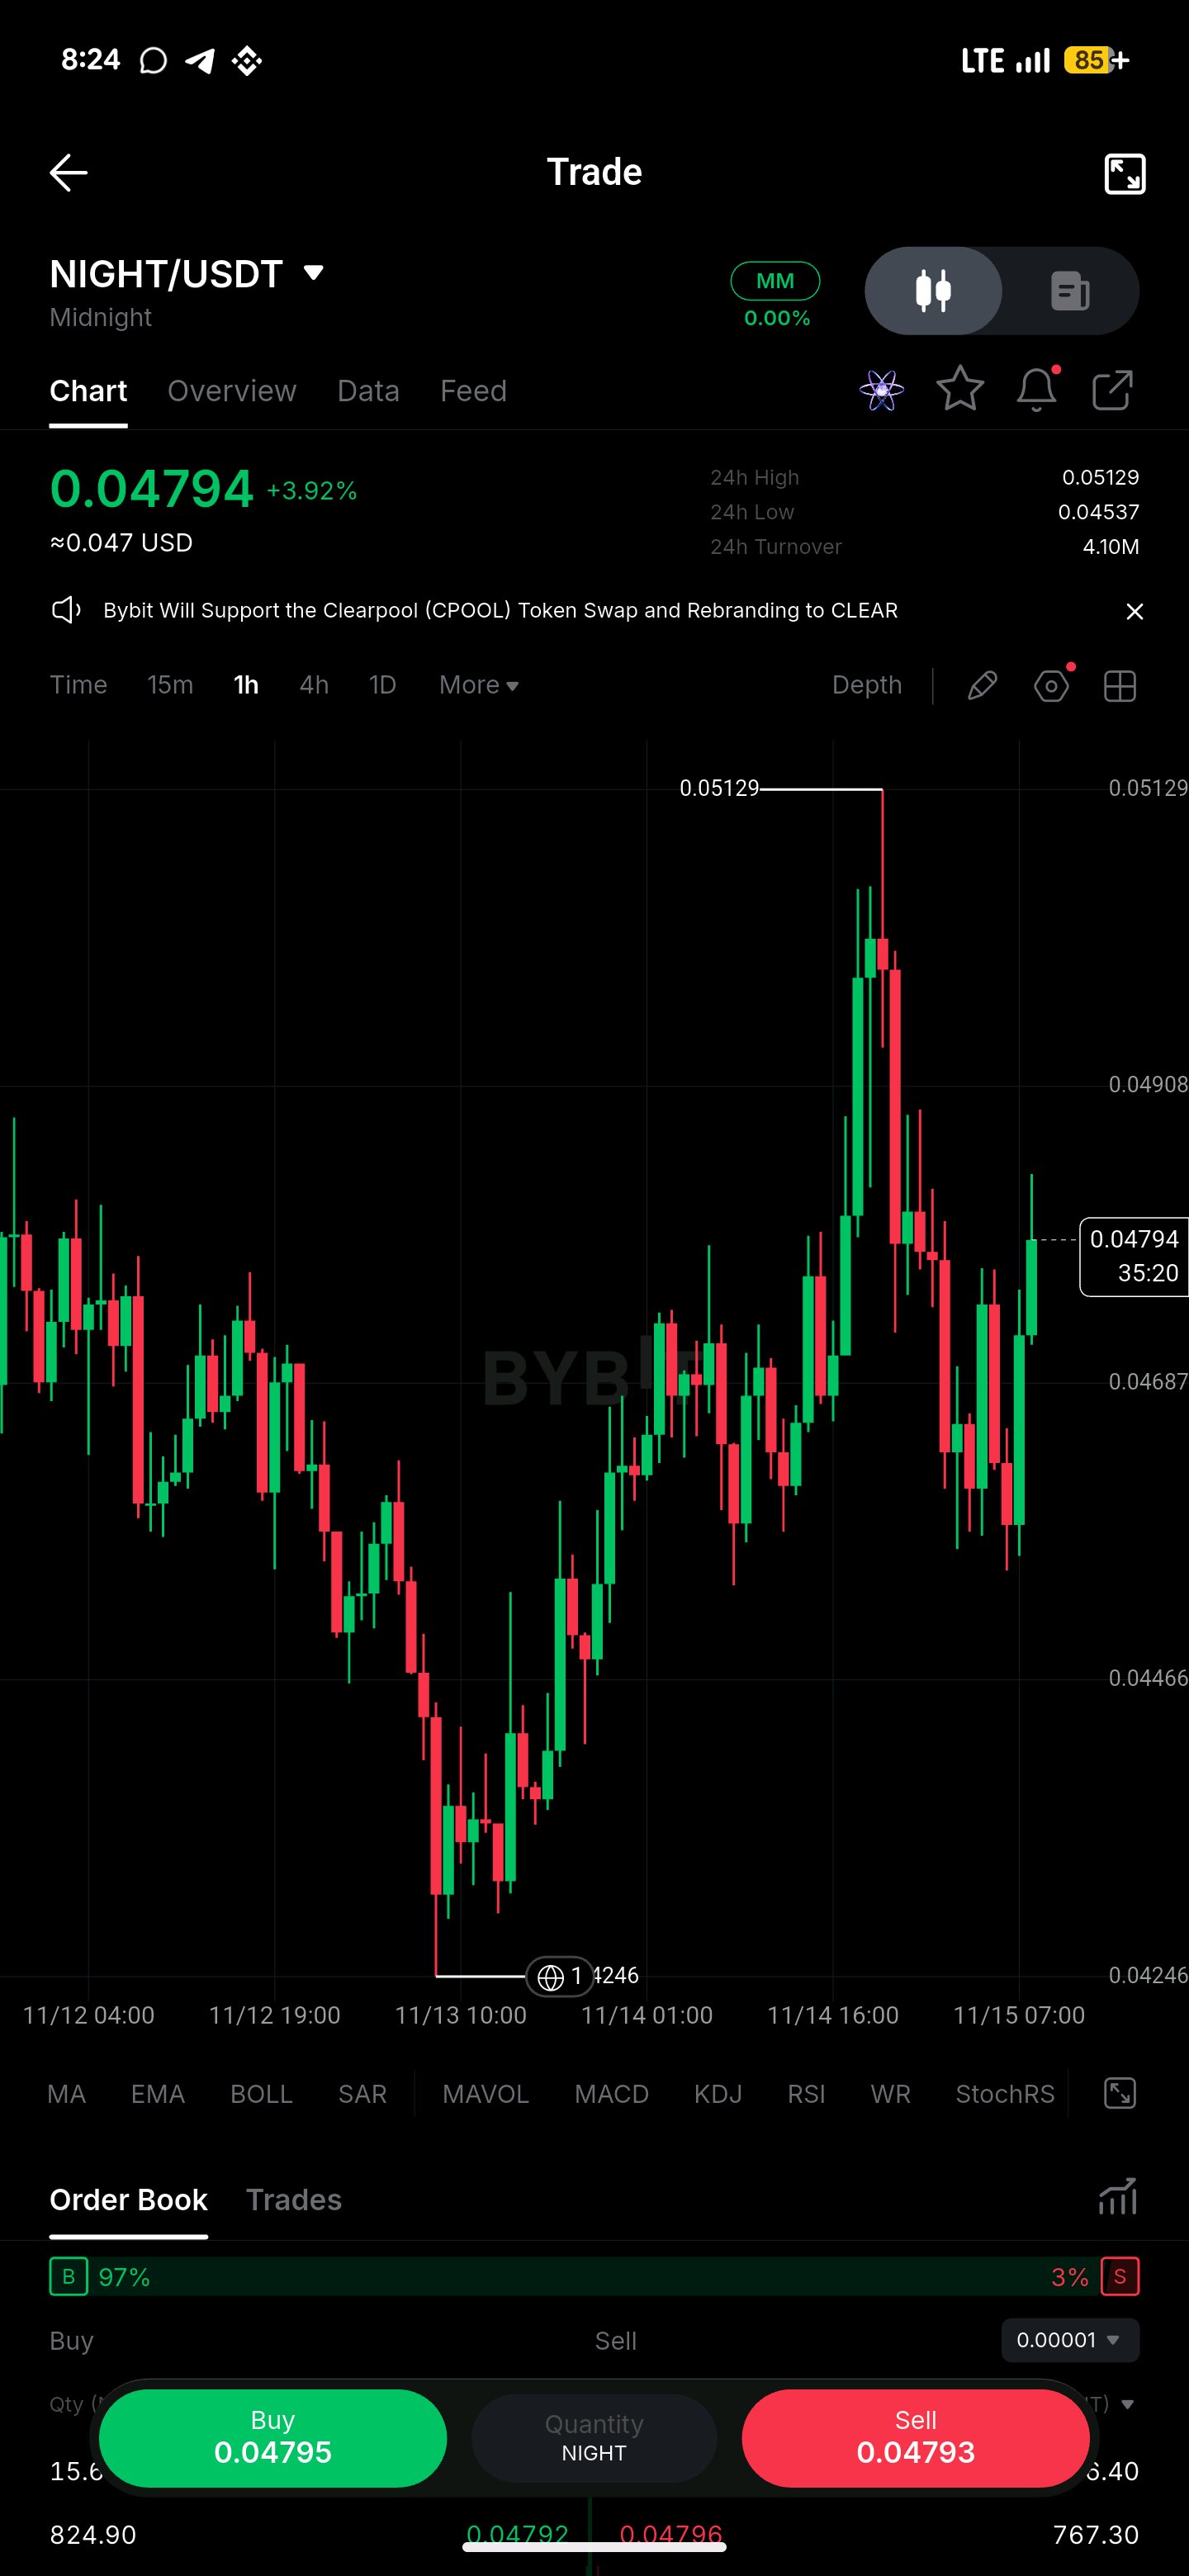
$NIGHTUSDT – Higher Timeframe Overview | Long on Pullback** Pair: $NIGHTUSDT (1H chart) **Market Observation** NIGHT has been choppy over the last few sessions. It sold off to the 0.04246 low on Nov 13, bounced, then pushed up to 0.05129 on Nov 14 before sellers stepped in. That rejection was quick, and price gave back most of the move before buyers showed up again. It's now trading around 0.04794, recovering, but still below the highs. I didn't get a clean entry on the push toward 0.05129, and I'm not interested in chasing a bounce after a rejection like that. I'd rather let price come back to me. **Current Outlook and Key Levels** *Buying Zone: 0.04537 – 0.04687* This area contains the recent 24h low at 0.04537 and the 0.04687 level that price has traded around repeatedly. It's where buyers defended the last pullback. I'd want to see a clear reaction here before treating it as a real entry: a wick rejection, a strong 1H close back above the zone, or a visible slowdown in selling. *Resistance Zone: 0.04908 – 0.05129* The 0.05129 high is the obvious ceiling, and 0.04908 is the first area where the last rally stalled. Sellers have already shown up in this range once. A breakout and sustained consolidation above 0.05129 would mean the market has accepted higher prices. A quick wick above that fails to hold would not. **Trading Setup** **Position:** Long on pullback **Entry Zone:** 0.04537 – 0.04687 (potential zone, not a confirmed entry until buyers react) **Stop-Loss:** Below 0.04466 **Invalidation:** A 1H close below 0.04466 means the pullback zone has failed and the structure is shifting back toward the 0.04246 low. At that point the long idea is off. **Take-Profits:** - TP1: 0.04908 - TP2: 0.05129 - TP3: Not defined. No verified level sits above 0.05129 on this chart, so I'd reassess if price breaks and holds there. **Why This Setup Makes Sense** The last rally to 0.05129 was impulsive and got rejected almost immediately. Entering near the highs would mean buying right where sellers have already acted, with a distant stop and little room. A pullback into 0.04537–0.04687 gives a tighter stop below 0.04466, and targets at levels the market has already respected. The zone only matters if buyers defend it. If price slices through without a reaction, there's no reason to be long. Waiting for confirmation means a smaller, cleaner risk instead of an emotional entry. TP1 at 0.04908 is the first realistic test of whether the recovery has strength, and TP2 retests the high. **Risk Management** Stick to the plan. Don't move or ignore the stop-loss, and size the position so a stop-out is an acceptable loss. A bullish structure can fail, and no setup guarantees a profit. This is not financial advice. *Note: Entry, stop and targets are derived from the levels visible on the chart. Adjust them if you have your own levels.* #ByXIMPACT
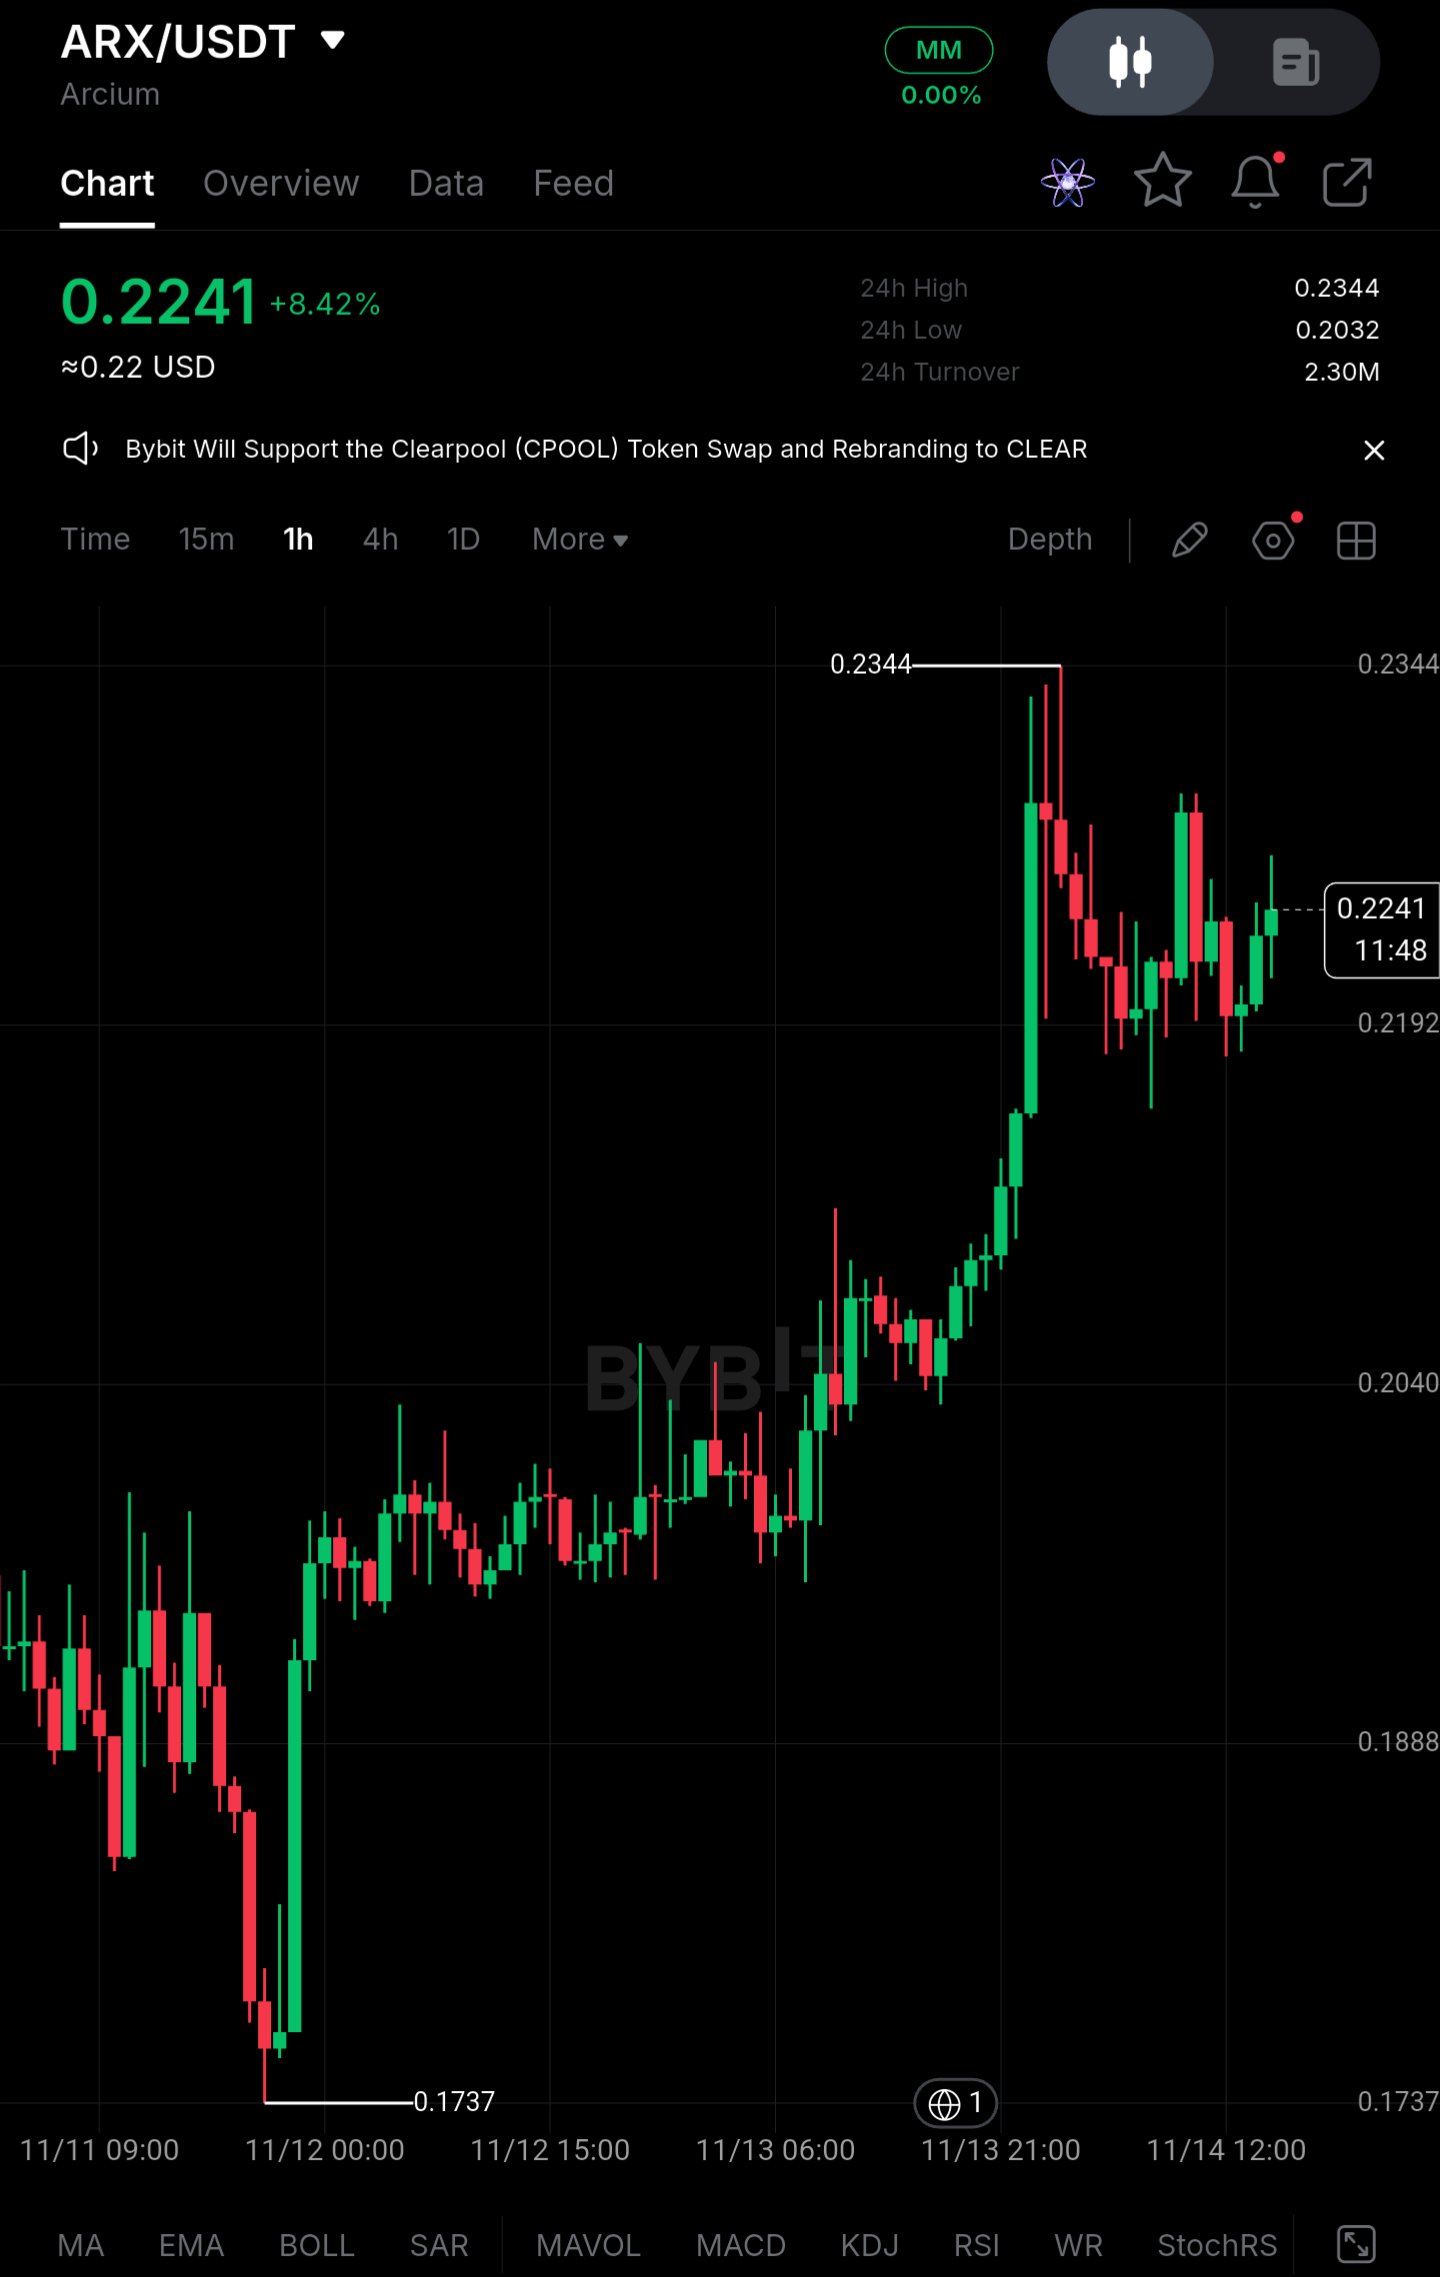
$ARXUSDT : Pullback From 0.2344 Is Not a Confirmed Trend Reversal** ARX is trading near 0.2241 after a sharp 1H rally off the 0.1737 low, and I am not treating the current pause below the high as a durable recovery. The advance was fast and thinly traded, and the key question is whether spot demand can absorb profit-taking while derivatives positioning stays long-tilted. **Price Action** - Current price: 0.2241 (+8.42% on 24h, about $0.22) - Recent low: 0.1737, which has since been followed by a roughly 35% expansion to the 0.2344 high - Pullback from the high: about 4.4%, with price holding in a 0.2190–0.2280 band - Immediate resistance: 0.2344, with a minor supply pocket near 0.2280 - First support: 0.2192, then the 0.2040 / 0.2032 zone (24h low) A reclaim and hold above 0.2344 would shift the structure toward continuation. Until then, the move reads as a vertical impulse followed by distribution-style consolidation, with lower highs forming inside the range. **Large Capital Picture** There are no ETF flows to reference, so the read comes from price behavior. The impulse candle around 11/13 21:00 expanded in a single hour, which is more consistent with concentrated large-wallet buying or a short squeeze than with broad accumulation. The follow-through since has been inconsistent: long upper wicks near 0.2344 and repeated rejections show supply is still being sold into strength. Large holders may be using the liquidity to reduce exposure. **Liquidity & Range Conditions** 24h turnover is about 2.30M, which is thin for a move of this size. Price is now compressing in a narrow range after the spike. A narrow range after a vertical move is not evidence of accumulation, and it more often precedes expansion in either direction. Without stronger spot participation, thin liquidity amplifies downside in the event of a break. **Derivatives Positioning** These figures are estimates based on typical behavior after a move like this, not verified readings. - Open interest: likely elevated relative to spot turnover after the rally - Funding: likely positive, meaning longs are paying shorts - Long share of accounts: likely above 55% If support gives way, this positioning creates vulnerability. Late longs entered near the highs and have little cushion above 0.2192, so a break could trigger a cascade of liquidations toward the 0.2040 area. **Key Figures** - Current price: 0.2241 - 24h high / low: 0.2344 / 0.2032 - Immediate resistance: 0.2344 - First support: 0.2192 - Secondary support: 0.2040–0.2032 - Major swing low: 0.1737 - 24h turnover: about 2.30M - Funding / long share (est.): positive / above 55% **Confirmation Levels** - **Bullish:** A sustained 1H close above 0.2344 with rising spot volume opens 0.2450–0.2500 and invalidates the distribution reading. - **Bearish:** A 1H close below 0.2192 exposes 0.2040–0.2032, and a failure there reopens 0.1888 and the 0.1737 low. **Closing** The current stabilization is real but unconfirmed. Large-capital selling into strength and crowded long positioning are competing with the recovery attempt. The decisive signal is whether spot buyers return and defend 0.2192 while leverage stays controlled, or whether a breakdown below that level triggers fresh long liquidations. #ByXIMPACT
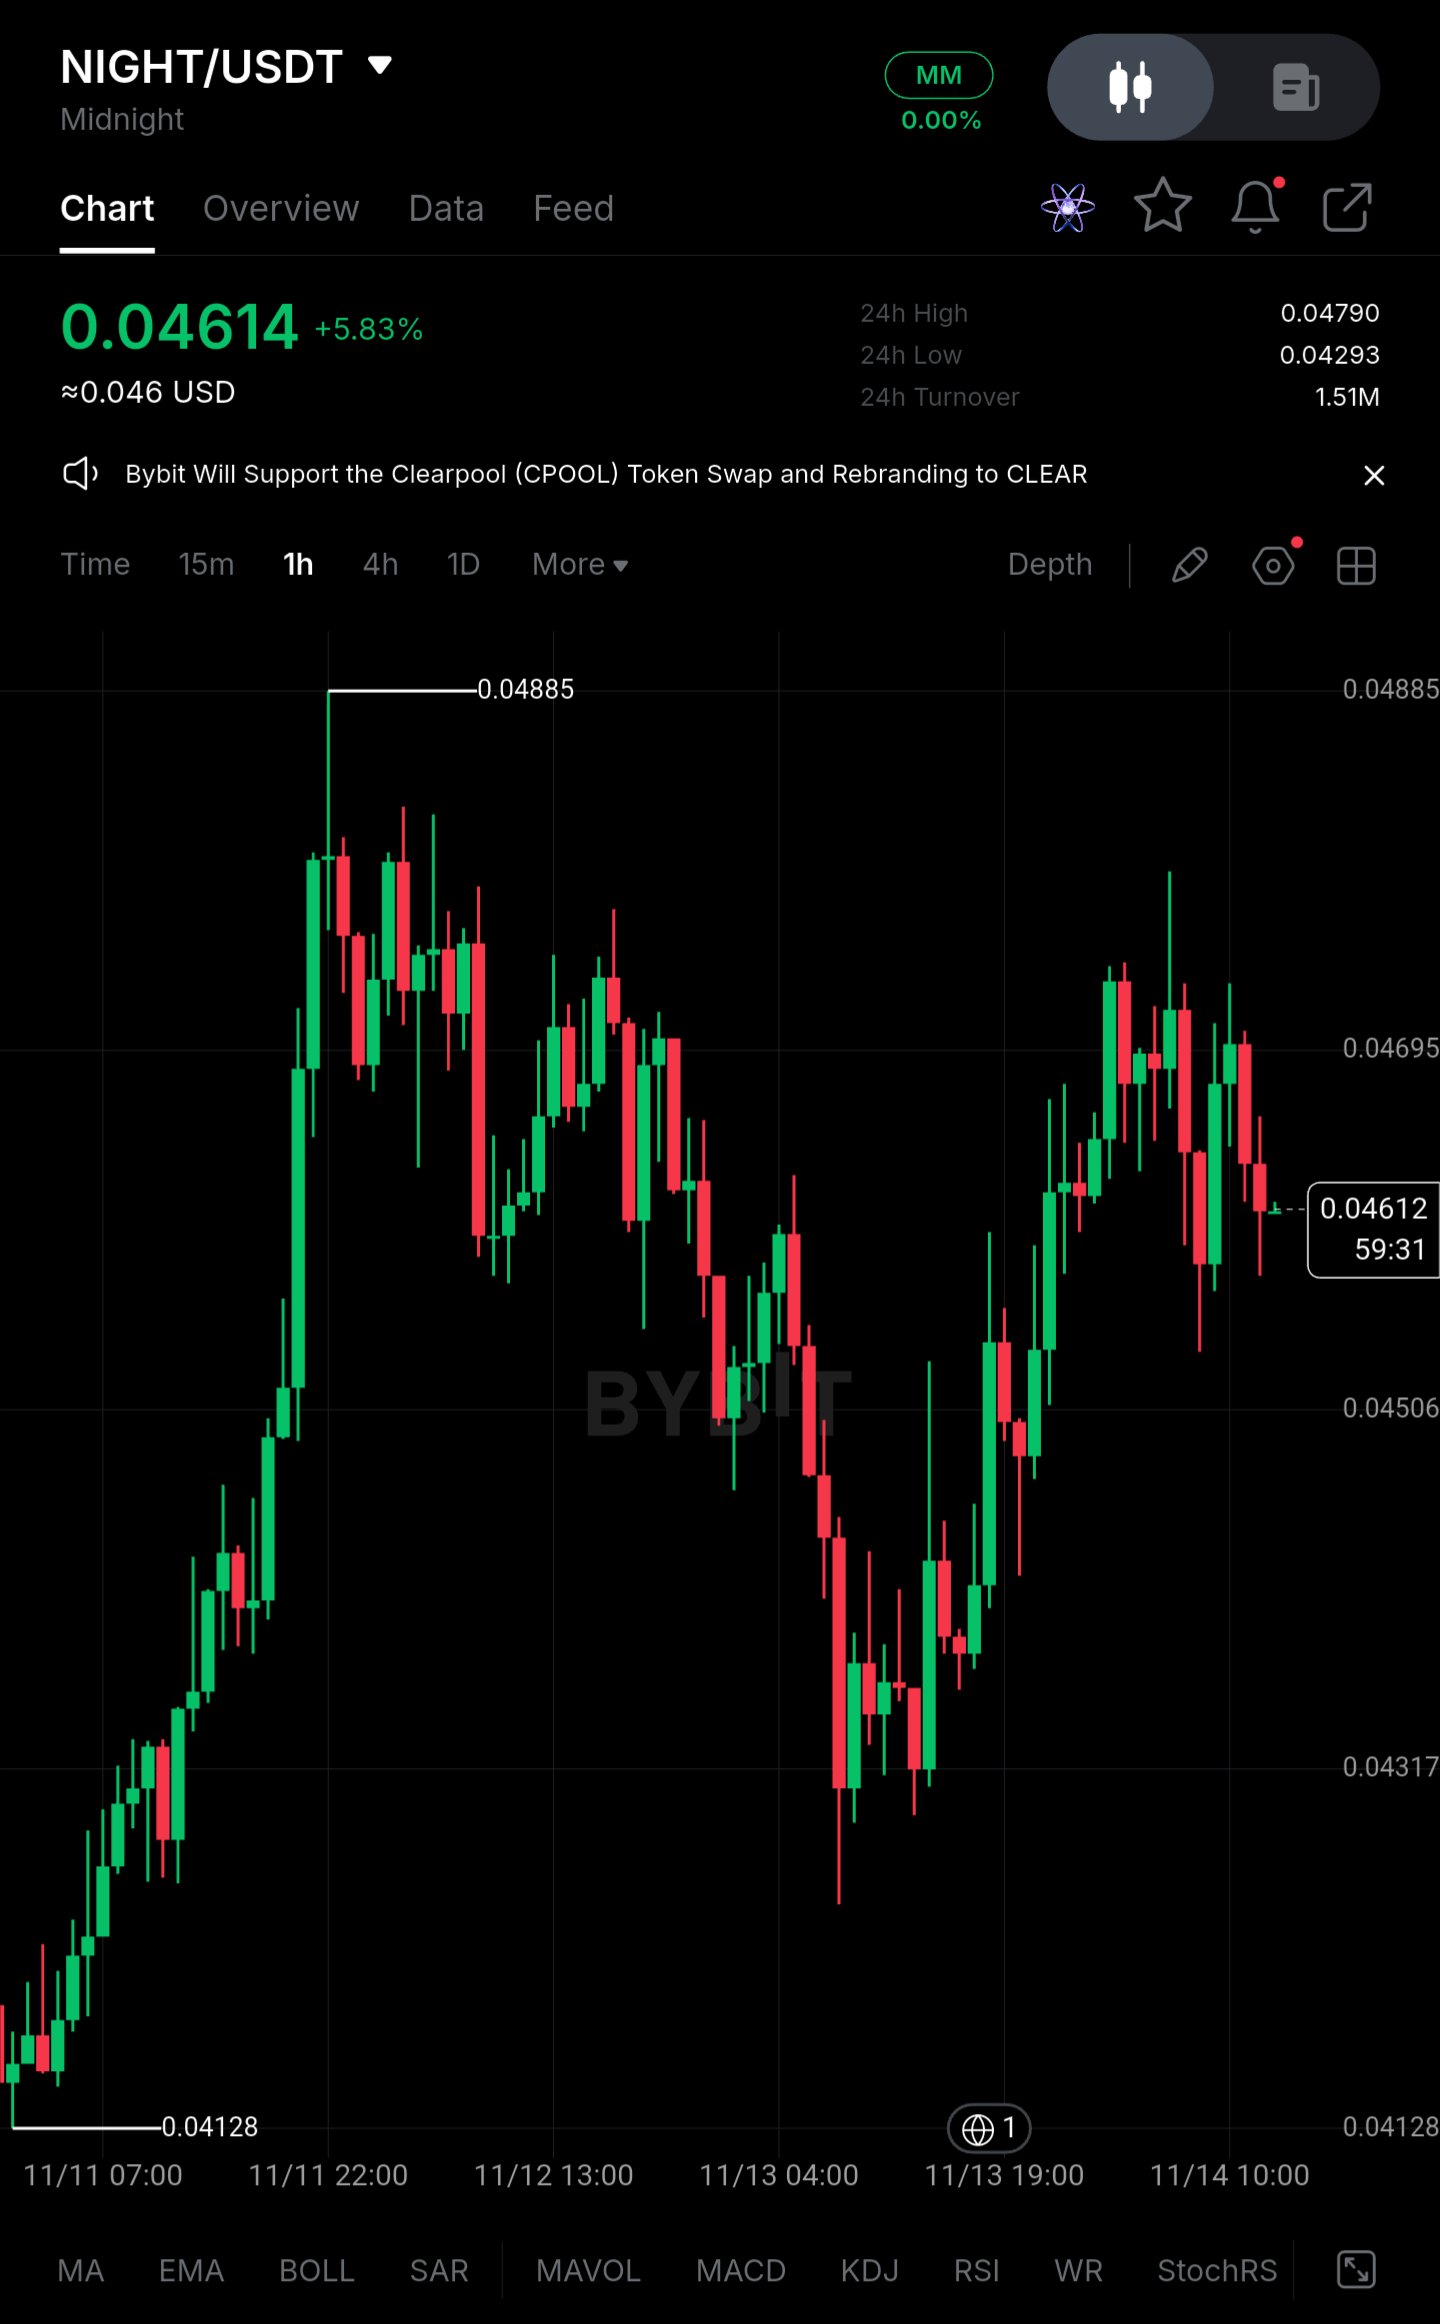
$NIGHTUSDT Range-Bound Below 0.04885, Not a Recovery Yet** NIGHT is trading near 0.04614, roughly 5.5% above the 0.04293 24h low and about 5.6% below the 0.04885 swing high. I'm not treating this stabilization as a recovery. The sharp advance from 0.04128 has stalled, and the last two rebounds peaked below the prior high. **Price Action** - Current price: 0.04614 (+5.83% on the day) - Recent low on chart: 0.04128 - Swing high: 0.04885 - 24h range: 0.04293 – 0.04790 - Immediate resistance: 0.04695, then 0.04790 (24h high) - First support: 0.04506, then 0.04317 Reclaiming 0.04790 and holding it would be the first sign buyers are regaining control of the range. Until then, the structure is a failed push toward highs followed by a pullback, which keeps the broader picture under pressure. **Institutional / Large Capital Picture** The chart carries no data on large-wallet movements, exchange flows or token unlocks, so I'm not going to infer any. What price does show is inconsistent demand. The advance from 0.04128 to 0.04885 was strong, but the retracement to roughly 0.04317 retraced a large part of it, and the second rebound failed to make a higher high. That pattern is consistent with sellers using strength to distribute rather than with sustained accumulation. **Liquidity & Range Conditions** Price has been rotating between roughly 0.04317 and 0.04885 for over two days. A range after a failed breakout is not evidence of accumulation. With 24h turnover at 1.51M, participation looks thin for a move of this size, and thin books make both directions prone to sharp wicks. Stronger spot participation is still needed. **Derivatives Positioning** Open interest, funding rate and the long/short ratio are not visible on this chart, so I'm not quoting figures. These are the numbers to check before acting. After a +5.83% daily move, positive funding and long-heavy positioning would be a vulnerability: a loss of 0.04506 could trigger forced long liquidations toward 0.04317 rather than an orderly retest. **Key Figures** - Current price: 0.04614 - Immediate resistance: 0.04695 - Upper resistance: 0.04790 (24h high), 0.04885 (swing high) - Support: 0.04506, then 0.04317 - Recent low: 0.04128 (chart low), 0.04293 (24h low) - OI / funding / long %: not verified from the chart **Confirmation Levels** - **Bullish:** A hold above 0.04790 would open 0.04885. A move through 0.04695 alone is not enough, since it still sits inside the range. - **Bearish:** A sustained close below 0.04506 exposes 0.04317, and a break of that level would put the 0.04128 low back in play. **Closing** The stability here is temporary until proven otherwise. A rejection from the highs and the possibility of crowded long positioning are working against the recovery attempt. The deciding signal is whether spot buyers return with leverage under control, or whether a break below 0.04506 triggers fresh long liquidations. #ByXIMPACT
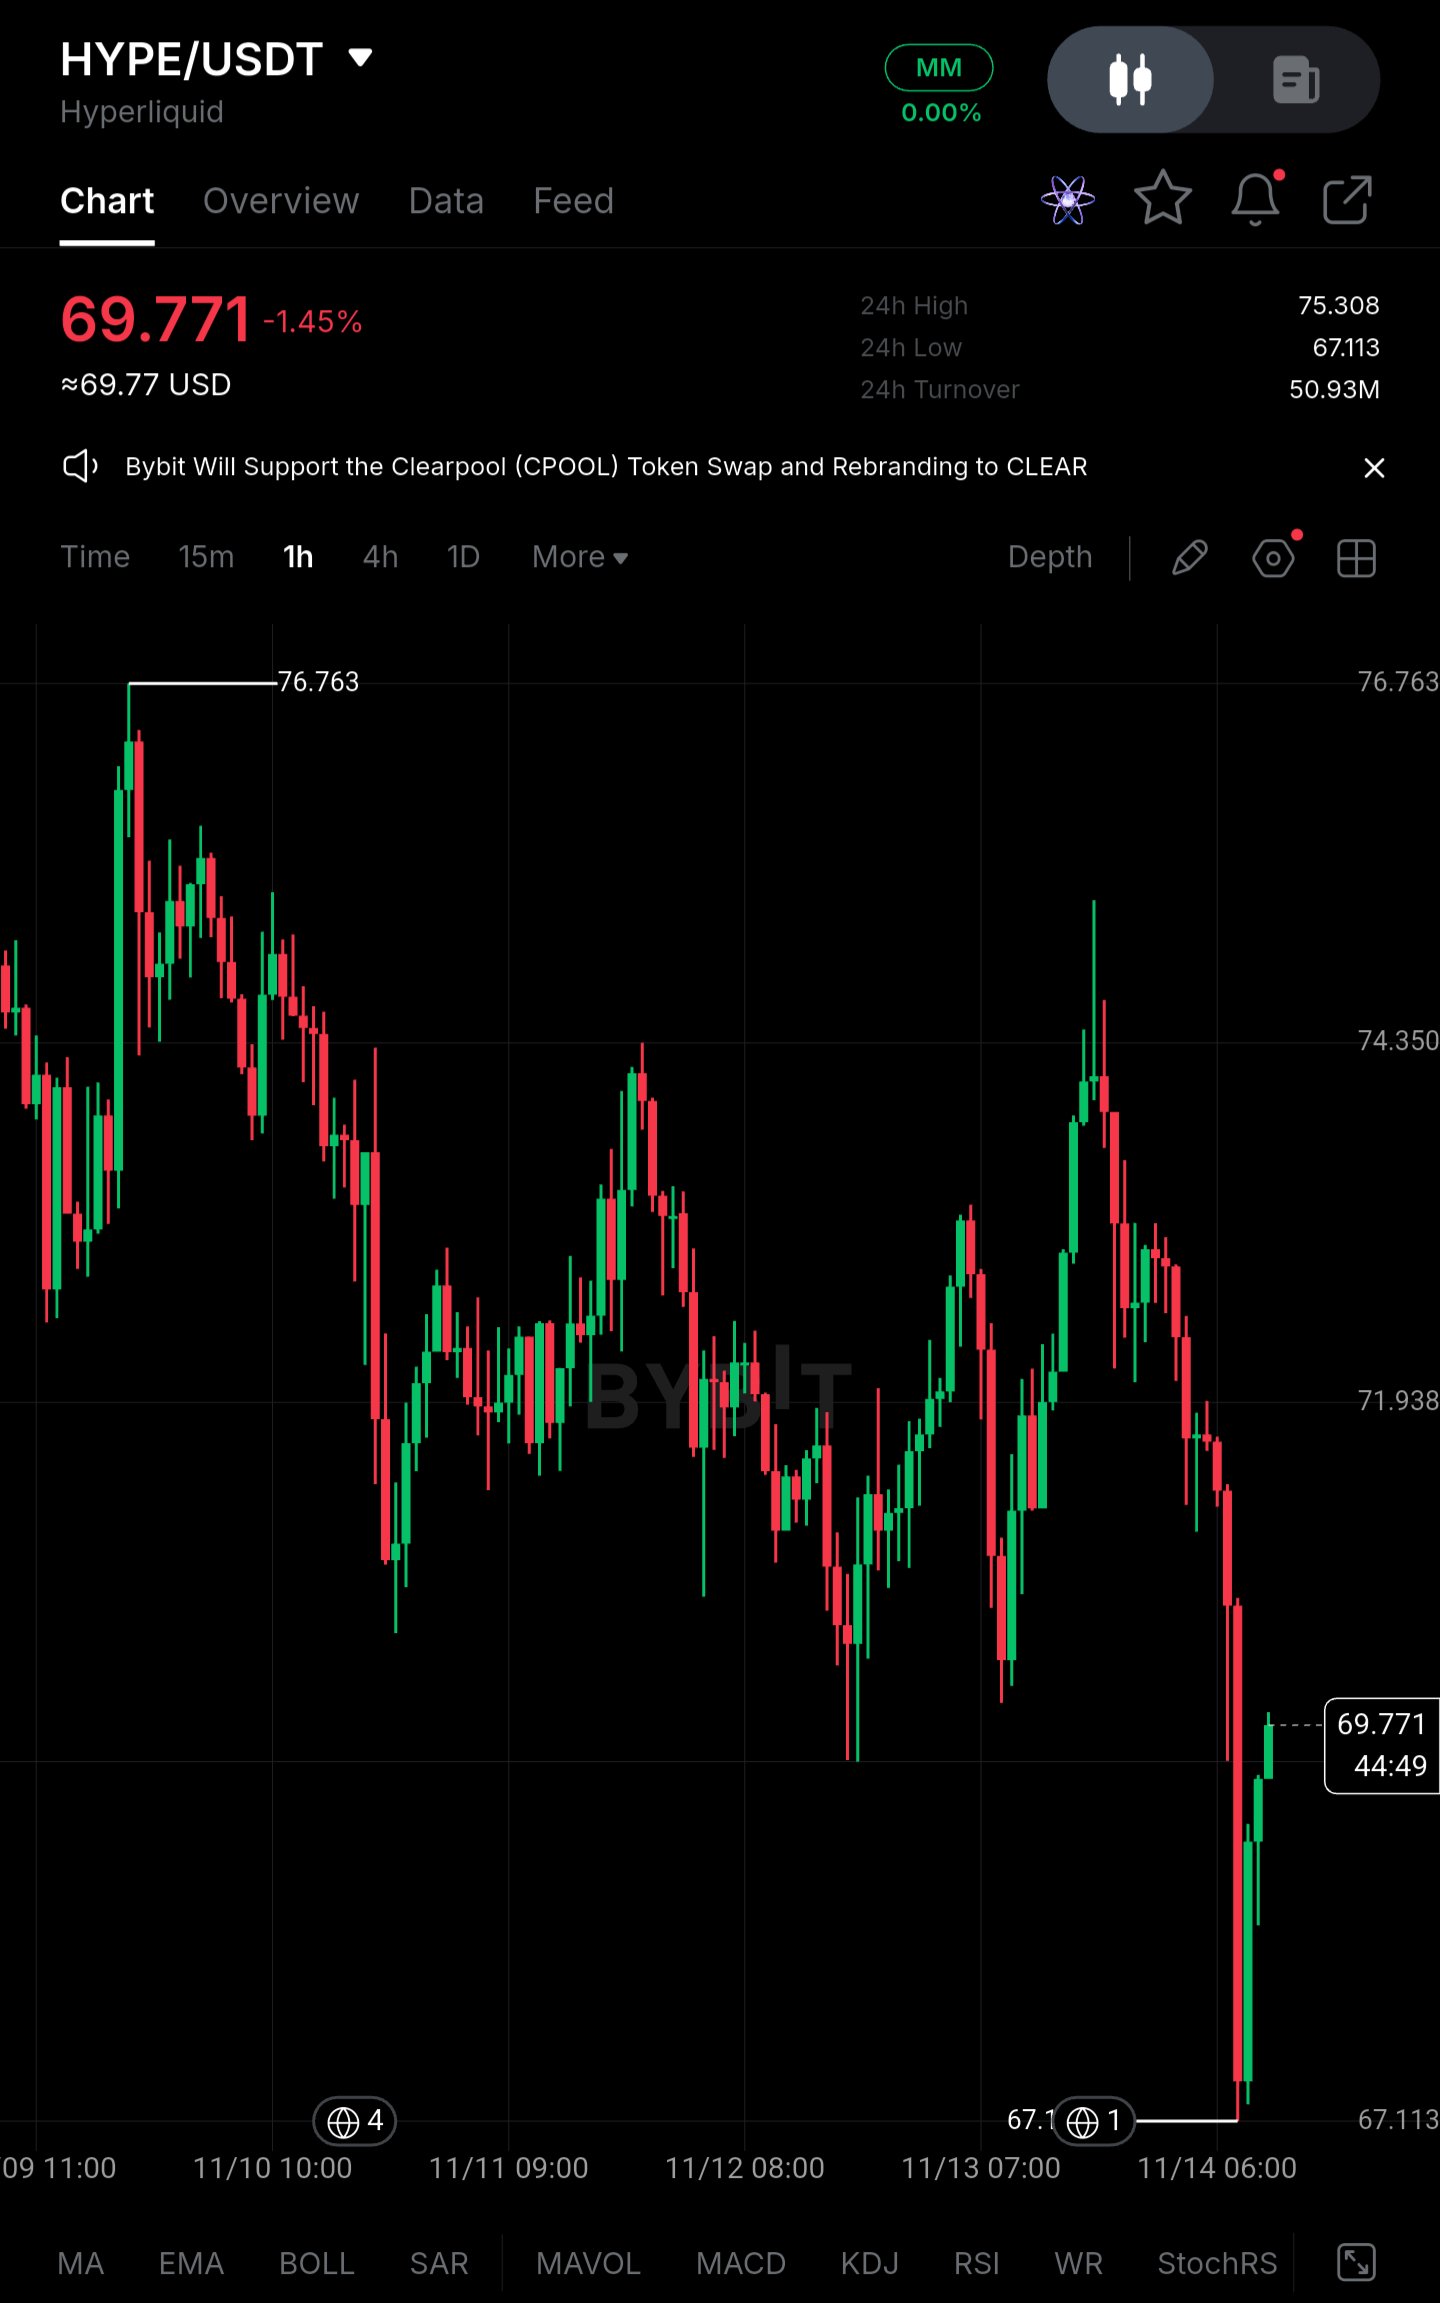
$HYPEUSDT – Gambaran Timeframe Lebih Tinggi | Long saat Pullback (Kondisional)** Pair: $HYPEUSDT HYPE telah menghabiskan beberapa hari terakhir dalam kisaran choppy dengan bias menurun. Level tertinggi terus merendah dari 76.763, dan penurunan terakhir jatuh tajam ke 67.113 sebelum rebound membawa harga kembali ke sekitar 69.771. Saya tidak mendapatkan entry yang bersih pada ayunan sebelumnya, dan saya tidak tertarik mengejar rebound dari satu kali flush saja. **Prospek Saat Ini dan Level Kunci** **Zona Pembelian (Buying Zone): 67.113 – 69.000 (kondisional)** Level terendah 67.113 adalah titik terendah pada chart ini, dan wick tajam ke bawah serta pemulihannya menunjukkan bahwa pembeli masuk di sana. Saya akan menganggap pengujian ulang area ini layak untuk diperhatikan, tetapi hanya jika harga menunjukkan reaksi, seperti wick penolakan atau terbentuknya level terendah yang lebih tinggi (higher low) di atas 67.113. Batas atas 69.000 adalah referensi saya sendiri untuk pullback, bukan level yang ditandai oleh chart, jadi sesuaikan dengan analisis Anda sendiri. **Zona Resistance: 71.938 – 74.350** Kedua level ini diuji berulang kali selama range, dan setiap dorongan ke sana selalu terkena aksi jual. Penembusan bersih dan bertahan di atas 71.938 akan menjadi tanda pertama bahwa urutan lower-high (level tertinggi yang lebih rendah) berakhir. Penerimaan (acceptance) di atas 74.350 akan membuat swing high 76.763 kembali berperan. **Setup Trading** **Posisi:** Long saat pullback, hanya setelah reaksi terkonfirmasi **Zona Entry:** 67.113 – 69.000, dengan konfirmasi pembeli. Bukan limit order buta. **Stop-Loss:** Di bawah 67.113. Saya tidak menetapkan angka pasti karena chart tidak menandai level yang terverifikasi di bawah level terendah tersebut. **Invalidasi:** Penutupan yang berkelanjutan di bawah 67.113 berarti flush low gagal bertahan. Rebound tersebut berarti hanyalah jeda, bukan pembalikan, dan setup tidak lagi berlaku. **Take-Profit:** - TP1: 71.938 - TP2: 74.350 - TP3: 76.763 (swing high sebelumnya, hanya jika 74.350 ditembus dan harga bertahan di atasnya) **Mengapa Setup Ini Masuk Akal** Pergerakan terakhir adalah penurunan tajam dan cepat yang diikuti oleh rebound cepat. Membeli rebound di dekat 69.771 menempatkan stop jauh di bawah dengan target pertama hanya berjarak dekat, jadi risk-to-reward-nya buruk. Pengujian ulang pada level terendah memberikan stop yang lebih ketat dan menguji apakah pembeli mempertahankannya untuk kedua kalinya. Sentuhan pertama pada flush low sering kali diuji kembali, dan reaksi pada pengujian ulang tersebut memberi tahu Anda lebih banyak daripada wick awal. Target mengikuti level yang telah bertindak sebagai resistance, jadi ini adalah tempat yang masuk akal untuk mengambil profit sementara struktur masih membuat lower highs. Jika harga menembus 67.113 tanpa reaksi, tidak ada trade, dan menunggu tidak memakan biaya apa pun. **Manajemen Risiko** Hargai rencana tersebut dan jangan memindahkan atau menghapus stop. Sesuaikan ukuran posisi agar stop-out menjadi kerugian yang bisa Anda terima. Rebound bisa gagal, dan tidak ada setup yang menjamin keuntungan. *Catatan: level berasal dari chart 1H saja. Pemeriksaan 4H atau harian akan membantu mengonfirmasi struktur yang lebih luas.* $ByXIMPACT
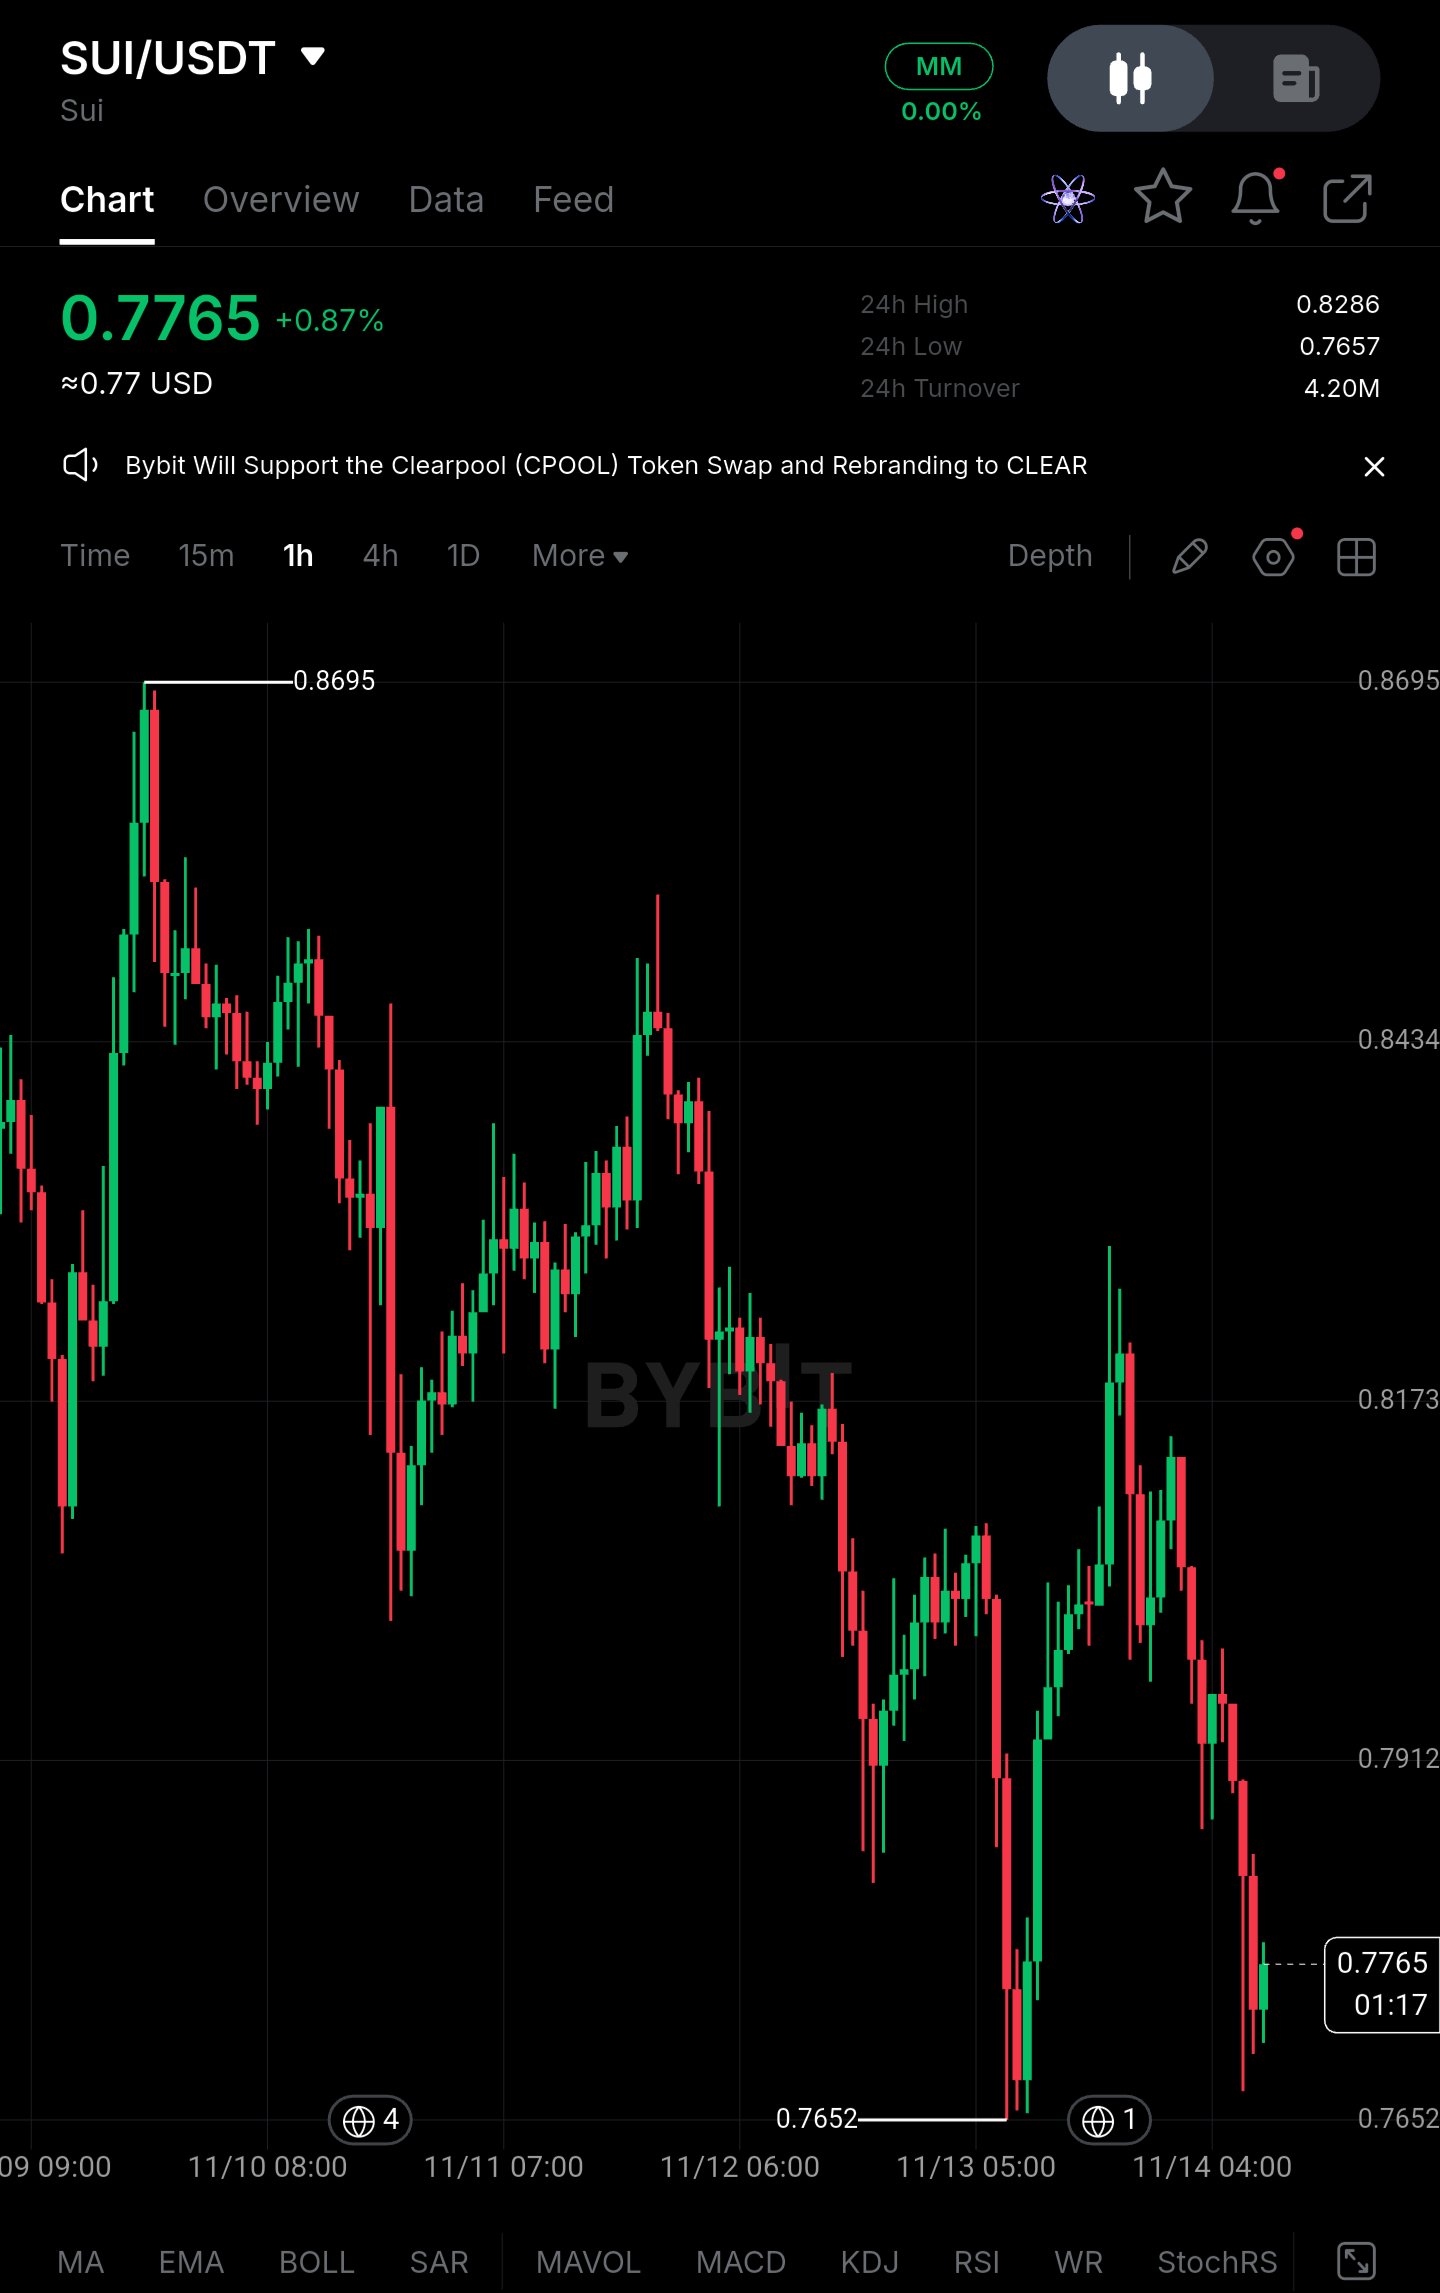
SUIUSDT Tertahan di Atas 0,7652, tapi Ini Belum Menjadi Pemulihan** SUI diperdagangkan mendekati 0,7765, tepat di atas level terendah 0,7652 yang ditetapkan pada grafik 1 jam. Saya tidak menganggap stabilisasi ini sebagai pemulihan. Strukturnya masih berupa rangkaian lower high (puncak yang lebih rendah), dan sejauh ini setiap pantulan selalu diiringi aksi jual. **Aksi Harga** - Harga saat ini: 0,7765 (+0,87% hari ini) - Level terendah baru-baru ini: 0,7652 - Swing high sebelumnya: 0,8695, jadi harga berada sekitar 10,7% di bawah puncak tersebut - Kisaran 24 jam: 0,7657 – 0,8286 - Resistance terdekat: 0,7912, lalu 0,8173 - Support pertama: 0,7652–0,7657, yang sudah diuji oleh harga Reclaim atau kembali ke level 0,8173 akan menjadi tanda pertama bahwa rangkaian lower high mulai terpatahkan. Sampai saat itu, tren yang lebih luas masih berada di bawah tekanan. **Gambaran Institusional / Modal Besar** Grafik tidak menunjukkan arus ETF, pergerakan dompet besar (large-wallet), atau arus keluar bursa, dan saya tidak akan menyimpulkannya dari harga. Apa yang ditunjukkan oleh grafik adalah aksi jual yang datang secara bergelombang. Setiap rebound dari 0,7652 mereda di bawah puncak sebelumnya, yang konsisten dengan penawaran (supply) yang menyerap permintaan (demand) alih-alih permintaan yang mengambil kendali. **Likuiditas & Kondisi Kisaran** Kisaran harga baru-baru ini cenderung ketat dibandingkan penurunannya. Jeda setelah penurunan tajam bukanlah bukti akumulasi. Volume perdagangan 4,20 juta selama 24 jam tidak menunjukkan jenis partisipasi spot berkelanjutan yang akan mengubah kisaran ini menjadi basis. **Posisi Derivatif** Open interest, tingkat pendanaan (funding rate), dan rasio long/short tidak terlihat pada grafik ini, jadi saya tidak mencantumkan angkanya. Ini adalah bagian yang harus diperiksa sebelum bertindak. Jika pendanaan positif dan posisi cenderung long setelah penurunan ini, itu adalah kerentanan. Penembusan di bawah 0,7652 kemudian akan berisiko memicu likuidasi posisi long paksa alih-alih retest yang teratur. **Angka-Angka Kunci** - Harga saat ini: 0,7765 - Resistance terdekat: 0,7912 - Resistance berikutnya: 0,8173, dengan 0,8434 di atasnya - Support: 0,7652–0,7657 - Swing high baru-baru ini: 0,8695 - OI / pendanaan / % long: tidak terverifikasi dari grafik **Level Konfirmasi** - **Bullish:** Bertahan di atas 0,8173 akan membuka jalan ke 0,8434. Pergerakan melewati 0,7912 saja tidak cukup, karena masih berada di dalam tren turun. - **Bearish:** Penutupan yang berkelanjutan di bawah 0,7652 membatalkan stabilisasi. Tidak ada support terverifikasi yang dipetakan di bawah level tersebut pada grafik ini, jadi breakdown akan membuat harga rentan terhadap penurunan cepat. **Penutup** Stabilitas di sini bersifat sementara sampai terbukti sebaliknya. Struktur lower high dan kemungkinan posisi long yang ramai sedang menghambat upaya pemulihan. Sinyal penentunya adalah apakah pembeli spot kembali dengan leverage yang terkendali, atau apakah penembusan di bawah 0,7652 memicu likuidasi long baru. ByXIMPACT
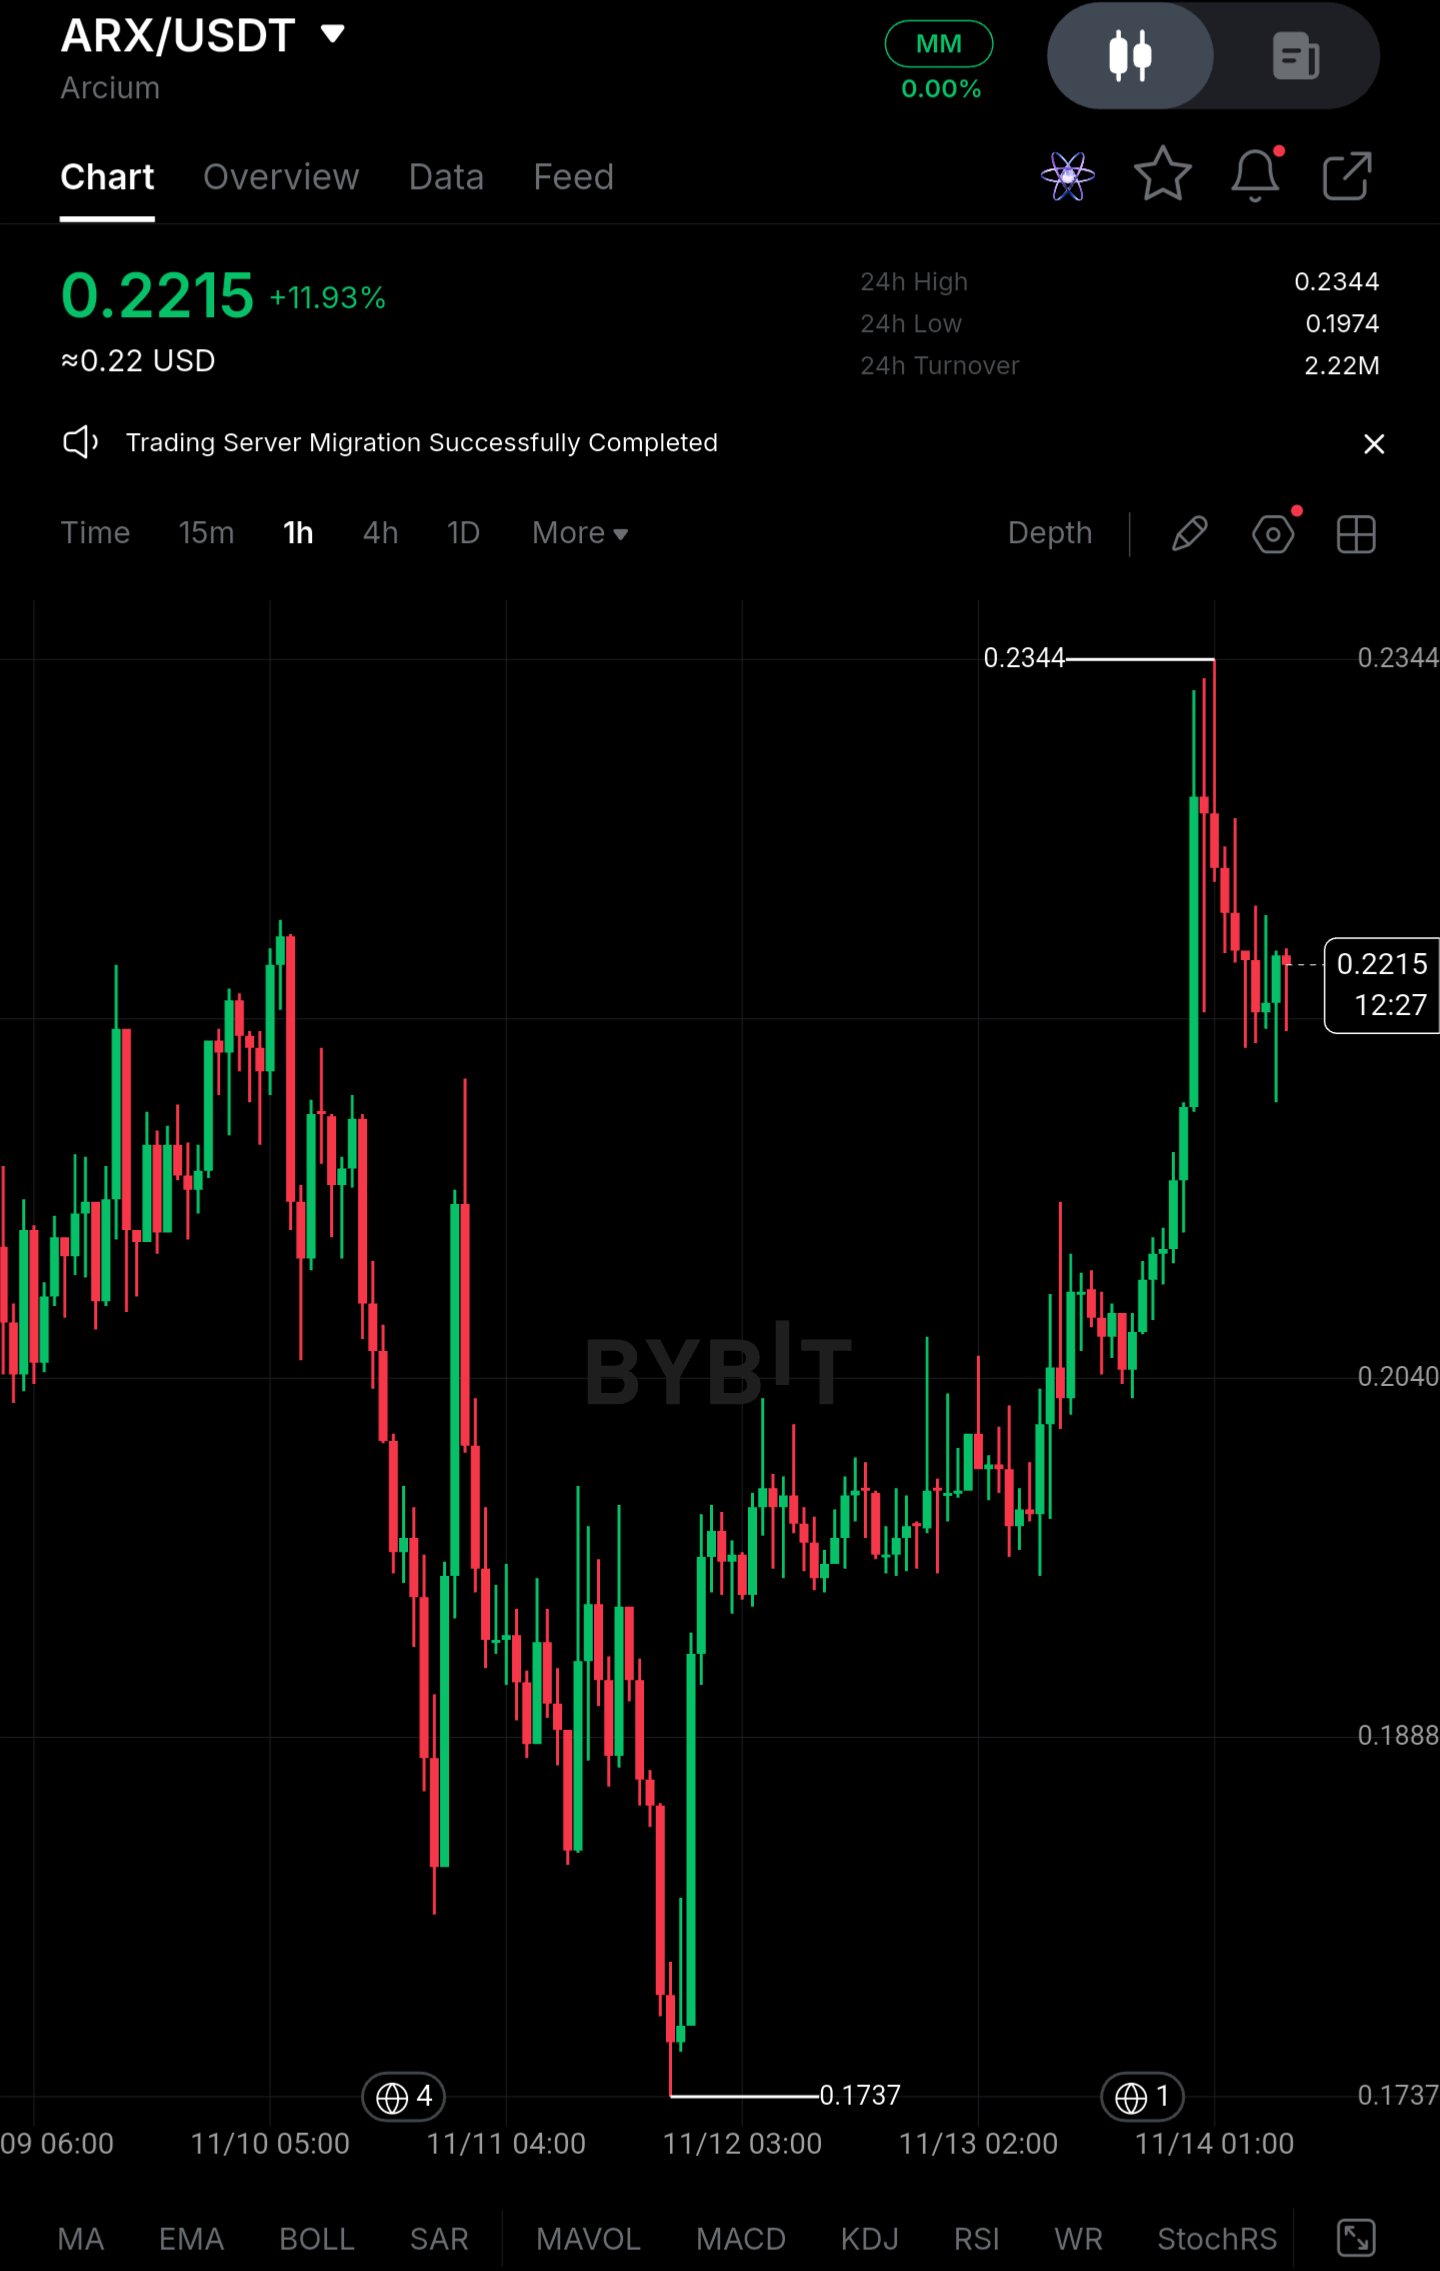
$ARXUSDT (Arcium) – Higher Timeframe Overview | Long on Pullback** Pair: $ARXUSDT ARX has been recovering steadily after bottoming near 0.1737 on 11/12. Price spent some time building a base, then pushed hard to a high of 0.2344 before cooling off. It's now trading around 0.2215, up roughly 12% on the day. I didn't get in near the lows, and I'm not interested in chasing a candle that has already moved this far. **Current Outlook and Key Levels** **Buying Zone: 0.1974 – 0.2040** This is where price consolidated before the breakout, and 0.1974 is the 24h low. If the market pulls back, this is the first area where previous resistance could act as support. I'd want to see buyers defend it with a reaction, such as a wick rejection or a higher low forming, before treating it as a real entry. **Resistance Zone: 0.2344** This is the recent high, where the impulse stalled and sellers stepped in. A clean break and sustained hold above it would suggest the recovery is turning into a larger higher-low structure. A quick spike above with no follow-through would not. **Trading Setup** **Position:** Long on pullback **Entry Zone:** 0.1974 – 0.2040, only after buyers show a reaction **Stop-Loss:** Below 0.1974. I'm not assigning a specific number because the chart doesn't give me a verified level under it. **Invalidation:** A sustained close below 0.1974 means the pre-breakout base has failed. It would also put price back inside the old range, and the bullish structure would no longer apply. **Take-Profits:** - TP1: 0.2344 (retest of the recent high) - TP2 and TP3: I'm leaving these open. Above 0.2344 there are no verified levels on this chart, so I'd reassess if price breaks and holds there. **Why This Setup Makes Sense** After an impulsive move like this, entering near 0.22 puts the stop a long way down and leaves little room before the 0.2344 high. Waiting for a pullback into 0.1974–0.2040 gives a much tighter stop. It also puts the entry at a level the market has already shown interest in. The buyer reaction matters, because a zone alone doesn't guarantee a bounce. If price slices through it without reacting, the setup is off and there's no trade. If it holds, TP1 at the recent high gives a defined and realistic first objective. Patience and confirmation beat paying up for momentum. **Risk Management** Respect the plan and don't move or ignore the stop. Size the position so a stop-out is a loss you can accept. A bullish structure can fail, and no setup guarantees a profit. *Note: the levels above come from the 1H chart provided. A true higher-timeframe view (4H or daily) would help confirm them.* #ByXIMPACT
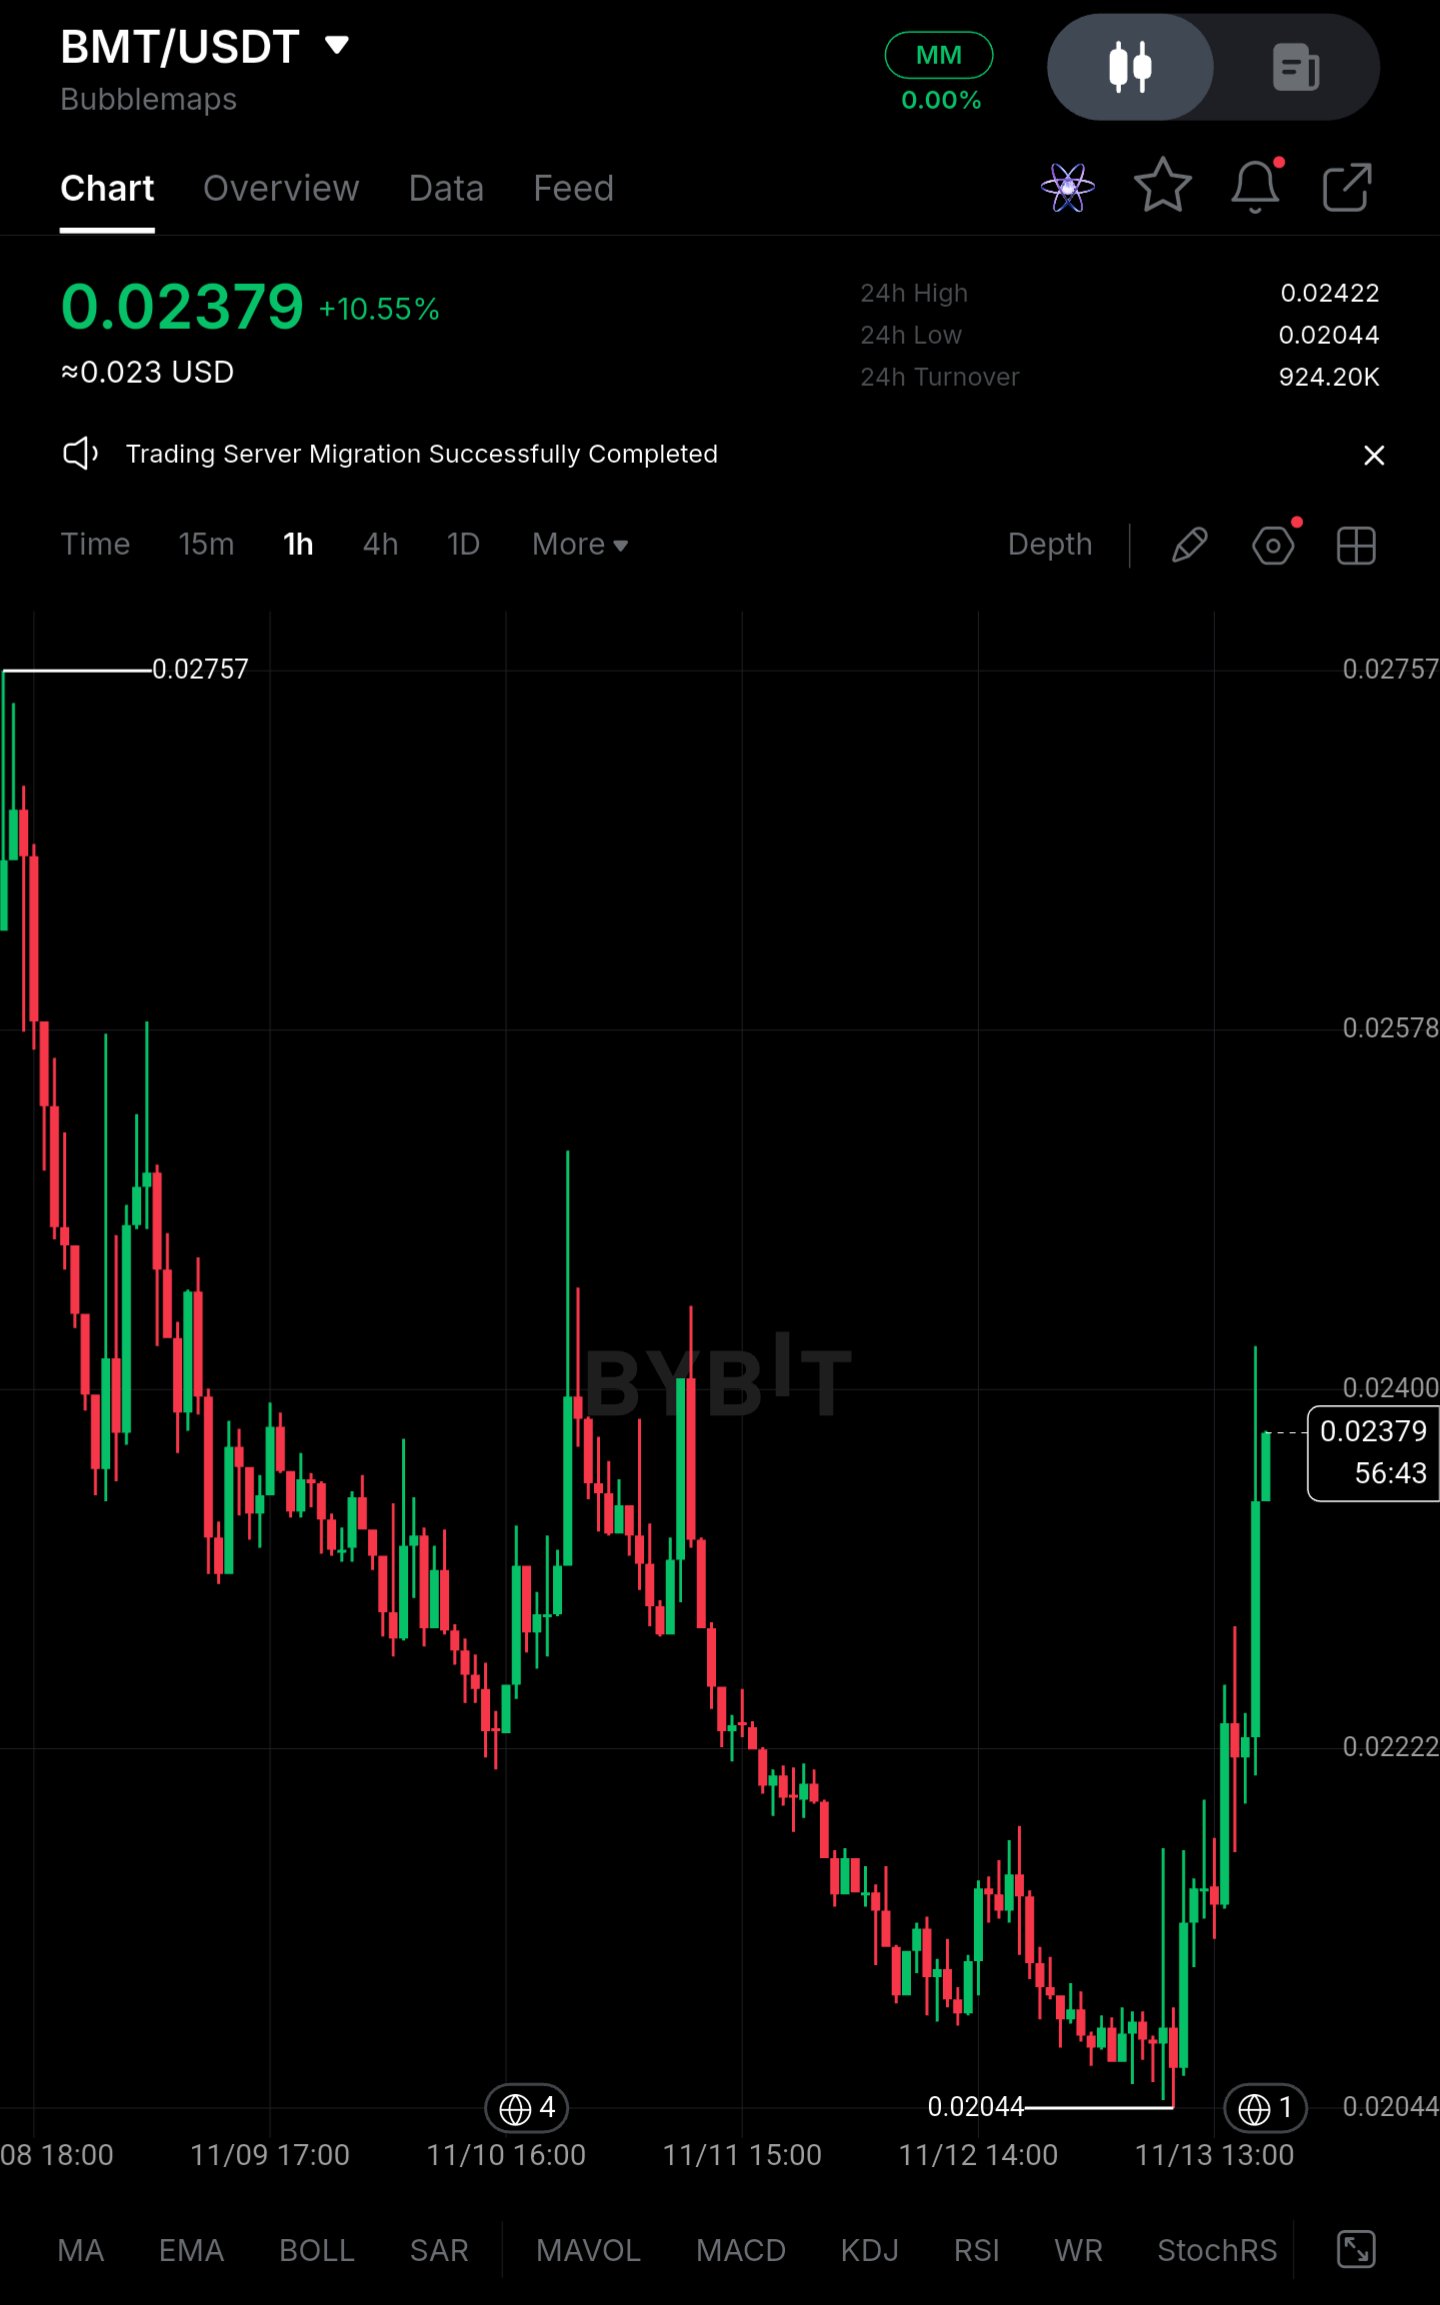
$BMTUSDT – Tinjauan Kerangka Waktu Lebih Tinggi | Long pada Pullback** Pasangan: $BMTUSDT (Bubblemaps, Bybit) BMT telah menghabiskan sebagian besar minggu lalu dengan tren penurunan. Harga turun dari area 0,02757 dan bergerak turun dengan cukup teratur, hanya dengan pantulan singkat, hingga menemukan titik terendah di 0,02044. Saya tidak mencoba untuk menangkap pergerakan jatuh itu, dan pantulan baru-baru ini terjadi terlalu cepat bagi saya untuk mengejarnya. Harga sekarang berada di sekitar 0,02379 (+10,55% dalam hari ini), mendorong naik ke area 0,02400 setelah kenaikan vertikal tajam dari posisi terendah. Itu adalah respons yang kuat, tetapi itu hanyalah urutan candle ekspansi setelah tren turun yang panjang, dan saya lebih suka melihat bagaimana perilaku harga pada pullback daripada langsung membelinya. *Catatan: bacaan ini didasarkan pada chart 1H yang disediakan, jadi anggaplah ini sebagai struktur jangka pendek, bukan tren kerangka waktu lebih tinggi yang terkonfirmasi.* **Prospek Saat Ini dan Level Utama** **Zona Beli: 0,02222 – 0,02250** 0,02222 adalah level yang terlihat pada chart, dan berada di tengah pantulan baru-baru ini di mana harga bergerak cepat melewatinya. Retrace ke area ini akan menjadi ujian apakah breakout tersebut nyata atau tidak. Saya ingin melihat pembeli masuk dengan penolakan wick atau penutupan 1H yang kuat kembali dari zona tersebut. Jika harga menembusnya dengan aksi jual yang deras, tidak ada yang perlu dibeli. **Zona Resistance: 0,02422 – 0,02578** 0,02422 adalah harga tertinggi 24 jam, dan 0,02578 adalah level bertanda berikutnya di atas, di mana harga ditolak selama penurunan sebelumnya. Penjual bisa saja muncul di sini karena ini adalah tempat di mana posisi long yang terjebak dari tren turun akan mencari jalan keluar. Penutupan 1H di atas 0,02578 yang bertahan pada pengujian ulang (retest) akan menunjukkan bahwa tren turun sedang patah dan 0,02757 kembali berperan. Sampai saat itu, ini adalah suplai overhead. **Pengaturan Trading** **Posisi:** Long pada pullback **Zona Entry:** 0,02222 – 0,02250, hanya setelah reaksi pembeli yang terlihat. Ini adalah zona entry potensial, bukan entry yang terkonfirmasi. **Stop-Loss:** Di bawah 0,02200 **Invalidasi:** Penutupan 1H di bawah 0,02200 akan menempatkan harga kembali ke dalam kisaran sebelumnya dan menunjukkan bahwa pantulan tersebut adalah short squeeze, bukan perubahan tren. Pada titik itu saya akan menepi dan melakukan penilaian ulang. **Take-Profit:** - TP1: 0,02422 - TP2: 0,02578 - TP3: 0,02757 **Mengapa Pengaturan Ini Masuk Akal** Setelah penurunan yang persisten ini, pantulan 10% biasanya merupakan tanda pertama dari pergeseran, bukan bukti dari pergeseran tersebut. Membeli di 0,02379 berarti masuk tepat di bawah harga tertinggi 24 jam dan 0,02400, dengan resistance dekat di atas dan stop yang harus diletakkan jauh di bawah. Itu adalah risiko yang buruk untuk ruang yang tersedia. Pullback ke 0,02222 memberikan level yang terdefinisi dengan stop di dekatnya, dan target berada pada level yang sudah ditandai oleh chart. Yang penting adalah reaksinya: jika pembeli mempertahankan zona tersebut, itu menunjukkan bahwa pergerakan tersebut memiliki permintaan di belakangnya. Jika tidak, stop-nya kecil dan idenya jelas salah. Saya lebih suka melewatkan sebagian dari kelanjutan daripada membeli lonjakan dan berharap. Level stop di 0,02200 adalah penempatan saya sendiri tepat di bawah zona, jadi sesuaikan dengan toleransi risiko Anda sendiri. **Manajemen Risiko** Hargai rencana tersebut dan jangan memindahkan atau mengabaikan stop. Atur ukuran posisi sehingga stop-out adalah kerugian yang dapat Anda terima, terutama pada koin yang baru saja bergerak secepat ini. Pemulihan setelah tren turun dapat gagal dengan cepat, dan tidak ada pengaturan yang menjamin keuntungan. $ByXIMPACT
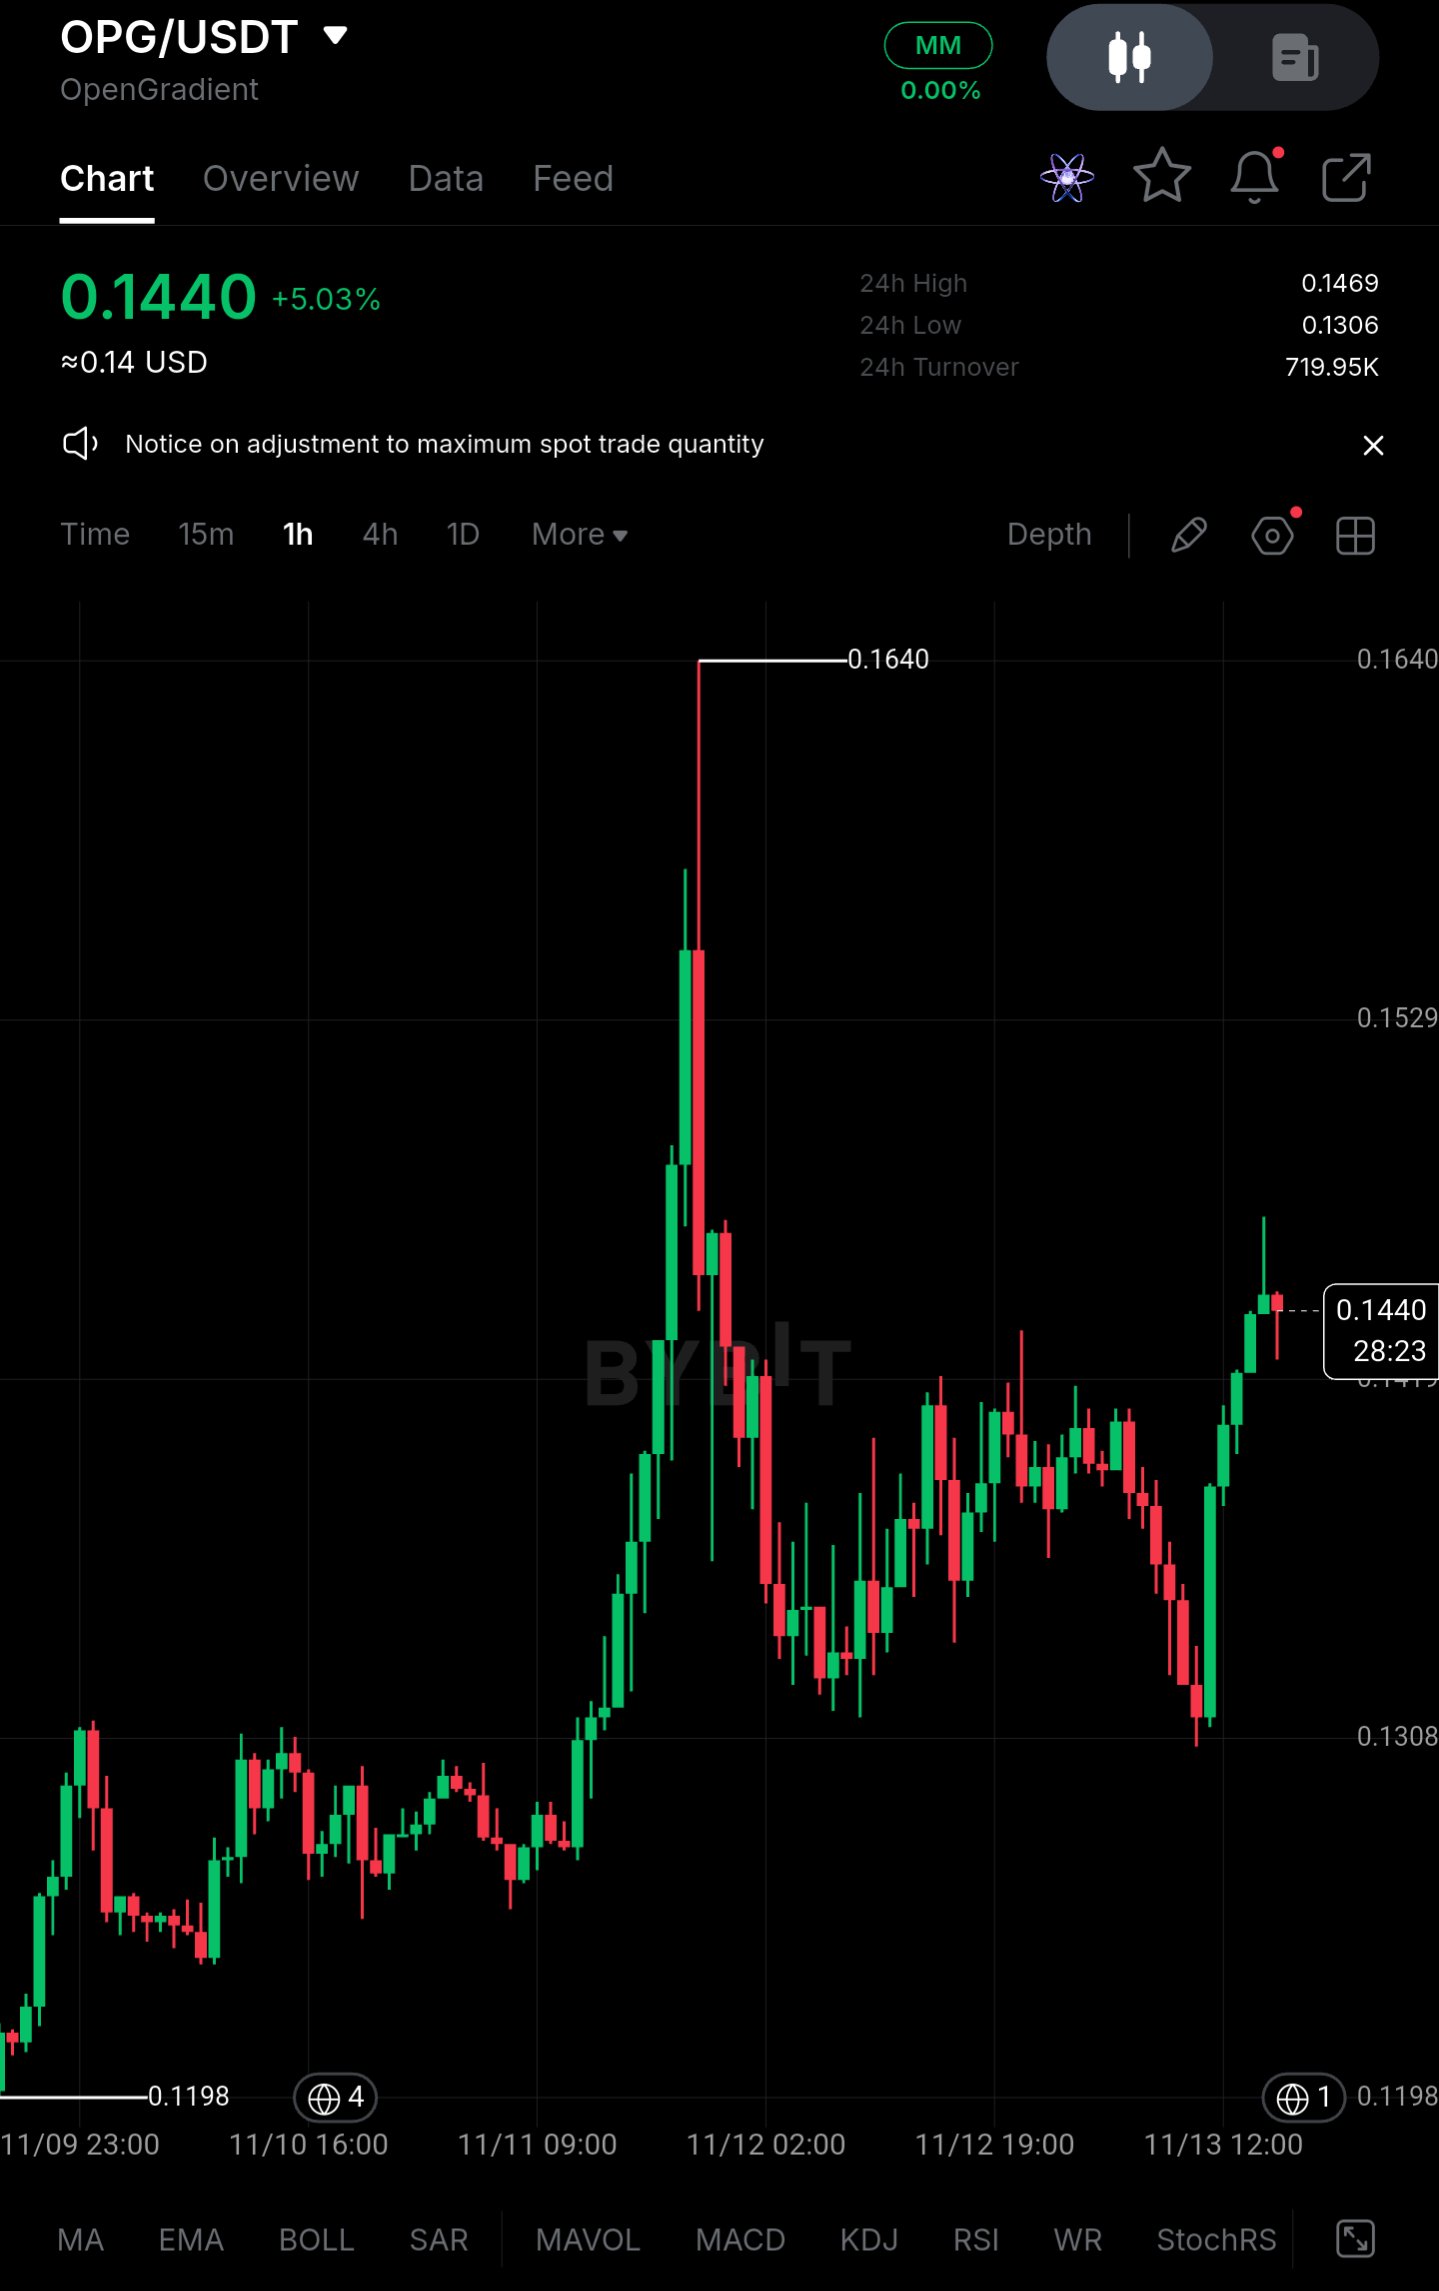
$OPGUSDT – Higher Timeframe Overview | Long on Pullback** Pair: $OPGUSDT (OpenGradient, Bybit) I've been watching OPG since the push off the 0.1198 low on 11/09. I didn't get a clean entry on that first leg, and chasing it near the top would have been poor risk. The move ran into 0.1640, where a long rejection wick printed, and price has since been working sideways to lower. Price is now around 0.1440 (+5.03% on the day) after bouncing from the 0.1306 area. That's a decent recovery, but it's still inside a range. I'd rather wait for price to come to me than buy into this bounce. *Note: this read is based on the 1H chart provided, so treat it as short-term structure rather than a confirmed higher-timeframe trend.* **Current Outlook and Key Levels** **Buying Zone: 0.1306 – 0.1308** This is the 24h low and the base of the recent range, where sellers were absorbed and price turned sharply higher. If it's retested, I'd want to see a wick rejection or a strong 1H close back up from the zone. A slow grind through it with no reaction isn't a setup. **Resistance Zone: 0.1469 – 0.1529** 0.1469 is the 24h high, and 0.1529 is the next level where price stalled during the earlier decline. Sellers may respond here since this is where the recent bounce could run out of steam. A 1H close above 0.1529 that holds on a retest would suggest the market is trying to revisit the 0.1640 high. Until then, this is just overhead supply. **Trading Setup** **Position:** Long on pullback **Entry Zone:** 0.1306 – 0.1308, only after a visible buyer reaction. This is a potential entry zone, not a confirmed entry. **Stop-Loss:** Below 0.1306 **Invalidation:** A 1H close below 0.1306 means the range floor has failed and the bounce was likely just a relief move. I'd step aside and reassess rather than hope for a recovery. **Take-Profits:** - TP1: 0.1469 - TP2: 0.1529 - TP3: 0.1640 **Why This Setup Makes Sense** After a sharp spike and rejection like the one at 0.1640, price often needs time to build a base. The recovery from 0.1306 is encouraging, but buying at 0.1440 means entering mid-range with limited room to the 0.1469 high and a stop far below. That's a poor trade, even if the direction is right. Waiting for a retest of 0.1306–0.1308 puts the stop just under a clearly defined low, and the targets sit at levels the chart has already marked. The reaction matters more than the level itself. If buyers defend it again, the trade is justified. If they don't, the stop is small and the thesis is cleanly invalidated. Patience may mean missing the move entirely, and I'm fine with that over forcing an entry. **Risk Management** Stick to the plan and don't move or ignore the stop. Size the position so a stop-out is a loss you can accept. A range-bound structure can break down as easily as it bounces, and no setup guarantees a profit. #ByXIMPACT
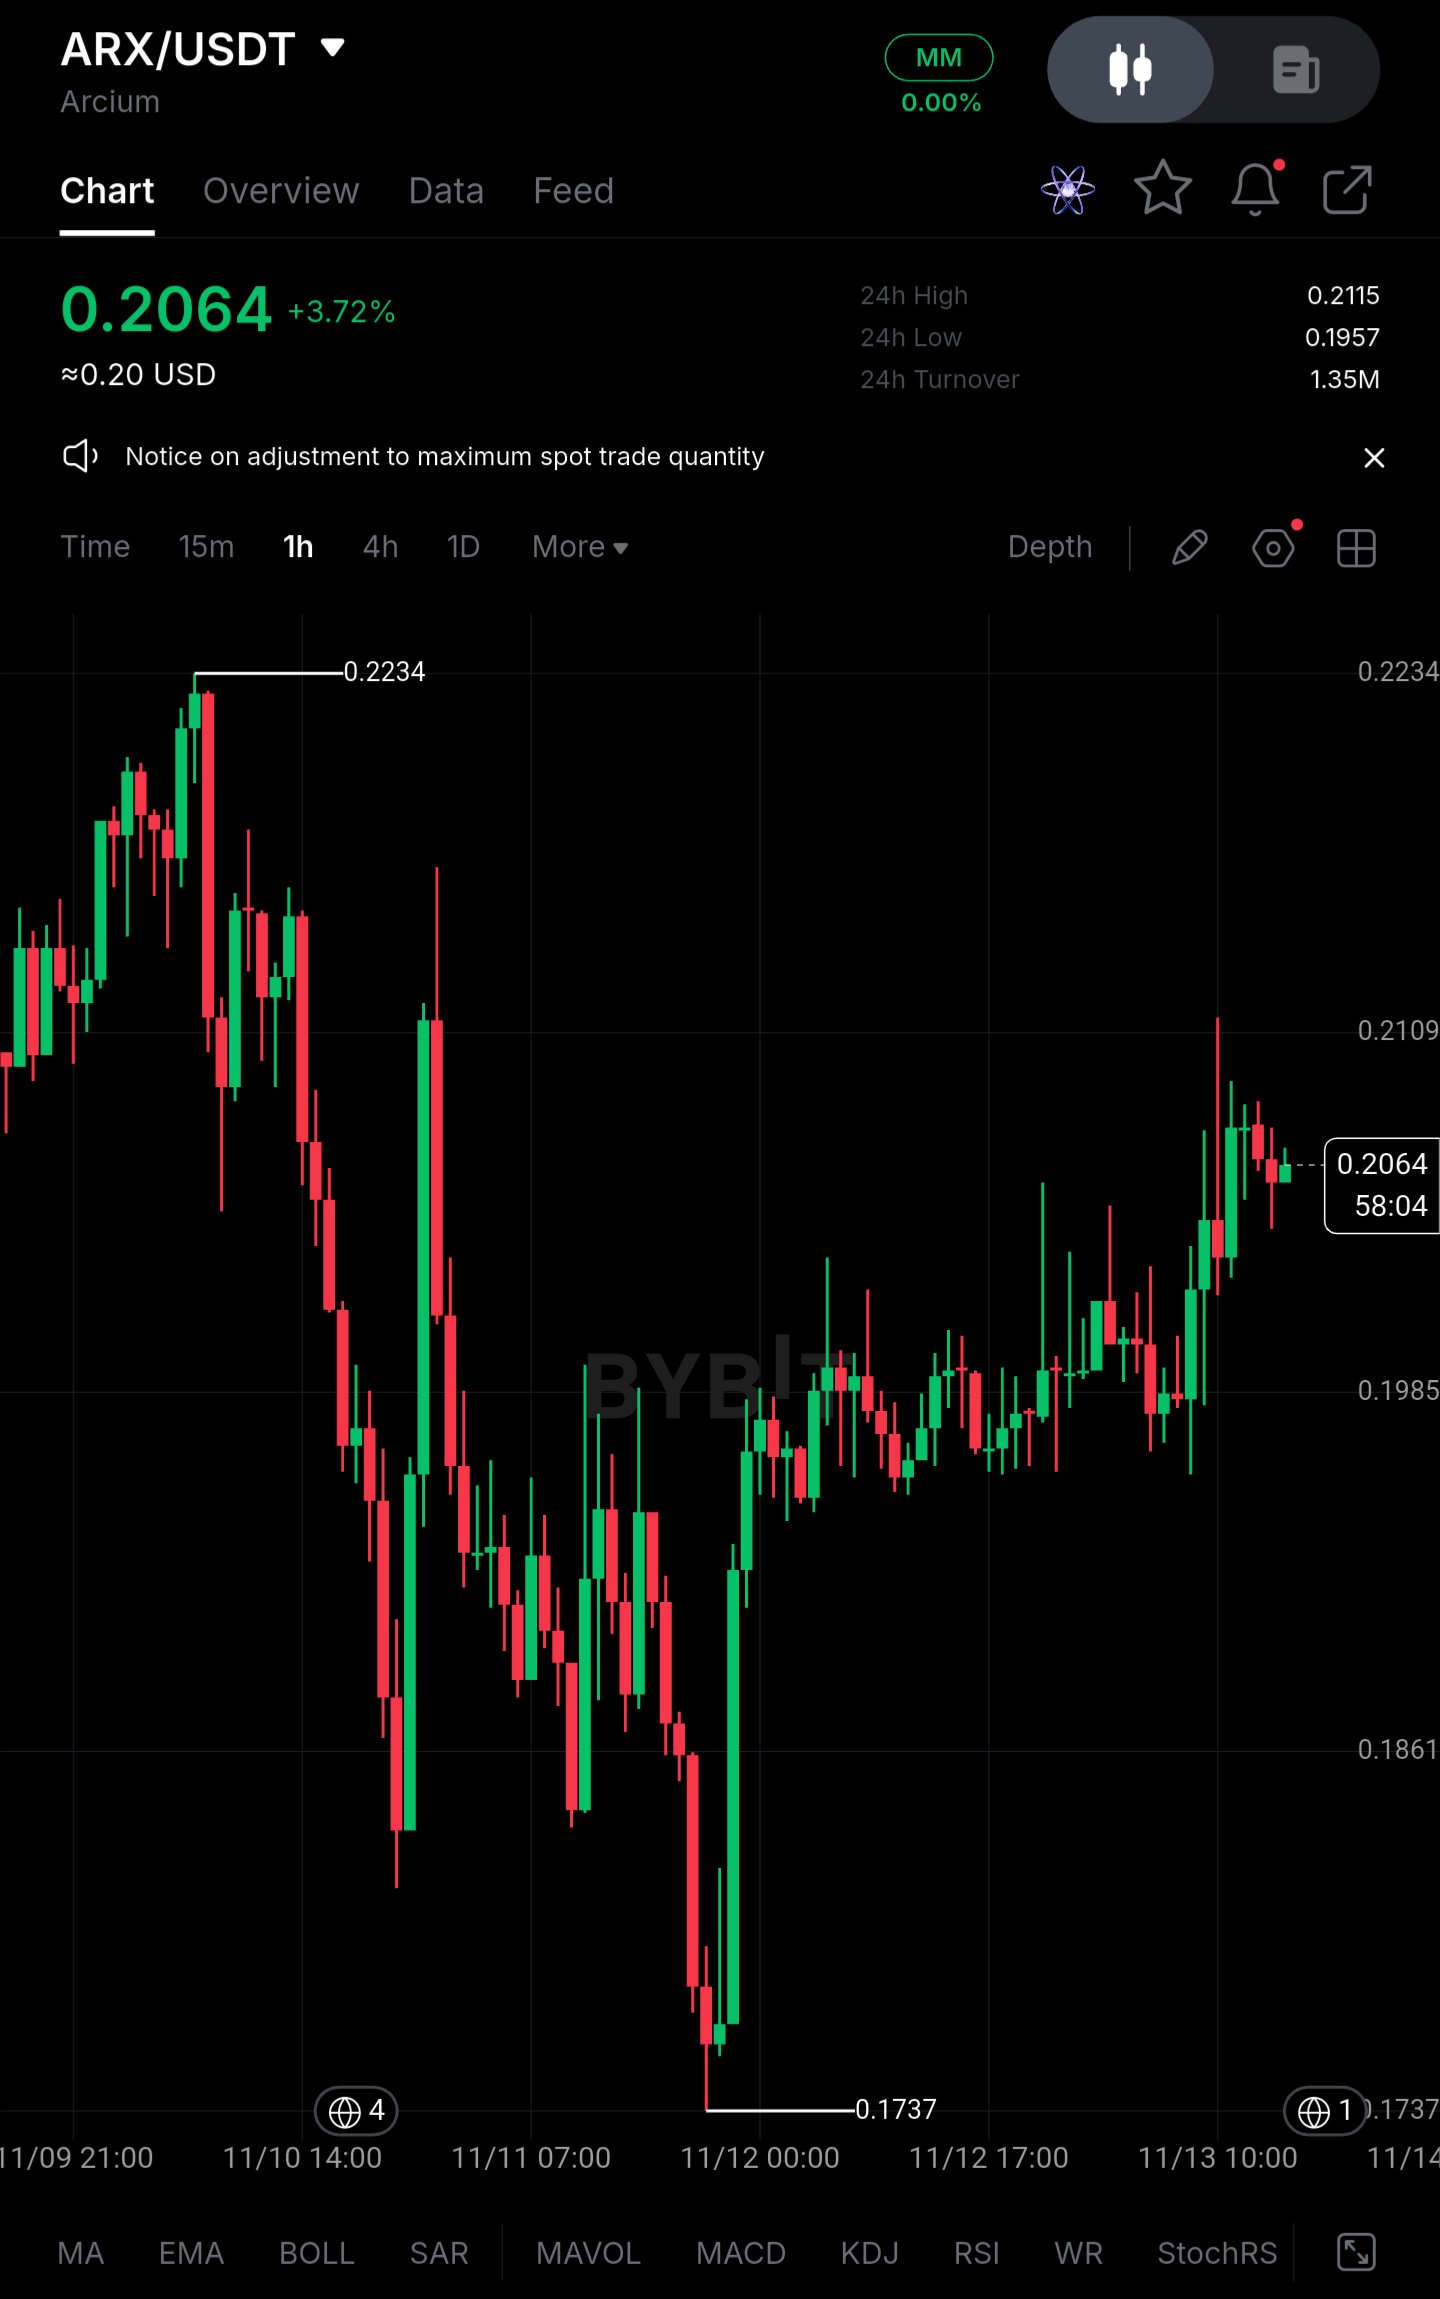
$ARXUSDT : Holding Near $0.206, But This Is Not a Recovery Yet** ARX/USDT is trading near $0.2064 after a sharp drawdown that carried price to $0.1737 on the 1H chart. The current stabilization is not being treated as a recovery. Large-capital selling pressure and a heavily long-tilted derivatives book remain the larger concern, and the bounce has not yet shown the spot demand needed to absorb it. **Price Action** ARX is at $0.2064, up 3.72% on the day, after rebounding roughly 18.8% from the $0.1737 low. That low was set on 11/12 after a steep, near-uninterrupted decline from the $0.2234 swing high, a drop of about 22%. The 24h range is narrow, $0.1957 to $0.2115, on turnover of only 1.35M. - Immediate resistance: $0.2109–$0.2115, which is the 24h high and where the latest wick was rejected - First support: $0.1985–$0.1957, where price based before the latest push higher - A reclaim of $0.2109 would improve short-term structure, but the broader trend remains under pressure, with a lower high still in place against $0.2234. **Large Capital Picture** ARX has no ETF channel, so the read comes from large-wallet and exchange-flow behavior. The V-shaped rebound from $0.1737 was driven by a single large impulse candle, not sustained bidding. The follow-through since is uneven, with alternating green and red candles and several upper wicks near $0.21. That points to inconsistent demand, with larger holders more willing to sell into strength than to accumulate. The sharp 11/11–11/12 flush also has the character of a forced-liquidation event, not orderly distribution. **Liquidity and Range Conditions** Price has compressed into a tight band after the decline. A narrow range following a sharp drop is not evidence of accumulation. Turnover of 1.35M is thin, and a move that is not backed by volume is easily reversed. Stronger spot participation is still needed before this range can be read as a base. **Derivatives Positioning** Exact figures are not visible on the chart, so these are estimates based on price behavior and typical positioning after such a rebound: - Open interest: elevated relative to spot turnover, consistent with leverage rebuilding during the bounce - Funding rate: positive, meaning longs are paying shorts - Long accounts: roughly 60–65% of positioning Positioning has rebuilt on the long side during a low-volume bounce. That creates vulnerability. If $0.1957 fails, stacked long stops and liquidations could accelerate a move back toward the recent low. **Key Figures** - Current price: ~$0.2064 - Immediate resistance: $0.2109–$0.2115 - Support zone: $0.1985–$0.1957 - Recent low: $0.1737 - Swing high: $0.2234 - 24h turnover: 1.35M - Estimated funding: positive - Estimated long share: ~60–65% **Confirmation Levels** - **Bullish:** A sustained hourly close above $0.2115 on rising spot volume would open $0.2234. Even then, the move would only be a recovery attempt, not a trend reversal. - **Bearish:** A close below $0.1957 would expose $0.1861, with $0.1737 as the next liquidity pool, where another sweep becomes likely. **Closing** The current stability is real but temporary. Large-holder selling and crowded long positioning are competing with the recovery attempt, and neither side has shown a decisive edge. The signal that matters is whether spot buyers return while leverage stays controlled, or whether another support breakdown triggers fresh long liquidations. *Not financial advice. Estimated derivatives figures should be verified against live exchange data.* #ByXIMPACT
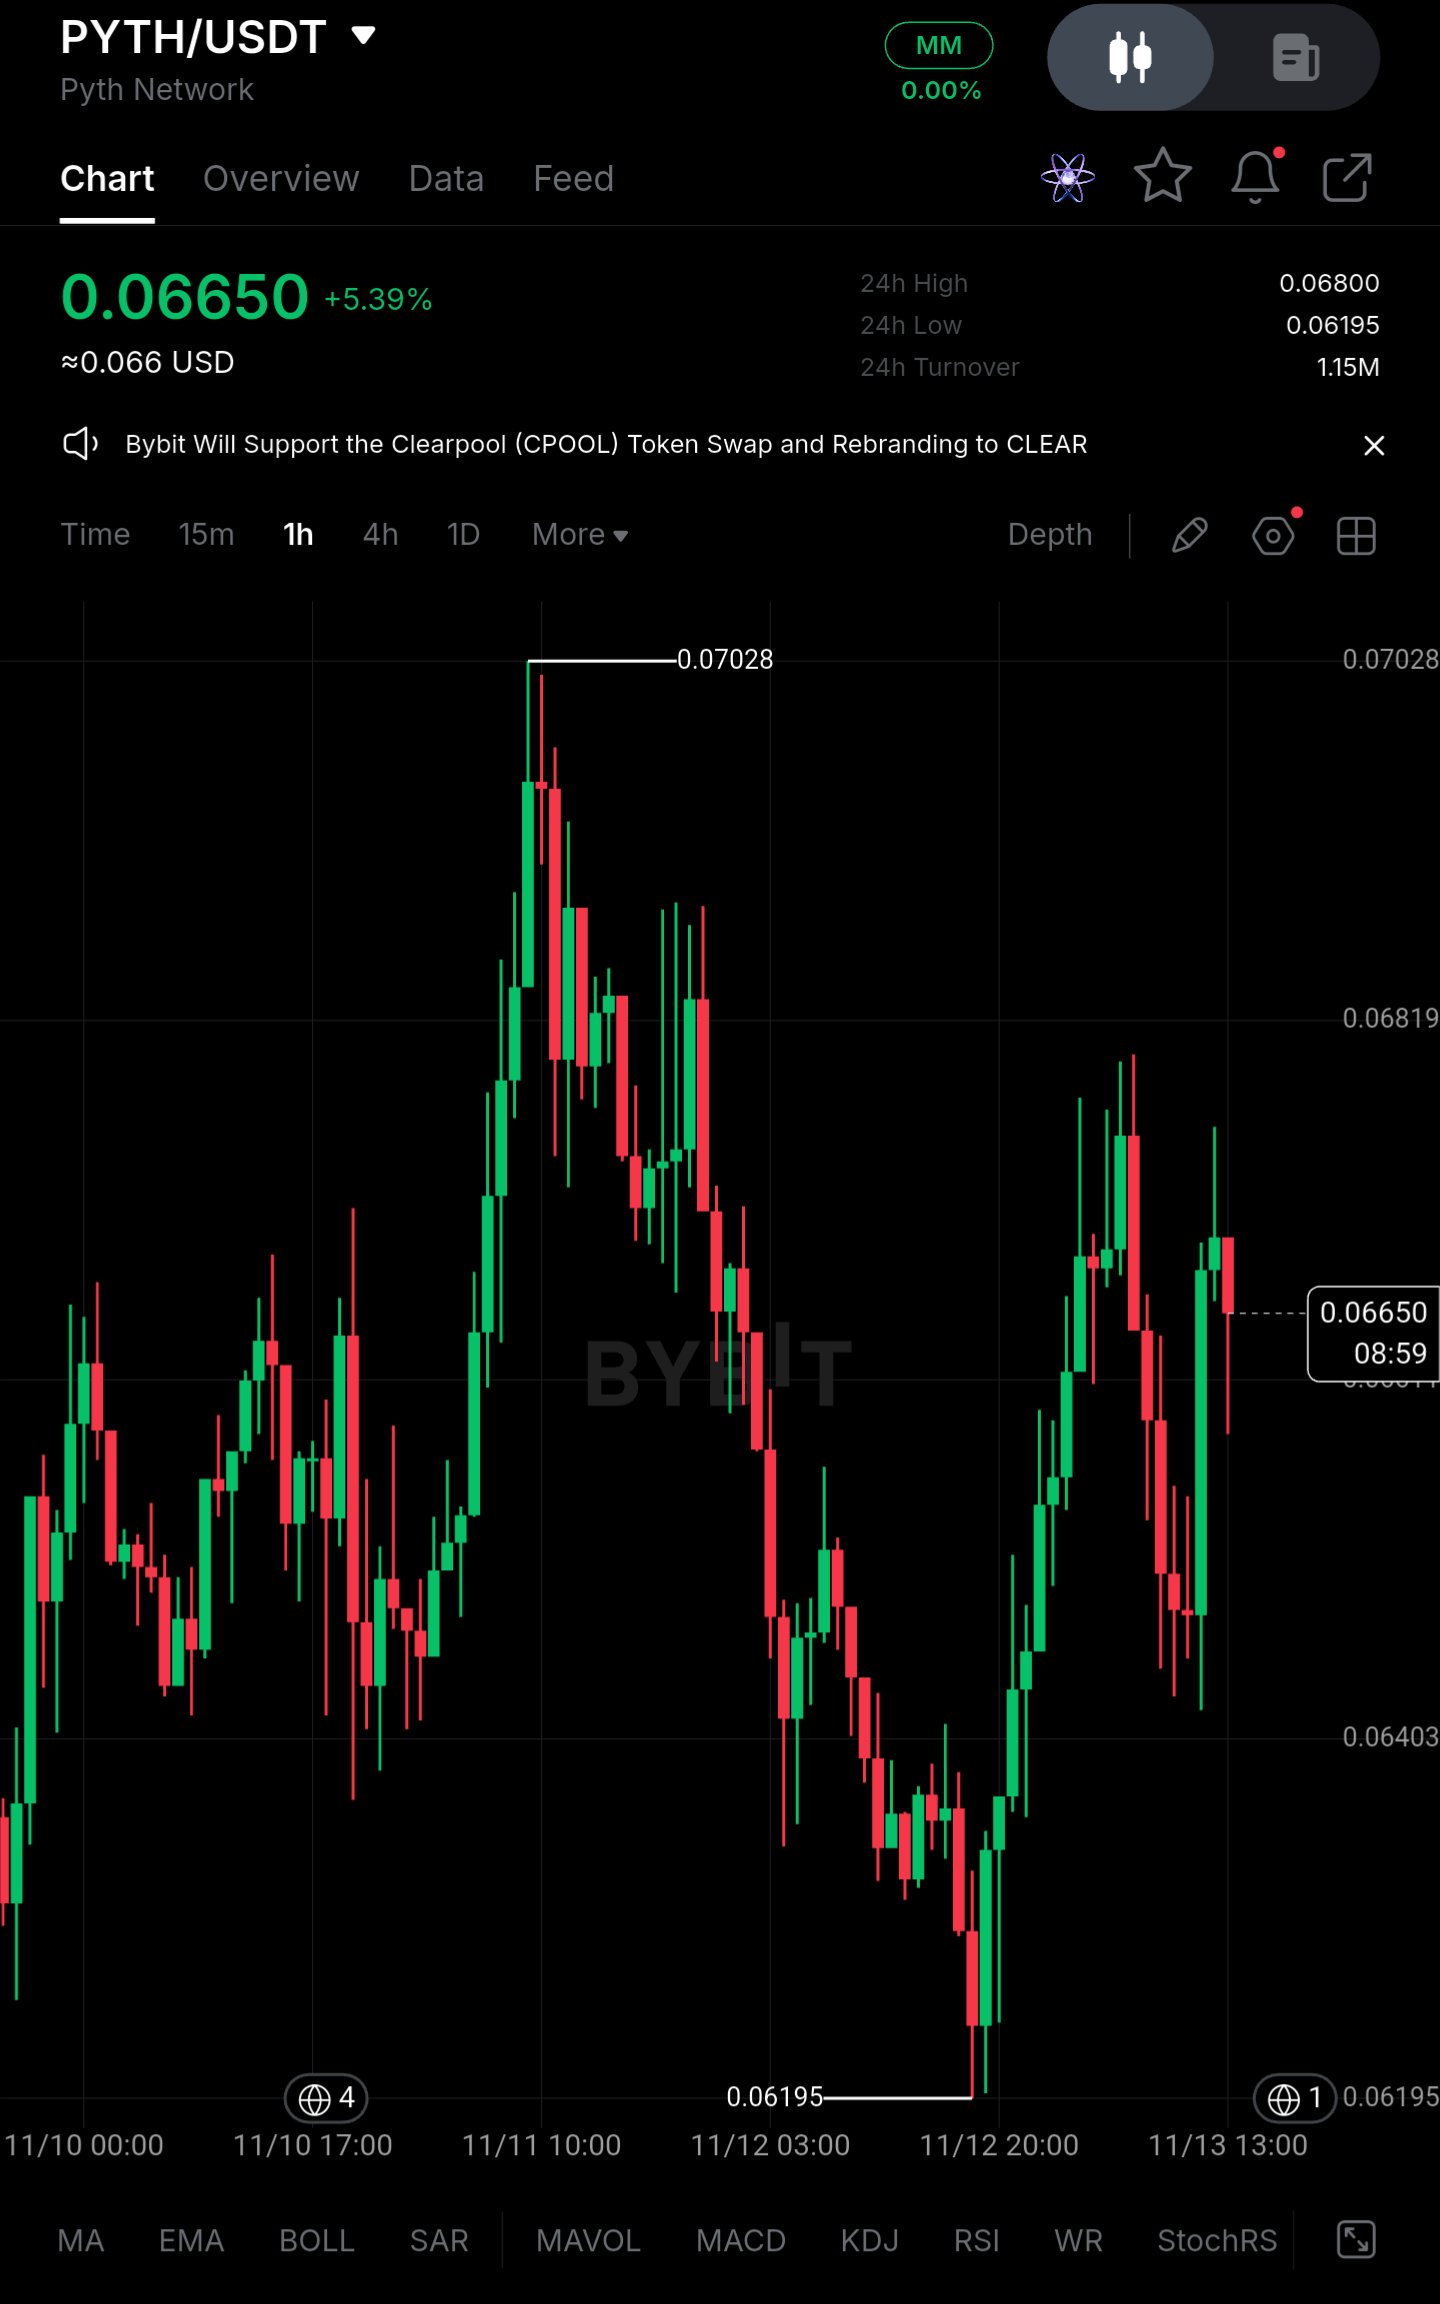
$PYTHUSDT – Tinjauan Timeframe Lebih Tinggi | Long saat Pullback** Pair: $PYTHUSDT **Observasi Pasar** PYTH naik ke 0.07028 di awal minggu, lalu kehilangan sebagian besar kenaikannya dalam penurunan stabil ke 0.06195. Sejak titik terendah tersebut, harga telah pulih dalam dua tahap dan sekarang berada di sekitar 0.06650, naik sekitar 5% hari ini. Pemulihannya terlihat cukup baik, tetapi belum berhasil menembus level tertinggi sebelumnya, jadi untuk saat ini saya menganggapnya sebagai pantulan di dalam kisaran yang lebih besar. Saya melewatkan dorongan pertama menuju 0.07028, dan mengejarnya setelah kejadian terasa tidak tepat. Pullback justru lebih menarik daripada breakout-nya. **Outlook Saat Ini dan Level Kunci** **Zona Pembelian: 0.06195 – 0.06403** Level terendah 0.06195 adalah dasar dari aksi jual baru-baru ini, dan 0.06403 adalah level berikutnya di atasnya yang direspons pasar. Bersama-sama, keduanya membentuk area tempat pembeli masuk setelah penurunan. Jika harga pullback ke sini, saya ingin melihat wick penolakan yang jelas atau penutupan hourly yang kuat kembali di atas 0.06403 sebelum menganggapnya sebagai entry yang valid. **Zona Resistance: 0.06800 – 0.06819** Level tertinggi 24 jam berada di 0.06800, dan 0.06819 adalah level tepat di atasnya. Harga sempat tertahan dari area ini pada dorongan terakhir, jadi penjual sudah muncul di sini sekali. Breakout hourly dan konsolidasi yang bertahan di atasnya akan membuka jalan menuju 0.07028 dan menunjukkan bahwa pemulihan ini bukan sekadar pantulan biasa. **Trading Setup** **Posisi:** Long saat pullback **Zona Entry:** 0.06195 – 0.06403, hanya setelah ada reaksi pembeli yang terlihat **Stop-Loss:** Di bawah 0.06195 (penutupan hourly) **Invalidasi:** Penutupan yang bertahan di bawah 0.06195 berarti level terendah baru-baru ini telah gagal. Level terendah tersebut adalah dasar dari seluruh pemulihan, jadi jika kehilangan level itu, rangkaian lower-low akan kembali berkuasa dan ide trading ini tidak lagi berlaku. **Take-Profit:** - TP1: 0.06800 - TP2: 0.06819 - TP3: 0.07028 **Mengapa Setup Ini Masuk Akal** Di 0.06650, harga sudah dekat dengan resistance di 0.06800, jadi posisi long di sini menawarkan ruang yang sangat sedikit sebelum penjual muncul kembali. Menunggu pullback ke area 0.06195 – 0.06403 memberikan struktur yang lebih baik: stop-loss ditempatkan tepat di bawah level terendah yang sudah dipertahankan pasar sebelumnya, dan potensi keuntungan ke target pertama jauh lebih besar dibandingkan risikonya. TP1 dan TP2 berada berdekatan karena rentang 0.06800 – 0.06819 adalah satu zona resistance, jadi saya perkirakan akan ada reaksi di sana dan saya akan mempertimbangkan untuk mengurangi risiko. TP3 di 0.07028 adalah level tertinggi sebelumnya, dan untuk mencapainya kemungkinan besar memerlukan breakout yang bersih dari rentang tersebut. Jika harga tidak pernah kembali ke zona beli, berarti tidak ada trade, dan itu tidak masalah. Melewatkan pergerakan pasar biayanya jauh lebih murah daripada memaksakan entry di tengah rentang harga. **Manajemen Risiko** Patuhi stop-loss dan atur ukuran posisi agar kerugian di bawah 0.06195 tetap dapat diterima. Pemulihan bisa saja gagal, dan tidak ada setup yang menjamin hasil profit. *Catatan: zona entry, stop, dan target tidak disertakan, jadi saya menyusunnya berdasarkan level di chart 1j Anda (0.06195, 0.06403, 0.06800, 0.06819, 0.07028). Sesuaikan jika Anda memiliki level sendiri, dan karena chart tersebut adalah 1j, Anda mungkin ingin mengubah "Timeframe Lebih Tinggi" di judul.* $ByXIMPACT
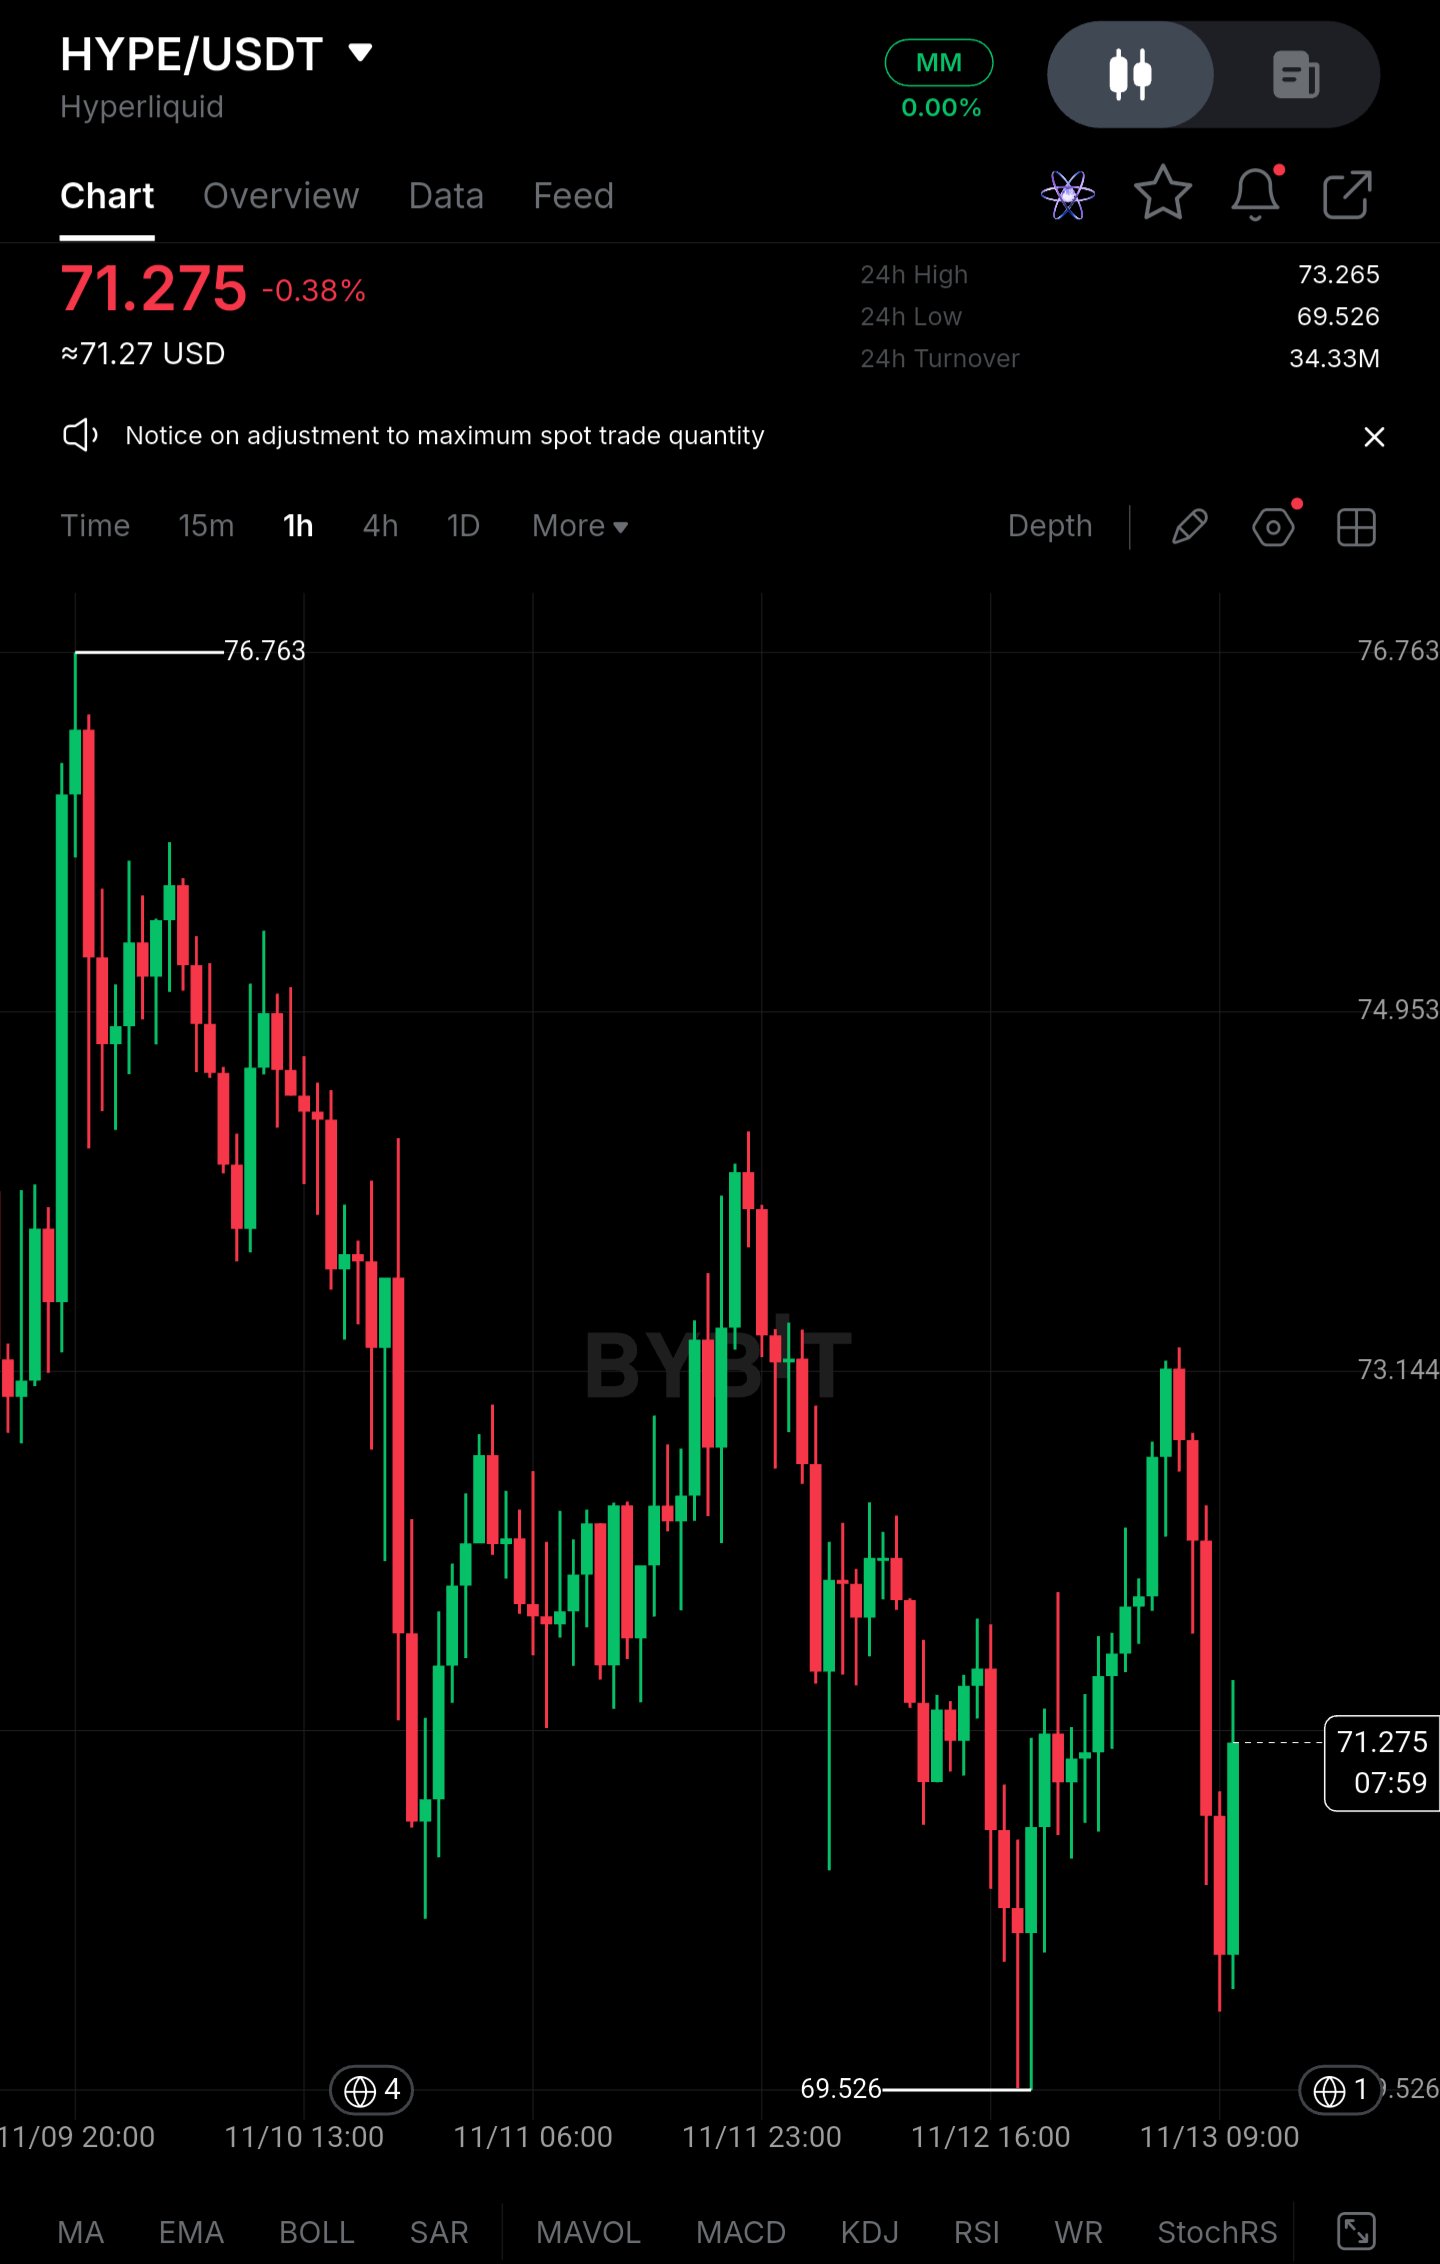
$HYPEUSDT – Tinjauan Kerangka Waktu yang Lebih Tinggi | Long saat Pullback** Pasangan: $HYPEUSDT **Observasi Pasar** HYPE telah bergerak sideways (choppy) pada grafik 1 jam sejak kenaikan ke 76.763 di awal minggu. Lonjakan itu memudar menjadi serangkaian lower high, dan harga telah berotasi dalam kisaran tersebut sejak saat itu. Harganya sekarang di sekitar 71.275, kira-kira di tengah kisaran itu, yang bukan merupakan titik di mana saya ingin melakukan entri kejar harga. Saya tidak menangkap pergerakan naik ke 76.763, dan saya tidak masalah dengan itu. Strukturnya sekarang lebih berguna daripada breakout sebelumnya. **Prospek Saat Ini dan Level Kunci** **Zona Beli: sekitar 69.5 – 70.0** Level terendah 24 jam di 69.526 adalah batas bawah yang telah dipertahankan pembeli sejauh ini. Harga sempat menyentuh area tersebut dan pulih, yang menunjukkan adanya permintaan di sana. Saya ingin melihat reaksi lain di zona ini, seperti sumbu penolakan yang tajam atau penutupan candle per jam (hourly close) yang hijau kuat, sebelum menganggapnya sebagai entri yang valid. **Zona Resistensi: 73.14 – 73.27** Area ini menampung level tertinggi 24 jam (73.265) dan level 73.144, dan harga sudah pernah berbalik turun dari area ini sekali. Breakout per jam dan konsolidasi yang berkelanjutan di atas level ini akan membuat 74.953 dan level tertinggi sebelumnya di 76.763 kembali berperan, dan mengindikasikan bahwa rangkaian lower-high sudah berakhir. **Pengaturan Trading** **Posisi:** Long saat pullback **Zona Entri:** ~69.5 – 70.0, hanya setelah ada reaksi pembeli yang terlihat **Stop-Loss:** Di bawah 69.526 (penutupan per jam) **Invalidasi:** Penutupan yang berkelanjutan di bawah 69.526 berarti batas bawah kisaran telah gagal. Pembeli telah mempertahankannya, jadi jika level ini tembus, strukturnya akan bergeser ke arah kelanjutan turun dan ide trading ini tidak lagi berlaku. **Take-Profit:** - TP1: 73.144 - TP2: 74.953 - TP3: 76.763 **Mengapa Pengaturan Ini Masuk Akal** Pada 71.275, pasar berada di antara support dan resistensi tanpa keunggulan yang jelas. Melakukan pembelian di sini menempatkan stop jauh di level terendah kisaran dan menyisakan sedikit ruang sebelum resistensi di 73.1. Menunggu pullback ke 69.5 memberikan stop yang jauh lebih ketat, karena invalidasi berada tepat di bawah level yang sudah dihormati oleh pasar. Target mengikuti struktur. TP1 adalah resistensi pertama di mana harga sudah sempat terhenti, dan TP2 serta TP3 adalah level berikutnya dalam perjalanan kembali menuju level tertinggi 76.763. Jika harga tidak pernah mencapai zona beli, maka tidak ada perdagangan, dan saya lebih memilih melewatkannya daripada memaksakan entri di tengah-tengah kisaran. **Manajemen Risiko** Hormati stop-loss dan atur ukuran posisi sehingga kerugian di 69.526 dapat diterima. Batas bawah kisaran bisa saja gagal, dan tidak ada pengaturan yang menjamin hasil yang menguntungkan. *Catatan: zona entri, stop, dan target tidak disertakan, jadi saya membuatnya berdasarkan level pada grafik 1 jam Anda (69.526, 73.144, 73.265, 74.953, 76.763). Sesuaikan jika Anda memiliki level Anda sendiri, dan karena grafiknya adalah 1 jam, Anda mungkin ingin mengubah "Higher Timeframe" di judul.* $ByXIMPACT
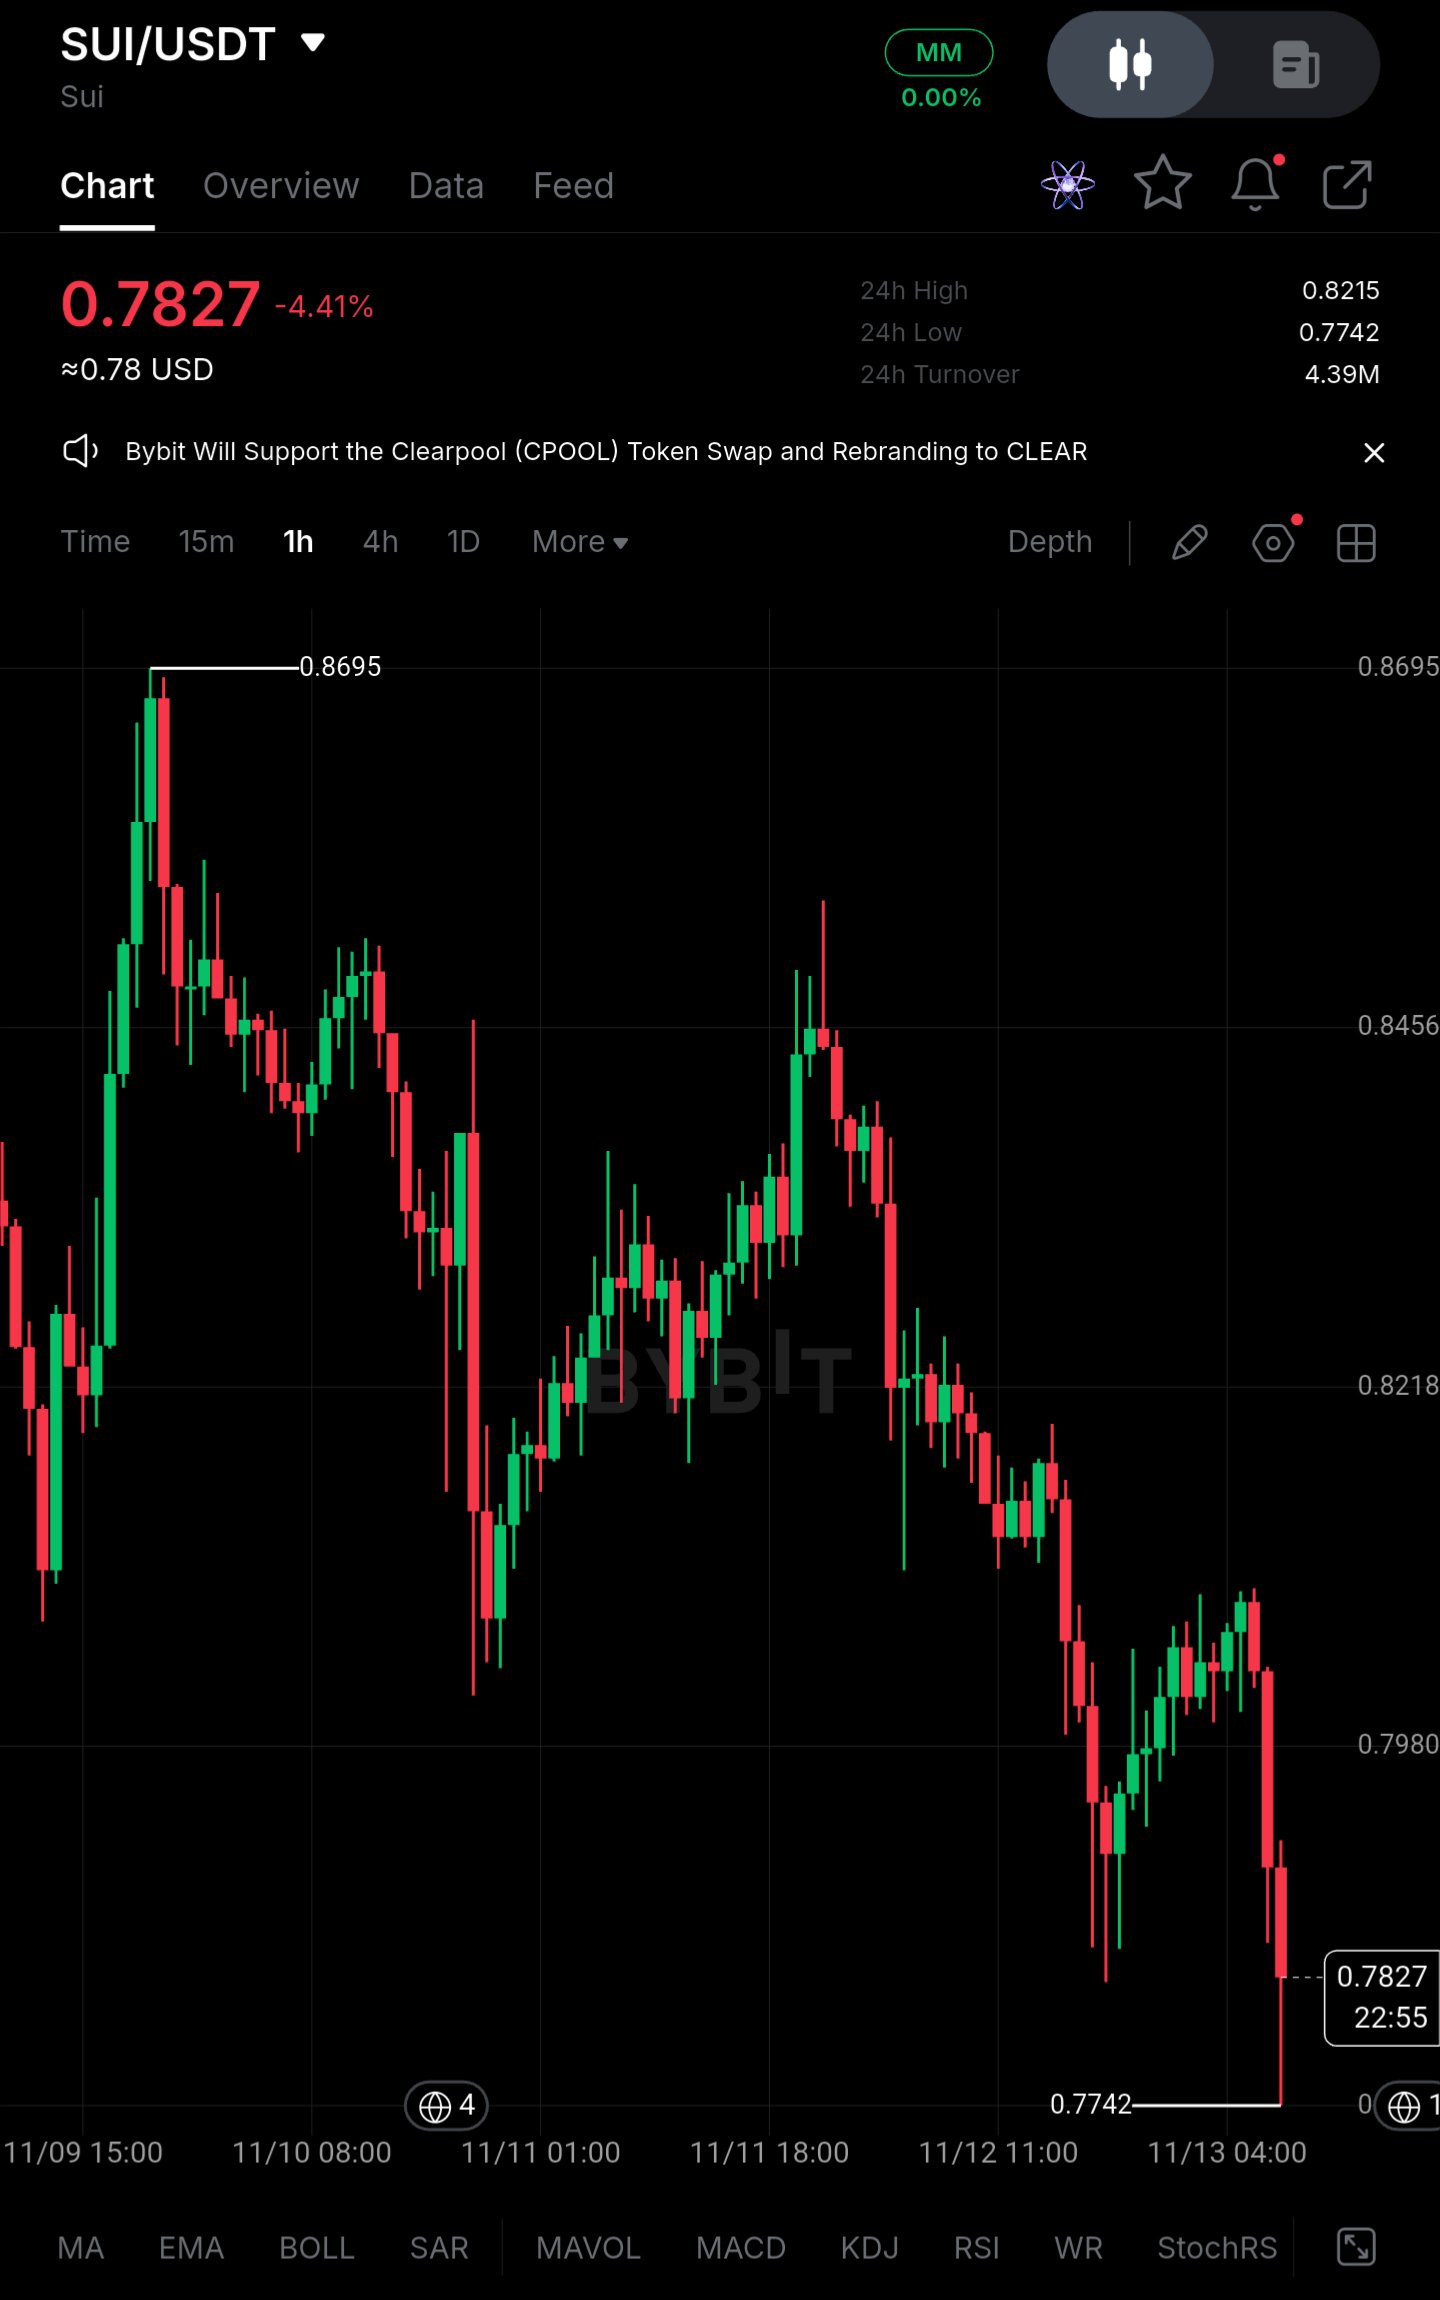
$SUIUSDT Tertahan di Dekat $0,78 Setelah Penurunan Tajam, Namun Ini Belum Bisa Disebut Pemulihan** SUI diperdagangkan di sekitar $0,7827 setelah mencetak level terendah baru di $0,7742, turun sekitar 4,4% dalam hari ini. Saya tidak menganggap jeda saat ini sebagai pemulihan. Kekhawatiran yang lebih besar adalah tekanan jual yang terus-menerus dari dompet besar (large-wallet) dikombinasikan dengan posisi derivatif yang masih condong long (beli). **Pergerakan Harga** - SUI berada di $0,7827, sekitar 10% di bawah level tertinggi lokal $0,8695 dari awal minggu. - Kisaran 24 jam adalah $0,7742 hingga $0,8215, dan candle per jam terakhir ditutup mendekati level terendah. - Resistance langsung berada di $0,7980, kemudian $0,8215–$0,8218, tempat dimulainya breakdown sesi akhir. - Support pertama adalah level terendah $0,7742. Reclaim di $0,8218 akan memperbaiki struktur jangka pendek, tetapi tren yang lebih luas dari lower high sejak $0,8695 tetap utuh. **Gambaran Modal Besar** Permintaan tidak konsisten. Setiap reli minggu ini disambut dengan suplai yang besar, dan breakdown dari $0,84 terjadi dengan cepat dan satu arah. Pola tersebut menunjukkan bahwa pemegang besar dan dana jangka pendek memanfaatkan kekuatan pasar untuk mengurangi eksposur alih-alih melakukan akumulasi. Perputaran spot sekitar 4,39 juta selama 24 jam tidak cukup untuk menunjukkan bahwa pembeli saat penurunan (dip buyers) sedang menyerap suplai ini. **Likuiditas dan Kondisi Kisaran** Harga sedang tertekan tepat di atas level terendah setelah penurunan impulsif. Kisaran yang ketat setelah penurunan bukanlah bukti akumulasi. Ini biasanya berarti penjual sedang jeda, bukan berarti pembeli telah mengambil kendali. Partisipasi spot yang nyata, dengan volume yang meningkat pada pergerakan naik dan pullback yang dangkal, masih belum terlihat. **Posisi Derivatif** Berdasarkan perilaku chart saat ini, posisi masih terlihat condong long: - Open interest tetap tinggi meskipun terjadi penurunan, yang menunjukkan bahwa posisi long dengan leverage belum sepenuhnya terhapus. - Funding diperkirakan sedikit positif, yang berarti posisi long masih membayar posisi short untuk bertahan. - Sekitar 55–60% posisi diperkirakan merupakan posisi long. Ini adalah kerentanan. Jika $0,7742 ditembus, likuidasi long paksa dapat mempercepat pergerakan jauh melampaui apa yang akan dihasilkan oleh penjualan spot saja. **Angka-Angka Kunci (nilai derivatif adalah perkiraan)** - Harga saat ini: $0,7827 - Resistance langsung: $0,7980, kemudian $0,8215–$0,8218 - Support: $0,7742 - Swing high terbaru: $0,8695 - Open interest: tinggi, tanpa deleveraging yang berarti - Funding: sedikit positif - Pangsa long: ~55–60% **Level Konfirmasi** - **Bullish:** penutupan per jam di atas $0,8218 dengan volume spot yang meningkat akan membuka jalan ke $0,8456 dan mulai memperbaiki struktur lower-high. - **Bearish:** penutupan per jam yang bersih di bawah $0,7742 akan membuka area $0,75, dengan $0,72 sebagai target berikutnya jika likuidasi long terjadi secara beruntun. **Penutup** Stabilitas di dekat $0,78 itu nyata, tetapi hanya sementara sampai terbukti sebaliknya. Penjualan oleh pemegang besar dan posisi long yang padat bekerja melawan upaya pemulihan ini. Sinyal yang menentukan adalah apakah pembeli spot kembali sementara leverage tetap terkendali, atau apakah breakdown support lainnya memicu likuidasi long baru. #ByXIMPACT
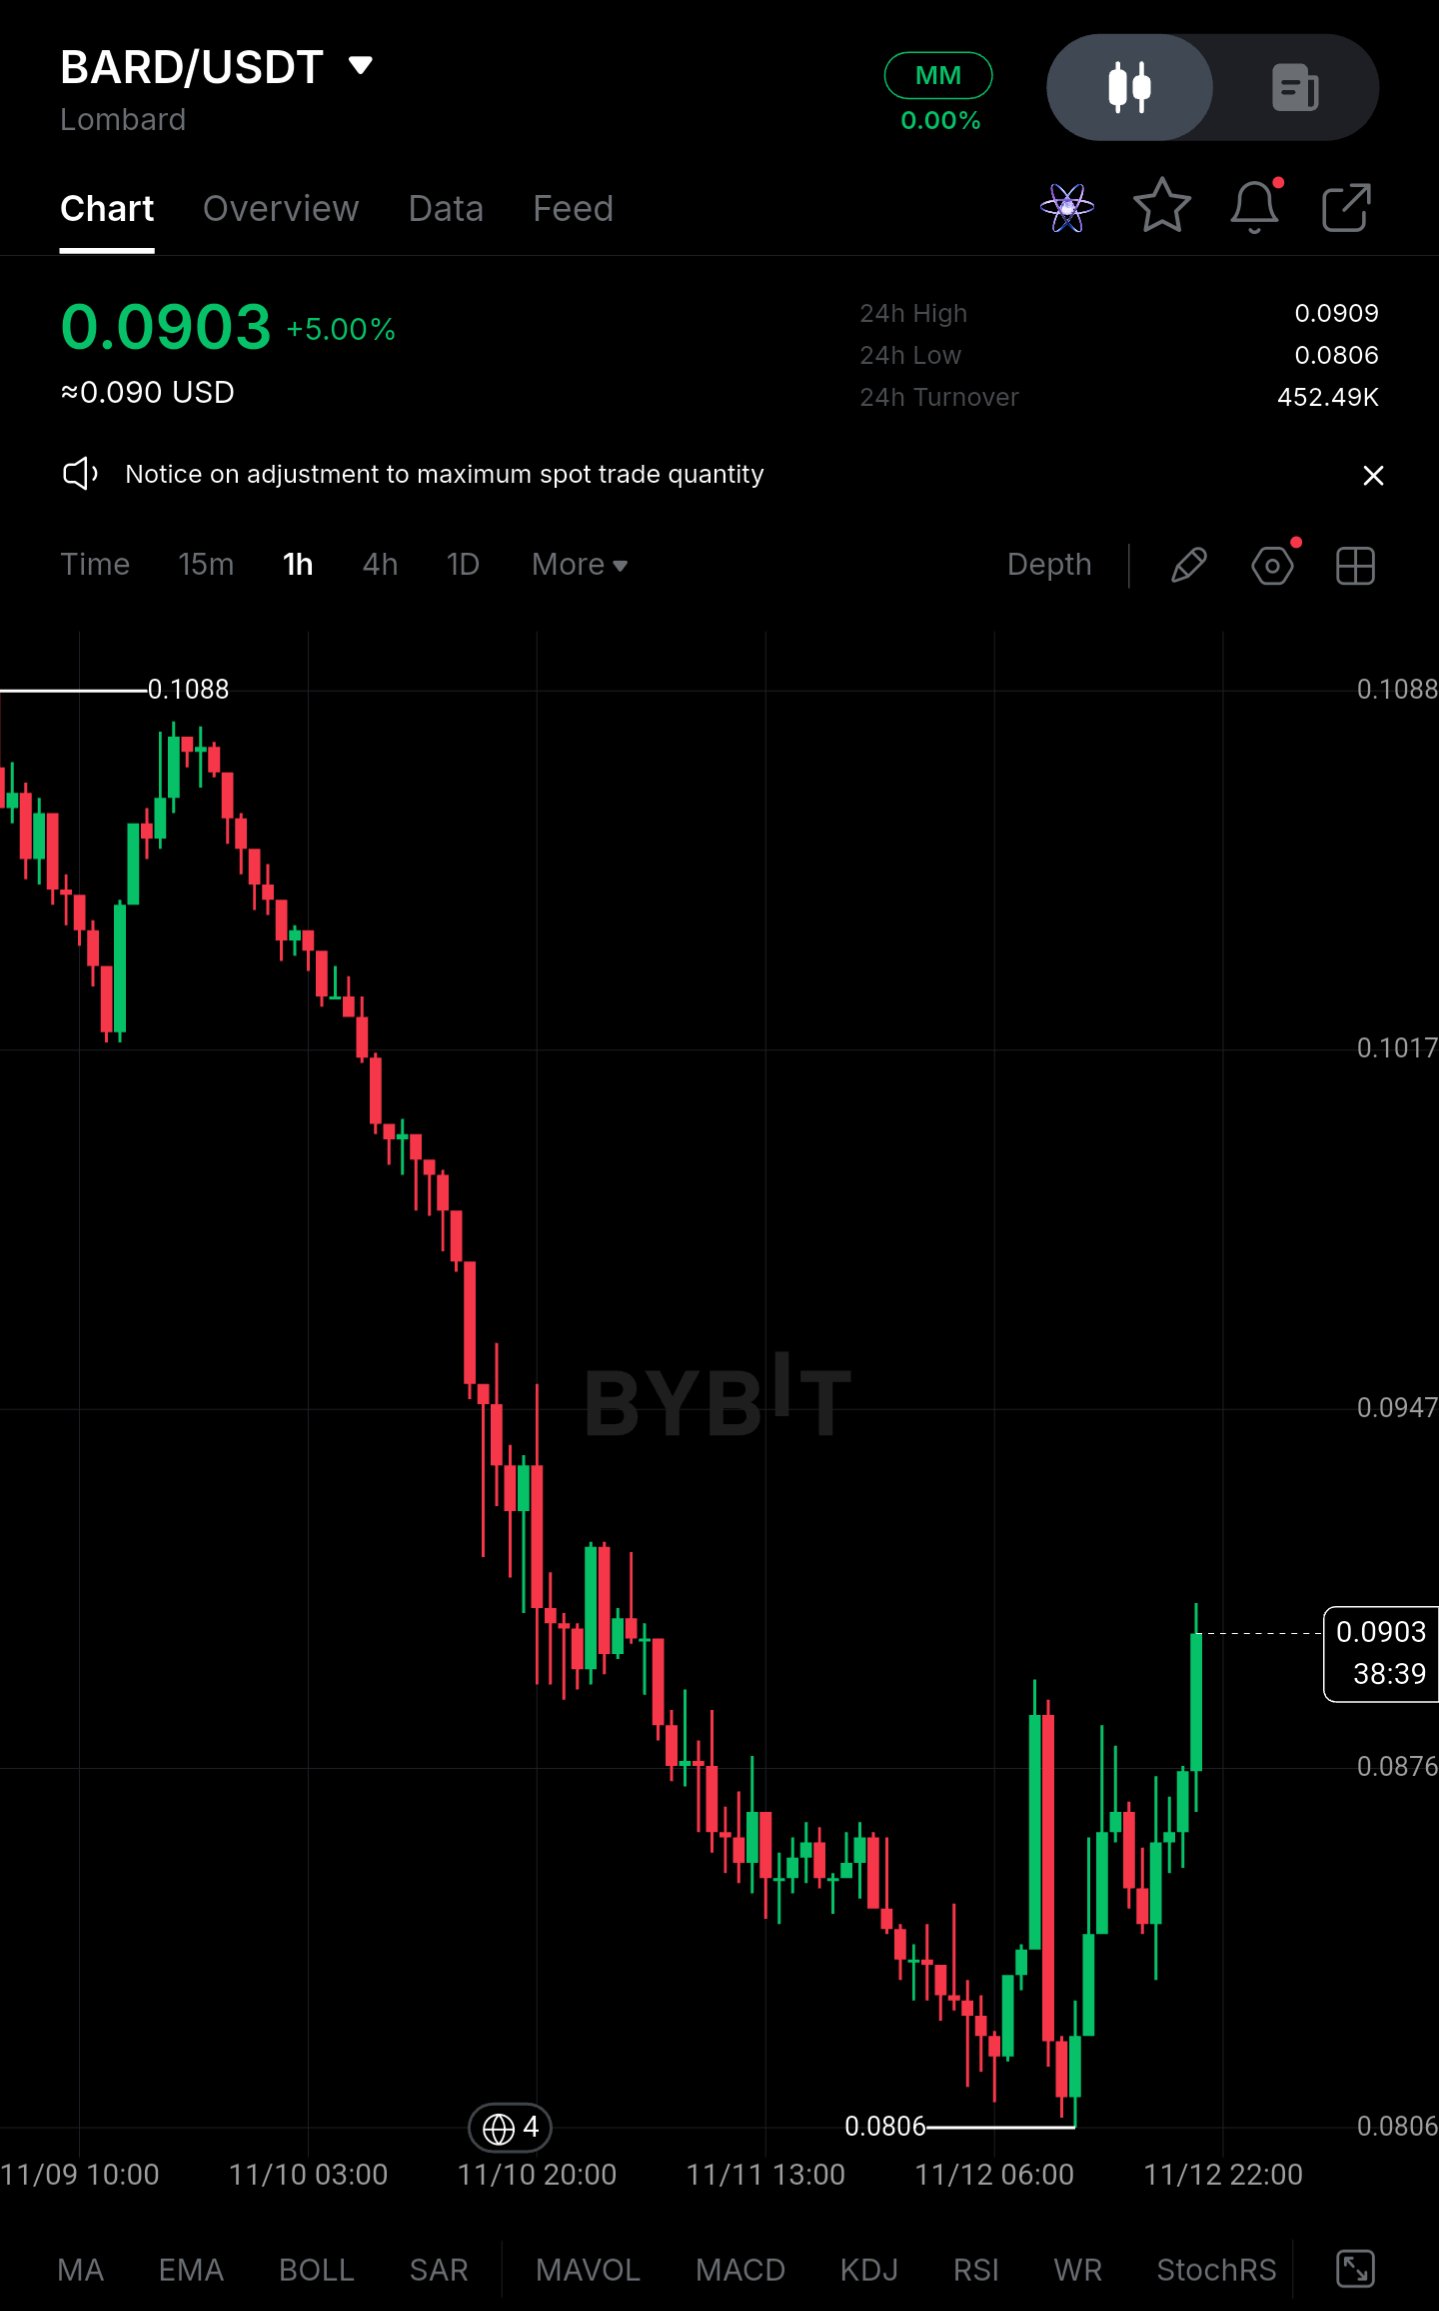
$BARDUSDT Analisis Pasar: Pantulan di Bawah Tekanan, Bukan Pemulihan** BARD diperdagangkan di dekat 0,0903 setelah penurunan tajam dari level tertinggi 0,1088 ke level terendah baru-baru ini di 0,0806. Saya tidak menganggap stabilisasi saat ini sebagai pemulihan. Kekhawatiran yang lebih besar adalah penjualan oleh pemegang besar yang terus berlanjut, ditambah dengan posisi derivatif yang tetap condong ke posisi long (beli) selama penurunan. **Pergerakan Harga** - Harga saat ini: 0,0903, naik sekitar 5% pada hari ini - Level terendah baru-baru ini: 0,0806, sekitar 26% di bawah level tertinggi 0,1088 - Pantulan dari level terendah: sekitar 12% - Kisaran 24 jam: 0,0806 hingga 0,0909, jadi harga sedang menekan batas atas kisaran harian - Resistance terdekat: 0,0909, kemudian 0,0947 - Support pertama: 0,0876 Reclaiming (kembali menembus) 0,0947 akan menjadi tanda pertama perubahan struktur, tetapi tren yang lebih luas masih menunjukkan lower highs (puncak yang lebih rendah) dan lower lows (lembah yang lebih rendah), sehingga pergerakan ini terbaca sebagai pantulan sementara (relief bounce) di dalam tren turun. **Gambaran Modal Besar** Untuk aset DeFi berkapitalisasi menengah seperti BARD, sinyal yang relevan adalah distribusi dari wallet besar dan arus masuk bursa (exchange inflows), bukan arus ETF. Penurunan dari 0,1088 terjadi secara konsisten, dengan candle merah yang berturut-turut dan sedikit jeda yang berarti, yang lebih mencerminkan pasokan yang berkelanjutan daripada satu peristiwa likuidasi tunggal. Volume rebound tidak merata, dan turnover 24 jam sekitar 452K terlalu tipis untuk klaim pemulihan. Permintaan tidak konsisten: pembeli muncul di dekat 0,0806 tetapi cepat memudar saat mendekati resistance. **Kondisi Likuiditas & Kisaran Harga** Harga tertahan dalam rentang terbatas sejak level terendah, kira-kira 0,0806 hingga 0,0909. Kisaran sempit setelah penurunan tajam bukanlah bukti akumulasi. Ini bisa dengan mudah mencerminkan penjual yang beristirahat sebelum langkah berikutnya. Partisipasi spot yang lebih kuat masih diperlukan untuk membuktikan sebaliknya, dan kurangnya tindak lanjut di atas 0,0909 menunjukkan bahwa hal itu belum terjadi. **Posisi Derivatif** *Angka di bawah ini adalah perkiraan yang disimpulkan dari perilaku harga dan posisi tipikal untuk aset ini, bukan data langsung. Verifikasi dengan data bursa terkini sebelum mengambil tindakan.* - Open interest: sedikit meningkat relatif terhadap turnover spot - Suku bunga pendanaan (funding rate): positif (sekitar +0,01%), jadi posisi long membayar posisi short - Akun long: sekitar 55–60% dari posisi Pantulan ini belum memaksa leverage keluar. Suku bunga pendanaan positif dan buku yang condong ke long berarti banyak partisipan memposisikan diri untuk pemulihan sebelum permintaan spot mengonfirmasinya. Jika support ditembus, posisi tersebut menjadi kerentanan dan dapat mempercepat putaran baru likuidasi posisi long. **Angka-Angka Kunci** - Area harga saat ini: 0,0903 - Resistance terdekat: 0,0909 hingga 0,0947 - Resistance lebih tinggi: 0,1017 - Support pertama: 0,0876 - Support utama / level terendah baru-baru ini: 0,0806 - Turnover 24 jam: ~452K - Pendanaan: positif (perkiraan) - Pangsa long: ~55–60% (perkiraan) **Level Konfirmasi** - **Bullish:** Penutupan per jam yang berkelanjutan di atas 0,0947 dengan volume spot yang meningkat akan membuka jalan menuju 0,1017. Tanpa volume, dorongan di atas level tersebut patut dicurigai. - **Bearish:** Penutupan per jam di bawah 0,0876 membuka peluang untuk pengujian ulang ke 0,0806. Penembusan di bawah level terendah tersebut akan mengonfirmasi kelanjutan tren dan kemungkinan memicu likuidasi posisi long. **Penutup** Stabilitas saat ini nyata namun bersifat sementara. Penjualan oleh pemegang besar dan posisi long yang padat bersaing dengan upaya pemulihan. Sinyal yang menentukan adalah apakah pembeli spot kembali sementara leverage tetap terkendali, atau apakah kerusakan support lainnya memicu likuidasi long baru. Sampai permintaan spot terbukti mampu menyerap pasokan, kehati-hatian tetap diperlukan. *Bukan saran keuangan.* #ByXIMPACT
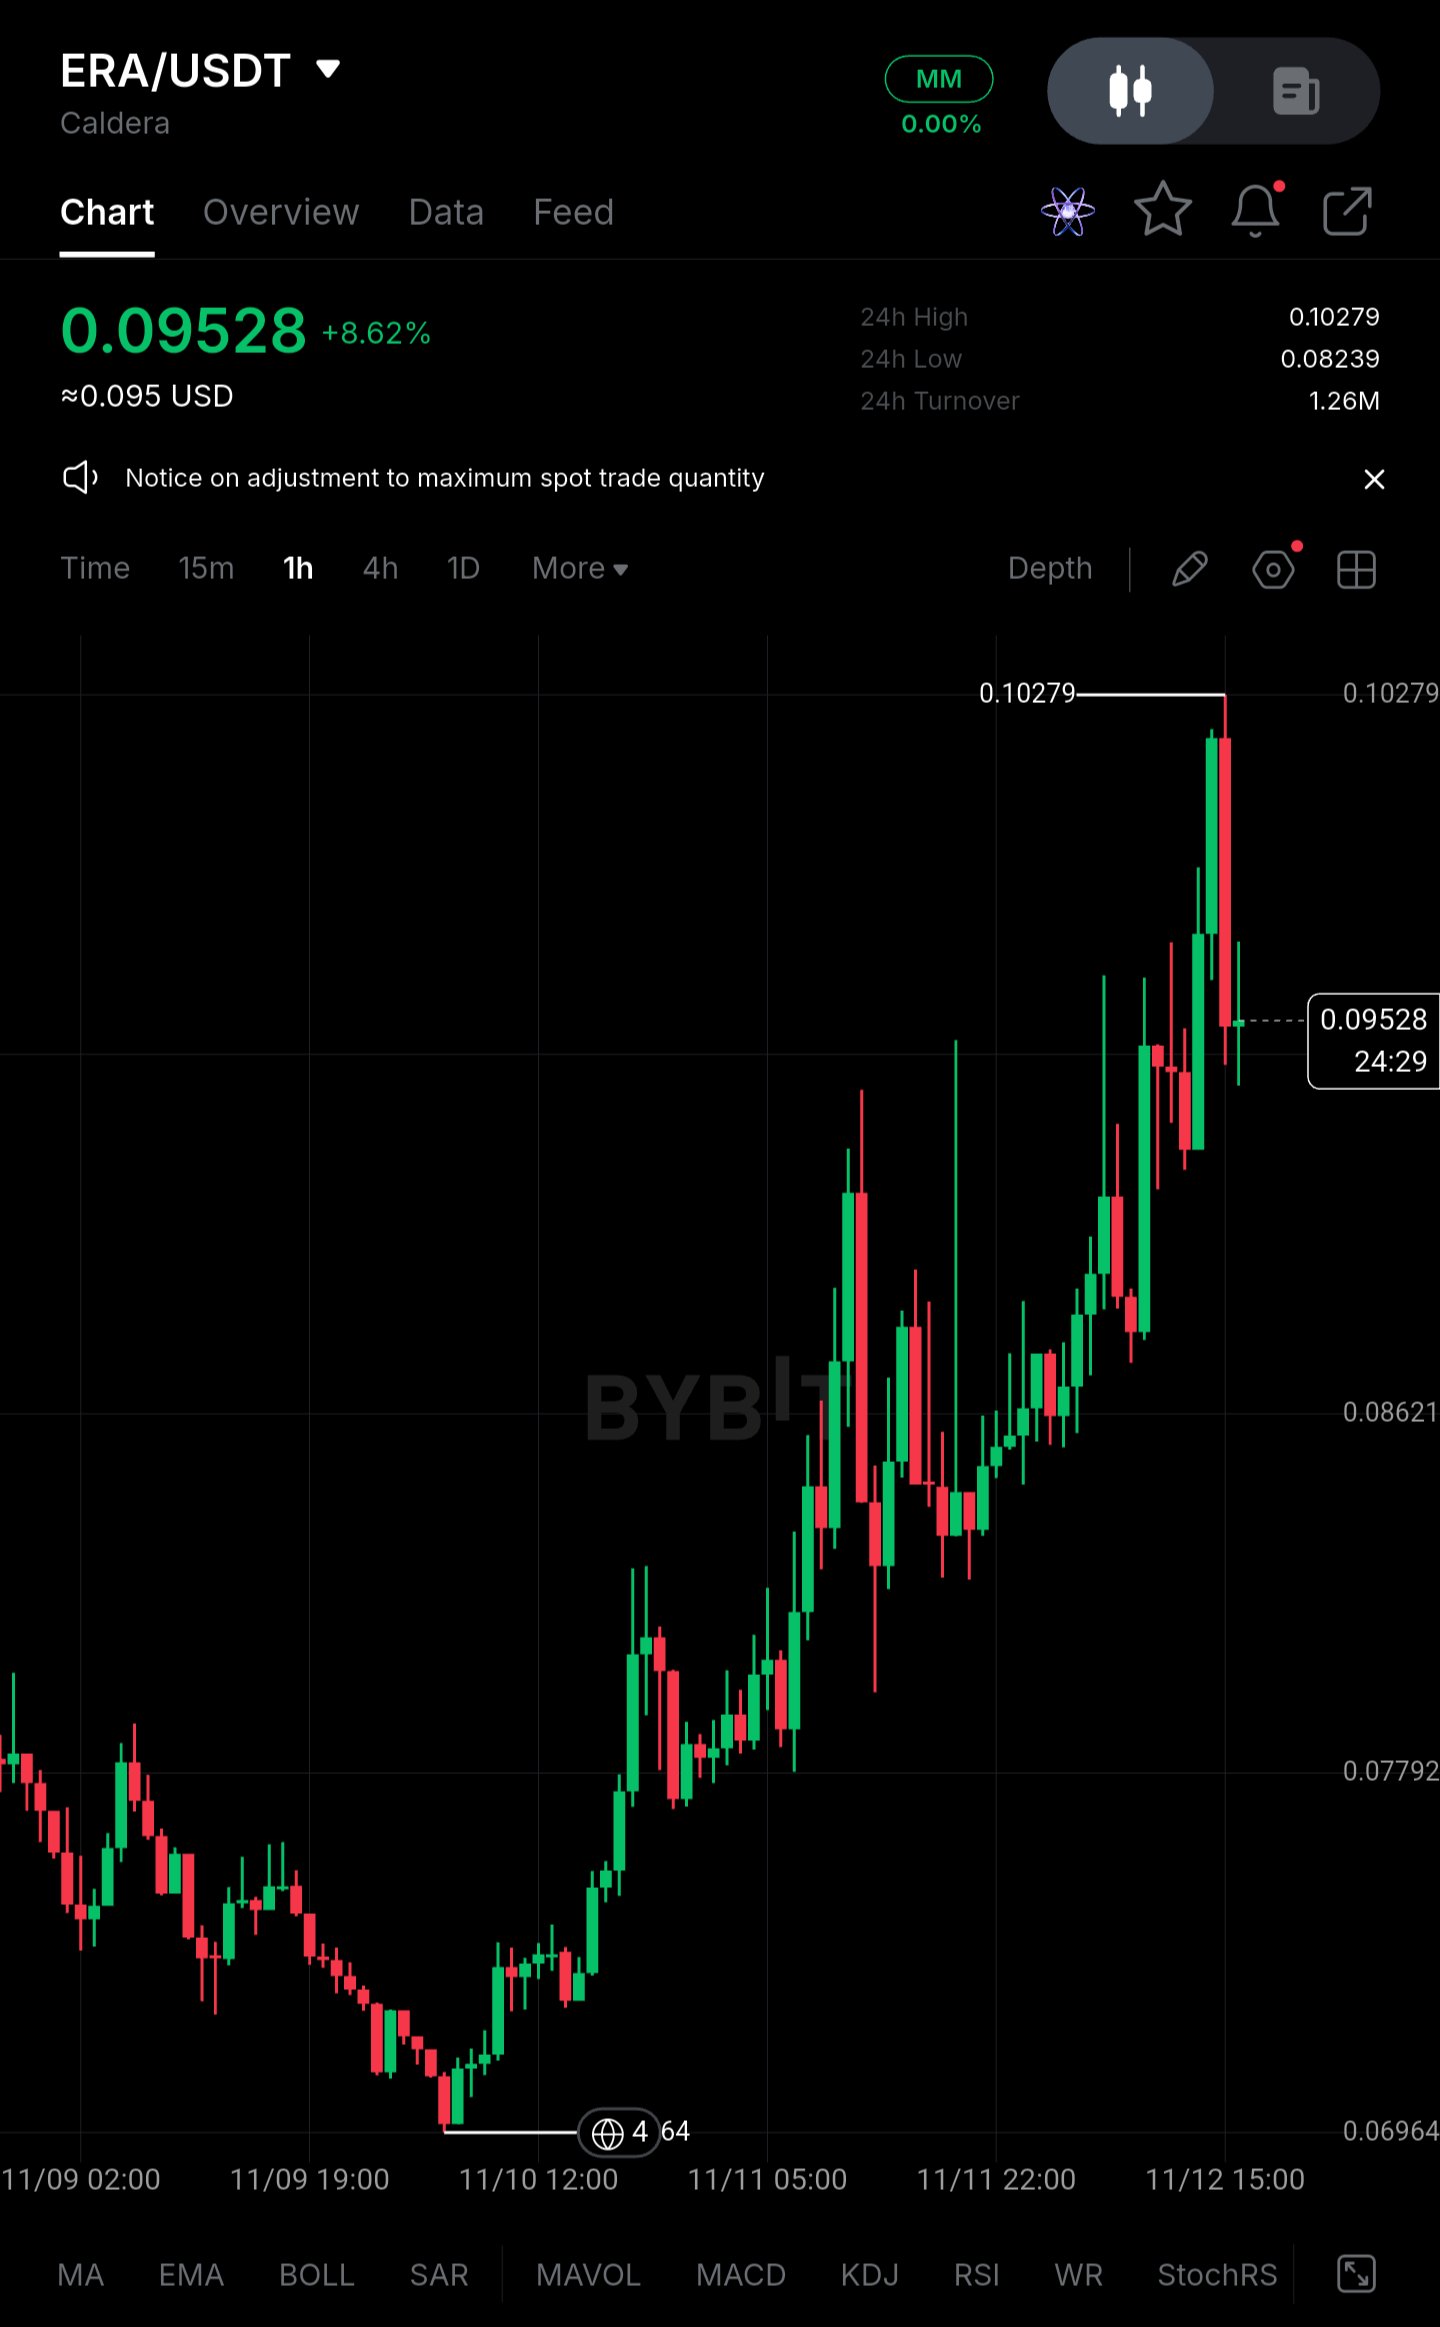
$ERAUSDT – Tinjauan Kerangka Waktu Lebih Tinggi | Long saat Pullback** Pair: $ERAUSDT (Grafik 1J, Bybit) Setelah penurunan stabil ke area 0,0696, ERA telah berbalik arah dan naik hampir tanpa jeda. Harga kini berada di sekitar 0,0953, naik sekitar 8,6% hari ini, setelah sempat menyentuh 0,10279. Level tertinggi tersebut ditolak dengan cepat, dengan sumbu atas yang panjang dan candle merah tepat di bawahnya. Saya tidak menangkap bagian bawahnya, jadi saya juga tidak tertarik untuk mengejar puncak pergerakan ini. **Pandangan Saat Ini dan Level Kunci** **Zona Pembelian: 0,0824 – 0,0862** Level terendah 24 jam berada di 0,0824, dan 0,0862 adalah tempat grafik menunjukkan level reaksi sebelumnya. Bersama-sama, keduanya membentuk area pullback tempat kenaikan sebelumnya dibangun. Saya ingin melihat harga melambat di sini, bertahan di zona tersebut, dan mencetak higher low (level terendah yang lebih tinggi) dengan pembeli yang kembali masuk. Satu kali sentuhan saja tidak cukup. **Zona Resistance: sekitar 0,1028** Ini adalah level tertinggi 24 jam, tempat dorongan terbaru ditolak dengan kuat. Penjual kemungkinan besar akan mempertahankannya lagi. Penembusan bersih dan konsolidasi berkelanjutan di atasnya akan menunjukkan bahwa tren dapat berlanjut dan mengubah level tersebut menjadi support. Sumbu cepat di atas level tersebut yang langsung dijual kembali bukanlah sebuah breakout. **Pengaturan Trading** **Posisi:** Long saat pullback **Zona Entry:** 0,0824 – 0,0862, hanya setelah reaksi pembeli terlihat jelas **Stop-Loss:** Di bawah 0,0824 (penutupan di bawah level terendah 24 jam) **Invalidasi:** Jika harga kehilangan level 0,0824 dan bertahan di bawahnya, struktur higher-low rusak dan pantulan dari 0,0696 terlihat lebih seperti pergerakan relief (pemulihan sementara). Di bawah itu, referensi terlihat berikutnya adalah 0,0779. **Take-Profit:** - TP1: 0,0953 (area harga saat ini, untuk profit parsial) - TP2: 0,1028 (level tertinggi 24 jam, resistance utama) - TP3: Tidak ditentukan. Tidak ada struktur yang ditandai di atas level tertinggi tersebut, jadi saya akan melakukan penilaian ulang setelah terjadi breakout yang terkonfirmasi. **Mengapa Pengaturan Ini Masuk Akal** ERA telah bergerak dari sekitar 0,0696 ke 0,1028 dalam rentang waktu singkat, dan candle terakhir menunjukkan penjual bereaksi di dekat puncak. Membeli di sana berarti masuk terlambat, dengan potensi kenaikan yang sempit ke level tertinggi dan invalidasi yang jauh. Pullback ke 0,0824–0,0862 memberikan struktur yang jauh lebih baik. Stop-loss bisa diletakkan tepat di bawah level terendah 24 jam, dan dua target pertama berada di level yang sudah ditunjukkan grafik. Jika pembeli tidak mempertahankan zona tersebut, saya tidak akan masuk. Sebuah zona hanyalah tempat untuk dipantau, dan entry memerlukan konfirmasi. **Manajemen Risiko** Hormati stop-loss dan jangan memindahkannya setelah Anda masuk. Sesuaikan ukuran posisi agar kerugian di stop-loss masih bisa diterima. Struktur bullish bisa gagal, dan tidak ada pengaturan yang menjamin keuntungan. Ini adalah rencana trading, bukan nasihat keuangan. $ByXIMPACT
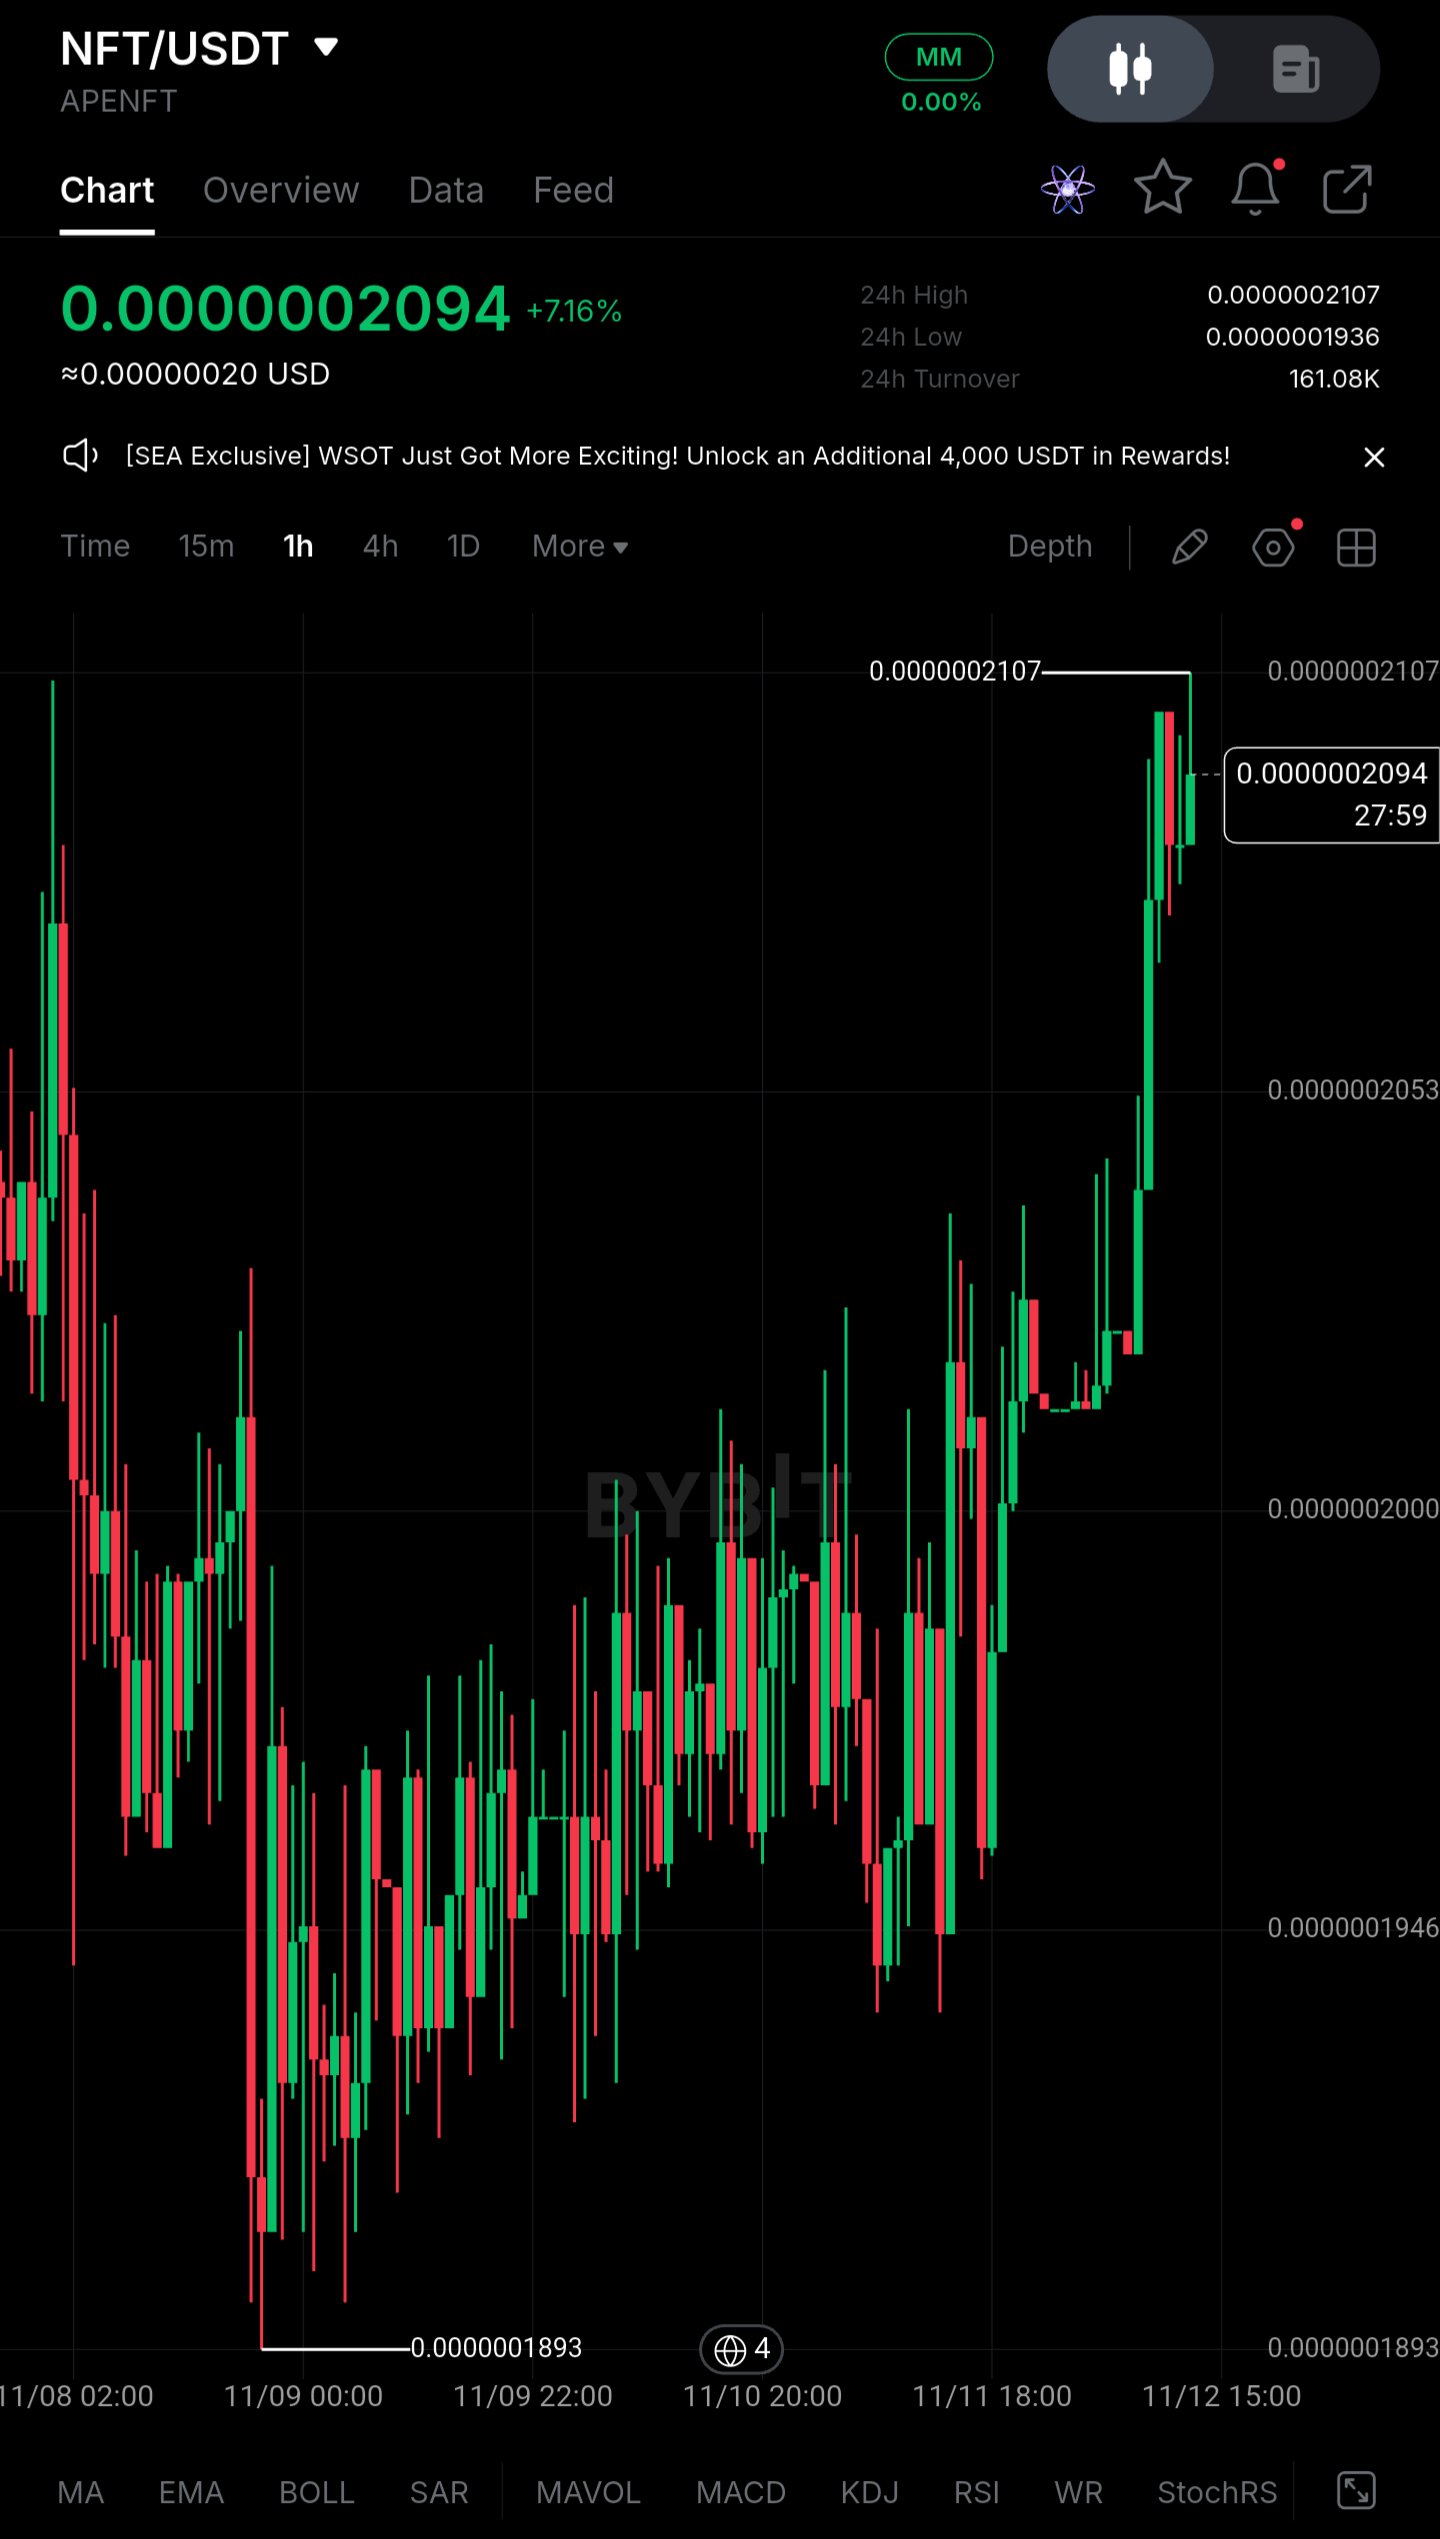
$NFTUSDT – Higher Timeframe Overview | Long on Pullback** Pair: $NFTUSDT (APENFT) NFT has been working its way higher on the 1h chart after printing a low at 0.0000001893 on 9 November. The days after that were choppy, with overlapping candles and long wicks both ways, but the lows kept getting a little higher. Today price finally pushed out of that range, and it now sits at 0.0000002094, up about 7% on the day. I didn't get involved during the base-building phase, and I'd rather wait than chase this move. **Current Outlook and Key Levels** *Buying Zone: 0.0000002000 – 0.0000002053* This area was the upper part of the recent range, where price stalled and moved sideways just before the breakout candle. Old resistance that has been broken often gets retested as support. I'd want to see buyers defend it with a visible reaction, such as a rejection wick or a strong hourly close back up. A slow bleed through the zone with no response would not count as a confirmation. *Resistance Zone: 0.0000002107* This is the 24h high, and price is only about 0.6% below it. The last candles show small bodies and upper wicks, so sellers are active. A clean break and a few hourly closes above it would suggest the range has turned into a higher base. That would be the first real sign of structural strength, though not a guarantee of continuation. **Trading Setup** - **Position:** Long on pullback - **Entry Zone:** 0.0000002000 – 0.0000002053 (only after buyer confirmation) - **Stop-Loss:** 0.0000001946 - **Invalidation:** A sustained hourly close below 0.0000001946 means price has fallen back into the old range. The breakout would then look like a failed push, and the idea is off. - **TP1:** 0.0000002107 (24h high) - **TP2:** A move beyond 0.0000002107 would mean price is trading above all levels visible on this chart. I have no verified level there, so I'd trail the stop on structure instead of setting a fixed target. TP1 alone doesn't pay well against this stop. Most of the reward would have to come from a continuation above the high, so I'd take partial profit at TP1 and manage the rest with a trailing stop. **Why This Setup Makes Sense** Buying right under 0.0000002107 after a vertical move leaves little room above and a lot of room below. If the move fades, price can drop back to the 0.0000002000 area quickly. Waiting for the pullback puts the entry closer to a level that has already been tested, and it gives me a clear point where the idea is wrong. The stop below 0.0000001946 sits under the recent higher lows, so it only triggers if the structure actually breaks. The wide stop also means a smaller position size. If price never pulls back and simply breaks higher, I'm fine missing it. Turnover is only about 161K over 24 hours, so this is a thin market, and the extra patience costs very little. **Risk Management** Stick to the plan and don't move the stop once you're in. Size the position so a stop-out is an acceptable loss, especially in a market this thin. A bullish structure can fail, and no setup guarantees a profit. *Not financial advice.* #ByXIMPACT
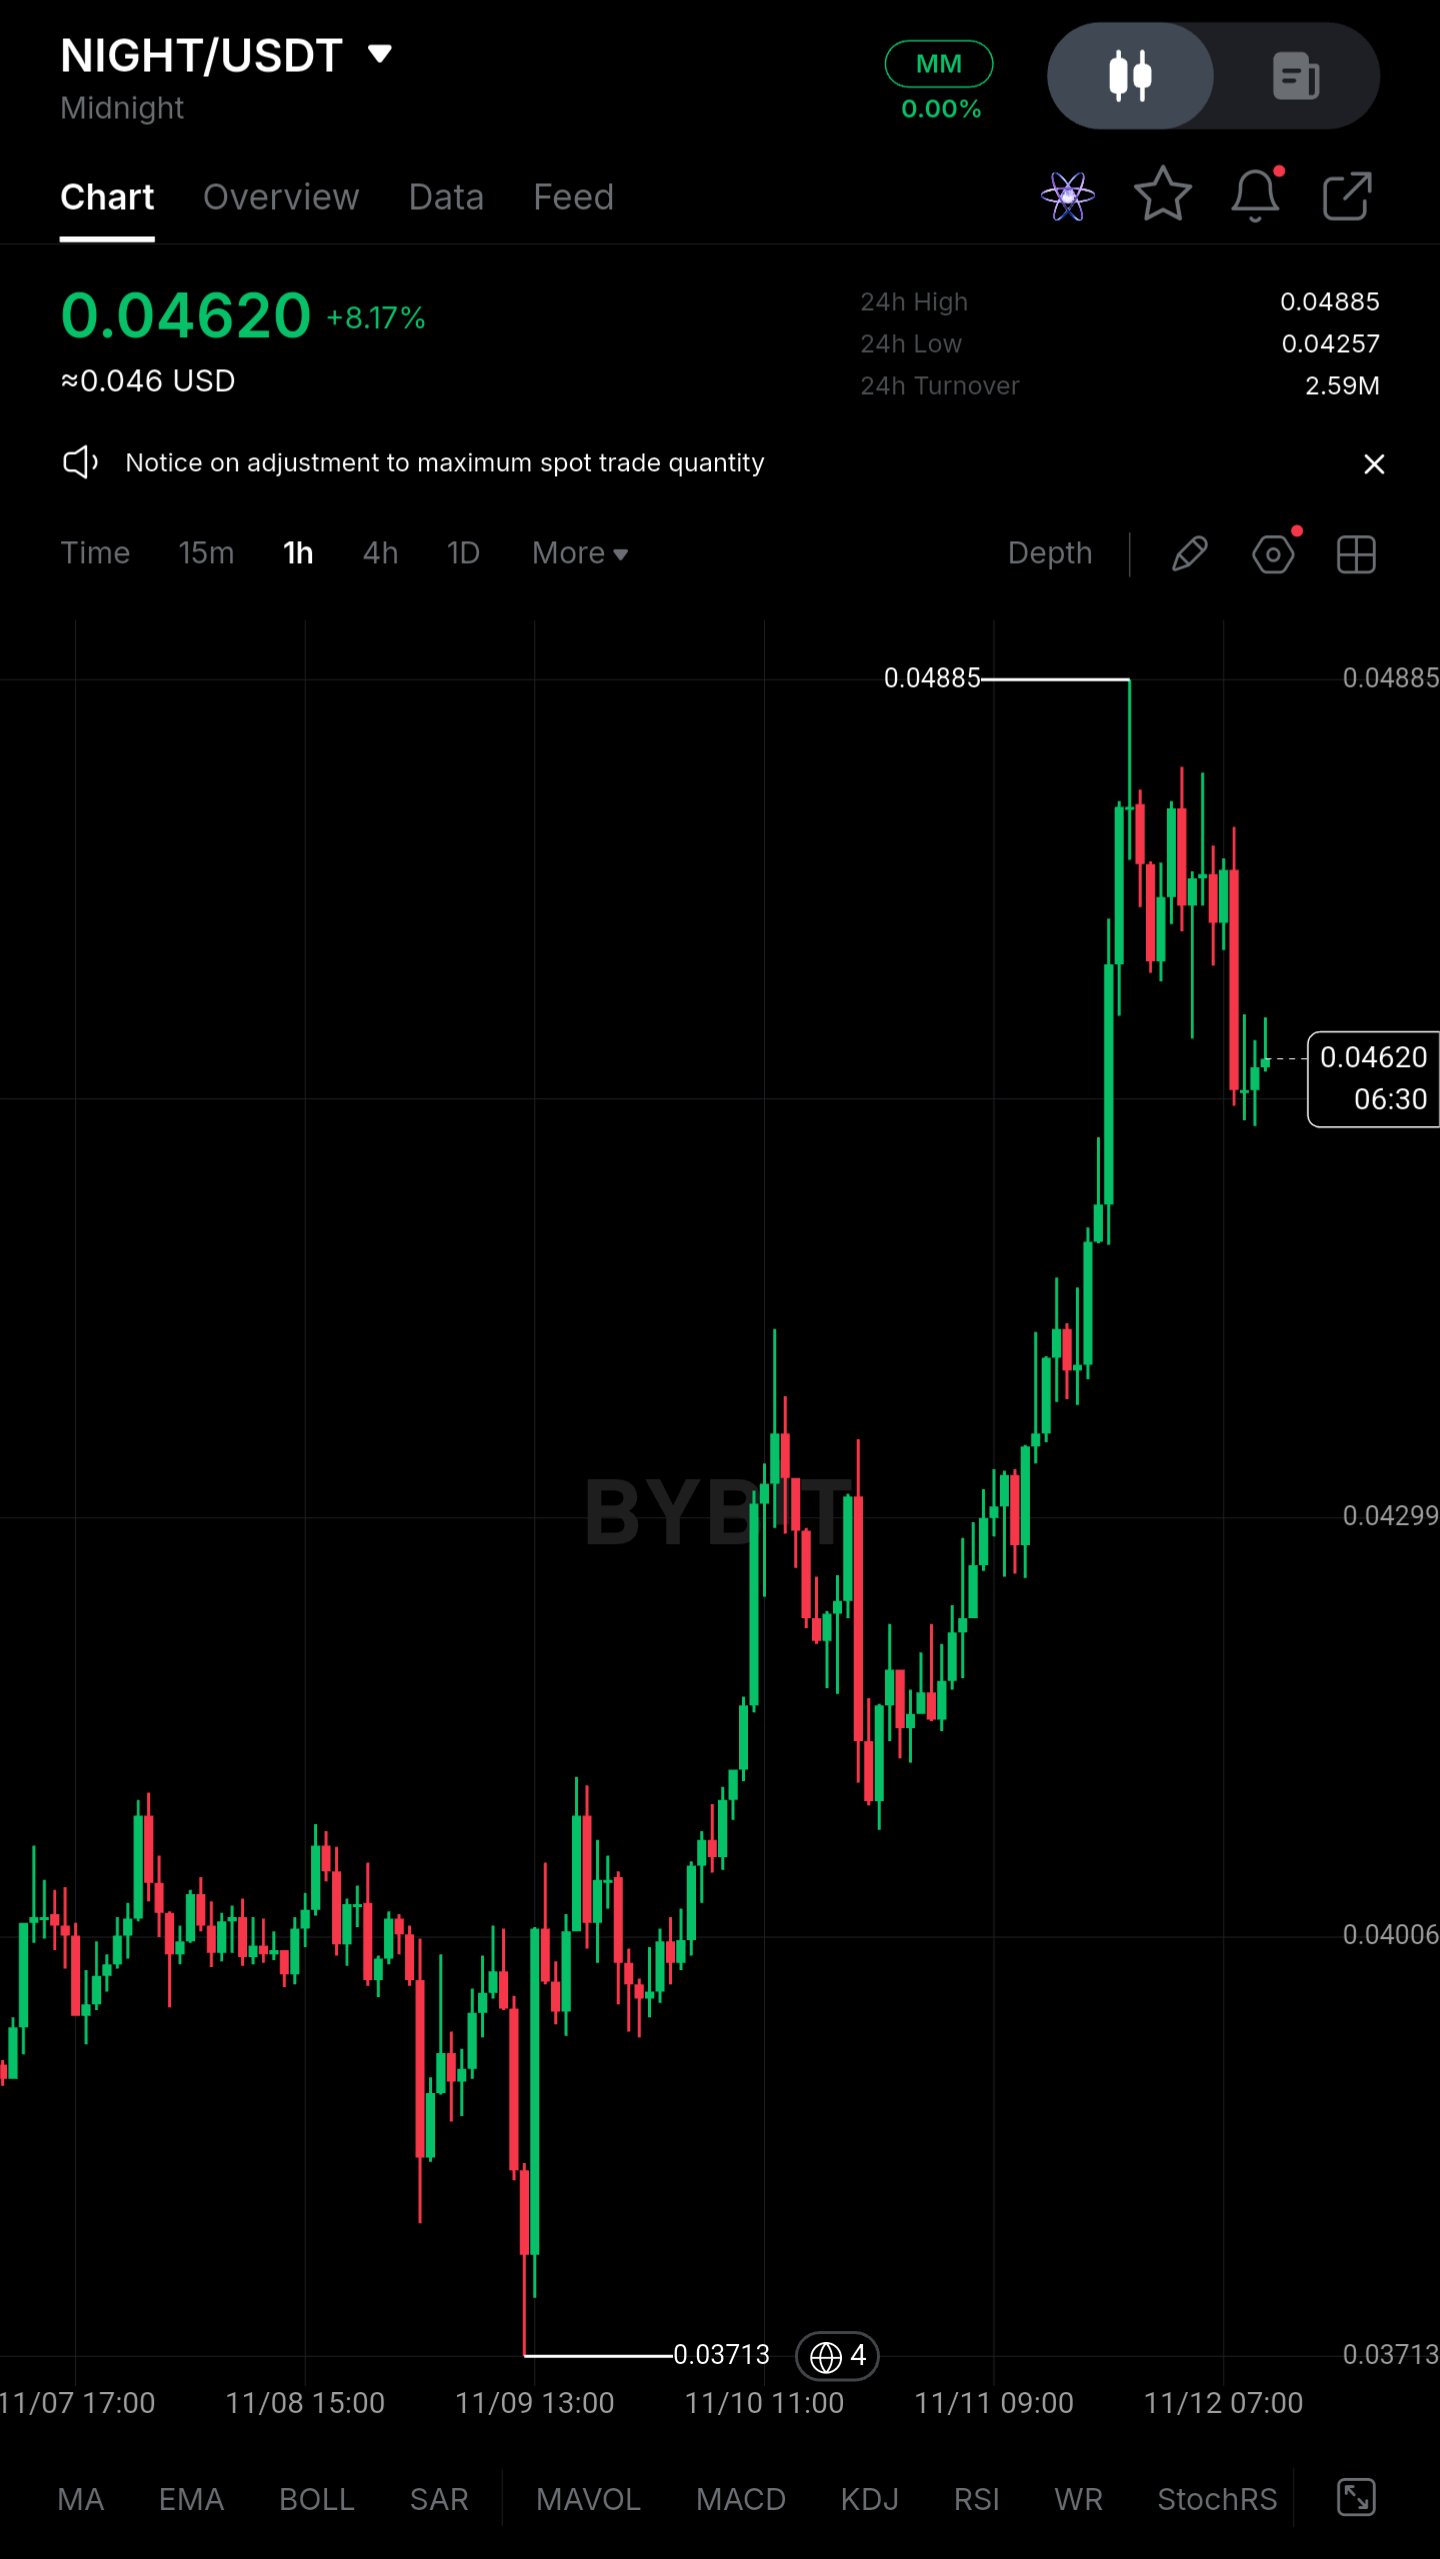
$NIGHTUSDT (Midnight) holds near $0.0462 after a rebound from $0.03713, but I'm not treating this as a recovery yet** NIGHT trades around $0.0462, up 8.17% on the day. It sits roughly 24% above the $0.03713 low from 9 November and about 5% below the 24h high of $0.04885. The bounce was sharp, but the move is already rolling over from its peak. The bigger concern is whether large holders are using this strength to distribute into a derivatives market that looks long-tilted. **Price Action** - Price: about $0.0462 (≈$0.046) - Move: roughly +31% from the $0.03713 low to the $0.04885 high, followed by a roughly 5% pullback - 24h range: $0.04257 to $0.04885, on about $2.59M in turnover - Immediate resistance: $0.0475 to $0.0488, where the latest rejection formed - First support: $0.0430 to $0.0426, the prior consolidation base and the 24h low A reclaim of $0.04885 would signal that buyers can absorb supply at the highs. Even then, the broader structure only shifts from a deep drawdown to a rebound within a range, not to a confirmed trend reversal. **Large Capital Picture** Without ETF-style flow data, large-wallet and exchange-flow behavior is the relevant lens. The sell-off into $0.03713 and the vertical rebound look more like a liquidity-driven swing than steady accumulation. The rally came in impulsive bursts, and the lower highs and long upper wicks near $0.0488 show supply is meeting every push. Demand is present, but it is inconsistent. **Liquidity & Range Conditions** The latest hourly candles are compressing after a sharp red leg from the highs. A narrow range after a fast move is not evidence of accumulation. Turnover of about $2.59M is modest for a 31% swing, which suggests the move may be thinly supported. Stronger spot participation is still needed. **Derivatives Positioning** Exact figures are not visible on a spot chart, so the following are reasonable estimates from the price structure: - Open interest: elevated and rebuilding after the squeeze off the lows - Funding: likely positive, meaning longs are paying shorts - Long share of accounts: likely around 55% to 60% This positioning is vulnerable. If $0.0430 fails, late longs from the $0.044 to $0.048 zone could be forced out, amplifying the move down. **Key Figures** - Current price: ~$0.0462 - Immediate resistance: $0.0475 to $0.0488 - Support zone: $0.0430 to $0.0426 - Recent low: $0.03713 - 24h turnover: ~$2.59M - Open interest: elevated (estimated) - Funding: positive (estimated) - Long share: ~55% to 60% (estimated) **Confirmation Levels** - Bullish: an hourly close above $0.04885 with rising spot volume opens $0.0500, then the mid-$0.05 area. - Bearish: a breakdown below $0.0430 exposes $0.0400, then a retest of the $0.03713 low, with long liquidations likely accelerating the move. **Closing** The stabilization is real but temporary. Rebound strength, large-holder supply and crowded long positioning are all competing at the same time. The decisive signal is whether spot buyers return while leverage stays controlled, or whether another support breakdown triggers fresh long liquidations. *Not financial advice.* #ByXIMPACT