CryptoDex
41913Suka92Pembagian623Penggemar134Ikuti
📈 Advanced Price Action | Tokenomics & Market Cycles ⚡️ Translating Whale Moves into Actionable Setups (BTC, ETH, Alts) 👇 Get Daily Alpha & Deep Chart Breakdowns
📈 Advanced Price Action | Tokenomics & Market Cycles ⚡️ Translating Whale Moves into Actionable Setups (BTC, ETH, Alts) 👇 Get Daily Alpha & Deep Chart Breakdowns
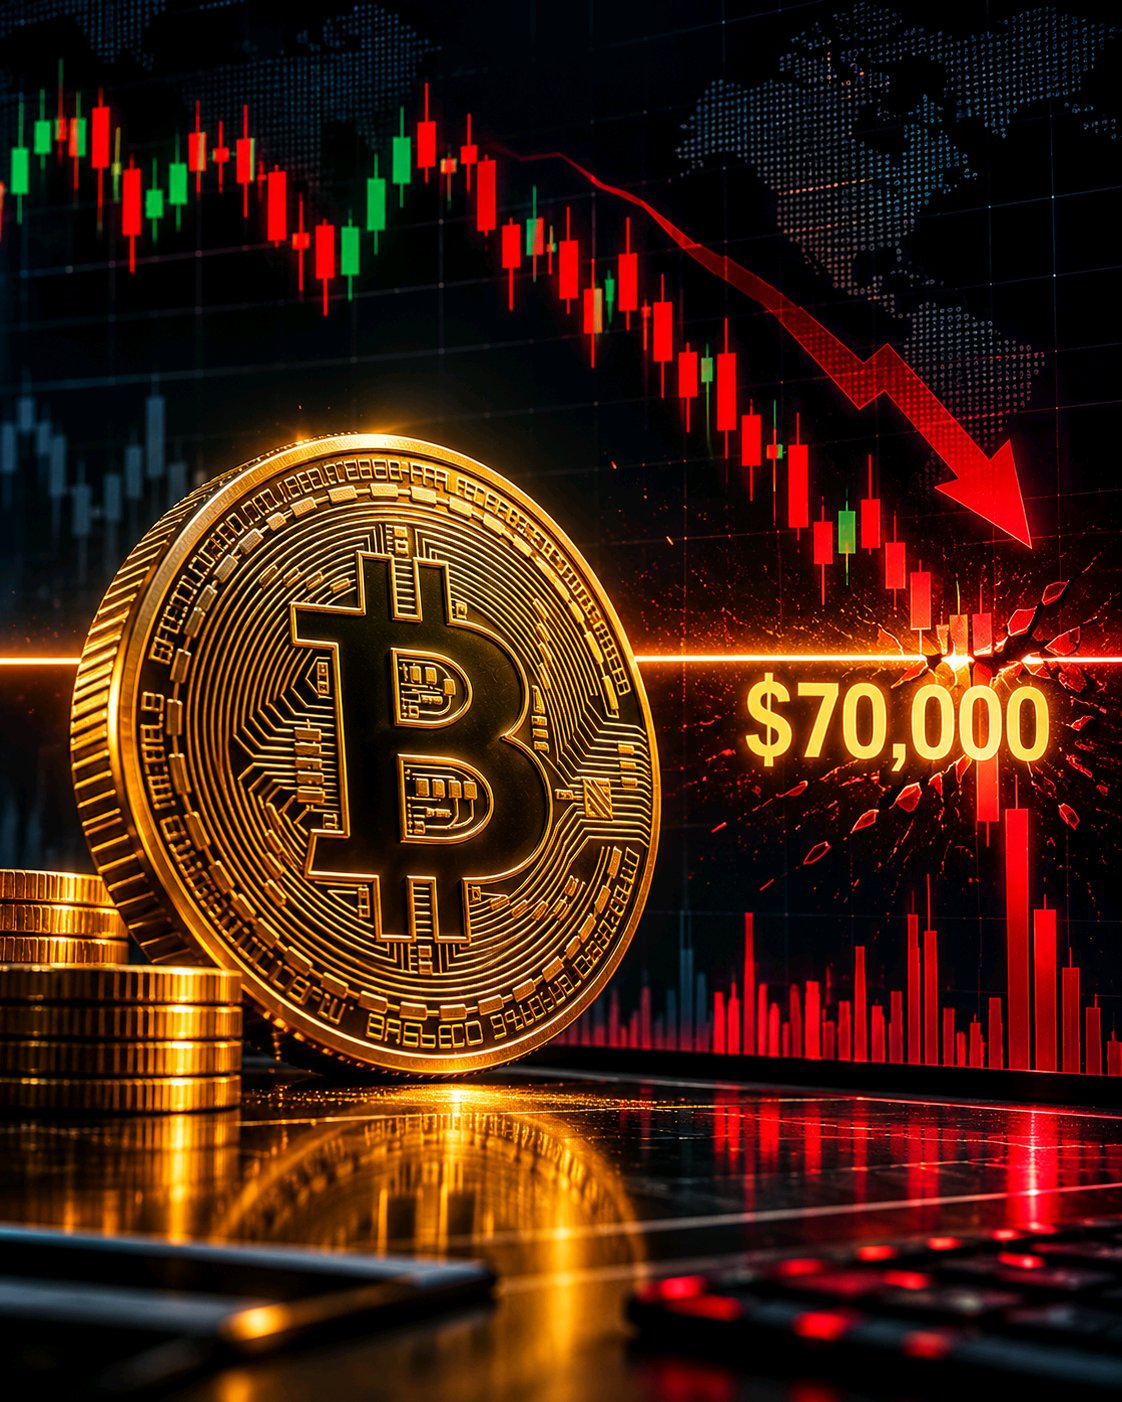
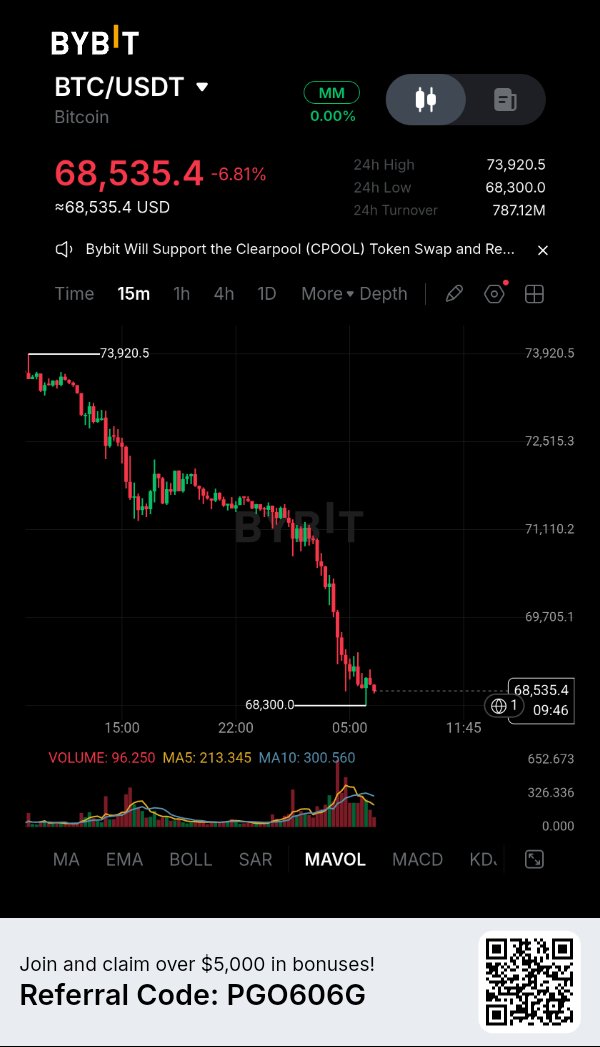
BREAKDOWN DI ANGKA $70K BARU SAJA MENGUBAH SENTIMEN PASAR
Bitcoin telah jatuh di bawah $70.000, menandai level terendahnya sejak Agustus. Lebih dari $1,3 miliar posisi kripto dengan leverage dilikuidasi dalam waktu 24 jam, mempercepat aksi jual. Ini bukan lagi sekadar koreksi pasar biasa. Leverage, penjualan institusional, dan melemahnya kepercayaan bergabung untuk menekan para bull BTC. Tiga kekuatan yang mendorong tekanan tersebut: Leverage reset: BTC saja menyumbang sekitar $677 juta dalam likuidasi, termasuk hampir $500 juta di sekitar level tembus $70rb. Permintaan institusional: ETF Bitcoin spot AS mencatat arus keluar selama lima hari berturut-turut, dengan total sekitar $1,44 miliar. coindesk.com Tekanan makroekonomi: Indeks Dolar AS naik di atas 103, mencapai level tertinggi sejak April 2025, sementara ekspektasi kenaikan suku bunga membebani aset berisiko. cryptonews.net APA SELANJUTNYA? 🟢 Skenario bullish: BTC merebut kembali $70rb, stabil di atasnya, dan arus ETF kembali positif. Wilayah $73rb–$75rb menjadi area pemulihan yang penting. 🔴 Skenario bearish: Penolakan lain di bawah $70rb, dikombinasikan dengan arus keluar institusional yang terus berlanjut, dapat memperpanjang koreksi. Pendapat saya: Gelombang likuidasi mungkin telah membersihkan leverage yang berlebihan, tetapi itu saja tidak mengonfirmasi harga terendah (bottom). Saya ingin melihat pembelian spot yang tulus kembali sebelum menyatakan adanya pembalikan tren (reversal). Sinyal besar berikutnya bukanlah prediksi lain. Melainkan apakah pembeli sungguhan akan masuk. Apakah kita sedang menyaksikan peluang akumulasi Bitcoin berikutnya, atau pasar sedang bersiap untuk koreksi yang lebih dalam? $BTCUSDT . #ByXIMPACT
🚨NVIDIA JUST LOST ITS BIGGEST LEADER
Nvidia is entering a new chapter. Jensen Huang, the co-founder who led Nvidia for more than three decades, has resigned as CEO and left the board. CFO Colette Kress will serve as interim CEO while the company searches for a permanent successor. Reuters +1 What does this mean for NVDAUSDT? 📉 Short term: Leadership uncertainty can trigger volatility, weaken investor confidence and increase selling pressure. Nvidia shares initially dropped as much as 14% before recovering part of the losses. AP News ⚠️ Medium term: Investors will question whether Nvidia can maintain its AI roadmap, strategic partnerships and execution without its most influential leader. 🟢 Bullish possibility: A smooth transition, strong financial results and continued AI-chip demand could restore confidence. 🔴 Bearish possibility: A prolonged leadership vacuum, weaker guidance or additional geopolitical pressure could extend the correction. My trading perspective: This is not automatically the end of Nvidia's growth story. Its technology, customers and AI ecosystem do not disappear with one executive's departure. But the market needs proof that the company can execute without Jensen Huang. For NVDAUSDT, I would prioritize volatility management, volume confirmation and clear price-action signals over emotional reactions to headlines. One question for traders: Is Nvidia facing a temporary leadership crisis, or are we witnessing the beginning of a major shift in its market valuation? $NVDAXUSDT #ByXIMPACT #WSOT2026 #USInflationRunsHotAndRateHikeBetsRise #SanDiskAnnounces8For1StockSplit #AnthropicIPOTestsTheAIBoom


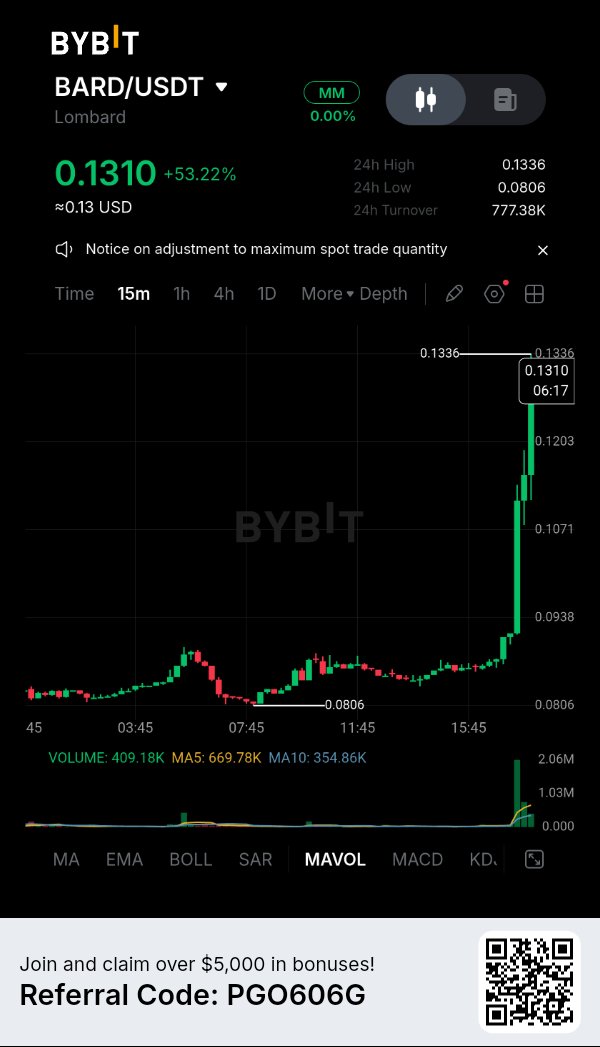
⚡THE SPIKE ISN'T THE SIGNAL — THE HOLD IS.
Lombard's delivered an explosive 15-minute move, reaching $0.1310 (+53.22%) on the Bybit snapshot, with a high of $0.1336. But the rally has since sharply retraced, with broader market feeds showing approximately $0.082–$0.087. The next challenge is rebuilding support, not simply repeating the breakout. Key levels to watch: $0.0806 — Critical local support. $0.0938 — First recovery level. $0.1071 — Next bullish reclaim. $0.1203–$0.1336 — Previous spike zone. Bullish scenario: Defend $0.0806, reclaim $0.0938 and confirm stronger momentum above $0.1071. Bearish scenario: Losing $0.0806 would put further downside pressure in focus. The bigger picture: BARD represents Lombard's protocol token, while LBTC is its separate yield-bearing Bitcoin asset. Lombard Docs No chasing vertical candles. Let confirmation lead the trade. Is BARD preparing for a recovery, or was this simply a short-lived liquidity spike? $BARDUSDT #ByXIMPACT #WSOT2026 #USInflationRunsHotAndRateHikeBetsRise #SanDiskAnnounces8For1StockSplit #AnthropicIPOTestsTheAIBoom

THE $73.2K PIVOT IS THE LINE TO WATCH
is facing a critical market test. Price has slipped below its 200-day moving average near $73.2K, while spot Bitcoin ETFs recorded five consecutive sessions of net outflows through November 11, totaling approximately $1.17B. Institutional demand remains an important signal to watch. Key levels to watch: Bullish scenario: Reclaim $73.2K and hold it, opening a potential move toward $74.8K–$75.2K. Bearish scenario: Continued weakness below $73.2K puts $72K in focus. Confirmation: Stronger spot volume and improving ETF flows. RSI near 34 suggests weak momentum, but oversold conditions alone do not confirm a market bottom. My focus: No blind dip buying. I want to see buyers demonstrate strength before calling a reversal. Are we approaching a recovery, or is Bitcoin preparing for another downside move? $BTCUSDT #ByXIMPACT #WSOT2026 #USInflationRunsHotAndRateHikeBetsRise #SanDiskAnnounces8For1StockSplit #AnthropicIPOTestsTheAIBoom

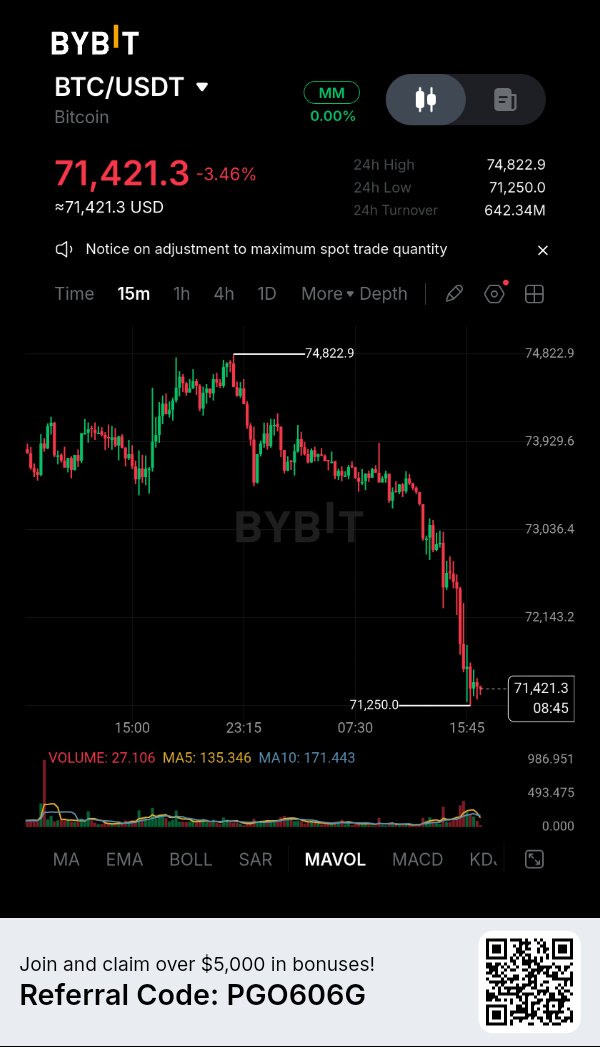
APPLE TOKEN SURGES: IS $360 NEXT? 🍎🚀
AAPLX is showing strong buying momentum on Bybit, climbing from the $347.33 area toward its 24-hour high. Buyers are now testing a critical resistance zone, and the next candle closes could determine whether the rally continues. 📊 Market Snapshot Current price: $359.30 24H change: +2.91% 24H high: $359.60 24H low: $349.15 24H turnover: 106.24K Underlying Apple stock price: $357.9390 🎯 Key Levels to Watch 🟢 First support: $356.53 🔵 Stronger support: $353.46 🟡 Major support: $350.3 🔴 Immediate resistance: $359.60 📈 Bullish Scenario A strong 1H close above $359.60, supported by increasing volume, could open the door toward the psychological $360 level and potentially higher. 📉 Bearish Scenario If price fails to break $359.60, a pullback toward $356.53 is possible. Losing that level could expose $353.46. 🔥 Fundamental Perspective AAPLX is a tokenized asset designed to track Apple stock, connecting traditional equity exposure with blockchain trading. Bybit explains that xStocks can trade 24/7, while corporate actions may adjust their multiplier. They do not provide direct shareholder voting rights or separate cash dividends. Help Center 💡 My Trading Strategy Momentum currently favors buyers, but chasing price near resistance is risky. I'm watching for a confirmed breakout above $359.60 or a healthy retest of $356.53 before considering the next move. Trade the confirmation, not the excitement. $AAPLXUSDT #ByXIMPACT #WSOT2026 #USInflationRunsHotAndRateHikeBetsRise #SanDiskAnnounces8For1StockSplit #AnthropicIPOTestsTheAIBoom

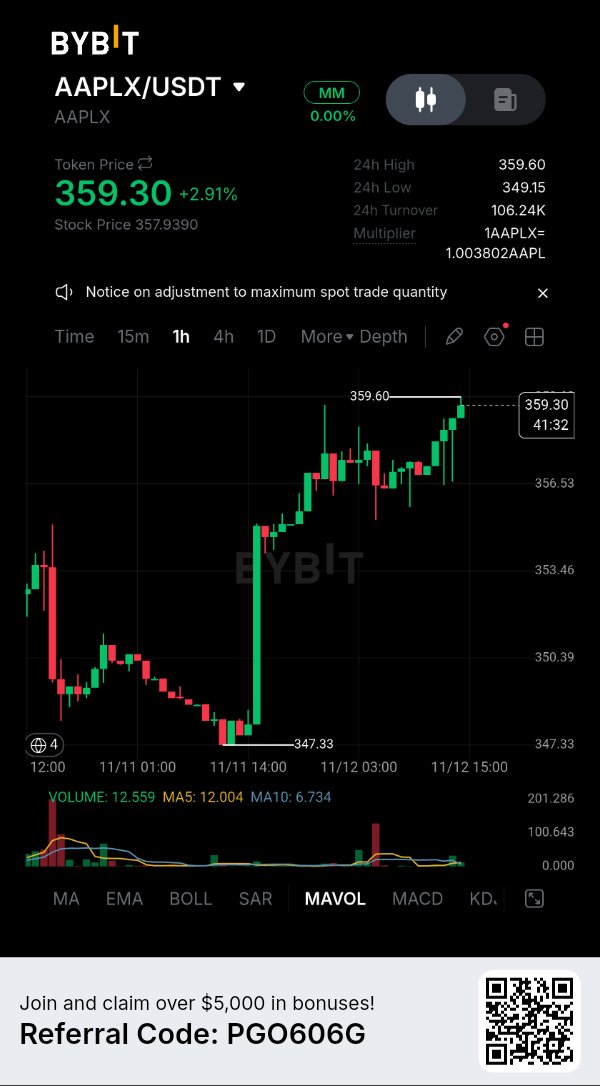
BISAKAH OPTIMISM MEMPERTAHANKAN SUPPORT UTAMANYA? 🔥
Optimism (OP) sedang menghadapi tekanan jual, dan para trader sedang mengamati zona support krusial. Pasar masih bearish untuk saat ini, tetapi pemulihan yang kuat bisa mengubah gambaran jangka pendek. 📊 Snapshot Pasar Harga saat ini: $0,0956 Perubahan 24J: -3,69% Harga tertinggi 24J: $0,1031 Harga terendah 24J: $0,09519 Open interest futures: $57,37 Juta Funding rate: -0,0059% 🎯 Level Kunci untuk Diperhatikan 🟢 Support langsung: $0,0948 🔵 Support utama: $0,0907 🔴 Resistance pertama: $0,0993 🚀 Resistance berikutnya: $0,1100 COINOTAG 📈 Skenario Bullish Jika pembeli mempertahankan level $0,0948 dan merebut kembali $0,0993 dengan volume yang kuat, OP bisa membangun momentum menuju $0,1100. 📉 Skenario Bearish Penutupan harian yang terkonfirmasi di bawah $0,0948 dapat mengekspos level $0,0907 dan memperpanjang struktur bearish saat ini. 🔥 Perspektif Fundamental Optimism terus memperluas ekosistem Superchain-nya. Whitechain bergabung dengan OP Stack pada 5 November, sementara proposal tata kelola yang diterbitkan pada 8 November berupaya menyelaraskan token OP dengan kesuksesan Superchain. Perkembangan ini patut diperhatikan, meskipun pertumbuhan ekosistem tidak menjamin pemulihan harga secara langsung. Optimism +1 💡 Strategi Trading Saya OP perlu merebut kembali $0,0993 sebelum saya menganggap pemulihannya meyakinkan. Sampai saat itu tiba, melindungi modal dan menunggu konfirmasi lebih penting daripada mengejar pantulan harga. Jangan FOMO. Jangan entry membabi buta. Tradinglah dengan rencana. 💬 Apa prediksi Anda? Akankah OP pulih di atas $0,10, atau akankah penjual mendorongnya menuju $0,0907? $OPGUSDT #ByXIMPACT #InflasiASMelonjakDanTaruhanKenaikanSukuBungaMeningkat #SanDiskMengumumkanPecahSaham8Untuk1 #AnthropicIPOValuationTest #WSOT2026

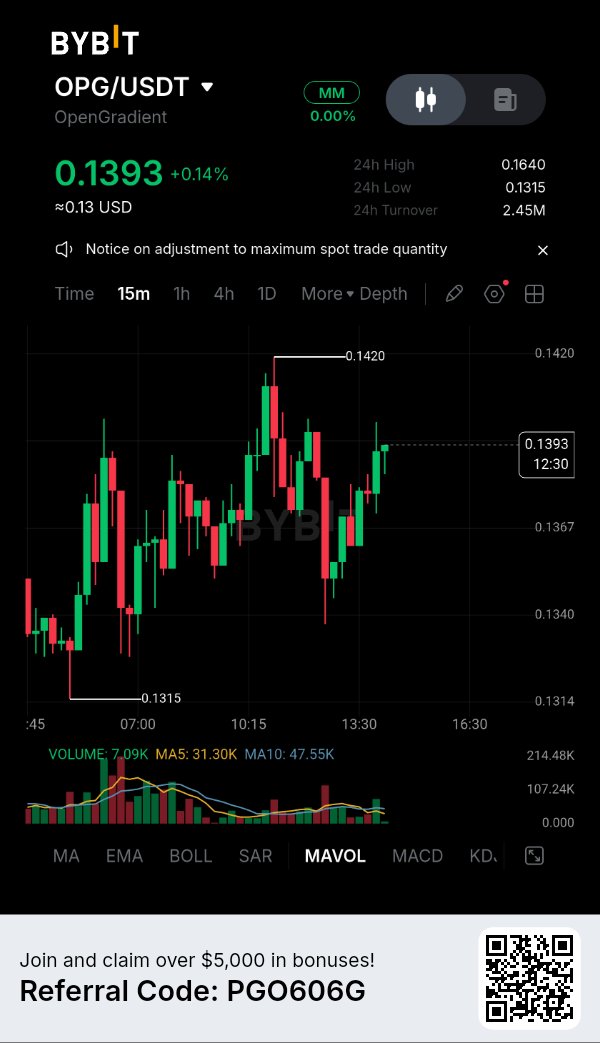
🪙EMAS DI BAWAH TEKANAN: APAKAH PEMBELI AKAN MEMPERTAHANKAN $3.920
menghadapi penurunan jangka pendek. Dengan eksposur yang terikat dengan emas dan meningkatnya minat pada aset dunia nyata yang ditokenisasi, para trader sedang mengamati apakah pembeli dapat merebut kembali kendali atau penjual akan mendorong harga lebih rendah. 📊 Ringkasan Pasar Harga saat ini: $3.942,8 Perubahan 24J: -2,39% Tertinggi 24J: $4.042 Terendah 24J: $3.920 Open interest futures: $815,37 Juta CoinGlass 🎯 Level Kunci untuk Diperhatikan 🟢 Support: $3.920–$3.940 🔵 Support utama: $3.875–$3.900 🔴 Resistance: $4.000–$4.042 🚀 Zona kenaikan berikutnya: $4.100–$4.120 📈 Skenario Bullish Jika pembeli mempertahankan $3.920 dan merebut kembali $4.000, penembusan di atas $4.042 dapat membuka jalan menuju $4.100–$4.120. 📉 Skenario Bearish Penembusan yang terkonfirmasi di bawah $3.920 dapat meningkatkan tekanan jual dan membuat zona $3.900–$3.875 menjadi fokus. 🔥 Perspektif Fundamental XAUT memiliki perbedaan utama dari mata uang kripto biasa: setiap token mewakili satu troy ounce murni emas fisik. Dalam laporan 4 November-nya, Tether menyatakan bahwa cadangan Q3-nya sesuai dengan sirkulasi token sebesar 827.417,63 ons, dengan nilai cadangan yang dilaporkan sebesar $3,44 miliar. tether.io 💡 Strategi Trading Saya Saya mengamati level $4.000 dengan cermat. Reclaim yang kuat dapat menandakan momentum beli yang baru, sementara kehilangan level $3.920 akan membuat saya berhati-hati. Arah emas, likuiditas pasar, dan sentimen makroekonomi tetap penting. Jangan FOMO. Tunggu konfirmasi. Lindungi modal Anda. 💬 Apa prediksi Anda? Akankah XAUT pulih di atas $4.000, atau akankah penjual mendorongnya di bawah $3.920 terlebih dahulu? $XAUTUSDT #ByXIMPACT #InflasiASMelonjakDanTaruhanKenaikanSukuBungaMeningkat #SanDiskMengumumkanPecahSaham8Untuk1 #AnthropicIPOValuationTest #BitcoinMencapaiTitikTerendahDuaBulanSetelahPemiluParuhWaktuAS

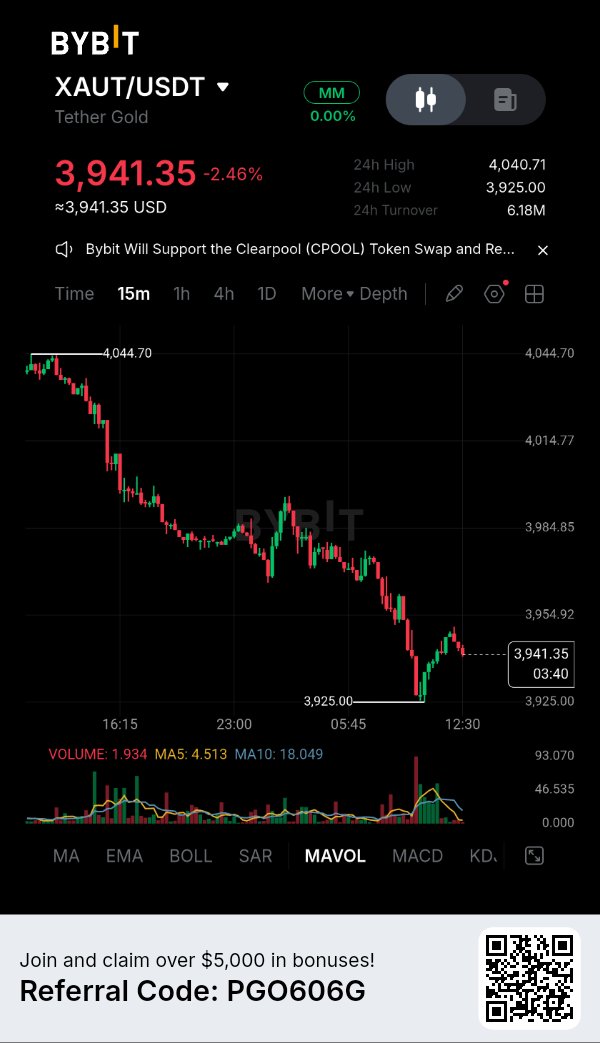
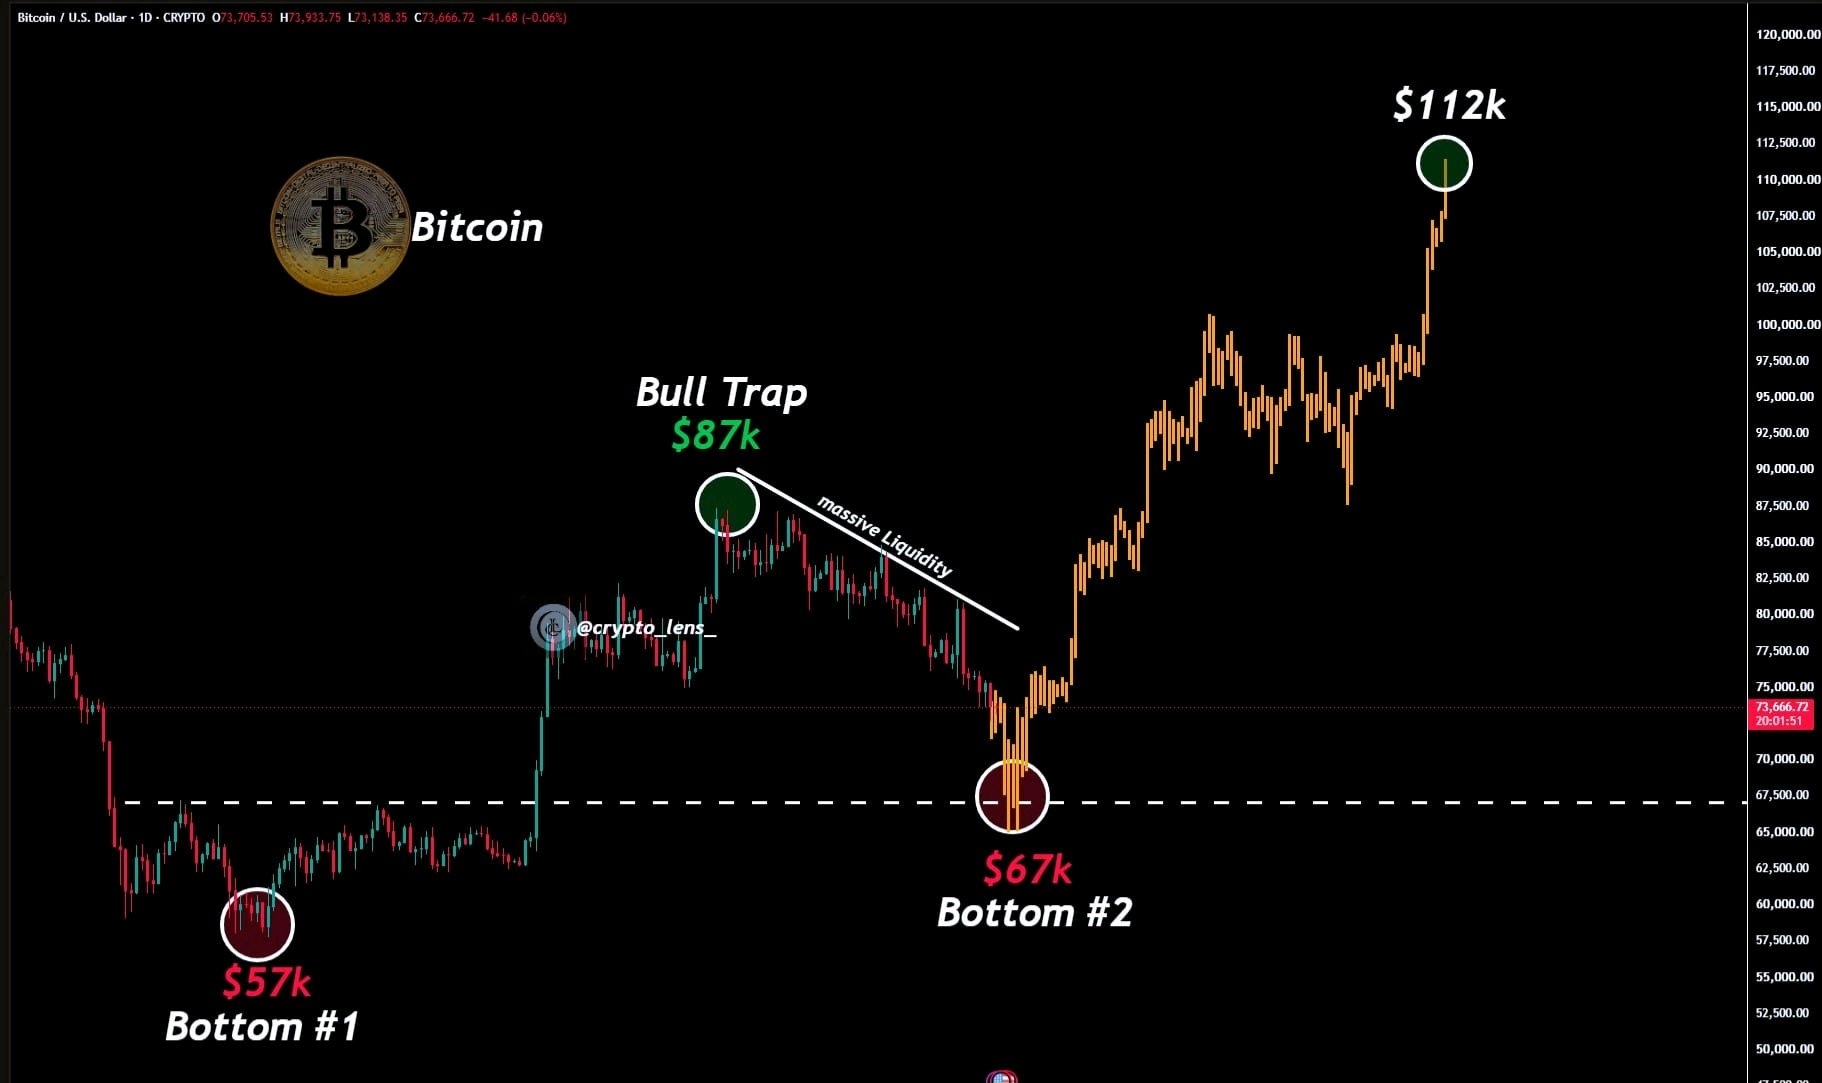
🚨 EVERYTHING IS PLAYING OUT EXACTLY AS I PREDICTED A few days ago, I told you that Bitcoin would drop to $73K. Bitcoin is now in the final stage of forming a double bottom. The plan hasn't changed: $73K → $70K → $67K → New Bull Run Save this chart and compare it again in a few months. Follow me and turn on notifications. Don’t be late. Whatever update comes next, I’ll post it here first $BTCUSDT #IMPACTbyTrade #WSOT2026 #USInflationRunsHotAndRateHikeBetsRise #BitcoinHitsTwoMonthLowAfterUSMidterms #AITechSelloffErases2Point5TrillionFromNasdaq100

IS MANTLE PREPARING FOR A STRONG RECOVERY? 🚀
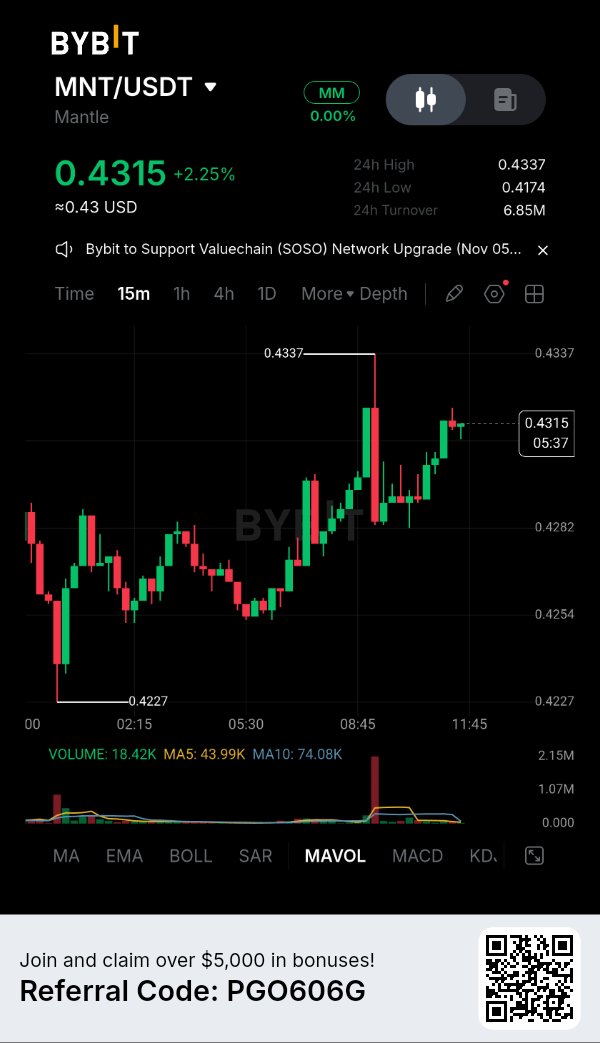
Mantle (MNT) is showing signs of a short-term recovery, but buyers still have an important challenge ahead. The key question is whether this bounce can turn into a genuine bullish reversal. 📊 Market Snapshot Current price: $0.428 24H change: +1.16% 24H high: $0.4339 24H low: $0.4167 Futures open interest: $41.7M CoinGlass +1 🎯 Key Levels to Watch 🟢 Support: $0.4174 🔵 First resistance: $0.4367 🔴 Major resistance: $0.4442 📈 Bullish Scenario If MNT reclaims $0.4367 with strong buying volume, momentum could improve. A confirmed breakout above $0.4442 would strengthen the bullish structure. 📉 Bearish Scenario If sellers push MNT below $0.4174, the recovery could lose momentum and further downside pressure may follow. Bybit +1 🔥 What Makes MNT Interesting? Mantle's recent governance activity and ecosystem development keep the project on traders' radar. However, derivatives data shows negative funding and declining trading volume, meaning the current bounce still needs stronger confirmation. CoinMarketCap +2 💡 My Trading Strategy I'm watching the $0.4367 resistance closely. A breakout with volume could create an interesting opportunity, while a rejection may offer another test of support. No FOMO. No blind entries. Wait for confirmation and manage risk. 💬 What is your prediction? Will MNT break $0.4442 and start a new bullish move, or will bears push it back below $0.4174? $MNTUSDT Market snapshot: November 12, 2026. Prices may vary across exchanges. Educational content only, not financial advice. #ByXIMPACT #USInflationRunsHotAndRateHikeBetsRise #BitcoinHitsTwoMonthLowAfterUSMidterms #AITechSelloffErases2Point5TrillionFromNasdaq100 #WSOT2026

A BREAKOUT OPPORTUNITY OR ANOTHER REJECTION? 🚀
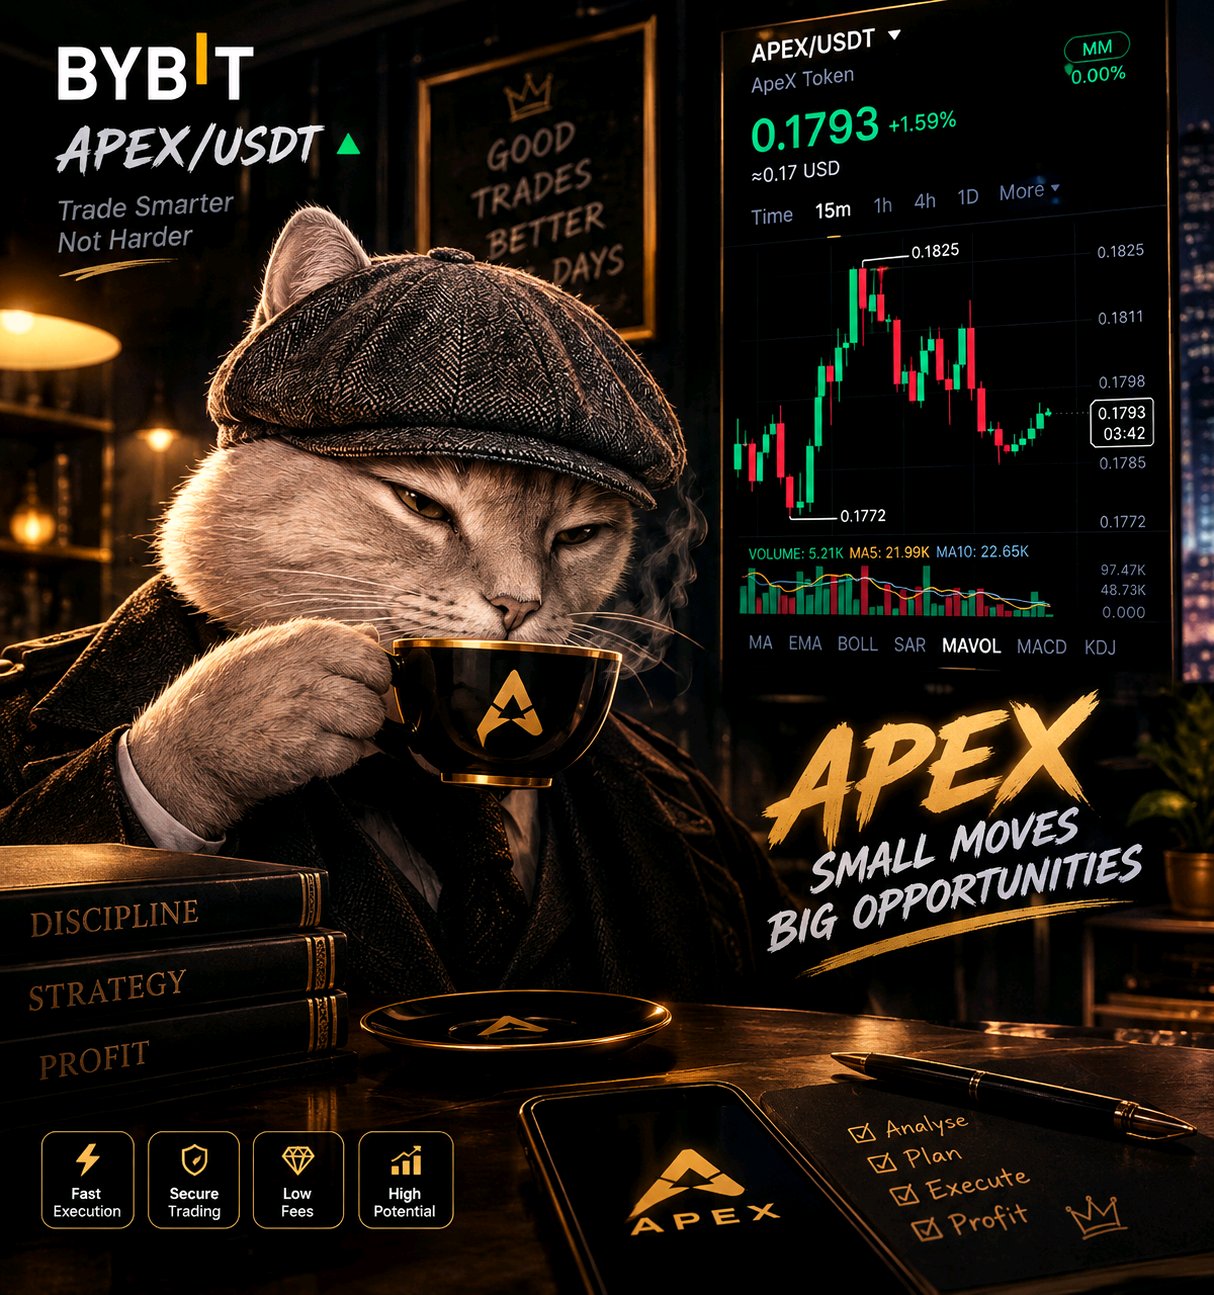
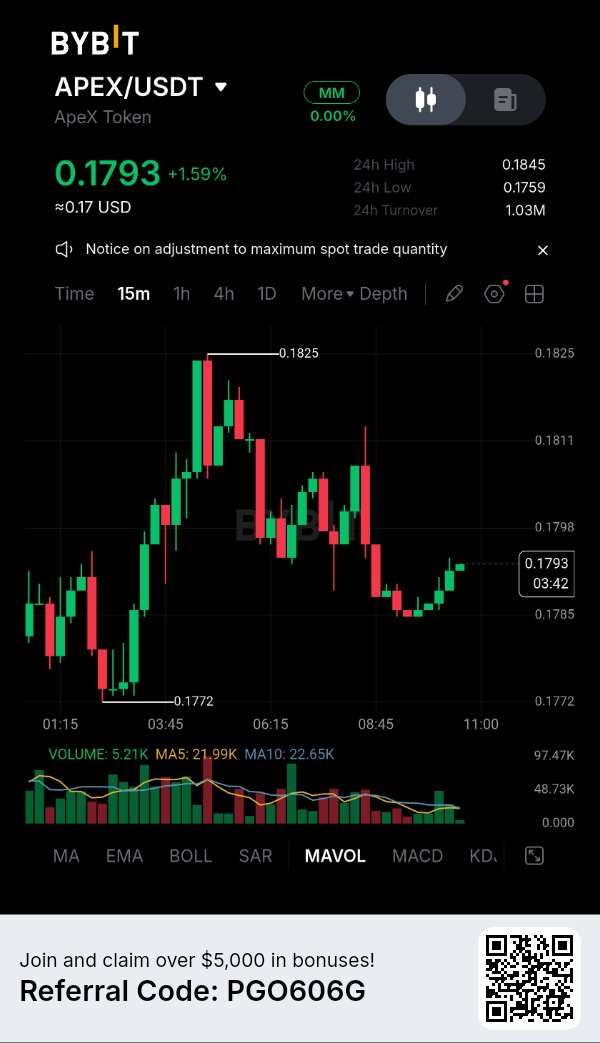
NOVEMBER 12, 2026 TRADING ANALYSIS: ApeX is approaching a decisive zone around $0.18. The next move could offer traders a clear opportunity, but confirmation matters more than speculation. Market snapshot * Current area: $0.18 * 24H range: $0.1718 – $0.1846 * Futures open interest: $4.23M * Funding rate: 0.0100% CoinGlass +1 Key levels to watch * 🟢 Support: $0.1718 * 🔴 Resistance: $0.1846 * 🚀 Bullish scenario: A confirmed breakout above $0.1846 with strong volume could open the way toward the psychological $0.19 level. * ⚠️ Bearish scenario: Losing $0.1718 could bring further selling pressure. Fundamental perspective ApeX reported 152,000 APEX tokens bought back during October. The protocol also generated approximately $290K in fees over the latest 30-day period. However, TVL has declined, so ecosystem growth still needs monitoring. Telegram +1 My trading view: APEX is worth watching, but I want to see a volume-backed breakout or a confirmed support reaction before taking a position. Patience is part of the strategy. 💬 Your prediction: Can APEX break $0.1846 and reach $0.19, or will sellers push it back toward $0.1718? Market data is a November 12 snapshot; prices vary by exchange. Educational content only — not financial advice. $APEXUSDT #IMPACTbyTrade #USInflationRunsHotAndRateHikeBetsRise #WSOT2026 #BitcoinHitsTwoMonthLowAfterUSMidterms #AITechSelloffErases2Point5TrillionFromNasdaq100
🥷$ASTER:BEYOND PRICE ACTION
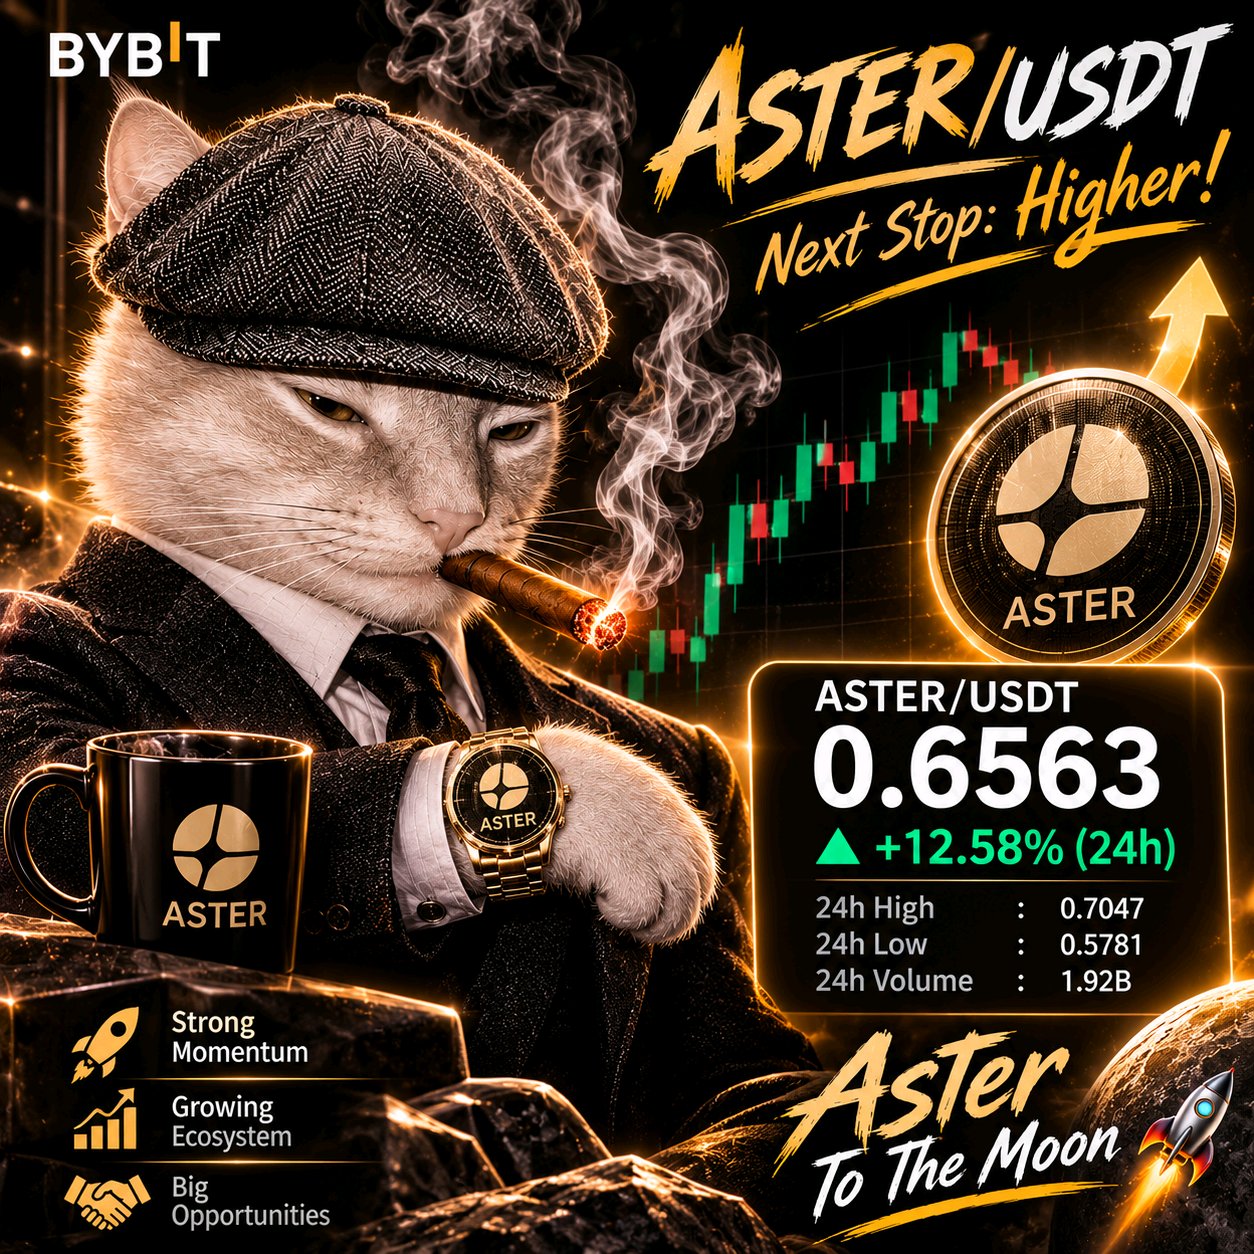
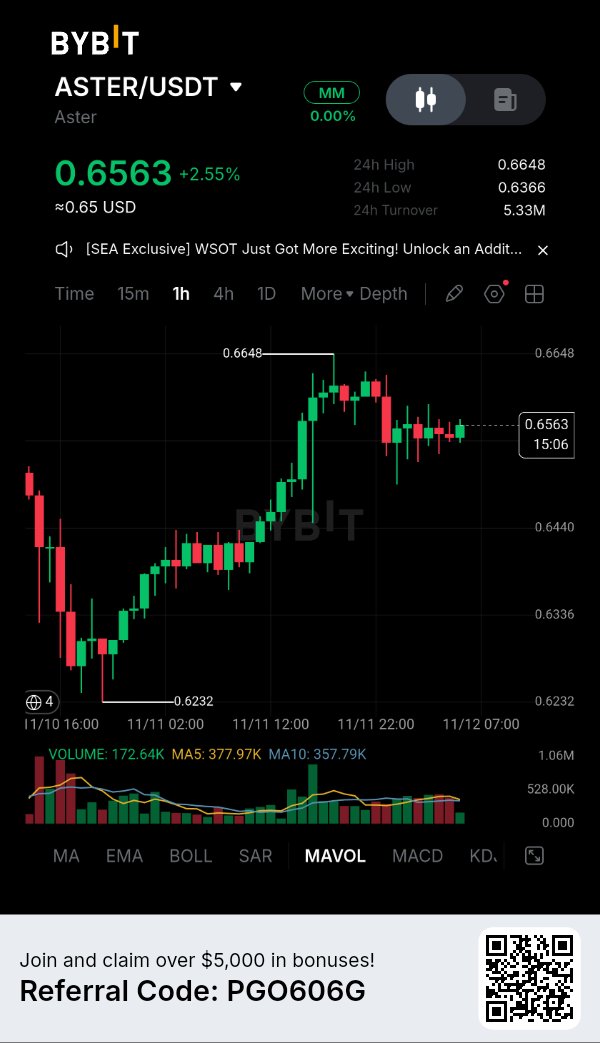
Aster is attracting attention, but the real opportunity may lie beyond short-term price movements. The project recently reported $35 billion in cumulative taker volume through its USD1 RWA Boost program after 10 epochs. This highlights significant trading activity, although volume should not be confused with revenue or net capital inflows. Sotwe Market overview — November 12: ASTER price: approximately $0.6548 24H change: +2.39% 24H range: $0.6362–$0.6643 Open interest: approximately $368.47M What I'm watching: The $0.6362 area is an important short-term reference. A confirmed breakout above $0.6643 could strengthen bullish momentum, with $0.68 as the next area to monitor. However, failure to hold support could expose ASTER to renewed selling pressure. Fundamentally, Aster's combination of perpetual trading, RWA exposure, multi-chain infrastructure and fee-linked buybacks makes it an interesting DeFi ecosystem to follow. Its long-term success will depend on sustainable adoption, real revenue and token utility. DefiLlama +1 My perspective: I'm interested in ASTER's ability to transform trading activity into sustainable ecosystem growth. A price rally is temporary; real utility is what deserves long-term attention. 💬 Do you believe ASTER has the potential to become a major player in DeFi? $ASTERUSDT #ByXIMPACT #USInflationRunsHotAndRateHikeBetsRise #USPayrollsAndRateDecisionsDriveMacroWeek #OilVolatilityTracksIranPeaceTalks #AnthropicIPOTestsTheAIBoom
Beyond the Hype, The Real Utility Engine 💎
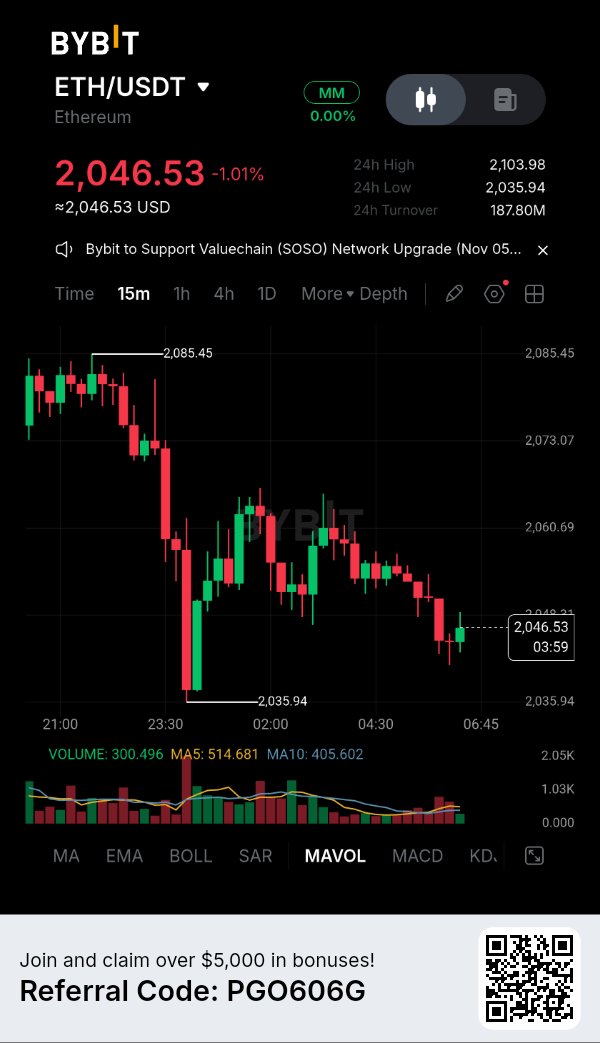
Forget short-term price action for a second. If you want to understand the true backbone of the digital economy, you have to look at Ethereum’s fundamental utility. Here is the context behind why ETH remains a cornerstone of my long-term thesis: ⚡ The Ultimate Settlement Layer: Ethereum isn't just a coin; it's the premier decentralized settlement layer. With the vast majority of Real World Assets (RWAs) and stablecoin volume flowing through its network, ETH captures value from the entire crypto ecosystem's growth. 🔥 Deflationary Mechanics: Post-Merge and with EIP-1559, Ethereum changed the game. The network actively burns a portion of transaction fees. When network activity peaks, supply shrinks. It’s a structural shift from pure inflation to a potentially deflationary asset during high-demand periods. 🛡️ Security & Decentralization: While newer Layer 1s promise speed, Ethereum prioritizes uncompromised security. It is the most battle-tested, decentralized smart contract platform in existence. Layer 2 rollups are now solving the scalability issue, allowing Ethereum to remain the secure base layer while handling massive transaction throughput. Don't just trade the charts; understand the ecosystem. When you analyze ETH, look at Layer 2 adoption rates, staking inflows, and Total Value Locked (TVL). That is where the real market context lives. Quality analysis always beats emotional trading. 📈 What’s your current outlook on ETH’s Layer 2 scaling solutions? Let’s discuss in the comments. $ETHUSDT #WSOT2026 #USInflationRunsHotAndRateHikeBetsRise #BitcoinHitsTwoMonthLowAfterUSMidterms #AITechSelloffErases2Point5TrillionFromNasdaq100 #ByXIMPACT

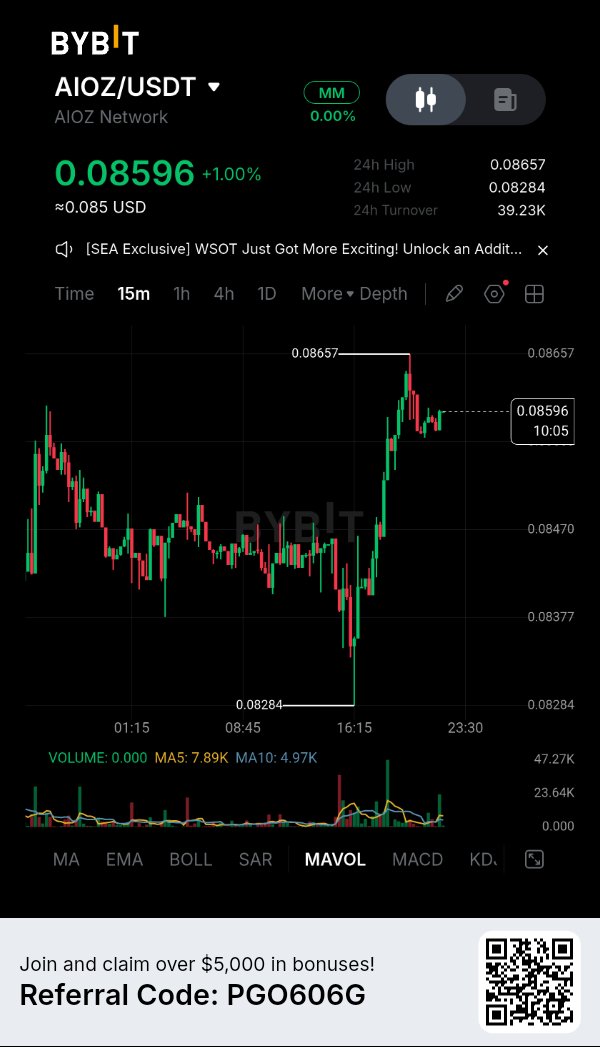
Everyone is searching for the next AI cryptocurrency. But who will provide the infrastructure that makes decentralized AI possible? This is where AIOZ Network enters the conversation. 1. WHAT MAKES AIOZ DIFFERENT? AIOZ is building a decentralized physical infrastructure network (DePIN) connecting AIOZ AI, AIOZ Storage, AIOZ Stream and AIOZ Pin. Its vision is to combine AI computation, storage, streaming and content delivery into one ecosystem. 2. WHY DOES THE AIOZ TOKEN MATTER? AIOZ has utility in network payments, DePIN rewards, staking and infrastructure incentives. Its published tokenomics include burns from transaction fees, DePIN rewards, infrastructure revenues and native dApp revenues. The published inflation schedule plans a reduction to 5% on December 25, 2026. My interpretation: the key question is whether real network usage can grow faster than token emissions. Burns do not automatically make a token deflationary. 3. DEVELOPMENT ACTIVITY Recent official updates include a Dog Breed Classification Challenge on November 10, Monocular Depth Estimation on November 5 and the AIOZ Stream MCP Server on November 4. These show product development activity, but announcements alone do not prove commercial adoption. 4. MARKET SNAPSHOT — NOVEMBER 11 CoinGecko snapshot: $0.08585, displayed 24h change +0.9%, 24h range $0.08284–$0.08640, market cap $110.75M and 24h volume $3.31M. Prices differ across exchanges. 5. TECHNICAL LEVELS Support: $0.0829 Reclaim level: $0.0859 Next resistance: $0.0885 Investing.com's November 11 technical snapshot showed RSI around 40.8 and an overall Strong Sell reading. I would not mistake a small recovery for a confirmed trend reversal. 6. THREE SCENARIOS BULLISH: Buyers defend $0.0829, volume improves and price reclaims $0.0859, opening a possible test of $0.0885. BEARISH: Price repeatedly fails at $0.0859 and loses $0.0829 on a confirmed close. NEUTRAL: Price consolidates without confirmation. Patience is preferable to forcing a trade. 7. THE BIGGEST RISK AIOZ must demonstrate developer adoption, reliable decentralized computing, competitive costs, sustainable token economics and real demand for storage, streaming and AI services. 8. MY FINAL VERDICT I'm looking at AIOZ as an infrastructure project attempting to connect decentralized computing, storage, streaming and blockchain economics. The opportunity is interesting. The challenge is execution. THE REAL QUESTION IS WHETHER AIOZ CAN TURN AI GROWTH INTO REAL NETWORK USAGE AND SUSTAINABLE DEMAND FOR AIOZ TOKENS. Do you believe decentralized infrastructure will become a serious competitor to traditional cloud providers? And can AIOZ capture part of that market? Let's discuss fundamentals, market structure and real adoption. Not just price predictions. Educational analysis, not financial advice. $AIOZUSDT #ByXIMPACT #WSOT2026 #USInflationRunsHotAndRateHikeBetsRise #BitcoinHitsTwoMonthLowAfterUSMidterms #AITechSelloffErases2Point5TrillionFromNasdaq100

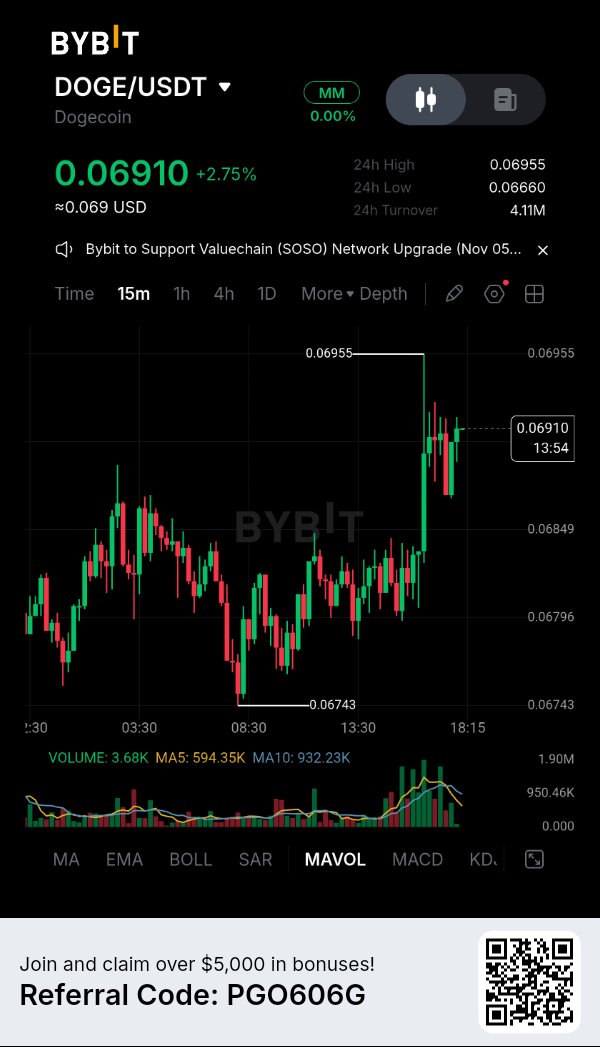
🐕THE NEXT MOVE WILL BE DECIDED BY BUYERS, NOT HYPE
Everyone talks about Dogecoin when it pumps. Very few people pay attention to what happens when the market starts testing the patience of buyers. And that is exactly why DOGEUSDT deserves attention right now. 1. THE MARKET SITUATION At the latest published November 11 market snapshot, DOGE was trading around $0.0681, down approximately 1.79% over 24 hours. Bitcoin and the broader crypto market were also under pressure. No verified DOGE-specific catalyst was identified in the available analysis. 2. THE CRITICAL PRICE ZONES SUPPORT: $0.0667–$0.0670. Buyers need to demonstrate strength here. FIRST RESISTANCE: $0.0688. Reclaiming it would be an early improvement. MAJOR RECLAIM ZONE: $0.0698–$0.0701. I would rather see DOGE reclaim and hold this zone than buy an unconfirmed green candle. 3. THREE SCENARIOS BULLISH: Support holds, volume improves, DOGE reclaims $0.0688 and $0.0701. Next area to monitor: $0.0720–$0.0723. BEARISH: A confirmed close below $0.0667 could expose $0.0644. NEUTRAL: Price remains trapped between support and resistance. Waiting for confirmation can be better than forcing a trade. 4. RSI The reported daily RSI was around 31.4. Momentum is weak and approaching oversold territory, but oversold does not automatically mean reversal. I want improving momentum, a resistance reclaim and convincing buying activity. 5. MY TRADING PHILOSOPHY No blind entries. No emotional trading. No excessive leverage. Define invalidation before entering. Risk management before profit targets. 6. THE BIGGER PICTURE Dogecoin is a case study in market psychology. Its price can react strongly to liquidity, sentiment, speculation and broader crypto-market movements. Monitor Bitcoin alongside DOGE's own price structure. FINAL THOUGHT: The question isn't simply whether DOGE can reach $0.10 again. CAN BUYERS PROVE THAT $0.067 IS A FLOOR BEFORE THE MARKET TESTS THEM AGAIN? I am watching the reaction, not chasing the prediction. Are we witnessing the beginning of a recovery, or is DOGE preparing for another liquidity sweep? Share your technical perspective. Let's discuss real market structure, not empty hype. Educational market analysis, not financial advice. $DOGEUSDT $SOLUSDT #ByXIMPACT #USInflationRunsHotAndRateHikeBetsRise #BitcoinHitsTwoMonthLowAfterUSMidterms #WSOT2026 #AITechSelloffErases2Point5TrillionFromNasdaq100

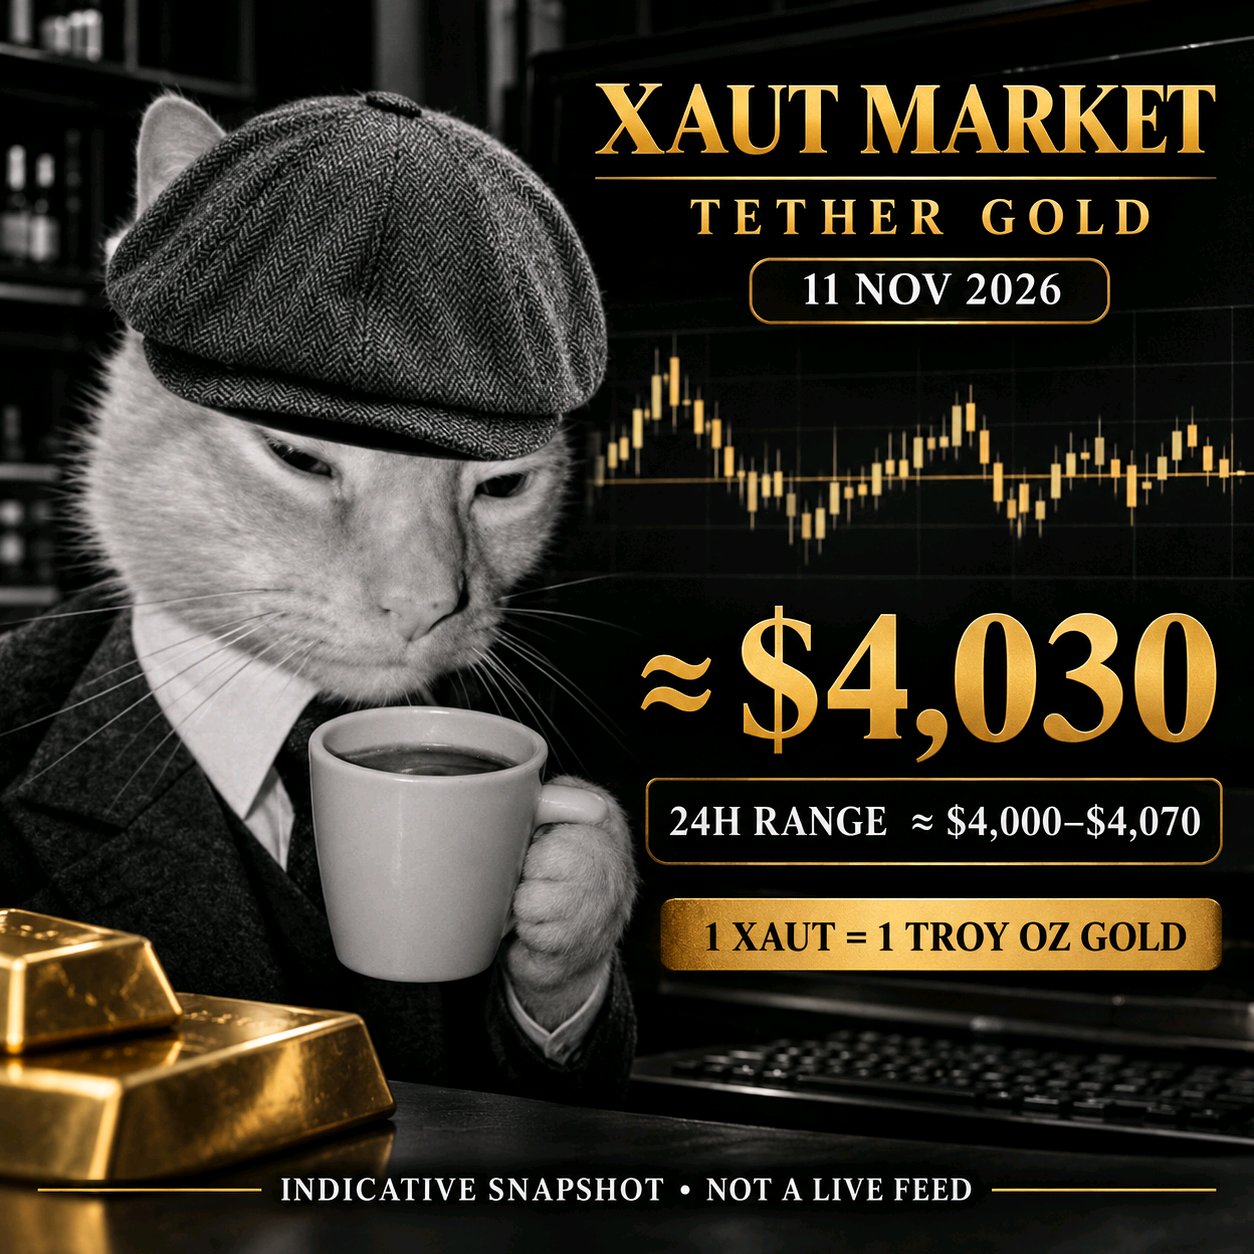
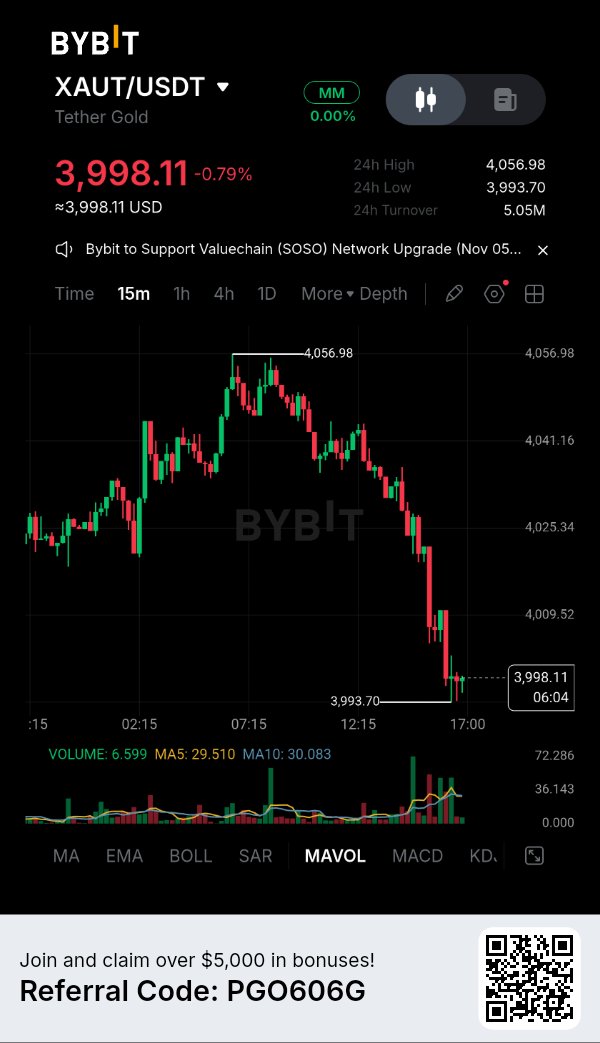
🟡$XAUT: DIGITAL GOLD IS MORE THAN YOU THINK
What happens when thousands of years of gold ownership meet blockchain technology? The answer is Tether Gold ($XAUT). But understanding XAUT requires looking beyond its price chart. We need to understand the underlying asset, reserve structure, macroeconomic forces, market behavior and risks. 1. THE FUNDAMENTALS Each full XAUT represents an ownership interest in one fine troy ounce (31.1035 grams) of physical gold associated with a specific gold bar meeting London Good Delivery standards. USDT is designed to track the US dollar. BTC is a decentralized digital asset. XAUT is designed to track physical gold. It is not a $1 stablecoin. 2. THE GOLD BACKING According to Tether's November 4, 2026 announcement, Q3 figures reported 827,417.630 fine troy ounces of gold and 827,417.630 XAUT in circulation, approximately 25.7 metric tonnes, held in Switzerland across 2,057 bars. The reported reserve value was approximately $3.44 billion. Tether says a qualified independent third party tests a sample of bars each quarter. 3. WHAT DRIVES XAUT? The US dollar, real interest rates, Federal Reserve expectations, inflation data, geopolitical uncertainty and central-bank demand all influence gold. Inflation alone is not automatically bullish: higher real yields can pressure gold. 4. MARKET CONTEXT — NOVEMBER 11, 2026 CoinMarketCap's analysis attributed recent XAUT weakness to falling spot gold after hotter-than-expected US inflation and higher rate expectations. This illustrates that XAUT inherits gold-market volatility even when its physical backing remains intact. 5. BULLISH SCENARIO Gold maintains higher highs and higher lows, the dollar and real yields weaken, and XAUT confirms a resistance breakout with a successful retest and healthy trading activity. BEARISH SCENARIO The dollar and real yields strengthen, gold breaks an important swing low, and XAUT fails to reclaim broken support. NEUTRAL SCENARIO Gold remains range-bound and macroeconomic signals conflict. Patience is better than forcing a trade. These are conditional scenarios, not live entry signals. 6. THE RISKS Custody and issuer risk, liquidity and spreads, KYC and physical redemption restrictions, blockchain and wallet security, and the possibility of a gold-market correction. Tether's published terms describe physical redemption in bar-sized quantities, normally around 430 tokens, with delivery in Switzerland and applicable fees. 7. MY FINAL PERSPECTIVE XAUT connects the value of traditional gold with blockchain transferability and accessibility. But the investment thesis must consider three things together: THE VALUE OF GOLD + THE QUALITY OF THE BACKING + THE RELIABILITY OF THE TOKEN INFRASTRUCTURE. XAUT is worth studying not because it is guaranteed to rise, but because it represents an important development in tokenized real-world assets. What is your perspective? Do you see Xaut primarily as a long-term digital gold holding or as an instrument for trading macroeconomic movements? Let's discuss with real analysis, not empty predictions. Educational market analysis. Not financial advice. $XAUTUSDT $ETHUSDT #ByXIMPACT #WSOT2026 #USInflationRunsHotAndRateHikeBetsRise #BitcoinHitsTwoMonthLowAfterUSMidterms #AITechSelloffErases2Point5TrillionFromNasdaq100
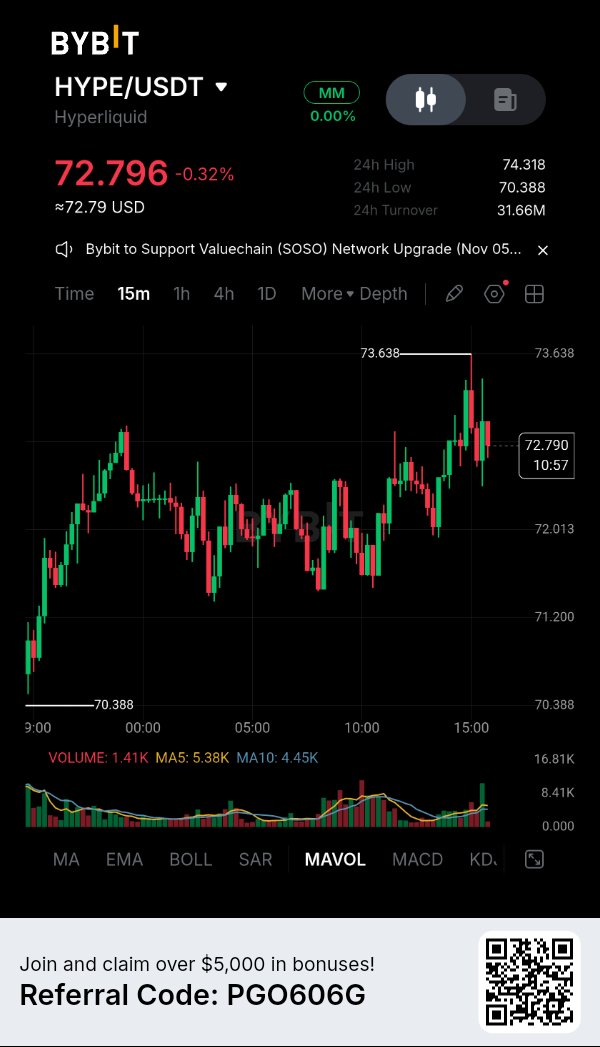
🗺️ 1. Market Structure & Price Action The 15-minute chart reveals a highly volatile, choppy intraday session, but ultimately a bullish recovery structure. · The Bottom: The session began with a sharp sell-off, establishing a firm floor at $70.388. · The Grind: Following the dip, the price entered a choppy, sideways-to-upward channel, characterized by erratic red and green candles. This indicates a battle between bulls and bears, with neither side holding absolute control for long periods. · The Breakout: Recently, bulls gained the upper hand, pushing the price to a local peak of $73.638. · Current State: The price has pulled back from the peak and is currently consolidating in the $72.79 area. It is currently testing the lower boundary of the recent breakout structure. 🎯 2. Critical Levels to Watch · 🛑 Immediate Resistance (Ceiling): $73.638 This is the current 24-hour high and the peak of the recent pump. The price was violently rejected here, leaving a long upper wick. A 15m close above this level is required to signal a continuation of the uptrend. · 🟢 Immediate Support (Floor): ~$72.01 If the current pullback deepens, this level—which acted as a pivot point multiple times earlier in the session—is the first line of defense. · 🔴 Major Structural Support: $70.388 The absolute bottom of the chart. A break below this invalidates the bullish intraday structure entirely. 📊 3. Volume & Momentum Analysis Look closely at the bottom indicator (Volume/MAVOL): · The Pump: The aggressive move up to $73.638 was accompanied by a massive spike in green volume bars. This confirms that real buying pressure drove the price up. · The Pullback: Currently, the price is retracing downward, but the volume is relatively low. This is actually a bullish sign. A low-volume pullback suggests that sellers are exhausted or simply taking profits, rather than a massive dump occurring. · Divergence Alert: Notice the most recent candle. It is red, and the price is dropping, but there is a slight uptick in red volume. Traders should watch closely to see if selling volume accelerates. ⚔️ 4. Trading Scenarios 📈 Bullish Scenario (Continuation): If the price holds the $72.01** support zone and prints a strong green 15-minute candle that breaks above **$72.80 with increasing volume, the path is clear to retest the $73.638 highs. A confirmed breakout above that could trigger a new leg up. 📉 Bearish Scenario (Rejection): The long wick at the top of the chart shows heavy selling pressure at $73.638. If the current downward momentum continues, breaking below **$72.01, the price will likely bleed back down toward the $71.20 area, and potentially retest the **$70.388 bottom. ⚠️ Trader's Note: This is a 15-minute chart; the trends here are short-lived. The volatility is high, as evidenced by the long wicks on both the top and bottom of the recent candles. Ensure tight stop-losses are used. (Disclaimer: This is technical analysis for educational purposes and does not constitute financial advice. Cryptocurrency markets are highly volatile.) $HYPEUSDT #ByXIMPACT #USInflationRunsHotAndRateHikeBetsRise #BitcoinHitsTwoMonthLowAfterUSMidterms #AITechSelloffErases2Point5TrillionFromNasdaq100 #DeutscheBankLaunchesDigitalAssetCustody

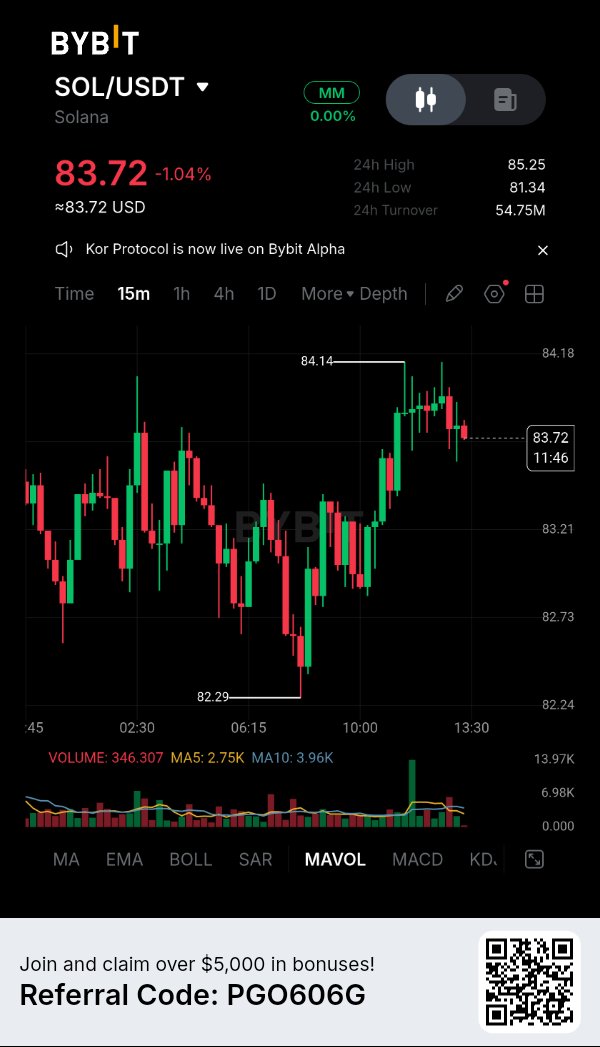
· Current Price: $83.72 (-1.04%). · The Structure: The chart shows a choppy, volatile session. Price initially dumped to a local low of $82.29**. After finding support, it rallied in a series of higher lows, pushing up to a local high of **$84.14. · Current State: The price was rejected at the $84.14 level and is currently pulling back, trading at **$83.72**. It is now testing the previous micro-support zone. 📉 Technical Playbook (The Mechanics) SOL is a high-cap asset, meaning its price action is heavily driven by spot liquidity and algorithmic trading. The 15m chart is currently showing a battle between buyers trying to establish a new uptrend and sellers defending the overhead resistance. The Critical Levels: · Immediate Overhead: $84.14 (The local high and rejection point). · Immediate Floor: $83.21 (The recent consolidation block before the final push). · Major Floor: $82.73 (The structural support that held during the earlier chop). · The "Origin" Level: $82.29 (The 24h low and the absolute bottom of the recovery). 🔍 What a Master Trader is Watching Right Now 1. The Volume Exhaustion Look at the volume bars. The massive push from $82.29 up to $84.14 was accompanied by a significant green volume spike (the tallest green bar). However, as the price pushed higher toward $84.14, the volume completely dried up. The price reached the high, but there were no buyers left to push it further. This lack of volume confirmation is a classic sign of an impending pullback. 2. The Rejection Wick The candle that hit $84.14 left a distinct upper wick. This indicates that sellers stepped in aggressively at that level to reject the price. The market is currently forming a lower high relative to the push that preceded it. 3. The Structural Support Test The price is currently at $83.72, hovering just above the **$83.21** level. How the price reacts here is crucial. If it slices through $83.21 with heavy red volume, the bullish structure is broken, and a retracement to the $82.73 or $82.29 levels becomes highly likely. 🧠 Scenarios to Monitor · The Breakdown (High Probability): Given the volume exhaustion at the top, if the price loses the $83.21** floor, watch for a continuation down to test **$82.73. If that fails, the market will likely look to sweep the liquidity resting at the $82.29 low. · The Re-accumulation (Bullish): If the price holds above $83.21 and forms a tight consolidation (flag) with declining volume, it could be re-accumulating for another push. A high-volume breakout above **$84.14** would invalidate the bearish pullback and open the door for further upside. · The Chop: SOL often consolidates in tight ranges. If the volume remains dead, the price could chop sideways between $83.50 and $84.00 for an extended period. Disclaimer: This is market mechanics analysis, not financial advice. Always manage your risk and be aware of broader market conditions (like Bitcoin's price action), which heavily influence assets like SOL. $SOLUSDT #ByXIMPACT #USInflationRunsHotAndRateHikeBetsRise #BitcoinHitsTwoMonthLowAfterUSMidterms #AITechSelloffErases2Point5TrillionFromNasdaq100 #WSOT2026

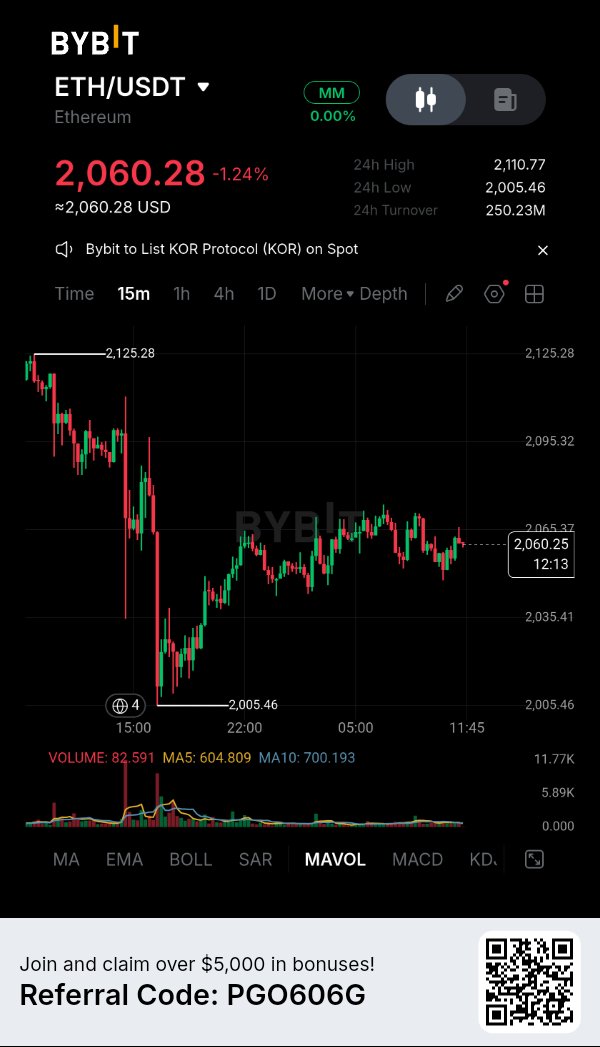
🚨 BRIEFING TAKTIS: Zona Kompresi, Keheningan
Perhatikan grafik 15 menit. Pasar baru saja menerima pukulan telak. Kita melihat penurunan tanpa henti dari level tertinggi 2.125, yang berpuncak pada pembersihan likuiditas (liquidity sweep) yang tajam langsung ke lantai 2.005,46. Itu adalah *shakeout* klasik yang dirancang untuk melikuidasi posisi *long* dengan *leverage* berlebihan dan menakuti trader ritel agar keluar dari posisi mereka. Namun lihat reaksinya. Para pembeli tidak hanya mempertahankan lantai harga tersebut; mereka menyerap kepanikan dan langsung mendorong harga kembali naik. Kita saat ini berada di 2.060,28, hanya turun 1,24% hari ini, dan harga bergerak menyamping (sideways), terjebak dalam kisaran sempit. Ini bukan kelemahan; ini adalah zona kompresi masif. Pasar sedang membangun energi untuk pergerakan berikutnya. ANALISIS TEKNIS (Mengapa ini penting): · Volume Vakum: Lihat batang volume di bagian bawah. Lonjakan merah masif dari penurunan awal sudah hilang. Volume penjualan telah benar-benar mengering. *Bear* tidak punya amunisi untuk mendorong harga lebih rendah saat ini. · Struktur Higher-Low: Meskipun terjadi gejolak hebat, harga menolak untuk turun kembali ke level terendah 2.005. Kita sedang membentuk struktur *higher-low* yang solid, membangun fondasi beton di bawah harga. · The Squeeze: Kita sedang terkompresi dengan ketat di antara *support* 2.035 dan *resistance* 2.065. *Moving average* mulai menyatu. Ekspansi tajam ke satu arah tidak terelakkan. RENCANA EKSEKUSI (BERDASARKAN ATURAN KETAT): Saya tidak memperdagangkan kondisi pasar yang tidak menentu seperti ini. Saya menunggu pasar menunjukkan arahnya, lalu saya menyerang dengan presisi bedah. 🎯 Pemicu (Trigger): Saya memantau candle 15 menit yang kuat untuk ditutup dengan kokoh di atas *resistance* lokal di 2.065,00. Begitu *bull* mengubah level tersebut menjadi *support* dengan lonjakan volume beli, pintu jebakan terbuka. 🛑 Invalidasi (Risiko): Ini tindakan bedah. Jika harga ditolak dengan agresif di sini dan kehilangan *support* struktural terkini di 2.035,00, tesis *bullish* menjadi tidak valid. Saya langsung keluar. Tanpa emosi, hanya *price action*. 💰 Target: · TP1: 2.095,00 (Resistance lokal terdekat) · TP2: 2.110,00 (Uji ulang level tertinggi 24 jam) KESIMPULAN: Pasar sedang melingkar seperti pegas. Jebakan telah disiapkan untuk *bear*. Saya tetap fokus, sabar, dan siap menyerang tepat di saat volume kembali dan *bull* berhasil menembus plafon harga. Apakah Anda melakukan trading di tengah gejolak ini, atau Anda menunggu *breakout* di atas 2.065? $ETHUSDT #ByXIMPACT #WSOT2026 #Pantauan IHK AS November #WSOTPicktoEarn10U #Data Penggajian AS dan Keputusan Suku Bunga Mendorong Pekan Makro

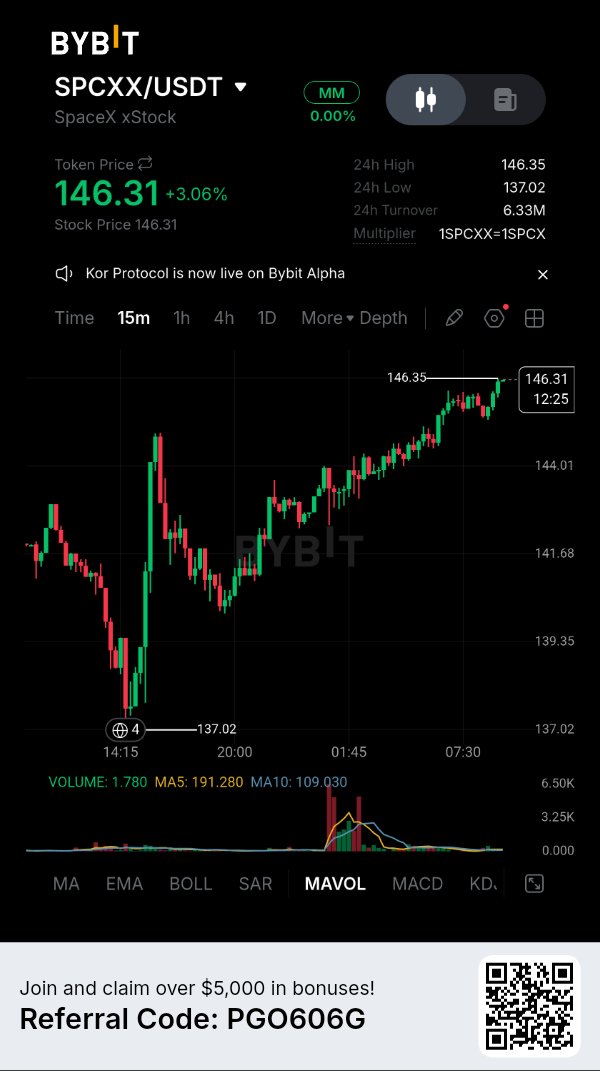
📊 Chart Overview · Asset: SPCXX paired with USDT (SpaceX xStock). · Current Price: $146.31 (Up +3.06%). · Timeframe: 15-minute (15m) chart. (Intraday view). · 24h Data: High: $146.35 | Low: $137.02 | Turnover: 6.33M. · Crucial Detail: The chart shows a "Multiplier" of 1SPCXX = 1SPCX. 📈 Technical Analysis Breakdown 1. Price Action & Recovery · The V-Shape: The chart displays a dramatic, aggressive V-shaped recovery. After a severe sell-off down to $137.02 (marked with a #4 circle), the price found immediate, strong support. · The Uptrend: From the bottom, buyers aggressively stepped in. The price formed a consistent series of higher highs and higher lows. · Current State: The price is currently pushing up against the 24-hour high of **$146.35**, resting just slightly below it at $146.31. It is consolidating in a tight range at the top of this trend. 2. Resistance & Support Levels · Immediate Resistance (Ceiling): $146.35. This is the current 24h high. A strong 15-minute close above this level is needed to confirm a breakout and continuation of the upward momentum. · Immediate Support (Floor): ~$144.01. Looking at the chart structure, this is the previous consolidation zone before the final leg up. If the price breaks down, this is the first area to watch. · Major Support: $137.02. The bottom of the recent crash. This is the critical structural floor for this 24-hour period. 3. Volume Analysis (The Story of the Move) · Look at the volume bars at the bottom. There is a massive, distinct spike in volume that occurs right at the bottom of the dip and the beginning of the recovery (around 01:45). · Interpretation: This massive green volume bar indicates heavy institutional or whale buying. This confirms that the bounce off the $137.02 level was a high-conviction buy. · The Catch: Notice the current volume on the right side. As the price climbs to new local highs, the volume is relatively flat and low. The current open candle shows a volume of 1.780 compared to the MA5 of 191.280. This is a classic bearish divergence on lower timeframes. The price is going up, but the buying volume is drying up, meaning the current uptrend lacks strong momentum to break the high. 🎯 Trading Scenarios · Bullish Scenario (Breakout): If a strong 15m candle closes solidly above $146.35, it signals the buyers have overpowered the resistance. However, for this to be reliable, you would want to see a spike in volume accompanying the breakout. · Bearish Scenario (Rejection/Pullback): The price is struggling at the 24h high with declining volume. There is a high probability of a rejection here. If the price gets pushed down, it will likely retest the $144.01 support area. If that fails, a slow bleed back down is possible. ⚠️ Important Notes for this Specific Asset · Tokenized Stock Dynamics: Because this is a tokenized version of a private asset (SpaceX), its price action may not perfectly track the traditional stock market (which is closed outside normal hours). It trades 24/7 on Bybit. · Liquidity Risk: While the turnover is decent (6.33M), the order book depth for tokenized private equity is often much thinner than standard crypto pairs. Watch out for sudden "wicks" (sharp, violent price movements) in either direction. · Notice: The banner notes "Kor Protocol is now live on Bybit Alpha." This is a general exchange announcement and not specific to this chart, but it's good to be aware of. (Disclaimer: This is a technical analysis of the provided image and does not constitute financial advice. Trading tokenized stocks carries unique risks.) $SPCXXUSDT #ByXIMPACT #WSOT2026 #NovUSCPIWatch #WSOTPicktoEarn10U #USPayrollsAndRateDecisionsDriveMacroWeek

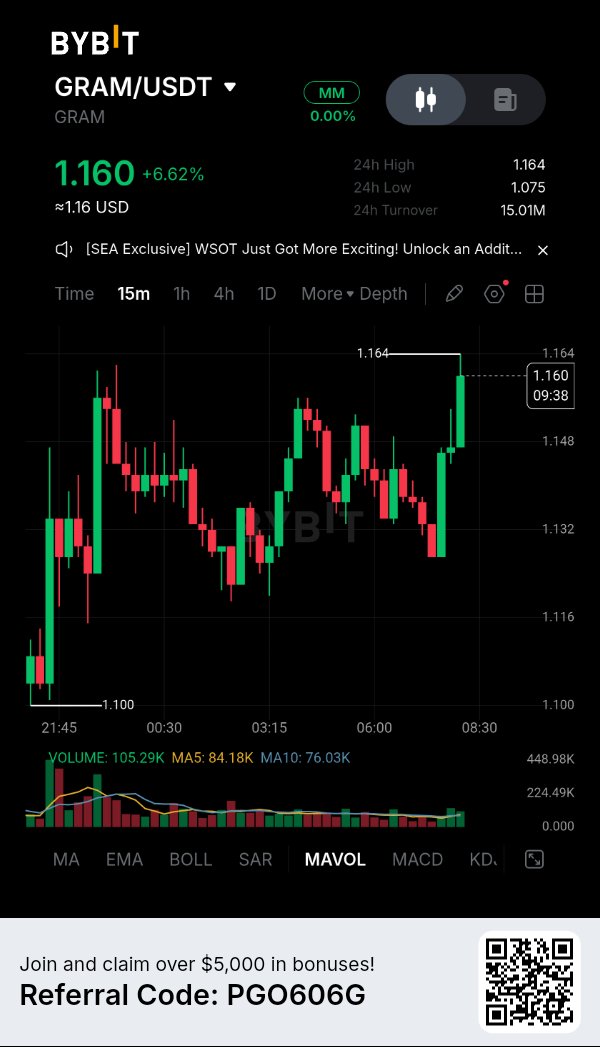
Here is a fresh, master-level breakdown of the GRAM/USDT chart on the 15-minute timeframe. This chart illustrates a highly volatile, choppy market that is slowly grinding upward. It is a great example of why patience is the most important tool in a trader's arsenal. Let's break down the mechanics. 1. The "Whipsaw" Environment Look at the chart from left to right. The price starts at the 24h Low of 1.100, rockets up to ~1.160, crashes down to ~1.125, rallies back to ~1.155, drops to ~1.130, and finally pushes to a new 24h High of 1.164. · The Master's View: Notice the long wicks on almost every candle. This is a classic "whipsaw" market. It is designed to trap retail traders. If you buy the green candles, you get stopped out by the red ones. If you short the red candles, you get squeezed by the green ones. The 24h Turnover is 15.01M—there is plenty of liquidity here, which means these erratic moves are likely driven by algorithmic trading and market makers shaking out weak hands. 2. The "Higher Low" Trend Despite the chaotic, violent swings, look at the macro structure. · First bottom: 1.100 · Second major bottom: ~1.125 · Third major bottom: ~1.130 · The Lesson: Even though the price is chopping wildly, it is printing higher lows. The underlying trend is actually mildly bullish. Buyers are slowly stepping in at higher prices, building a floor. 3. The Current Setup: The Breakout Attempt Right now, the price is sitting at 1.160, pressing right up against the 24h High of 1.164. · Look at the volume bar beneath the most recent massive green candle. It's a very healthy green spike. This tells us that real money is driving this final push. · However, notice that the price has stalled right at the resistance line. It is struggling to break through. --- The Master Trader's Game Plan for GRAM: This is a frustrating chart to trade on a 15-minute timeframe because the chop is so violent. The trend is bullish, but you are currently staring at a major resistance level. Here is how a professional handles it: · Do Not FOMO: Buying right now at 1.160 is a gamble. You are buying right into a wall of sellers at the 24h high. If it rejects here, you will be trapped. · The "Breakout Confirmation" Play: The master move is to wait. Set a buy stop order just above 1.164. If a 15-minute candle closes solidly above that level with strong volume, the resistance is broken, and you can enter a long position. · The "Buy the Dip" Play (The Safe Route): Look at the recent structure. There is a clear support zone around 1.130 - 1.148 (the area of the last pullback). If the price rejects the 1.164 high and pulls back, wait for it to hit that 1.130 zone. If it prints a strong green bounce candle there, that is a much safer entry with a defined stop-loss. · The Danger Zone: If the price violently breaks below 1.125 (the middle swing low), the higher-low structure is broken. The trend has shifted bearish, and the price will likely revisit the 1.100 floor. Summary: GRAM is in a choppy, volatile uptrend, but it is currently fighting a major resistance level at 1.164. The recent volume is promising, but do not chase the price at the top of the range. Wait for a confirmed breakout above 1.164, or a healthy pullback to the 1.130 support zone before making a move. $GRAMUSDT #ByXIMPACT #NovUSCPIWatch #WSOTPicktoEarn10U #USPayrollsAndRateDecisionsDriveMacroWeek #BybitAIEvolving