Rufiweb3
2565Suka0Pembagian54Penggemar7Ikuti
Apple xStock ($AAPLXUSDT) trades at $357.39 (+0.26%) on the 4H chart, consolidating near its multi-session highs after printing a 24-hour high of $360.80 and a low of $355.71 with 64.27K in turnover. Fundamental momentum aligns with Apple Inc.'s ongoing tech sector dominance, strong underlying earnings, and the accelerated adoption of tokenized real-world assets (RWAs) that mirror traditional equity performance on-chain through compliant wrapper mechanisms. CONTEXT The tokenized equity is pressing near all-time highs following a solid recovery phase, successfully defending structural demand zones above the $330-$340 range and consolidating right beneath immediate multi-week resistance clusters. NEWS Recent corporate updates for Apple highlight accelerating momentum in AI-driven features, expanded services revenue, and robust hardware demand heading into the late-year consumer shopping cycle. Ecosystem developments similarly emphasize growing institutional liquidity for compliant tokenized stock wrapper products. FUNDAMENTAL AAPLX functions as a blockchain-native tracker asset mirroring the exact economic value and price performance of Apple Inc. shares on a 1:1 basis, offering crypto-native market participants 24/7 exposure backed by audited reserves and institutional custody. ECOSYSTEM The expanding tokenized equities (xStocks) sector bridges traditional financial equities with decentralized finance protocols, enabling seamless cross-chain utility, collateralization in digital lending markets, and round-the-clock price tracking. KEY TECHNICAL CONFLUENCE Volume: 24h turnover stands at 64.27K, reflecting steady institutional order flow and balanced dip-buying near local support bases. Indicators: AAPLX trades at $357.39, testing immediate moving average resistance clusters below the 24-hour high of $360.80. 4H RSI hovers around neutral-bullish territory near 58. Fundamentals: Direct correlation to Apple's robust underlying revenue streams and broader mega-cap tech equity sentiment provides stable macro backing. WHAT I LIKE Clean structural defense holding above the multi-week swing support base near $340.00–$350.00. Seamless on-chain exposure to premier mega-cap tech equities without leaving digital asset trading venues. Healthy range compression following impulsive upside expansion phases. WHAT I DON'T LIKE Immediate overhead supply near $360.80 and the $365.00 psychological ceiling capping rapid upside continuation. Subdued alt-market liquidity for tokenized equities during broader crypto sector consolidations. Inherent tracking correlation risks tied to traditional equity market volatility and macro headline news. MAJOR LEVELS Resistance: $360.80 (24h High) to $365.00 $375.00 to $390.00 (Extension Targets) Support: $355.71 (24h Low) to $351.32 $341.84 (Key Structural Base) Invalidation: Daily close below $320.00 TRADE PLAY Setup: Look for a confirmed 4H volume breakout above $361.00 or a disciplined retest hold of the $350.00–$352.00 demand zone. Trigger: 4H bullish engulfing candle closing above $358.00 with expanding spot turnover. Entry: $356.00 Stop Loss: $335.50 ($20.50 risk) TP1: $382.00 (1.26R) TP2: $410.00 (2.62R) TP3: $445.00 (4.32R) Risk Disclaimer Cryptocurrency and tokenized equity trading involves substantial risk of loss and is not suitable for every investor. Valuation volatility is high, and past performance is not indicative of future results. Always manage your position size and employ strict risk management protocols. #ByXIMPACT


NVIDIA xStock ($NVDAXUSDT) diperdagangkan pada $167,32 (-1,00%) pada grafik 6J, mengalami jeda korektif ringan setelah mencetak harga tertinggi 24 jam di $169,10 dan harga terendah sesi di $154,26 dengan volume perdagangan 4,35 Juta. Momentum fundamental sejalan dengan posisi pasar NVIDIA yang dominan dalam perangkat keras AI perusahaan, permintaan arsitektur Blackwell generasi berikutnya, dan adopsi aset dunia nyata (RWA) ter-tokenisasi yang berkembang, yang menghubungkan ekuitas teknologi tradisional secara langsung ke jalur likuiditas aset digital. KONTEKS Ekuitas ter-tokenisasi ini berkonsolidasi di dekat level pemulihan lokal setelah penurunan korektif multi-minggu yang tajam dari harga distribusi tertinggi sebelumnya di atas $220, menguji basis permintaan struktural segera di dekat wilayah $154,00. BERITA Pembaruan perusahaan baru-baru ini untuk NVIDIA menyoroti percepatan penyebaran infrastruktur AI perusahaan dan permintaan global yang kuat untuk klaster komputasi GPU canggih. Selain itu, perkembangan ekosistem menekankan meningkatnya partisipasi institusional dalam wrapper ekuitas ter-tokenisasi yang patuh di seluruh jaringan DeFi multi-rantai. FUNDAMENTAL NVDAX berfungsi sebagai aset pelacak berbasis blockchain yang mencerminkan nilai ekonomi dan kinerja harga saham NVIDIA Corporation yang sebenarnya, menawarkan peserta pasar kripto-asli eksposur 24/7 yang didukung oleh cadangan kontrak pintar yang aman dan likuiditas institusional. EKOSISTEM Sektor ekuitas ter-tokenisasi yang berkembang menjembatani pasar keuangan tradisional dengan protokol keuangan terdesentralisasi, memungkinkan utilitas lintas rantai yang mulus, dukungan agunan di pasar pinjaman digital, dan pelacakan harga sepanjang waktu. KONFLUENS TEKNIS UTAMA Volume: Volume 24 jam mencapai 4,35 Juta, mencerminkan arus pesanan yang stabil dan penyerapan likuiditas saat harga mencoba stabil di dekat zona support lokal. Indikator: NVDAX diperdagangkan pada $167,32, menguji klaster resistance moving average segera di bawah harga tertinggi 24 jam $169,10. RSI 6J pulih sedikit menuju netral 44 dari kondisi oversold baru-baru ini. Fundamental: Korelasi langsung terhadap pertumbuhan pendapatan kecerdasan buatan NVIDIA yang mendasari dan sentimen ekuitas mega-cap yang kuat memberikan dukungan makro yang stabil. APA YANG SAYA SUKA Pertahanan struktural yang bersih tertahan di atas lantai support swing multi-minggu di dekat $154,00. Eksposur on-chain yang mulus ke ekuitas kecerdasan buatan utama tanpa harus meninggalkan tempat perdagangan aset digital. Parameter risiko-terhadap-imbalan yang menarik untuk akumulator range-bound setelah koreksi struktural yang dalam. APA YANG TIDAK SAYA SUKA Penawaran overhead segera di dekat $170,86 dan blok resistance $187,47 yang membatasi kelanjutan kenaikan yang cepat. Likuiditas pasar alt yang lemah untuk ekuitas ter-tokenisasi selama konsolidasi sektor kripto yang lebih luas. Risiko korelasi pelacakan bawaan yang terkait dengan volatilitas pasar ekuitas tradisional dan rotasi makro sektor teknologi. LEVEL UTAMA Resistance: $169,10 (Tertinggi 24j) hingga $170,86 $187,47 hingga $204,08 (Target Ekstensi) Support: $154,26 (Terendah 24j) $145,00 (Basis Struktural Utama) Invalidasi: Penutupan harian di bawah $135,00 RENCANA PERDAGANGAN Pengaturan: Cari breakout volume 6J yang terkonfirmasi di atas $171,00 atau pengujian ulang zona permintaan $152,00–$155,00. Pemicu: Candlestick bullish engulfing 6J ditutup di atas $168,00 dengan volume spot yang berkembang. Entri: $165,00 Stop Loss: $138,50 (risiko $26,50) TP1: $195,00 (1,13R) TP2: $225,00 (2,26R) TP3: $260,00 (3,58R) Pernyataan Penyangkalan Risiko Perdagangan mata uang kripto dan ekuitas ter-tokenisasi melibatkan risiko kerugian yang substansial dan tidak cocok untuk setiap investor. Volatilitas valuasi sangat tinggi, dan kinerja masa lalu bukan merupakan indikasi hasil di masa depan. Selalu kelola ukuran posisi Anda dan gunakan protokol manajemen risiko yang ketat. #ByXIMPACT


Tether Gold ($XAUTUSDT) trades at $3,877.42 (-2.71%) on the 4H chart, experiencing a sharp corrective pullback below the $3,900 handle after printing a 24-hour high of $3,995.88 and dropping to a session low of $3,851.40 with 9.47M in turnover. Fundamental sentiment follows broader macro commodity adjustments as spot gold bullion consolidates beneath recent highs, while Tether's allocated physical gold backing across secure Swiss vaults continues to ensure a dependable 1:1 tokenized RWA valuation framework. CONTEXT The asset is pulling back sharply from local multi-week distribution highs, testing key structural demand floors near the $3,850.00 region after failing to sustain momentum above the $4,130.11 previous swing peak. NEWS Recent precious metals and tokenized RWA updates reflect profit-taking across commodity-backed instruments as broader macro markets re-evaluate safe-haven positioning and central bank reserve accumulation dynamics amid shifting interest rate expectations. FUNDAMENTAL Tether Gold represents full fractional ownership of physical gold bullion stored in secure Swiss vaults, offering market participants direct exposure to spot gold prices with the added mobility and composability of blockchain-native tokens. ECOSYSTEM The tokenized commodity sector bridges traditional precious metals with decentralized finance infrastructure, enabling seamless cross-chain liquidity transfers, collateral backing in lending markets, and transparent on-chain audits. KEY TECHNICAL CONFLUENCE Volume: 24h turnover stands at 9.47M, reflecting heightened selling pressure and liquidity absorption as price tests multi-day support zones. Indicators: XAUT trades at $3877.42, breaking below short-term moving average clusters and pressing toward the lower boundary of its 4H channel. 4H RSI drops into oversold territory near 32. Fundamentals: Direct tracking of physical gold bullion spot prices provides a strong macro safety net despite near-term technical liquidations. WHAT I LIKE Clean proximity to major multi-week structural demand floors near $3,850.00. Direct inflation-hedge utility and physical gold backing without traditional custodial friction. Attractive risk-to-reward parameters for defensive dip-buyers seeking commodity exposure. WHAT I DON'T LIKE Heavy overhead supply near $3,995.88 and the $4,130.11 pivot blocking immediate trend reversal. Elevated short-term downside momentum forcing tests of critical support boundaries. Non-yielding nature during periods of elevated cash-equivalent alternative yields. MAJOR LEVELS Resistance: $3,995.88 (24h High) to $4,085.27 $4,130.11 (Local Peak) to $4,179.80 Support: $3,851.40 (24h Low) to $3,801.70 $3,750.00 (Key Structural Base) Invalidation: Daily close below $3,700.00 TRADE PLAY Setup: Look for a confirmed 4H volume stabilization and bullish reversal candlestick above the $3,850.00 demand base or a high-rejection reclaim of $3,950.00. Trigger: 4H bullish engulfing candle closing above $3,900.00 with expanding spot turnover. Entry: $3,865.00 Stop Loss: $3,685.00 ($180.00 risk) TP1: $4,100.00 (1.31R) TP2: $4,350.00 (2.69R) TP3: $4,650.00 (4.35R) Risk Disclaimer Cryptocurrency and tokenized commodity trading involves substantial risk of loss and is not suitable for every investor. Valuation volatility is high, and past performance is not indicative of future results. Always manage your position size and employ strict risk management protocols. #ByXIMPACT


Alphabet Inc. xStock ($GOOGLXUSDT) diperdagangkan di harga $295,65 (+1,17%) pada grafik 4 Jam, melakukan pemantulan teknis di atas level $290 setelah mencetak level terendah 24 jam di $290,41 dan level tertinggi sesi di $297,73 dengan volume perdagangan sebesar 1,19 juta. Momentum fundamental selaras dengan kepemimpinan Alphabet yang berkelanjutan dalam infrastruktur kecerdasan buatan (AI) perusahaan, adopsi Google Cloud yang dipercepat, dan penyebaran multi-rantai aset dunia nyata (RWA) yang ditokenisasi yang mencerminkan kinerja ekuitas tradisional secara on-chain. KONTEKS Ekuitas yang ditokenisasi ini sedang berkonsolidasi di dekat resistensi kisaran menengah lokal setelah fase pemulihan yang stabil, mengikuti pergerakan harga dasar saham Alphabet Inc. Kelas A (GOOGL) di pasar ekuitas global tradisional. BERITA Perkembangan perusahaan baru-baru ini untuk Alphabet menyoroti investasi modal yang besar dan berkelanjutan ke dalam infrastruktur pusat data AI dan integrasi perusahaan yang diperluas dari model AI generatif Gemini di seluruh Google Cloud dan Workspace. Selain itu, pembaruan ekosistem menekankan meningkatnya likuiditas institusional untuk produk pembungkus saham yang ditokenisasi yang patuh terhadap regulasi. FUNDAMENTAL GOOGLX berfungsi sebagai aset pelacak asli blockchain yang mencerminkan nilai ekonomi dan kinerja harga yang tepat dari saham Alphabet Inc., menawarkan investor kripto paparan 24/7 yang didukung oleh cadangan yang diaudit dan infrastruktur kontrak pintar yang transparan. EKOSISTEM Sektor ekuitas yang ditokenisasi (xStock) yang berkembang menjembatani ekuitas keuangan tradisional dengan protokol keuangan terdesentralisasi (DeFi), memungkinkan utilitas lintas rantai yang mulus, kolateralisasi di pasar pinjaman, dan penyediaan likuiditas di seluruh ekosistem multi-rantai. KONFLUENS TEKNIS UTAMA Volume: Perputaran 24 jam berada di angka 1,19 juta, mencerminkan arus pesanan institusional yang stabil dan pembelian saat harga turun (dip-buying) yang seimbang di dekat basis dukungan lokal. Indikator: GOOGLX diperdagangkan pada $295,65, menguji klaster resistensi rata-rata pergerakan (moving average) langsung di bawah level tertinggi 24 jam di $297,73. RSI 4 Jam berada di kisaran netral 52. Fundamental: Korelasi langsung dengan pendapatan iklan dasar Alphabet yang kuat, ekspansi cloud, dan sentimen teknologi mega-kap yang lebih luas memberikan dukungan makro yang stabil. APA YANG SAYA SUKAI Pertahanan struktural yang bersih bertahan di atas basis dukungan ayunan multi-minggu di dekat $285,00–$290,00. Paparan on-chain yang mulus ke ekuitas teknologi mega-kap utama tanpa meninggalkan tempat likuiditas aset digital. Kompresi kisaran yang sehat setelah fase pemulihan sisi atas yang impulsif. APA YANG TIDAK SAYA SUKAI Pasokan overhead langsung di dekat $297,73 dan ambang psikologis $300,00 yang membatasi kelanjutan sisi atas yang cepat. Likuiditas pasar alt yang rendah untuk ekuitas yang ditokenisasi selama konsolidasi sektor kripto yang lebih luas. Risiko korelasi pelacakan yang melekat terkait dengan volatilitas pasar ekuitas tradisional dan berita utama makro. LEVEL UTAMA Resistensi: $297,73 (Tertinggi 24 jam) hingga $300,00 (Langit-langit Psikologis) $315,00 hingga $330,00 (Target Ekstensi) Dukungan: $290,41 (Terendah 24 jam) hingga $286,00 $275,00 (Basis Struktural Kunci) Invalidasi: Penutupan harian di bawah $265,00 RENCANA PERDAGANGAN Pengaturan: Cari konfirmasi penembusan volume 4 Jam di atas $298,00 atau pengujian ulang yang disiplin pada zona permintaan $288,00–$290,00. Pemicu: Lilin bullish engulfing 4 Jam ditutup di atas $295,00 dengan perputaran spot yang meluas. Entri: $293,00 Stop Loss: $268,50 (risiko $24,50) TP1: $320,00 (1,10R) TP2: $345,00 (2,12R) TP3: $375,00 (3,34R) Peringatan Risiko Perdagangan mata uang kripto dan ekuitas yang ditokenisasi melibatkan risiko kerugian yang substansial dan tidak cocok untuk setiap investor. Volatilitas penilaian sangat tinggi, dan kinerja masa lalu tidak menunjukkan hasil di masa depan. Selalu kelola ukuran posisi Anda dan terapkan protokol manajemen risiko yang ketat. #ByXIMPACT


$AMZNXUSDT xStock (AMZNX/USDT) trades at $266.93 (-1.74%) on the 4H chart, consolidating below its multi-session highs after printing a 24-hour high of $274.72 and a low of $265.51 with 93.11K in turnover. Fundamental momentum aligns with broader U.S. equities and mega-cap tech performance, alongside growing institutional adoption of tokenized real-world assets (RWAs) that track traditional equity prices on-chain through compliant wrapper mechanisms. CONTEXT The tokenized equity is undergoing a mild short-term retracement following a strong multi-week rally, testing local demand zones while tracking the underlying price action of Amazon.com, Inc. (AMZN) shares across traditional financial markets. NEWS Recent corporate updates for Amazon highlight expanding AWS cloud infrastructure demand driven by enterprise artificial intelligence workloads, alongside strong e-commerce logistics performance heading into the late-year consumer shopping cycle. FUNDAMENTAL AMZNX functions as a blockchain-native tracker certificate mirroring the economic value and price performance of Amazon.com shares, offering crypto-native market participants seamless exposure to traditional equity returns backed by institutional liquidity pools. ECOSYSTEM The expanding tokenized stock (xStock) sector bridges traditional equities with decentralized finance (DeFi) infrastructure, enabling 24/7 cross-chain asset tracking and capital efficiency across multi-chain liquidity venues. KEY TECHNICAL CONFLUENCE Volume: 24h turnover stands at 93.11K, reflecting balanced order flow and routine profit-taking near local resistance levels. Indicators: AMZNX trades at $266.93, testing immediate moving average support near the middle of its recent 4H trading channel. 4H RSI hovers around neutral 48. Fundamentals: Direct correlation to Amazon's underlying corporate earnings strength and robust mega-cap equity market sentiment provide steady macro backing. WHAT I LIKE Clean structural defense holding above the multi-week swing support base near $260.00. Seamless on-chain exposure to blue-chip equity performance without leaving the digital asset ecosystem. Healthy range compression following impulsive upside expansion phases. WHAT I DON'T LIKE Immediate overhead supply near $274.72 capping rapid short-term upside continuation. Subdued alt-market liquidity for tokenized equities during broader crypto sector rotations. Inherent tracking correlation risks tied to traditional equity market volatility and gap openings. MAJOR LEVELS Resistance: $274.72 (24h High) to $275.39 (Local Peak) $285.00 to $300.00 (Extension Targets) Support: $265.51 (24h Low) to $262.79 $250.00 (Key Structural Base) Invalidation: Daily close below $240.00 TRADE PLAY Setup: Look for a confirmed 4H volume breakout above $275.00 or a high-rejection test hold near the $260.00–$262.00 demand zone. Trigger: 4H bullish engulfing candle closing above $270.00 with expanding spot turnover. Entry: $267.00 Stop Loss: $247.50 ($19.50 risk) TP1: $290.00 (1.18R) TP2: $315.00 (2.46R) TP3: $345.00 (4.00R) Risk Disclaimer Cryptocurrency and tokenized equity trading involves substantial risk of loss and is not suitable for every investor. Valuation volatility is high, and past performance is not indicative of future results. Always manage your position size and employ strict risk management protocols. #WSOT2026


$AAPLXUSDT Inc. (AAPL/USDT) trades at $355.63 (+2.04%) on the daily chart, extending a strong recovery rally above the $350 handle after closing a previous session near $348.51 and recording a 24-hour high of $355.90 with 24.82M in volume and a market capitalization topping $5.06 trillion. Fundamental momentum continues to anchor on Apple reclaiming its position as tech's premier mega-cap heavyweight above the $5 trillion threshold, fueled by robust fiscal Q4 earnings showcasing $114 billion in revenue and accelerating AI strategies pushing Siri toward advanced agent-like functionality. CONTEXT The asset is pressing near its all-time highs following a solid post-earnings recovery and broader mega-cap tech strength, successfully defending structural demand zones above the $330-$340 range and breaking out past previous multi-week consolidation resistance clusters. NEWS Recent corporate developments highlight Apple's accelerated push into agent-like AI features under executive leadership changes, revamping Siri's architecture for deeper contextual on-screen awareness. Additionally, solid September-quarter performance figures showing an 18% jump in iPhone revenue continue to reinforce investor confidence despite near-term memory and hardware supply headwinds. FUNDAMENTAL Apple's core fundamental value proposition remains anchored in its unmatched ecosystem stickiness, record-breaking Services revenue streams touching over $31 billion, and robust free cash flow generation supporting consistent capital return programs. ECOSYSTEM The expanding hardware and software ecosystem centers around upcoming operating system architecture shifts, tighter hardware-software vertical integration, and deeply embedded consumer electronics adoption across global consumer markets. KEY TECHNICAL CONFLUENCE Volume: 24h turnover stands at 12.21B with a daily volume of 24.82M, reflecting healthy institutional participation and liquidity absorption near local highs. Indicators: AAPL trades at $355.63, breaking out above short-term moving average resistance and testing the upper boundary of its 52-week range. Daily RSI holds in bullish momentum territory near 65. Fundamentals: Exceptional fourth-quarter revenue beats and strong institutional ETF weightings provide a solid foundational floor during macro market rotations. WHAT I LIKE Clean structural breakout and momentum continuation pushing past key psychological resistance at $350. Solid corporate earnings reports proving resilient hardware demand alongside expanding high-margin Services revenue. Massive institutional sponsorship and market cap dominance anchoring safe-haven mega-cap capital flows. WHAT I DON'T LIKE Elevated valuation multiples with a trailing P/E ratio approaching 39.65 leaving less room for minor earnings disappointments. Proximity to 52-week absolute highs increasing susceptibility to short-term profit-taking. Ongoing supply chain pressures and component cost fluctuations impacting near-term gross margin guidance. MAJOR LEVELS Resistance: $355.90 (24h High) to $357.70 (Local Peak) $365.00 to $375.00 (Extension Targets) Support: $349.32 (24h Low) $340.00 (Key Support Base) Invalidation: Daily close below $330.00 TRADE PLAY Setup: Look for a confirmed high-volume daily breakout above $358.00 or a disciplined retest hold of the $348.00 to $350.00 demand zone. Trigger: Daily bullish continuation candle closing above $356.00 with expanding spot turnover. Entry: $354.00 Stop Loss: $331.50 ($22.50 risk) TP1: $378.00 (1.06R) TP2: $400.00 (2.04R) TP3: $425.00 (3.15R) Risk Disclaimer Cryptocurrency and equity CFD trading involves substantial risk of loss and is not suitable for every investor. Valuation volatility is high, and past performance is not indicative of future results. Always manage your position size and employ strict risk management protocols. #WSOT2026


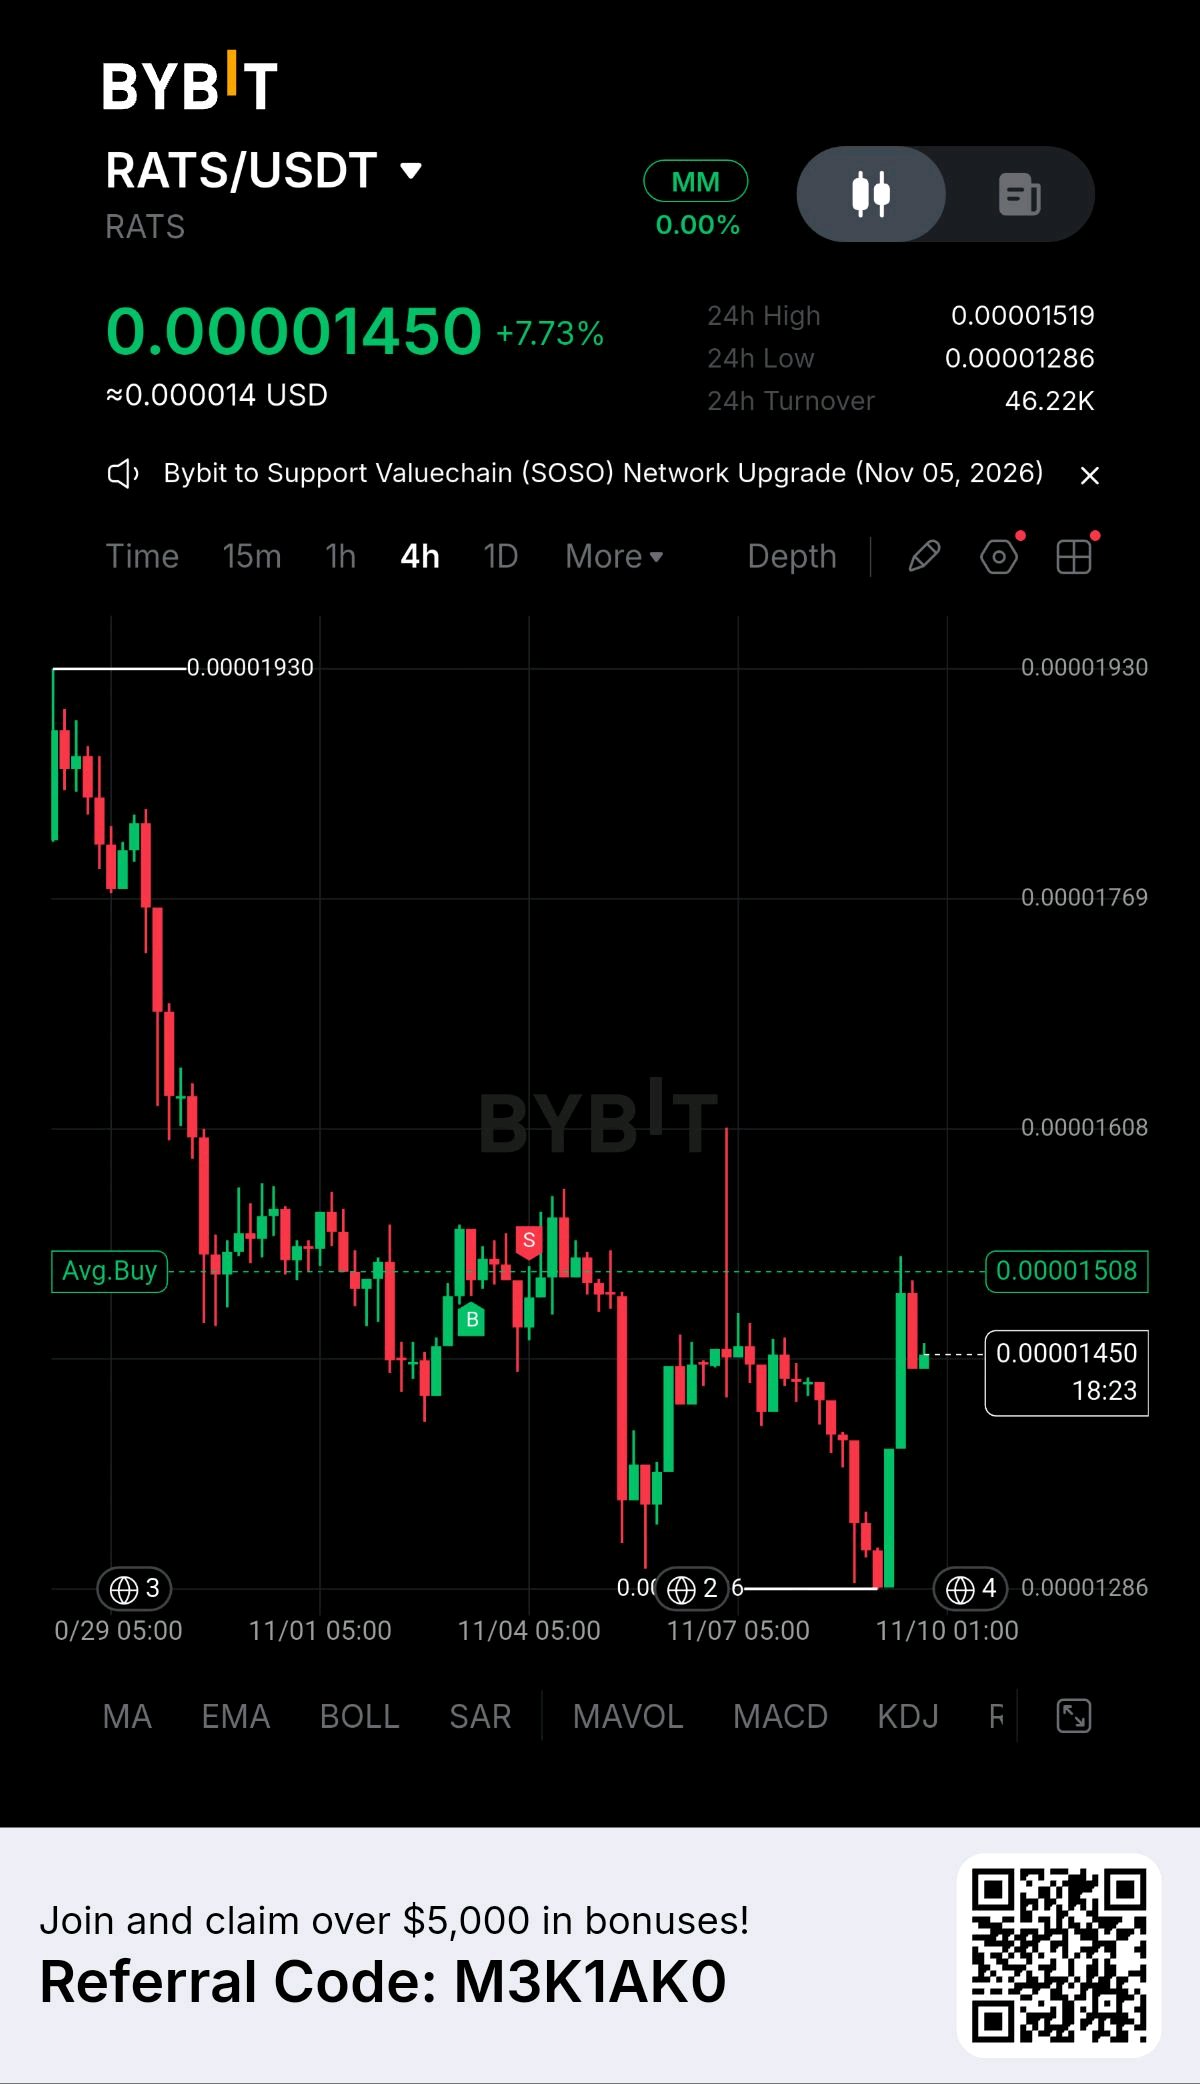
$Mina Bounces +5.71% Above 0.050 Support
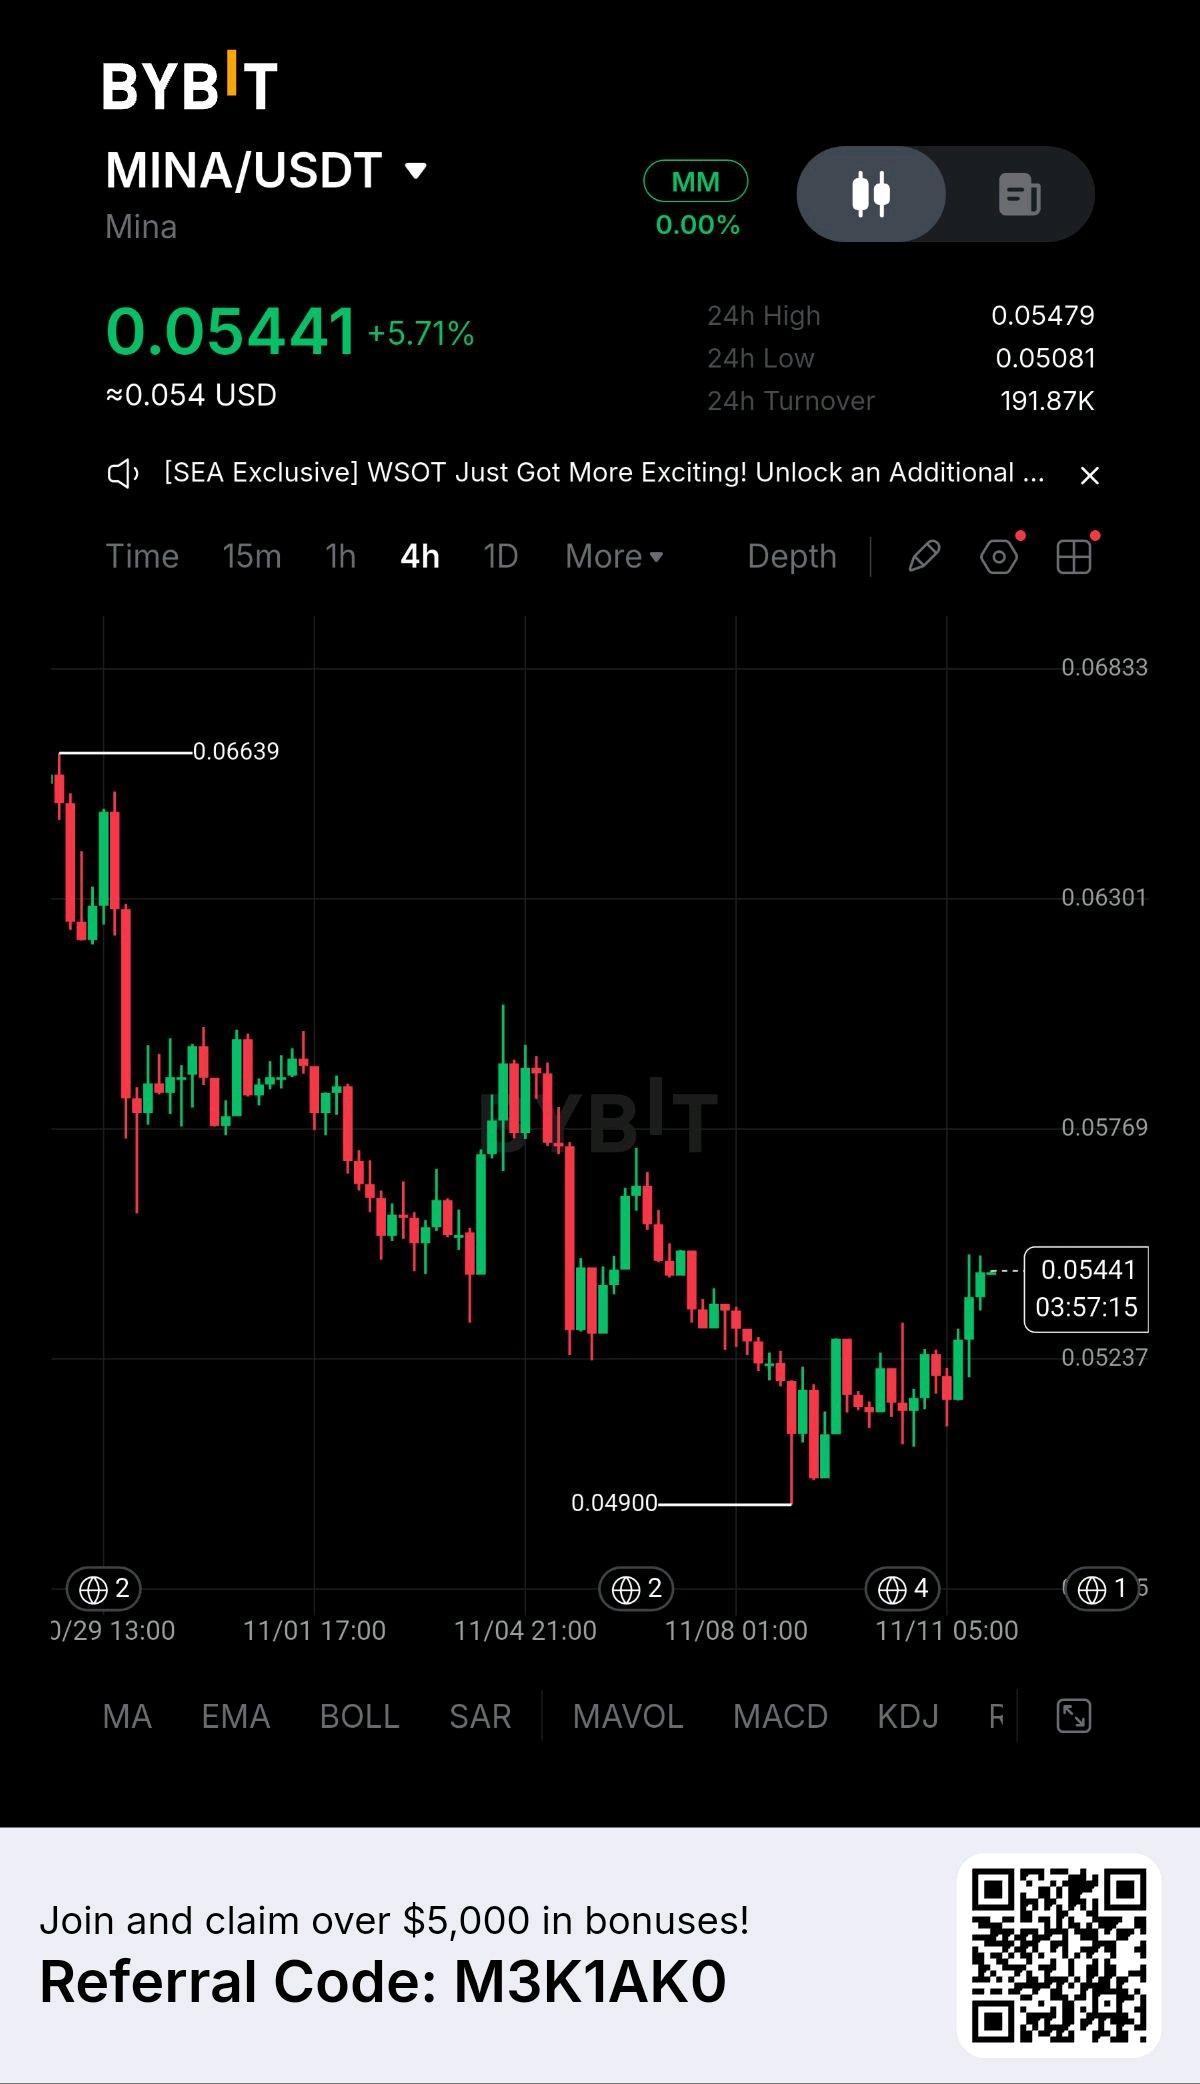
Mina Protocol (MINA/USDT) trades at $0.05441 (+5.71%) on the 4H chart, mounting a strong recovery rally above the $0.054 handle after defending a multi-week swing low near $0.04900 and recording a 24-hour low of $0.05081 with 191.87K in turnover. Fundamental momentum continues to anchor on the successful rollout of the Mesa mainnet upgrade, which halved block times to 90 seconds and expanded zkApp capacity. Additionally, ongoing developer tooling enhancements via o1js and native prover integration continue to drive lightweight zero-knowledge application deployment across the network. Key Technical Confluence • Volume: 24h turnover stands at 191.87K, reflecting steady dip-buying and liquidity absorption near the $0.04900 structural demand base. • Indicators: MINA trades at $0.05441, reclaiming the immediate moving average cluster and pressing toward the 24-hour high of $0.05479. 4H RSI recovers from oversold conditions toward neutral 55. • Fundamentals: Ongoing adoption of recursive zk-SNARK technology and lightweight node architecture provide unique long-term scaling narratives despite broader altcoin liquidity constraints. What I Like • Clean structural defense and bullish rejection off the major $0.04900 demand floor. • Solid +5.71% single-session impulse confirming active buyer participation at lower range extremes. • Unique zero-knowledge positioning enabling trust-minimized verification on resource-constrained devices. What I Don't Like • Heavy overhead resistance near the $0.05769 and $0.06301 supply blocks capping rapid upside continuation. • Subdued turnover volume requiring broader market participation to challenge higher range ceilings. • Persistent inflationary token issuance creating constant supply overhead during risk-off market phases. Major Levels • Resistance: $0.05479 (24h High) / $0.05769 / $0.06301 / $0.06833 • Support: $0.05081 (24h Low) / $0.04900 (Key Support Base) • Invalidation: Daily close below $0.04600 Trade Play • Setup: Look for a confirmed 4H volume breakout above $0.05500 or a high-rejection test hold near the $0.05100 demand zone. • Trigger: 4H bullish engulfing candle closing above $0.05400 with expanding spot turnover. • Entry: $0.05350 • Stop Loss: $0.04580 ($0.0077 risk) • TP1: $0.06100 (1.00R) • TP2: $0.06900 (2.04R) • TP3: $0.07800 (3.21R) $MINAUSDT $GRAMUSDT #WSOT2026 #USInflationRunsHotAndRateHikeBetsRise
Google Market Insight Nov 11, 2026 Google Cloud doubled its revenue. Investors still want to know when that growth turns into cash. I am using Alphabet’s GOOGL shares for this analysis. The latest verified completed session closed at $287.38, down 0.27 percent, with 28.29 million shares traded on November 10. These are completed session figures, not a live intraday quote. On the support side, I am watching $285.68, the previous session’s low. Holding that area would support stabilization, although one session alone does not establish a durable floor. On the resistance side, $292.02 is the first reference, followed by Monday’s high of $296.33. Reclaiming those levels would strengthen the recovery case. Recent earnings coverage reports Google Cloud revenue of $30.7 billion, up 103 percent, and Cloud operating income of $11.1 billion. That is substantial growth, but Search revenue growth slowed to 12 percent from 17 percent in the preceding quarter. The bigger tension is spending. Quarterly capital expenditure reached $51.4 billion against operating cash flow of $42.3 billion, leaving a $9.1 billion free cash outflow. New TPU systems support Google’s AI ambitions, but product launches alone do not prove attractive investment returns. My outlook is constructive on Cloud demand but cautious on cash conversion. Investors need evidence that growth can eventually outpace the infrastructure bill. Lesson of the day: A company can grow rapidly and still generate less cash for shareholders. Revenue measures demand. Free cash flow shows what remains after funding that growth. The strongest investment story needs both, not just the more impressive headline. $GOOGLXUSDT $METAXUSDT #WSOT2026 #USInflationRunsHotAndRateHikeBetsRise #BybitAIEvolving


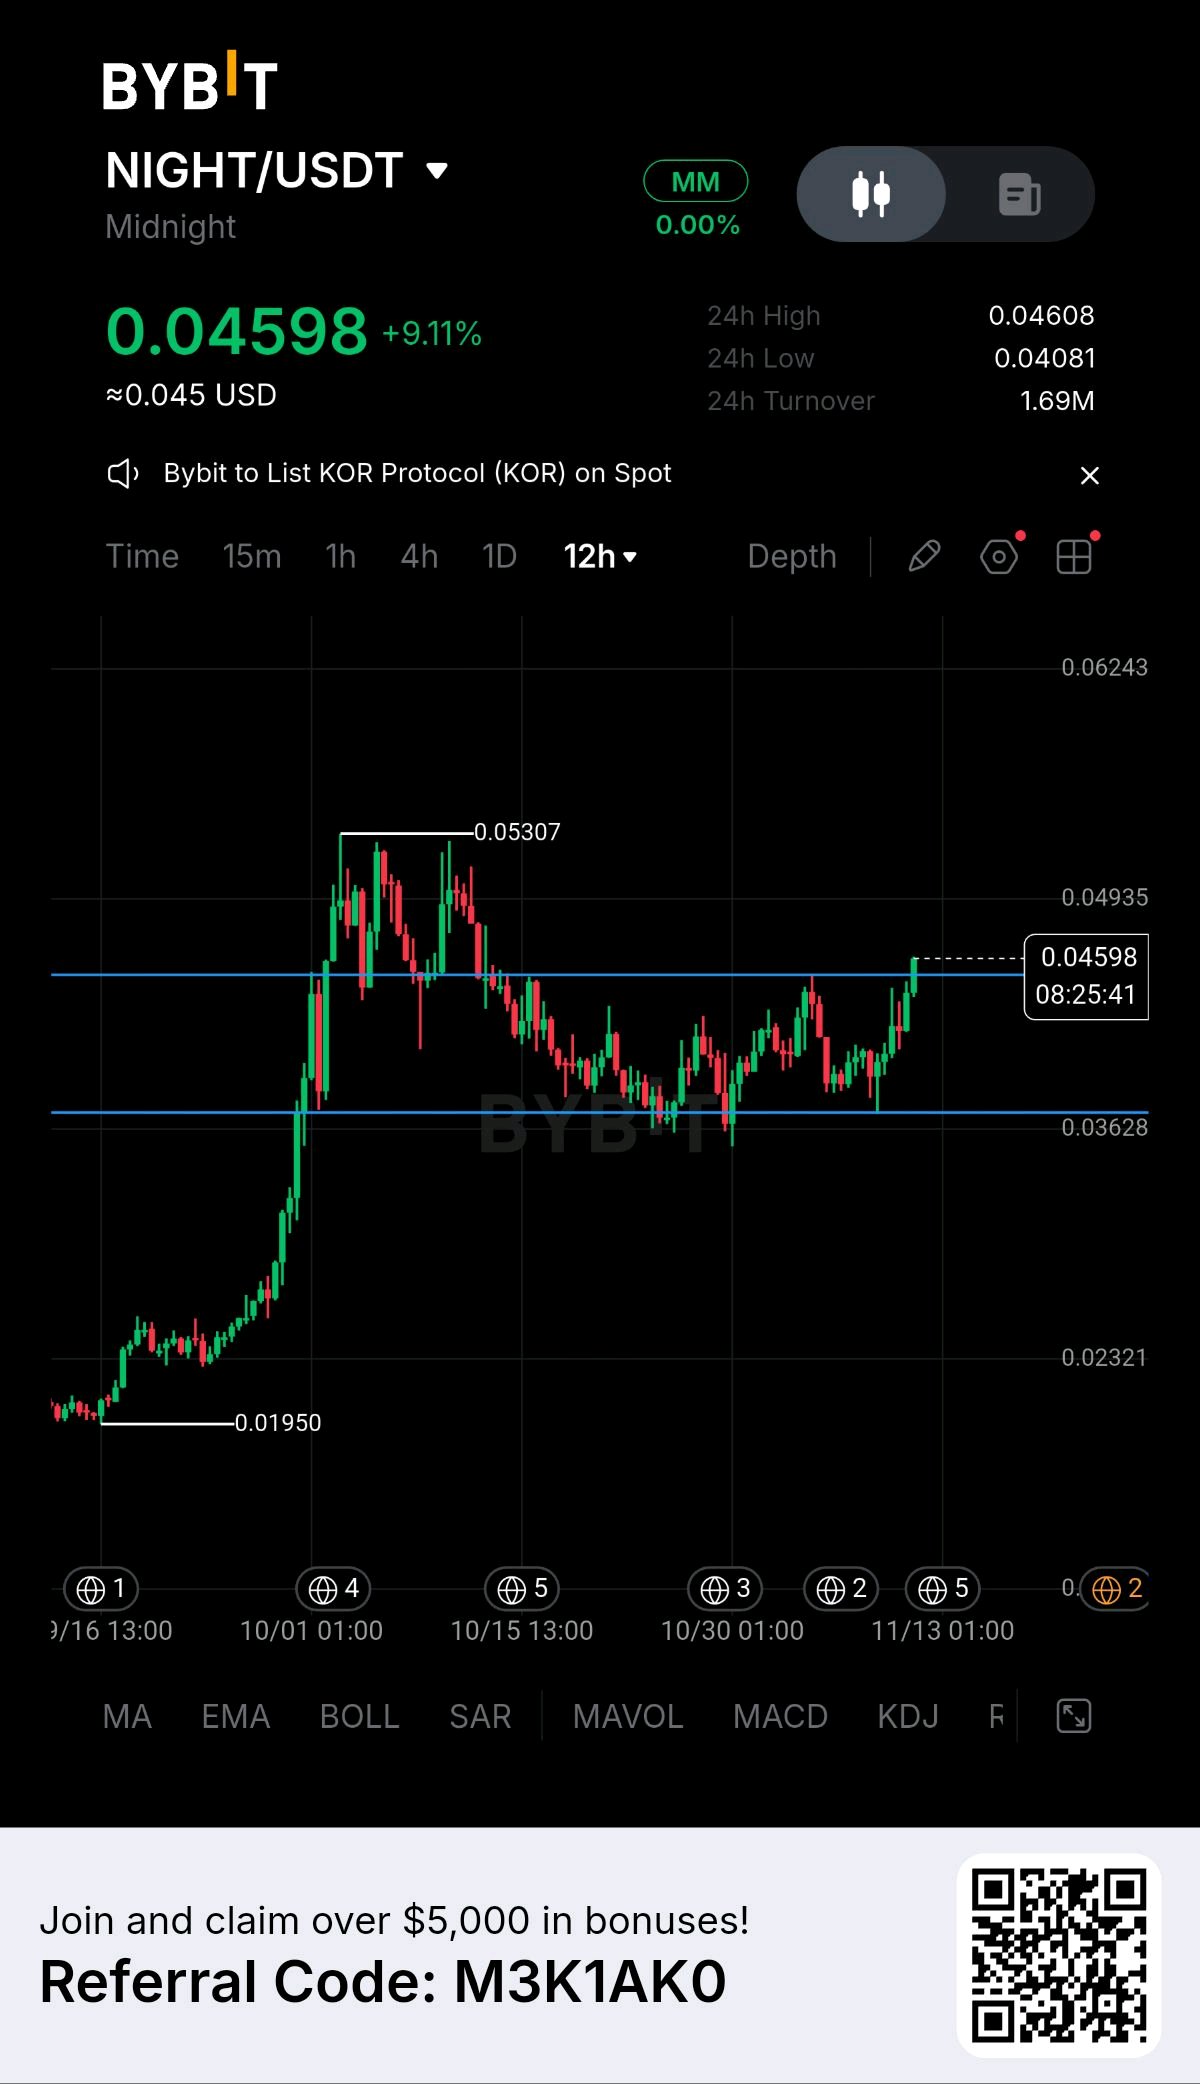
Midnight Reclaims 0.045 Resistance After Strong Bounce Midnight (NIGHT/USDT) trades at $0.04598 (+9.11%) on the 12H chart, mounting a powerful breakout rally above the key $0.045 handle after defending structural demand near the $0.03628 base and printing a 24-hour low of $0.04081 with 1.69M in turnover. Fundamental momentum continues to benefit from Midnight's expanding zero-knowledge Layer-1 ecosystem as a Cardano partner chain, featuring the continuous generation of DUST utility resources via NIGHT staking and robust cross-chain privacy infrastructure rollouts. Key Technical Confluence • Volume: 12H turnover reached 1.69M, reflecting heavy spot accumulation and aggressive buyer participation as price cleared the mid-range channel. • Indicators: NIGHT trades at $0.04598, successfully reclaiming the upper boundary resistance zone and pressing toward the 24-hour high of $0.04608. 12H RSI surges past neutral 62 into bullish continuation territory. • Fundamentals: Continued adoption of the Compact programming language for decentralized applications and growing interest in programmable privacy asset rails provide strong structural backing. What I Like • Clean bullish rejection and recovery off the major $0.03628 demand floor. • Decisive recapture of the critical $0.045 resistance pivot, flipping short-term momentum back to the bulls. • Strong single-session impulse (+9.11%) demonstrating robust buyer dominance. What I Don't Like • Immediate overhead supply zone near $0.04935 and $0.05307 capping rapid upside continuation. • Proximity to prior distribution levels requiring sustained spot volume to clear the all-time range peaks. • Persistent macro sensitivity across privacy-focused and smart contract platform sectors. **Major Levels** • Resistance: $0.04608 (24h High) / $0.04935 / $0.05307 (Local Peak) / $0.06243 • Support: $0.04081 (24h Low) / $0.03628 (Key Support Base) / $0.02321 • Invalidation: Daily close below $0.03500 Trade Play • Setup: Look for a successful high-volume retest hold of the breakout pivot near $0.04400–$0.04500 or a clean 12H close above $0.04700. • Trigger: 12H bullish continuation candle holding support with expanding spot turnover. • Entry: $0.04550 • Stop Loss: $0.03580 ($0.0097 risk) • TP1: $0.05200 (1.00R) • TP2: $0.05900 (2.00R) • TP3: $0.06800 (3.12R) $NIGHTUSDT $OPGUSDT #WSOT2026 #USInflationRunsHotAndRateHikeBetsRise #AITechSelloffErases2Point5TrillionFromNasdaq100

NVDAX Market Insight Nov 11, 2026 A bounce after a sharp decline is not the same as a recovery. NVDAX still needs buyers to prove they can hold their ground. CoinGecko’s snapshot shows NVDAX at $175.35, down 3.70 percent over 24 hours, with $18.55 million in trading volume. Volume fell 18.50 percent from the previous day, suggesting participation has cooled. Quotes differ across venues, so I would check my trading platform before acting. On the support side, the reported 24 hour low of $166.56 is the main reference I am watching. A return toward that level would test whether buyers can absorb another wave of selling. On the resistance side, $182.80 is the reported 24 hour high. Reclaiming and holding above it would strengthen the rebound case. Until then, the move remains inside its recent range rather than a confirmed breakout. Nvidia’s earnings report is scheduled for November 17. The key questions are whether AI demand is translating into deliveries and whether guidance can support investors’ growth expectations. Strong demand alone does not remove execution, financing or regulatory risks. My outlook is cautious until price and participation improve together. NVDAX also carries issuer, liquidity and tracking risks beyond those of Nvidia shares. Lesson of the day: Tokenized stock prices and underlying share prices are related, but not interchangeable. Different trading hours and liquidity can create temporary gaps. Before calling a move cheap or expensive, compare synchronized quotes and understand which instrument you are actually buying. $NVDAXUSDT $BTCUSDT #WSOT2026 #USInflationRunsHotAndRateHikeBetsRise #BitcoinHitsTwoMonthLowAfterUSMidterms


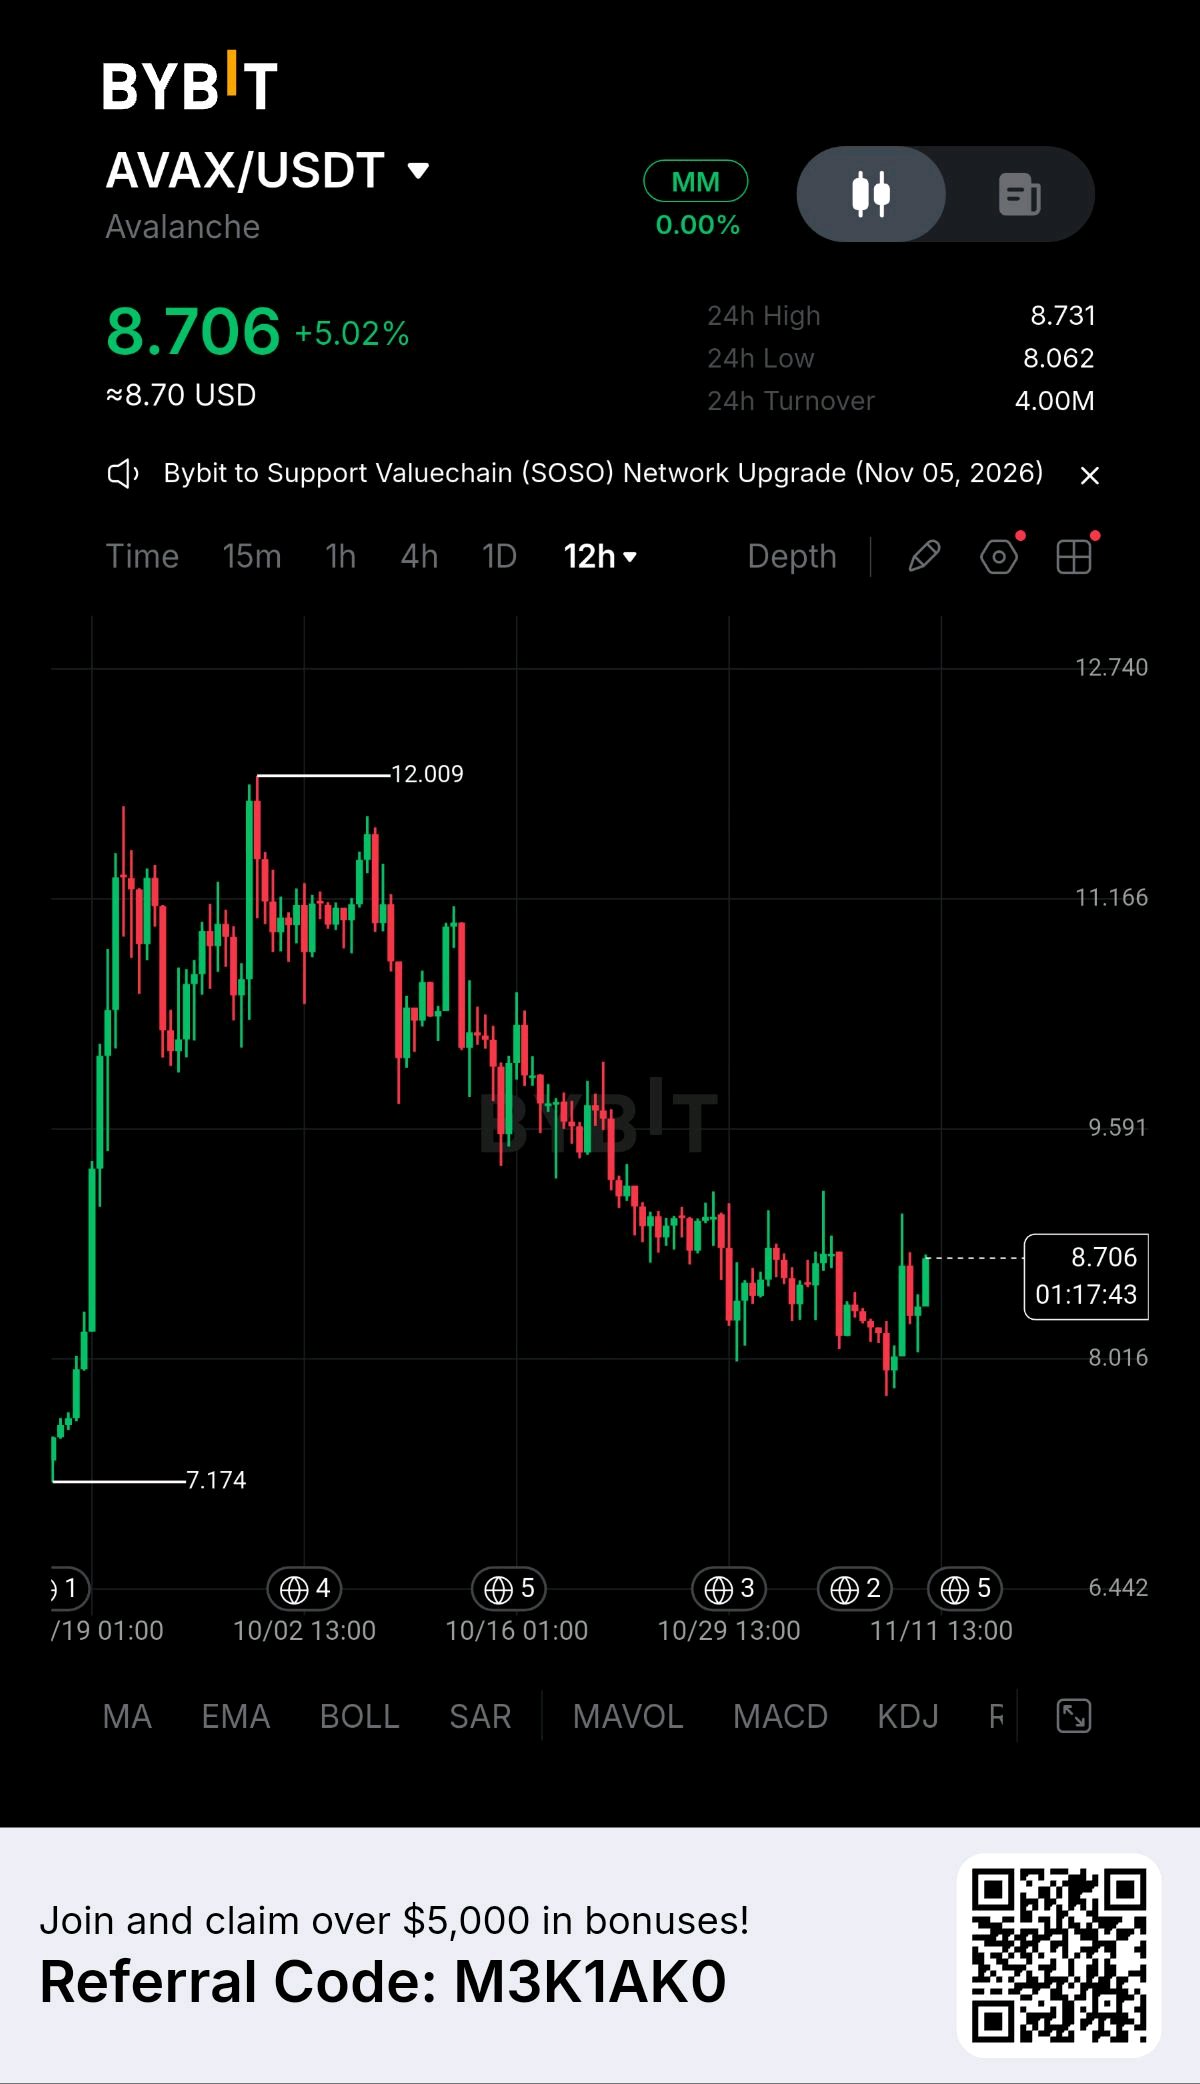
$AVAX Subnets & Rebound Test
Latest News & Ecosystem Catalysts ➠ Subnet Scalability & Enterprise Adoption: Avalanche continues expanding its custom subnet architecture, driving institutional asset tokenization and high-throughput deployment across modular application chains. ➠ Network Upgrade Integration: Ecosystem validator updates and cross-chain messaging bridges improve transaction finality and user onboarding efficiency. ➠ Exchange Turnover Expansion: 24-hour trading turnover reaches $4.00M on Bybit as market volume picks up across layer-1 alternative pairs. Whale & Institutional Money Flow ➠ Order Book Bid Aggregation: Strong structural buy-side volume clusters defend the $8.016 to $8.062 demand corridor, absorbing multi-week corrective pressure. ➠ Smart Money Accumulation: On-chain metrics reveal large-wallet accumulation phases following the successful defense of multi-day swing lows near $7.174. Liquidity & Volume Dynamics ➠ Spot Price & Turnover Action: Spot $AVAX trades at $8.706 (+5.02%) on Bybit. 24-hour turnover registers at $4.00M with daily price oscillating between a low of $8.062 and a high of $8.731. ➠ Technical Rebound Momentum: Price action demonstrates an impulsive recovery leg, testing local resistance boundaries following a prolonged correction from highs near $12.009. Tokenomics & Structural Supply ➠ Deflationary Staking Model: Base fee burning mechanisms and validator bonding requirements continually reduce circulating liquid float during high network activity periods. Narrative & Market Sector ➠ Modular Subnet Infrastructure: Positions itself as a premier customizable layer-1 network tailored for institutional finance, enterprise subnet deployment, and high-performance decentralized gaming. Key Technical Setup (12H Chart) ➠ Primary Resistance Levels: $9.591 | $11.166 | $12.009 ➠ Core Support Levels: $8.016 | $7.174 | $6.442 Risk versus Reward Ratio ➠ Risk/Reward Profile: Favorable at 1:3.2 for momentum continuation swing positions initiated near the $8.05 to $8.45 retest zone, targeting an expansion toward $9.591 and $11.166. Trader’s Game Plan ➠ Support Retest Entry Strategy: Accumulate long exposure on healthy pullbacks into the $8.016–$8.400 support band, maintaining a strict stop loss below $7.100. ➠ Breakout Expansion Strategy: Trigger momentum long setups on a confirmed 12-hour candle close above local resistance at $8.731, targeting a push toward $9.591. Investor’s Angle ➠ Strategic Layer-1 Allocation: Building disciplined positioning near structural demand floors provides high asymmetric upside exposure during altcoin sector rotation phases. Not financial advice. $AVAXUSDT $LITUSDT #WSOT2026 #NovUSCPIWatch #WSOTPicktoEarn10U

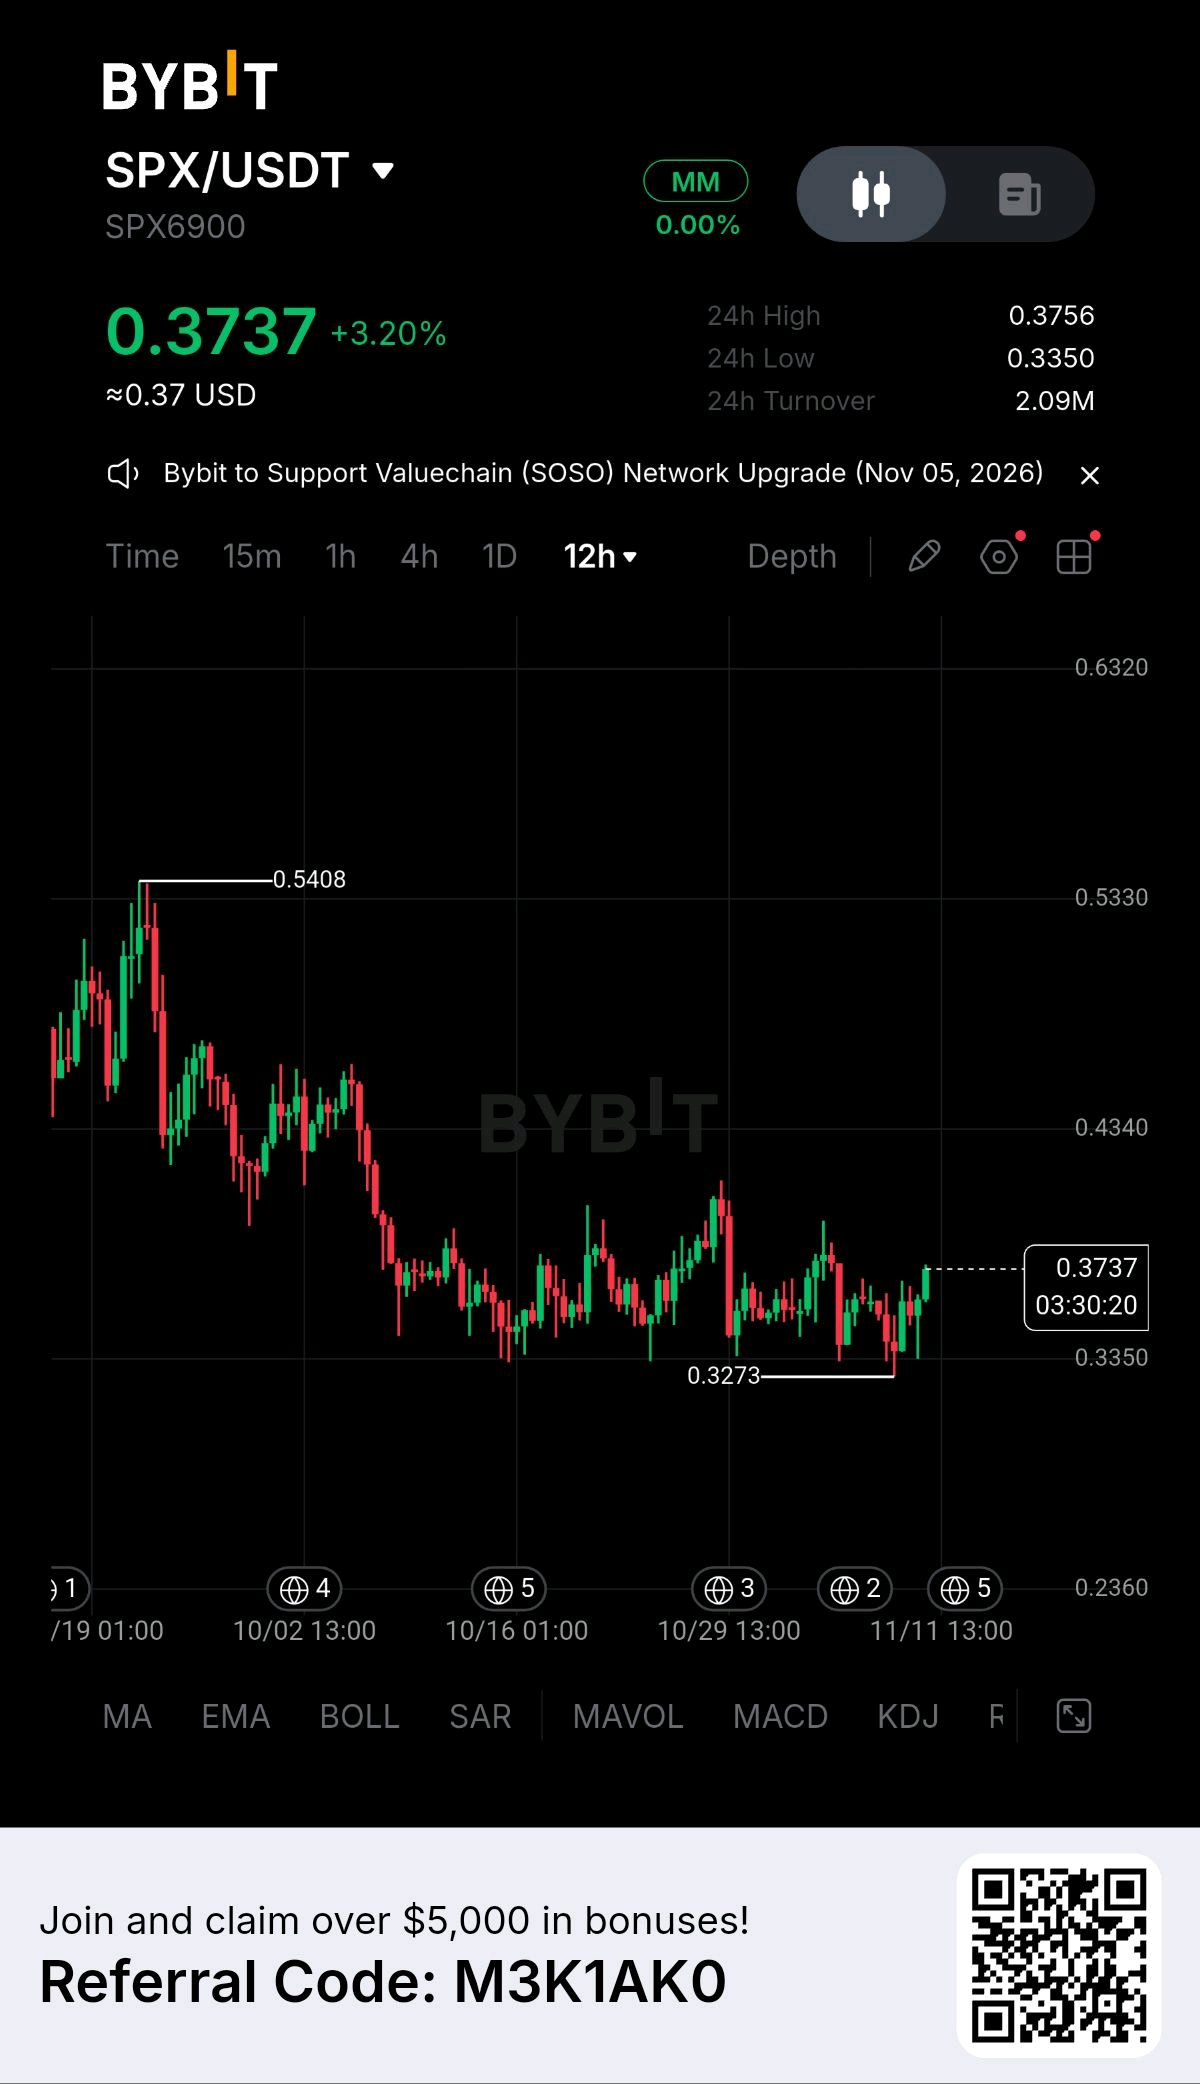
$SPX Bounces 3% Off Its Weekly Low Near $0.33
SPX6900 just posted a solid green session, climbing back above 0.37 after testing a fresh low for the stretch, though the token remains deep in a downtrend that's defined most of this year. SPX6900 is a self-described community meme asset with no roadmap, no team-led development, and no claimed intrinsic value, its own project says as much. The community, who call themselves Aeons, has built a reputation around a buy-and-hold mentality, and prominent crypto commentator Murad Mahmudov recently compared their conviction through steep drawdowns to early Bitcoin holders, though he was careful to frame it as a comparison of behavior rather than a claim the two assets will perform alike. That conviction has been tested, SPX now trades more than 80% below its July 2025 all-time high of 2.27, and 2026 has been its calmest year on record in terms of price range, with every close falling between roughly 0.25 and 0.65. Technical commentary earlier this week flagged the token sitting in a descending channel, with analysts noting price needed to hold around 0.34 and reclaim its 200-day moving average near 0.39 to show real signs of recovery, a level that today's bounce is now testing from below. The chart shows a steep decline from a high of 0.5408 down through a choppy multi-week slide to a low of 0.3273, with today's bounce bringing price back to 0.3737, up 3.20%, right around the middle of that broader range. Given the token is bouncing from a key support zone that technical watchers have specifically flagged, this looks like a cautious long rather than a wait-and-see setup, provided the level holds. An entry near the current 0.3737 with invalidation below 0.3273, the recent low, keeps risk tied to that well-defined floor. The first target sits near 0.39, the 200-day moving average and the level analysts have pointed to as the line between continued range-bound trading and a real recovery attempt, offering a modest but reasonable reward relative to the risk. China's Q3 GDP grew 4.5% year on year, beating forecasts on strong AI-related exports and tech manufacturing, a mildly supportive macro backdrop for risk assets broadly, though a pure sentiment-driven meme token like SPX is likely to keep trading far more on its own community conviction than on any macro data print. Not financial advice. $SPXUSDT $COREUSDT #WSOT2026 #WSOTPicktoEarn10U #NovUSCPIWatch

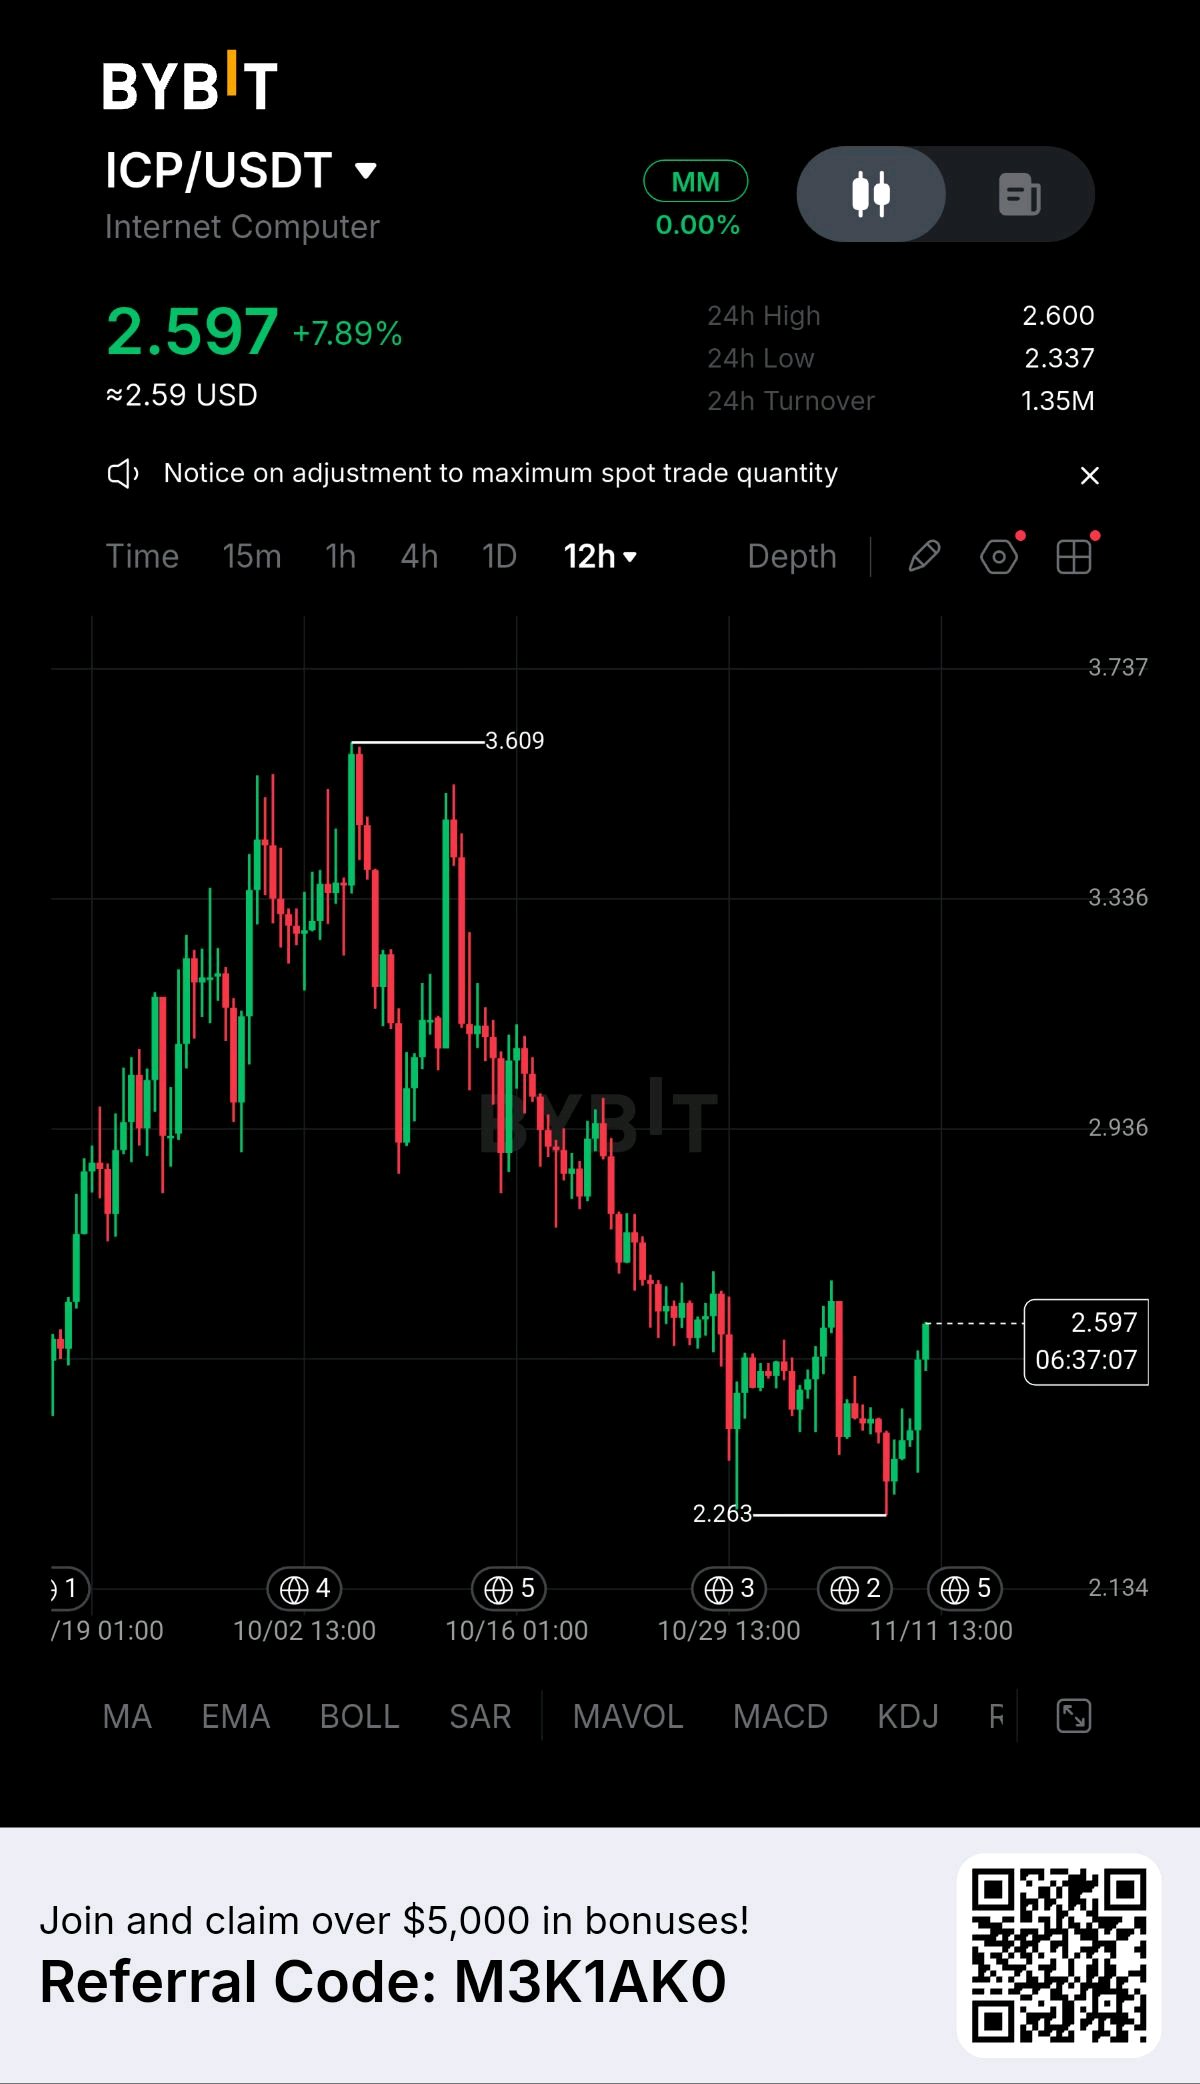
$ICP Jumps 8% in a Sharp Snapback Off $2.26
Internet Computer just staged its strongest bounce in weeks, and for once there's no clear catalyst behind it, which says something about how oversold this chart had become. ICP's recent slide down to $2.26 wasn't driven by anything project-specific. CoinMarketCap's own analysis flagged no ICP news, hacks, or regulatory events behind the early-November drop, attributing the move instead to a broader altcoin selloff tied to Bitcoin and Ethereum liquidations and macro risk-off flows. On the development side, DFINITY founder Dominic Williams announced progress on MULTI/DEX, a fully on-chain, open-source order book exchange built on ICP, though the market barely reacted to that news when it landed. With no fresh negative catalyst driving the recent weakness, today's sharp reversal looks more like exhausted sellers than a response to any specific trigger. ICP is trading at $2.597, up 7.89% on the day, bouncing hard off the $2.263 low from the past session. The 12 hour chart shows a long decline from the $3.609 high in mid-October down to that low, with today's move the first candle of real size to break that downtrend after weeks of lower highs. Resistance sits at $2.600 today's high, then $2.936 and $3.336 further up the chart. Support is $2.337 from the past 24 hours, then the $2.263 low that triggered this move. Turnover came in strong at 1.35M, well above the quieter sessions during the decline. Given this is a sharp reversal off an extended downtrend with no clear fundamental driver, a pullback into the $2.40-2.50 zone holding as support would offer more confirmation than chasing the bounce directly. A trigger there, invalidation below $2.263, and a target at $2.936 would offer close to 3R, though the weight of the prior downtrend means a higher low needs to actually hold before this looks like more than a relief bounce. Not financial advice. $ICPUSDT $COREUSDT #WSOT2026 #WSOTPicktoEarn10U #NovUSCPIWatch
CoreDAO Tests 0.0112 Support as Range Consolidation Holds CoreDAO (CORE/USDT) trades at $0.01271 (+6.72%) on the 12H chart, staging a technical bounce above its recent swing low near $0.01126 while reaching a 24-hour high of $0.01293 with 164.75K in turnover. Fundamental developments continue to focus on Core DAO's Bitcoin DeFi (BTCFi) infrastructure expansion, including protocol revenue models pivoting toward systematic token buybacks via products like lstBTC and dual staking. Recent ecosystem updates also follow community governance transitions and network security enhancements following previous validator reward adjustments. Key Technical Confluence • Volume: 12H turnover stands at 164.75K, showing moderate spot accumulation and buying interest near the multi-week demand floor. • Indicators: CORE trades at $0.01271, attempting to reclaim the $0.0130 pivot level after bottoming near $0.01126. 12H RSI recovers from oversold levels toward neutral territory around 42. • Fundamentals: Growing interest in Bitcoin-secured yield products and decentralized staking utility provide foundational support despite ongoing macro altcoin consolidation. What I Like • Clean structural defense holding firmly above the $0.01126 multi-week demand base. • Solid +6.72% single-session recovery confirming active buyer participation at lower range extremes. • Innovative BTCFi mechanics aiming to link on-chain network fees directly to token value capture. What I Don't Like • Immediate overhead resistance near the $0.01838 and $0.02484 supply blocks capping trend continuation. • Subdued turnover volume requiring broader market participation to challenge higher range ceilings. • Prolonged macro downtrend structure on higher timeframes following previous corrections. Major Levels • Resistance: $0.01293 (24h High) / $0.01838 / $0.02484 / $0.03131 • Support: $0.01140 (24h Low) / $0.01126 (Key Support Base) / $0.00544 • Invalidation: Daily close below $0.01050 Trade Play • Setup: Look for a confirmed 12H volume breakout above $0.01350 or a high-rejection test hold near the $0.01150 demand zone. • Trigger: 12H bullish engulfing candle closing above $0.01300 with expanding spot turnover. • Entry: $0.01250 • Stop Loss: $0.01040 ($0.0021 risk) • TP1: $0.01600 (1.67R) • TP2: $0.02100 (4.05R) • TP3: $0.02700 (6.90R) $COREUSDT $BSBUSDT #WSOT2026 #WSOTPicktoEarn10U #NovUSCPIWatch


AMZN Market Insight Nov 10, 2026 Amazon cleared $265. Now the test is whether buyers can defend the breakout instead of giving it back. The latest verified completed session closed at $266.93, up 2.94 percent on November 9. Trading volume was 42.82 million shares versus a 30 day average of 44.21 million. The gain was strong, but volume was slightly below average, so it does not yet establish unusually strong buying conviction. These are completed session figures, not a live intraday quote. On the support side, I am watching $264 to $265 as a potential retest zone. Holding there would strengthen the breakout case. Below that, $258 and the technical reference around $254 become important. On the resistance side, $270 to $273 is the next test. Beyond that, the reported 52 week high of $287.20 is a broader reference, not a guaranteed target. The business story remains strong. Recent results showed AWS revenue growth of 39.3 percent and a record company operating margin of 13.9 percent. But approximately $220 billion in planned annual capital spending keeps the return on AI investment under scrutiny. Amazon also announced its Black Friday and Cyber Monday plans. That supports the holiday sales narrative, but an announcement alone does not prove stronger demand or better margins. Lesson of the day: A breakout tells you buyers pushed through resistance. A successful retest tells you they are willing to defend it. When volume is not exceptional, that second piece of evidence matters even more. I would watch how Amazon behaves around $265 rather than assume every green session confirms the next rally. $AMZNXUSDT $STRKUSDT #WSOT2026 #WSOTPicktoEarn10U #NovUSCPIWatch


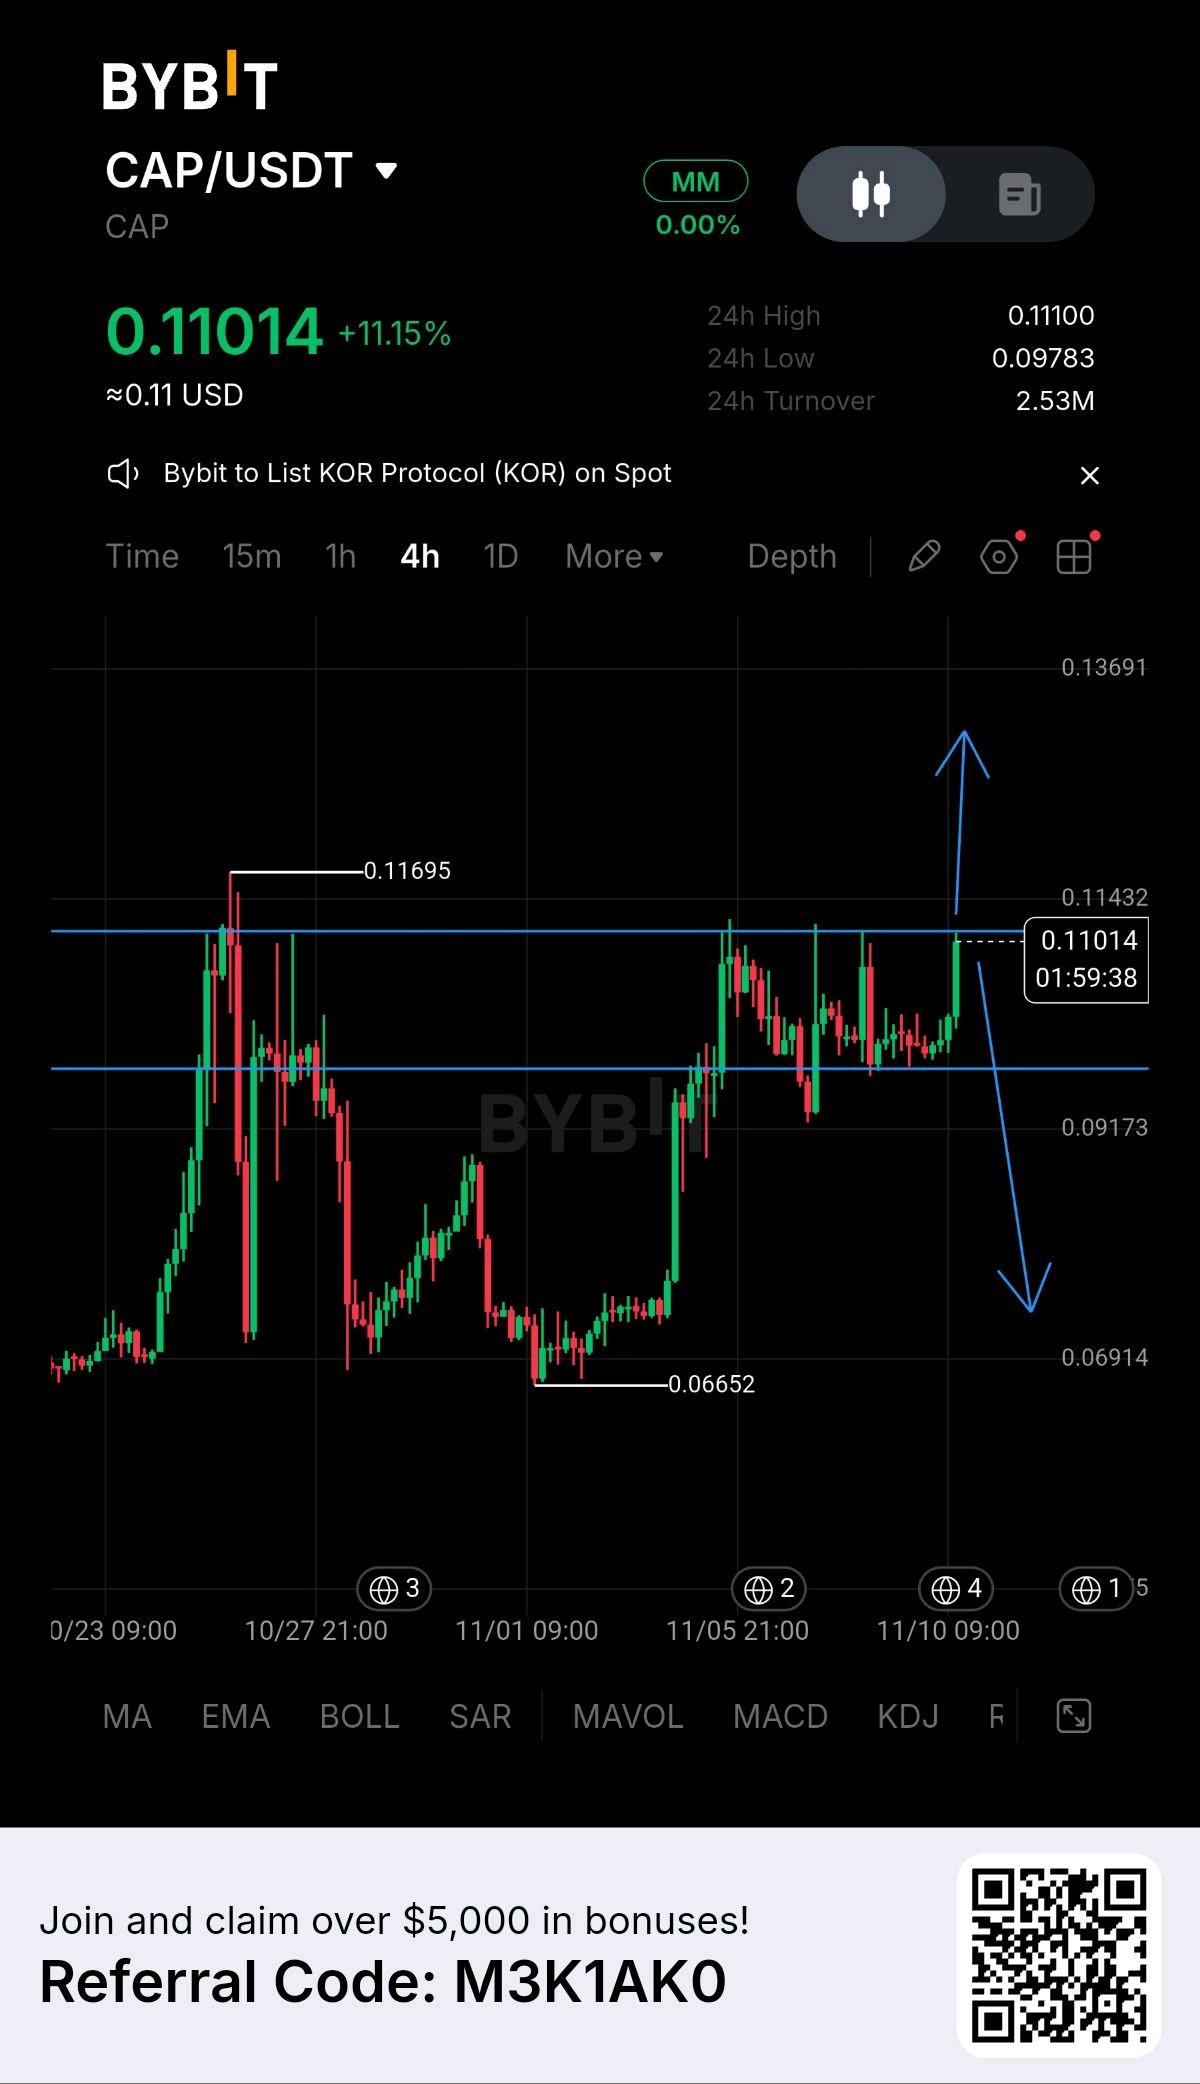
$CAP Momentum Breakout & Resistance Test
Latest News & Ecosystem Catalysts ➠ Ecosystem Expansion & Utility: Capital protocol continues scaling its decentralized liquidity framework and cross-chain execution modules, driving increased transaction volume across integrated networks. ➠ Exchange Listing Catalysts: Platform announcements regarding token listings and liquidity rewards fuel increased retail visibility and short-term capital inflows across centralized venues. ➠ Derivatives Volume Expansion: 24-hour trading turnover expanded to $2.53M on Bybit as market volatility picked up across alternative trading pairs. Whale & Institutional Money Flow ➠ Order Book Bid Aggregation: Strong structural buy-side volume clusters continue defending the $0.09783 to $0.09173 demand corridor, absorbing aggressive profit-taking. ➠ Smart Money Accumulation: On-chain metrics reveal large-wallet accumulation phases following the successful defense of multi-day swing lows near $0.06652. Liquidity & Volume Dynamics ➠ Spot Price & Turnover Action: Spot $CAP trades at $0.11014 (+11.15%) on Bybit. 24-hour turnover registers at $2.53M with daily price oscillating between a low of $0.09783 and a high of $0.11100. ➠ Technical Rebound Momentum: Price action demonstrates a strong impulsive recovery leg, testing key resistance barriers near local highs. Tokenomics & Structural Supply ➠ Deflationary Fee Model: Protocol fee share distribution and staking bond mechanisms reduce liquid circulating supply during high-volume network activity periods. Narrative & Market Sector ➠ High-Performance DeFi Protocol: Positions itself as a premier decentralized liquidity layer connecting automated market making with robust yield optimization mechanics. Key Technical Setup (4H Chart) ➠ Primary Resistance Levels: $0.11432 | $0.13691 ➠ Core Support Levels: $0.09173 | $0.06914 | $0.06652 Risk versus Reward Ratio ➠ Risk/Reward Profile: Favorable at 1:3.2 for momentum continuation swing positions initiated near the $0.0980 to $0.1050 retest zone, targeting an expansion toward $0.11432 and $0.13691. Trader’s Game Plan ➠ Support Retest Entry Strategy: Accumulate long exposure on healthy pullbacks into the $0.09173–$0.09800 support band, maintaining a strict stop loss below $0.08500. ➠ Breakout Expansion Strategy: Trigger momentum long setups on a confirmed 4-hour candle close above local resistance at $0.11100, targeting a push toward $0.11432 and $0.13691. Investor’s Angle ➠ Strategic DeFi Allocation: Building disciplined positioning near structural demand floors provides high asymmetric upside exposure during decentralized finance sector rotation phases. Not financial advice. $CAPUSDT $BSBUSDT #WSOT2026 #WSOTPicktoEarn10U #NovUSCPIWatch
XAUT Market Insight Nov 10, 2026 More gold backing does not automatically mean a higher token price. That distinction matters in today’s pullback. Binance’s market snapshot shows XAUT at $4,057.65, down 0.56 percent over 24 hours, with reported trading volume of $271.2 million. Quotes vary across venues, so I would check my trading platform before acting. Using the 4 hour XAUTUSDT technical levels as reference, I am watching support around $4,040, followed by $4,028. Below that, $4,013 to $4,005 is the next potential reaction zone. Losing those areas would weaken the near term recovery. On the resistance side, $4,073 is the first hurdle, followed by $4,090 to $4,110. Holding above that zone would strengthen the recovery case, with $4,145 becoming another level to watch. These contract levels may differ slightly from spot prices. Recent reports citing Tether put XAUT’s gold reserves at approximately 25.7 tons, valued at $3.44 billion at the end of the third quarter. That supports the adoption story, but does not establish fresh buying pressure today. My outlook is cautious until price reclaims resistance. Growing reserves and a falling token price can coexist because adoption and gold’s market price are different forces. Lesson of the day: Reserve growth measures the expansion of a gold token’s backing, not appreciation per token. Study gold’s direction, token liquidity and backing separately. A stronger adoption story is useful context, but price still needs confirmation. $XAUTUSDT $BSBUSDT #WSOT2026 #WSOTPicktoEarn10U #Oracle20BFundingPlanTestsTheAITrade


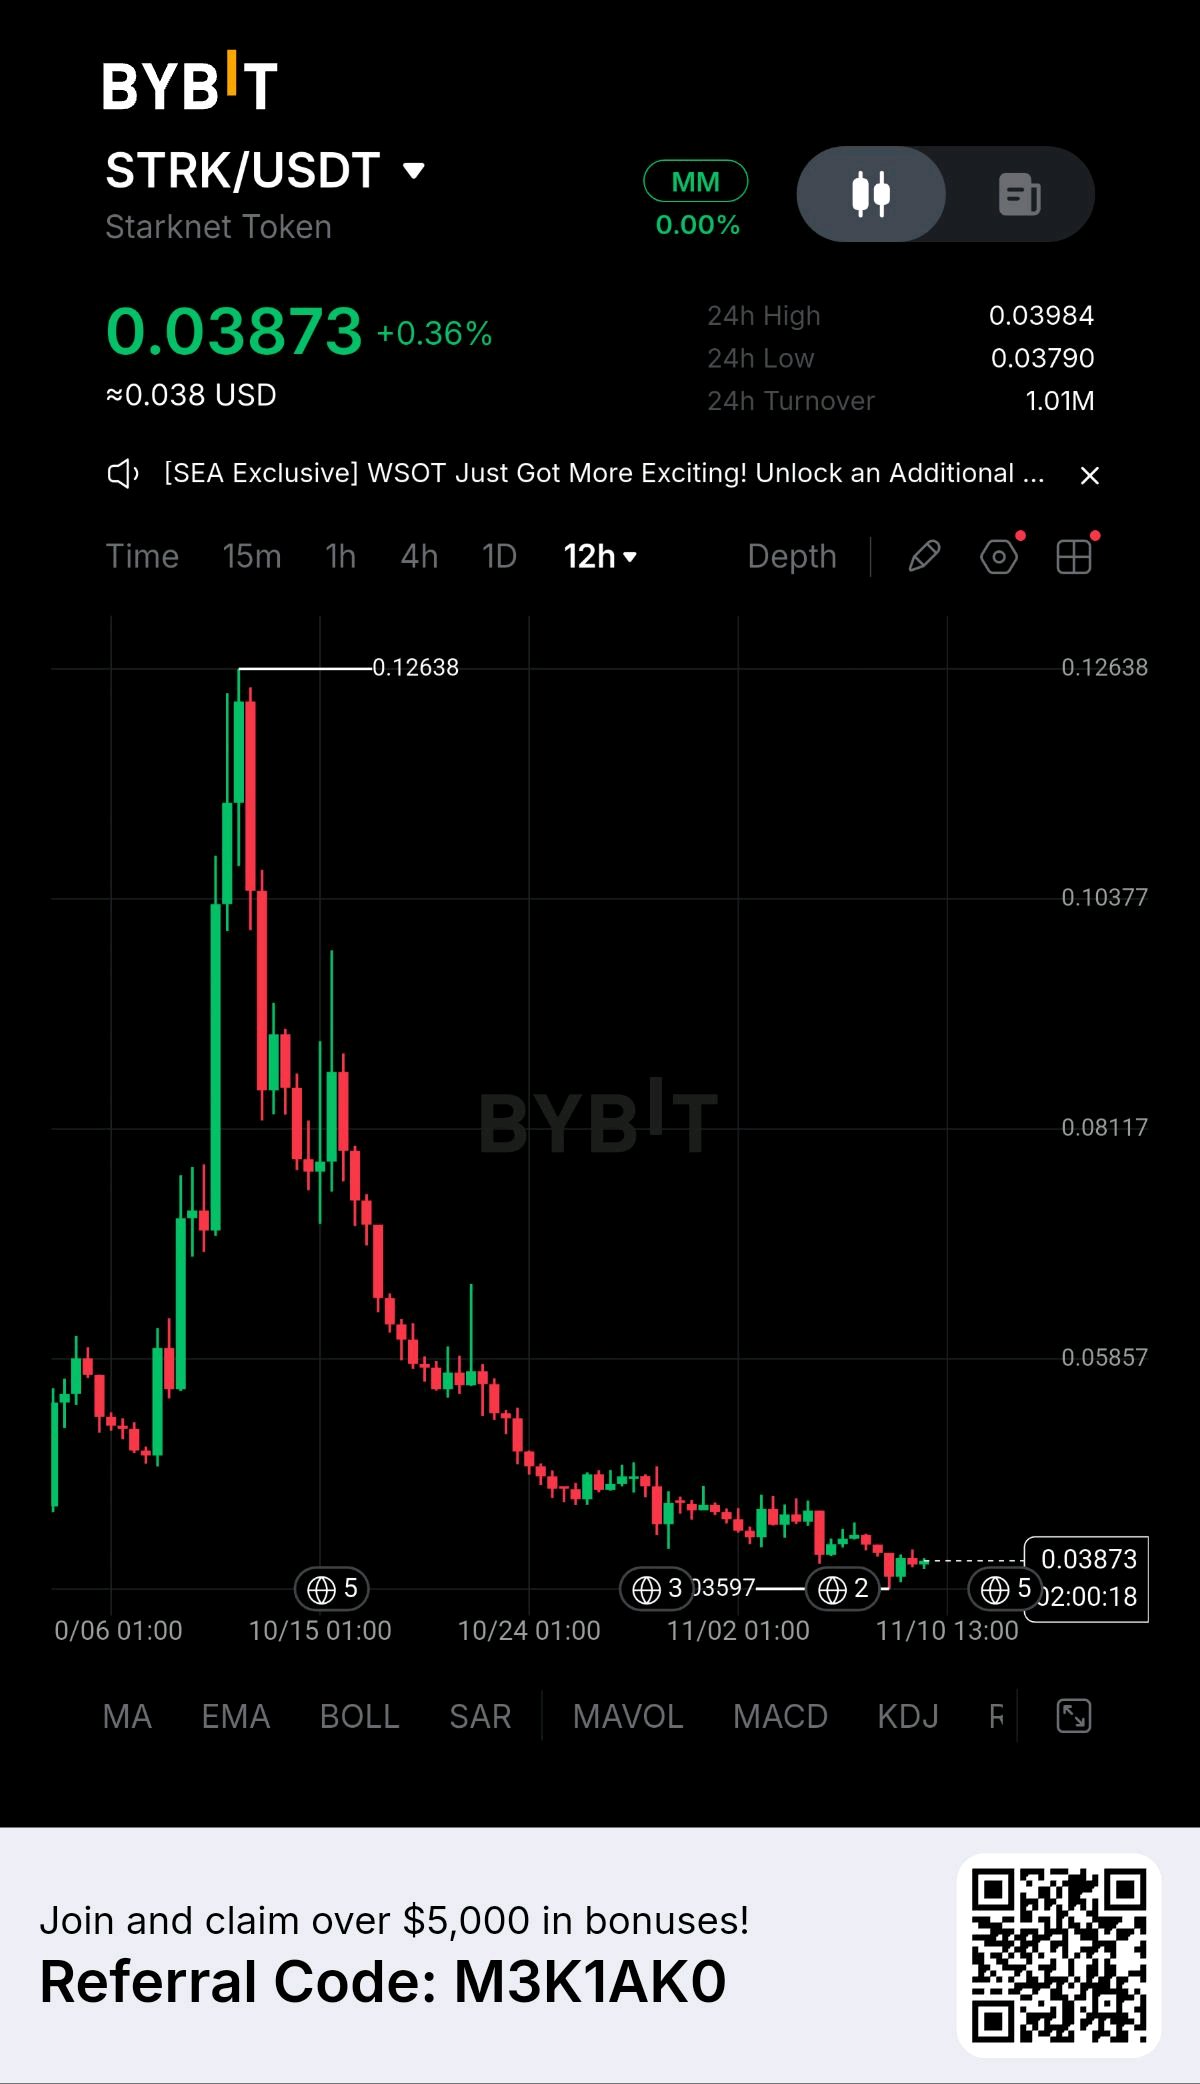
STRK Tests 0.038 Floor Ahead of November Unlock
Starknet (STRK/USDT) trades at $0.03873 (+0.36%) on the 12H chart, consolidating near its multi-week demand base after printing a 24-hour low of $0.03790 and a high of $0.03984 with 1.01M in turnover. Fundamental sentiment remains cautious as traders prepare for Starknet's scheduled November 15 token unlock, which will release 127 million STRK (~$5.1M) to early contributors and investors. On the development front, StarkWare recently deployed the v0.14.3 mainnet upgrade transitioning the network's hash function from Pedersen to BLAKE2s-256 as part of its roadmap toward post-quantum security by 2027. Key Technical Confluence • Volume: 12H turnover stands at 1.01M, reflecting subdued trading activity and cautious range accumulation ahead of upcoming supply expansions. • Indicators: STRK trades at $0.03873, defending the key $0.03597–$0.03790 support zone while remaining capped beneath the descending moving average cluster. 12H RSI hovers near neutral-oversold levels around 38. • Fundamentals: Ongoing protocol infrastructure upgrades (v0.14.3) and privacy tooling rollouts (Starkzap SDK) provide long-term technological backing, weighed against near-term token unlock pressures. What I Like • Clean structural defense holding consistently above the multi-week swing low near $0.03597. • Continued Layer-2 scalability enhancements and forward-looking cryptographic upgrades. • Low absolute valuation offering asymmetric reward potential for long-term accumulators once supply events clear. What I Don't Like • Impending 127 million STRK token unlock on November 15 creating potential near-term supply overhead. • Heavy overhead resistance near the $0.05857 and $0.08117 supply blocks capping trend continuation. • Subdued spot volume and broader altcoin weakness limiting aggressive upside momentum. Major Levels • Resistance: $0.03984 (24h High) / $0.05857 / $0.08117 / $0.10377 • Support: $0.03790 (24h Low) / $0.03597 (Key Support Base) / $0.03000 (Psychological Floor) • Invalidation: Daily close below $0.03450 Trade Play • Setup: Look for a confirmed 12H volume breakout above $0.04200 or wait for post-unlock price stabilization around the $0.03600 demand zone. • Trigger: 12H bullish engulfing candle closing above $0.03950 with expanding spot turnover. • Entry: $0.03850 • Stop Loss: $0.03480 ($0.0037 risk) • TP1: $0.04500 (1.75R) • TP2: $0.05200 (3.64R) • TP3: $0.06000 (5.81R) $STRKUSDT $BSBUSDT #WSOT2026 #WSOTPicktoEarn10U #USPayrollsAndRateDecisionsDriveMacroWeek
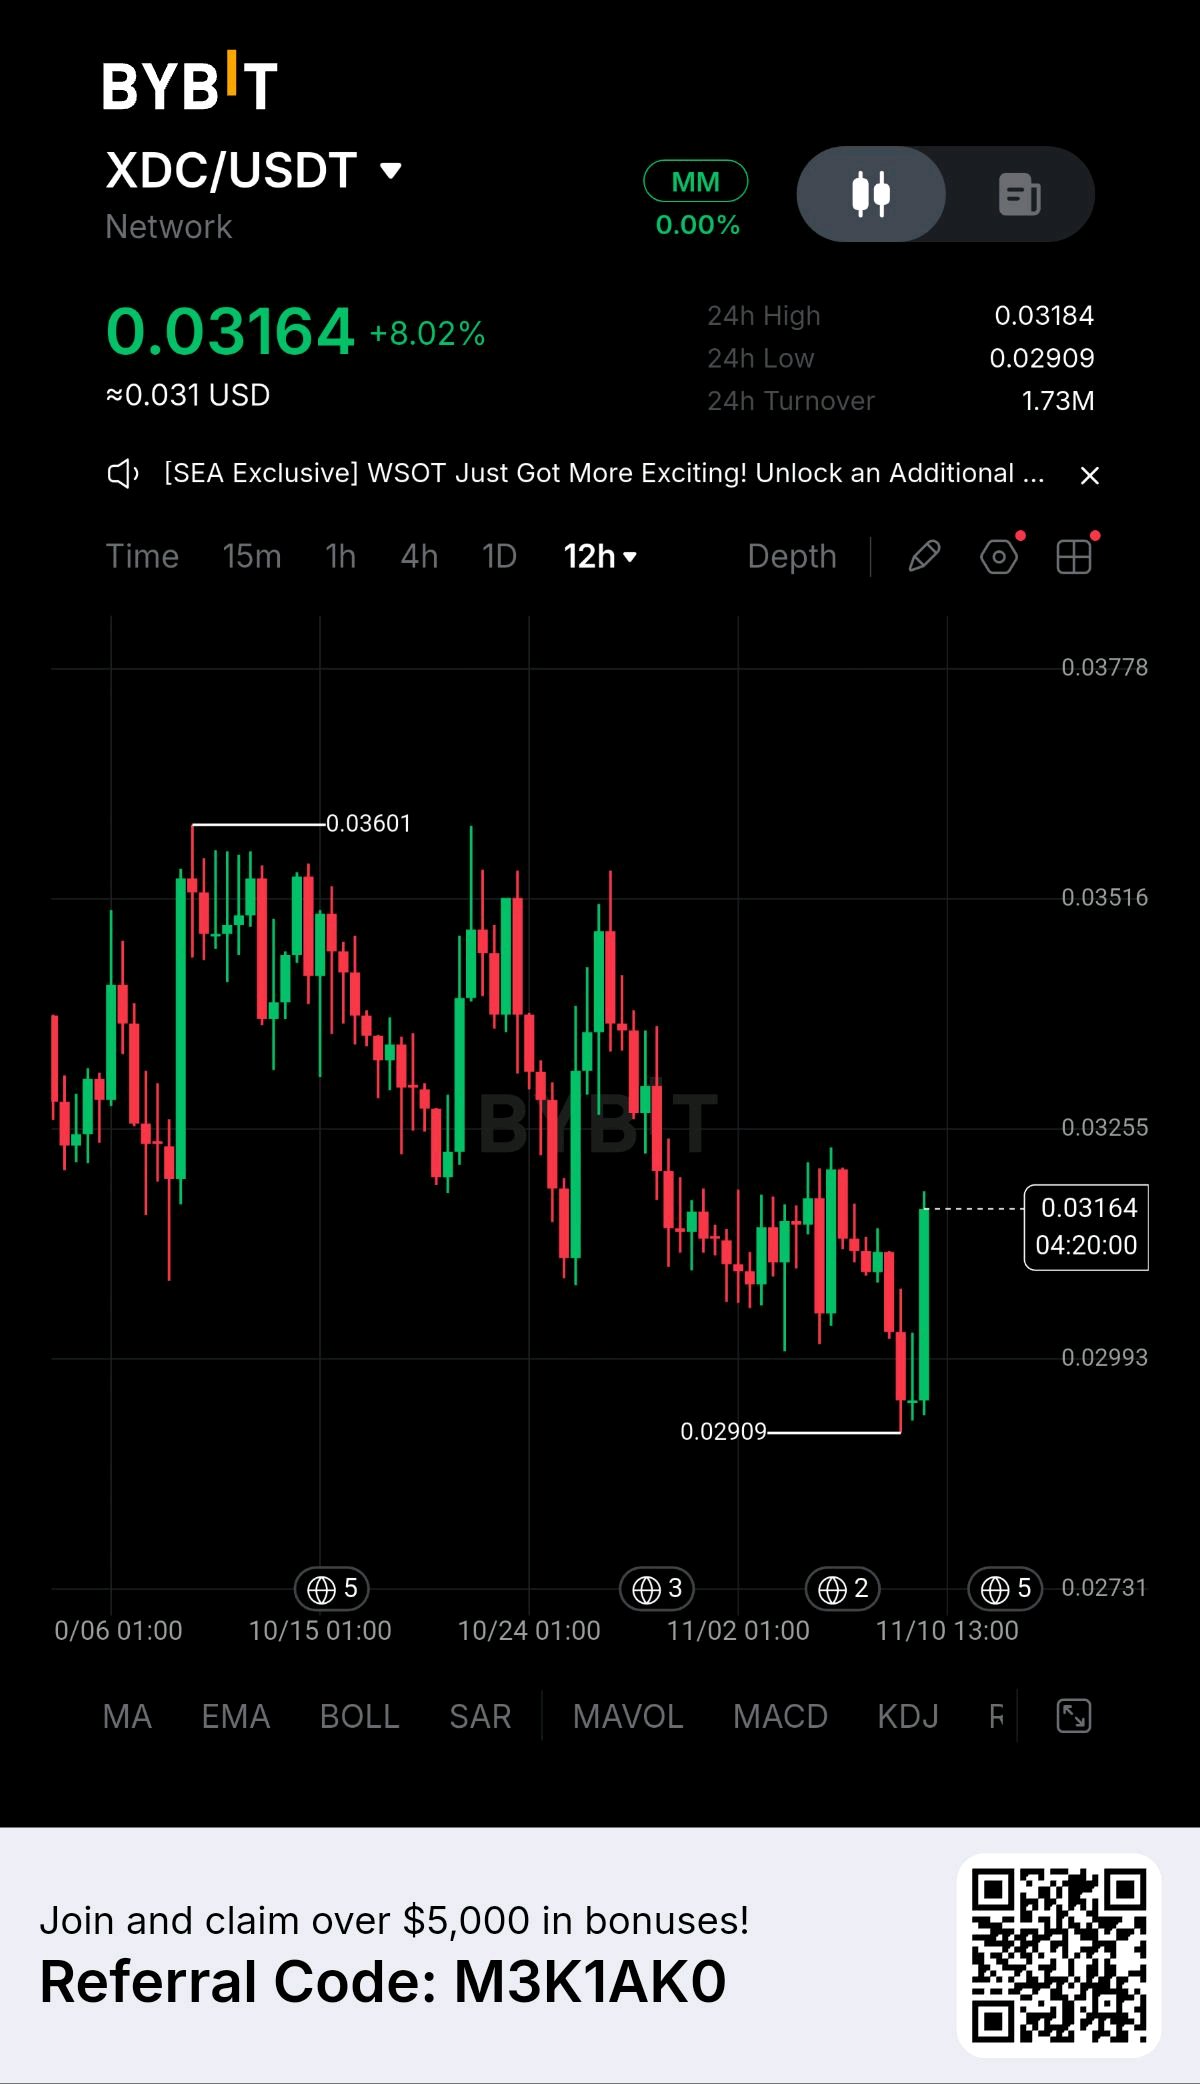
$XDC Jumps 8% Off a Fresh Low Despite a Rough Week XDC just snapped a multi-day losing streak with its sharpest bounce in weeks, even as the broader technical picture has stayed weak heading into today. XDC Network has had a quiet but steady drumbeat of institutional news recently, even as price action struggled. Earlier this month, the New York Stock Exchange's tokenized securities venue connected to XDC Network through partner transfer agents, a notable bridge between traditional finance infrastructure and the network. XDC Ventures, the project's 125 million dollar venture arm, also made a strategic investment in ScallopX, a fintech platform aiming to bring XDC and USDC into everyday card payments and cross-border payouts. Most recently, Thai exchange Bitkub enabled USDC deposits and withdrawals on XDC Network starting November 9, expanding practical access to the chain. None of that news stopped the slide though, price fell more than 5% on both November 8 and 9 even as volume stayed well below its 30-day average, and technical readings through that stretch showed price trading under its key moving averages with a bearish MACD, prompting at least one market analysis to recommend holding existing positions rather than opening new ones until a clearer reversal confirms. XDC has an RWA Hour event scheduled for November 12, which could serve as a fresh catalyst given the network's growing real-world-asset and tokenization focus. The chart shows a steady decline from a high near 0.03601 down to a fresh low of 0.02909, before today's sharp reversal brought price back to the current 0.03164, up 8.02%. Given this bounce is happening against a backdrop of weak volume and bearish technical readings over the prior several sessions, this looks like a setup to watch rather than chase immediately. A move above 0.03255 would be an encouraging sign that today's strength has real follow-through and could open a path back toward 0.03516. Below 0.02909, the recent low, the broader downtrend would remain intact and today's bounce would look more like a dead-cat reaction than a genuine reversal. China's Q3 GDP grew 4.5% year on year, beating forecasts on strong AI-related exports and tech manufacturing, a mildly supportive macro backdrop for risk assets broadly, though XDC's recent price action has been driven far more by its own technical weakness and institutional news flow than by anything tied to the broader macro picture. Not financial advice. $XDCUSDT $SUIUSDT #WSOT2026 #WSOTPicktoEarn10U #NovUSCPIWatch

$SUI Fights Back From $0.8011 With Samsung in Its Corner Sui just bounced off a level that's held against two separate waves of selling, and a fresh mainstream partnership is giving the recovery a real narrative to lean on. Samsung confirmed it's integrating fee-free USDC transfers on the Sui network into Samsung Wallet for eligible US Galaxy users this month, a rollout that could reach roughly 82 million compatible devices and lets users move stablecoins without installing a separate crypto wallet or holding SUI tokens. On the corporate side, SUI Group Holdings, the Nasdaq-listed treasury company, posted a $47.7M Q3 profit driven largely by digital-asset gains on its roughly 109 million SUI position, though that corporate buying hasn't been enough on its own to pull the token back above the $0.87 level multiple analysts have flagged as the line needed to confirm a broader reversal. SUI is trading at $0.8463, up 1.65% on the day, bouncing off the $0.8011 low hit in the last session. The 4 hour chart shows a volatile multi-week stretch: a spike to $0.9655 in late October, a sharp fade, a second rally attempt to $0.9350 that also failed, and then a steep slide into the $0.8011 low before today's recovery. Resistance sits at $0.8695 today's high, then the $0.8833-0.8833 and $0.9350 zones that capped the last two rally attempts. Support is $0.8063 from the past 24 hours, then the $0.8011 low that triggered this bounce. Turnover came in solid at 5.34M. Given how both prior rallies on this chart failed around $0.93-0.97, a pullback into the $0.8313-0.8463 zone holding as support would offer a more conservative entry than chasing today's bounce. A trigger there, invalidation below $0.8011, and a target at $0.8833 would offer close to 2R, with the broader setup still needing a reclaim of $0.87 to shift the larger trend back in buyers' favor. Not financial advice. $SUIUSDT $SIGNUSDT #WSOT2026 #WSOTPicktoEarn10U