Bin Isah
5939Suka0Pembagian111Penggemar20Ikuti
Content Creator ll Web3 growth strategist ll Community Builder ll Ambassador
Content Creator ll Web3 growth strategist ll Community Builder ll Ambassador
$METAXUSDT is trading at $625.95, down 0.42% over 24 hours. The token is sitting close to the bottom of its recent range after Meta’s aggressive AI spending plans increased concerns about cash flow and future funding. The question is whether buyers can defend $620, or whether the market needs a deeper reset. This is Meta xStock, not the original META share. Chart: The reported 24-hour range is $621.69 to $632.09, while the seven-day range is $596.94 to $652.92. Price is holding only slightly above the daily low and remains far below the weekly high. The chart is not showing strong upside momentum yet. Buyers need to protect the $620 area first, then reclaim $632.09 before the recovery can target the upper part of the range. News: The latest concern is Meta’s expanding AI budget. Reports say the company is preparing to spend as much as $145B on facilities and infrastructure, while investors are questioning how quickly those investments can produce returns. Meta’s revenue remains strong, but rising capital expenditure and weaker free cash flow have made the market more sensitive to execution risk. The AI story is still powerful, but it now comes with a much higher financing bill. Fundamentals: METAX tracks Meta Platforms stock through a tokenized structure backed by underlying shares. Its value depends on Meta’s advertising business, AI products, user growth, operating margins and ability to convert heavy infrastructure spending into future revenue. The company has a real business and substantial cash generation, but aggressive AI investment can reduce free cash flow before the benefits become visible. METAX holders also do not receive the same direct shareholder rights as holders of META shares. Sentiment and narrative: The narrative has changed from “Meta is winning AI” to “Can Meta afford the AI race without damaging returns?” Bulls believe the spending will build a major long-term advantage. Bears are focused on dilution, rising costs and uncertain payback. That tension explains why the token is holding near its weekly low despite the strength of Meta’s underlying platform business. The market wants evidence of profitable AI monetization, not only larger spending forecasts. Ecosystem: METAX sits within the tokenized-equity ecosystem, linking Meta exposure with blockchain trading and third-party custody. It can trade outside traditional stock-market hours, but the token may diverge from META when liquidity is thin or the underlying market is closed. Its value is tied to Meta’s company performance, while its trading experience depends on the issuer, supported exchanges and token liquidity. Momentum: Reported 24-hour volume is approximately $4.10M, up 67.8% from the previous day. Price is slightly lower while volume is rising, which suggests that more participants are active during the pullback. That is not a clean accumulation signal yet. If volume expands while price continues falling, sellers remain in control. Buyers need to turn the increased activity into a hold above support. Key levels: Support: $621.69 first, then $600, followed by the seven-day low near $596.94. Resistance: $632.09 first, then $650–$652.92. I want a 2H close above $652.92 on rising spot volume before treating this as a confirmed recovery. Scenarios: Bull: buyers defend $621.69, reclaim $632.09 and push METAX back toward the $650–$652.92 resistance zone. Base: METAX ranges between roughly $600 and $650 while investors wait for clearer evidence that Meta’s AI spending can produce acceptable returns. Bear: $621.69 breaks, the token loses $600 and retests the $596.94 weekly low or lower. Considerations: Meta has a strong advertising business, but the current market debate is about capital intensity and cash-flow pressure. A successful AI strategy could support a major recovery, while weak monetization or further spending increases could keep valuation under pressure. METAX also carries tokenization, custody and liquidity risks in addition to the risks of Meta’s underlying stock. For now, the chart remains vulnerable until buyers reclaim the upper range. Not financial advice. #ByXIMPACT


$SPCXXUSDT diperdagangkan di $140,98, naik 0,75% dalam 24 jam, namun pemulihannya masih di bawah area $148. Token ini telah memantul dari posisi terendah baru-baru ini, tetapi pembeli belum menunjukkan kekuatan yang cukup untuk mengubah rebound tersebut menjadi breakout yang terkonfirmasi. Ini adalah saham tokenisasi SpaceX di pasar spot, bukan kontrak perpetual SPCXUSDT. Grafik: Rentang spot terbaru berada di kisaran $136,76 hingga $148,17, sementara pergerakan tujuh hari tetap positif sekitar 2,6% dalam snapshot yang diambil. Harga bertahan di atas posisi terendah harian, tetapi masih cukup dekat dengan bagian bawah rentang sehingga penjual tetap relevan. Harga tertinggi $148,17 adalah ujian grafik utama. Pergerakan di atas level tersebut akan memperbaiki struktur pemulihan, sementara penembusan di bawah $136,76 akan mengindikasikan bahwa rebound mulai kehilangan kendali. Berita: Perkembangan terbaru yang utama adalah SpaceX menolak daftar saham tokenisasi yang diusulkan di OKXICE. Hal itu menunjukkan bahwa pasar tokenisasi sedang berkembang, tetapi juga menyoroti ketidakpastian hukum dan regulasi seputar paparan berbasis blockchain terhadap saham perusahaan. Ada juga laporan yang menghubungkan SpaceX dengan pengeluaran besar untuk infrastruktur komputasi AI. Hal itu memperluas kisah pertumbuhan perusahaan melampaui roket dan Starlink, tetapi komitmen pembiayaan yang besar tidak sama dengan pendapatan atau laba instan. Fundamental: SPCXX dirancang untuk memberikan eksposur tokenisasi ke saham SpaceX melalui struktur xStocks. Nilainya bergantung pada valuasi pasar swasta SpaceX, bisnis peluncuran, pertumbuhan Starlink, kontrak, dan ekspansi ke infrastruktur AI. Token ini tidak memberikan pemegangnya hak suara yang sama atau posisi pemegang saham langsung seperti saham SpaceX terdaftar. Harga juga bisa bergerak menjauh dari referensi dasar ketika likuiditas token tipis atau pasar tradisional tutup. Sentimen dan Narasi: Narasinya berubah dari kisah perusahaan luar angkasa murni menjadi kisah teknologi dan infrastruktur yang lebih luas. SpaceX memiliki potensi pertumbuhan besar melalui Starlink, layanan peluncuran, dan rencana komputasi AI, tetapi setiap area memerlukan pengeluaran modal yang besar dan eksekusi yang sukses. Rebound baru-baru ini menunjukkan pembeli masih tertarik, tetapi kegagalan untuk menembus $148 menunjukkan bahwa keyakinan belum cukup kuat untuk mengonfirmasi tren naik yang baru. Ekosistem: SPCXX berada di pasar ekuitas tokenisasi, menghubungkan eksposur SpaceX dengan perdagangan blockchain, kustodian, dan bursa yang didukung. Ekosistemnya didasarkan pada perusahaan induk, bukan protokol kripto yang terpisah. Sifat perdagangan token 24/7 memang berguna, tetapi juga dapat menciptakan kesenjangan harga ketika pasar ekuitas dasar kurang aktif. Ketentuan penerbit, akses penebusan, dan likuiditas tempat perdagangan tetap penting. Momentum: Volume spot yang dilaporkan sekitar $11,67 juta, turun sekitar 18,9% dari hari sebelumnya. Harga sedikit lebih tinggi, tetapi volume yang turun menunjukkan bahwa rebound tidak didukung oleh partisipasi yang meluas. Hal itu tidak membatalkan pergerakan tersebut, tetapi membuat breakout $148,17 menjadi lebih penting. Pembeli membutuhkan penerimaan harga dan aktivitas spot yang lebih kuat untuk membuktikan bahwa pemulihan tersebut lebih dari sekadar aksi beli untuk menutupi posisi short atau permintaan sementara. Level Kunci: Support: $136,76 pertama, lalu $133–$135, diikuti oleh area $121 yang lebih dalam. Resistance: $143–$145 pertama, lalu $148,17 dan level psikologis $150. Saya menginginkan penutupan 2H di atas $148,17 dengan volume spot yang meningkat sebelum menganggap ini sebagai breakout yang terkonfirmasi. Skenario: Bull: pembeli bertahan di atas $136,76, merebut kembali $145 dan menembus $148,17, membuka jalan menuju area $150. Base: SPCXX bergerak di antara kisaran $135 dan $148 sementara pasar menunggu arah yang lebih jelas dari valuasi dasar SpaceX. Bear: rebound gagal di bawah $143–$145, lalu $136,76 ditembus dan harga kembali menuju $133 atau area $121. Pertimbangan: SPCXX adalah ekuitas tokenisasi dengan volatilitas tinggi, bukan investasi stabil tradisional. Kisah pertumbuhan SpaceX memang kuat, tetapi valuasi, kebutuhan pembiayaan, dan penemuan harga pasar swasta menimbulkan ketidakpastian. Likuiditas token juga bisa jauh lebih tipis daripada eksposur pasar perusahaan induk yang lebih luas. Sinyal kuncinya adalah apakah pembeli dapat merebut kembali $148,17 dengan permintaan spot yang nyata. Sampai hal itu terjadi, ini tetap merupakan pemulihan di dalam rentang, bukan breakout yang terkonfirmasi. Bukan nasihat keuangan. $ByXIMPACT

$XAUTUSDT is trading at $3,875.26, down 2.68% over 24 hours. The token has fallen back toward the lower end of its recent range, making $3,850 the next area buyers need to defend. The question is whether this is a normal gold pullback or the start of a deeper reset. This is Tether Gold, backed by physical gold, not a dollar-pegged stablecoin. Chart: Price is near the reported 24-hour low of $3,848.33, while the high is around $3,995.20. The market has lost the $4,000 area and is now testing the lower boundary of the move. A recovery above $3,900 would be the first sign that buyers are returning, but price has not yet shown a clear reversal. The recent weekly structure is also weaker than before. A clean break below $3,850 would expose the market to further downside, while a move back above $4,000 would improve the short-term picture. News: The latest positive development is Tether Gold’s reported completion of a KPMG audit with approximately $2.2B in gold backing. Tether has also reported that its physical gold reserves grew to about 25.7 tonnes during the year. That strengthens confidence in the backing story, but it has not protected XAUT from today’s sell-off. Reserve growth supports the product’s structure; it does not guarantee that the market price of gold will continue rising. Fundamentals: Each XAUT represents one fine troy ounce of physical gold held in custody. Its value depends mainly on the gold market, real interest rates, the US dollar and demand for defensive assets. Unlike most crypto tokens, XAUT does not rely on platform revenue, staking activity or community attention. However, holders still face issuer, custody, redemption and exchange-liquidity risks. Physical backing does not remove the risk of a decline in gold prices. Sentiment and narrative: The narrative is shifting from gold accumulation to capital protection. Traders are watching whether gold can stabilize after losing the $4,000 area. The audit and reserve updates are constructive for long-term confidence, but short-term sentiment is clearly weaker. A token can have strong backing and still fall if traders reduce exposure to gold or move into cash and higher-yielding assets. Ecosystem: XAUT connects physical bullion with blockchain-based trading and transfers. Its ecosystem is built around gold custody, reserve verification, exchanges and redemption rather than a standalone crypto application. That gives XAUT a different profile from speculative tokens. Its main strength is asset backing, while its main risks are custody arrangements, redemption conditions and liquidity during sharp market moves. Momentum: Reported 24-hour volume is approximately $122.76M, showing that the decline is taking place with substantial activity. This is not a quiet drift lower. The combination of a 2.68% decline and heavy volume suggests meaningful selling pressure or repositioning. Buyers need to absorb that pressure near $3,850 before the chart can form a reliable recovery. Key levels: Support: $3,850 first, then $3,800 as a psychological level. Resistance: $3,900 first, followed by $3,995.20 and the $4,000 area. I want a 2H close back above $4,000 on rising spot volume before treating this as a confirmed recovery. A break below $3,850 would be a warning that the decline is extending. Scenarios: Bull: buyers defend $3,850, reclaim $3,900 and push XAUT back toward the $4,000 area. Base: XAUT trades between roughly $3,850 and $4,000 while the gold market searches for direction. Bear: $3,850 breaks, the recovery fails and price moves toward $3,800 or lower. Considerations: XAUT can decline even when its physical backing remains intact. A stronger dollar, higher real yields or reduced demand for safe-haven assets can pressure gold. The token also trades across venues with different liquidity, so prices and spreads may vary. The immediate chart is weak, and the reserve news is not enough to reverse that by itself. I would focus on whether buyers can defend $3,850 and reclaim $4,000 before treating this pullback as complete. Not financial advice. #ByXIMPACT


$NVDAXUSDT diperdagangkan pada $157,03, turun 10,19% dalam 24 jam. Pertanyaannya bukan lagi apakah pembeli dapat memperpanjang reli, melainkan apakah mereka dapat menstabilkan harga setelah penurunan tajam. Pantulan harga saja tidak akan memperbaiki kerusakan; pembeli perlu merebut kembali posisi yang hilang. Ini adalah NVIDIA xStock, yang memberikan eksposur token terhadap saham NVIDIA, bukan proyek kripto AI yang berdiri sendiri. Grafik: Snapshot spot agregat yang diambil menunjukkan kisaran 24 jam sebesar $158,40 hingga $177,93 dan kisaran tujuh hari sebesar $158,40 hingga $198,92. Harga spot terbaru berada di bawah level terendah snapshot tersebut, yang menunjukkan pelemahan lebih lanjut atau perbedaan antara pembaruan pasar. Bagaimanapun, $158,40–$160 sekarang menjadi referensi pemulihan, bukan support yang terkonfirmasi. Snapshot agregat juga menunjukkan penurunan mingguan sebesar 18,3%, jadi pelemahan ini melampaui satu sesi saja. Berita: Pengumuman yang diterbitkan NVIDIA menyatakan bahwa Jensen Huang telah mengundurkan diri sebagai CEO dan anggota dewan, dengan CFO Colette Kress ditunjuk sebagai CEO sementara. Perusahaan mulai mencari pengganti permanen. Hasil kuartalan tetap dijadwalkan pada 17 November. Hal itu menciptakan dua ujian terpisah: kepercayaan pada transisi kepemimpinan dan kepercayaan pada prospek bisnis. Pengumuman tersebut tidak menetapkan bahwa permintaan chip telah melemah, namun menimbulkan ketidakpastian seputar eksekusi dan strategi jangka panjang. Fundamental: NVDAX melacak ekuitas dasar NVIDIA melalui struktur xStocks. Pendorong ekonominya adalah pendapatan pusat data NVIDIA, permintaan perangkat keras AI, margin, kapasitas pasokan, dan pengeluaran pelanggan. Ketidakpastian kepemimpinan dapat memengaruhi valuasi bahkan ketika bisnis operasional tetap kuat. Perbedaan utamanya adalah antara perubahan kepercayaan investor dan penurunan pendapatan. Penurunan harga saat ini saja tidak membuktikan yang terakhir. Sentimen dan narasi: Narasi telah bergeser dari pertumbuhan AI ke kontinuitas. Investor sedang menilai apakah NVIDIA dapat mempertahankan peta jalan teknologi dan hubungan pelanggannya melalui pergantian kepemimpinan. Harga yang jatuh meskipun ada peluang AI yang lebih luas menunjukkan bahwa cerita sektor yang kuat tidak dapat membatalkan risiko spesifik perusahaan. Pemburu harga murah mungkin melihat peluang, tetapi membeli karena token telah jatuh tajam tidak sama dengan mengidentifikasi pembalikan yang terkonfirmasi. Ekosistem: Bisnis NVIDIA berada dalam jaringan penyedia cloud, produsen chip, pengembang, dan operator pusat data yang luas. Ekosistem perangkat keras dan perangkat lunaknya lebih relevan terhadap valuasi daripada aktivitas pemegang token NVDAX. Token ini menambah lapisan lain: pengaturan penerbit, kustodian, transfer blockchain, dan likuiditas bursa. Eksposur terhadap bisnis NVIDIA tidak identik dengan kepemilikan langsung sahamnya dengan hak pemegang saham penuh. Momentum: Volume perdagangan 24 jam agregat yang dilaporkan sekitar $34,99 juta, naik 91,9% dari hari sebelumnya. Berbeda dengan penurunan yang tenang, penurunan ini disertai dengan aktivitas yang jauh lebih besar. Kombinasi tersebut konsisten dengan tekanan jual yang meningkat, meskipun volume saja tidak dapat mengidentifikasi motif setiap pembeli atau penjual. Pantulan harga bisa saja terjadi, tetapi bukti pemulihan yang lebih kuat memerlukan harga untuk merebut kembali level yang hilang dan mempertahankannya. Level kunci: Support: $150 sebagai referensi psikologis; level terendah baru yang terkonfirmasi di bawah $157 belum ditetapkan dalam data yang diambil. Resistance: $158,40–$160 terlebih dahulu, kemudian $177,93, diikuti oleh $198,92, level tertinggi tujuh hari yang dilaporkan. Saya menginginkan penutupan 2 jam kembali di atas $160 dan pengujian ulang yang berhasil sebelum menganggap pantulan harga sebagai stabilisasi. Merebut kembali $177,93 akan memberikan bukti pemulihan yang lebih kuat. Skenario: Bull: pembeli merebut kembali $160, menahan pengujian ulang, dan bergerak kembali menuju $177,93. Base: NVDAX stabil di sekitar area $150–$160 saat investor menilai transisi kepemimpinan dan pendapatan mendatang. Bear: upaya untuk merebut kembali $160 gagal, dan harga bergerak menuju $150. Kehilangan level psikologis itu akan membuat sisi penurunan tanpa referensi support yang terverifikasi dalam snapshot ini. Pertimbangan: Ini adalah pengaturan berbasis peristiwa, jadi berita utama dapat mengalahkan sinyal teknis biasa. Laporan pendapatan menambah sumber potensi repricing tajam lainnya. Likuiditas token dan perbedaan antara jam pasar juga dapat menimbulkan celah antara NVDAX dan saham dasarnya. Prioritas segera adalah bukti stabilisasi, bukan mengasumsikan bahwa penurunan dua digit harus berbalik. Permintaan yang kuat untuk infrastruktur AI dapat mendukung bisnis sementara saham masih menghadapi tekanan valuasi dan tata kelola. Bukan nasihat keuangan. #ByXIMPACT


$TSLAXUSDT is trading at $389.28, up 0.35% over 24 hours, but buyers still need to clear the $395 area. The recovery has brought price back toward the top of its weekly range without establishing a breakout. The question is whether fresh demand arrives or the move settles into consolidation. This is Tesla xStock, not a meme coin or a futures contract. Chart: The reported spot range is $383.35 to $394.71 over 24 hours and $336.08 to $394.71 over seven days. Price is below the shared daily and weekly high, making $394.71 the clearest overhead reference. Holding $383.35 would keep the immediate range intact, but a move above the high needs confirmation rather than a brief wick. These aggregate ranges and the latest spot quote come from separately updated snapshots. News: Recent reporting centers on Tesla’s plan to phase out Cybertruck production at its Texas plant to make room for more Cybercab manufacturing. An updated report suggests the transition could occur later in 2027 than initially indicated. That keeps robotaxi expansion in focus, but production plans are not the same as proven demand or profits. Whether Tesla can scale Cybercab economically matters more than the announcement alone. Fundamentals: TSLAX provides tokenized exposure to Tesla shares through the xStocks structure. Its underlying drivers are Tesla’s vehicle sales, operating margins, energy business and progress in autonomy. The token is not an independent business with its own revenue stream. Its market capitalization measures circulating token exposure, not Tesla’s entire valuation. Backing by shares also does not protect holders when the underlying stock declines. Sentiment and narrative: The narrative is Tesla’s transition from an automaker toward a broader autonomy business. Bulls see Cybercab as a new source of growth. Skeptics want evidence that investment and production capacity will translate into sustainable earnings. Price is holding near the weekly ceiling, which is constructive, but enthusiasm has not yet produced a confirmed break. A compelling robotaxi story still needs commercial execution and market follow-through. Ecosystem: TSLAX belongs to the tokenized-equities market, connecting Tesla exposure with exchange trading and blockchain infrastructure. Its ecosystem depends on the issuer, share custody, supported networks and liquidity providers. The useful distinction is access versus ownership: trading the token offers economic exposure, but not all the rights of directly holding Tesla shares. Momentum: Reported aggregate 24-hour volume is approximately $7.05M, down about 15.1% from the previous day. The modest price gain is therefore not accompanied by expanding activity. That does not automatically make the setup bearish, but it leaves the recovery short of strong confirmation. A push through $394.71 would be more convincing if spot volume increased and price held above the level afterward. Key levels: Support: $383.35 first, then $380 as a psychological reference, followed by $336.08, the reported seven-day low. Resistance: $394.71 first, then the psychological $400 area. I want a 2H close above $394.71 on rising spot volume before treating this as a breakout. Scenarios: Bull: buyers hold $383.35, clear $394.71 and push toward the $400 test. Base: TSLAX consolidates between roughly $383 and $395 as the recovery pauses. Bear: $383.35 breaks and price loses $380, increasing the risk of a deeper retracement within the weekly range. Considerations: Tesla can react sharply to production updates, earnings expectations and autonomy-related headlines. Token prices can also diverge from the underlying shares when liquidity thins or traditional markets are closed. The immediate setup favors waiting for confirmation: proximity to resistance is not evidence that resistance has been overcome. Not financial advice. #WSOT2026


$METAXUSDT is trading at $628.56, down 3.46% over the last 24 hours. The token is pulling back after a recent recovery, with the $623 area now acting as the first test. The question is whether buyers can defend that level and push price back toward $650, or whether the move has already lost momentum. This is the Meta Platforms tokenized stock, not the original META share. Chart: The reported 24h range is $623.51 to $651.47, while the recent seven-day range is roughly $587.53 to $650.94. Price is sitting close to the lower end of today’s range after failing to hold above $650. The broader setup is mixed. METAX is still above the recent weekly low, but the rejection near $650 means buyers have not confirmed a clean continuation. A break below $623 would weaken the recovery structure and bring the lower $587 area back into focus. News: The main narrative around Meta remains its spending on artificial intelligence and the metaverse. One report suggested that reduced metaverse spending helped the METAx token rise earlier, but that headline is not a fresh operational development for Meta itself. The more important question is whether Meta’s AI investment can produce enough revenue and earnings growth to justify the company’s valuation. For METAX, the token follows the underlying Meta share rather than creating its own independent catalyst. Fundamentals: METAX is a tokenized representation of Meta Platforms stock, backed 1:1 by underlying shares held with a third-party custodian. Its value depends on Meta’s earnings, advertising business, AI spending, user growth and operating margins. The token does not provide the same shareholder rights as directly owning META shares. It also carries issuer, custody, liquidity and token-market risks in addition to the normal risks of investing in Meta. Sentiment and narrative: The current narrative is shifting between two ideas: Meta’s AI opportunity and concern over the size of its spending commitments. Bulls see AI infrastructure and monetization as the next growth engine. Bears are watching whether those investments reduce margins before they generate meaningful returns. That creates a more cautious setup than a simple bullish technology story. The price needs to reclaim the upper range before sentiment looks decisively stronger. Ecosystem: METAX is part of the tokenized-equity market, allowing Meta exposure through blockchain-based trading. It can trade beyond traditional stock-market hours, but the token may not move exactly in line with META during periods of thin liquidity or when the underlying market is closed. Its ecosystem is tied to Meta’s stock, the xStocks structure, custodians and supported exchanges. There is no separate METAX product economy to support the price. Momentum: Short-term momentum is negative, with METAX down 3.46% in 24 hours. Reported spot volume is around $203K on one market snapshot, while broader aggregated trackers show much higher activity. The difference suggests that liquidity varies significantly between venues. The immediate signal is weak because price is falling from the $650 area. Buyers need to absorb the pullback around $623 before the chart can regain a constructive shape. Key levels: Support: $623.51 first, then $600, followed by the seven-day low near $587.53. Resistance: $640 to $648 first, then $650.94 to $651.47. I want a 2H close back above $651.47 on rising spot volume before treating this as a confirmed breakout. Scenarios: Bull: buyers defend $623, reclaim the $640–$648 area and clear $651.47, opening the way toward higher levels. Base: METAX ranges between roughly $600 and $650 as the market waits for clearer direction from Meta’s underlying stock. Bear: $623 breaks, the recovery fails and price retests $600 or the $587.53 weekly low. Considerations: METAX is not a meme coin and its price is not driven mainly by crypto sentiment. The main drivers are Meta’s earnings, AI spending, advertising performance and the valuation of the underlying stock. Token liquidity can also be thinner than Meta’s traditional share market, which may create wider spreads and sharper moves. A strong Meta business does not guarantee a strong METAX chart if token demand or market liquidity weakens. Not financial advice. #WSOT2026


$XAUTUSDT turun 1,5% dalam 24 jam meskipun masih mencatatkan kenaikan mingguan sebesar 2,3% dalam snapshot spot yang diambil. Pertanyaannya adalah apakah pembeli dapat mempertahankan level $4.000 dan membangun kembali momentum menuju $4.125, atau apakah pemulihan mulai memudar. Ini adalah Tether Gold, bukan stablecoin yang dipatok ke dolar. Grafik: Harga berada di $4.035,79, dengan kisaran 24 jam antara $4.003,65 hingga $4.107,91. Kisaran tujuh hari adalah $3.925,67 hingga $4.125,06. Harga berada di dekat batas bawah kisaran harian, menyisakan ruang yang sempit sebelum area $4.000 berada di bawah tekanan. Pemulihan mingguan tetap utuh dalam kisaran tersebut, tetapi pembeli belum berhasil menembus level tertinggi $4.125,06. Ini adalah angka spot agregat, dan harga di masing-masing bursa bisa berbeda. Berita: Pembaruan cadangan terbaru Tether melaporkan sekitar 25,7 ton emas fisik yang mendukung XAUT, dengan nilai $3,44 miliar pada akhir kuartal. Cadangan telah tumbuh 59% sejak akhir tahun sebelumnya. Itu menunjukkan ekspansi produk, bukan peningkatan otomatis pada nilai setiap token. Sebuah laporan terpisah mengidentifikasi 2.000 XAUT yang berpindah ke Binance, tetapi deposit ke bursa bukanlah bukti penjualan. Fundamental: Setiap XAUT mewakili hak kepemilikan atas satu troy ounce emas fisik pada batangan emas tertentu. Nilainya terutama bergantung pada emas, bukan pada pendapatan proyek, pembakaran token, atau perhatian komunitas. Suku bunga riil, kekuatan dolar, dan permintaan akan aset defensif adalah pendorong utamanya. Dukungan fisik menambatkan token ke sebuah aset, tetapi tidak mencegah kerugian ketika harga emas turun. Sentimen dan Narasi: Narasinya adalah emas dengan aksesibilitas kripto. Investor dapat memperoleh eksposur ke emas batangan tanpa harus menyimpannya secara pribadi, sambil tetap memiliki kemampuan untuk mentransfer dan memperdagangkan token tersebut. Pertumbuhan cadangan mendukung proposisi tersebut, tetapi penurunan harian menunjukkan bahwa pasar tidak hanya sekadar membeli cerita tersebut. Aset defensif masih bisa mengalami koreksi tajam. Ekosistem: XAUT berada di antara penyimpanan emas fisik dan infrastruktur perdagangan digital. Ekosistemnya terdiri dari penerbit, kustodian, jaringan blockchain, dan bursa, bukan platform aplikasi yang berdiri sendiri. Transparansi cadangan, transfer yang andal, dan ketentuan penukaran lebih penting di sini daripada keterlibatan sosial atau sensasi pengembang. Momentum: Volume perdagangan 24 jam yang dilaporkan adalah sekitar $164,91 juta, dengan aktivitas turun sekitar 4,2% dari hari sebelumnya. Harga tergelincir seiring dengan volume yang lebih lemah, yang tidak menunjukkan akumulasi agresif maupun aksi jual yang penuh keyakinan. Pembeli perlu merebut kembali kisaran atas sebelum pemulihan terlihat lebih kuat. Level kunci: Support: $4.003,65 pertama, bersama dengan area psikologis $4.000, kemudian $3.925,67, titik terendah tujuh hari. Resistance: $4.107,91 pertama, kemudian $4.125,06, titik tertinggi tujuh hari. Saya ingin penutupan 2 jam di atas $4.125,06 dengan volume spot yang meningkat sebelum menganggap ini sebagai breakout. Skenario: Bull: pembeli mempertahankan $4.000, merebut kembali $4.107,91 dan menembus $4.125,06, memungkinkan pemulihan melampaui kisaran mingguan. Base: XAUT diperdagangkan antara kisaran $4.000 dan $4.125 saat momentum stabil. Bear: $4.000 gagal bertahan, dan XAUT menguji kembali $3.925,67. Penembusan di bawah level tersebut akan merusak pemulihan mingguan. Pertimbangan: Dolar yang lebih kuat atau imbal hasil riil yang lebih tinggi dapat menekan emas bahkan ketika permintaan untuk emas yang ditokenisasi sedang tumbuh. XAUT juga membawa risiko penerbit, kustodian, blockchain, dan likuiditas bursa. Penukaran fisik memiliki persyaratan verifikasi, jumlah minimum, dan biaya. Cerita dukungannya konstruktif, tetapi pertanyaan perdagangan jangka pendek tetap pada apakah $4.000 dapat bertahan. Bukan saran keuangan. #WSOT2026


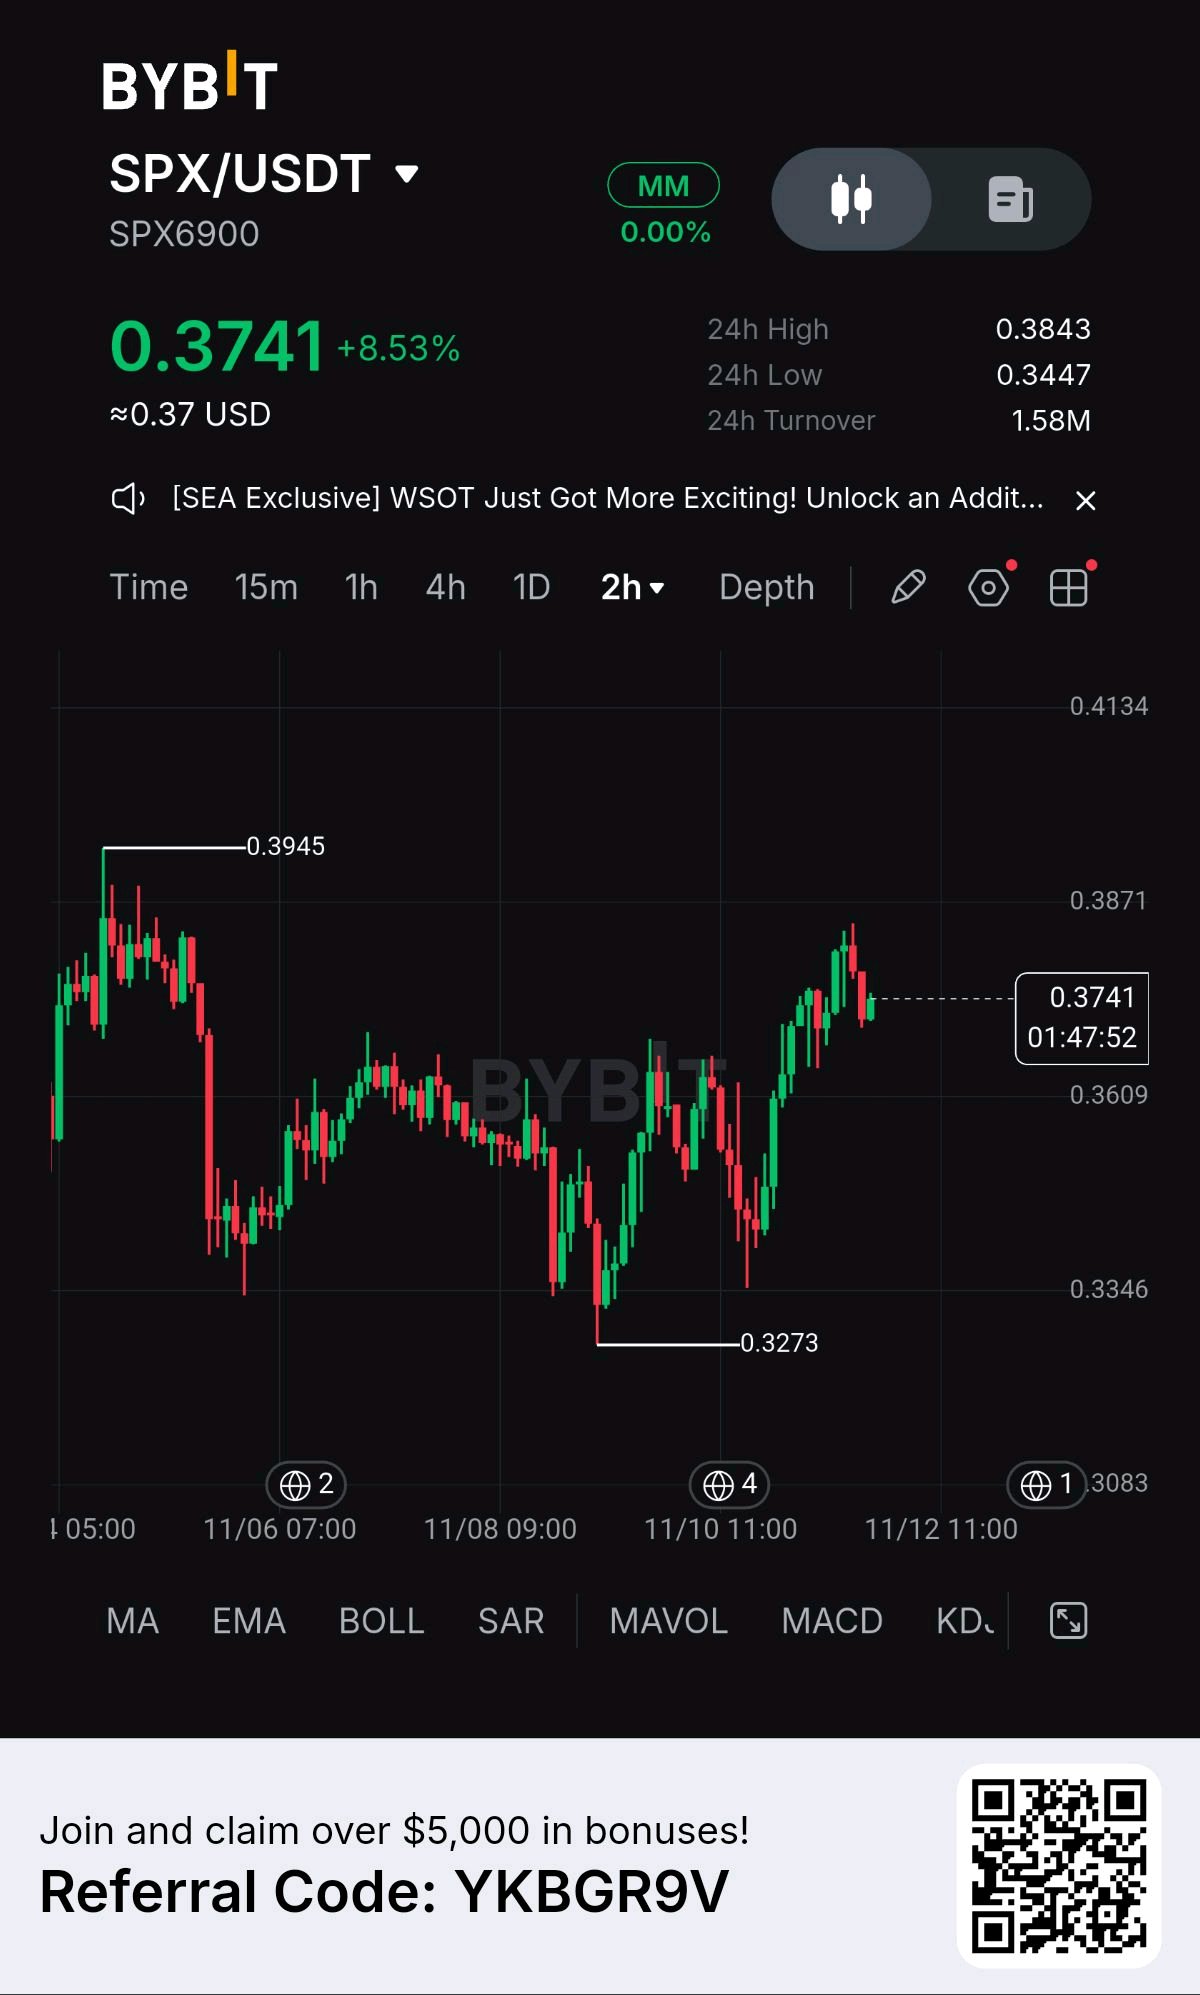
$0.52 Target Reaffirmed: $SPX Double-Bottom Rebound & Liquidity Sweep Market News & Macro Catalysts ✔ Bybit Spot Liquidity & Volume: SPX6900 ($SPX) traded up +8.53% to $0.3741 on Bybit, generating a robust 24-hour turnover volume of $1.58M across high-frequency derivative desks. ✔ Meme Sector Risk Rotation: As broader crypto market volatility clears, speculative liquidity is re-entering top-tier culturally driven meme assets, with $SPX holding a dominant market position across multi-chain ecosystems (Ethereum, Base, Solana). ✔ Fully Circulating Token Metrics: $SPX features zero token unlock overhang with 931M tokens fully circulating, mitigating continuous inflation selling pressure during demand expansion phases. ✔ Intraday Trading Range: Price action established a firm 2-hour baseline floor between a session low of $0.3447 and a high of $0.3843, effectively reclaiming value above the $0.3600 structural pivot zone. Market Analysis & Price Action The 2-Hour Liquidity Sweep: 2-Hour $SPX price action at $0.3741 executed a precise double-bottom liquidity sweep at the $0.3273 local swing floor, initiating a rapid V-shape recovery impulse. The Overhead Supply Test: The strong green momentum expansion pushed directly back toward the structural breakdown resistance zone near $0.3871, aiming to invalidate the local lower-high corrective channel from the $0.3945 peak. Current Momentum: Immediate market structure reflects aggressive buyer absorption, with higher lows being defended off the $0.3273 baseline sweep. Liquidity Targets: Downside sell-side liquidity rests below $0.3273. On the upside, immediate buy-side liquidity sits at $0.3871, with secondary macro expansion targeting $0.4134 and $0.5200. Support and Resistance Levels ✔ Immediate Support: $0.3609 – $0.3650 (Local 2-hour demand & breakout pivot floor) ✔ Invalidation Support: $0.3273 (Major structural swing low & double-bottom defense level) ✔ First Resistance Target: $0.3871 – $0.4134 (Immediate overhead supply zone & swing peak) ✔ Macro Resistance Target: $0.5200 – $0.6500 (Major trend expansion peak target zone) Risk Management Rule: A 2-hour close below $0.3273 invalidates the immediate bullish reversal setup and opens downside risk toward lower liquidity pools at $0.3083. Maintain strict position sizing limited to 1–2% of total trading equity. $SPXUSDT $INITUSDT #WSOT2026 #USInflationRunsHotAndRateHikeBetsRise #AnthropicIPOTestsTheAIBoom
I’m reviewing SPCX’s outlook.I’m assessing SPCX’s setup.I’m checking SPCX’s levels.SPCX is recovering, but the next resistance zone will tell us more than the bounce itself. Using the SPCX perpetual market’s 4 hour levels, I am watching $144.58 to $146.64 as the first resistance area. A sustained break above it, followed by a successful retest, would strengthen the recovery case. The next references are $147.88 to $148.54, then $151.79 to $152.34. On a pullback, $142.17 is a potential retest level rather than confirmed support. If buyers cannot establish a floor there, the stronger calculated support references sit around $133.34 to $135.24. Below that, $129.54 to $130.83 becomes the next area to monitor. The available headlines include reports of ARK Invest adding SPCX exposure. That provides some institutional context, but it does not prove that institutional buying is driving the current recovery. Reports of losses on leveraged equity positions are also a reminder that a compelling company narrative does not protect a trade from drawdowns. My take is cautiously constructive, with confirmation still needed. I would rather see SPCX reclaim $146.64 and defend it than assume every bounce is the start of a sustained rally. Repeated rejection around that zone would keep the recovery vulnerable. World economic conditions, financing costs and appetite for growth stocks can influence sentiment. These levels apply to the perpetual instrument, whose price can differ from the underlying shares. For me, $144.58 to $146.64 is the immediate test. Clearing it would improve the setup. Failing there would call for patience. $SPCXXUSDT $TSLAXUSDT #WSOT2026 #USInflationRunsHotAndRateHikeBetsRise #BitcoinHitsTwoMonthLowAfterUSMidterms


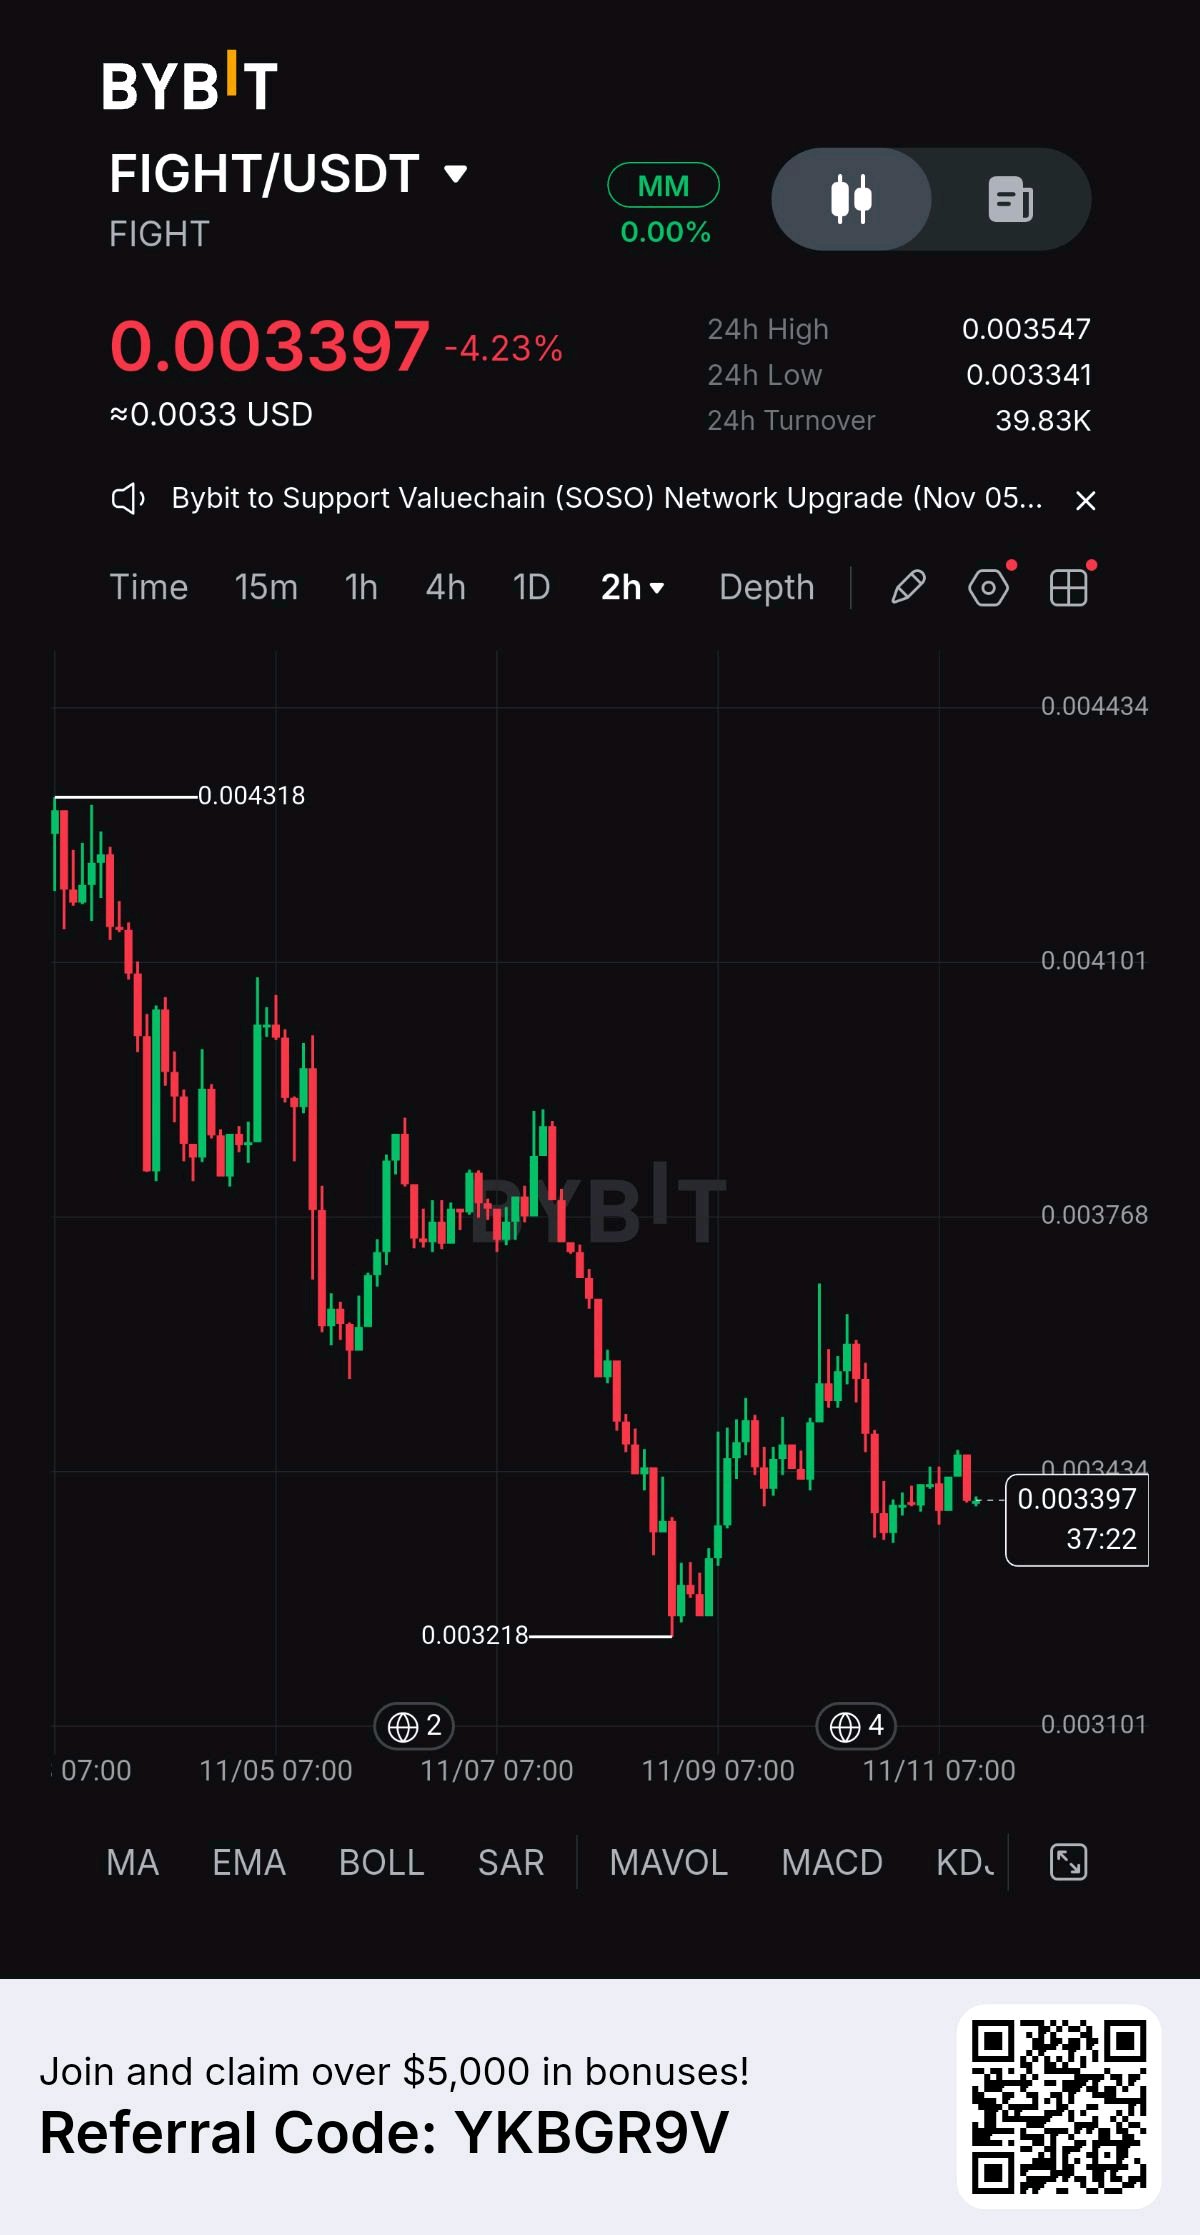
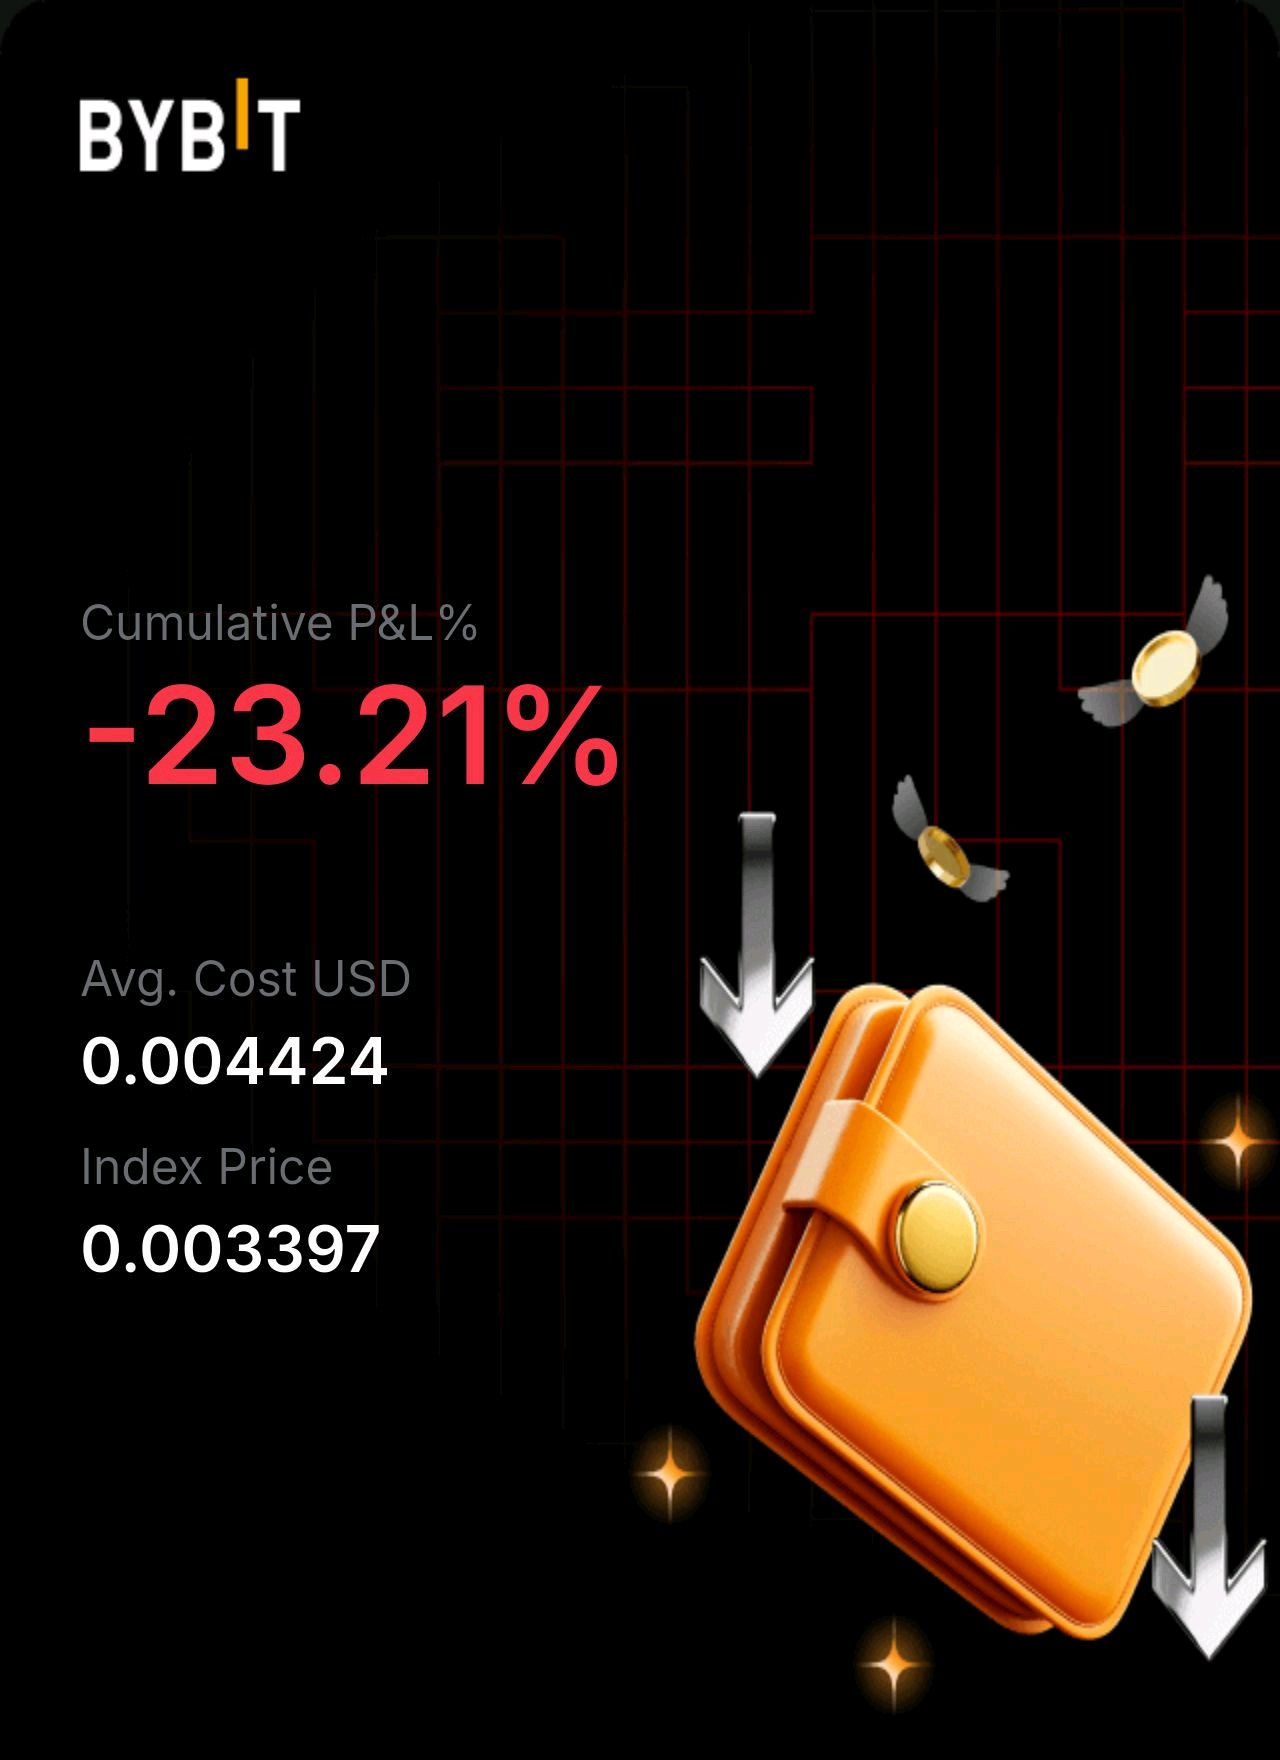
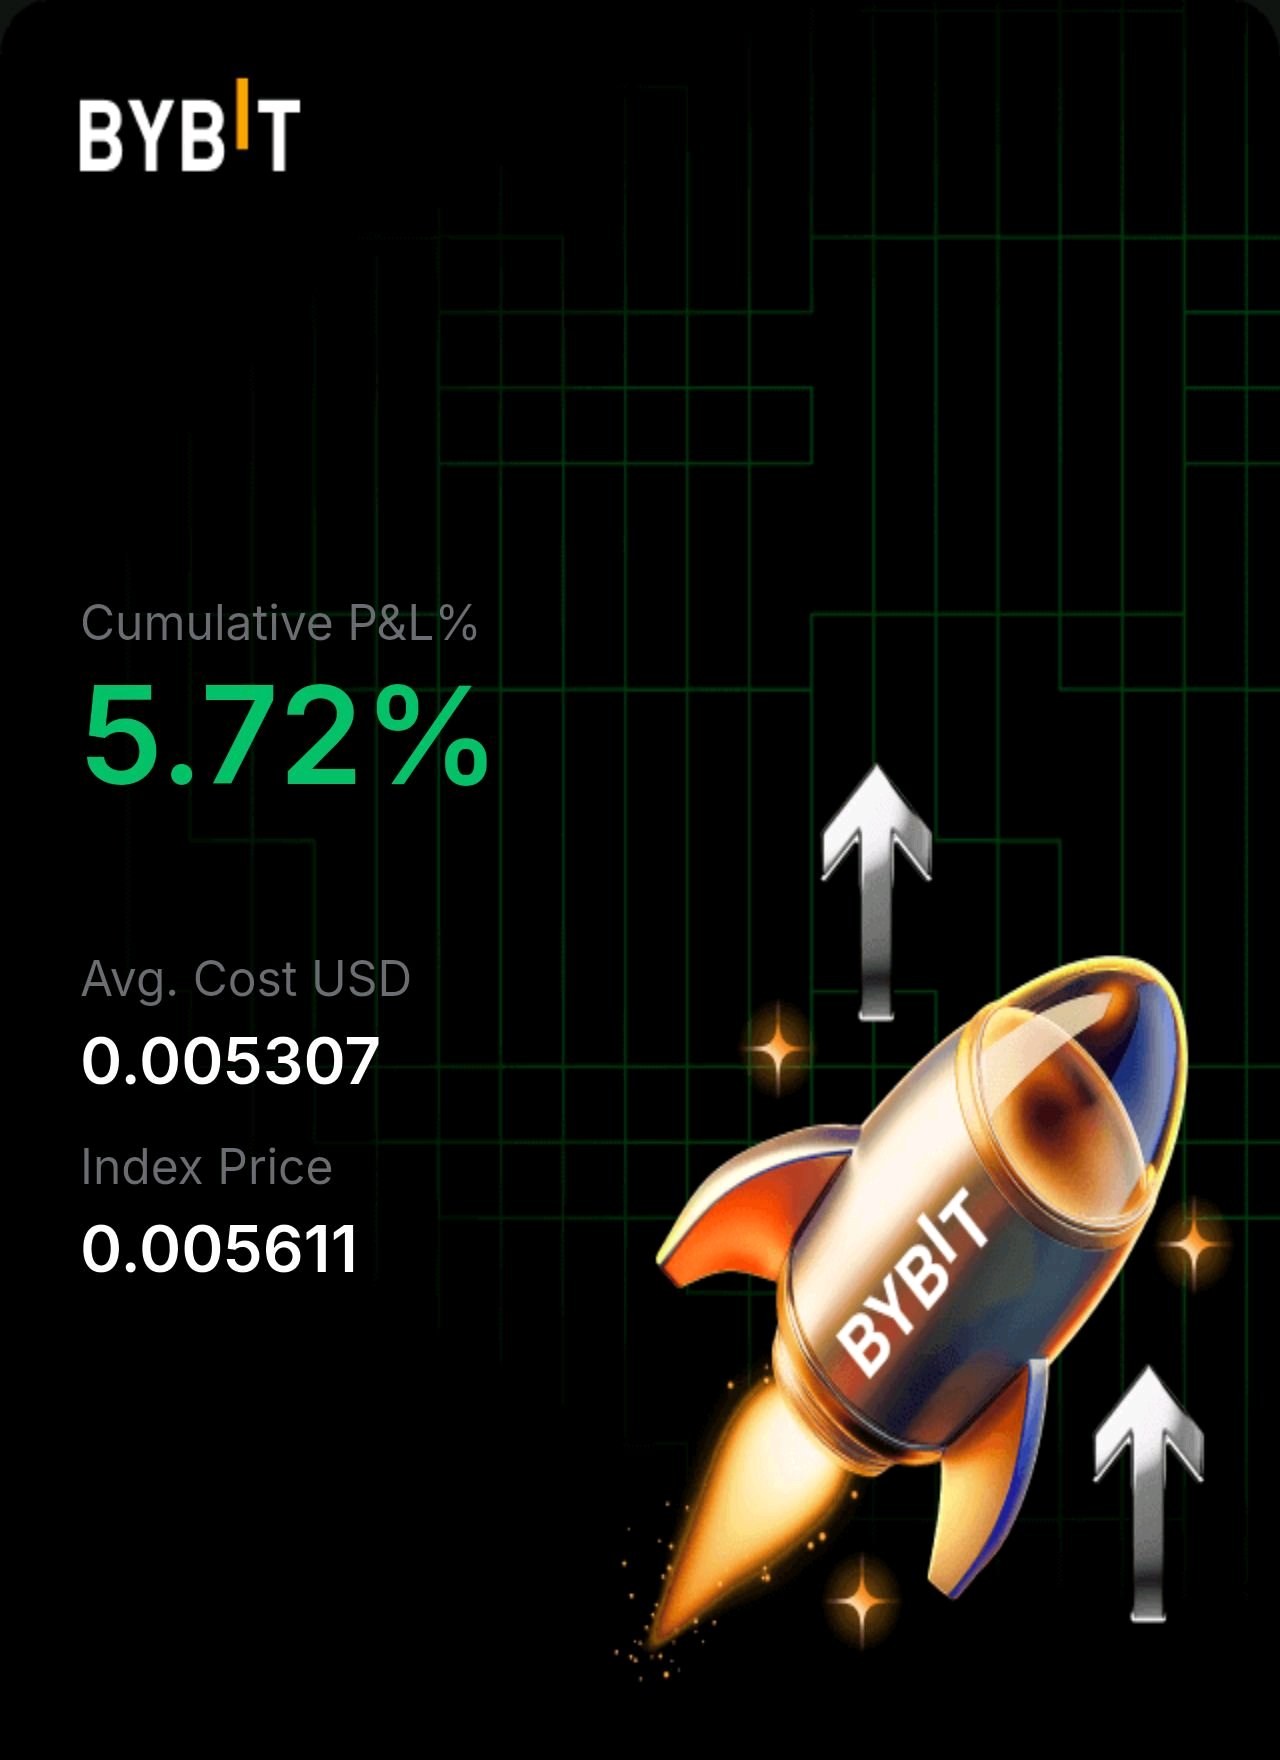
FIGHT ($FIGHT) Market Analysis & Position Rationale Position Disclosure & Rationale I have actively purchased FIGHT tokens at an average entry cost of $0.004424, which is currently sitting at a cumulative unrealized loss of -23.21% as price trades near $0.003397 (Not Financial Advice, DYOR). My decision to enter this position was driven by anticipating a momentum breakout following range consolidation near $0.004400, though the asset subsequently experienced extended downward expansion toward lower structural support bases before stabilizing near $0.003218. Market Drivers & Overview Token Overview & Market Narrative: FIGHT serves as the primary utility and governance token for Fight.ID, a Web3 combat sports fan ecosystem and identity platform backed by the Fight Foundation. Operating natively across high-throughput networks and featuring an official Web3 partnership with the UFC, the platform allows users to build on-chain reputation through non-transferable Fighting Points (FP), access exclusive sports content, and participate in predictive event markets. Key News & Catalysts Driving Sentiment: Subdued 24-Hour Turnover & Consolidation (-4.23%): The 2-hour chart highlights ongoing downward drift from the $0.004318 swing peak down to test a local floor near $0.003218, with 24-hour volume reaching $39.83K. Ecosystem Execution & Telegram Drops: Ongoing engagement through UFC digital collectible drops and Fighter Community staking portals continues building protocol utility, although market sentiment remains constrained by broader micro-cap altcoin liquidity contractions. Why Traders & Investors Consider Allocating: Tier-1 Sports IP & Web3 Integration: Direct licensing ties with UFC combat sports events establish a recurring revenue flywheel driven by fan acquisition and token burning mechanisms. Asymmetric Mean-Reversion Potential: Following deep intraday pullbacks (-23.21% from entry), structural double-bottom stabilization around major demand floors offers potential rebound setups toward overhead cost-basis resistance. Technical Analysis & Key Levels Resistance Levels $0.003768 (Localized Overhead Supply Zone) $0.004424 (Average Buy Cost Basis & Structural Resistance Peak) Support Levels $0.003341 (Immediate Dynamic Support Baseline Floor) $0.003218 (Critical Capitulation Bottom & Demand Base) Candlestick & Metric Patterns to Watch: Capitulation Wick & Higher-Low Defense: The 2-hour chart shows price printing a sharp capitulation wick down to $0.003218 before staging a minor V-shaped bounce toward $0.003397, signaling early absorption by buyers. Compression Below Dynamic Resistance: Spot trades near $0.003397 below short-term moving average ribbons. Buyers are attempting to build a sustainable consolidation base above the $0.003341 dynamic floor to setup a recovery wave toward the $0.003768 supply zone. Bulls must defend the $0.003218–$0.003341 support base to prevent further downward structural breakdown. A verified 2-hour close above $0.003768 is required to initiate a broader recovery rally back toward the $0.004424 entry cost basis. Maintain disciplined risk management and position control when managing drawdown scenarios in high-beta assets. $FIGHTUSDT $OPGUSDT #WSOT2026 #USInflationRunsHotAndRateHikeBetsRise #AITechSelloffErases2Point5TrillionFromNasdaq100
I’m reviewing $TSLAX.I’m assessing Tesla’s outlook.I’m checking $TSLAX’s drivers.is rising while Tesla faces difficult questions about Cybertruck. Is the market looking beyond a struggling product, or getting ahead of itself on what comes next? That tension is more important than the green price change. is trading at $386.17, up 3.14% over 24 hours. The move shows positive momentum, but trading volume remains unverified, so it does not establish broad buying conviction. Crypto sentiment reads fear at 29, although that is not a direct measure of Tesla investor confidence. offers tokenized Tesla exposure, with issuer and liquidity risks beyond the underlying business. [Bloomberg reports] that Tesla will refund Cybertruck deposits for a considerable number of customers. Separate coverage reports a planned production line shutdown. These developments raise questions about product demand and capital allocation. Tesla’s autonomy narrative still offers potential, but future ambitions must translate into commercial results rather than simply offset disappointing headlines. My view is positive on momentum, cautious on confirmation. Available price structure data does not support credible support or resistance levels, and older token listings or promotions do not explain this gain. A stronger bullish case needs sustained buying alongside evidence of improving vehicle margins, demand, and profitable execution. The rebound deserves attention, but the business still needs to justify the optimism. $TSLAXUSDT $SPCXXUSDT #WSOT2026 #NovUSCPIWatch #AITechSelloffErases2Point5TrillionFromNasdaq100


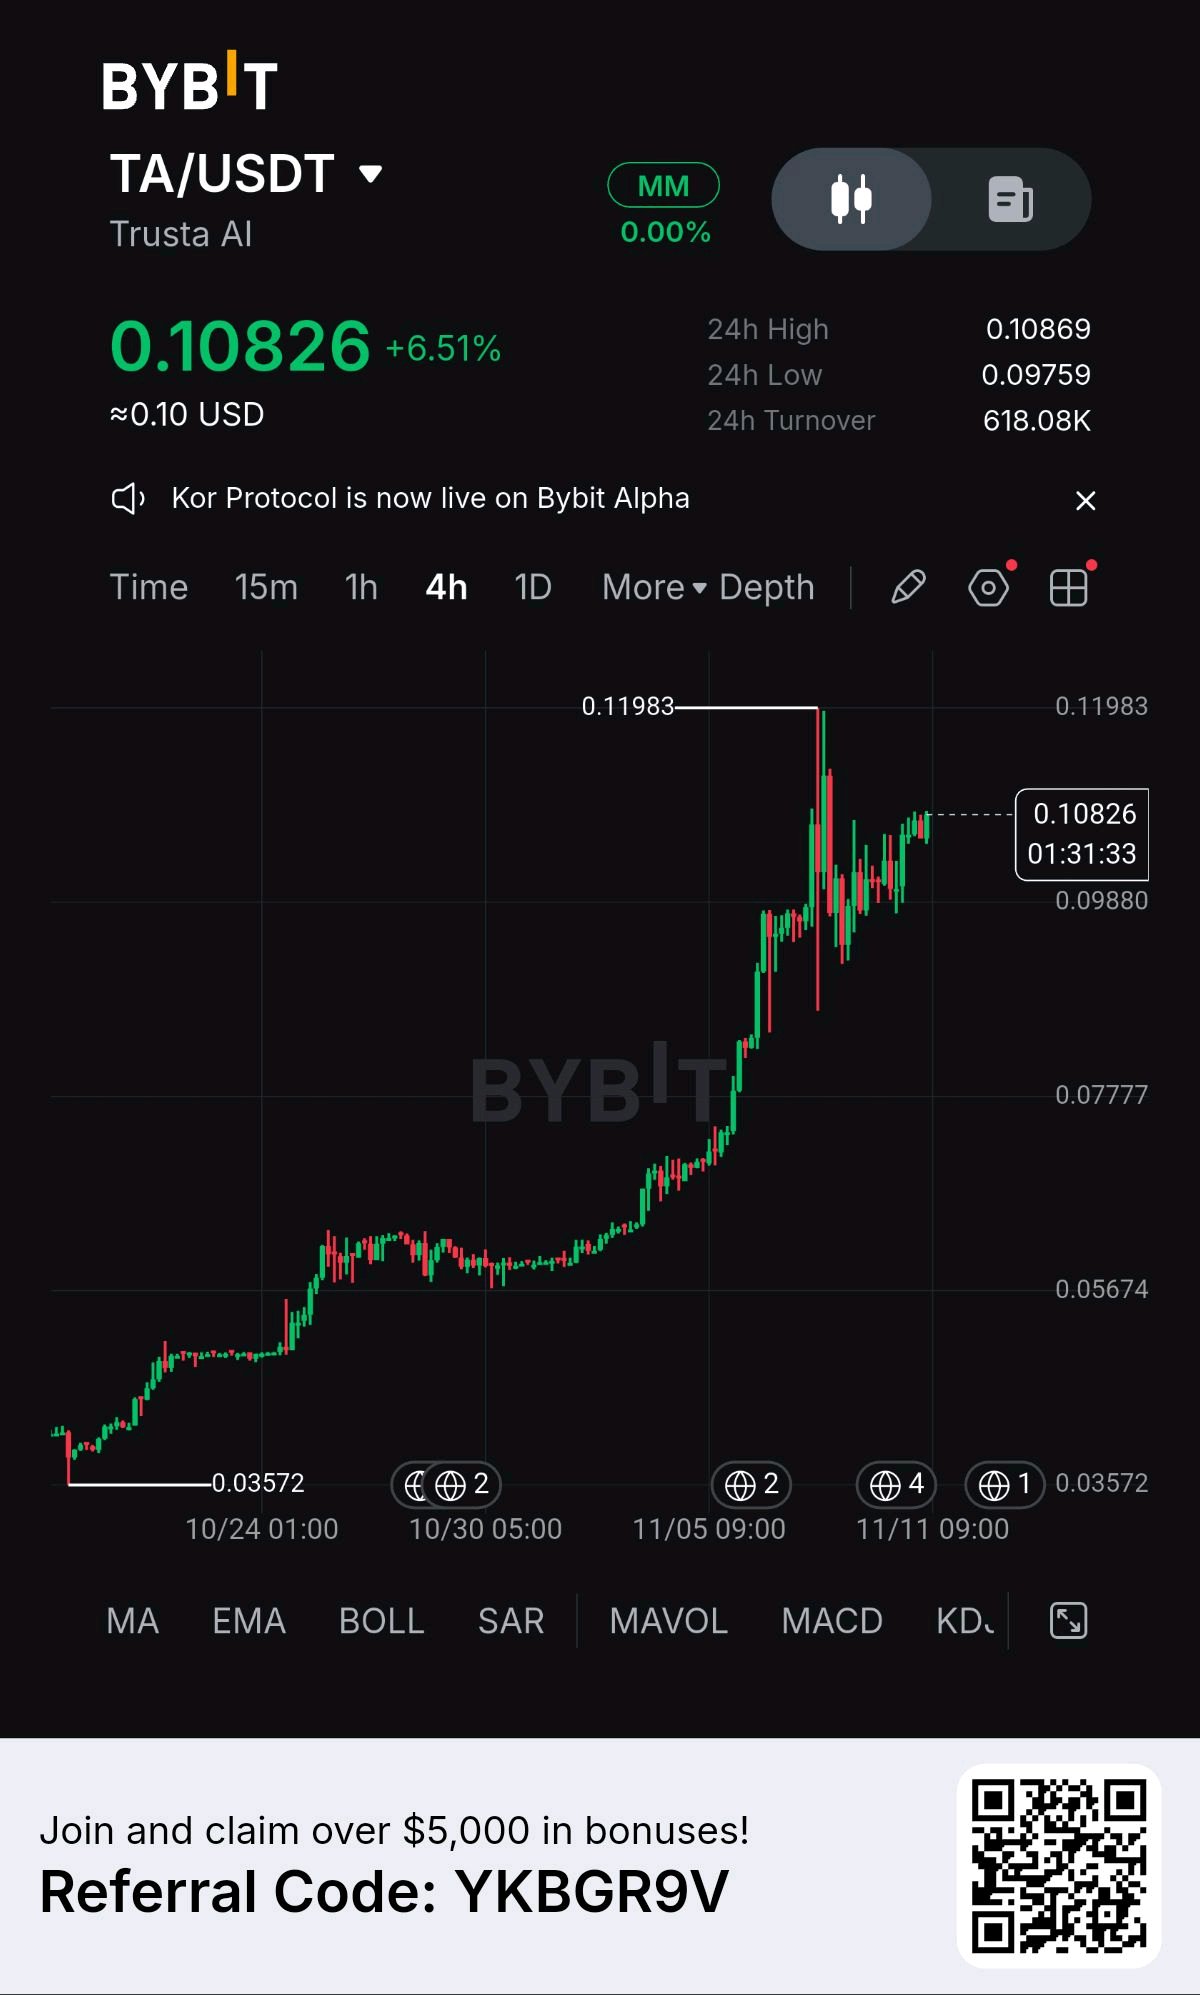
$0.15 Target Reaffirmed: $TA Parabolic Expansion & AI Data Base Market News & Macro Catalysts ✔ Bybit Spot Liquidity & Turnover: Trusta AI ($TA) registered a +6.51% intraday gain to trade at $0.10826 on Bybit, backed by 24-hour trading turnover volume of $618.08K. ✔ AI Identity & On-Chain Reputation Infrastructure: Trusta AI's core scoring engine continues to expand adoption across Layer-1 and Layer-2 ecosystems, providing Sybil attack prevention and verifiable identity metrics for Web3 protocols. ✔ Bybit Ecosystem Rotation: The debut of Kor Protocol on Bybit Alpha has catalyzed speculative liquidity rotation across early-stage AI agent and data-management protocols on the exchange. ✔ Intraday Range Stability: Price action established a firm 4-hour trading baseline between a session low of $0.09759 and a high of $0.10869, sustaining its structural uptrend off recent accumulation floors. Market Analysis & Price Action The Parabolic Trend Vector: 4-hour $TA price action at $0.10826 shows a powerful macro trend expansion originating from the $0.03572 accumulation base. The Overhead Supply Test: Following a sharp spike to the $0.11983 local swing peak, price action consolidated into a higher low at $0.09880 before resuming its upward trajectory to retest local high supply. Current Momentum: Market structure is aggressively bullish, with buyers defending step-up support levels ($0.03572 → $0.05674 → $0.07777 → $0.09880) to maintain upward momentum. Liquidity Targets: Downside sell-side liquidity rests below $0.09880. On the upside, immediate buy-side liquidity sits at $0.11983, with secondary macro expansion targeting $0.13500 and $0.15000. Support and Resistance Levels ✔ Immediate Support: $0.09880 – $0.10200 (4-hour local consolidation shelf & higher-low demand floor) ✔ Invalidation Support: $0.07777 (Major structural swing breakdown level) ✔ First Resistance Target: $0.11983 – $0.13500 (Immediate local peak & expansion supply zone) ✔ Macro Resistance Target: $0.15000 – $0.18000 (Major historical price discovery target zone) Risk Management Rule: A 4-hour close below $0.07777 invalidates the immediate parabolic continuation thesis and opens risk toward lower liquidity brackets at $0.05674. Maintain strict position sizing limited to 1–2% of total trading equity. $TAUSDT $COREUSDT #WSOT2026 #WSOTPicktoEarn10U #NovUSCPIWatch
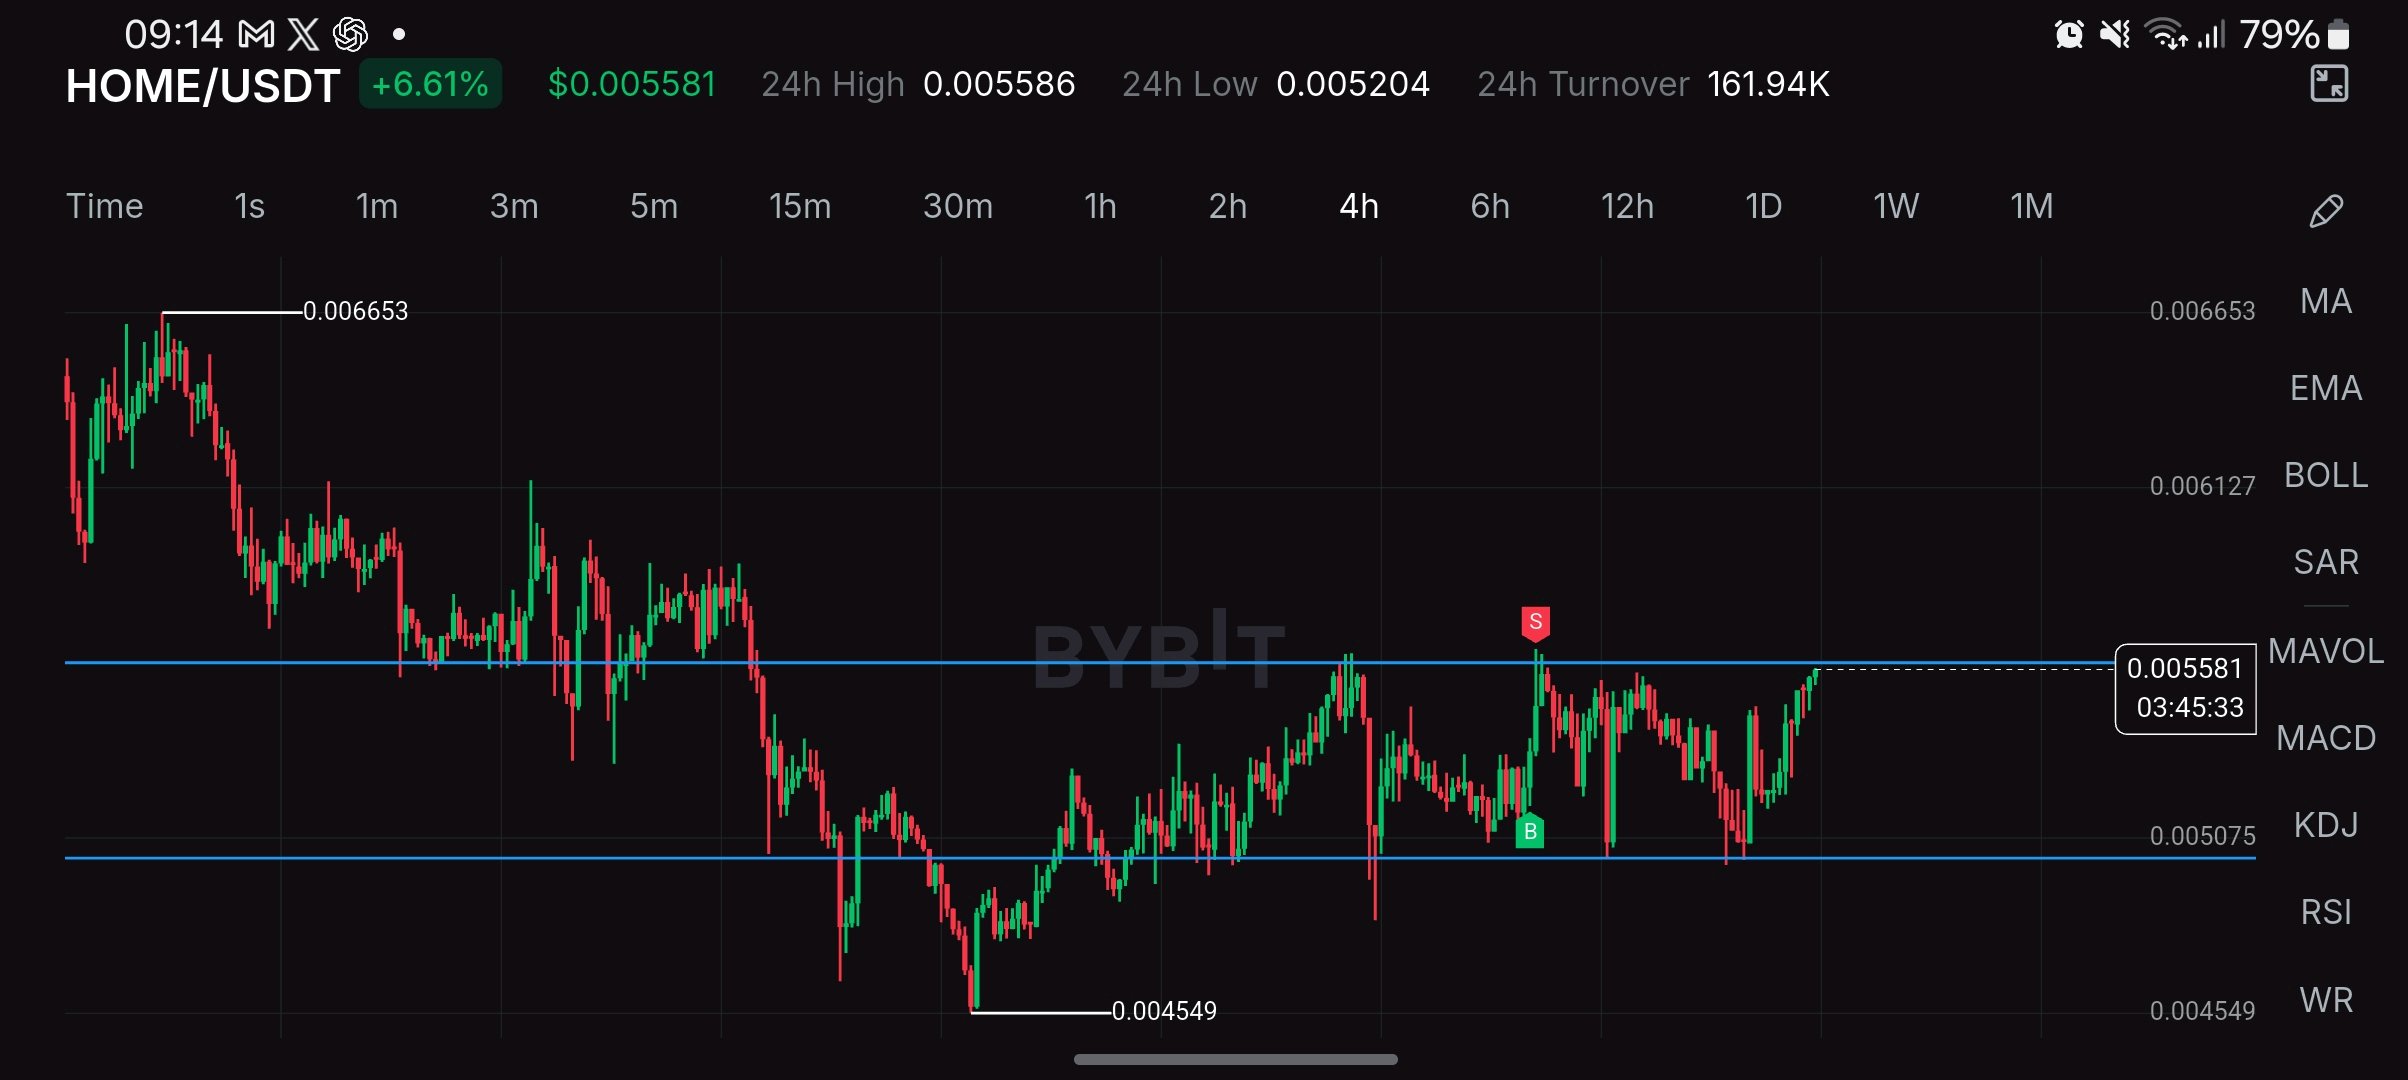
$HOME: Testing the $0.0056 Ceiling
$HOME is pushing into the same ceiling that has rejected it several times in recent weeks. Today's 6.6% move is happening on low volume, so the real test is what comes next. What the 4H chart shows: Price is $0.005581, right at the upper edge of a range between about $0.0051 and $0.0056. Every push into $0.0056 has been rejected, including the sharp wick that printed a sell signal, and every dip toward $0.0051 has been bought. The 24h range is $0.005204 to $0.005586, so price is sitting exactly at the top. The bigger picture is still bearish: the structure is lower highs from $0.006653, and the yearly low is $0.004549. 24h turnover on Bybit is only about $162K, so a breakout without strong volume would be suspect. What's happening: There is no fresh project news this week. The main story is the tokenomics. Defi App uses 80% of protocol revenue for weekly on-chain buybacks, and when that was confirmed in August, $HOME jumped 13%. Upbit also listed HOME around then, which added Asian retail demand. The roadmap includes a physical debit card and prop trading in Q4 2026, which could be a catalyst if it ships. The headwind is supply: only about 4.36B of the 10B tokens are circulating, so roughly 56% is still to come from team, investor and ecosystem unlocks over the next years. That limits how far rallies can go. China and the global backdrop: China's Q3 GDP grew 4.5%, beating forecasts, and the yuan hit a 4-year high. For China, that means steadier policy and less need for emergency stimulus. For the world, stronger Asian growth supports risk appetite, and Asian retail access (like the Upbit listing) matters for a token like $HOME. The link is indirect, since China restricts crypto trading, and the beat is export-led with retail sales up only 1.1%. For $HOME, trading volume on Defi App (which drives buybacks) and Bitcoin's direction matter far more than China data. Key levels: Support: $0.0052 to $0.0051 first, then $0.004549 (the yearly low). A break below $0.0051 would reopen the move to the lows. Resistance: $0.0056 first, then $0.006127, then $0.006653 (the swing high). I want a 4H close above $0.0056 on rising volume before I treat this as a breakout. Scenarios: Bull: volume picks up, buyers close above $0.0056, and $HOME heads toward $0.006127. Base: $HOME gets rejected again and ranges between $0.0051 and $0.0056. Bear: sellers take control, $0.0051 breaks, and $HOME retests the $0.004549 low. Honest risk: thin liquidity means breakouts can fail fast, and the large locked supply is a constant overhang. Not financial advice. Does the fourth test of the ceiling finally break it? $HOMEUSDT $ICPUSDT #WSOT2026 #WSOTPicktoEarn10U #NovUSCPIWatch
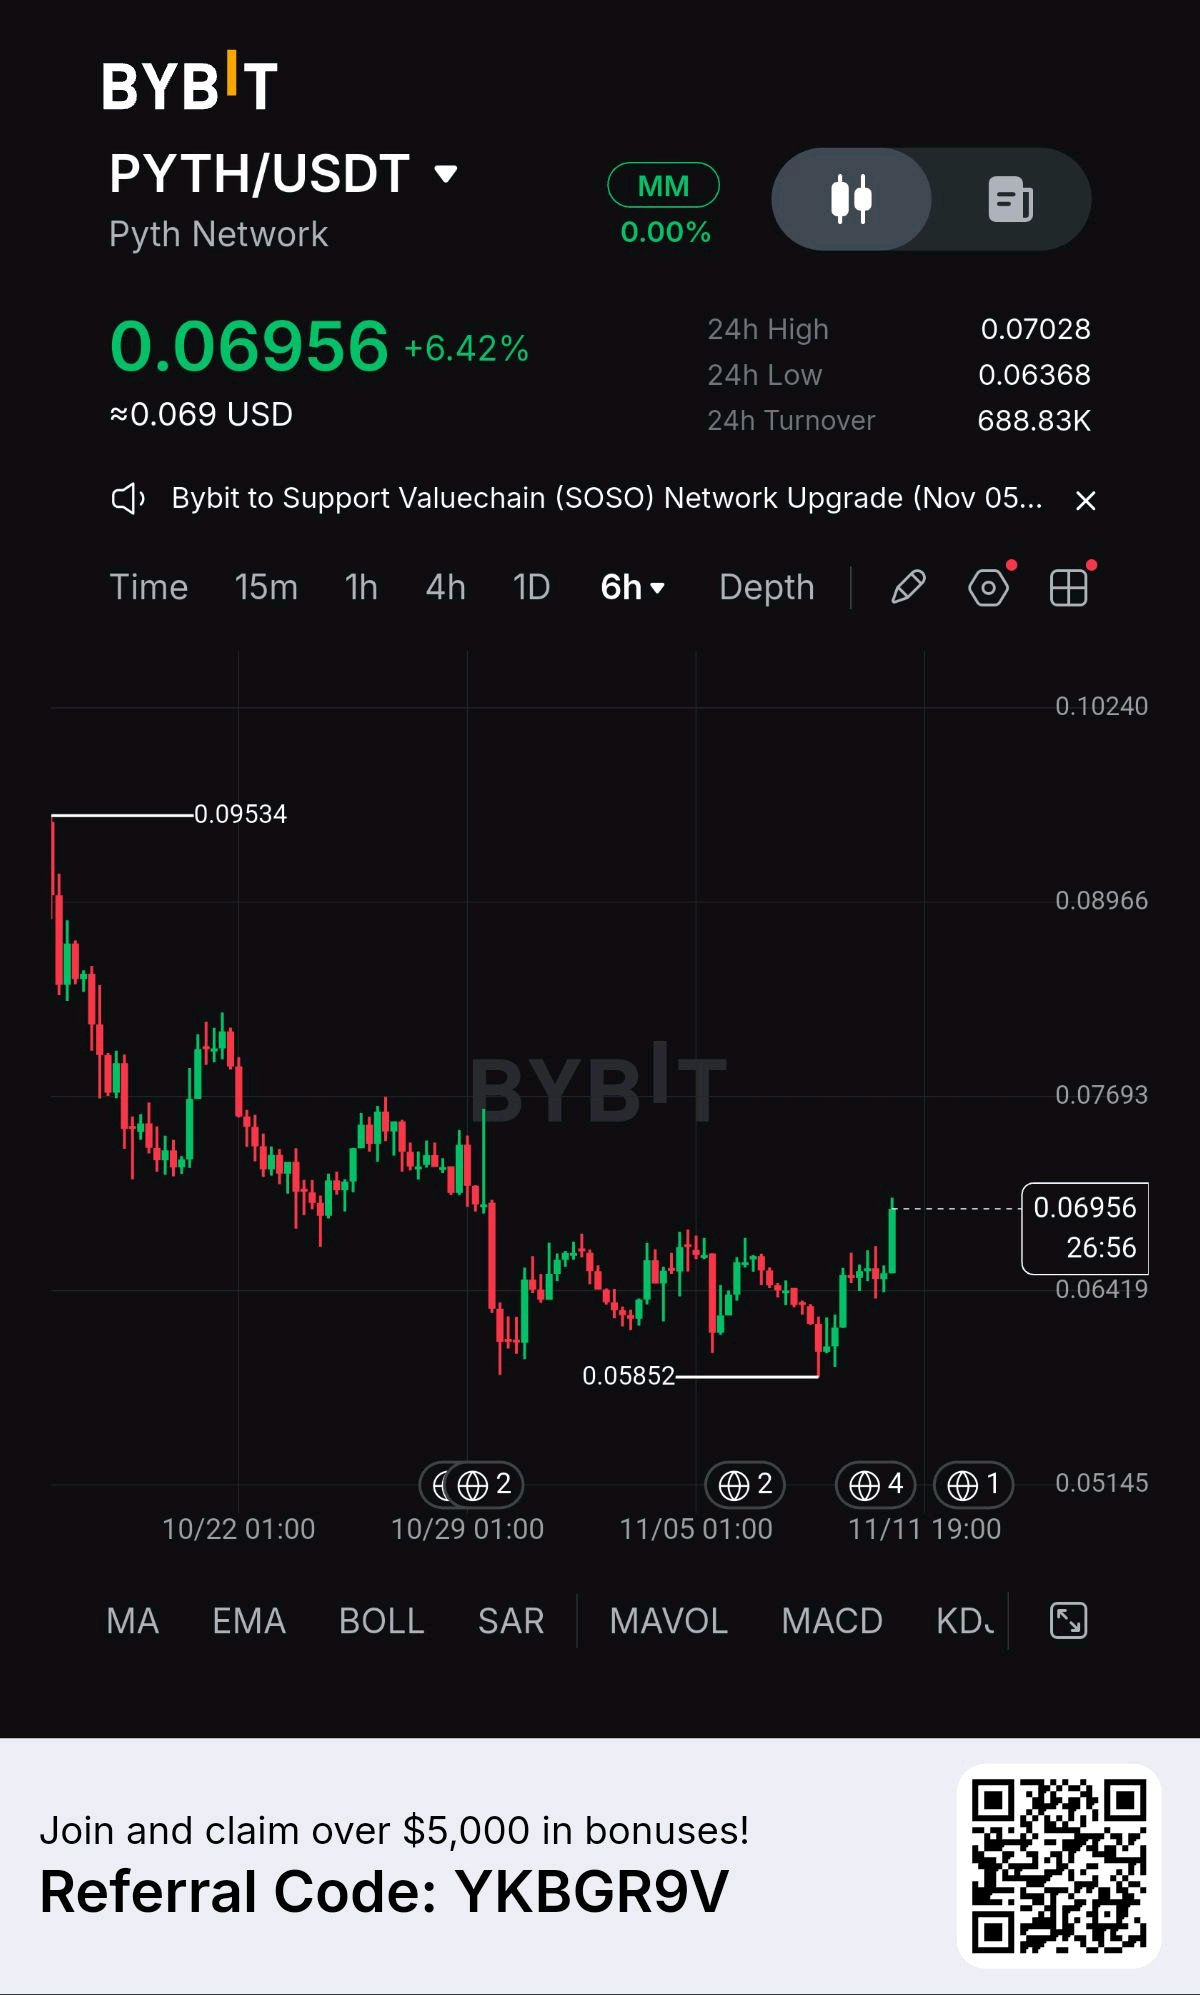
$PYTH: Range Breakout, Now the Retest 🧵
1/ PYTH is trading at $0.06956, up 6.42%, after a 24h range of $0.06368-$0.07028. On the 6h chart, price spent about two weeks in a $0.0585-$0.068 range after falling from the $0.09534 high. A double bottom at $0.0585-$0.0587 (Oct 30 and Nov 8-9) held both times, and today's candle has pushed above the range top. 2/ The honest read: this is a breakout from a range, but it's day one. The old range top at $0.0675-$0.068 should now act as support, and a retest that holds is the confirmation. The measured move (range height added to the top) points to about $0.0775, which lines up with the $0.0763-$0.077 resistance from the late-October swing highs. Turnover of 688.83K is solid for the move. 3/ News context: trackers show no PYTH-specific catalyst for the recent moves, only normal volatility and broad market direction. The project side is steady. Monthly recurring revenue is growing (ARR reached about $13.7M in October), DAO revenue funds PYTH buybacks, and the network has added pre-IPO price indices for leading AI companies and continuous pricing for oil and metals. The token is worth about $550M and is still roughly 94% below its $1.20 all-time high, though about 133% above its June 2026 low. 4/ China's GDP: Q3 grew 4.5% (beating the 4.4% forecast), and the nine-month pace of 4.6% is inside the 4.5%-5% target. For China, growth is export-led while consumers stay weak (September retail sales +1.1%) and the property slump continues. For the world, China is about 30% of global growth and the largest buyer of oil and metals, so its demand shapes the commodity and FX price swings that Pyth now publishes data for. That helps the business case over time, but PYTH's price itself still trades on crypto liquidity. 5/ Scenarios from here: 📈 Bull: Holds $0.0675-$0.068 on a retest, then clears $0.0770 → $0.08966. ➡️ Base: Retests the breakout zone and chops between $0.0637 and $0.0770. 📉 Bear: Closes back inside the range and loses $0.0637 → retest of the $0.0585 double bottom. 6/ Levels on the radar: • Resistance: $0.0763-$0.0770, $0.08966, $0.09534 • Support: $0.0675-$0.068 (old range top), $0.0642, $0.0637, $0.0585 Bottom line: the setup is attractive if the retest holds. A stop just under $0.0675 risks about 3%, while the move to $0.077 offers about 11%. A close back inside the range would cancel the breakout. $PYTHUSDT $INITUSDT #WSOT2026 #WSOTPicktoEarn10U #USPayrollsAndRateDecisionsDriveMacroWeek #NovUSCPIWatch

GRAM ($GRAM) Market Analysis & Neutral Outlook Position Disclosure & Rationale No active position is held in GRAM tokens at this stage (Not Financial Advice, DYOR). The choice to remain unpositioned reflects a prudent wait and see stance while observing whether price action can establish a confirmed daily acceptance above local resistance or validate a secondary retest of underlying demand bases following recent intraday momentum expansion. Market Drivers & Overview Token Overview & Market Narrative: GRAM functions as a decentralized proof-of-work (PoW) computational and ecosystem token minted natively within the TON (The Open Network) ecosystem. The asset leverages Telegram-native infrastructure, enabling decentralized distribution, peer-to-peer micro-transactions, and community gaming utility across Web3 applications. Key News & Catalysts Driving Sentiment: Intraday Reversal Acceleration (+10.14%): The 4-hour chart demonstrates a sharp V-shaped recovery sequence lifting GRAM from its $0.991 local bottom to test a 24-hour peak of $1.147 on $15.78M in 24-hour trading turnover. TON Ecosystem Volume Expansion: Increased transaction activity and liquidity flows across TON ecosystem DEXs and centralized spot venues have supported rapid capital rotation back into high-beta network assets. Why Traders & Investors Consider Allocating: Telegram Ecosystem Integration: Direct alignment with TON Web3 distribution channels provides broad retail accessibility and seamless micro-payment utility. Impulsive Volatility Swings: High 24-hour turnover and sharp momentum bounces off historical support levels create attractive setups for short-term swing trading strategies. Technical Analysis & Key Levels Resistance Levels $1.179 (Localized Overhead Supply Zone) $1.273 (Macro Structural High Resistance) Support Levels $1.085 (Localized Support Baseline Floor) $0.991 (Critical Capitulation Bottom & Demand Base) Candlestick & Metric Patterns to Watch: Bullish V-Shaped Reversal Structure: The 4-hour candlestick chart displays a strong sequence of consecutive green expansion candles rebounding aggressively off the $0.991 demand floor, reclaiming short-term moving average ribbons and stabilizing near $1.141. High Volume Absorption: Significant 24-hour turnover of $15.78M validates active spot buying interest absorbing sell orders near recent capitulation lows. Bulls must hold and defend the $1.085–$0.991 support base to preserve structural recovery integrity and prevent a full breakdown to new lows. A verified breakout and 4-hour close above $1.179 is required to unlock further upside expansion toward the $1.273 macro supply ceiling. Always apply strict risk management and capital allocation protocols given the high volatility of ecosystem assets. $GRAMUSDT $NOTUSDT #WSOT2026 #WSOTPicktoEarn10U #NovUSCPIWatch
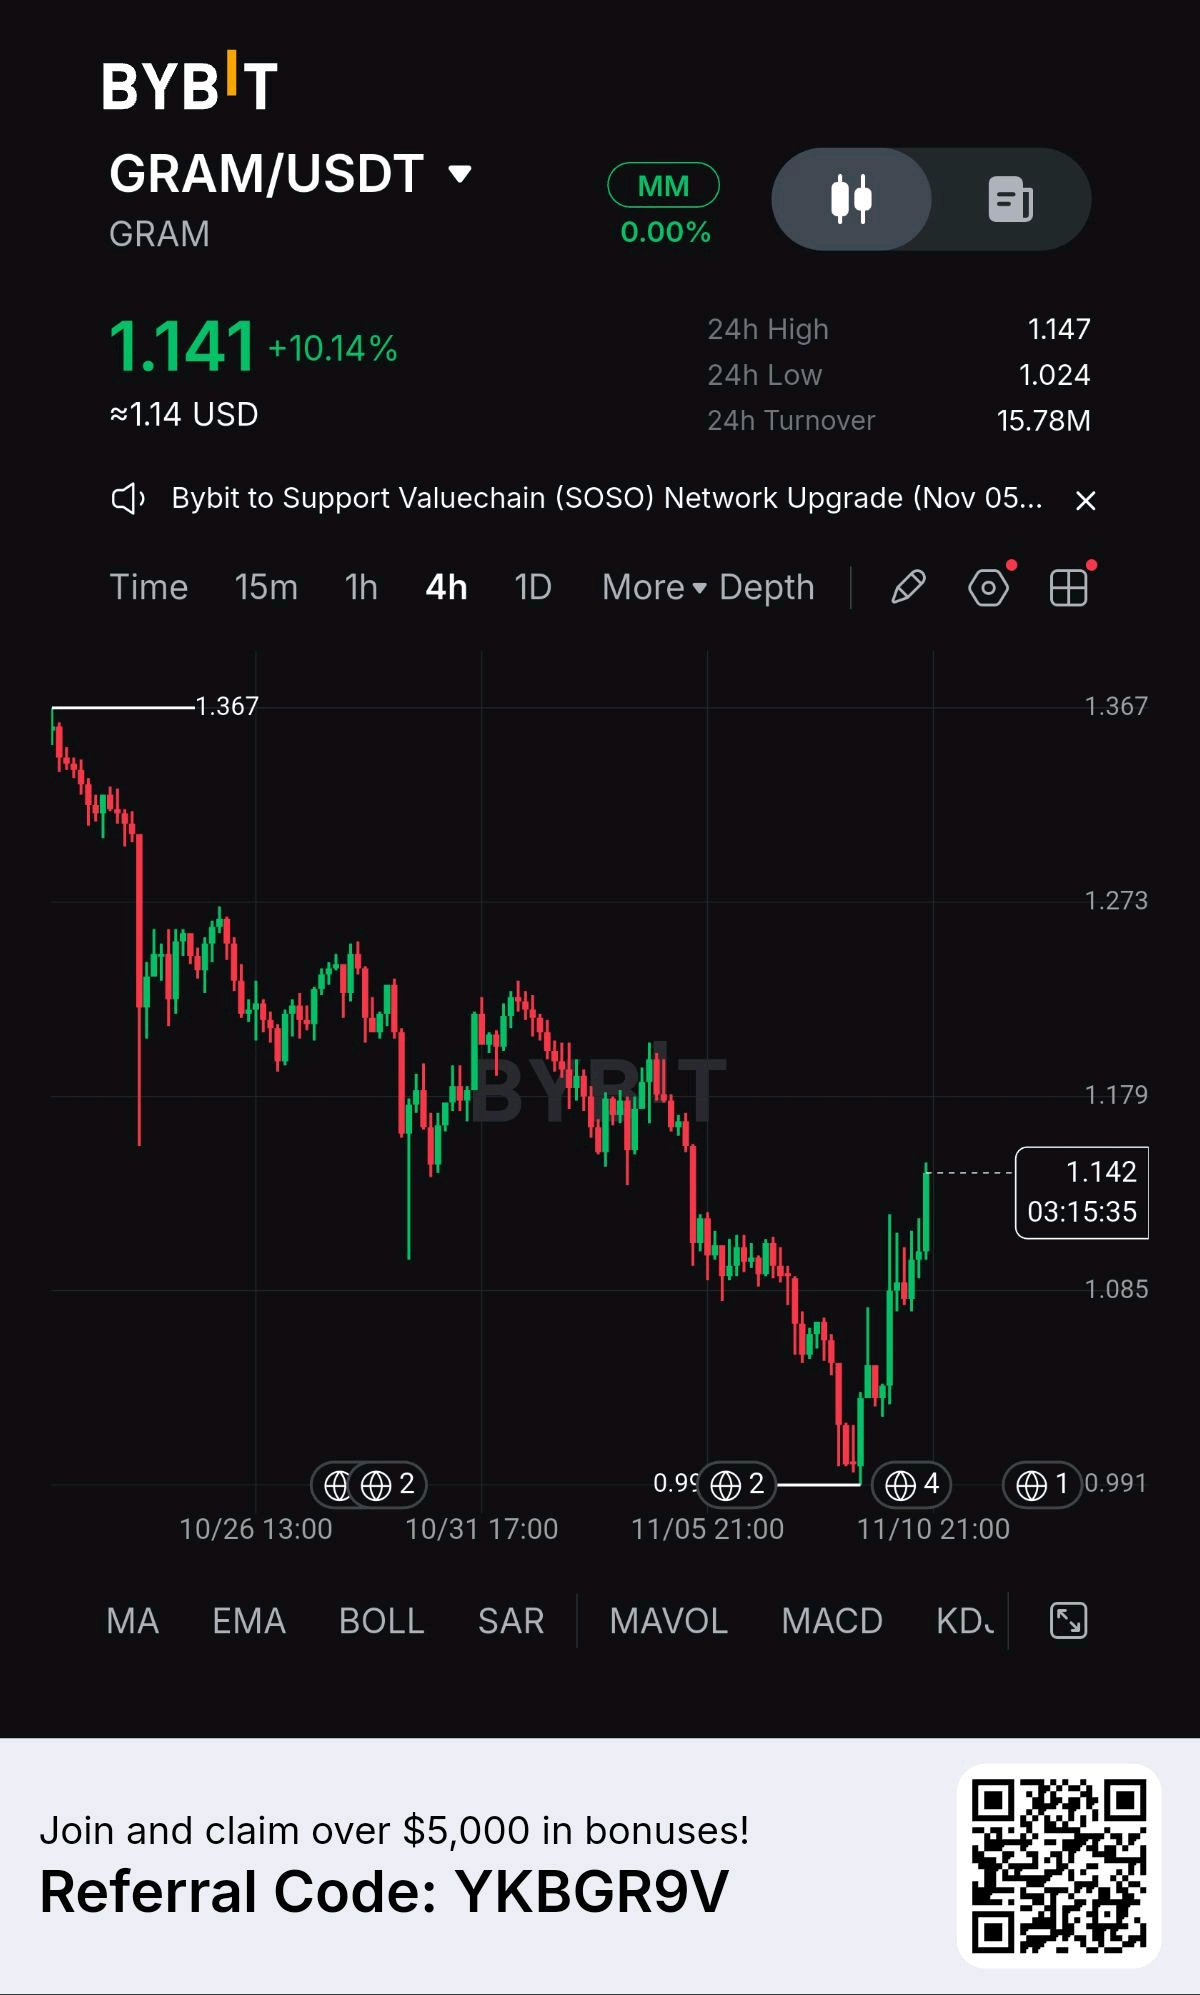

GRAM ($GRAM) Market Analysis & Neutral Outlook Position Disclosure & Rationale No active position is held in GRAM tokens at this stage (Not Financial Advice, DYOR). The choice to remain unpositioned reflects a prudent wait and see stance while observing whether price action can establish a confirmed daily acceptance above local resistance or validate a secondary retest of underlying demand bases following recent intraday momentum expansion. Market Drivers & Overview Token Overview & Market Narrative: GRAM functions as a decentralized proof-of-work (PoW) computational and ecosystem token minted natively within the TON (The Open Network) ecosystem. The asset leverages Telegram-native infrastructure, enabling decentralized distribution, peer-to-peer micro-transactions, and community gaming utility across Web3 applications. Key News & Catalysts Driving Sentiment: Intraday Reversal Acceleration (+10.14%): The 4-hour chart demonstrates a sharp V-shaped recovery sequence lifting GRAM from its $0.991 local bottom to test a 24-hour peak of $1.147 on $15.78M in 24-hour trading turnover. TON Ecosystem Volume Expansion: Increased transaction activity and liquidity flows across TON ecosystem DEXs and centralized spot venues have supported rapid capital rotation back into high-beta network assets. Why Traders & Investors Consider Allocating: Telegram Ecosystem Integration: Direct alignment with TON Web3 distribution channels provides broad retail accessibility and seamless micro-payment utility. Impulsive Volatility Swings: High 24-hour turnover and sharp momentum bounces off historical support levels create attractive setups for short-term swing trading strategies. Technical Analysis & Key Levels Resistance Levels $1.179 (Localized Overhead Supply Zone) $1.273 (Macro Structural High Resistance) Support Levels $1.085 (Localized Support Baseline Floor) $0.991 (Critical Capitulation Bottom & Demand Base) Candlestick & Metric Patterns to Watch: Bullish V-Shaped Reversal Structure: The 4-hour candlestick chart displays a strong sequence of consecutive green expansion candles rebounding aggressively off the $0.991 demand floor, reclaiming short-term moving average ribbons and stabilizing near $1.141. High Volume Absorption: Significant 24-hour turnover of $15.78M validates active spot buying interest absorbing sell orders near recent capitulation lows. Bulls must hold and defend the $1.085–$0.991 support base to preserve structural recovery integrity and prevent a full breakdown to new lows. A verified breakout and 4-hour close above $1.179 is required to unlock further upside expansion toward the $1.273 macro supply ceiling. Always apply strict risk management and capital allocation protocols given the high volatility of ecosystem assets. $GRAMUSDT $NOTUSDT #WSOT2026 #WSOTPicktoEarn10U #NovUSCPIWatch

I’m reviewing METAX’s outlook.I’m reviewing the market setup.I’m reviewing METAX’s setup.I’m checking METAX’s levels.I’m checking METAX context.A recovery near the top of a trading range needs proof, not just optimism. METAX’s spot snapshot shows $644.67, up 0.37% over 24 hours. Separately, CoinGecko reports approximately $5.64 million in aggregate 24 hour trading volume. Its percentage change differs from the spot snapshot, so I would not treat those sources as one synchronized reading. Confirmed METAX technical support and resistance levels are unavailable, so I am using CoinGecko’s reported trading ranges as references rather than proven turning points. The first upside reference is $649.01, the reported 24 hour high. A sustained break above it, followed by a successful retest, would strengthen the continuation case. Rejection there would leave a pullback possible. On the downside, $615.84 is the reported 24 hour low. Below that, $587.53 is the lower boundary of the reported 7 day range. These are observation points, not automatic buy levels or guaranteed floors. My take is cautiously constructive, but I would rather see price establish support above $649.01 than chase it near the range high. The available METAX headline about reduced metaverse spending is older and does not explain the current move. World economic conditions, advertising demand and returns on AI spending can influence Meta’s underlying shares. METAX also carries issuer and liquidity risks, and its token price can diverge from those shares. For me, the key question is whether $649.01 becomes support or remains a barrier. $METAXUSDT $SUIUSDT #WSOT2026 #WSOTPicktoEarn10U #NovUSCPIWatch


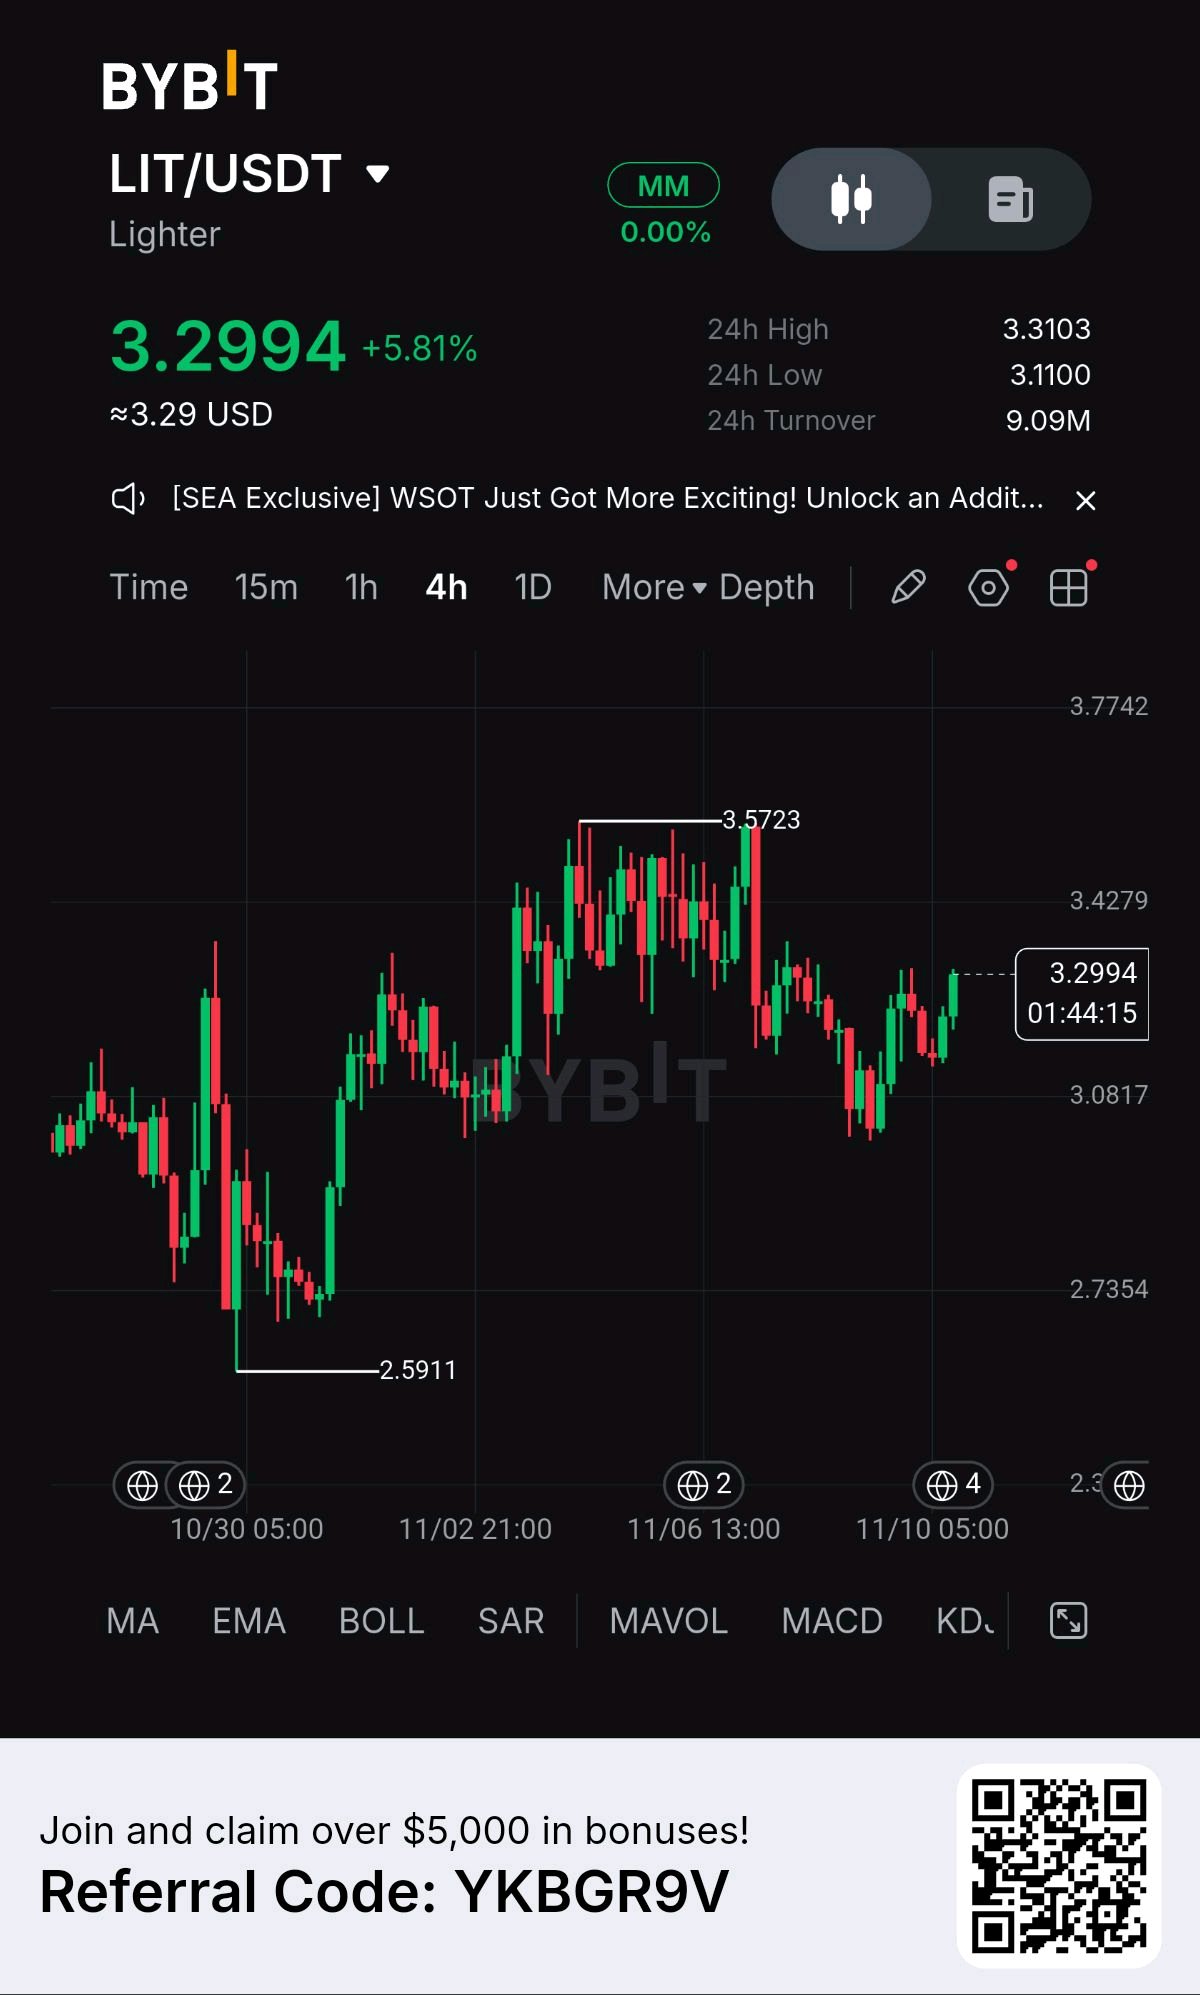
Target $5,20 Ditegaskan Kembali: Rebound $LIT & Basis Ekspansi Regulasi Berita Pasar & Katalis Makro ✔ Perluasan Registrasi CFTC: Lighter ($LIT) memulai langkah untuk mendaftar lisensi Designated Contract Market (DCM) dan DCO dari CFTC, memperkuat kerangkanya untuk beroperasi sebagai tempat perdagangan futures perpetual on-chain yang teregulasi sepenuhnya. ✔ Penghasilan Pendapatan & Pembelian Kembali Token: Eksekusi protokol fundamental terus menguat setelah menghasilkan lebih dari $70 juta dalam pendapatan kumulatif dan melakukan pembelian kembali struktural sebesar 19,62 juta token $LIT. ✔ Dukungan Keuangan Robinhood: Kepemilikan strategis Robinhood dalam putaran Seri B Lighter dan integrasi mesin order book dengan bukti SNARK yang dapat diverifikasi terus mendorong likuiditas institusional ke platform tersebut. ✔ Likuiditas & Turnover Spot: $LIT diperdagangkan di $3,2994 (+5,81%) di Bybit, didukung oleh volume turnover perdagangan 24 jam sebesar $9,09 juta dengan rentang sesi $3,1100 hingga $3,3103. Analisis Pasar & Aksi Harga Sapuan Double-Bottom: Aksi harga $LIT 4 jam di $3,2994 melakukan sapuan likuiditas yang tepat pada swing low lokal $3,0817, membangun lantai struktural yang lebih tinggi di atas swing low makro sebelumnya di $2,5911. Uji Pasokan Overhead: Aksi harga mencetak pemulihan multi-candle yang kuat, mendorong langsung ke resistensi terdekat di $3,4279 dengan maksud untuk menantang puncak swing makro di $3,5723. Momentum Saat Ini: Struktur pasar secara konstruktif bullish, karena pembeli mempertahankan level terendah lokal yang lebih tinggi ($2,5911 → $3,0817) dan menyerap aksi ambil untung dari sisi jual di atas. Target Likuiditas: Likuiditas sisi jual sisi bawah berada di bawah $3,0817. Di sisi atas, likuiditas sisi beli terdekat berada di $3,4279, dengan ekspansi makro sekunder menargetkan $3,5723 dan $5,2000. Tingkat Support dan Resistance ✔ Support Terdekat: $3,1100 – $3,1800 (Permintaan 4 jam lokal & lantai konsolidasi sesi) ✔ Support Invalidasi: $2,5911 (Level breakdown swing low struktural utama) ✔ Target Resistance Pertama: $3,4279 – $3,5723 (Zona pasokan overhead terdekat & puncak swing) ✔ Target Resistance Makro: $3,7742 – $5,2000 (Zona target ekspansi puncak historis utama) Aturan Manajemen Risiko: Penutupan 4 jam di bawah $2,5911 membatalkan pengaturan pembalikan bullish dan membuka risiko sisi bawah menuju $2,1000. Pertahankan ukuran posisi yang ketat terbatas pada 1–2% dari total ekuitas perdagangan. $LITUSDT $CAPUSDT #WSOT2026 #WSOTPicktoEarn10U #Pantauan IHK AS November
I’m checking $NVDAX’s outlook.I’m reviewing $NVDAX’s setup.I’m assessing $NVDAX’s drivers.I’m checking $NVDAX’s market.I’m reviewing Nvidia’s news.AI demand makes headlines. But how much of that demand becomes profitable revenue, and how much is already priced in? That is the question behind $NVDAX’s recovery, not simply whether Nvidia remains important to the AI industry. $NVDAX is trading at $178.74, up 1.32% over 24 hours. It is a spot tokenized instrument offering Nvidia price exposure, not direct share ownership or a perpetual position. Broader crypto sentiment reads fear at 32, although that does not measure Nvidia investor confidence. The gain is encouraging, but buying strength still needs volume confirmation before it deserves to be called a breakout. The strongest relevant headline is a report, attributed to Bloomberg, that Moonshot leased Nvidia B300 servers under a contract worth 432 million yuan. That supports the narrative of continued demand for advanced computing, but a server leasing contract should not be mistaken for an equivalent amount of direct Nvidia revenue. The fundamental case rests on sustained chip demand, margins, and customers earning enough from AI to keep investing. For $NVDAX itself, available coverage mainly documents older trading venue expansions and promotional campaigns rather than a fresh token catalyst. Wider access can help distribution, but it does not automatically create deeper liquidity or higher valuations. My view is cautiously constructive, not a confirmed long setup. A sustained recovery backed by stronger trading activity and solid Nvidia results would carry more weight than this price gain alone. $NVDAXUSDT $SUIUSDT #WSOT2026 #WSOTPicktoEarn10U


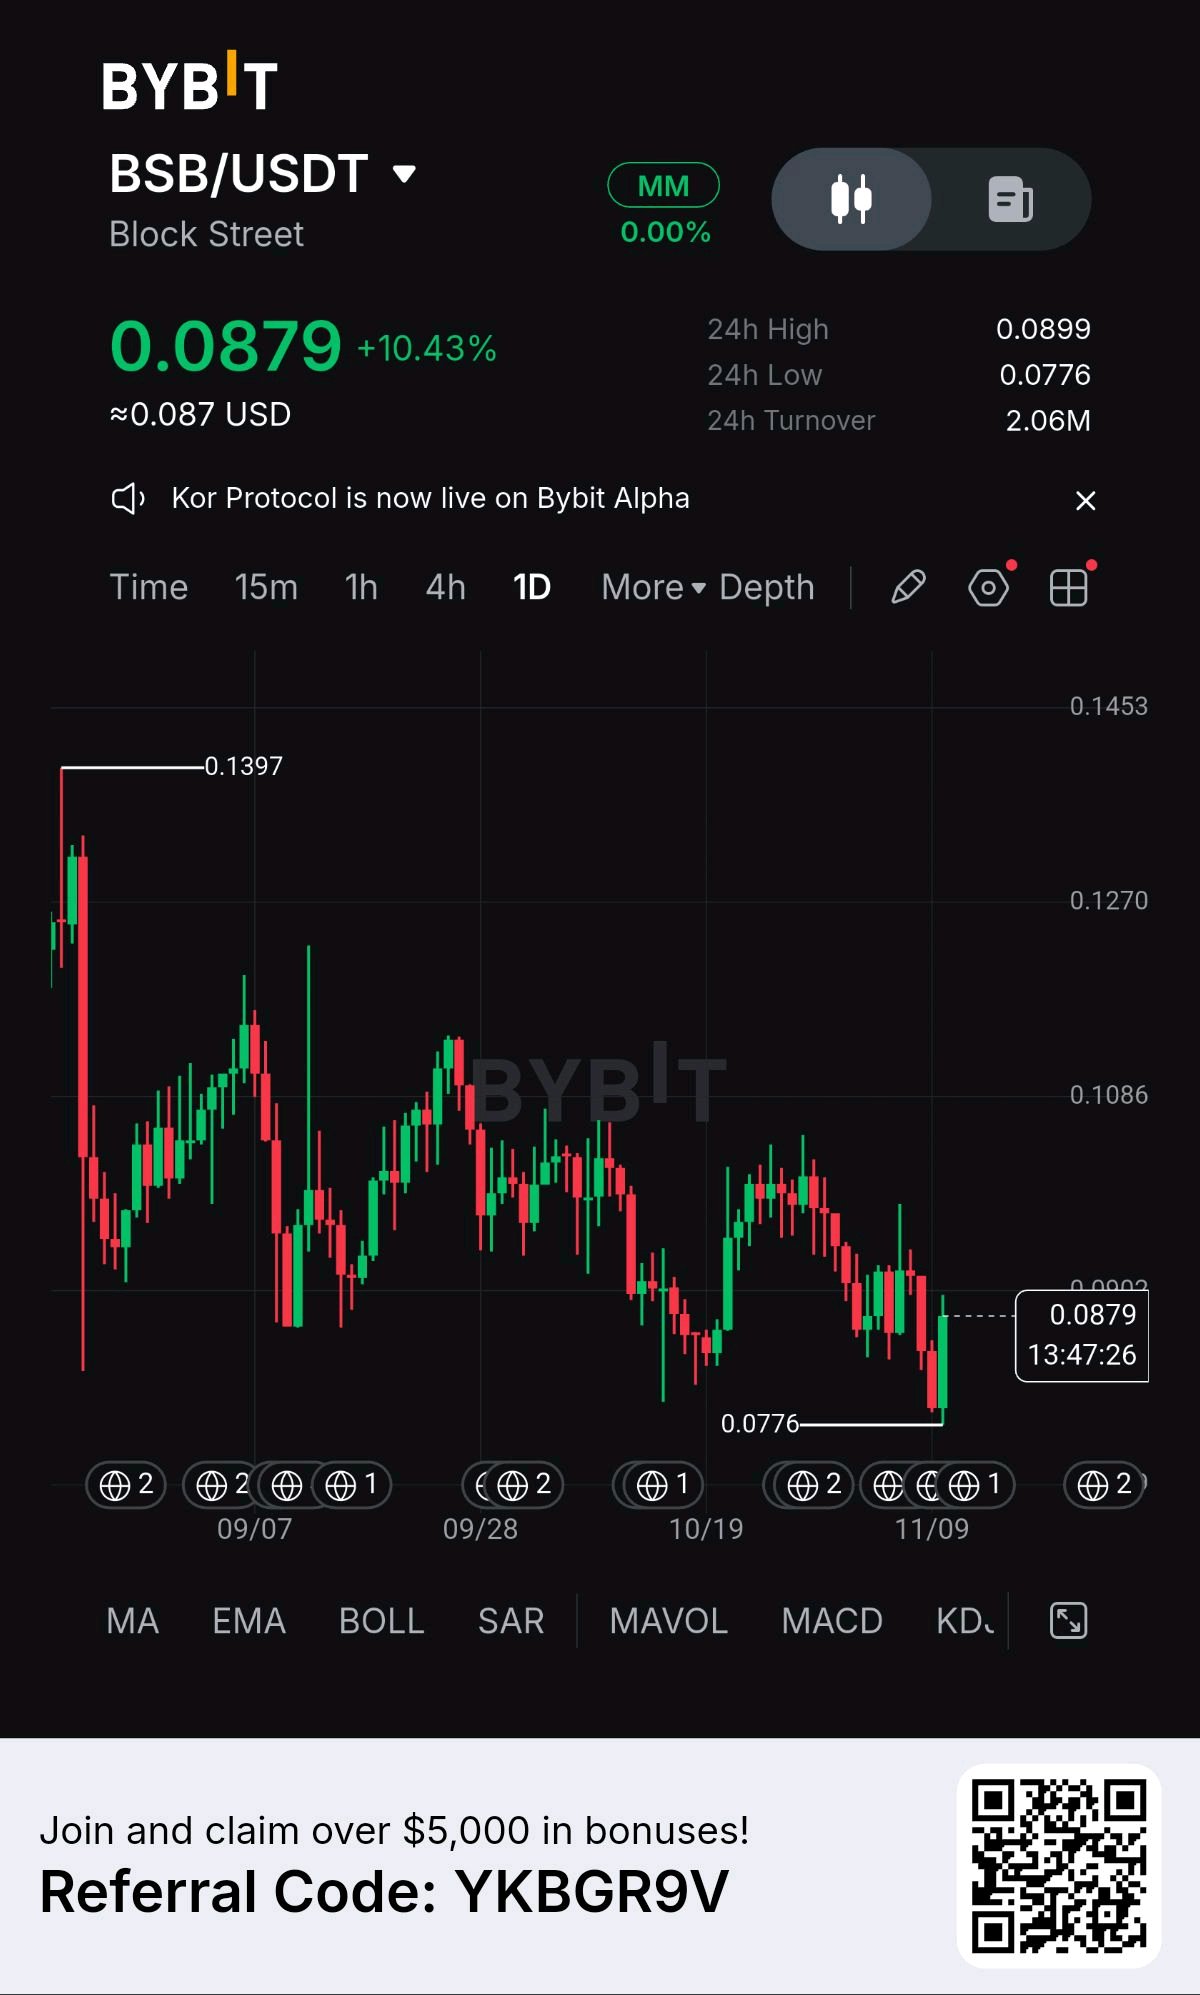
Block Street ($BSB) Market Analysis & Neutral Outlook Position Disclosure & Rationale No active position is held in BSB tokens at this stage (Not Financial Advice, DYOR). The choice to remain unpositioned reflects a prudent wait and see stance while observing whether price action can establish a confirmed daily acceptance above local resistance or validate a secondary retest of underlying demand bases following recent intraday momentum expansion. Market Drivers & Overview Token Overview & Market Narrative: BSB serves as the native utility asset for Block Street, powering decentralized financial infrastructure, ecosystem liquidity routing, and protocol governance. The asset attracts retail interest and algorithmic trading desks monitoring low-cap volatility expansions across primary exchange spot pairs. Key News & Catalysts Driving Sentiment: Intraday Volume Acceleration (+10.43%): The daily chart demonstrates a strong bullish recovery sequence lifting BSB from its $0.0776 local low to challenge a 24-hour high of $0.0899 on 2.06M in 24-hour trading turnover. Market Rebound & Liquidity Inflows: Recent capital rotation into high-beta exchange-listed tokens has driven steady spot buying volume, allowing price action to reclaim short-term moving average baselines and bounce off multi-week lows. Why Traders & Investors Consider Allocating: Asymmetric Micro-Cap Potential: Deep structural discount levels following extended historical pullbacks offer dynamic risk-reward scenarios for speculative swing traders. Impulsive Intraday Momentum: Rapid recovery swings indicate active liquidity absorption around key structural demand floors. Technical Analysis & Key Levels Resistance Levels $0.1086 (Localized Overhead Supply Zone) $0.1270 (Immediate Swing High Resistance Peak) Support Levels $0.0776 (Critical Capitulation Bottom & Structural Demand Base) $0.0650 (Macro Structural Support Floor) Candlestick & Metric Patterns to Watch: V-Shaped Reversal Structure: The daily candlestick chart displays an aggressive sequence of green recovery candles bouncing directly off the $0.0776 floor, attempting to reverse the preceding downtrend structure. Local Consolidation Near Recovery Highs: Price is currently trading at $0.0879, attempting to build a sustainable base above recent lows before challenging higher overhead resistance ceilings. Bulls must defend the $0.0776 demand base to preserve this recovery structure and prevent a breakdown to new lows. A verified breakout and daily close above $0.1086 is required to unlock further upside expansion toward higher liquidity targets. Always apply strict risk management and capital allocation protocols given the thin liquidity and high volatility of micro-cap digital assets. $BSBUSDT $SUIUSDT #WSOT2026 #WSOTPicktoEarn10U #NovUSCPIWatch