Fancy
15425Suka0Pembagian284Penggemar11Ikuti
I'm following you
I'm following you
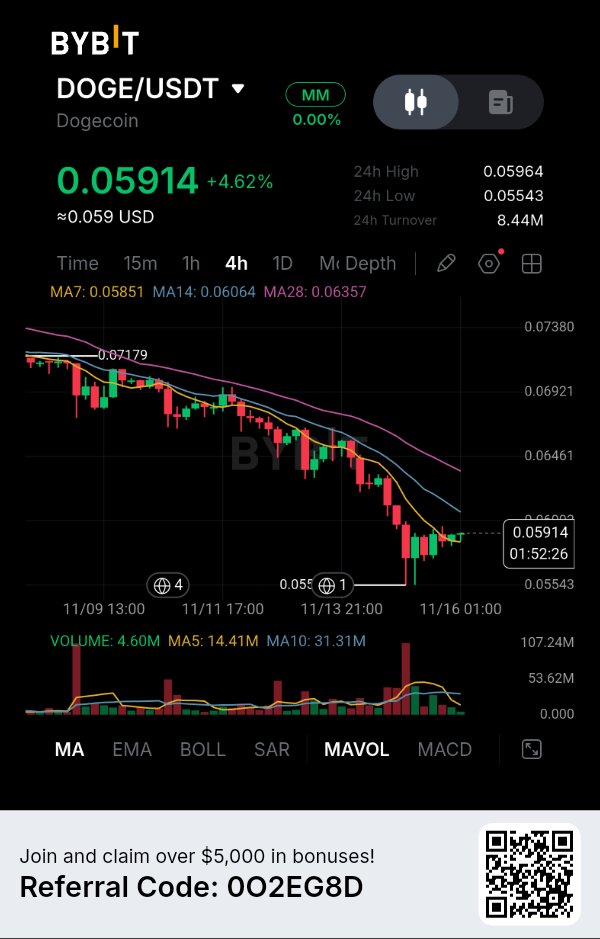
$DOGEUSDT — Dogecoin Sedang Pulih, Namun Tren yang Lebih Besar Belum Berubah. Dogecoin telah naik 4,62% dalam tangkapan layar 4H Anda, tetapi saya tidak yakin bahwa pembeli telah mendapatkan kembali kendali. Bagian yang menarik adalah DOGE telah memantul dari level terendah terbarunya sambil tetap berada di bawah dua rata-rata pergerakan penting. Pada saat yang sama, ada sesuatu yang berubah di balik proyek ini: para pengembang sedang berupaya memberikan DOGE kegunaan yang lebih praktis melalui ekosistem aplikasi. Hal ini menciptakan kontras yang menarik antara peningkatan utilitas dan struktur pasar yang lemah secara teknis. DATA PASAR — GRAFIK 4H BYBIT Menurut grafik Anda: * Harga: $0,05914 * Perubahan 24J: +4,62% * Tertinggi 24J: $0,05964 * Terendah 24J: $0,05543 * Turnover 24J: $8,44 juta * MA7: $0,05851 * MA14: $0,06064 * MA28: $0,06357 Untuk snapshot pasar terpisah hari ini, 16 November, CoinMarketCap melaporkan DOGE di sekitar $0,05895, dengan kapitalisasi pasar sekitar $9,24 miliar dan volume 24J sebesar $1,15 miliar. Pasokan yang beredar adalah sekitar 156,76 miliar DOGE, tanpa pasokan maksimum tetap. APA YANG DIUNGKAPKAN GRAFIK DOGE telah bergerak di dalam struktur yang menurun, jatuh dari wilayah $0,07179 yang terlihat menuju $0,05543. Pembeli baru-baru ini telah mempertahankan area yang lebih rendah dan mendorong harga kembali ke atas MA7 di $0,05851. Namun, MA14 di $0,06064 dan MA28 di $0,06357 tetap menjadi resistance di atas. Detail lain yang perlu diperhatikan: volume yang ditampilkan adalah 4,60 juta, dibandingkan dengan volume MA5 sebesar 14,41 juta dan volume MA10 sebesar 31,31 juta. Ini menunjukkan pemulihan terbaru belum menarik partisipasi yang sebanding dengan aktivitas perdagangan sebelumnya. Bagi saya, $0,06064 adalah level penting pertama yang perlu direbut kembali oleh pembeli. PERKEMBANGAN YANG HARUS DIPERHATIKAN OLEH BANYAK ORANG Ekosistem Dogecoin sedang berusaha untuk bergerak melampaui transfer dan pembayaran sederhana. Pada 11 November, DogeOS mengumumkan bahwa versi pertamanya telah dikembangkan dan diaudit, dengan mainnet yang digambarkan sudah sangat dekat, meskipun belum ada tanggal peluncuran yang dikonfirmasi. Proyek ini bertujuan untuk memperkenalkan lapisan aplikasi yang kompatibel dengan Ethereum yang mendukung DeFi, perdagangan, pinjaman, dan game. Lebih dari 100 pengembang dilaporkan sedang mengerjakan aplikasi tersebut. Yang membuat ini sangat menarik adalah bahwa DogeOS bermaksud menggunakan DOGE untuk biaya transaksi daripada memperkenalkan token asli lainnya. Namun, ada batasan penting: DogeOS adalah lapisan aplikasi terpisah, bukan peningkatan langsung ke blockchain dasar Dogecoin. Model keamanannya saat ini masih bergantung pada validator terpilih, sementara peningkatan yang diusulkan untuk verifikasi bukti zero-knowledge asli belum disetujui. PERTANYAAN NILAI TOKEN Saya terus kembali ke satu masalah. Jika DogeOS berhasil menarik pengembang dan aplikasi, DOGE bisa mendapatkan utilitas tambahan melalui biaya transaksi dan aktivitas aplikasi. Namun, penyelesaian pengembangan tidak menjamin adopsi pengguna. Bukti nyata akan datang dari penggunaan aplikasi yang sebenarnya, permintaan transaksi, dan jumlah DOGE yang beredar melalui layanan baru ini. Dogecoin memiliki jaringan yang mapan dan likuiditas yang substansial, tetapi struktur pasokan inflasinya juga berarti permintaan harus tetap relevan dari waktu ke waktu. RENCANA TRADING SAYA — SHORT KONDISIONAL Struktur 4H yang lebih luas masih mendukung penjual, terlepas dari pemulihan baru-baru ini. Trigger: Penolakan di sekitar $0,0600–$0,0606, diikuti oleh penutupan 4H di bawah $0,0585. Entry: $0,0582–$0,0585. Stop-loss: $0,0600. TP1: $0,0565. TP2: $0,05543. TP3: $0,0535. Menggunakan entry representatif di $0,05835: Potensi penurunan ke TP3: 8,32%. Risiko terdefinisi: 2,83%. Estimasi risk-to-reward: 2,94:1. Pengaturan ini bersifat kondisional. Saya tidak akan masuk tanpa adanya penolakan resistance dan breakdown berikutnya. PANDANGAN AKHIR SAYA Dogecoin sedang memasuki fase pengembangan yang menarik. DogeOS bisa memberikan aplikasi keuangan tambahan bagi DOGE, tetapi pasar masih membutuhkan bukti bahwa pengembang dapat mengubah infrastruktur ini menjadi aktivitas pengguna yang konsisten. Menurut saya, pertanyaan terpenting bukanlah apakah Dogecoin dapat menarik lebih banyak perhatian. Melainkan apakah Dogecoin dapat berevolusi dari aset yang terutama dipegang dan ditransfer orang menjadi aset yang memiliki alasan tambahan untuk digunakan secara aktif. Transisi tersebut bisa menjadi lebih penting bagi nilai jangka panjang DOGE daripada pemulihan harga jangka pendek lainnya. $DOGEUSDT #ByXIMPACT

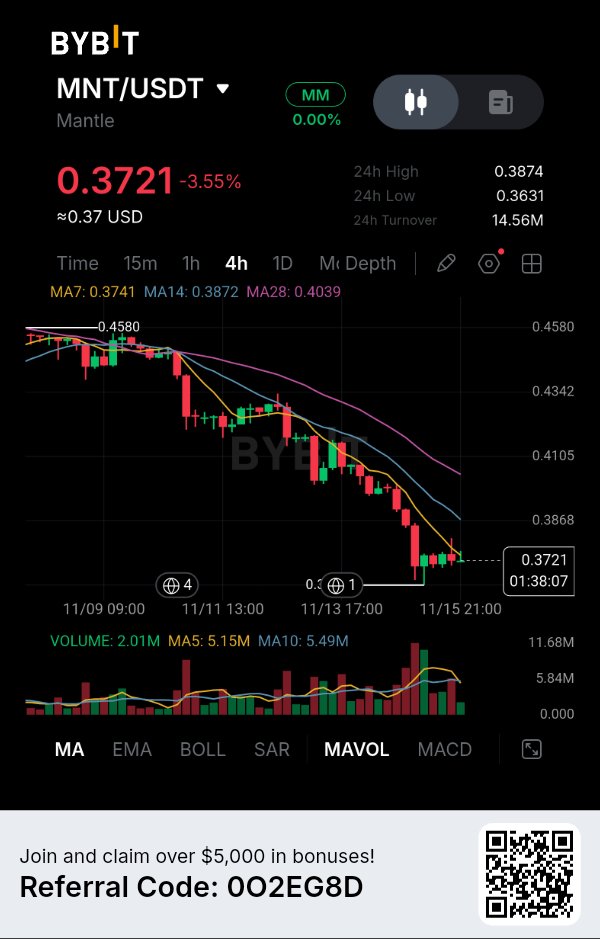
The Selling Pressure Has Not Disappeared — Another Resistance Test Could Create an Opportunity. Mantle is struggling to recover after an extended decline, and one detail on this 4-hour chart deserves attention: price is consolidating near its recent low while all three moving averages remain positioned above it. This suggests that buyers are attempting to stabilize the market, but sellers still have control over the broader structure. I am particularly interested in whether the next recovery toward resistance will attract buyers or simply give sellers another opportunity. MARKET STRUCTURE — THE DOWNTREND REMAINS IN CONTROL MNT is currently trading around $0.3721, down 3.55%, with a 24-hour high of $0.3874 and a low of $0.3631. Looking at the 4-hour chart, Mantle has declined from approximately $0.4580, creating a persistent sequence of lower highs and lower lows. The previous recovery attempts have repeatedly failed to establish a meaningful bullish reversal. More recently, sellers accelerated the decline toward $0.3631. Price has since started moving sideways around $0.37, but this consolidation has not yet produced a convincing structural recovery. For me, the important question is whether this sideways movement represents temporary stabilization or simply a pause within the existing downtrend. THE MOVING AVERAGES ARE STILL FAVORING SELLERS Three technical readings stand out: - MA7: $0.3741 - MA14: $0.3872 - MA28: $0.4039 All three moving averages are above the current price. Their positioning is also bearish, with MA7 below MA14 and MA14 below MA28. This arrangement reflects persistent weakness across the displayed moving-average periods. The first resistance area is around $0.3741, followed by $0.3872. Above these levels, MA28 near $0.4039 represents a much stronger recovery challenge. What interests me most is the gap between current price and MA28. Buyers have considerable technical resistance to overcome before the broader structure can improve. VOLUME — THE MARKET IS LOSING PARTICIPATION The volume data provides another useful perspective: - Current volume: 2.01M - MA5: 5.15M - MA10: 5.49M Current volume is significantly below both displayed averages. This suggests that recent trading participation has cooled compared with the preceding activity. I would not automatically interpret declining volume as accumulation or distribution. However, it tells me that the current consolidation is not yet supported by convincing buying participation. If MNT attempts another recovery, I want to see volume expand alongside price. Without that confirmation, a move toward resistance could struggle to attract sustained demand. THE IMPORTANT DETAIL — $0.3631 The recent low is becoming the most important reference point for this setup. Buyers have managed to prevent an immediate continuation below $0.3631, but they have not yet demonstrated the strength required to reclaim the moving-average resistance cluster. This creates an interesting market situation. Price is attempting to stabilize, but the broader structure remains bearish. If MNT recovers toward $0.3741–$0.3872 and sellers defend that region again, the market could revisit its recent low. A decisive breakdown below $0.3631 would create the possibility of another downside extension. On the other hand, reclaiming $0.3872 with stronger volume would weaken my current bearish interpretation. MY TRADING STRATEGY — SHORT My preferred direction is SHORT because the prevailing market structure and moving-average alignment continue to favor sellers. I would rather wait for a recovery into resistance than chase MNT near its current support. - Direction: SHORT - Entry Zone: $0.3790–$0.3860 - Confirmation: 4H bearish rejection from the entry zone. - Stop Loss: $0.3970 - TP1: $0.3631 - TP2: $0.3500 - TP3: $0.3380 Estimated Risk/Reward: Approximately 1:1.5 to 1:3.5, depending on entry and execution. TP1 is based on the visible chart low, while TP2 and TP3 are projected downside extensions rather than confirmed support levels shown in the screenshot. A sustained 4-hour move above $0.3970 would invalidate this setup. If MNT continues falling without offering the planned entry, I would avoid chasing the move. WHAT COULD CHANGE MY VIEW? A convincing recovery above $0.3872, followed by stronger buying volume and progress toward $0.4039, would make me reconsider the bearish outlook. That would indicate buyers are beginning to challenge the structure that has controlled the decline. FINAL THOUGHT Mantle is approaching an important decision point. The market has slowed its decline, but slowing down is not the same as reversing direction. The next resistance test could reveal whether buyers are finally gaining strength or whether sellers still have unfinished business. $MNTUSDT #ByXIMPACT

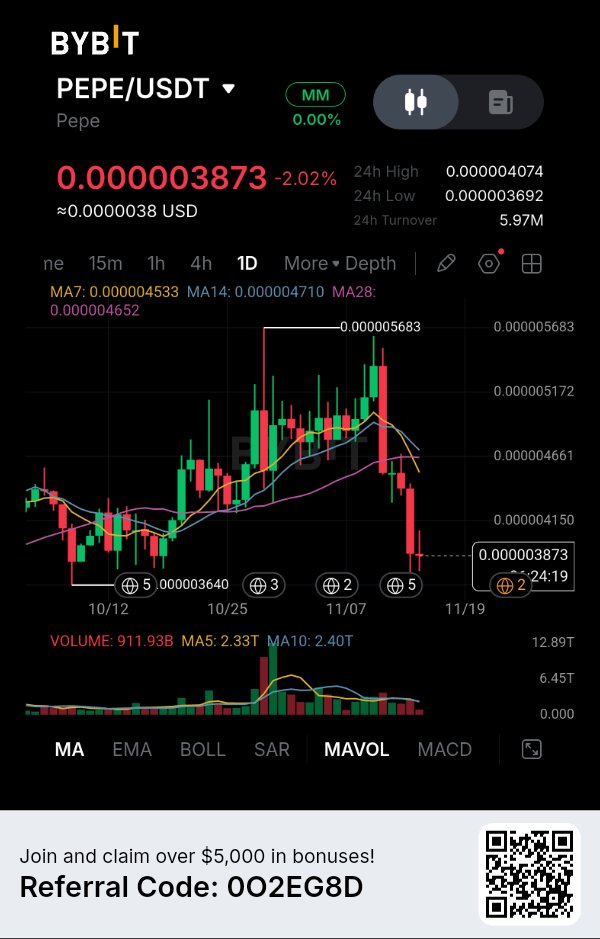
$PEPEUSDT — Reli menuju $0.00000568 telah benar-benar berubah karakternya, dan saya sedang mengamati apakah penjual dapat mengubah pemulihan berikutnya menjadi lower high (puncak yang lebih rendah) lainnya. Yang membuat grafik ini menarik bagi saya adalah seberapa cepat PEPE kehilangan pijakan yang telah diraihnya selama reli sebelumnya. Pada grafik harian, PEPE naik menuju $0.000005683, tetapi pembeli gagal mempertahankan momentum tersebut. Harga sejak itu mengalami penolakan tajam dan sekarang diperdagangkan di sekitar $0.000003873, turun 2,02%. Bagian pentingnya bukan sekadar besarnya penurunan. Ini tentang di mana harga diperdagangkan relatif terhadap moving average-nya. MA7 saat ini berada di sekitar $0.000004533, MA14 di sekitar $0.000004710, dan MA28 di sekitar $0.000004652. Ketiganya berada di atas harga saat ini, yang menunjukkan bahwa pemulihan masih memiliki resistance signifikan untuk diatasi. Ada level lain yang tidak ingin saya abaikan. PEPE baru-baru ini mendekati area $0.000003692, sementara support yang terlihat sebelumnya berada di sekitar $0.000003640. Di sinilah saya ingin melihat bagaimana respons pembeli. Rebound dari wilayah ini mungkin saja terjadi, tetapi saya tidak akan menganggapnya sebagai pembalikan bullish kecuali harga mulai merebut kembali moving average dan membentuk higher low (lembah yang lebih tinggi). Pendekatan pilihan saya adalah menunggu pemulihan menuju $0.00000445–$0.00000465. Jika penjual menolak wilayah tersebut pada grafik harian, itu bisa memberikan peluang yang lebih terstruktur untuk mengikuti momentum bearish yang ada. Saya tidak tertarik mengejar penurunan di level saat ini. Saya ingin pasar menawarkan entri yang lebih baik daripada melakukan penjualan setelah pergerakan sudah terjadi. Rencana trading kondisional saya: * Arah: SHORT * Zona Entri: $0.00000445–$0.00000465 * Stop Loss: $0.00000480 * TP1: $0.000003873 * TP2: $0.000003692 * TP3: $0.000003400 (proyeksi ekstensi) Setup ini memerlukan konfirmasi penolakan bearish dari zona entri. Pemulihan harian yang berkelanjutan di atas $0.00000480 akan membatalkan ide ini. Saya pernah melihat koin meme pulih dengan tajam setelah aksi jual agresif, jadi saya tidak ingin berasumsi bahwa setiap breakdown akan berlanjut. Jika pembeli merebut kembali klaster moving average, saya akan mempertimbangkan kembali pandangan bearish ini. Untuk saat ini, pertanyaannya bukan seberapa cepat PEPE bisa kembali ke level tertinggi sebelumnya. Pertanyaannya adalah apakah pembeli dapat mempertahankan posisi terendah baru-baru ini sebelum penjual mencoba penurunan berikutnya. $PEPEUSDT #ByXIMPACT

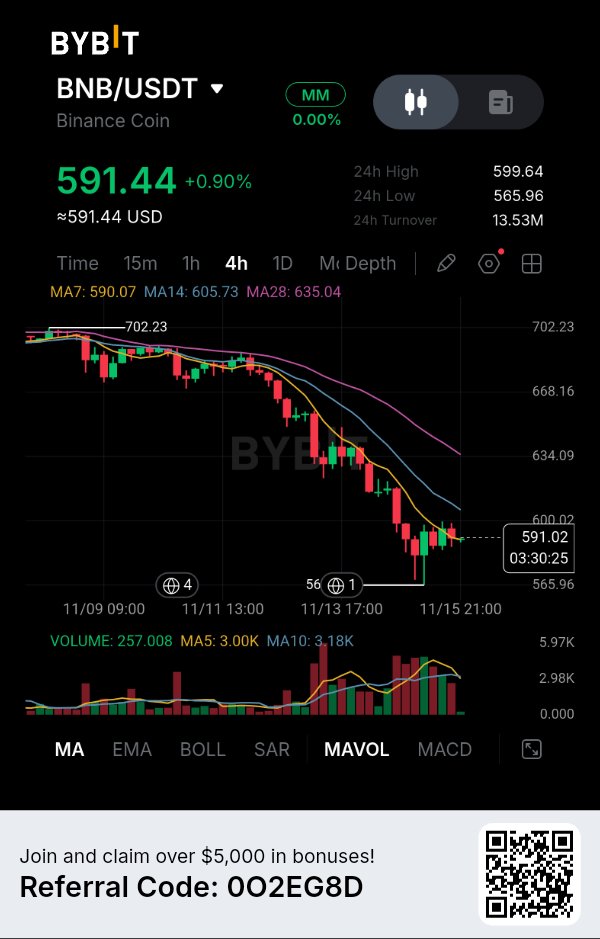
$BNBUSDT — Network Activity Remains High, But the Token Is Struggling to Recover. BNB is showing a small recovery on the 4H chart, but I don't think buyers have regained control yet. The interesting part is that BNB Chain continues processing millions of transactions while its native token is trading well below its recent price levels. This creates an important distinction between network activity and market demand. A busy blockchain does not automatically mean its native asset must appreciate. MARKET DATA — BYBIT 4H CHART According to your chart: Price: $591.44 24H change: +0.90% 24H high: $599.64 24H low: $565.96 24H turnover: $13.53M MA7: $590.07 MA14: $605.73 MA28: $635.04 For separate market context, the latest November 15 aggregated snapshot reports BNB around $598.52, with approximately $78.58B market capitalization and $1.48B futures volume. These figures are separate from your chart snapshot. WHAT THE CHART IS REVEALING BNB has experienced a sustained decline from the visible $702.23 region. The recent selling pushed price toward $565.96, where buyers attempted a recovery. Price has now moved slightly above MA7 at $590.07, but MA14 at $605.73 and MA28 at $635.04 remain overhead. This is an important distinction: the short-term bounce is visible, but the broader 4H structure remains weak. The $599–$606 region is the immediate resistance area I am watching. Meanwhile, $565.96 remains the important support. THE FUNDAMENTAL SIDE — BNB CHAIN IS STILL EXPANDING One development worth watching is the upcoming Jenner upgrade. On November 3, BNB Chain released version 1.8.2, scheduling the BSC mainnet Jenner hard fork for December 8, 2026. One important addition is Payment Lane, which reserves 5% of block gas capacity by default for eligible BNB transfers and approved payment transactions. This matters because BNB Chain is trying to make payment transactions more reliable during periods of network congestion. There is also measurable network activity. On November 14, BNB Smart Chain recorded approximately 17.42 million transactions, while network fees reached 713.21 BNB for that day. Its stablecoin supply stood around $11.56 billion. These figures suggest that BNB Chain has substantial usage beyond speculative trading. TOKEN ECONOMICS — THE BURN MECHANISM On October 19, BNB Chain completed its 37th quarterly burn, removing 1,646,196.44 BNB from circulation, worth approximately $1.197 billion at the time. The remaining supply was reported at approximately 131.51 million BNB. BNB also serves as the gas and governance asset across the BNB Chain ecosystem. What interests me is the combination of network utility and systematic supply reduction. However, burns do not guarantee price appreciation, particularly when broader market demand is weakening. MY INTERPRETATION I keep coming back to one contradiction: BNB Chain is processing substantial transaction activity, but BNB's chart still reflects considerable selling pressure. The network has a clear development roadmap, and the upcoming Payment Lane upgrade could strengthen its payment infrastructure. However, the market needs more than network activity to establish a sustainable recovery. Buyers must demonstrate that they are willing to absorb selling pressure around the current resistance zones. MY TRADING PLAN — CONDITIONAL SHORT The broader 4H structure currently favors downside continuation. Trigger: 4H candle closes below $565.96, followed by a failed retest. Entry: $563–$566. Stop-loss: $578. TP1: $552. TP2: $540. TP3: $525. Using a representative entry of $564.50: Potential downside to TP3: 7.00%. Defined risk: 2.39%. Estimated risk-to-reward: 2.93:1. This is a conditional setup, not an immediate entry. I would wait for the support breakdown and failed retest. MY FINAL VIEW BNB has something many tokens struggle to demonstrate: an established network with substantial transaction activity, payment infrastructure and a recurring supply-reduction mechanism. But the current chart highlights an important distinction between ecosystem strength and token performance. For me, the next test is whether BNB can turn its network activity into enough market demand to reclaim the $605–$635 resistance region. Until then, the recovery remains technically incomplete. $BNBUSDT #ByXIMPACT

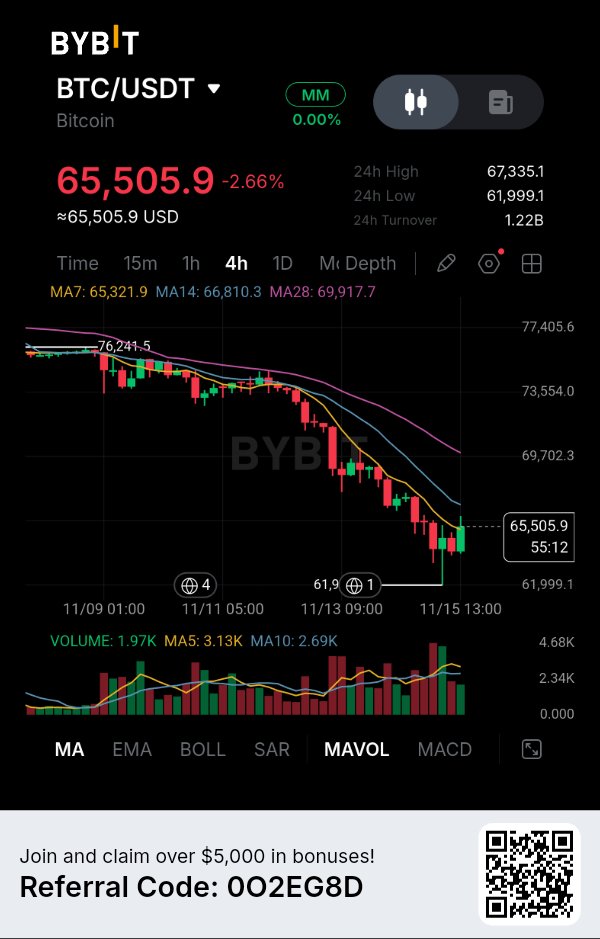
$BTCUSDT — Bitcoin sedang mencoba untuk bangkit dari level $61.999, namun pertanyaan yang lebih besar adalah apakah pembeli dapat mengubah pantulan ini menjadi perubahan struktur pasar yang nyata. Yang membuat grafik ini menarik bagi saya adalah jarak yang telah ditempuh Bitcoin dari level tertinggi sebelumnya. Pada grafik 4H, BTC telah turun dari kisaran $76.241, secara konsisten membentuk lower high dan lower low. Aksi jual terbaru mendorong harga ke arah $61.999 sebelum pembeli masuk dan menghasilkan pemulihan yang nyata. Bitcoin sekarang diperdagangkan di sekitar $65.505,9. Itu adalah reaksi yang menggembirakan, tetapi saya tidak ingin mengacaukan candle pemulihan dengan pembalikan yang terkonfirmasi. Moving average memberi saya alasan lain untuk tetap berhati-hati. MA7 berada di sekitar $65.321,9, sementara MA14 berada di $66.810,3 dan MA28 berada di dekat $69.917,7. Harga telah berhasil mendapatkan kembali MA7 jangka pendek, tetapi dua moving average lainnya tetap berada di atas. Ini menciptakan ujian penting bagi pembeli: bisakah mereka memulihkan $66.810 dan akhirnya menantang kisaran $69.900, atau akankah penjual menggunakan pantulan ini untuk menetapkan lower high lainnya? Saya sangat tertarik dengan area $66.800–$67.335. Area ini menggabungkan MA14 dengan level tertinggi 24 jam yang terlihat, menjadikannya wilayah penting untuk diperhatikan terkait potensi penolakan. Skenario yang saya sukai adalah SHORT, tetapi hanya jika Bitcoin pulih ke zona tersebut dan penjual menunjukkan bahwa mereka masih mempertahankan resistance. 🎯 TARGET PENURUNAN SAYA TP1: $64.000 TP2: $62.000 TP3: $60.000 (estimasi ekstensi) Manajemen Risiko Rencana trading kondisional saya: Zona Entry: $66.800–$67.335 Stop Loss: $70.100 Konfirmasi: Penolakan bearish 4H dari zona entry. Invalidasi: Penerimaan 4H yang berkelanjutan di atas $70.100. Target akhir adalah proyeksi ekstensi, bukan level support yang terkonfirmasi. Level-level ini menjelaskan potensi setup, bukan posisi yang sudah dieksekusi. Jika Bitcoin merebut kembali MA14 dan mulai membangun higher low, saya akan mempertimbangkan kembali pandangan bearish saya. Saya tidak ingin tetap berkomitmen pada ide short jika pasar mulai membuktikan sebaliknya. Saya telah belajar bahwa setelah penurunan yang berkepanjangan, pemulihan pertama bisa menipu. Terkadang keputusan terpenting bukanlah memprediksi ke mana Bitcoin akan bergerak selanjutnya, melainkan menunggu untuk melihat apakah pembeli benar-benar dapat mempertahankan posisi yang telah mereka pulihkan. Untuk saat ini, saya mengamati satu pertanyaan penting: Apakah Bitcoin sedang membangun fondasi untuk pemulihan, atau apakah pembeli hanya memberi penjual kesempatan lain untuk mendorong pasar lebih rendah? $BTCUSDT #ByXIMPACT

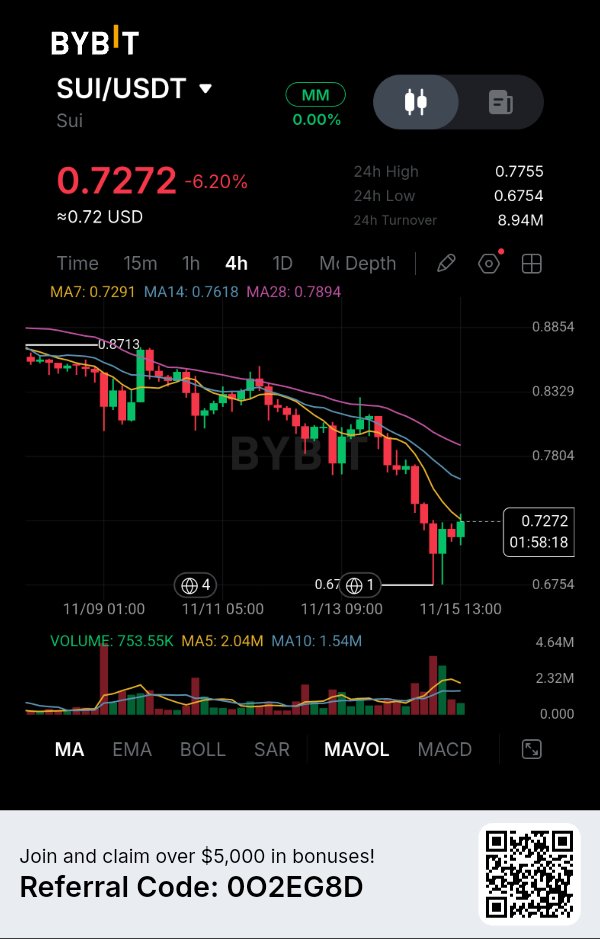
Rebound dari $0.6754 Menghadapi Masalah yang Jauh Lebih Besar — Penjual Masih Mengendalikan Struktur. SUI telah turun 6,20%, tetapi yang paling menarik bagi saya adalah perilaku setelah penurunan tajam terbarunya. Pembeli berhasil melakukan pemulihan dari $0.6754, namun harga masih berjuang di sekitar moving average tercepatnya. Ini menimbulkan pertanyaan penting: apakah pembeli sedang mempersiapkan pemulihan yang nyata, atau ini hanya pantulan sementara di dalam tren turun yang sudah terbentuk? Saya lebih condong ke kemungkinan kedua sampai grafik memberikan bukti yang lebih kuat. STRUKTUR PASAR — TEKANAN KE BAWAH BELUM HILANG SUI saat ini diperdagangkan di sekitar $0.7272, dengan harga tertinggi 24 jam di $0.7755 dan terendah di $0.6754. Jika melihat grafik 4 jam, struktur yang lebih luas telah memburuk secara signifikan dari level tertinggi sebelumnya di dekat $0.8713. Harga terus membentuk lower high dan lower low, dengan upaya pemulihan yang berulang kali gagal merebut kembali level resistansi sebelumnya. Gelombang penjualan terbaru mendorong SUI menuju $0.6754, di mana pembeli akhirnya masuk. Candle hijau yang muncul setelahnya menunjukkan adanya minat beli, namun pemulihannya tetap relatif kecil dibandingkan dengan penurunan sebelumnya. Bagi saya, perbedaan pentingnya adalah pembeli telah mempertahankan level terendah, tetapi mereka belum mengubah struktur pasar secara luas. MOVING AVERAGE MEMBENTUK HAMBATAN DI ATAS Tiga pembacaan layak mendapat perhatian khusus: - MA7: $0.7291 - MA14: $0.7618 - MA28: $0.7894 SUI saat ini diperdagangkan sedikit di bawah MA7 dan jauh di bawah MA14 dan MA28. Susunannya juga tetap bearish, dengan moving average tercepat berada di bawah rata-rata jangka menengah dan keduanya di bawah MA28. Hal ini menciptakan urutan resistansi yang harus diatasi oleh pembeli. Tantangan pertama adalah merebut kembali $0.7291. Setelah itu, wilayah $0.7618 menjadi sangat penting. Saya akan lebih memperhatikan $0.7894 karena merebut kembali moving average yang lebih panjang akan mewakili perbaikan yang lebih berarti dalam struktur 4 jam. Sampai level-level ini pulih, saya melihat pantulan saat ini sebagai upaya pemulihan, bukan pembalikan tren yang terkonfirmasi. VOLUME — PEMULIHAN INI KEHILANGAN BAHAN PENTING Inilah sesuatu yang memperkuat kehati-hatian saya. Volume yang ditampilkan sekitar 753.55K, sementara: - MA5: 2.04M - MA10: 1.54M Volume saat ini jauh di bawah kedua rata-rata tersebut. Ini menunjukkan bahwa pemulihan terbaru tidak menarik tingkat partisipasi yang sama seperti yang terlihat selama aktivitas perdagangan baru-baru ini. Saya tidak menginterpretasikan ini saja sebagai bukti distribusi, tetapi ini membuat pantulan saat ini kurang meyakinkan. Jika pembeli benar-benar berniat membalikkan tren, saya ingin melihat partisipasi yang lebih kuat yang menyertai perebutan kembali resistansi. Beberapa candle hijau tanpa ekspansi volume yang berarti tidak cukup untuk mengubah penilaian saya. LEVEL YANG BISA MENENTUKAN PERGERAKAN BERIKUTNYA Wilayah $0.6754 sekarang menjadi titik acuan penting. Pembeli mempertahankan level ini, tetapi pasar masih perlu menunjukkan bahwa mereka dapat menetapkan level tertinggi yang lebih tinggi (higher high) dan mempertahankan pemulihan di atas klaster moving average. Jika SUI reli menuju $0.7480–$0.7620 dan menemui penolakan lagi, itu bisa memberi penjual kesempatan baru. Namun, breakout 4 jam yang kuat di atas struktur resistansi akan melemahkan tesis bearish. Inilah sebabnya saya lebih tertarik pada bagaimana SUI bereaksi selama pemulihan daripada mengejar penurunan saat ini. STRATEGI TRADING SAYA — SHORT Arah pilihan saya tetap SHORT, berdasarkan struktur pasar yang menurun, penyelarasan moving average yang bearish, dan volume yang relatif lemah selama pemulihan. - Arah: SHORT - Zona Entri: $0.7480–$0.7620 - Konfirmasi: Penolakan bearish dari zona entri pada grafik 4H. - Stop Loss: $0.7950 - TP1: $0.6754 - TP2: $0.6500 - TP3: $0.6250 Estimasi Risk/Reward: Sekitar 1:1.5 hingga 1:3.8, tergantung pada entri dan eksekusi. TP1 didasarkan pada level terendah grafik yang terlihat, sementara TP2 dan TP3 adalah proyeksi ekstensi sisi bawah, bukan level support terkonfirmasi yang ditampilkan di tangkapan layar. Pergerakan 4 jam yang berkelanjutan di atas $0.7950 akan membatalkan pengaturan ini. Saya akan menghindari mengejar perdagangan jika harga jatuh tanpa menawarkan entri yang direncanakan. APA YANG BISA MENGUBAH PANDANGAN SAYA? Perebutan kembali $0.7618 secara meyakinkan diikuti oleh pergerakan di atas $0.7894 dengan volume beli yang lebih kuat akan membuat saya mempertimbangkan kembali pandangan bearish ini. Itu akan menunjukkan bahwa pembeli akhirnya melakukan lebih dari sekadar mempertahankan harga yang lebih rendah. PEMIKIRAN AKHIR SUI telah menemukan pembeli di dekat $0.6754, tetapi menemukan support hanyalah permulaan. Ujian sebenarnya adalah apakah pembeli tersebut dapat merebut kembali level resistansi yang berulang kali menghentikan pemulihan. $SUIUSDT #ByXIMPACT

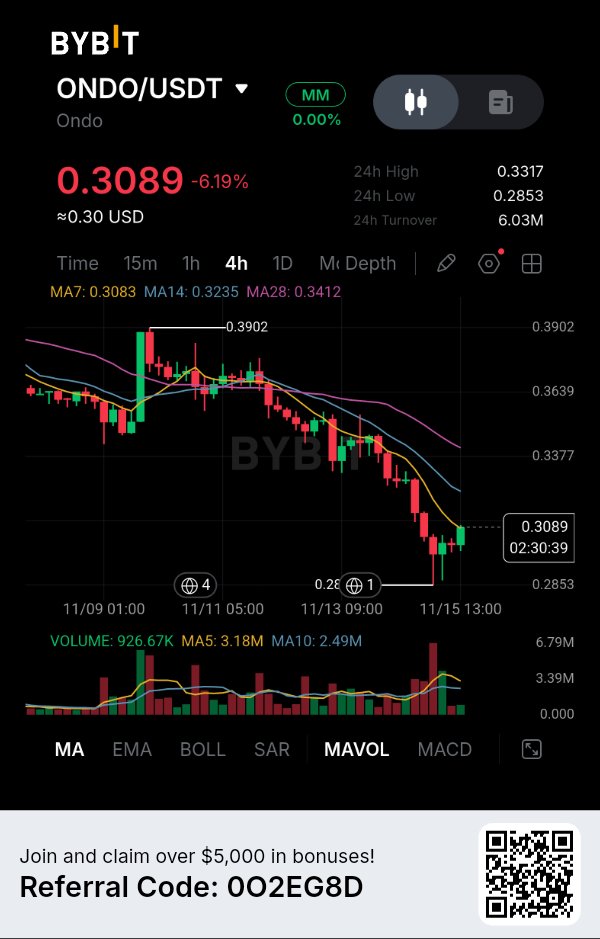
$ONDOUSDT — Adopsi Aset Dunia Nyata (RWA) Terus Meluas, Namun Token Ini Menghadapi Realitas Berbeda. ONDO mengalami tekanan jual bahkan saat sektor aset dunia nyata terus berkembang. Hal yang membuat grafik ini menarik adalah kesenjangan antara produk keuangan Ondo yang terus meluas dan kelemahan yang saat ini terlihat pada harga tokennya. Saya secara khusus tertarik dengan jadwal pasokan mendatang. Proyek ini sedang mengembangkan kasus penggunaan keuangan baru, tetapi pasar juga harus menyerap token tambahan seiring berjalannya waktu. DATA PASAR — GRAFIK 4J Berdasarkan grafik Bybit Anda: Harga saat ini: $0.3089 Perubahan 24J: -6.19% Tertinggi 24J: $0.3317 Terendah 24J: $0.2853 Omzet 24J: $6.03M MA7: $0.3083 MA14: $0.3235 MA28: $0.3412 Snapshot pasar terbaru pada 15 November menempatkan ONDO di kisaran $0.30, dengan kapitalisasi pasar sekitar $1.47B dan volume perdagangan global 24 jam sebesar $184M. Pasokan yang beredar adalah sekitar 4.87 miliar terhadap pasokan maksimum 10 miliar token. APA YANG DIUNGKAPKAN GRAFIK ONDO telah membentuk struktur penurunan setelah gagal mempertahankan pemulihan sebelumnya ke arah $0.3902. Harga sekarang diperdagangkan di bawah MA14 dan MA28, sementara MA7 berada di dekat harga saat ini. Ini menunjukkan bahwa pembeli jangka pendek sedang mencoba menstabilkan pasar, tetapi struktur 4J secara keseluruhan tetap lemah. Support terdekat berada di $0.2853. Pembeli bereaksi dari level ini, menghasilkan pemulihan kecil ke arah $0.3089. Namun, volume menceritakan sisi lain dari cerita ini. Volume yang ditampilkan terakhir adalah 926.67K, dibandingkan dengan MA5 di 3.18M dan MA10 di 2.49M. Rebound tersebut belum menunjukkan partisipasi yang meyakinkan. CERITA FUNDAMENTAL — ONDO MEMPERLUAS JANGKAUAN PRODUKNYA Satu perkembangan baru-baru ini menarik perhatian saya. Pada 14 November, Spout Finance mengumumkan rencana untuk pinjaman USDC yang didukung oleh saham AS yang ditokenisasi di Solana. Ondo adalah investor di Spout, dan pengumuman tersebut mengindikasikan bahwa aset yang ditokenisasi yang didukung Ondo diharapkan dapat diterima sebagai jaminan saat produk tersebut diluncurkan. Ini menarik karena aset keuangan yang ditokenisasi pada akhirnya bisa menjadi berguna selain sekadar menyimpannya. Menggunakannya sebagai jaminan memperkenalkan potensi aplikasi keuangan lainnya. Platform Ondo yang lebih luas juga melaporkan TVL sekitar $965.79M, menunjukkan bahwa ekosistem aset yang ditokenisasi memiliki modal substansial yang terkait dengannya. KONTRADIKSI TOKENOMICS Di sinilah saya menjadi lebih berhati-hati. Menurut jadwal unlock DefiLlama, sekitar 918.05 juta token ONDO dijadwalkan untuk unlock pada 17 Januari 2027. Pada harga referensi 15 November, alokasi tersebut bernilai sekitar $274.64 juta, setara dengan sekitar 18.85% dari pasokan yang beredar. Ini tidak berarti setiap token yang di-unlock akan langsung dijual. Namun, hal ini menciptakan pertimbangan pasokan yang berarti. Saat ini, sekitar 48.7% dari pasokan maksimum ONDO beredar. Itu menjadikan distribusi masa depan faktor penting saat mengevaluasi valuasinya. INTERPRETASI SAYA Saya terus kembali pada satu perbedaan: ekspansi produk Ondo dan permintaan token ONDO adalah dua hal yang terpisah. Saham yang ditokenisasi, produk keuangan, dan aplikasi jaminan dapat memperkuat ekosistem. Namun investor masih perlu memahami bagaimana perkembangan ini diterjemahkan menjadi nilai langsung bagi token aslinya. Unlock yang akan datang menambahkan variabel lain ke persamaan tersebut. RENCANA TRADING SAYA — SHORT KONDISIONAL Struktur 4J saat ini mendukung setup kelanjutan penurunan. Pemicu: Candle 4J ditutup di bawah $0.2853, diikuti oleh retest yang gagal. Entry: $0.2830–$0.2860. Stop-loss: $0.2960. TP1: $0.2750. TP2: $0.2650. TP3: $0.2550. Menggunakan entry representatif di $0.2845: Potensi penurunan ke TP3: 10.37%. Risiko terukur: 4.04%. Estimasi risk-to-reward: 2.57:1. TP2 dan TP3 adalah target yang diproyeksikan di bawah support grafik yang terlihat, bukan level support yang ditetapkan. Setup ini tetap tidak aktif sampai breakdown dan retest yang gagal terjadi. PANDANGAN AKHIR SAYA Ondo sedang membangun di sekitar tren keuangan penting: membawa aset tradisional ke dalam sistem keuangan berbasis blockchain. Namun menurut saya, ekspansi ekosistem saja tidak menjamin apresiasi harga token. Tantangan berikutnya adalah membuktikan bahwa produk keuangan baru dapat menghasilkan permintaan ekonomi yang berkelanjutan sementara pasokan yang beredar terus meningkat. Bagi ONDO, hubungan antara adopsi aset dunia nyata, utilitas token, dan pasokan masa depan mungkin menjadi lebih penting daripada pemulihan harga jangka pendek berikutnya. $ONDOUSDT #ByXIMPACT

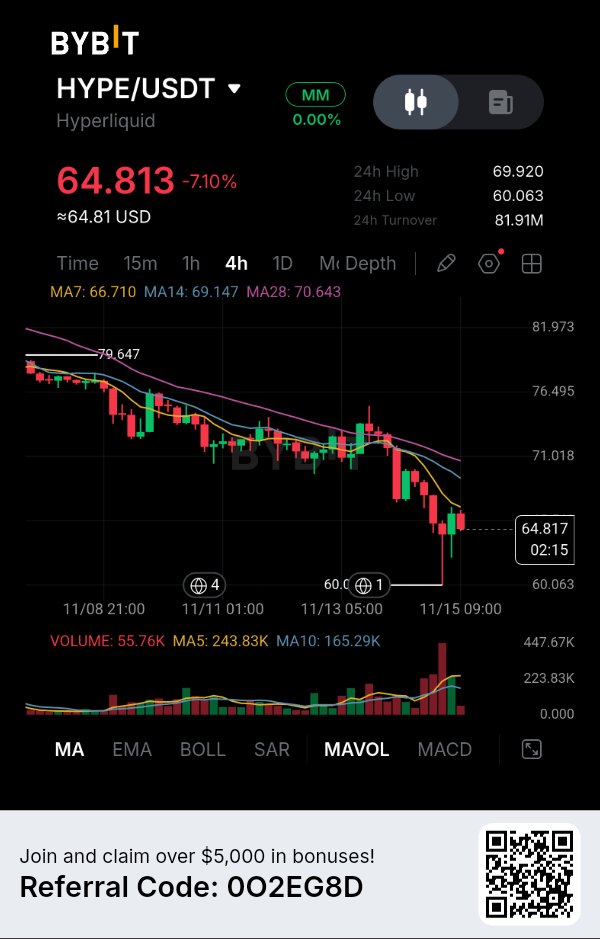
$HYPEUSDT — Pantulan dari $60,06 layak diperhatikan, tetapi struktur 4H yang lebih luas masih memberikan keunggulan bagi pihak penjual. Yang menarik perhatian saya adalah betapa tajamnya HYPE kehilangan pijakan setelah diperdagangkan di dekat area $79,64. Penurunan ini bukan sekadar koreksi kecil. Harga terus membentuk level tertinggi yang lebih rendah (lower highs), dan aksi jual terbaru mendorongnya ke arah $60,063 sebelum pembeli berhasil memicu pemulihan. HYPE saat ini diperdagangkan di sekitar $64,81, turun 7,10%. Meskipun rebound menunjukkan adanya minat beli, saya belum yakin bahwa penjual telah kehilangan kendali. Moving average menjelaskan mengapa saya bersikap hati-hati. MA7 berada di $66,71, MA14 di $69,14, dan MA28 di $70,64. Ketiganya tetap berada di atas harga saat ini, menciptakan area resistensi yang perlu ditembus oleh pembeli. Ada satu detail yang menurut saya sangat menarik: penolakan tajam di dekat $60,06 terjadi bersamaan dengan peningkatan aktivitas perdagangan. Pembeli merespons, tetapi pemulihan tersebut belum mengubah urutan level tertinggi yang lebih rendah. Saya tidak ingin menganggap reaksi dari support sebagai pembalikan tren yang terkonfirmasi. Pendekatan pilihan saya adalah memantau pemulihan menuju $66,70–$69,15. Jika HYPE mencapai area tersebut dan penjual kembali melakukan penolakan, saya yakin struktur bearish yang ada saat ini bisa menawarkan peluang short yang lebih baik. Saya mengincar $62 terlebih dahulu, diikuti oleh level terendah baru-baru ini di sekitar $60,06. Jika level tersebut ditembus dengan tekanan jual yang berkelanjutan, perpanjangan lebih lanjut menuju $57,50 menjadi mungkin terjadi. Manajemen Risiko Rencana trading kondisional saya adalah: Arah: SHORT Zona Entry: $66,70–$69,15 Stop Loss: $71,30 TP1: $62,00 TP2: $60,06 TP3: $57,50 (estimasi ekstensi) Saya ingin melihat konfirmasi bearish di dalam zona entry daripada sekadar memasang order hanya karena harga mencapainya. Pergerakan 4H yang berkelanjutan di atas $71,30 akan membatalkan setup khusus ini. Risiko terbesar yang saya lihat adalah pemulihan kuat lainnya dari area support $60. Jika pembeli berhasil merebut kembali moving average dan mulai membentuk level terendah yang lebih tinggi (higher lows), saya harus mempertimbangkan kembali pandangan bearish saya. Saya belajar bahwa setelah aksi jual tajam, kesabaran bisa lebih berharga daripada mencoba menangkap candle berikutnya. Untuk saat ini, saya mengamati apakah $HYPE mengubah pemulihan berikutnya menjadi level tertinggi yang lebih rendah (lower high) lagi, atau apakah pembeli akhirnya memiliki cukup kekuatan untuk menantang tren turun yang lebih luas. $HYPEUSDT #ByXIMPACT

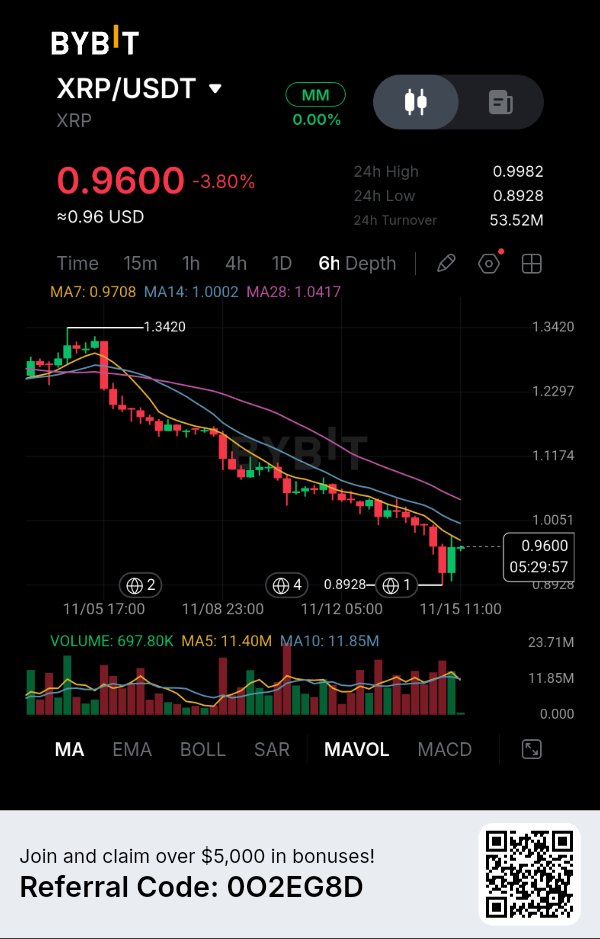
The Bounce From $0.8928 Looks Interesting, But Sellers Haven't Lost Control Yet. XRP has recovered from its recent low, but I am not treating this rebound as evidence of a trend reversal. What stands out on the 6-hour chart is the distance between the current price and the three moving averages. Buyers have managed to interrupt the decline, yet they still have several resistance levels to overcome before the broader structure can change. Sometimes the most important signal is not how strongly price bounces, but where that bounce starts losing momentum. MARKET STRUCTURE — THE DOWNTREND REMAINS INTACT XRP is currently trading around $0.9600, down 3.80%, with a 24-hour high of $0.9982 and a low of $0.8928. The broader 6-hour structure shows a persistent decline from approximately $1.3420. Lower highs and lower lows have dominated the chart, with several recovery attempts failing to establish a meaningful bullish reversal. The latest selling wave pushed XRP toward $0.8928, where buyers finally attempted to defend the market. Price has since recovered toward $0.9600, but this movement remains a short-term rebound inside a much larger declining structure. I want to see whether this recovery can reclaim resistance or whether sellers will use it as another opportunity to enter. THREE MOVING AVERAGES, ONE CLEAR MESSAGE The displayed moving averages are: - MA7: $0.9708 - MA14: $1.0002 - MA28: $1.0417 All three averages remain above the current price. Their bearish arrangement is particularly important because the fastest average is below the medium-term average, which is itself below the longer average. This suggests that the selling pressure is not limited to one isolated candle. The first resistance area is around $0.9708, followed by $1.0002. Above these levels, MA28 near $1.0417 represents another significant obstacle. For buyers, reclaiming these averages would be an important step toward repairing the damaged market structure. Until then, I remain cautious about calling this recovery a reversal. VOLUME — THE RECOVERY STILL NEEDS PARTICIPATION One detail deserves special attention. The displayed volume is approximately 697.80K, compared with MA5 at 11.40M and MA10 at 11.85M. Current volume is substantially below both displayed averages. This indicates that the latest recovery is not currently accompanied by strong volume participation relative to those averages. I would not automatically interpret this as sellers disappearing or buyers accumulating. Instead, I want to see whether trading activity expands when XRP approaches the moving-average resistance cluster. Without stronger participation, the recovery could struggle to develop into a sustainable upward move. THE $0.8928 LEVEL IS MORE IMPORTANT THAN IT LOOKS For me, the interesting part of this chart is the relationship between the recent low and the overhead resistance. Buyers have defended $0.8928, but they have not yet reclaimed the levels that previously acted as support during the decline. That creates an important imbalance. The market has demonstrated some willingness to buy lower prices, but it has not demonstrated enough strength to challenge the broader bearish structure. If XRP approaches $0.98–$1.00 and encounters another rejection, that could create a more attractive downside opportunity. However, a strong recovery above $1.0002 with expanding volume would make the bearish interpretation less convincing. MY TRADING STRATEGY — SHORT My preferred direction is SHORT, based on the prevailing 6-hour trend and the positioning of the moving averages. I would rather enter on a recovery into resistance than chase XRP after an already extended decline. - Direction: SHORT - Entry Zone: $0.9850–$0.9980 - Confirmation: 6H bearish rejection within the entry zone. - Stop Loss: $1.0250 - TP1: $0.8928 - TP2: $0.8600 - TP3: $0.8300 Estimated Risk/Reward: Approximately 1:2.6 to 1:5.0, depending on entry and execution. TP1 is based on the visible chart low, while TP2 and TP3 are projected downside extensions rather than confirmed support levels on this screenshot. A sustained 6-hour move above $1.0250 would invalidate this setup. If price declines without offering the planned entry, I would avoid chasing it. WHAT COULD CHANGE MY VIEW? A convincing reclaim of $1.0002 followed by stronger buying participation would weaken my bearish outlook. A subsequent move above $1.0417 would provide further evidence that the broader structure is improving. FINAL THOUGHT XRP has shown that buyers are willing to defend $0.8928. The next challenge is proving they can reclaim the resistance levels that sellers have controlled throughout this decline. A bounce can change the candles, but only a structural recovery can change the trend. $XRPUSDT #ByXIMPACT

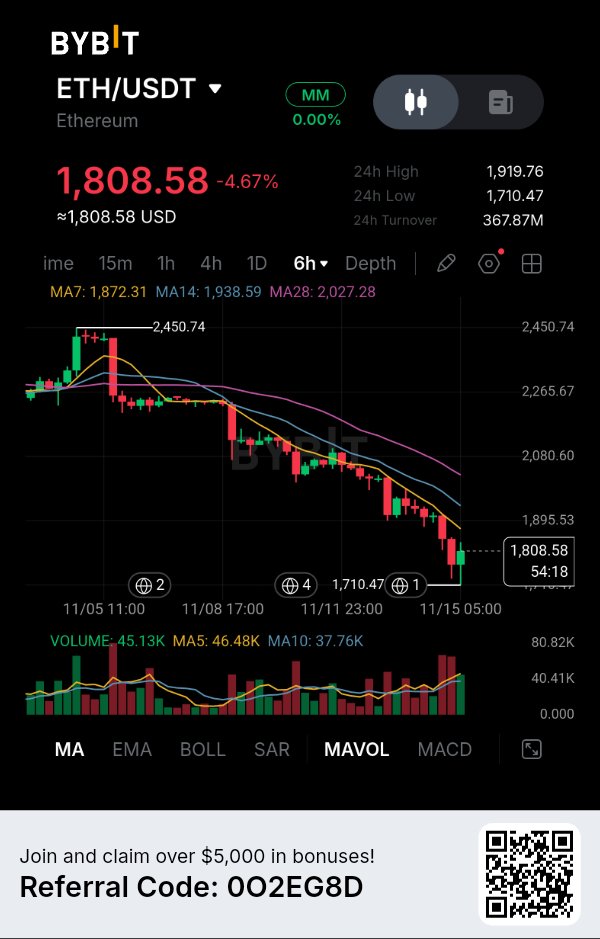
$ETHUSDT — Pemulihan dari $1.710 memang menarik, tapi saya belum yakin para pembeli telah melakukan cukup banyak upaya untuk mengubah struktur yang lebih besar. Ethereum diperdagangkan di sekitar $1.808,58 pada grafik 6 jam setelah penurunan berkepanjangan dari area $2.450. Yang menarik perhatian saya adalah reaksi terbaru di dekat $1.710,47. Pembeli berhasil mendorong harga menjauh dari level terendah tersebut, namun pemulihan ini masih menghadapi beberapa hambatan. Bagian yang menurut saya paling penting adalah posisi moving average (MA). MA7 berada di $1.872,31, MA14 di $1.938,59, dan MA28 di $2.027,28. Ketiganya tetap berada di atas harga saat ini dan mengarah ke bawah. Bagi saya, ini menunjukkan bahwa pasar belum membentuk struktur pemulihan yang meyakinkan. Pantulan dari support layak untuk diperhatikan, tetapi saya tidak ingin menganggapnya sebagai pembalikan tren yang terkonfirmasi. Saya secara khusus tertarik pada apa yang terjadi di sekitar $1.850–$1.872. Jika ETH kembali ke wilayah ini dan pembeli gagal merebut kembali MA7, penolakan (rejection) lainnya dapat memberikan peluang bagi penjual untuk melanjutkan tren yang ada. Skenario pilihan saya adalah posisi SHORT setelah konfirmasi penolakan tersebut. Saya tidak tertarik menjual hanya karena harga sudah turun. Saya lebih memilih membiarkan pasar pulih ke area resistance dan menunjukkan apakah penjual masih bersedia mempertahankannya. Target penurunan saya adalah $1.750 terlebih dahulu, diikuti oleh level terendah baru-baru ini di sekitar $1.710. Jika support tersebut ditembus dengan tekanan jual yang berlanjut, pergerakan lebih lanjut menuju $1.650 menjadi sebuah kemungkinan. Manajemen Risiko Setup kondisional saya menggunakan: Zona Entry: $1.850–$1.872 Stop Loss: $1.945 TP1: $1.750 TP2: $1.710 TP3: $1.650 (estimasi ekstensi) Pemulihan berkelanjutan di atas $1.945 akan membatalkan ide bearish khusus ini. Level-level ini adalah setup yang diusulkan, bukan posisi yang sudah dieksekusi. Saya juga tidak ingin mengabaikan kemungkinan pembeli mempertahankan $1.710 lagi. Jika ETH mulai merebut kembali moving average jangka pendeknya, saya harus mempertimbangkan kembali pandangan bearish saya daripada tetap terpaku pada satu arah. Saya telah belajar bahwa entry terbaik tidak selalu datang saat pasar bergerak paling cepat. Terkadang, peluang yang lebih penting muncul ketika harga kembali ke level di mana baik pembeli maupun penjual memiliki sesuatu untuk dibuktikan. Untuk saat ini, saya mengamati apakah ETH mengubah upaya pemulihan berikutnya menjadi lower high (puncak yang lebih rendah), atau akhirnya memberikan alasan bagi pembeli untuk menantang tren penurunan yang lebih luas. $ETHUSDT #ByXIMPACT

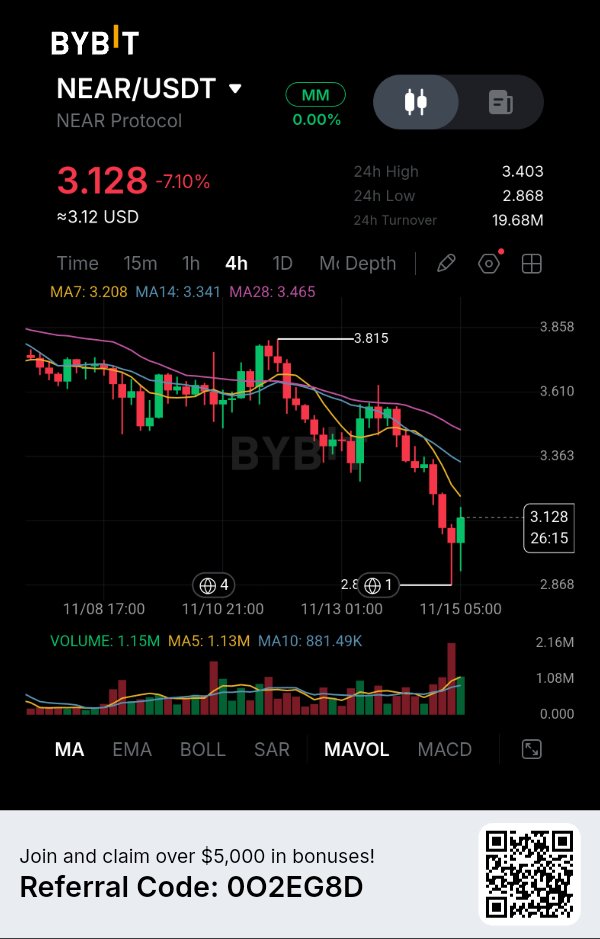
The $2.868 Level Has Become the Most Important Test for Buyers. NEAR has lost more than 7% on the 4H chart, and the interesting part is how quickly sellers pushed price below all three moving averages. Buyers managed to recover from $2.868, but I don't think one rebound is enough to change the market structure. What stands out to me is the combination of declining price, increasing trading activity and weakening DeFi liquidity. There is a difference between a project continuing to develop and its token finding genuine demand. MARKET DATA — YOUR BYBIT CHART Price: $3.128 24H change: -7.10% 24H high: $3.403 24H low: $2.868 24H turnover: $19.68M MA7: $3.208 MA14: $3.341 MA28: $3.465 These are the figures visible in your screenshot, not a live exchange quote. WHAT THE CHART IS REVEALING NEAR has been forming a declining structure after failing to sustain its recovery toward $3.815. The latest sell-off pushed price below MA7, MA14 and MA28. Their current positions also show a bearish alignment, with the longer moving average sitting highest. The $2.868 area is the immediate support to watch. Price reacted from that level, producing a recovery candle toward $3.128, but the bounce remains below MA7 at $3.208. Volume adds another detail. The displayed volume is 1.15M, slightly above MA5 at 1.13M and above MA10 at 881.49K. This indicates increased participation during the latest price movement. THE FUNDAMENTAL CONTRADICTION NEAR's infrastructure story remains active, but its economic data deserves closer attention. According to DefiLlama's November 14 data, NEAR's broader tracked ecosystem had approximately $265.38M in TVL, while 30-day fees reached $6.38M and protocol revenue reached $1.92M. However, TVL had declined approximately 23% over the previous 30 days. The native NEAR chain separately recorded approximately $149.33M in DeFi TVL, $133.38M in stablecoin value and $9.52M in daily DEX volume. This distinction matters because ecosystem-wide activity and native-chain liquidity are not the same thing. There is also a risk worth monitoring: DefiLlama records a $3.8M bridge and cross-chain security incident on October 1, 2026. This makes cross-chain security an important part of NEAR's infrastructure story, particularly as the ecosystem expands across multiple networks. For additional market context, CoinGlass reported NEAR around $2.94 on November 15, with a 14.53% 24-hour decline and approximately $659M in futures open interest. This is a separate live market snapshot, not the price shown in your Bybit screenshot. MY INTERPRETATION I keep coming back to the difference between network expansion and capital confidence. NEAR has meaningful infrastructure activity, but falling TVL and a declining token price suggest that ecosystem development isn't currently enough to offset broader selling pressure. I would pay particular attention to $2.868. If buyers cannot defend that level, the recovery attempt could lose its remaining strength. MY TRADING PLAN — CONDITIONAL SHORT I'm selecting SHORT because the 4H structure currently favors sellers. Trigger: 4H candle closes below $2.868, followed by a failed retest. Entry: $2.85–$2.87. Stop-loss: $2.98. TP1: $2.78. TP2: $2.68. TP3: $2.55. Using a representative entry of $2.86: Potential downside to TP3: 10.84%. Defined risk: 4.20%. Estimated risk-to-reward: 2.58:1. TP2 and TP3 are projected levels, not established support levels visible in the screenshot. This setup remains conditional; I would not enter before the breakdown and failed retest. MY FINAL VIEW NEAR is facing two different challenges: maintaining confidence in its ecosystem infrastructure and restoring demand for its native token. The next important signal isn't simply another green candle. It's whether buyers can defend meaningful support while the broader ecosystem demonstrates that its activity is translating into sustainable economic value. $NEARUSDT #ByXIMPACT

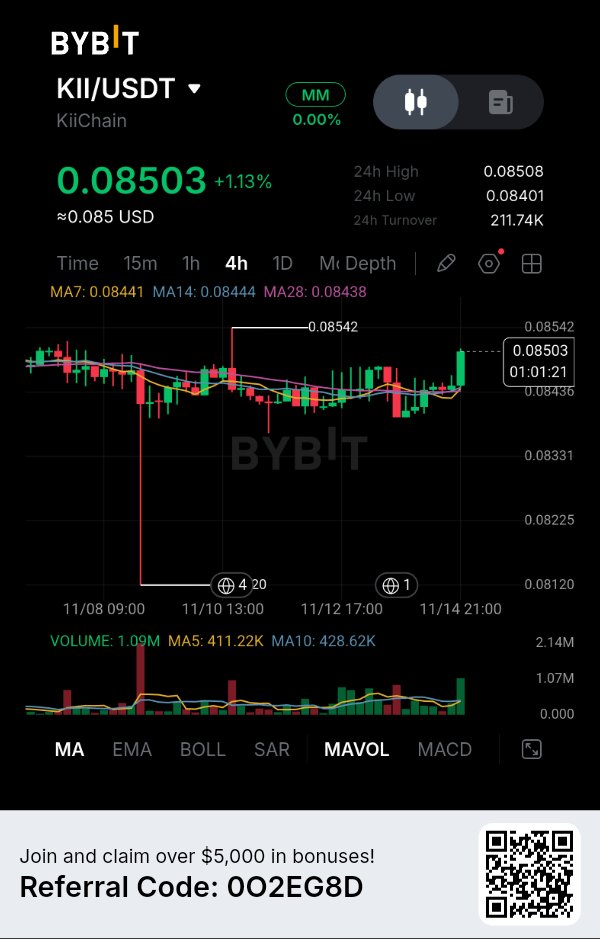
KiiChain Is Building Financial Infrastructure, But Its Token Supply Tells Another Story. KII is trading near $0.085, with buyers attempting to push price above a relatively tight consolidation range. What interests me is the contrast between KiiChain's expanding financial infrastructure and the amount of token supply that has yet to enter circulation. I think this is an important distinction: a blockchain can attract financial institutions and process real transactions, but its native token still needs a sustainable economic demand mechanism. MARKET DATA — 4H CHART According to your Bybit chart: Price: $0.08503 24H change: +1.13% 24H high: $0.08508 24H low: $0.08401 24H turnover: $211.74K MA7: $0.08441 MA14: $0.08444 MA28: $0.08438 The latest available market snapshot on November 15 places KII around $0.0844, with approximately $26.38M market capitalization and $5.81M daily volume. WHAT THE CHART IS REVEALING KII has been moving sideways around $0.0840–$0.0850, with a previous downside wick reaching approximately $0.08120. The interesting development is that price has moved above all three moving averages. MA7, MA14 and MA28 are clustered around $0.0844, suggesting that buyers have gained short-term control. The immediate resistance is $0.08542. A confirmed breakout above this level could give buyers room to challenge higher prices. Volume also deserves attention. The latest displayed volume is 1.09M, compared with MA5 at 411.22K and MA10 at 428.62K. Participation has increased, although sustained activity is still needed. THE PROJECT STORY — REAL FINANCIAL USE CASES KiiChain is developing infrastructure for cross-border payments, foreign-exchange liquidity and stablecoin settlement. On September 9, KiiChain announced agreements involving Financiera Juriscoop and Banco Agrario in Colombia. The objective is to connect regulated financial institutions with its 24/7 FX and settlement infrastructure. The announcement also reported more than $500M in processed volume and over 200 enterprise clients. Another development came on October 22, when Finoa Consensus Services confirmed its validator and oracle price-feeder role on KiiChain mainnet. This adds institutional infrastructure participation to the network. These developments matter because KiiChain is attempting to solve an actual financial infrastructure problem rather than relying exclusively on speculative blockchain activity. THE TOKENOMICS CONTRADICTION This is where I become more cautious. KII has a maximum supply of 1.8 billion tokens. Market-data providers report circulating supply figures ranging from approximately 312M to 354M, highlighting differences in their supply calculations. Its FDV is around $152M. There is also an important supply event. Tokenomics.com lists a November 14 unlock of approximately 17 million KII, representing around 0.9% of maximum supply. The scheduled date has passed, but the actual distribution and resulting market impact require confirmation. My interpretation is that KiiChain's infrastructure expansion is interesting, but future token emissions and unlocks could influence how much value existing holders retain. MY TRADING PLAN — CONDITIONAL LONG The short-term chart structure favors a conditional breakout attempt. Trigger: 4H candle closes above $0.08542, followed by a successful retest. Entry: $0.08540–$0.08555. Stop-loss: $0.08430. TP1: $0.08620. TP2: $0.08700. tP3: $0.08800. Using a representative entry of $0.08545: Potential upside to TP3: 2.99%. Defined risk: 1.35%. Estimated risk-to-reward: 2.21:1. The setup remains inactive until the breakout and retest occur. MY FINAL VIEW KiiChain's most interesting opportunity is its attempt to connect traditional financial workflows with always-on blockchain settlement. However, I don't think institutional integrations alone are enough to establish long-term token value. The real test is whether increasing FX activity, financial partnerships and network usage can create sustainable demand for KII while additional supply continues entering circulation. That's the relationship I will be watching most closely. $KIIUSDT #ByXIMPACT

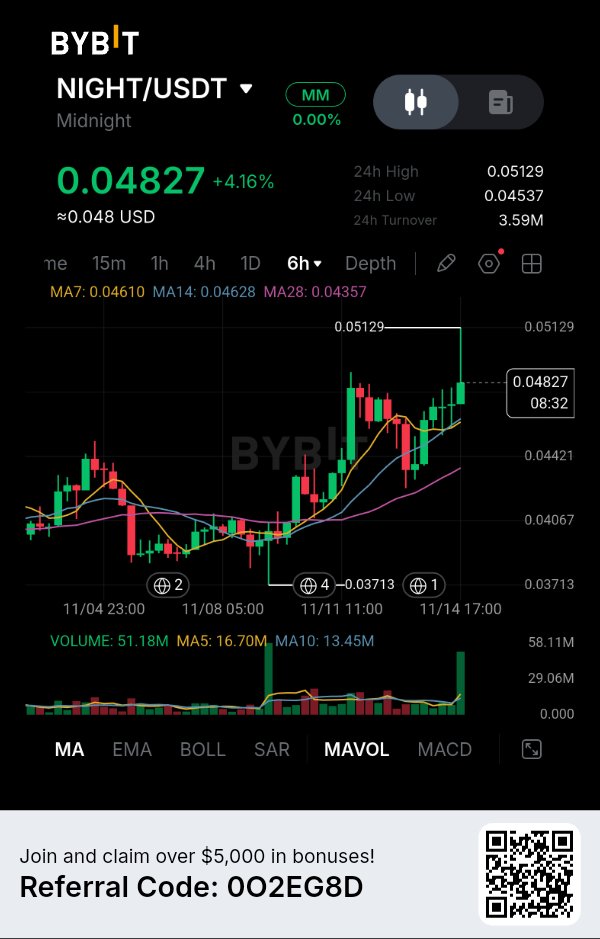
A Powerful Volume Expansion Is Changing the Short-Term Market Structure. NIGHT has gained 4.16%, but the most interesting development on this 6-hour chart is not the percentage increase. It is the combination of expanding volume, a strong recovery above all three moving averages, and a fresh attempt to challenge the $0.05129 resistance. What caught my attention is that this move looks different from the earlier sideways trading. Buyers are finally showing stronger participation, and the market is beginning to reflect that change. MARKET STRUCTURE — BUYERS HAVE TAKEN THE INITIATIVE NIGHT is currently trading around $0.04827, with a 24-hour high of $0.05129 and a low of $0.04537. Looking at the broader 6-hour structure, price previously spent considerable time consolidating around the $0.04000–$0.04200 region. The important change came when buyers pushed price above that range and accelerated the recovery. Since then, NIGHT has established stronger upward momentum, although the rejection near $0.05129 shows that sellers are still defending higher prices. I am particularly interested in whether the latest breakout can establish a higher support base rather than becoming another temporary upward spike. THE MOVING AVERAGES ARE SUPPORTING THE RECOVERY Three readings stand out: - MA7: $0.04610 - MA14: $0.04628 - MA28: $0.04357 Price is currently trading above all three moving averages. More importantly, the MA7 and MA14 are positioned above MA28, while price has moved considerably higher than the longer average. This suggests that short-term momentum has improved and the previous consolidation has developed into a stronger recovery structure. The $0.04610–$0.04628 region is particularly important because it contains both faster moving averages. If buyers defend this area during a pullback, it could become a useful foundation for another upward attempt. VOLUME — THIS IS THE SIGNAL I FIND MOST INTERESTING The volume data provides another important piece of evidence. - Current volume: 51.18M - MA5: 16.70M - MA10: 13.45M Current volume is substantially above both displayed averages. This is significant because the latest upward movement is accompanied by increased market participation. I would distinguish this from a low-volume price recovery, where a token rises without attracting meaningful trading activity. Here, the expansion in volume suggests that the latest move has attracted considerably more attention. However, high volume near resistance can also represent profit-taking. I want to see whether buyers can maintain participation rather than assuming every large volume candle represents accumulation. THE $0.05129 RESISTANCE BATTLE For me, this is where the next important decision will happen. NIGHT has already approached $0.05129, but the market has not yet established a convincing breakout above it. A successful 6-hour close above this level, supported by sustained volume, could open the door toward higher projected price areas. On the other hand, rejection followed by a breakdown below the moving-average support region would weaken the current bullish interpretation. The important distinction is that momentum has improved, but resistance still needs to be overcome. MY TRADING STRATEGY — LONG My preferred direction is LONG because the current price structure, moving-average positioning, and volume expansion favor buyers. I would prefer entering on a controlled pullback rather than chasing the latest green candle. - Direction: LONG - Entry Zone: $0.04650–$0.04720 - Confirmation: 6H support hold followed by renewed buying momentum. - Stop Loss: $0.04480 - TP1: $0.05129 - TP2: $0.05400 - TP3: $0.05700 Estimated Risk/Reward: Approximately 1:1.8 to 1:3.8, depending on entry and execution. TP1 is based on the visible resistance, while TP2 and TP3 are projected extensions rather than established resistance levels shown in the screenshot. A sustained 6-hour breakdown below $0.04480 would invalidate this setup. If price continues upward without offering the planned entry, I would avoid chasing it. WHAT COULD CHANGE MY VIEW? A rejection from $0.05129 followed by weakening volume and a loss of the moving-average support region would make me reconsider the bullish outlook. I want to see buyers defend the progress they have made, not simply create another temporary spike. FINAL THOUGHT NIGHT is showing something worth watching: price is rising alongside a substantial expansion in trading activity. The next challenge is turning that momentum into a sustainable breakout above resistance. $NIGHTUSDT #ByXIMPACT

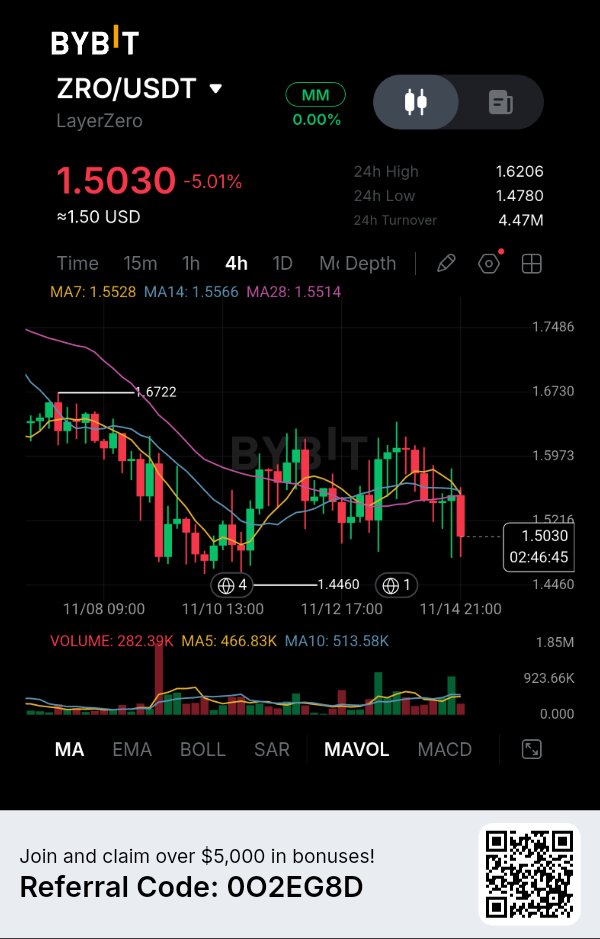
LayerZero Is Facing a Market Test as Selling Pressure Returns. ZRO is down 5.01% on the 4H chart, and what catches my attention is not just the decline. It's the fact that price has slipped below all three moving averages while approaching the $1.478 support area. For me, this creates an important question: is the market simply correcting after consolidation, or is demand weakening enough to push ZRO toward its previous swing low? MARKET DATA — 4H CHART Current price: $1.5030 24H change: -5.01% 24H high: $1.6206 24H low: $1.4780 24H turnover: $4.47M MA7: $1.5528 MA14: $1.5566 MA28: $1.5514 WHAT THE CHART IS REVEALING ZRO previously found support around $1.4460 and recovered toward the $1.60 region. However, buyers struggled to maintain that recovery. The latest decline has pushed price below MA7, MA14 and MA28. All three averages are clustered around $1.55, creating an overhead resistance zone. Another detail worth watching is volume. The latest displayed volume is 282.39K, below MA5 at 466.83K and MA10 at 513.58K. Selling pressure is visible, although the latest candle alone does not establish whether sellers are gaining sustained participation. The immediate support is $1.4780, followed by the previous swing low around $1.4460. THE FUNDAMENTAL STORY — A SUPPLY EVENT IS APPROACHING There is another reason I'm paying attention to ZRO right now. According to LayerZero's November 3 ecosystem update, holders of STG can continue converting their tokens into ZRO until December 15. The project is also updating ZRO's security configuration ahead of Zero mainnet, increasing the required DVN verification threshold to 4/4. The upcoming Zero mainnet launch, currently scheduled for November 30, is another important milestone. It could expand ZRO's role beyond governance into staking, gas payments and network security. But there's a supply consideration that deserves attention. DefiLlama's latest unlock schedule shows approximately 23.63 million ZRO tokens scheduled to unlock on November 19, worth around $35 million at the displayed valuation. This represents approximately 5.92% of the circulating float. That doesn't mean all unlocked tokens will immediately enter the market. However, it creates a potential supply overhang while traders are already dealing with weak technical structure. TOKEN ECONOMICS — AN IMPORTANT DISTINCTION LayerZero reports that its entities have deployed approximately $112.7 million into ZRO buybacks since September 2025. Stargate revenue has also been directed toward ZRO buybacks since April 2026. This creates an interesting economic structure: the project has mechanisms intended to connect ecosystem revenue with token demand, but upcoming unlocks introduce another variable. I think the market needs to evaluate both sides rather than focusing exclusively on buybacks or supply expansion. MY INTERPRETATION What stands out to me is the timing. Zero mainnet is approaching, LayerZero is strengthening its infrastructure, and the token has a scheduled unlock just days before the planned launch. The project has meaningful developments, but the token's immediate price behavior is showing hesitation. I would pay particular attention to whether the $1.478 support level survives. Losing it could expose the previous $1.446 low. MY TRADING PLAN — CONDITIONAL SHORT I'm selecting one direction because the current 4H structure favors downside continuation. Trigger: A confirmed 4H candle close below $1.478, followed by a failed retest. Entry: $1.465–$1.478. Stop-loss: $1.535. TP1: $1.446. TP2: $1.400. TP3: $1.350. Using a representative entry of $1.470: Potential downside to TP3: 8.16%. Defined risk: 4.42%. Estimated risk-to-reward: 1.85:1. This setup is conditional. I would not enter before the support breakdown and failed retest. MY FINAL VIEW LayerZero is approaching an important transition. Zero mainnet could introduce additional utility for ZRO, while the upcoming token unlock creates a near-term supply consideration. For me, the interesting question isn't simply whether LayerZero can expand its infrastructure. It's whether the upcoming network launch can create enough sustainable token demand to absorb new supply and strengthen the market structure. That relationship between network expansion, token economics and actual market demand is what makes ZRO worth watching. $ZROUSDT #ByXIMPACT

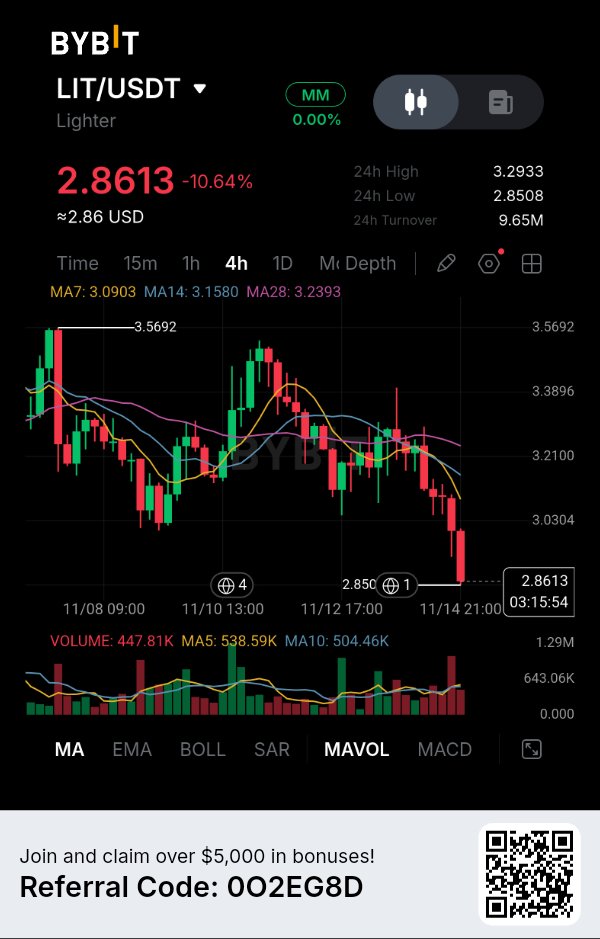
$LITUSDT — A 10.64% DROP, AND SELLERS ARE NOW TESTING THE LAST VISIBLE SUPPORT! What makes this chart interesting to me isn't just the sharp decline. It's the fact that LIT has finally broken below a consolidation area that previously kept price moving sideways. LIT is currently trading around $2.8613, down 10.64% on the 4H chart, after testing a low near $2.8508. The latest candles show strong selling pressure, and buyers haven't demonstrated a convincing recovery yet. THE TECHNICAL PICTURE The moving averages are showing a clear bearish alignment: MA7: $3.0903 MA14: $3.1580 MA28: $3.2393 Price is trading below all three averages, with the short-term MA7 positioned beneath MA14 and MA28. Another detail worth watching is volume: Current Volume: 447.81K MA5 Volume: 538.59K MA10 Volume: 504.46K The decline is significant, but I want to see whether selling participation increases if support breaks again. MY MARKET INTERPRETATION The $2.8508 area is the immediate level I'm watching. If LIT loses this support and a 4H candle confirms the breakdown, another downward move could develop. However, after such a sharp decline, chasing the current price doesn't look attractive to me. A weak recovery toward $3.00–$3.09 could offer a better opportunity if sellers reject that zone. MY CONDITIONAL TRADING PLAN — SHORT Entry Zone: $3.00–$3.09 Stop Loss: $3.17 TP1: $2.8508 TP2: $2.75 TP3: $2.65 INVALIDATION: A sustained 4H recovery above $3.17 would weaken this bearish setup. TP2 and TP3 are projected targets, not confirmed support levels on the visible chart. The short setup requires a confirmed rejection before entry. WHAT I'M WATCHING NEXT I don't want to assume that one large red candle guarantees another decline. The real test is whether buyers can defend $2.8508 or whether sellers turn this level into another resistance zone. If support fails, the market could open the door to further downside. Will $LIT defend $2.85, or are sellers preparing to push it toward $2.65? $LITUSDT #ByXIMPACT

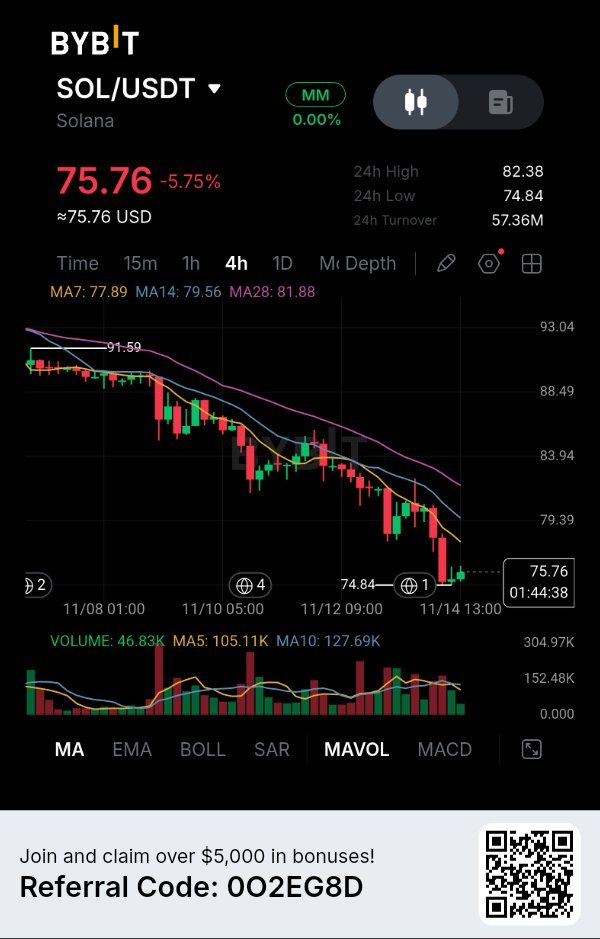
Solana Kehilangan Dukungan, dan Pantulan Terakhir Belum Meyakinkan. Solana telah turun 5,75%, tetapi detail yang paling menarik pada grafik 4 jam ini bukanlah besarnya penurunan. Melainkan betapa konsistennya penjual mempertahankan zona resistensi moving average. Setiap upaya pemulihan berjuang untuk mengubah struktur yang lebih luas, dan pergerakan terakhir menuju $74,84 menunjukkan pembeli masih berjuang keras. Saya sangat memperhatikan apakah level ini menjadi titik henti sementara atau sekadar jeda sebelum pergerakan penurunan berikutnya. STRUKTUR PASAR — PENJUAL MASIH MENGENDALIKAN TREN SOL saat ini diperdagangkan di sekitar $75,76, dengan harga tertinggi 24 jam di $82,38 dan terendah di $74,84. Looking pada grafik 4 jam, penurunan dari sekitar $91,59 telah berkembang menjadi rangkaian lower high dan lower low yang terus-menerus. Yang menonjol adalah absennya pemulihan struktural yang berarti. Pembeli telah mencoba beberapa rebound, tetapi pergerakan tersebut berulang kali menemui tekanan jual sebelum merebut kembali level swing sebelumnya. Penurunan terbaru telah membawa SOL mendekati level terendah barunya di $74,84. Ini adalah area penting karena penembusan yang tegas dapat membuka pintu bagi perpanjangan penurunan lainnya. MOVING AVERAGE MENGUNGKAPKAN GAMBARAN BESAR Tiga pembacaan teknis layak mendapat perhatian: - MA7: $77,89 - MA14: $79,56 - MA28: $81,88 Ketiga moving average berada di atas harga saat ini, dan pengaturannya tetap bearish. Average tercepat berada di bawah average jangka menengah, sementara keduanya tetap di bawah MA28. Ini memberi tahu saya bahwa pelemahan tidak terbatas pada candle terbaru. Tren 4 jam yang lebih luas juga berada di bawah tekanan. Wilayah $77,89–$79,56 adalah penghalang pemulihan penting pertama. Di atas itu, $81,88 mewakili resistensi moving average signifikan lainnya. Sampai SOL mulai merebut kembali level-level ini, saya akan berhati-hati dalam menafsirkan candle hijau jangka pendek sebagai pembalikan tren yang tulus. VOLUME — DETAIL YANG MEMBUAT PEMULIHAN MERAGUKAN Volume yang ditampilkan sekitar 46,83K, dibandingkan dengan: - MA5: 105,11K - MA10: 127,69K Volume saat ini jauh di bawah kedua rata-rata volume tersebut. Ini menunjukkan bahwa aktivitas perdagangan terbaru relatif tenang dibandingkan partisipasi baru-baru ini. Saya merasa ini penting karena pemulihan yang berkelanjutan membutuhkan lebih dari sekadar perubahan arah harga sementara. Jika pembeli ingin menantang struktur bearish yang ada, saya mengharapkan partisipasi yang lebih kuat selama pergerakan naik. Tanpa konfirmasi itu, setiap pemulihan menuju moving average dapat menarik tekanan jual yang diperbarui. PERTARUNGAN TERSEMBUNYI DI SEKITAR $74,84 Ada satu level yang menurut saya lebih layak mendapat perhatian daripada persentase perubahan harian: $74,84. Ini adalah level terendah yang terlihat baru-baru ini, dan SOL diperdagangkan relatif dekat dengannya. Pertahanan yang sukses dapat menghasilkan pantulan kelegaan jangka pendek menuju $77,89. Namun, tekanan berulang pada area dukungan yang sama bisa menjadi berbahaya bagi pembeli, terutama ketika struktur yang lebih luas terus menghasilkan lower high. Interpretasi saya adalah bahwa penjual saat ini memiliki keunggulan, tetapi saya ingin menghindari masuk langsung ke area dukungan. Peluang yang lebih menarik adalah pemulihan menuju resistensi di atas diikuti oleh bukti bahwa pembeli tidak dapat mempertahankan pergerakan tersebut. STRATEGI TRADING SAYA — SHORT Saat ini saya menyukai setup SHORT karena struktur 4 jam, penyelarasan moving average, dan perilaku harga baru-baru ini mendukung tekanan penurunan yang berkelanjutan. - Arah: SHORT - Zona Entri: $77,80–$78,80 - Konfirmasi: Penolakan bearish di dalam zona entri. - Stop Loss: $80,30 - TP1: $74,84 - TP2: $72,80 - TP3: $70,50 Estimasi Risiko/Imbalan: Sekitar 1:1,2 hingga 1:3,3, tergantung pada entri dan eksekusi. TP1 didasarkan pada level terendah grafik yang terlihat, sementara TP2 dan TP3 adalah proyeksi perpanjangan penurunan, bukan level dukungan yang dikonfirmasi yang ditunjukkan dalam tangkapan layar. Pergerakan 4 jam yang berkelanjutan di atas $80,30 akan membatalkan setup ini. Saya tidak akan mengejar harga jika SOL terus turun tanpa memberikan entri yang direncanakan. APA YANG BISA MENGUBAH PANDANGAN SAYA? Pemulihan kuat di atas $79,56, diikuti oleh keberhasilan merebut kembali $81,88 dengan volume yang meningkat, akan membuat saya mempertimbangkan kembali pandangan bearish. Itu akan menunjukkan bahwa pembeli akhirnya menantang struktur yang mengendalikan penurunan ini. PEMIKIRAN AKHIR Pergerakan penting Solana berikutnya mungkin tidak terlalu bergantung pada seberapa cepat ia bisa memantul, melainkan apakah pembeli dapat merebut kembali level-level yang berulang kali dipertahankan oleh penjual. Untuk saat ini, tren patut dihormati, dan kesabaran di sekitar resistensi lebih penting daripada mengejar setiap candle pemulihan. $SOLUSDT #ByXIMPACT

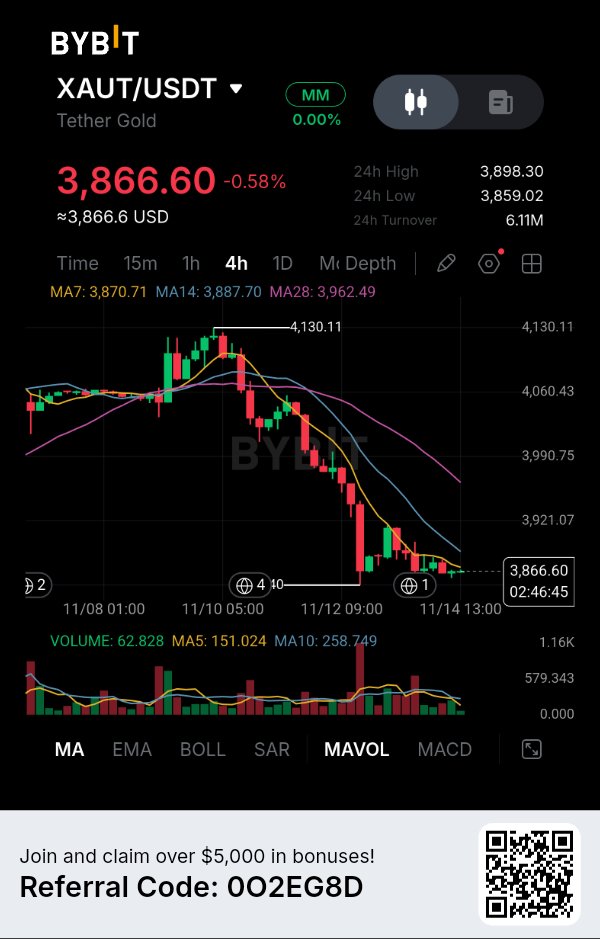
Emas Mempertahankan Nilainya, Tetapi Grafik 4J Menunjukkan Cerita yang Berbeda. Bagian menarik dari XAUT saat ini adalah perbedaan antara perannya sebagai aset yang didukung emas dan struktur pasarnya dalam jangka pendek. Eksposur emas mungkin tetap menarik, tetapi grafik menunjukkan bahwa pembeli belum mendapatkan kembali kendali setelah penurunan tajam. Saya memberikan perhatian khusus pada wilayah $3.850–$3.870 karena pasar sedang mencoba untuk stabil di sana setelah turun dari sekitar $4.130. DATA PASAR — GRAFIK 4J Harga saat ini: $3.866,60 Perubahan 24J: -0,58% Tertinggi 24J: $3.898,30 Terendah 24J: $3.859,02 Omzet 24J: $6,11 Juta MA7: $3.870,71 MA14: $3.887,70 MA28: $3.962,49 APA YANG DIUNGKAPKAN GRAFIK XAUT mengalami penurunan kuat dari area $4.130, diikuti oleh serangkaian level tertinggi yang lebih rendah (lower highs) dan level terendah yang lebih rendah (lower lows). Candle terbaru menunjukkan beberapa stabilisasi di sekitar $3.860, tetapi harga tetap berada di bawah ketiga moving average. MA7 di $3.870,71 adalah resistance terdekat, diikuti oleh MA14 di $3.887,70. Hambatan di atas (overhead barrier) yang lebih signifikan adalah MA28 di $3.962,49. Volume juga patut diperhatikan. Volume terbaru yang ditampilkan adalah 62,828, dibandingkan dengan volume MA5 sebesar 151,024 dan volume MA10 sebesar 258,749. Ini menunjukkan bahwa stabilisasi terbaru belum menarik partisipasi yang sangat kuat. CERITA FUNDAMENTAL — TONGGAK KEPERCAYAAN BARU UNTUK TETHER GOLD Perkembangan penting tiba pada 12 November. Tether mengumumkan bahwa KPMG U.S. menyelesaikan audit independen terhadap TG Commodities, penerbit XAUT, yang mencakup laporan keuangan tahun 2025 mereka. Audit tersebut menerima opini tanpa pengecualian (unqualified opinion), dan Tether melaporkan bahwa batangan emas fisik yang mendukung token tersebut telah diperiksa dan dihitung secara fisik. Untuk aset digital yang didukung emas, hal ini penting karena proposisi nilainya bergantung pada lebih dari sekadar permintaan pasar. Investor juga membutuhkan keyakinan bahwa emas fisik yang mendasarinya benar-benar ada. Ada angka signifikan lainnya. Menurut laporan cadangan Tether per 30 September 2026, XAUT didukung oleh 827.417,63 fine troy ounce emas fisik, setara dengan sekitar 25,7 metrik ton. Nilai cadangan yang dilaporkan mencapai $3,44 miliar. Setiap XAUT mewakili kepemilikan atas satu fine troy ounce emas. Ini memberi XAUT model valuasi yang secara fundamental berbeda dari mata uang kripto konvensional. KONTRADIKSI PASAR Meskipun ada kemajuan dalam transparansi cadangan ini, pasar telah mengalami koreksi yang nyata. Data historis CoinGecko per 14 November menempatkan kapitalisasi pasar XAUT di sekitar $3,13 miliar, dengan volume perdagangan 24 jam sekitar $193 juta. Harga penutupannya pada 13 November adalah sekitar $3.872,86. Yang menarik bagi saya adalah bahwa peningkatan transparansi cadangan tidak secara otomatis mencegah penurunan harga dalam jangka pendek. XAUT mengikuti pasar emas yang mendasarinya. Oleh karena itu, harganya dapat turun bahkan ketika dukungan fisik tetap utuh. Perbedaan itu penting saat mengevaluasi aset ini. INTERPRETASI TEKNIS SAYA Grafik 4J menunjukkan penurunan yang jelas dari sekitar $4.130 ke wilayah $3.850–$3.860. Harga saat ini sebesar $3.866,60 tetap berada di bawah: MA7: $3.870,71 MA14: $3.887,70 MA28: $3.962,49 Ketiga moving average diposisikan di atas pasar, yang menunjukkan bahwa pemulihan belum mengubah struktur jangka pendek. Zona resistance langsung adalah $3.870–$3.900. Area $3.859 adalah support terdekat pertama yang penting, berdasarkan level terendah 24 jam yang ditampilkan. Volume juga tetap relatif terbatas dibandingkan dengan moving average yang ditampilkan, menunjukkan bahwa pembeli belum menunjukkan partisipasi yang kuat. RENCANA TRADING SAYA — SHORT KONDISIONAL Saya memantau terjadinya breakdown pada support $3.859 daripada masuk hanya karena grafiknya terlihat lemah. Pemicu: Candle 4J ditutup di bawah $3.859, diikuti oleh retest yang gagal. Entry: $3.855–$3.860. Stop-loss: $3.898. TP1: $3.840. TP2: $3.815. TP3: $3.785. Menggunakan entry representatif di $3.857,50: Potensi penurunan ke TP3: 1,88%. Risiko yang ditentukan: 1,05%. Estimasi risk-to-reward: 1,79:1. Target yang lebih rendah adalah level yang diproyeksikan, bukan zona support historis yang terkonfirmasi. Setup ini tetap tidak aktif sampai kondisi breakdown dan retest terjadi. PANDANGAN AKHIR SAYA Saya merasa XAUT menarik karena menghubungkan kepemilikan emas tradisional dengan transfer aset berbasis blockchain. Audit KPMG baru-baru ini memperkuat cerita transparansi, sementara cadangan fisik yang dilaporkan memberikan fondasi penting bagi proposisi nilainya. Namun, saya memisahkan keyakinan pada dukungan aset dari keyakinan pada arah harga jangka pendek. Untuk saat ini, grafik tetap di bawah tekanan, dan $3.859 adalah level yang saya pantau. Cerita yang lebih besar adalah apakah emas yang ditokenisasi dapat terus berkembang sebagai instrumen keuangan sambil mempertahankan transparansi dan dukungan fisik yang membuatnya berharga sejak awal. $XAUTUSDT #ByXIMPACT

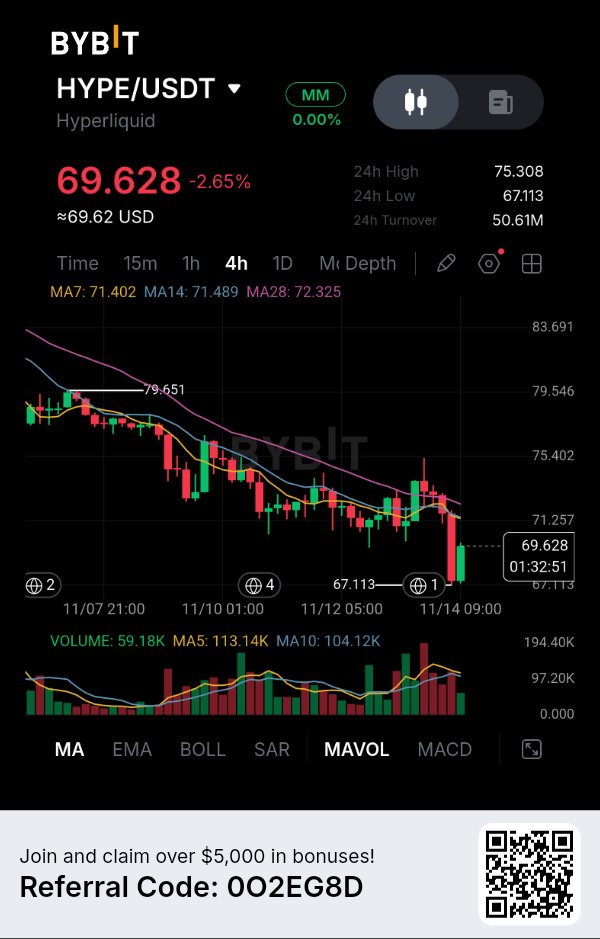
$HYPEUSDT — PENURUNAN TAJAM KE $67.11, TAPI PEMULIHANNYA BELUM TERLIHAT MEYAKINKAN! Yang menarik perhatian saya pada grafik 4H adalah betapa cepatnya HYPE kehilangan pijakan setelah gagal mempertahankan upaya pemulihannya. Harga saat ini diperdagangkan di sekitar $69.628, turun 2,65%, setelah sempat jatuh ke $67.113 sebelum menghasilkan rebound kecil. Rebound itu layak untuk diperhatikan, tetapi saya belum melihat cukup bukti untuk menyebutnya sebagai pembalikan tren. CERITA TEKNIKAL Moving average memberikan gambaran yang jelas tentang tekanan saat ini: MA7: $71.402 MA14: $71.489 MA28: $72.325 Ketiga rata-rata tersebut berada di atas harga saat ini. Ini menunjukkan bahwa struktur 4H yang lebih luas tetap bearish. Detail lain menarik perhatian saya: volume yang ditampilkan adalah 59.18K, sementara rata-rata volume MA5 dan MA10 adalah 113.14K dan 104.12K. Pemulihan terakhir memerlukan partisipasi yang lebih kuat sebelum saya mempertimbangkannya sebagai perubahan momentum yang berarti. LEVEL YANG PENTING Area resistance terdekat berada di kisaran $71.40–$72.33. Jika HYPE mencoba pulih ke zona ini tetapi gagal untuk merebutnya kembali, penjual bisa mendapatkan peluang lagi. Level terendah $67.113 tetap menjadi acuan sisi bawah yang penting. RENCANA TRADING KONDISIONAL SAYA — SHORT Saya tertarik untuk mengambil posisi short hanya jika harga menghasilkan pemulihan yang lemah dan mengonfirmasi penolakan. Zona Entry: $71.40–$72.30 Stop Loss: $73.30 TP1: $67.15 TP2: $65.80 TP3: $64.50 INVALIDASI: Breakout 4H yang berkelanjutan di atas $73.30 akan membatalkan pengaturan short yang diusulkan ini. TP2 dan TP3 adalah target proyeksi, bukan level support yang dikonfirmasi pada grafik yang terlihat. APA YANG SAYA TUNGGU Saya tidak ingin mengejar HYPE setelah penurunan yang tajam. Saya lebih suka melihat harga mengunjungi kembali resistance, gagal membangun penerimaan di atas moving average, dan memberi penjual peluang lain. Pertanyaan menarik sekarang adalah apakah $67.11 hanyalah titik berhenti sementara atau awal dari koreksi yang lebih dalam. Bisakah HYPE merebut kembali $72, atau akankah penjual menggunakan pemulihan berikutnya untuk mendorong harga lebih rendah? $HYPEUSDT #ByXIMPACT

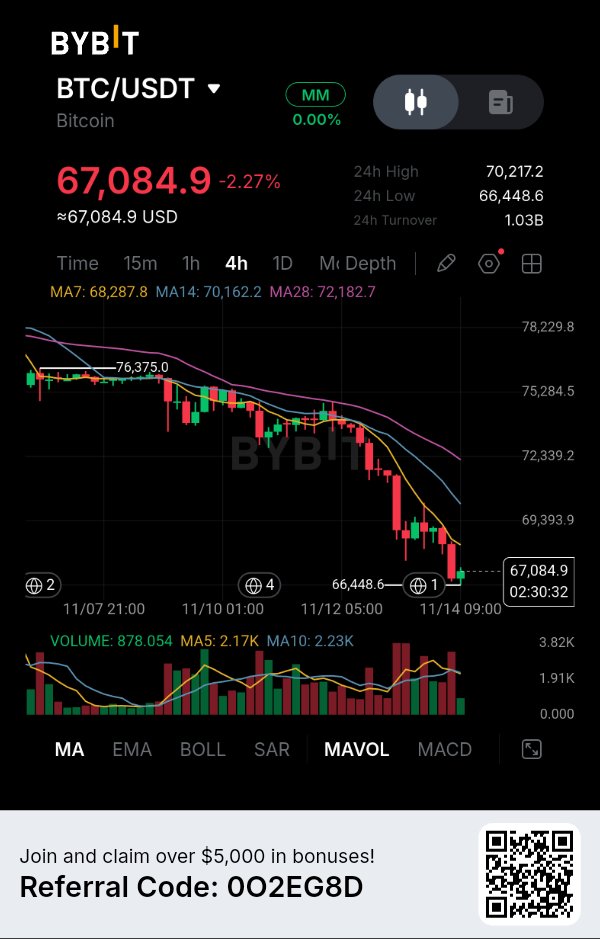
Bitcoin Is Approaching a Critical Support, But the Bigger Problem Is What Happened Before It Got Here. Bitcoin is trading near $67,084 after another significant decline, but what concerns me most is not the latest red candle. It is the speed at which buyers have lost control of the 4-hour market structure. Every recovery attempt has struggled to challenge the previous resistance, while the moving averages continue to point downward. I believe the current price action deserves more attention than simply calling this another market correction. MARKET STRUCTURE — SELLERS HAVE THE ADVANTAGE BTC is currently trading around $67,084.9, down 2.27%, with a 24-hour high of $70,217.2 and a low of $66,448.6. Looking at the 4-hour chart, Bitcoin has declined from approximately $76,375, creating a sequence of lower highs and lower lows. The latest selling wave pushed price toward $66,448.6, where some buying interest appeared. We can now see a small recovery candle near $67,084. However, I am not interpreting this bounce as a reversal. The broader structure remains bearish, and Bitcoin has not reclaimed any major moving-average resistance. Until that changes, sellers have the stronger technical position. THE MOVING AVERAGES REVEAL THE REAL PROBLEM Three readings stand out: - MA7: $68,287.8 - MA14: $70,162.2 - MA28: $72,182.7 All three moving averages are positioned above the current price. Even more importantly, they are arranged in bearish order, with MA7 below MA14 and MA14 below MA28. This reflects persistent downward momentum across the displayed moving-average periods. The first recovery challenge is around $68,287, followed by the much stronger resistance region near $70,162. For me, these levels represent more than technical lines. They are areas where a recovery must prove that buyers can actually regain control. VOLUME — THE BOUNCE NEEDS MORE PARTICIPATION Another detail caught my attention. The displayed volume is approximately 878.054, compared with MA5 at 2.17K and MA10 at 2.23K. Current volume is considerably below both averages. This suggests that the latest small recovery candle does not yet demonstrate strong buying participation. Meanwhile, the preceding decline contained several substantial volume bars, showing that the selling phase attracted significant market activity. I would therefore be careful about treating the current bounce as evidence of strong accumulation. A recovery needs participation, not just a change in candle color. THE DETAIL MANY TRADERS MAY OVERLOOK Bitcoin is approaching an important psychological decision point. After falling from above $76,000, the market is now attempting to stabilize around $67,000. But there is a difference between finding temporary support and building a sustainable recovery. The $66,448 region is the immediate level I am watching. If sellers break it convincingly, the market could extend its correction toward lower price areas. On the other hand, reclaiming $68,287 with stronger volume would be the first indication that downside momentum is weakening. My concern is that traders may become too optimistic after seeing a small bounce while the broader technical structure remains under pressure. MY TRADING STRATEGY — SHORT My preferred direction remains SHORT, ideally after a temporary recovery into resistance rather than chasing Bitcoin near its recent low. - Direction: SHORT - Entry Zone: $69,200–$69,800 - Confirmation: 4H bearish rejection within the entry zone. - Stop Loss: $70,500 - TP1: $66,450 - TP2: $65,500 - TP3: $64,500 Estimated Risk/Reward: Approximately 1:1.5 to 1:3.3, depending on entry and execution. TP1 is based on the visible recent low, while TP2 and TP3 are projected downside extensions rather than confirmed support levels on this screenshot. A sustained move above $70,500 would invalidate this setup. If Bitcoin continues falling without providing the planned entry, I would not chase the move. WHAT COULD CHANGE MY VIEW? A strong 4-hour recovery above $70,162, supported by expanding volume, would make me reconsider the bearish outlook. Reclaiming that moving average would represent a meaningful improvement in market structure. Until then, I prefer to respect the prevailing trend instead of anticipating a reversal. FINAL THOUGHT Bitcoin does not need another temporary bounce to change the market narrative. It needs to reclaim important resistance and prove that buyers can sustain control. Until that happens, the recovery remains something to question rather than celebrate. $BTCUSDT #ByXIMPACT

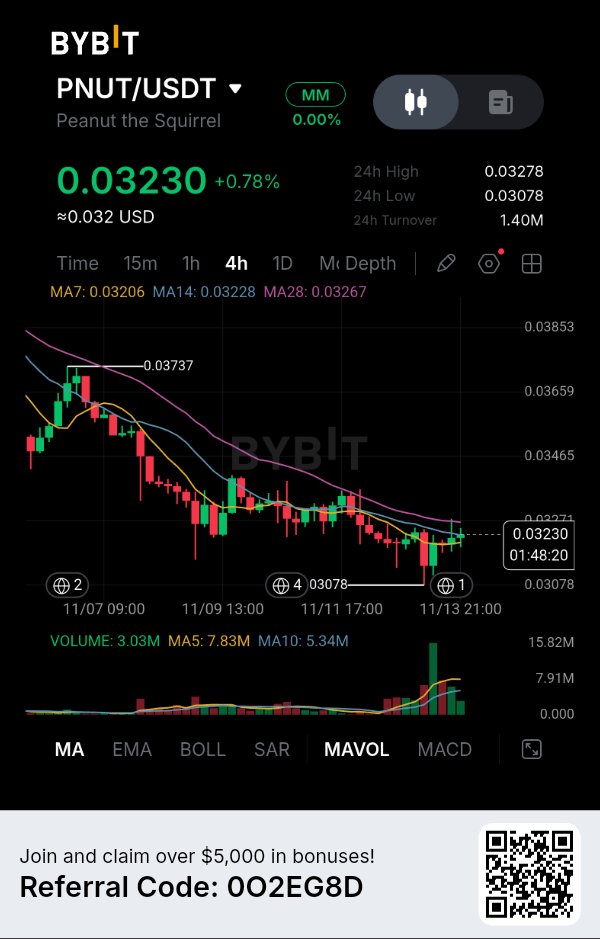
$PNUTUSDT Buyers Are Attempting a Recovery, But One Resistance Zone Could Decide the Next Move. PNUT has started showing signs of recovery after touching $0.03078, but I am not convinced that buyers have regained control. The interesting part of this chart is the difference between short-term momentum and the broader trend: price is recovering above its fastest moving average while remaining underneath the longer moving-average resistance. That creates a potentially important decision point for the next 4-hour candles. MARKET STRUCTURE — A RECOVERY INSIDE A DECLINING TREND PNUT is currently trading around $0.03230, up 0.78%, with a 24-hour high of $0.03278 and a low of $0.03078. Looking at the broader 4-hour structure, the token has declined from approximately $0.03737, establishing a sequence of lower highs and lower price levels. Recently, sellers pushed price toward $0.03078, where buyers appeared and attempted to stabilize the market. The latest candles show some recovery, but the larger descending structure remains intact. For me, this is an important distinction. A recovery from support can create a trading opportunity without necessarily confirming a complete trend reversal. THE MOVING AVERAGE BATTLE The displayed moving averages provide three important reference points: - MA7: $0.03206 - MA14: $0.03228 - MA28: $0.03267 Price has moved above MA7 and is trading around MA14, which suggests that immediate selling pressure has eased. However, MA28 remains overhead resistance. I am particularly interested in the $0.03260–$0.03278 region. This area combines the longer moving average with the recent 24-hour high. If buyers cannot reclaim this region, the current recovery could turn into another lower high. That would reinforce the existing bearish market structure. VOLUME — A RECOVERY THAT STILL NEEDS CONFIRMATION There is another detail worth examining. The displayed volume is approximately 3.03M, while MA5 stands at 7.83M and MA10 at 5.34M. Current volume is below both averages. The chart also shows a noticeable earlier green volume expansion during the recent recovery attempt. However, participation has subsequently cooled. This is where I become cautious. Price is recovering, but the latest volume reading does not demonstrate sustained buying strength. I would want to see stronger participation before treating this move as a genuine bullish breakout. A price increase without consistent volume expansion can struggle when it reaches established resistance. THE DETAIL OTHER TRADERS MIGHT MISS The most interesting part of PNUT's current structure is that buyers have managed to defend the $0.03078 region, but they have not yet changed the sequence of lower highs. This means the market is currently showing two different signals. Short-term stabilization is visible, while the broader trend still favors sellers. I believe the resistance region around $0.03267–$0.03278 deserves more attention than the current 0.78% gain. If sellers defend this area again, PNUT could revisit its recent support. MY TRADING STRATEGY — SHORT My preferred scenario is a conditional SHORT on a failed recovery into resistance. - Direction: SHORT - Entry Zone: $0.03255–$0.03275 - Trigger: Bearish rejection from the resistance zone on the 4H chart. - Stop Loss: $0.03305 - TP1: $0.03150 - TP2: $0.03078 - TP3: $0.03020 Estimated Risk/Reward: Approximately 1:2.3 to 1:4.9, depending on entry and execution. TP1 is an intermediate projected support, TP2 is the visible chart low, and TP3 is an estimated extension below the displayed structure. A sustained 4-hour reclaim above $0.03305 would invalidate this short setup. I would also avoid chasing the trade if price falls without offering the planned entry. WHAT COULD CHANGE MY VIEW? A strong 4-hour breakout above $0.03278, supported by expanding volume, would weaken my bearish interpretation. Reclaiming MA28 and establishing higher highs would provide stronger evidence that buyers are taking control. Until then, I see the current recovery as a test of resistance rather than proof of a new uptrend. FINAL THOUGHT PNUT has shown that buyers are willing to defend lower prices. Now the market needs to prove they can do more than defend support — they need to overcome the resistance that has controlled the broader trend. $PNUTUSDT #ByXIMPACT