Marco
20480いいね0シェア417ファン1フォロー
Professional Trader | Technical Analyst | Risk Management Focused | Helping traders navigate the markets through disciplined strategies and data-driven decision
Professional Trader | Technical Analyst | Risk Management Focused | Helping traders navigate the markets through disciplined strategies and data-driven decision
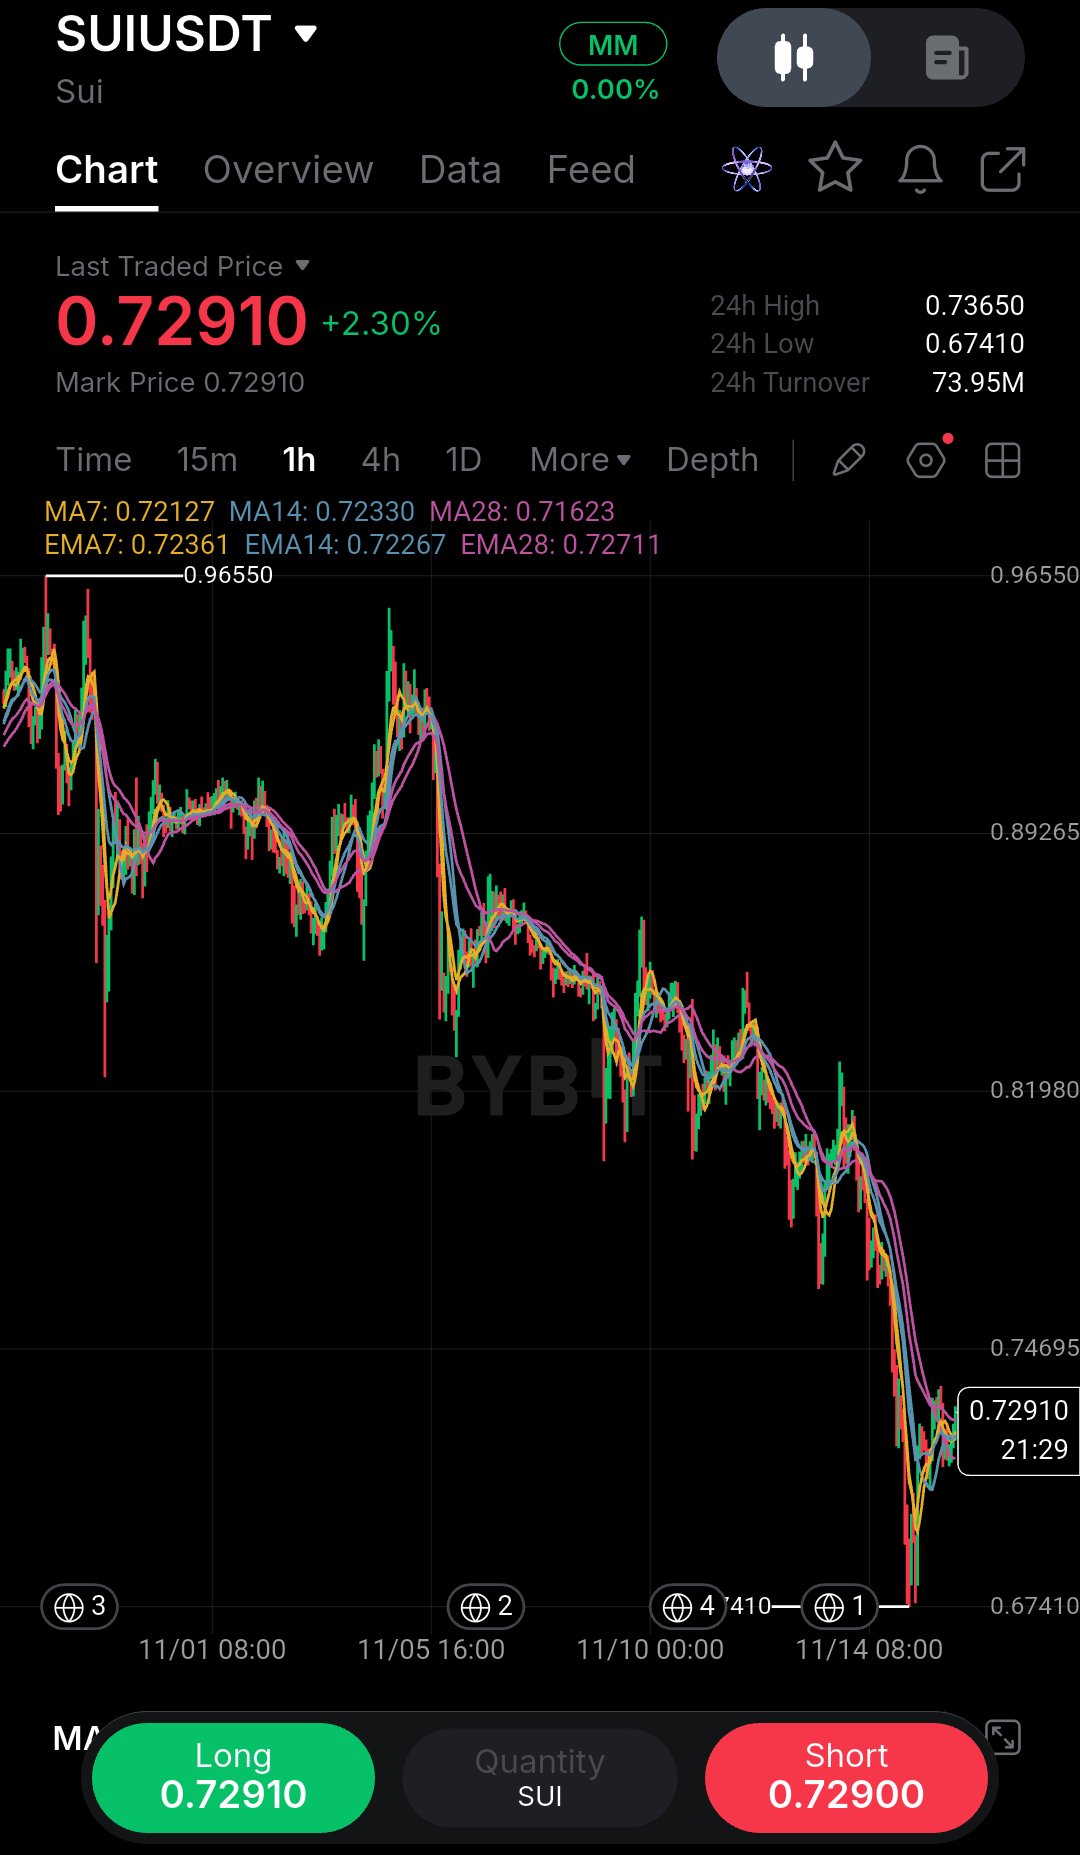
このSUIのチャートは危うく見逃すところでしたが、右側の移動平均線と価格がどのように反応しているかに気づき、注目しました。 1時間足で見ると、マクロトレンドは0.96550の高値から0.67410の安値まで大きく下落していました。しかし、直近の値動きをズームインしてみると、激しい売りは沈静化しており、価格を0.72910(+2.30%)まで押し戻す強力でアグレッシブなV字回復が見られます。 ここで重要なポイントは、価格が現在、扇状に広がった移動平均線クラスターのすぐ上で推移していることです。MA7(0.72127)、MA14(0.72330)、MA28(0.71623)がいずれも下値支持線(ダイナミックサポート)として機能しています。 これは教科書的な構造転換です。ダウントレンドが安値を更新しなくなり、価格が移動平均線をアグレッシブに回復したときは、売り手が枯渇したことを示唆します。ただし、現在はローカルなレジスタンスゾーンを試している段階であり、完全な反転ではなく、あくまで戦術的なリバウンドに過ぎません。 落ちるナイフを掴もうとして学んだ教訓は、底値で買うのではなく、構造転換の確認を待ってから買うべきだということです。 トレードプラン: バイアス:短期強気(回復局面を狙う)。 エントリーゾーン:0.7200 – 0.7250(MAクラスターの再テストを狙った小幅な押し目を待つ)。 損切り(ストップロス):0.6740(直近のローカルスイング安値のすぐ下)。 ターゲット1:0.7365(24時間高値および当面のレジスタンス)。 ターゲット2:0.8198(レンジ中間のマクロレジスタンス)。 ターゲット3:0.8926(前回のブレイクダウン水準)。 リスク・リワード:1:2.5 無効条件:1時間足が0.7100を割り込んで確定した場合。これはローカルな上昇トレンドのサポート喪失を意味します。 この荒い値動きの途中でFOMO(乗り遅れる恐怖)に駆られないように。1時間足が強く確定するのを待ち、ストップロスを遵守し、許容範囲以上のリスクを取らないようにしましょう。 SUIはついにリリーフラリーの準備が整ったと思いますか?それとも、これは次の下落に向けた一時的な小休止に過ぎないのでしょうか? $SUIUSDT #ByXIMPACT
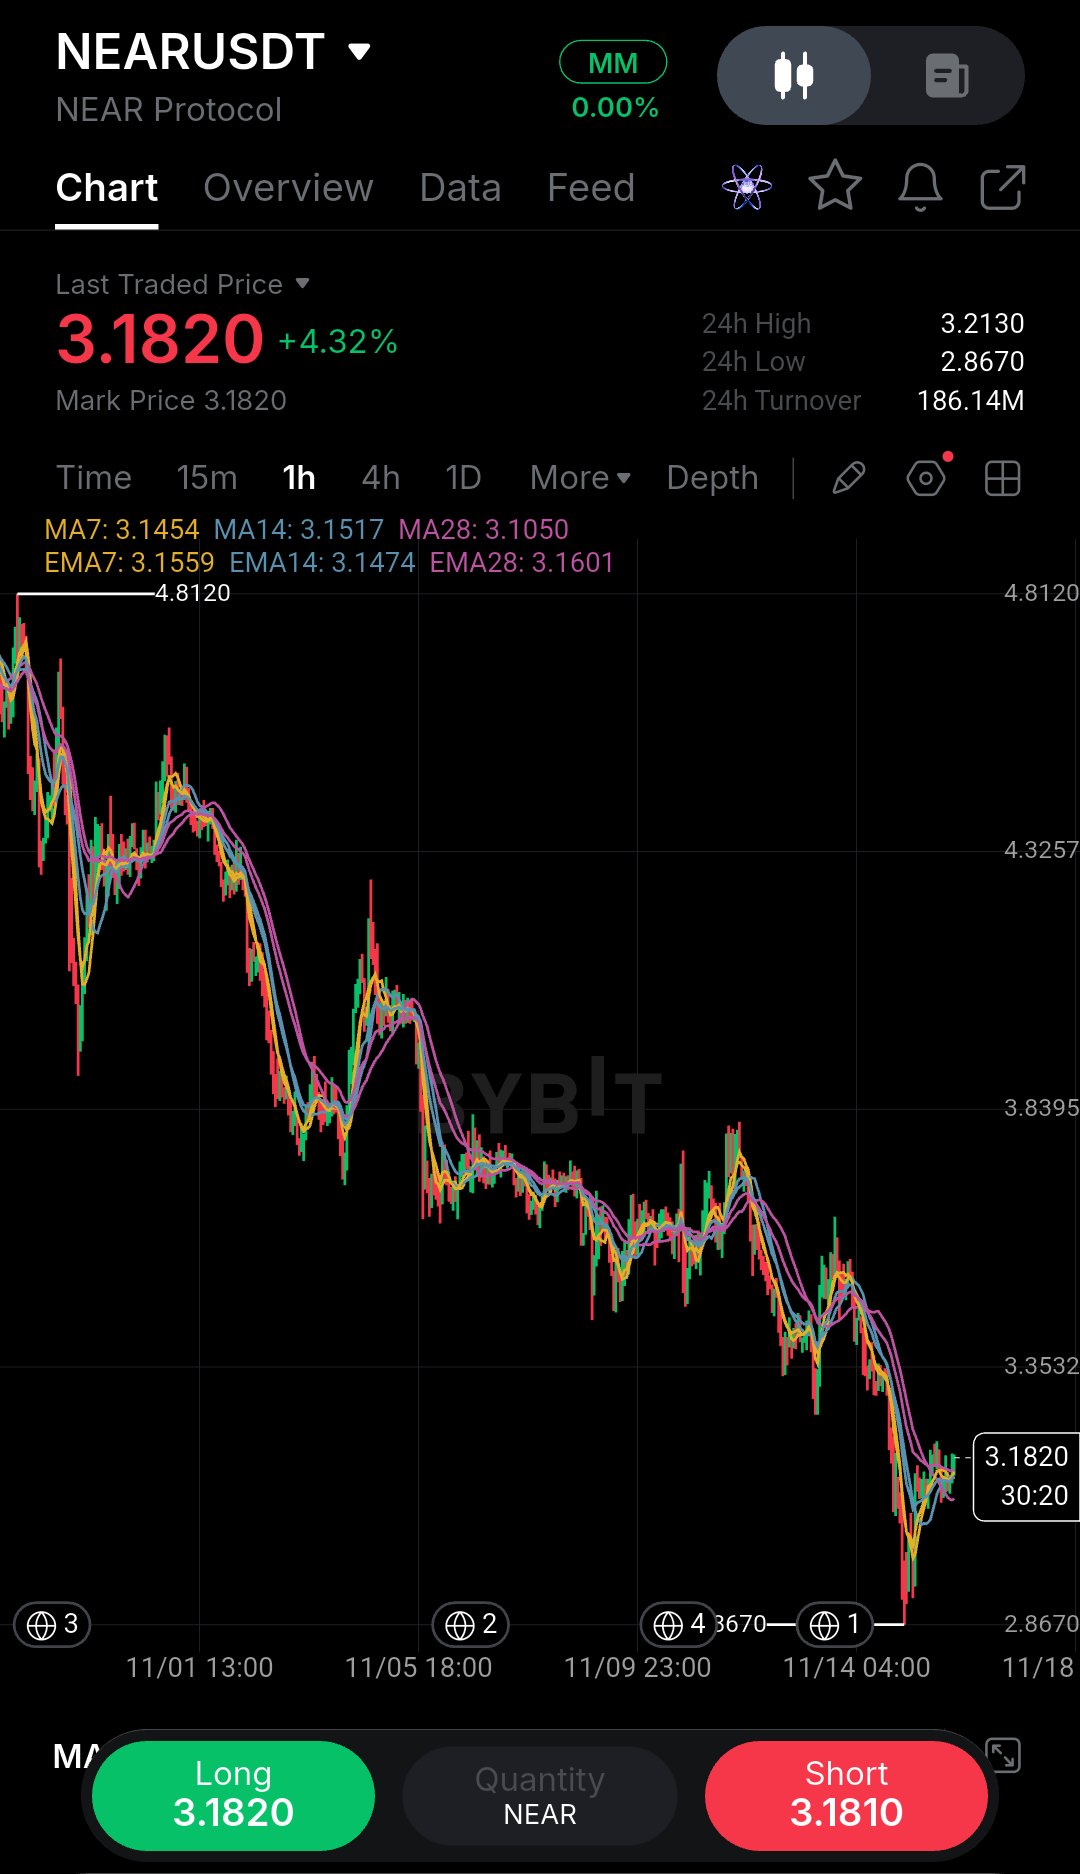
NEARのチャートは無視するところでしたが、右側の移動平均線と価格の相互作用に気づいて考え直しました。 1時間足を見ると、マクロトレンドでは4.8120のピークから2.8670の安値まで大きく下落していました。しかし、直近の値動きに注目してみてください。激しい売りは止まり、現在価格を3.1820(+4.32%)まで押し上げる、力強くアグレッシブなV字回復を見せています。 ここでの重要なポイントは、価格が現在、扇状に広がった移動平均線のクラスターのすぐ上で推移していることです。MA7(3.1454)、MA14(3.1517)、MA28(3.1050)がいずれも価格の下で動的サポートとして機能しています。 これは教科書通りの構造転換です。ダウントレンドが安値を更新しなくなり、価格が移動平均線を力強く奪還したときは、売り手が疲弊している合図です。ただし、現在はローカルなレジスタンスゾーンをテストしている段階ですので、完全な反転というよりは、あくまで戦術的なリバウンドと捉えるべきでしょう。 落ちるナイフを掴もうとして学んだ教訓ですが、ボトムを買うのではなく、構造転換の確認を買うのが正解です。 トレードプラン: バイアス:短期強気(回復を狙う) エントリーゾーン:3.1000~3.1500(MAクラスターの再テストに向けたわずかなプルバックを狙う) 損切り(ストップロス):2.8670(直近のローカルスイング安値の少し下) ターゲット1:3.2130(24時間高値および当面のレジスタンス) ターゲット2:3.3532(中盤のマクロレジスタンス) ターゲット3:3.8395(以前のブレイクダウンレベル) リスクリワード:1:2.5 無効条件(インバリデーション):1時間足が3.0000を下回って確定した場合。これはローカルな上昇トレンドサポートの喪失を意味します。 この揉み合いの最中でFOMO(乗り遅れる恐怖)に駆られないように。1時間足が力強く確定するのを待ち、ストップロスを遵守し、許容できる以上のリスクは決して取らないようにしてください。 NEARはついにリリーフラリーに向かっていると思いますか?それとも、次の下落に向けた一時的な小休止でしょうか? $NEARUSDT #ByXIMPACT
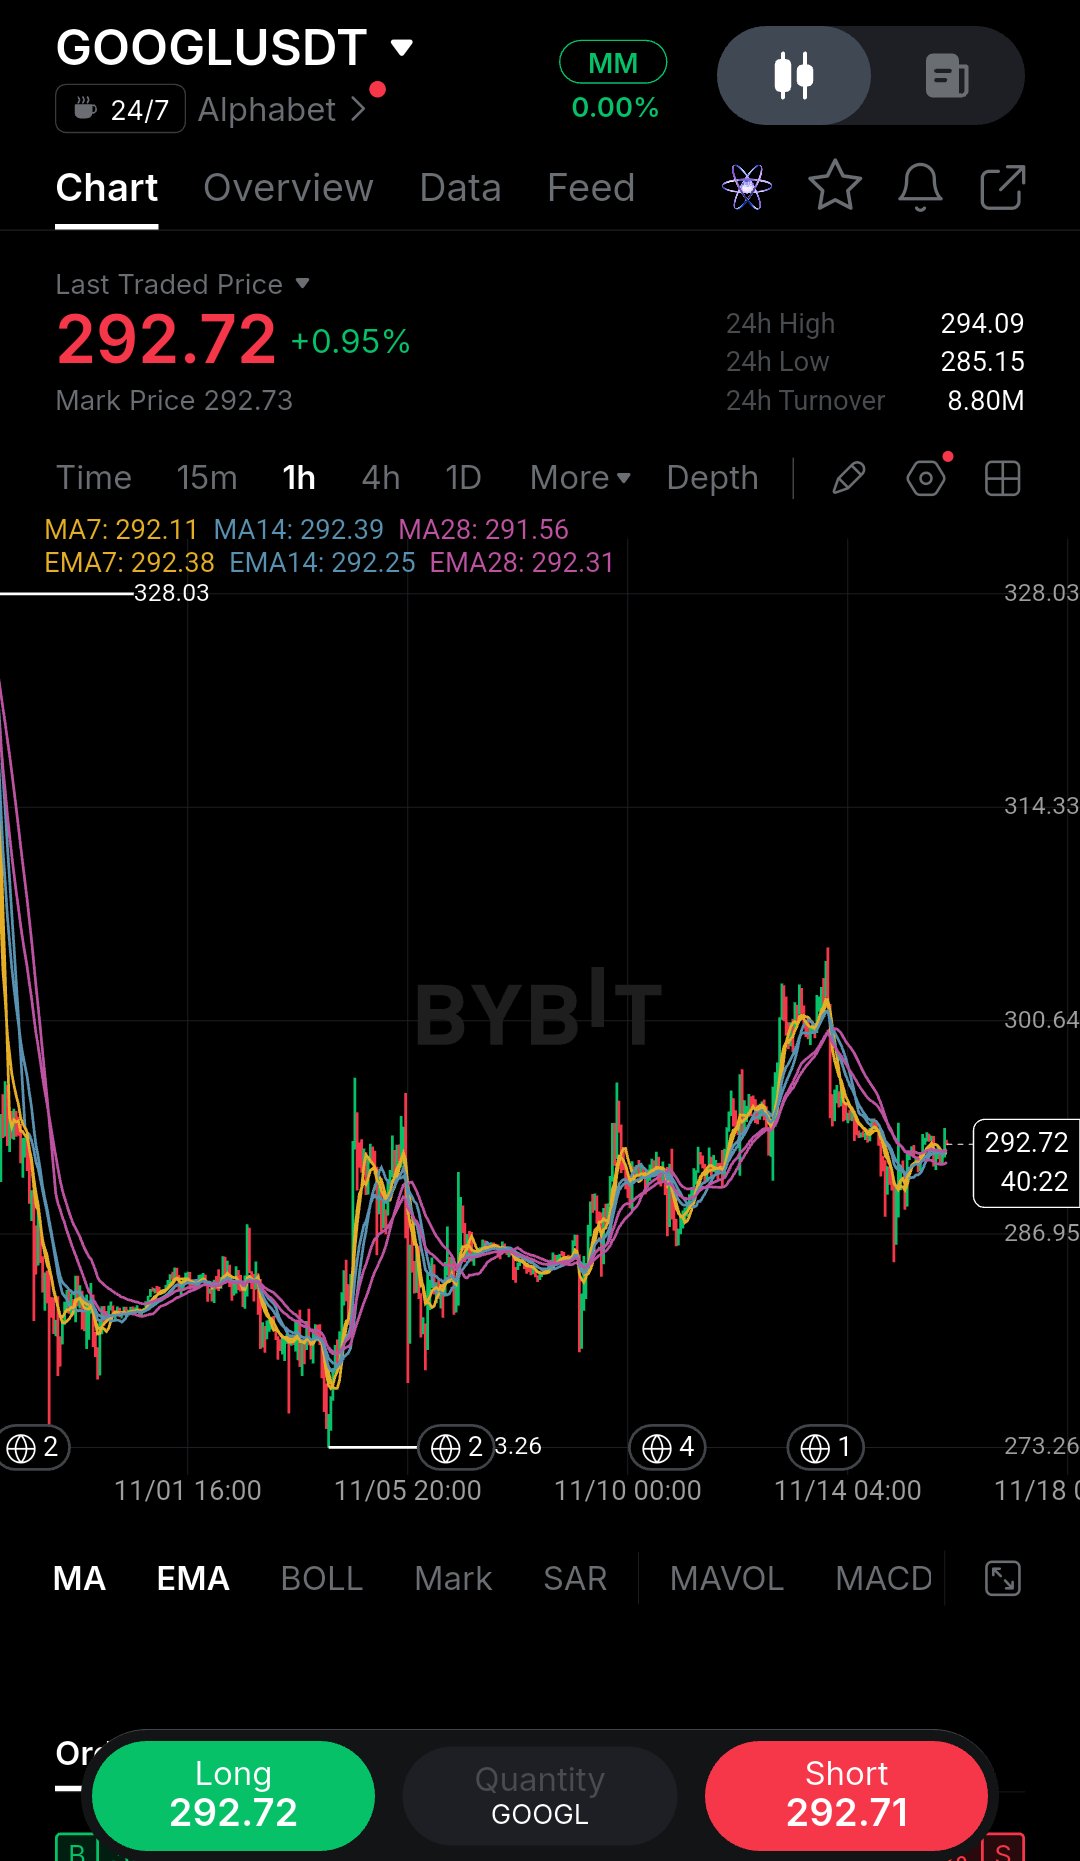
右側の移動平均線と価格の相互作用に気づくまで、このGOOGLのチャートは無視するところでした。 1時間足を見ると、マクロトレンドでは328.03のピークから273.26の安値まで、凄まじい「滝」のような下落がありました。しかし、直近のプライスアクションを拡大して見てください。激しい売りは沈静化し、着実な階段状の回復を見せ、価格は292.72(+0.95%)まで押し戻されています。 ここで重要なのが、現在価格が完全にフラットになった移動平均線のサンドイッチ状態に閉じ込められているという点です。MA7(292.11)、MA14(292.39)、MA28(291.56)がすべて、現在の価格周辺で密集しています。 これぞ教科書通りのボラティリティ・スクイーズです。大幅下落の後、このように移動平均線がフラットになるということは、売りのモメンタムが完全に枯渇したことを意味します。市場はエネルギーを溜め込み、カタリスト(材料)を待っている状態です。 こうした暴落後のベース形成をトレードする中で学んだ教訓は、方向性を予測してはいけないということです。私は資金を投じる前に、1時間足がこの密集地帯を明確にブレイクして確定するのを待ちます。 トレードプラン: バイアス:ニュートラル(ブレイクアウト待ち)。 エントリーゾーン:294.20 – 294.50(ローカルレジスタンスと24時間高値を上抜ける、力強い1時間足確定時のみ)。 損切り:285.00(直近のローカルスイング安値のすぐ下)。 ターゲット1:300.64(ミッドレンジ・レジスタンス)。 ターゲット2:314.33(前回ブレイクダウン・レベル)。 ターゲット3:328.03(マクロピーク)。 リスク・リワード:1:2.5 無効化条件:1時間足が289.00以下で確定した場合(このベースの崩壊と下降トレンド再開のシグナル)。 このようなレンジ相場の最中にFOMOで飛び乗ってはいけません。確認のローソク足を待ち、損切りラインを尊重し、決して失っても良い額以上のリスクを取らないように。 皆さんはGOOGLがようやくここで底を打ったと思いますか?それとも、これは次の暴落前の一時停止に過ぎないでしょうか? $GOOGLXUSDT #ByXIMPACT
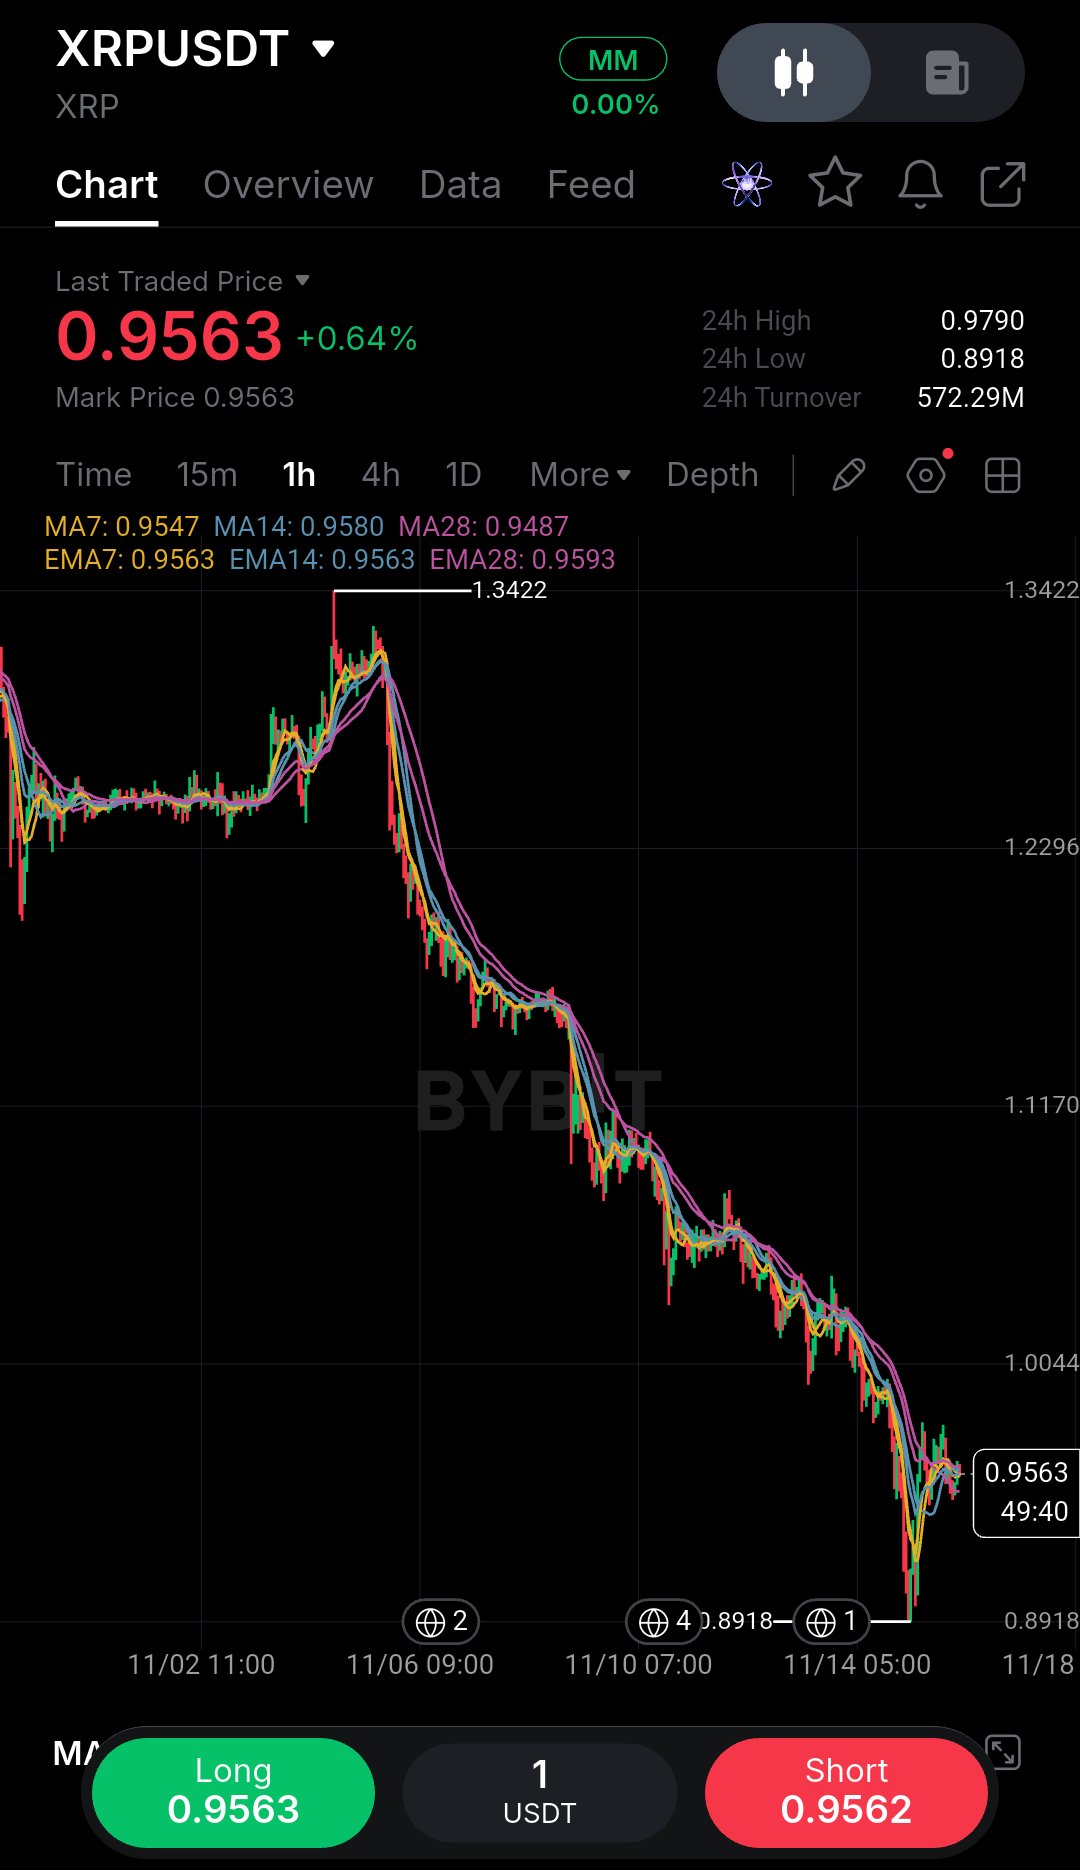
このXRPのチャートは、右側の移動平均線に対して価格がどれほどタイトに圧縮されているかに気づくまで、ほとんど無視するところでした。 1時間足を見ると、マクロトレンドは間違いなく弱気です。1.3422のピークから執拗な下落が続いており、高値切り下げと安値切り下げが長く続いています。しかし、直近の値動きに注目してください。0.8918の安値までフラッシュ(急落)した後、強気な売りは停滞しました。価格は0.9563まで反発しましたが、ここで重要な詳細があります。価格は現在、完全にフラットな移動平均線のサンドイッチの中に閉じ込められています。MA7(0.9547)、MA14(0.9580)、MA28(0.9487)がすべて現在の価格周辺でタイトな結び目状に圧縮されています。 これは典型的なボラティリティ・スクイーズ(収束)です。大幅な下落の後、移動平均線がこのようにフラットになるということは、売りモメンタムが完全に枯渇したことを意味します。市場はエネルギーを溜め込み、きっかけを待っている状態です。 このような暴落後のベース形成を取引する際に学んだ教訓は、方向性を予測しないことです。私は、リスクを取る前に、1時間足がこのクラスターの外側で明確に確定するのを待ちます。 トレードプラン: バイアス: ニュートラル(ブレイクアウト待ち) エントリーゾーン: 0.9790 – 0.9800(ローカルレジスタンスと24時間高値を上抜ける強い1時間足確定時のみ) 損切り: 0.8900(直近のマクロ安値のすぐ下) ターゲット1: 1.0044(レンジ中間のレジスタンス) ターゲット2: 1.1170(以前のブレイクダウンレベル) ターゲット3: 1.2296(マクロレジスタンス) リスク/リワード: 1:2.5 無効条件: 1時間足が0.9300を下回って確定した場合。このベースの崩壊と下降トレンドの再開を示唆します。 この揉み合いの最中にFOMO(乗り遅れる恐怖)で飛びつかないでください。確認のローソク足が出るのを待ち、損切りラインを尊重し、失ってもいい額以上のリスクは決して取らないようにしましょう。 XRPはついにここで底を打ったと思いますか?それとも、これは次の暴落前の一時停止に過ぎないでしょうか? $XRPUSDT #ByXIMPACT
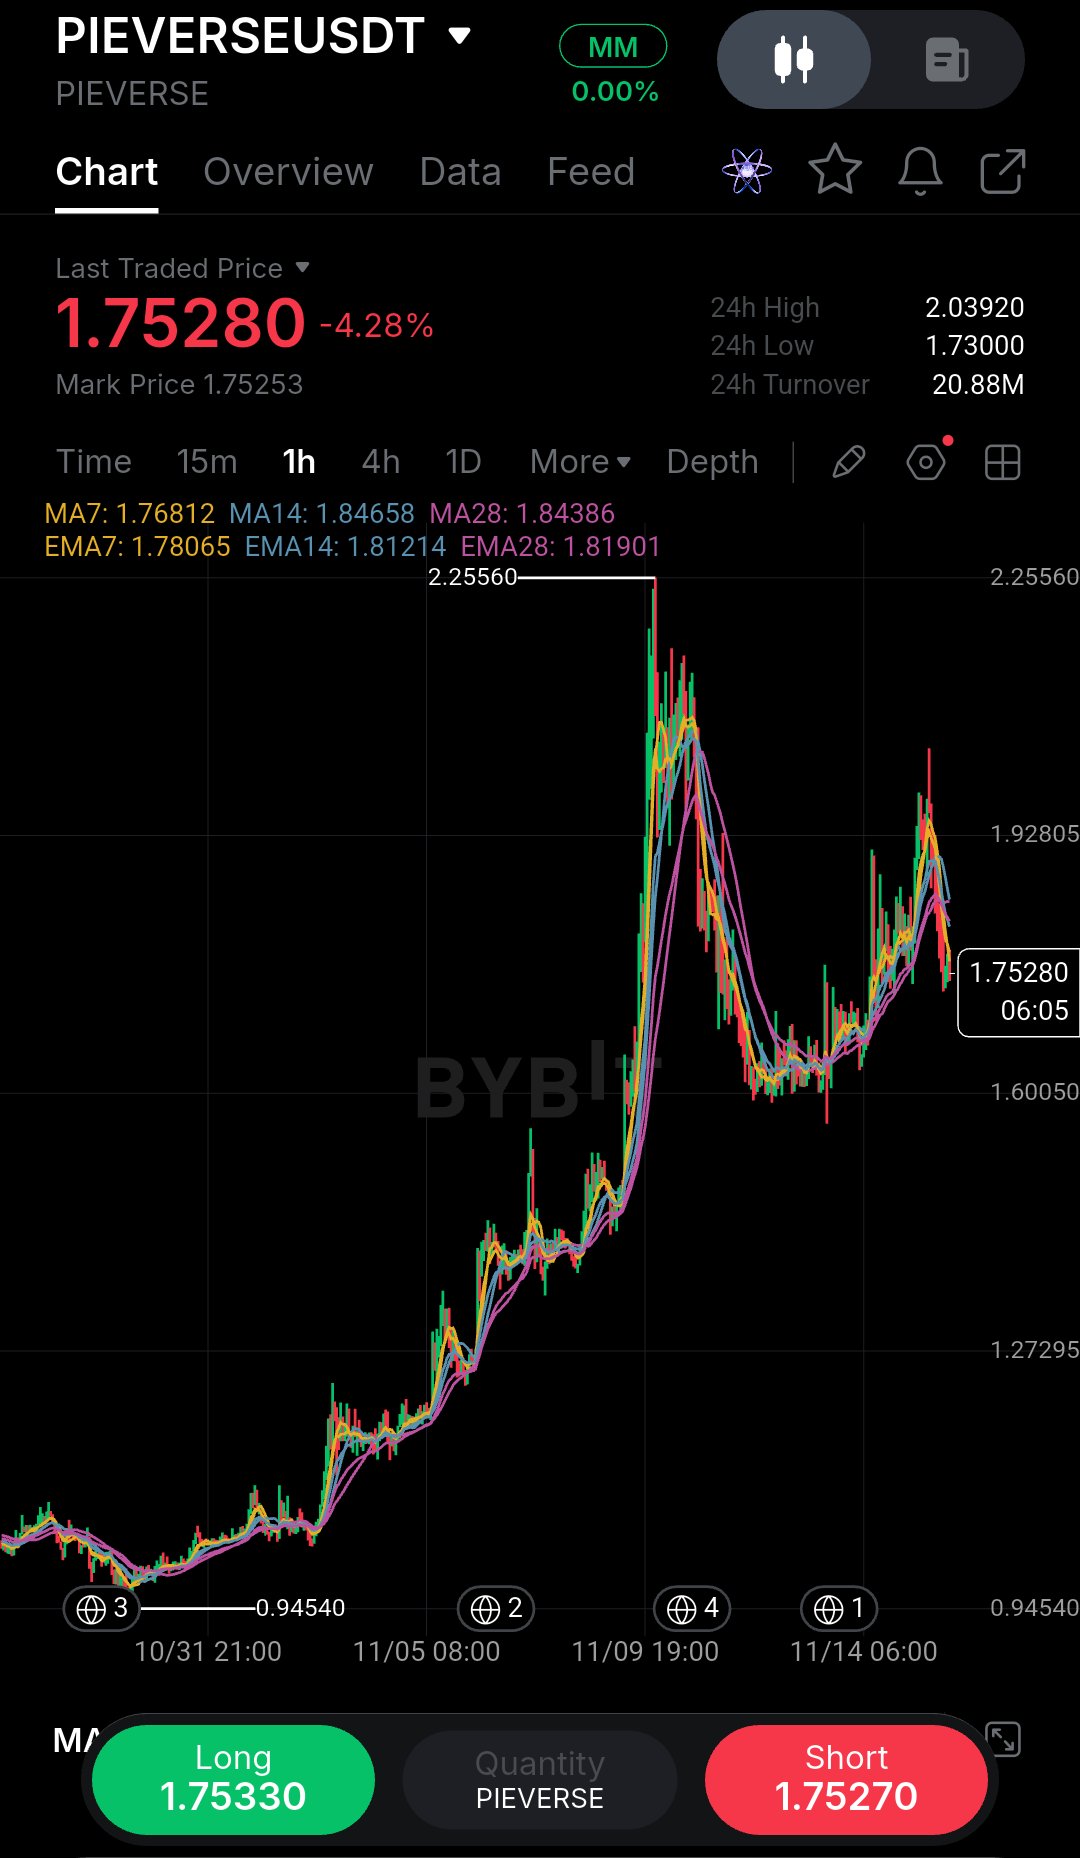
The first thing I ask myself looking at this PIEVERSE chart is whether I’d actually risk my own money here right now. Honestly, the answer is no—not in the middle of this heavy sell-off. But it’s a perfect example of why waiting for confirmation matters. Looking at the 1-hour timeframe, the macro trend is clearly bearish. We’ve bled from the 2.25560 peak, and the recent price action is pure capitulation. A heavy -4.28% drop just sliced straight through support, tagging a low of 1.73000. Right now, price is hovering at 1.75280, and the moving averages are stacked heavily above us. The MA7 (1.768), MA14 (1.846), and MA28 (1.843) are all fanning out to the downside. This is a textbook bearish alignment. When price goes vertical like this, there is very little structural support underneath it. A lesson I’ve learned from taking too many early entries is that oversold does not always mean it’s time to buy. I always let the market prove it can find a floor before entering. Trade Plan: Bias: Bearish (Waiting for a dead-cat bounce or structural base). Entry Zone: 1.8400 – 1.8500 (Looking for a retracement to the MA cluster, only if it forms a clear rejection). Stop Loss: 2.0390 (Above the previous breakdown block). Target 1: 1.7300 (Recent low). Target 2: 1.6005 (Macro swing low). Target 3: 1.5500 (Psychological support). Risk/Reward: 1:2.5 Invalidation: A 1H candle close back above 1.9000, signaling a massive V-shaped reversal. Do not FOMO into a falling candle. Wait for the market to cool off, respect your stop loss, and never risk more than you can afford to lose. Would you dare to catch this falling knife, or are you waiting for a clear reversal signal? $PIEVERSEUSDT #ByXIMPACT
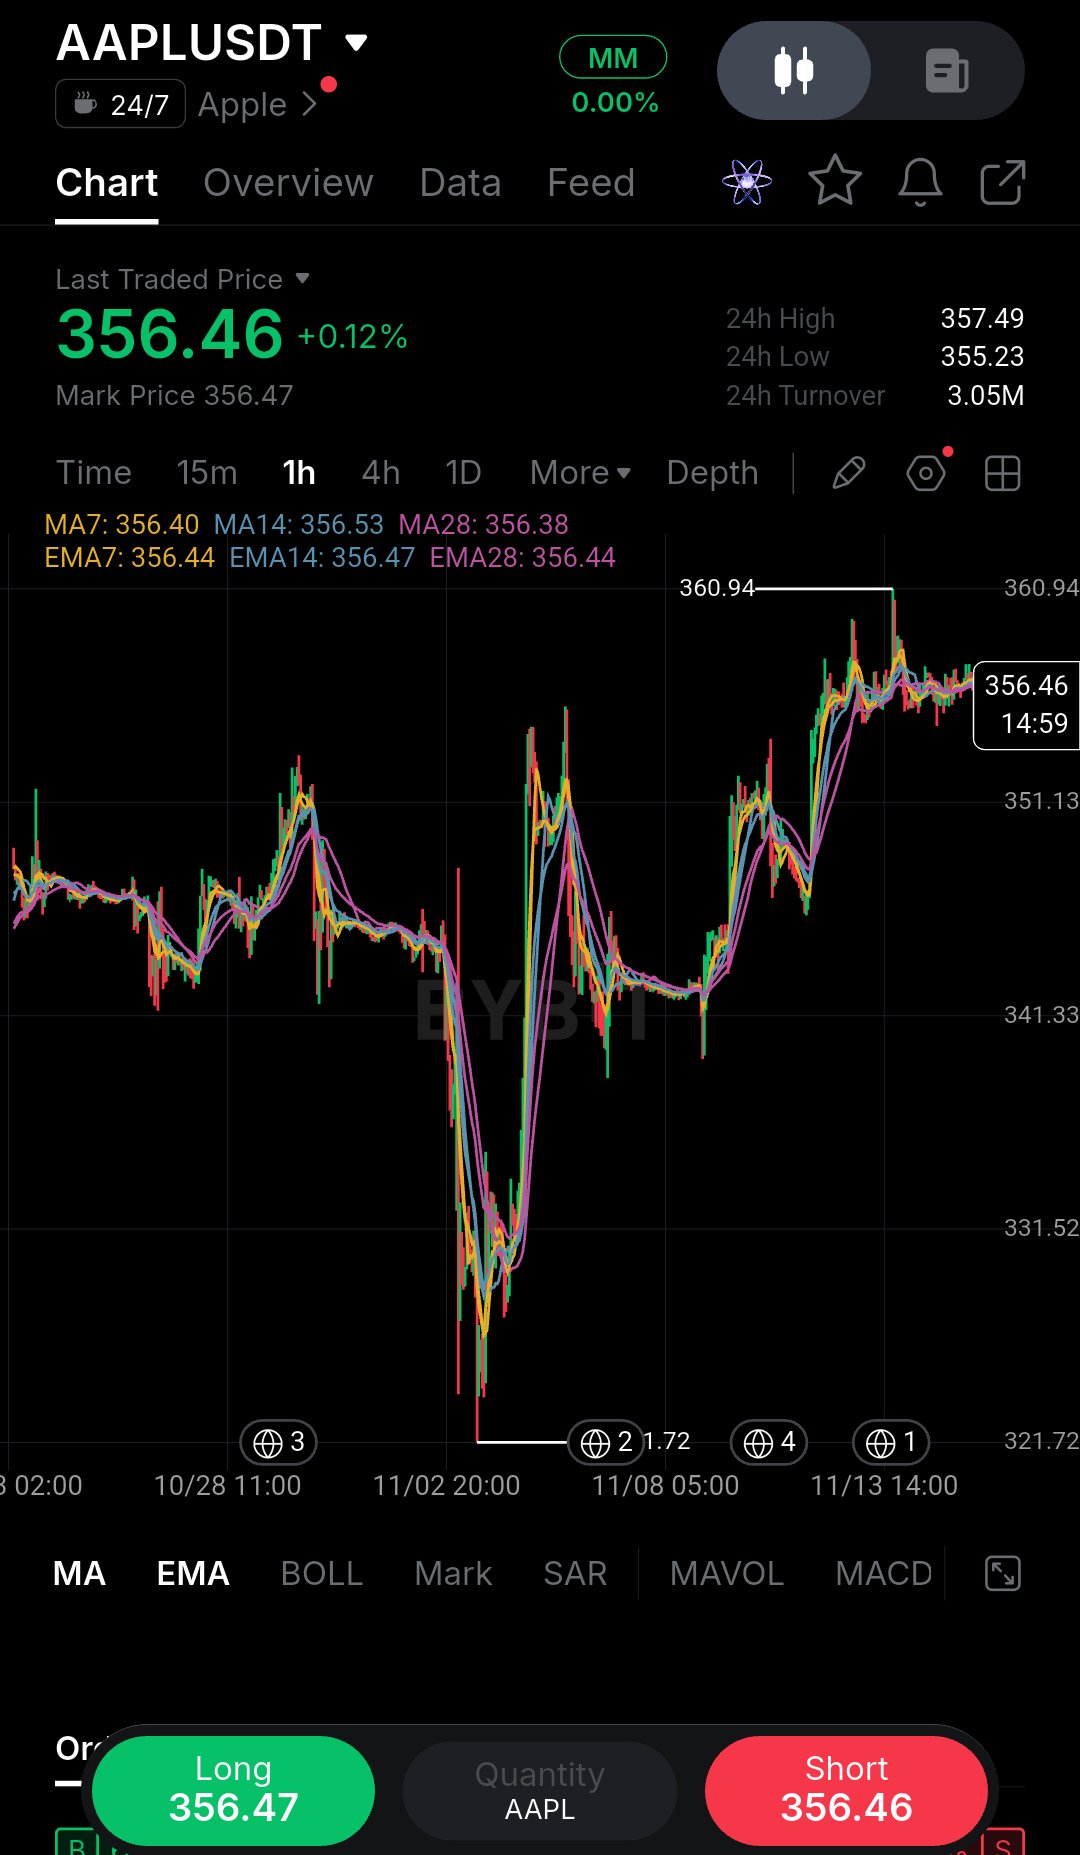
I almost ignored this AAPL chart until I noticed how tightly the price was compressing right under the moving averages. Looking at the 1-hour timeframe, the macro trend had a massive V-shaped flush down to the 321.72 low, but since then, the buyers have completely taken over. We are currently sitting at 356.46 (+0.12%), pushing up against the local highs. Here is the critical detail: price is currently trapped inside a completely flat moving average sandwich. The MA7 (356.40), MA14 (356.53), and MA28 (356.38) are all compressed into a tight knot right around the current price. This is a textbook volatility squeeze. After a massive recovery, when the MAs flatten out like this, it means the buying momentum has paused. The market is coiling, waiting for its next directional move. A lesson I've learned from trading these post-crash bases is that you don't guess the direction. I wait for the hourly candle to close decisively outside this cluster before risking capital. Trade Plan: Bias: Neutral (Waiting for a breakout or breakdown). Entry Zone: 357.60 – 357.80 (Only on a strong 1H close clearing the local resistance and 24h high). Stop Loss: 355.20 (Just below the recent local swing low). Target 1: 360.94 (Recent macro high). Target 2: 365.00 (Price discovery). Target 3: 370.00 (Extended target). Risk/Reward: 1:2.5 Invalidation: A 1H candle close below 355.00, signaling a breakdown of this base and a deeper pullback. Don't FOMO into the middle of this chop. Wait for the confirmation candle, respect your stop loss, and never risk more than you can afford to lose. Do you think AAPL breaks higher from this squeeze, or is it setting up for a deeper retracement? $AAPLXUSDT #ByXIMPACT
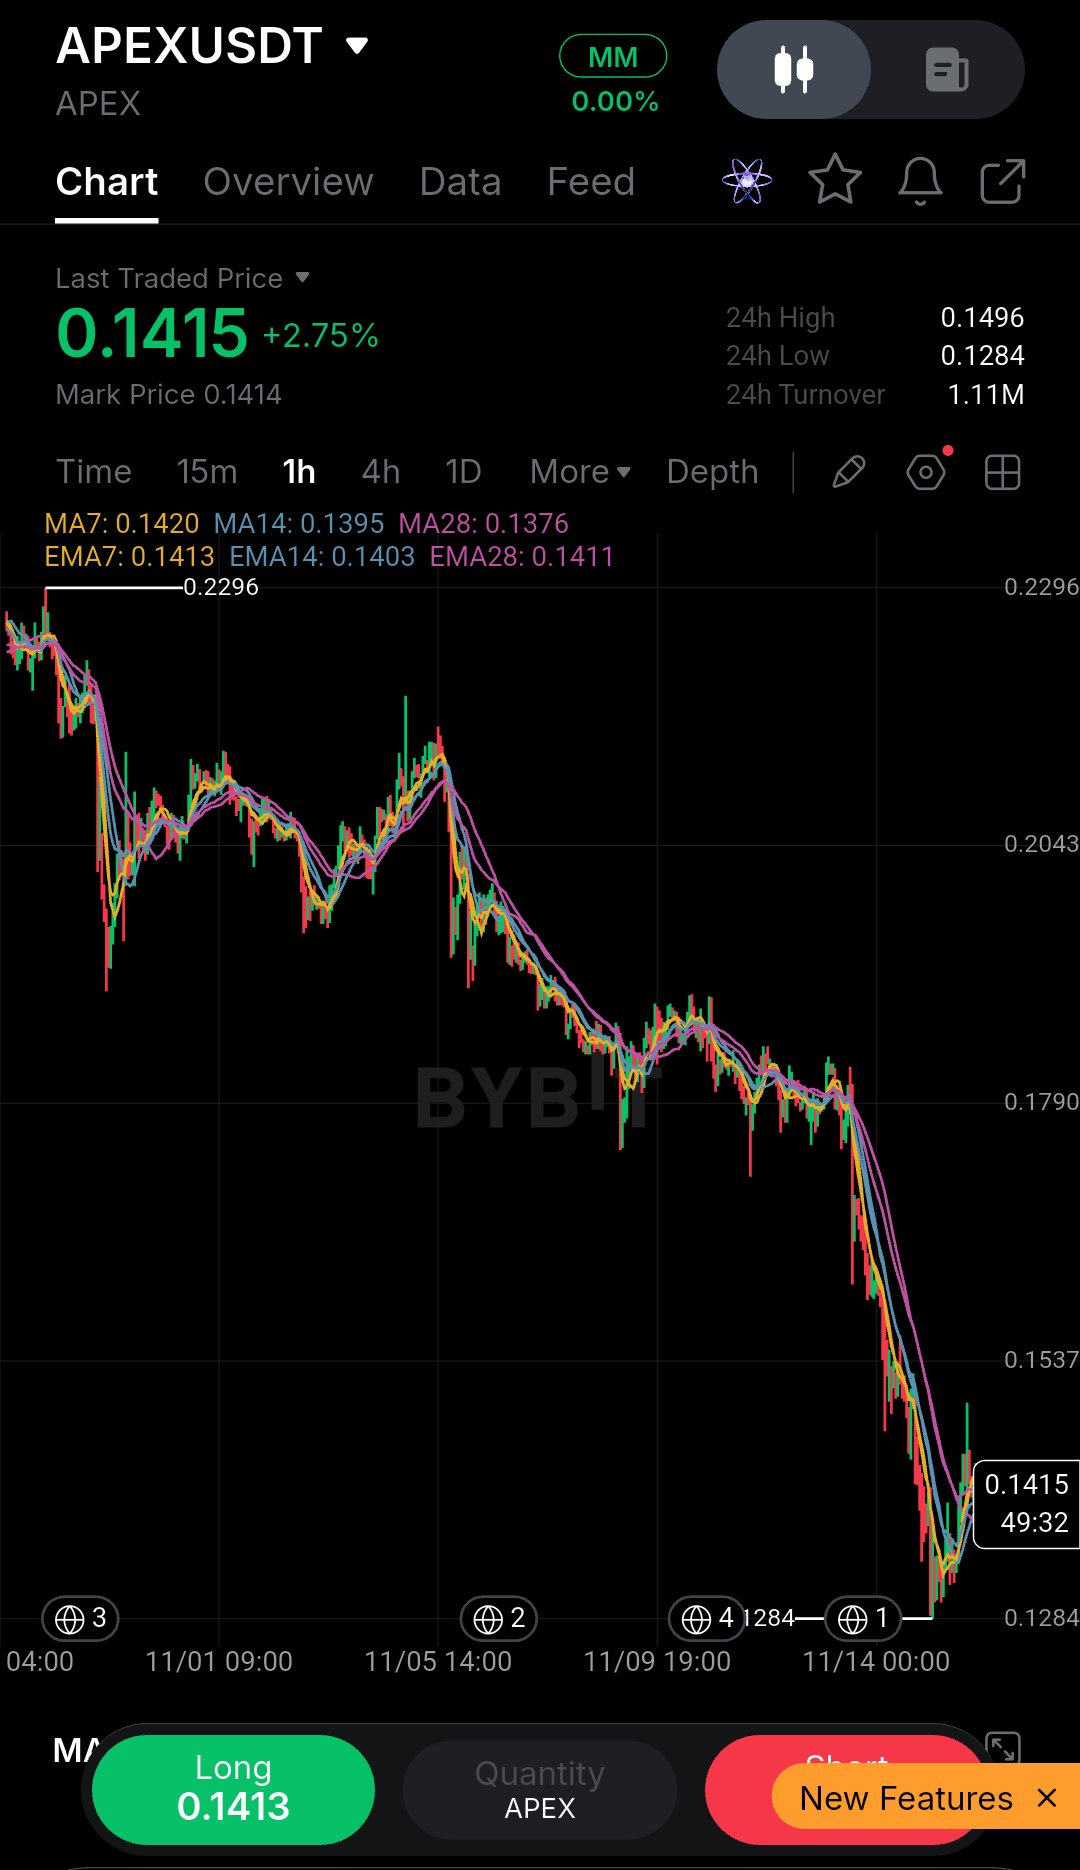
APEXのチャートは見過ごすところでしたが、右側で価格が移動平均線とどう絡んでいるかに気づいて目が留まりました。 1時間足で見ると、マクロトレンドは0.2296のピークから0.1284の安値まで大きく下落していました。しかし、直近のプライスアクションを拡大してみると、激しい売りが止まり、0.1415(+2.75%)まで価格を押し戻す力強いV字回復が見られます。 ここで重要なポイントは、価格が現在、拡散する移動平均線のクラスターのすぐ上で推移していることです。MA7(0.1420)、MA14(0.1395)、MA28(0.1376)のすべてが、価格の下で動的なサポートとして機能しています。 これは教科書的な構造転換です。ダウントレンドが安値を切り下げるのをやめ、価格が積極的に移動平均線を奪還する時、それは売り手が疲弊しているサインです。ただし、現在はローカルなレジスタンスゾーンをテストしている段階であり、完全な反転というよりは戦術的なバウンスと捉えるべきでしょう。 落ちるナイフを掴もうとして学んだ教訓は、底を狙うのではなく、構造転換の確認を待ってから買うべきだということです。 トレードプラン: バイアス:短期強気(回復を狙う) エントリーゾーン:0.1370~0.1400(移動平均線クラスターへのリテストに向けた軽微な押し目を狙う) ストップロス:0.1280(直近のローカルスイング安値のすぐ下) ターゲット1:0.1496(24時間高値および当面のレジスタンス) ターゲット2:0.1790(レンジ中間のマクロレジスタンス) ターゲット3:0.2043(以前のブレイクダウン水準) リスクリワード:1:2.5 無効条件:1時間足が0.1330を下回って確定した場合。これはローカルな上昇トレンドサポートの喪失を意味します。 この荒い値動きの最中にFOMO(乗り遅れる恐怖)で飛びつかないこと。1時間足が強く確定するのを待ち、ストップロスを守り、失ってもいい額以上のリスクは決して取らないようにしましょう。 APEXはいよいよリリーフラリーの準備が整ったと思いますか?それとも、次の下落局面の前のひと休みに過ぎないでしょうか? $APEXUSDT #ByXIMPACT
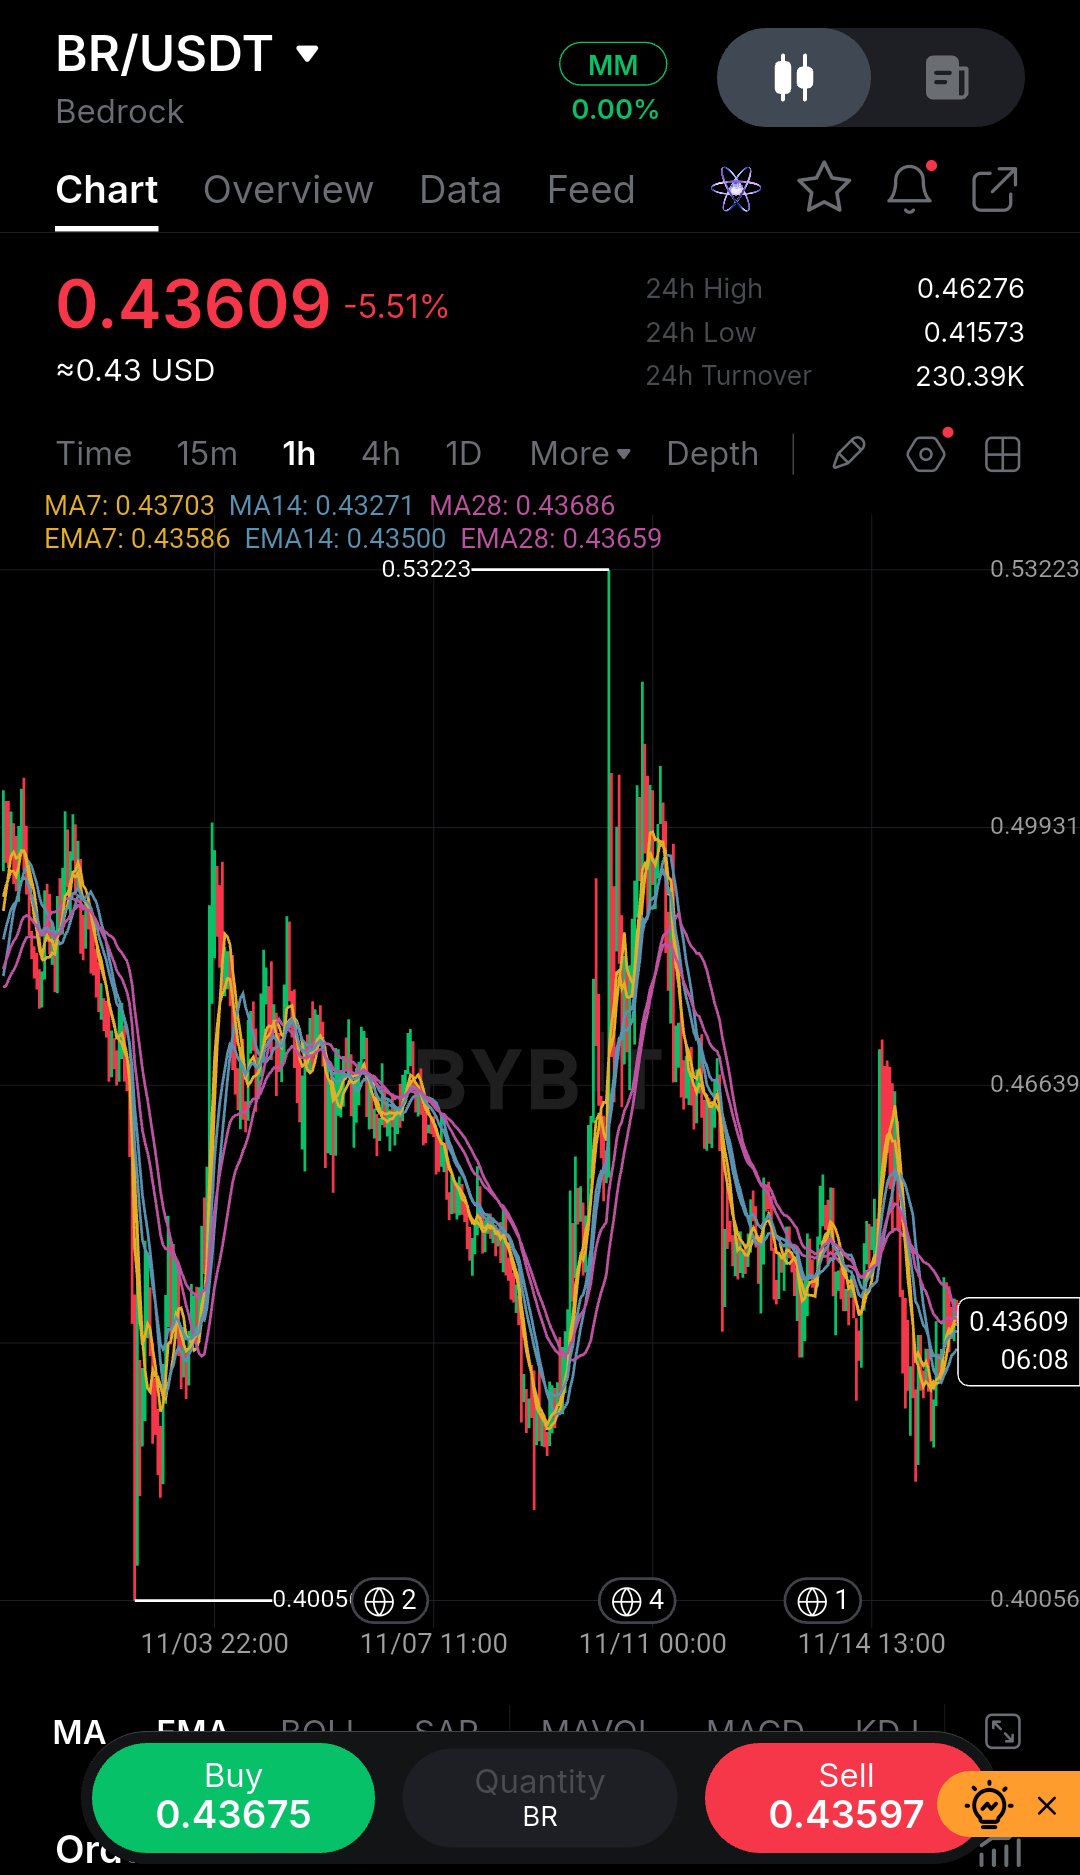
The first thing I ask myself looking at this BR chart is whether I’d actually risk my own money here right now. Honestly, the answer is no—not in the middle of this heavy sell-off. But it’s a perfect example of why waiting for confirmation matters. Looking at the 1-hour timeframe, the macro trend is clearly bearish. We’ve bled from the 0.53223 peak, and the recent price action is pure capitulation. A heavy -5.51% drop just sliced straight through support, tagging a low of 0.41573. Right now, price is hovering at 0.43609, and the moving averages are stacked heavily above us. The MA7 (0.43703), MA14 (0.43271), and MA28 (0.43686) are all acting as dynamic resistance. This is a textbook bearish alignment. When price goes vertical like this, there is very little structural support underneath it. A lesson I’ve learned from taking too many early entries is that oversold does not always mean it’s time to buy. I always let the market prove it can find a floor before entering. Trade Plan: Bias: Bearish (Waiting for a dead-cat bounce or structural base). Entry Zone: 0.44500 – 0.44800 (Looking for a retracement to the MA cluster, only if it forms a clear rejection). Stop Loss: 0.46200 (Above the previous breakdown block). Target 1: 0.41573 (Recent low). Target 2: 0.40056 (Macro swing low). Target 3: 0.39000 (Psychological support). Risk/Reward: 1:2.5 Invalidation: A 1H candle close back above 0.45500, signaling a massive V-shaped reversal. Do not FOMO into a falling candle. Wait for the market to cool off, respect your stop loss, and never risk more than you can afford to lose. Would you dare to catch this falling knife, or are you waiting for a clear reversal signal? $BRUSDT #ByXIMPACT
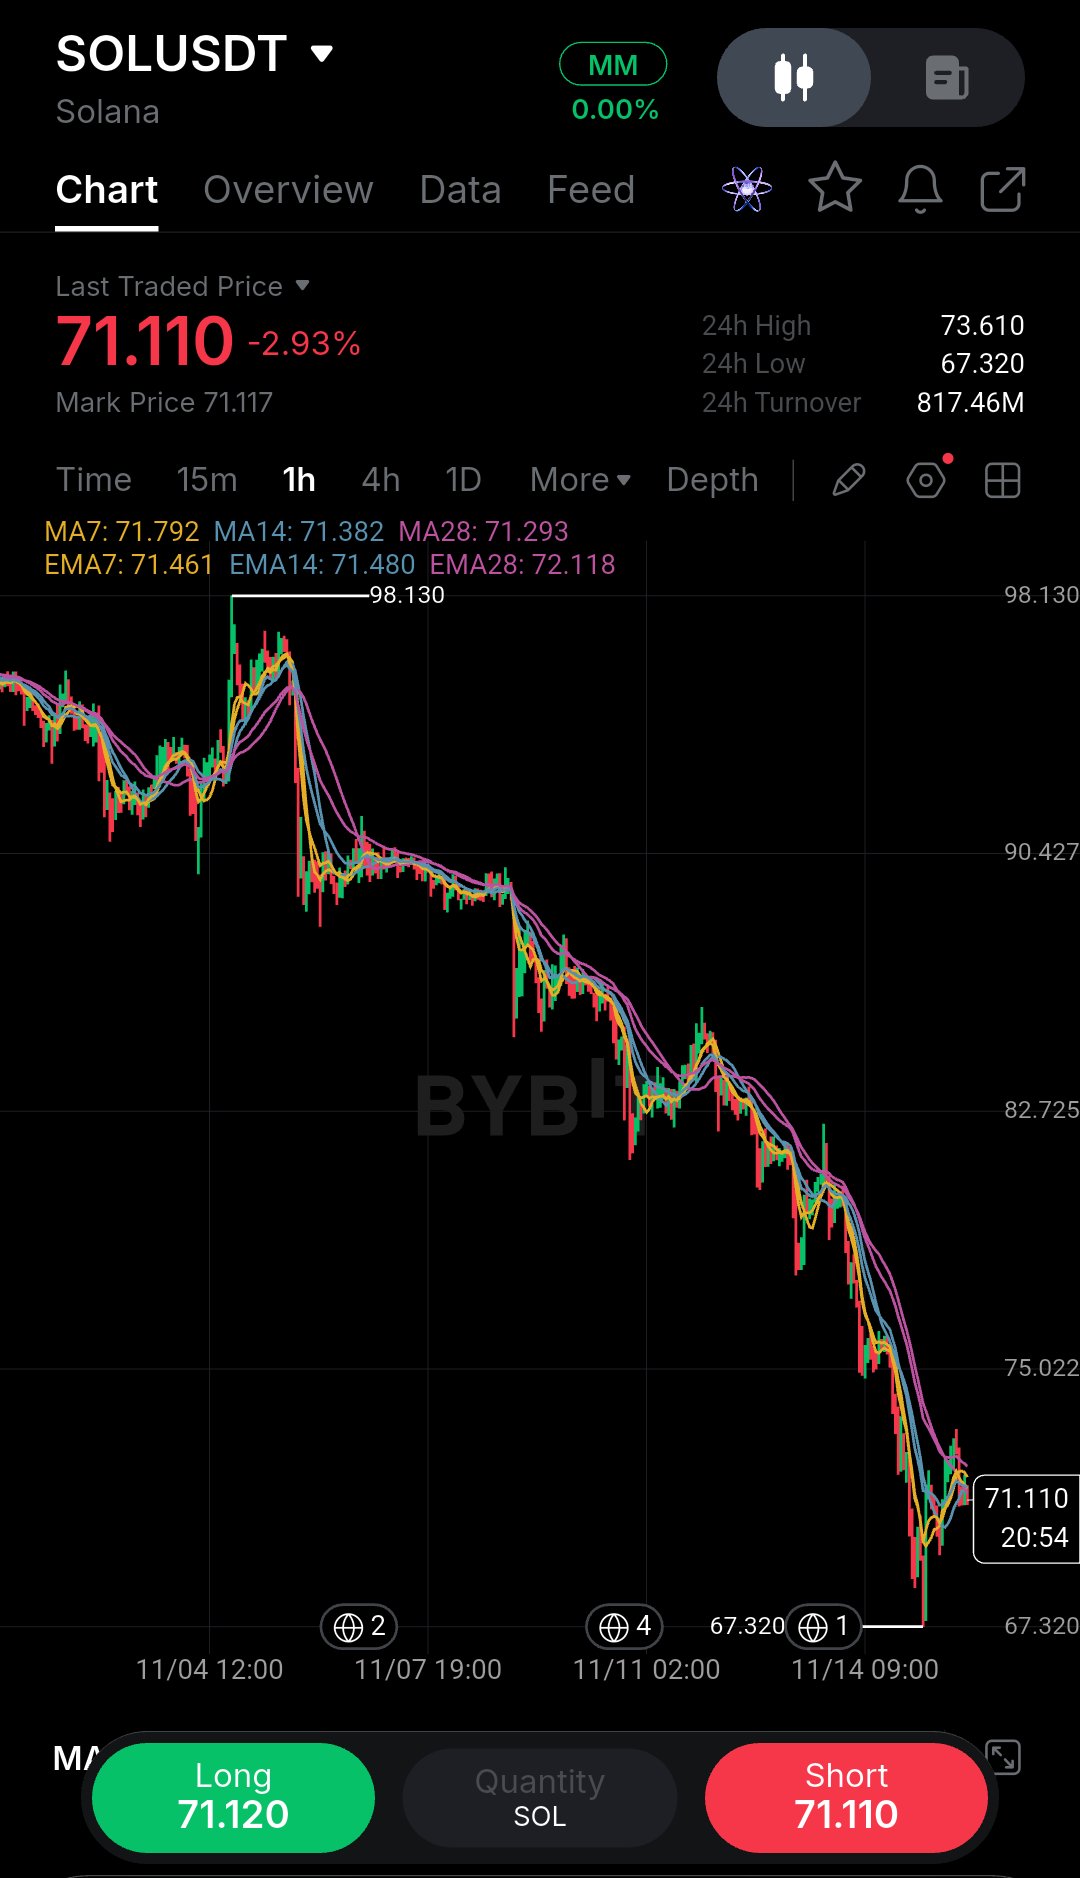
The first thing I ask myself looking at this SOL chart is whether I’d actually risk my own money here right now. Honestly, the answer is no—not in the middle of this heavy sell-off. But it’s a perfect example of why waiting for confirmation matters. Looking at the 1-hour timeframe, the macro trend is clearly bearish. We’ve bled from the 98.130 peak, and the recent price action is pure capitulation. A heavy -2.93% drop just sliced straight through support, tagging a low of 67.320. Right now, price is hovering at 71.110, and the moving averages are stacked heavily above us. The MA7 (71.792), MA14 (71.382), and MA28 (71.293) are all fanning out to the downside. This is a textbook bearish alignment. When price goes vertical like this, there is very little structural support underneath it. A lesson I’ve learned from taking too many early entries is that oversold does not always mean it’s time to buy. I always let the market prove it can find a floor before entering. Trade Plan: Bias: Bearish (Waiting for a dead-cat bounce or structural base). Entry Zone: 71.400 – 71.800 (Looking for a retracement to the MA cluster, only if it forms a clear rejection). Stop Loss: 73.600 (Above the previous breakdown block). Target 1: 67.320 (Recent low). Target 2: 65.000 (Psychological support). Target 3: 63.000 (Extended target). Risk/Reward: 1:2.5 Invalidation: A 1H candle close back above 72.500, signaling a massive V-shaped reversal. Do not FOMO into a falling candle. Wait for the market to cool off, respect your stop loss, and never risk more than you can afford to lose. Would you dare to catch this falling knife, or are you waiting for a clear reversal signal? $SOLUSDT #ByXIMPACT
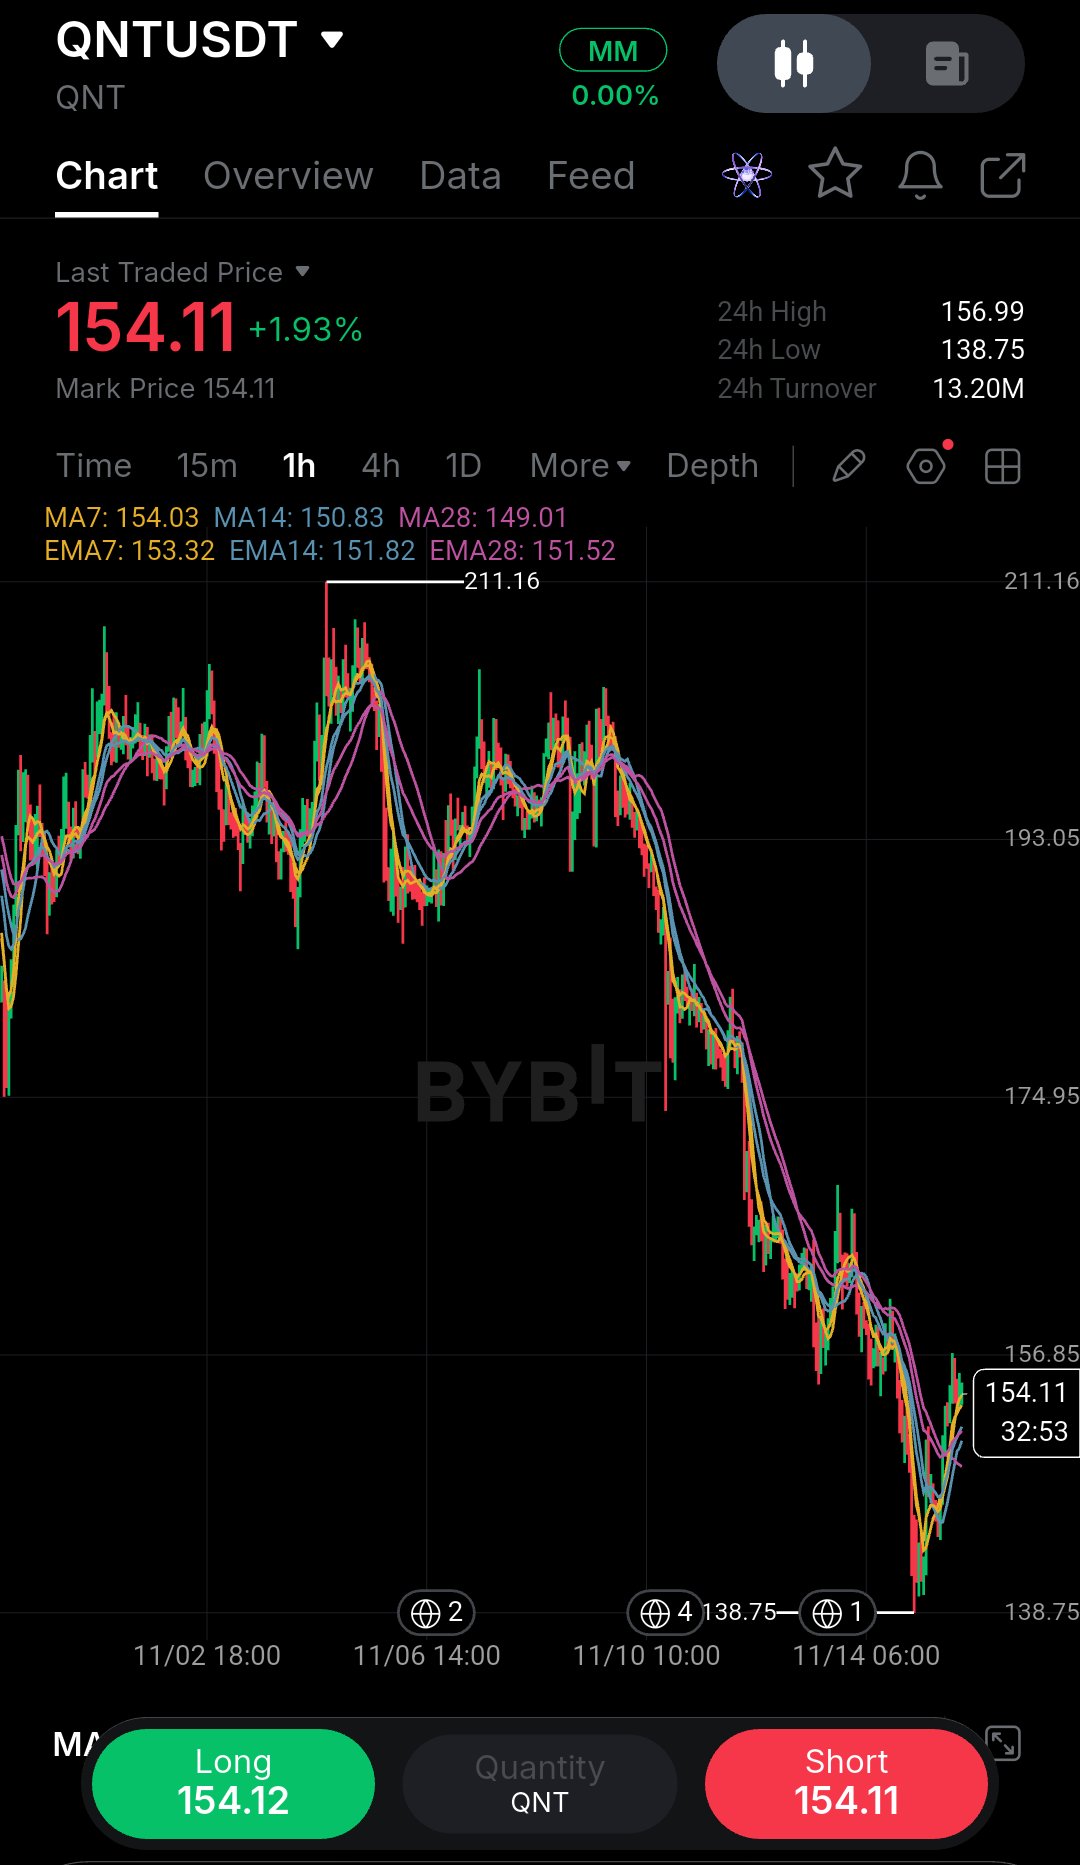
I almost ignored this QNT chart until I noticed how the price was interacting with the moving averages on the right side. Looking at the 1-hour timeframe, the macro trend had a heavy bleed from the 211.16 peak down to the 138.75 low. But zoom in on the recent price action. The aggressive selling stalled, and we’ve seen a strong, aggressive V-shaped recovery pushing the price back up to 154.11 (+1.93%). Here is the critical detail: price is currently trading just above a fanned-out moving average cluster. The MA7 (154.03), MA14 (150.83), and MA28 (149.01) are all acting as dynamic support beneath us. This is a textbook structural shift. When a downtrend stops making lower lows and price aggressively reclaims its moving averages, it signals that sellers are exhausted. However, we are testing a local resistance zone, so this is a tactical bounce, not a full reversal yet. A lesson I've learned from trying to catch falling knives is that you don't buy the bottom; you buy the confirmation of a structure shift. Trade Plan: Bias: Short-term bullish (Playing the recovery). Entry Zone: 150.00 – 153.00 (Looking for a slight pullback to retest the MA cluster). Stop Loss: 138.70 (Just below the recent local swing low). Target 1: 156.99 (24h high and immediate resistance). Target 2: 174.95 (Mid-range macro resistance). Target 3: 193.05 (Previous breakdown level). Risk/Reward: 1:2.5 Invalidation: A 1H candle close below 148.00, which would signal a loss of the local uptrend support. Don't FOMO into the middle of this chop. Wait for the hourly candle to close strong, respect your stop loss, and never risk more than you can afford to lose. Do you think QNT is finally ready for a relief rally, or is this just a pause before the next leg down? $QNTUSDT #ByXIMPACT
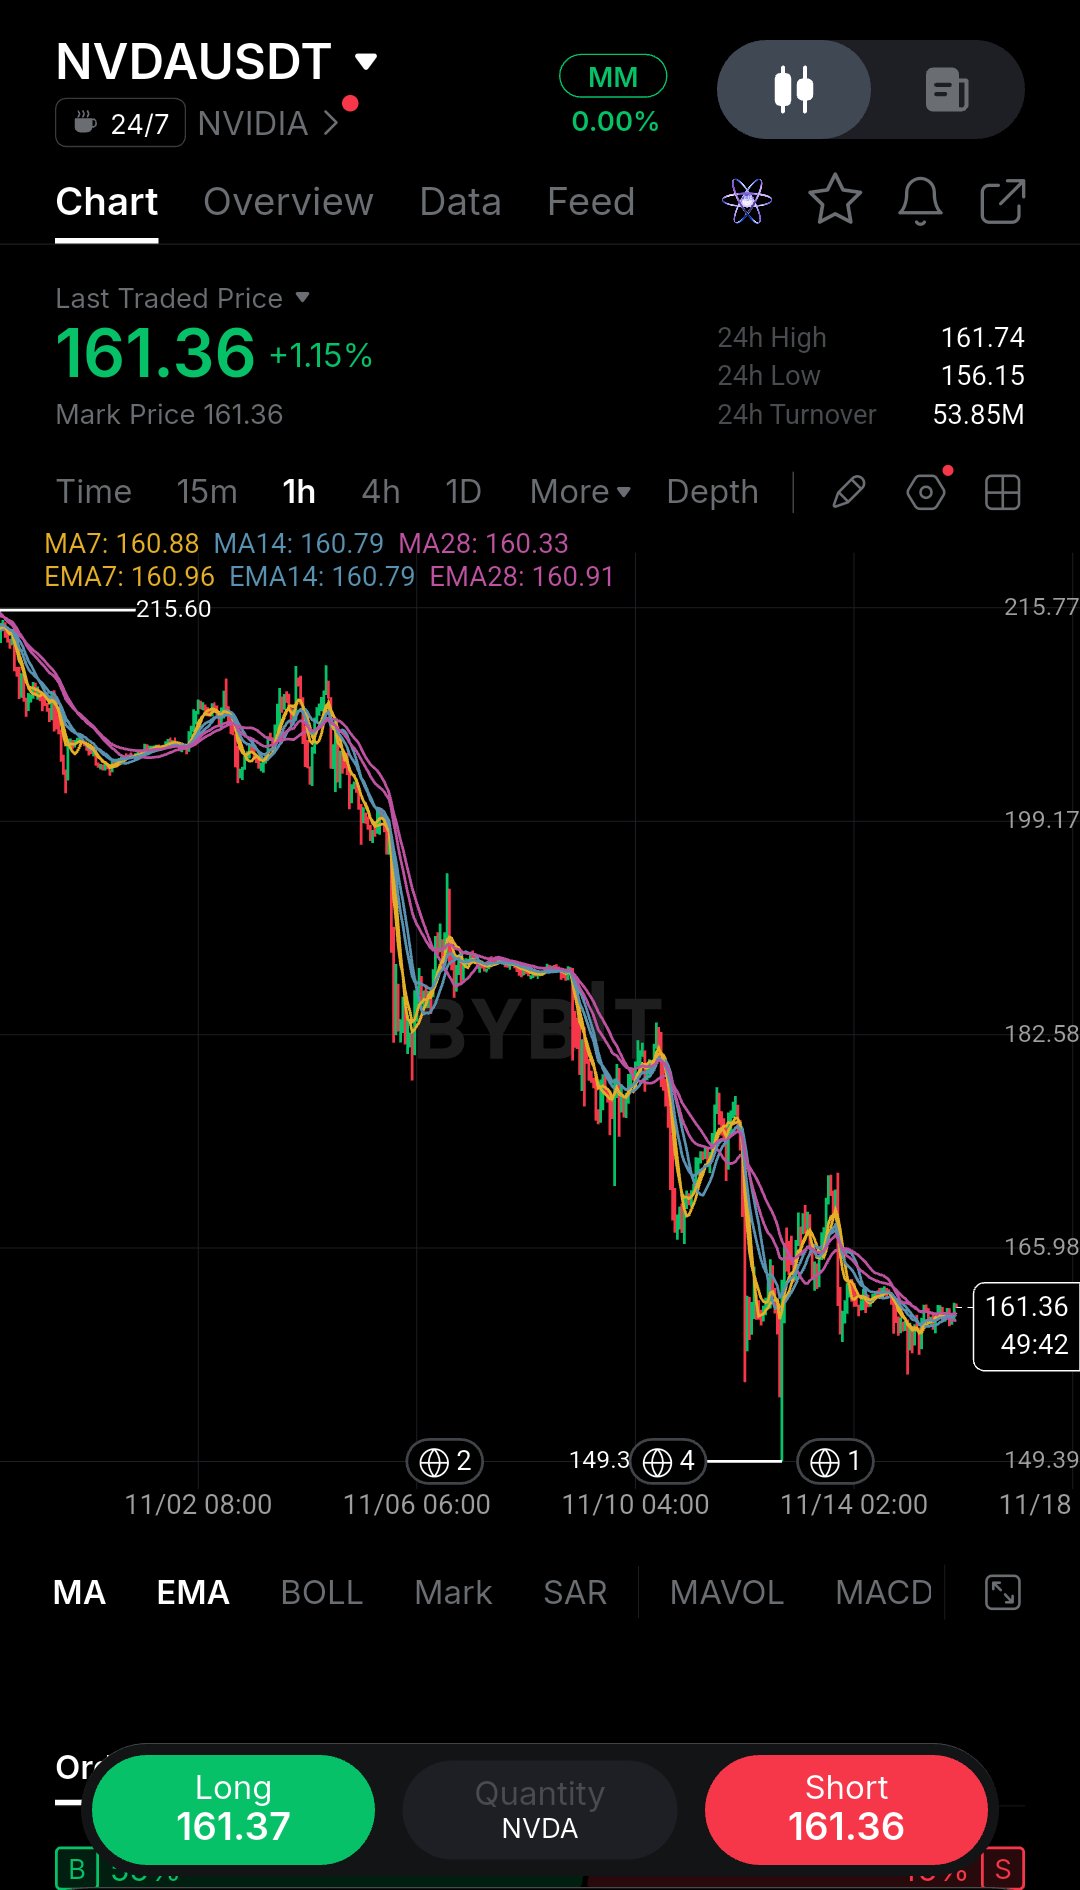
I almost ignored this NVDA chart until I noticed how tightly the price was compressing right under the moving averages. Looking at the 1-hour timeframe, the macro trend is undeniably bearish. We’ve been in a relentless bleed from the 215.60 peak, printing a long sequence of lower highs and lower lows. But zoom in on the recent price action. After flushing to the 149.39 low, the aggressive selling stalled. Price bounced back to 161.36, and here is the critical detail: price is currently trapped inside a flat moving average sandwich. The MA7 (160.88), MA14 (160.79), and MA28 (160.33) are all compressed into a tight knot right around the current price. This is a textbook volatility squeeze. After a massive drop, when the MAs flatten out like this, it means the selling momentum has completely dried up. The market is coiling, waiting for a catalyst. A lesson I've learned from trading these post-crash bases is that you don't guess the direction. I wait for the hourly candle to close decisively outside this cluster before risking capital. Trade Plan: Bias: Neutral (Waiting for a breakout). Entry Zone: 161.80 – 162.00 (Only on a strong 1H close clearing the local resistance and 24h high). Stop Loss: 156.00 (Just below the recent local swing low). Target 1: 165.98 (Mid-range resistance). Target 2: 182.58 (Previous breakdown level). Target 3: 199.17 (Macro resistance). Risk/Reward: 1:2.5 Invalidation: A 1H candle close below 159.00, signaling a breakdown of this base and a resumption of the downtrend. Don't FOMO into the middle of this chop. Wait for the confirmation candle, respect your stop loss, and never risk more than you can afford to lose. Do you think NVDA is finally finding a floor here, or is this just a pause before the next dump? $NVDAXUSDT #ByXIMPACT
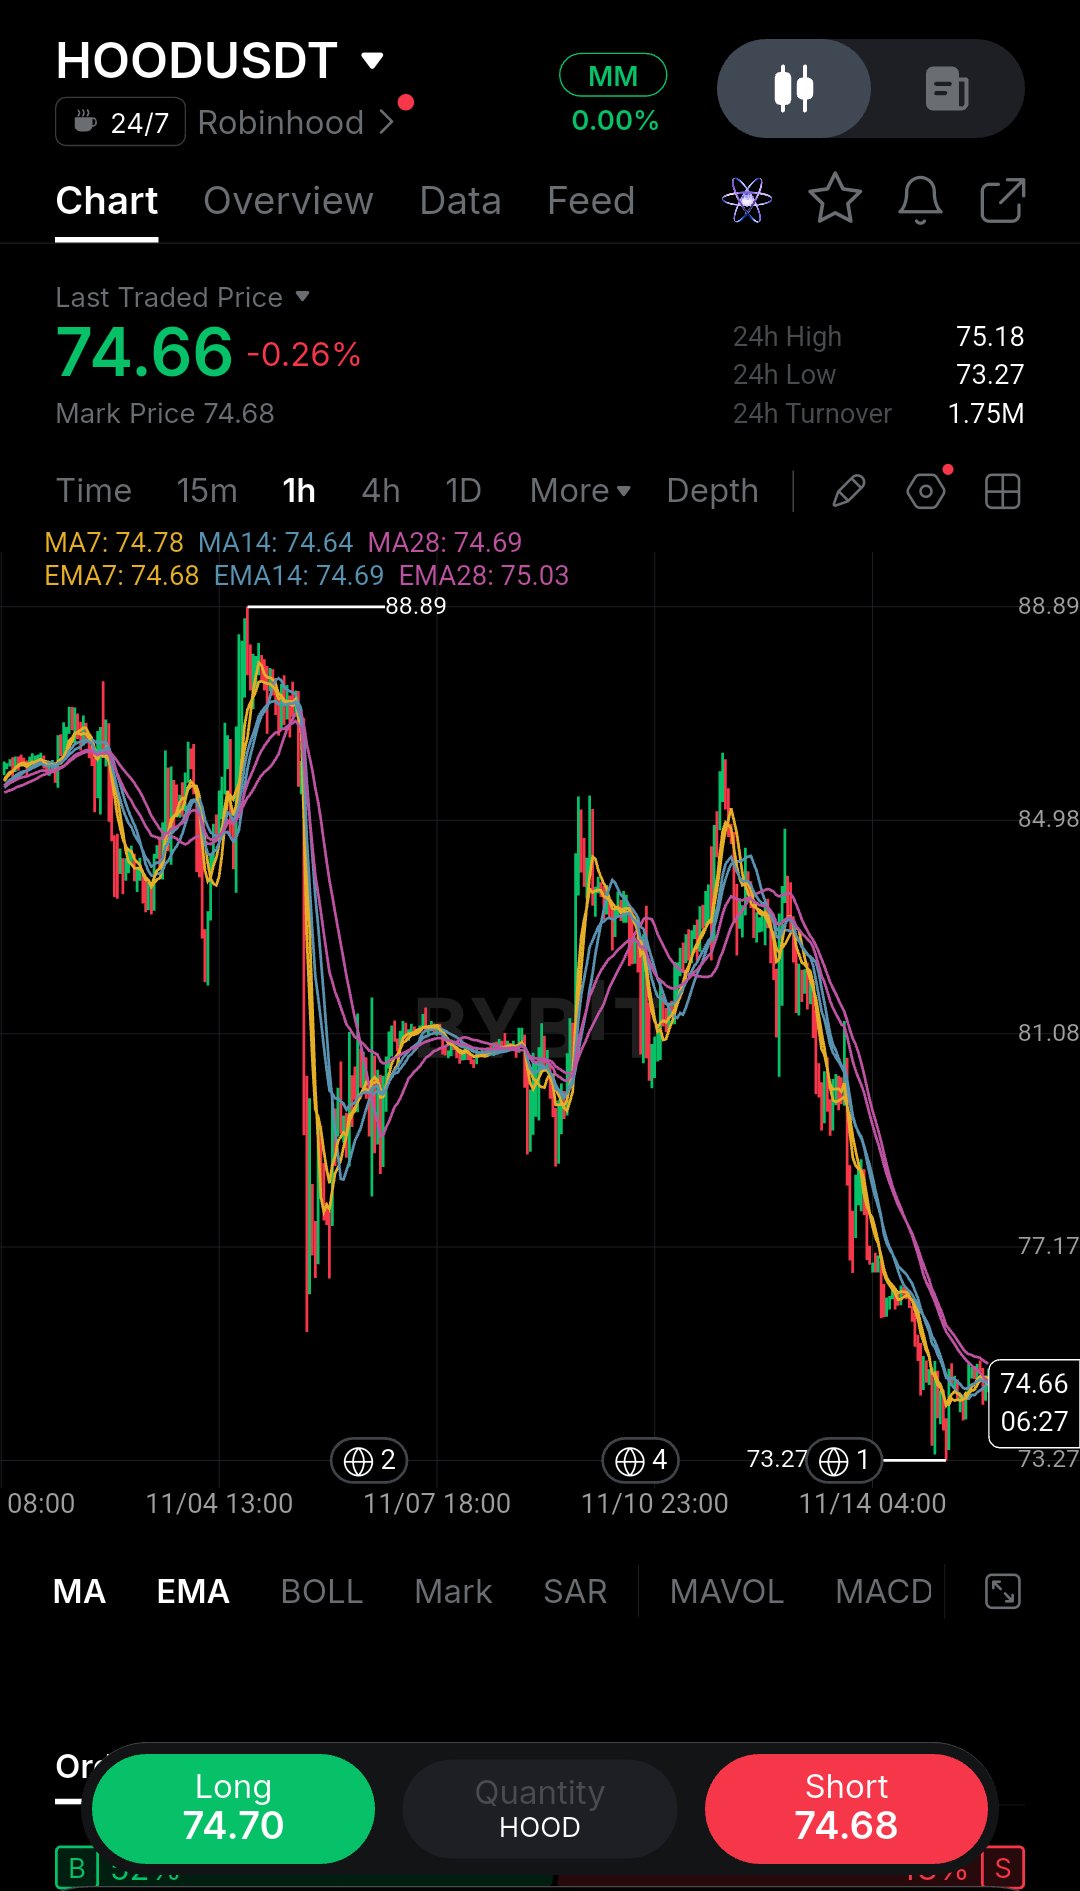
このHOODのチャートを見て最初に自問するのは、今ここで自分の資金をリスクに晒すかということです。正直なところ、答えはノーです。これほど激しい売り叩きの最中ではなおさらです。しかし、これはなぜ確認を待つことが重要なのかを示す完璧な例と言えます。 1時間足で見ると、マクロトレンドは明らかに弱気です。88.89のピークから下落が続いており、最近のプライスアクションは完全な投げ売り状態です。急落によりサポートを真っ向から突き抜け、73.27の安値を付けました。現在、価格は74.66付近を推移しており、移動平均線が頭上に重くのしかかっています。MA7(74.78)、MA14(74.64)、MA28(74.69)がすべて動的なレジスタンスとして機能しています。 これは教科書的な弱気の並びです。価格がこれほど垂直に落ちると、下支えとなる構造的なサポートはほとんどありません。 早まったエントリーを何度も経験して学んだ教訓は、「売られすぎ=買い時」ではないということです。私は常に、市場が底を打てることを証明してからエントリーするようにしています。 トレードプラン: バイアス: 弱気(デッドキャットバウンスまたは構造的な底を待つ) エントリーゾーン: 75.00 – 75.20(移動平均線のクラスターへのリトレースメントを狙う。明確な反落を確認できた場合のみ) ストップロス: 77.20(直前のブレイクダウンブロックの上) ターゲット1: 73.27(直近安値) ターゲット2: 71.00(心理的サポートライン) ターゲット3: 69.00(拡張ターゲット) リスクリワード: 1:2.5 無効化: 1時間足が76.50を超えて確定した場合、大規模なV字回復のシグナルとみなす。 落ちてくるナイフにFOMO(取り残される恐怖)を感じて飛びつかないこと。市場が落ち着くのを待ち、ストップロスを守り、失ってもいい額以上のリスクは決して取らないこと。 あなたならこの落ちてくるナイフを掴む勇気がありますか?それとも、明確な反転シグナルを待ちますか? $HOODXUSDT #ByXIMPACT
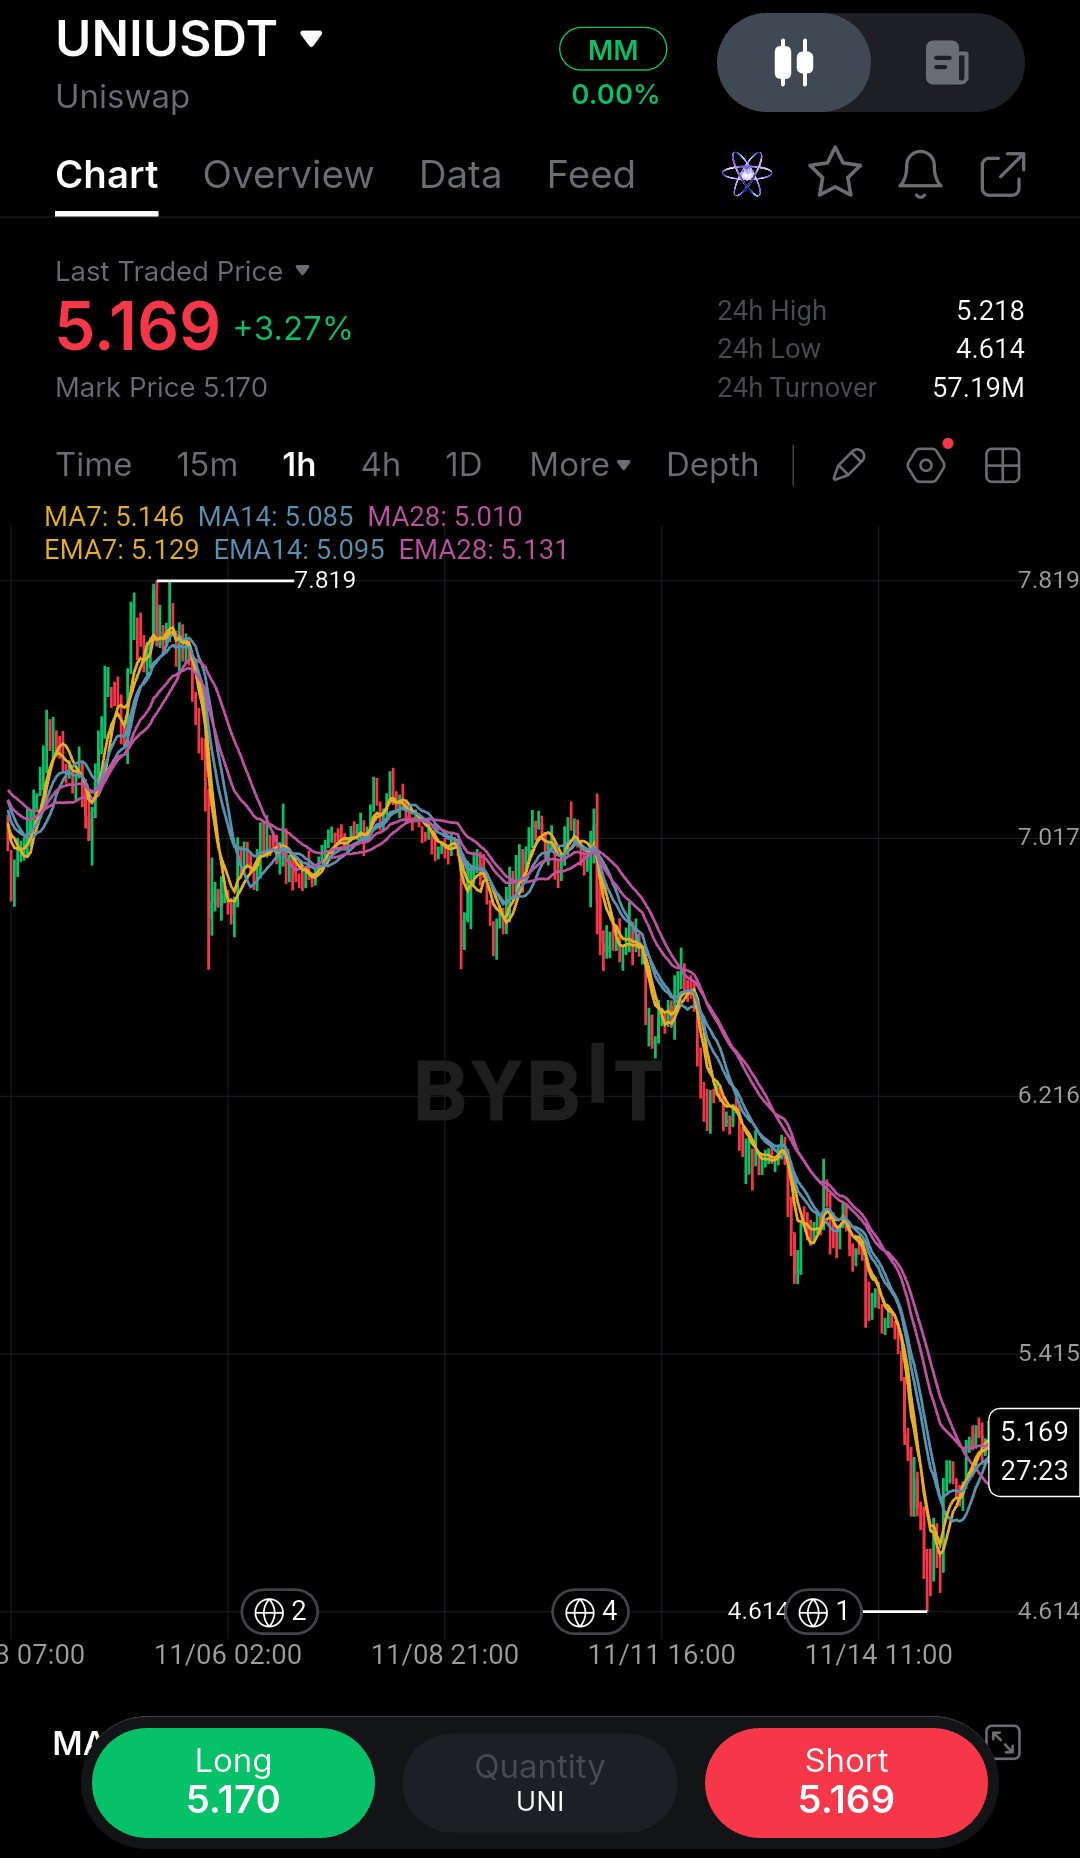
I almost ignored this UNI chart until I noticed how the price was interacting with the moving averages on the right side. Looking at the 1-hour timeframe, the macro trend had a heavy bleed from the 7.819 peak down to the 4.614 low. But zoom in on the recent price action. The aggressive selling stalled, and we’ve seen a strong, aggressive V-shaped recovery pushing the price back up to 5.169 (+3.27%). Here is the critical detail: price is currently trading just above a fanned-out moving average cluster. The MA7 (5.146), MA14 (5.085), and MA28 (5.010) are all acting as dynamic support beneath us. This is a textbook structural shift. When a downtrend stops making lower lows and price aggressively reclaims its moving averages, it signals that sellers are exhausted. However, we are testing a local resistance zone, so this is a tactical bounce, not a full reversal yet. A lesson I've learned from trying to catch falling knives is that you don't buy the bottom; you buy the confirmation of a structure shift. Trade Plan: Bias: Short-term bullish (Playing the recovery). Entry Zone: 5.050 – 5.120 (Looking for a slight pullback to retest the MA cluster). Stop Loss: 4.610 (Just below the recent local swing low). Target 1: 5.218 (24h high and immediate resistance). Target 2: 6.216 (Mid-range macro resistance). Target 3: 7.017 (Previous breakdown level). Risk/Reward: 1:2.5 Invalidation: A 1H candle close below 4.900, which would signal a loss of the local uptrend support. Don't FOMO into the middle of this chop. Wait for the hourly candle to close strong, respect your stop loss, and never risk more than you can afford to lose. Do you think UNI is finally ready for a relief rally, or is this just a pause before the next leg down? $UNIUSDT #ByXIMPACT
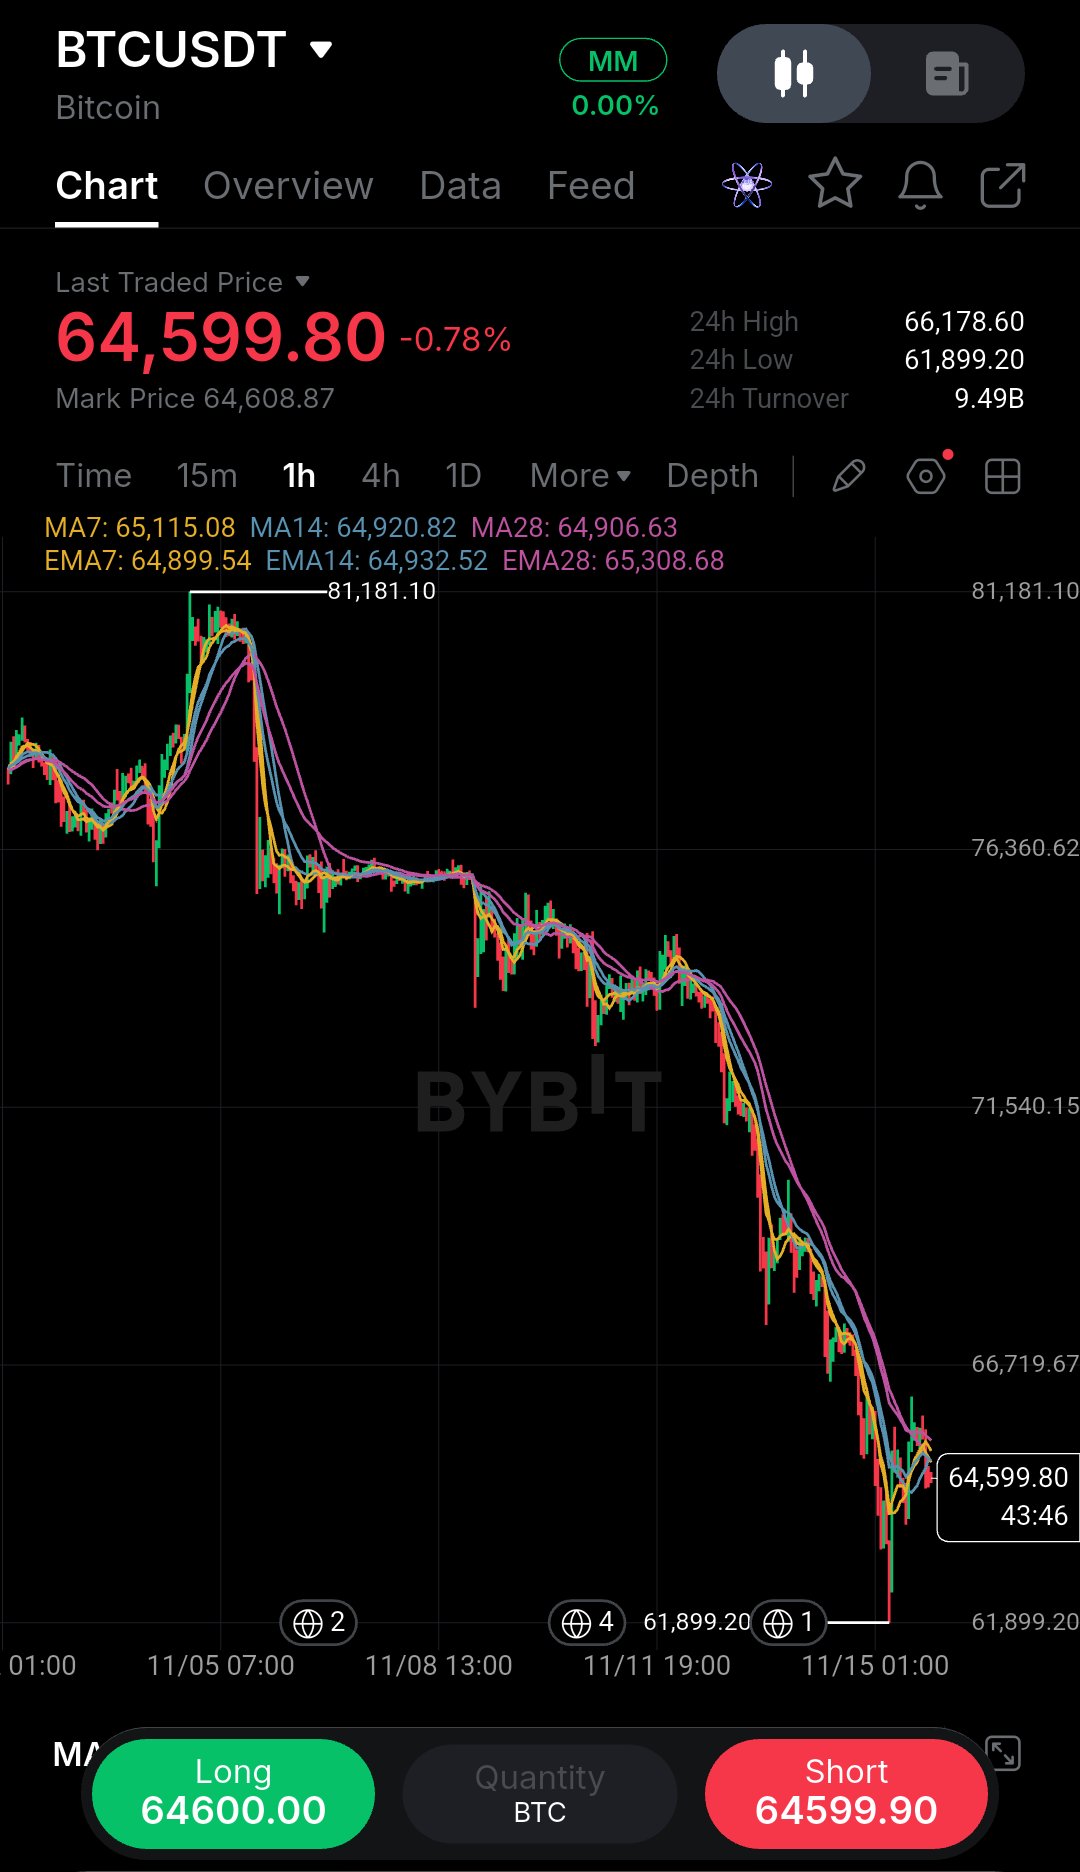
The first thing I ask myself looking at this BTC chart is whether I’d actually risk my own money here right now. Honestly, the answer is no—not in the middle of this heavy sell-off. But it’s a perfect example of why waiting for confirmation matters. Looking at the 1-hour timeframe, the macro trend is clearly bearish. We’ve bled from the 81,181 peak, and the recent price action is pure capitulation. A heavy -0.78% drop just sliced straight through support, tagging a low of 61,899.20. Right now, price is hovering at 64,599.80, and the moving averages are stacked heavily above us. The MA7 (65,115), MA14 (64,920), and MA28 (64,906) are all acting as dynamic resistance. This is a textbook bearish alignment. When price goes vertical like this, there is very little structural support underneath it. A lesson I’ve learned from taking too many early entries is that oversold does not always mean it’s time to buy. I always let the market prove it can find a floor before entering. Trade Plan: Bias: Bearish (Waiting for a dead-cat bounce or structural base). Entry Zone: 65,100 – 65,500 (Looking for a retracement to the MA cluster, only if it forms a clear rejection). Stop Loss: 66,200 (Above the previous breakdown block). Target 1: 61,899 (Recent low). Target 2: 60,000 (Psychological support). Target 3: 58,000 (Extended target). Risk/Reward: 1:2.5 Invalidation: A 1H candle close back above 66,000, signaling a massive V-shaped reversal. Do not FOMO into a falling candle. Wait for the market to cool off, respect your stop loss, and never risk more than you can afford to lose. Would you dare to catch this falling knife, or are you waiting for a clear reversal signal? $BTCUSDT #ByXIMPACT
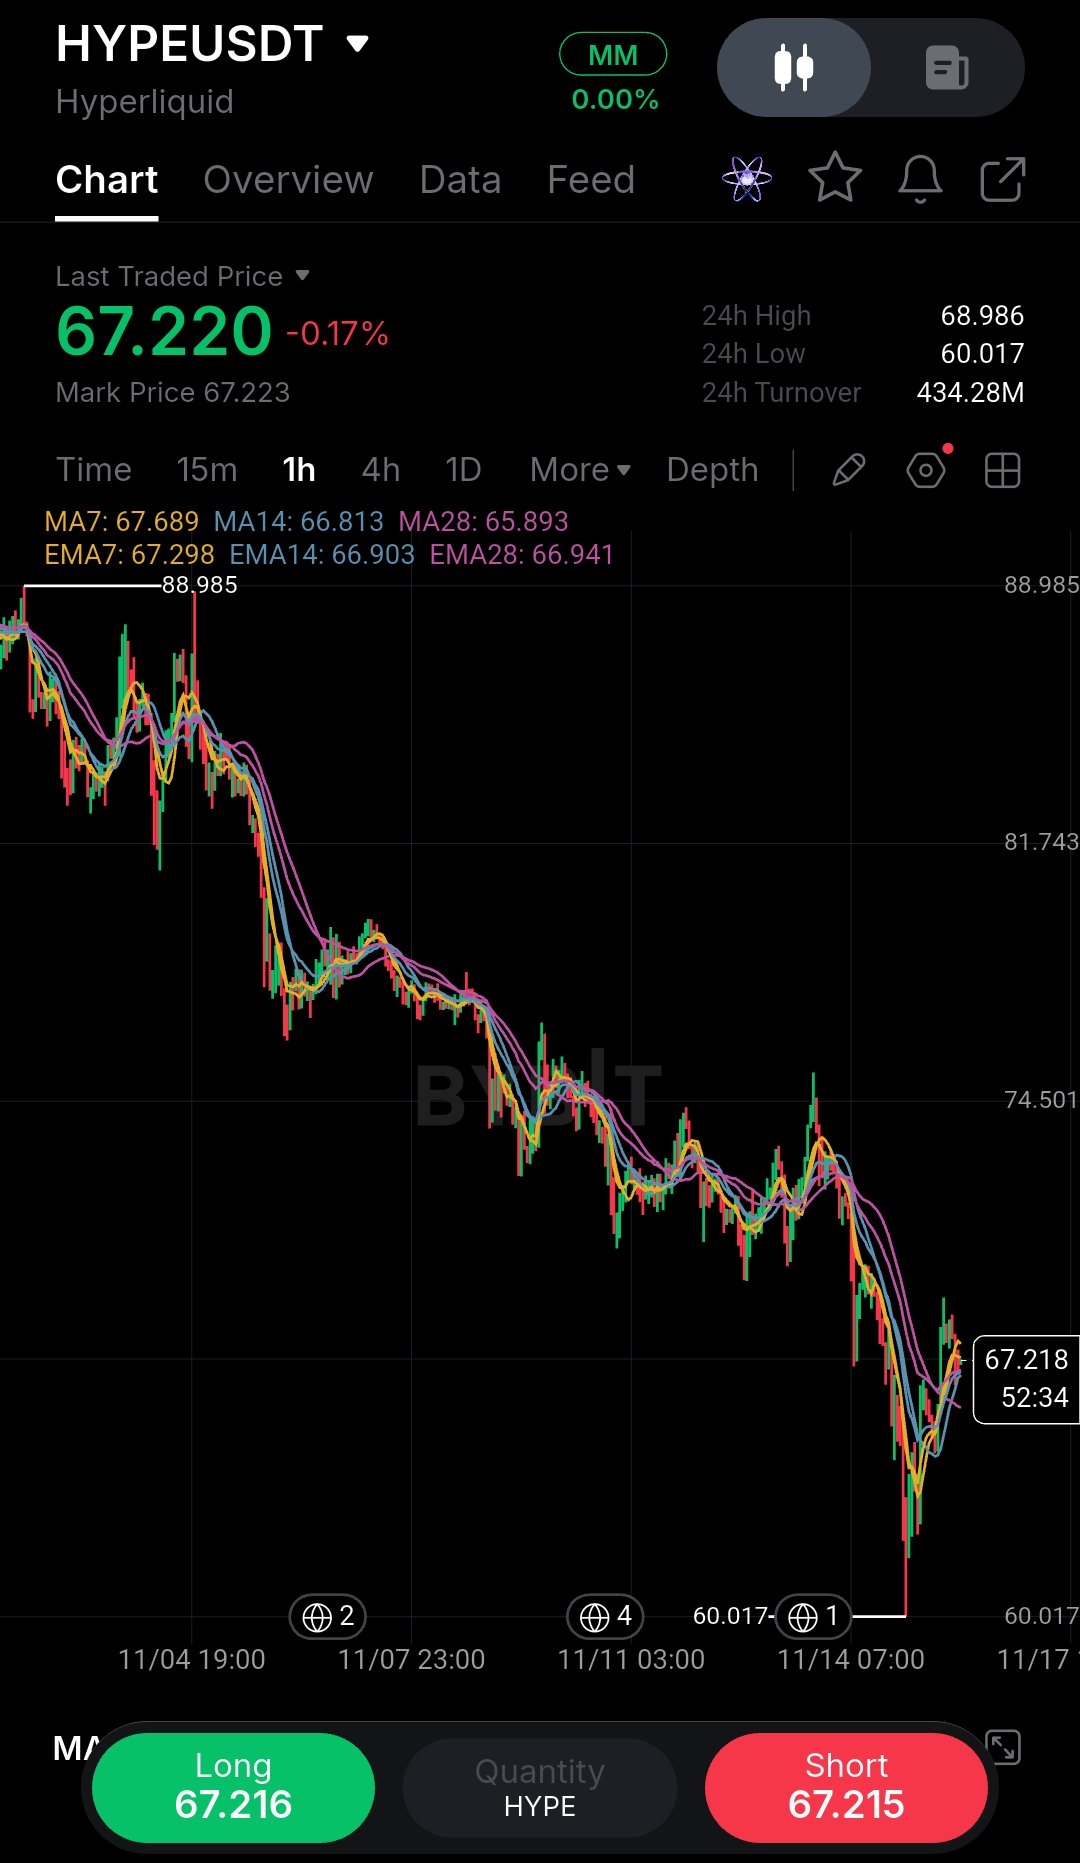
このHYPEのチャート、危うく見逃すところだったけど、右側の移動平均線と価格の絡み方を見てハッとしたよ。 1時間足を見ると、88.985のピークから60.017の安値まで、マクロトレンドはかなりひどい垂れ下げだった。でも直近の値動きをズームインしてみると、激しい売りはストップして、V字回復で価格を67.220(-0.17%)まで押し戻す力強い動きを見せている。 ここからが重要。現在、価格は広がっていた移動平均線が収束するクラスターの真上に位置している。MA7(67.689)、MA14(66.813)、そしてMA28(65.893)が、まさに今の価格帯で重なっているんだ。 これは教科書通りの構造変化だ。下降トレンドで安値を更新しなくなり、価格が移動平均線を力強く奪還し始めたら、それは売り圧力が枯渇したサイン。ただ、ローカルなレジスタンスゾーンを試している最中だから、本格的な反転というよりは、あくまで戦術的なリバウンドと見るべきだろう。 落ちてくるナイフを掴もうとして学んだ教訓は、底値で買うな、構造変化の確認を買え、ということだ。 トレードプラン: バイアス:短期強気(回復狙い) エントリーゾーン:65.900 – 66.800(MAクラスターの再テストを狙って少し押すのを待つ) 損切り:60.000(直近の安値のすぐ下) ターゲット1:68.986(24時間高値、即時のレジスタンス) ターゲット2:74.501(中期マクロレジスタンス) ターゲット3:81.743(前回の下落起点) リスクリワード:1:2.5 無効条件:1時間足が64.000を下回って確定した場合。これはローカルな上昇トレンドのサポート割れを意味する。 この揉み合いの真っ最中にFOMOで飛びつくのはやめよう。1時間足が力強く確定するのを待ち、損切りラインを厳守して、失ってもいい額以上のリスクは取らないこと。 HYPEはついに自律反発の準備が整ったと思う?それとも、次の下落に向けた単なる一時停止かな? $HYPEUSDT #ByXIMPACT
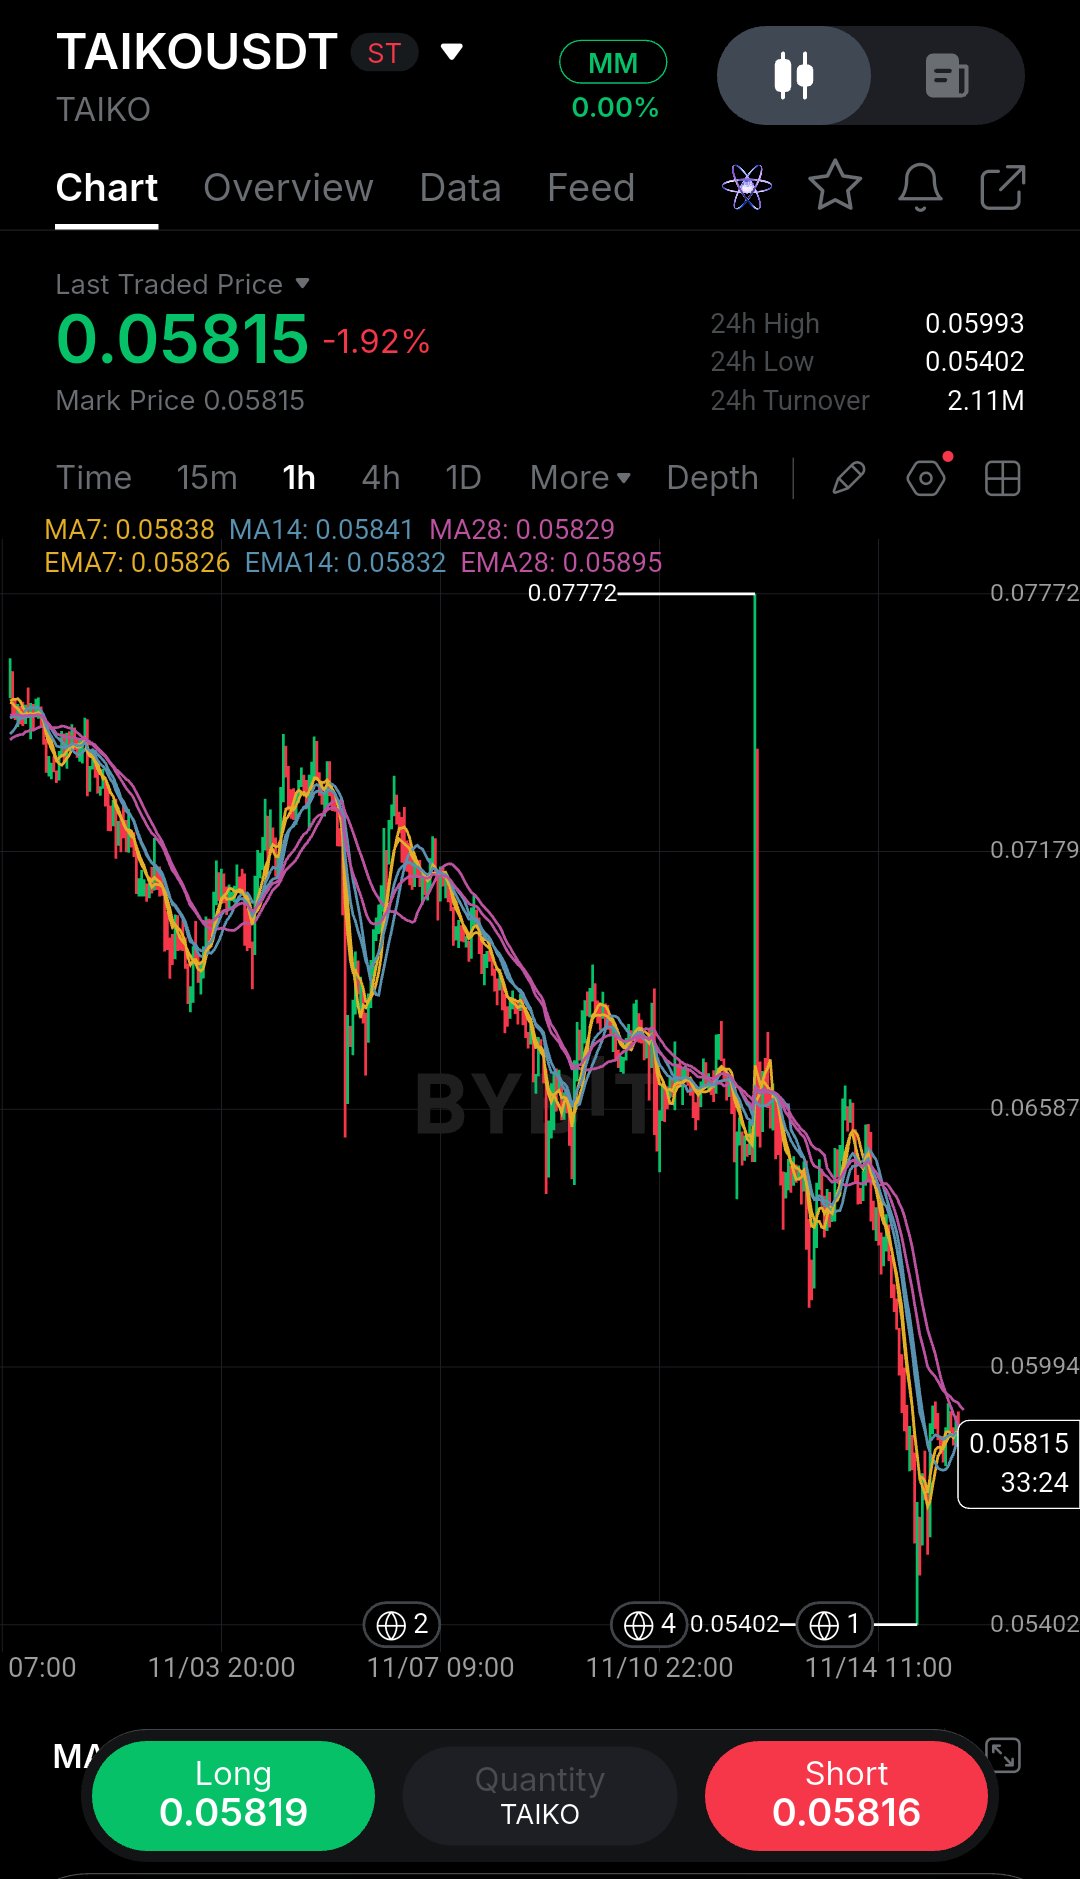
TAIKOのチャートはほとんど無視するところでしたが、右側で価格が移動平均線に沿って非常にタイトに圧縮されていることに気づきました。 1時間足で見ると、マクロトレンドは紛れもなく弱気です。0.07772のピークから執拗な下落が続いており、高値切り下げと安値切り下げの連続が続いています。しかし、直近のプライスアクションを拡大してみましょう。0.05402の安値まで急落した後、激しい売りは停滞しました。価格は0.05815まで戻しましたが、ここで重要な詳細があります。現在、価格は完全にフラットな移動平均線のサンドイッチ状態に閉じ込められています。MA7(0.05838)、MA14(0.05841)、そしてMA28(0.05829)がすべて、現在の価格のすぐ近くで固く圧縮されています。 これは典型的なボラティリティ・スクイーズ(収束)です。大幅な下落の後、このように移動平均線がフラットになるということは、売りモメンタムが完全に枯渇したことを意味します。市場はエネルギーを溜め込み、カタリスト(引き金)を待っている状態です。 暴落後のベース形成を取引する上で私が学んだ教訓は、方向性を予測しないことです。私は、リスクを取る前に、1時間足がこのクラスターを明確にブレイクして確定するのを待ちます。 トレードプラン: バイアス: 中立(ブレイクアウト待ち) エントリーゾーン: 0.06000 – 0.06020(ローカルレジスタンスと24時間高値をクリアする強力な1時間足の確定時のみ) 損切り: 0.05400(直近のマクロスイング安値のすぐ下) ターゲット1: 0.06587(ミドルレンジのレジスタンス) ターゲット2: 0.07179(前回のブレイクダウンレベル) ターゲット3: 0.07772(マクロピーク) リスクリワード: 1:2.5 無効化: 1時間足が0.05650を下回って確定した場合。このベースの崩壊を示唆し、下降トレンドの再開となります。 この揉み合いの最中にFOMO(乗り遅れへの恐怖)で飛びつかないこと。確認用のローソク足が出るのを待ち、損切りラインを尊重し、決して失っても良い額以上のリスクは取らないようにしてください。 皆さんはTAIKOがようやくここで底を打ったと思いますか?それとも、これは次の暴落前の一時停止に過ぎないと思いますか? $TAIKOUSDT #ByXIMPACT
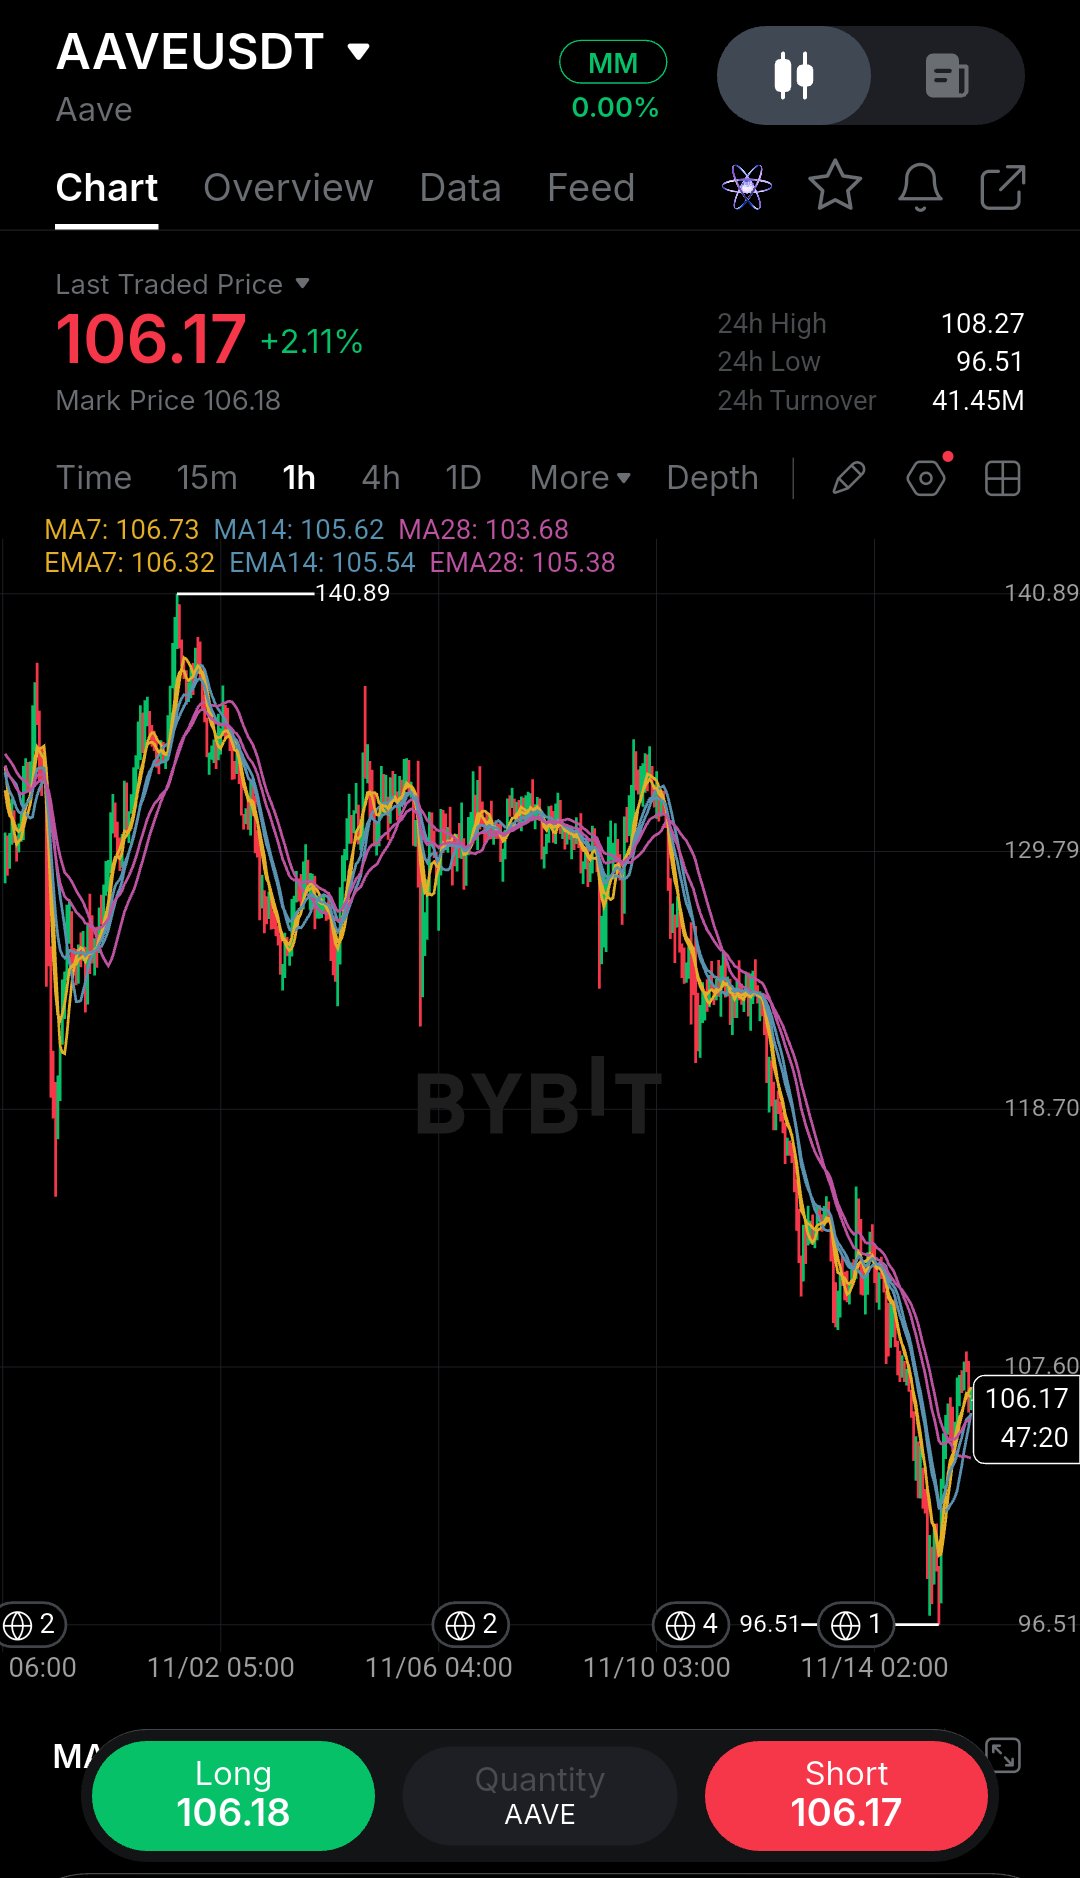
I almost ignored this AAVE chart until I noticed how the price was interacting with the moving averages on the right side. Looking at the 1-hour timeframe, the macro trend had a heavy bleed from the 140.89 peak down to the 96.51 low. But zoom in on the recent price action. The aggressive selling stalled, and we’ve seen a strong, aggressive V-shaped recovery pushing the price back up to 106.17 (+2.11%). Here is the critical detail: price is currently trading just above a fanned-out moving average cluster. The MA7 (106.73), MA14 (105.62), and MA28 (103.68) are all acting as dynamic support beneath us. This is a textbook structural shift. When a downtrend stops making lower lows and price aggressively reclaims its moving averages, it signals that sellers are exhausted. However, we are testing a local resistance zone, so this is a tactical bounce, not a full reversal yet. A lesson I've learned from trying to catch falling knives is that you don't buy the bottom; you buy the confirmation of a structure shift. Trade Plan: Bias: Short-term bullish (Playing the recovery). Entry Zone: 104.00 – 106.00 (Looking for a slight pullback to retest the MA cluster). Stop Loss: 96.50 (Just below the recent local swing low). Target 1: 108.27 (24h high and immediate resistance). Target 2: 118.70 (Mid-range macro resistance). Target 3: 129.79 (Previous breakdown level). Risk/Reward: 1:2.5 Invalidation: A 1H candle close below 102.00, which would signal a loss of the local uptrend support. Don't FOMO into the middle of this chop. Wait for the hourly candle to close strong, respect your stop loss, and never risk more than you can afford to lose. Do you think AAVE is finally ready for a relief rally, or is this just a pause before the next leg down? $AAVEUSDT #ByXIMPACT
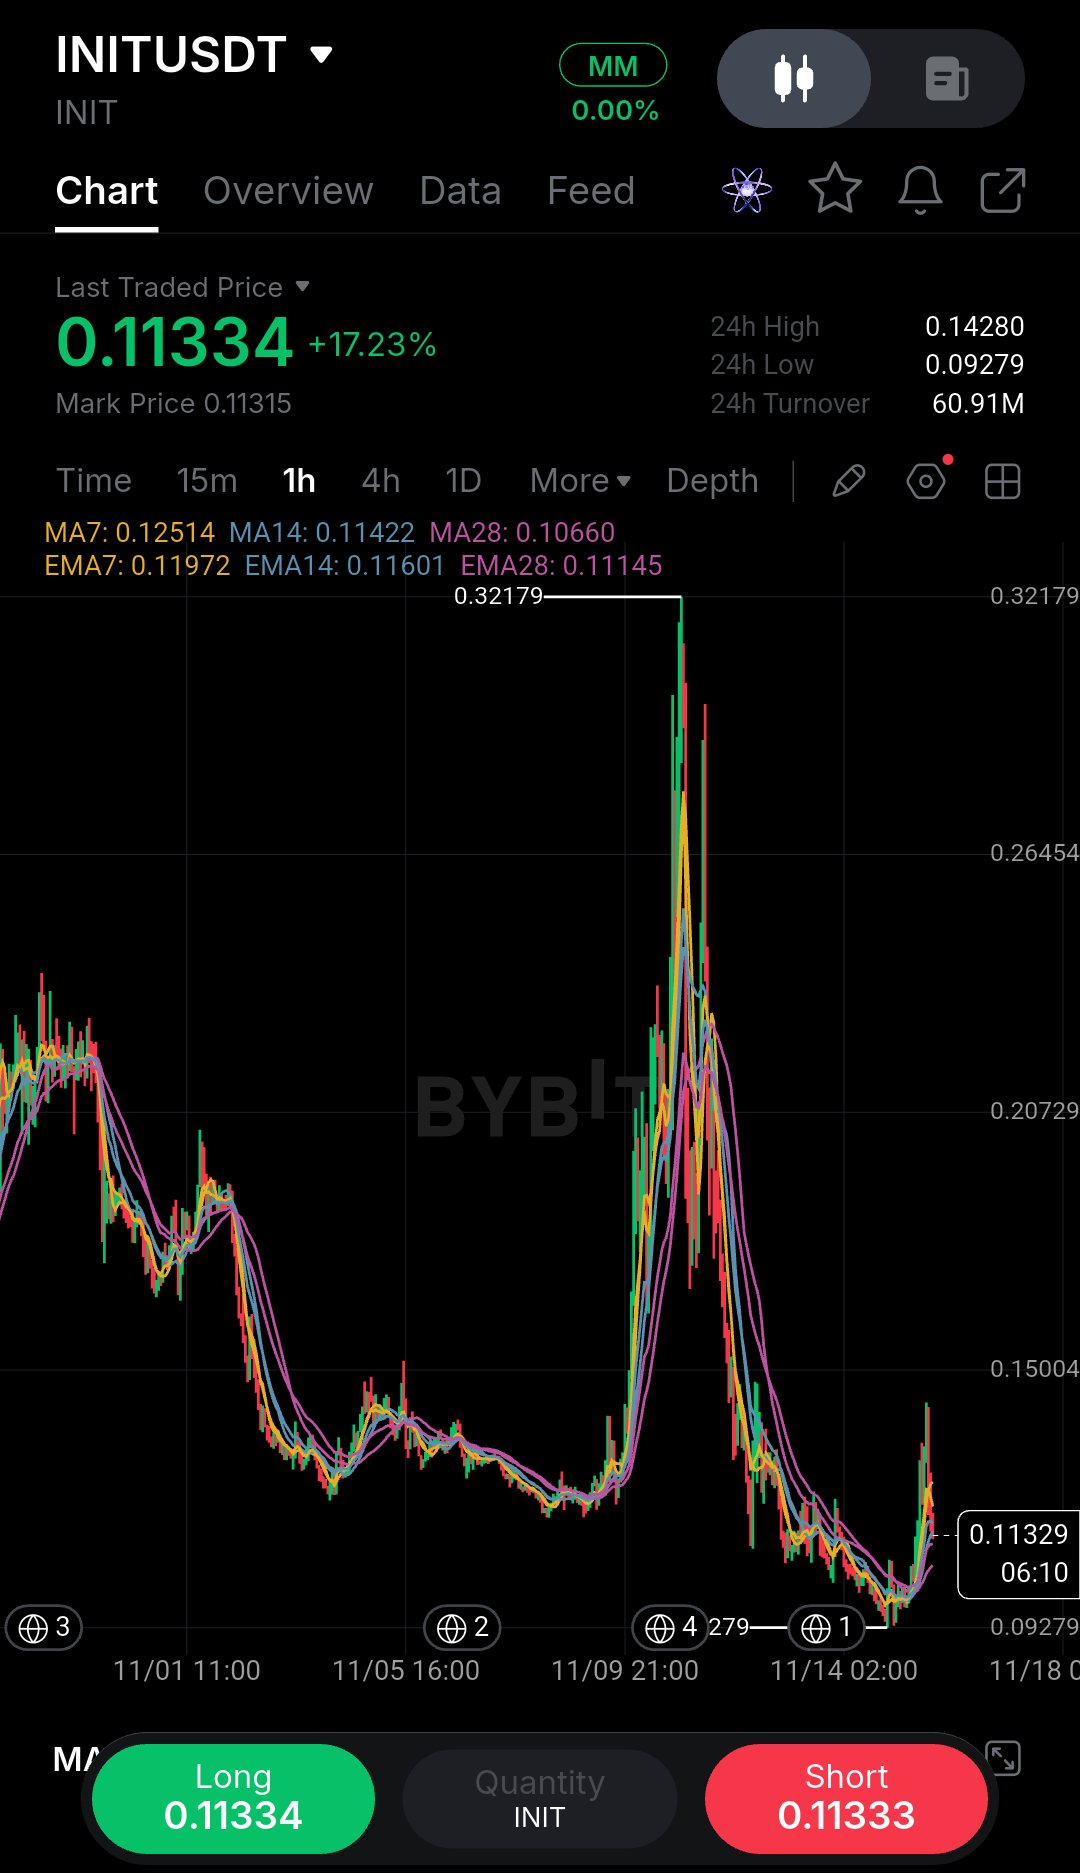
I almost ignored this INIT chart until I noticed how the price was interacting with the moving averages on the right side. Looking at the 1-hour timeframe, this chart is incredibly volatile. We saw a massive parabolic spike to 0.32179, followed by a brutal bleed all the way down to the 0.09279 low. But zoom in on the recent price action. The aggressive selling stalled, and we’ve just seen a strong impulse pushing the price back up to 0.11334 (+17.23%). Here is the critical detail: price is currently trading right at a fanned-out moving average cluster. The MA7 (0.12514), MA14 (0.11422), and MA28 (0.10660) are all converging right at the current price. This is a textbook structural shift. When a downtrend stops making lower lows and price aggressively reclaims its moving averages, it signals that sellers are exhausted. However, this move is getting extended. Chasing a green candle after a 17% spike is a great way to get trapped in a pullback. A lesson I've learned from chasing these reversals is that the initial impulse is often just the trap. I prefer to wait for the price to retest the moving averages before entering. Trade Plan: Bias: Short-term bullish (Playing the recovery). Entry Zone: 0.1060 – 0.1100 (Looking for a slight pullback to retest the MA28/MA14 cluster). Stop Loss: 0.0927 (Just below the recent local swing low). Target 1: 0.1428 (24h high and immediate resistance). Target 2: 0.2072 (Mid-range macro resistance). Target 3: 0.2645 (Previous breakdown level). Risk/Reward: 1:2.5 Invalidation: A 1H candle close back below 0.1000, signaling the bears are back in control. Don't FOMO into a vertical candle. Wait for the price to cool off and prove it can hold these levels, respect your stop loss, and never risk more than you can afford to lose. Do you think this recovery has legs, or is it just a lower high before the next dump? $INITUSDT #ByXIMPACT
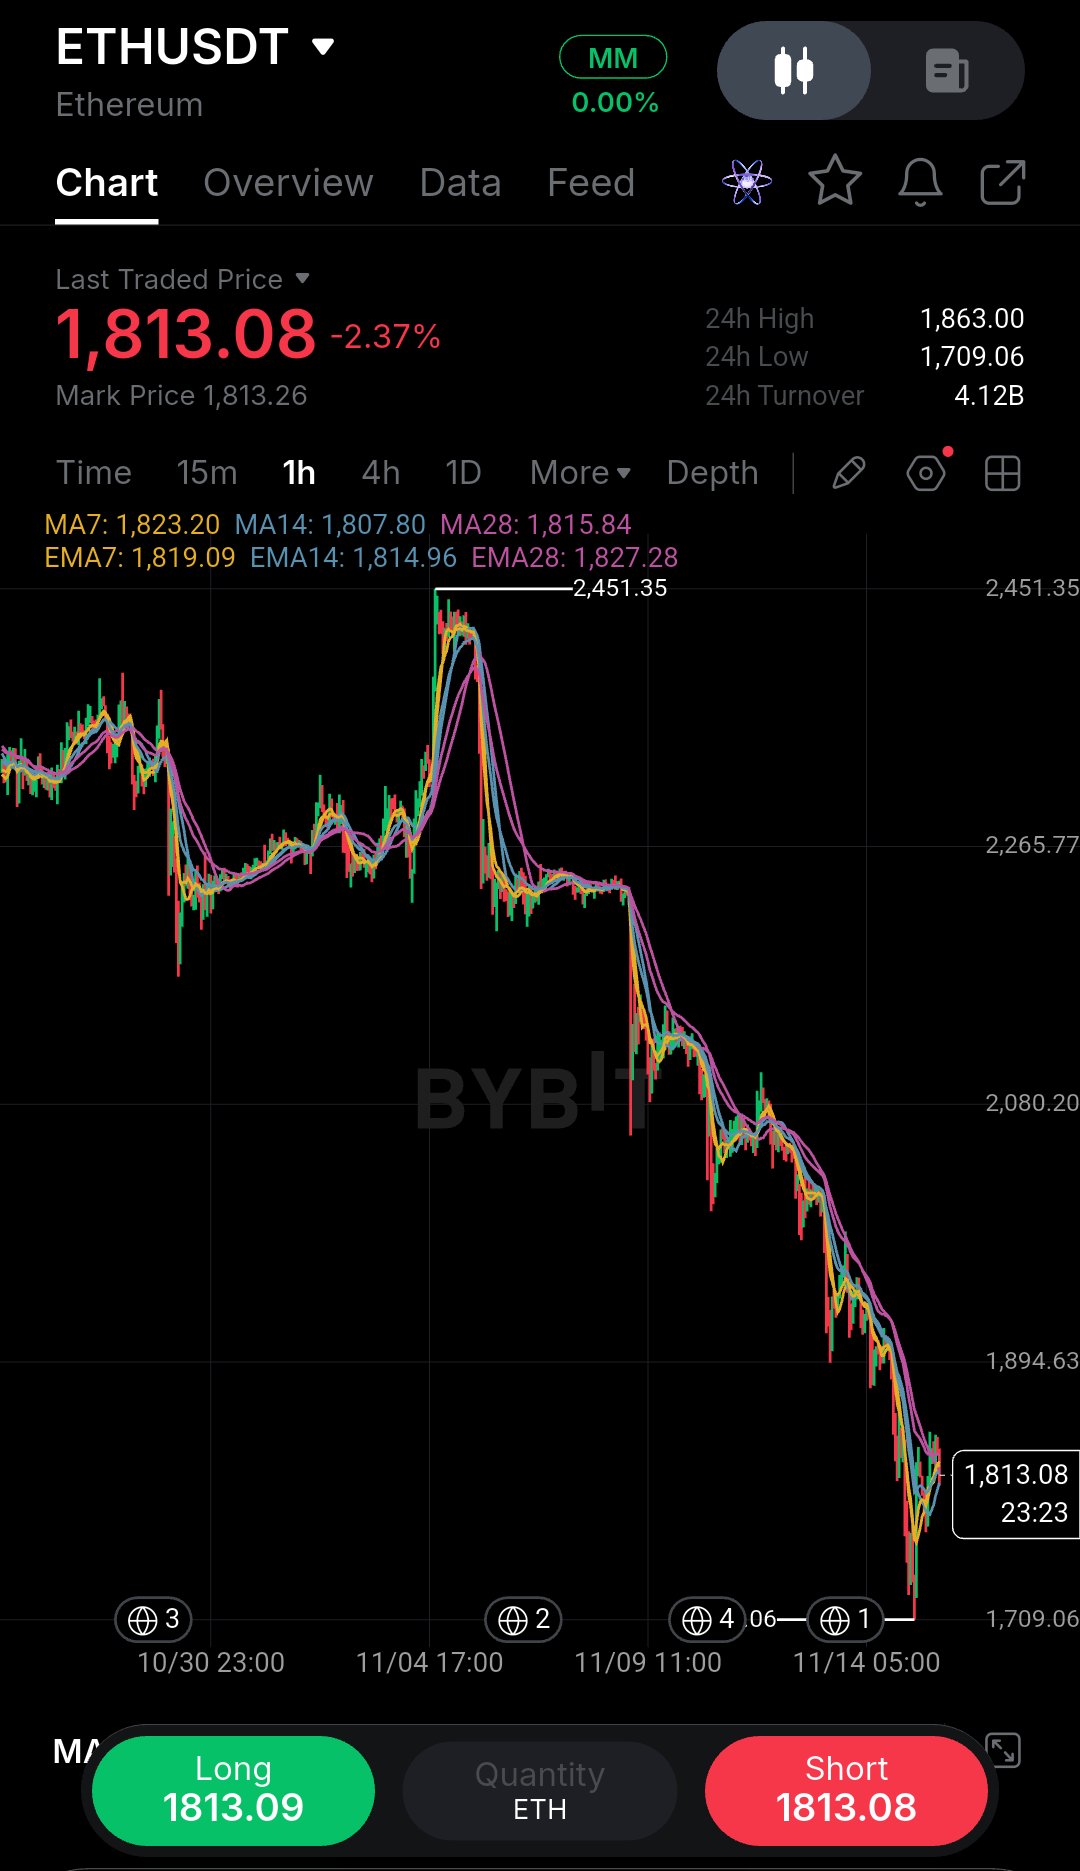
The first thing I ask myself looking at this ETH chart is whether I’d actually risk my own money here right now. Honestly, the answer is no—not in the middle of this heavy sell-off. But it’s a perfect example of why waiting for confirmation matters. Looking at the 1-hour timeframe, the macro trend is clearly bearish. We’ve bled from the 2,451.35 peak, and the recent price action is pure capitulation. A heavy -2.37% drop just sliced straight through support, tagging a low of 1,709.06. Right now, price is hovering at 1,813.08, and the moving averages are stacked heavily above us. The MA7 (1,823), MA14 (1,807), and MA28 (1,815) are all acting as dynamic resistance. This is a textbook bearish alignment. When price goes vertical like this, there is very little structural support underneath it. A lesson I’ve learned from taking too many early entries is that oversold does not always mean it’s time to buy. I always let the market prove it can find a floor before entering. Trade Plan: Bias: Bearish (Waiting for a dead-cat bounce or structural base). Entry Zone: 1,820.00 – 1,830.00 (Looking for a retracement to the MA cluster, only if it forms a clear rejection). Stop Loss: 1,863.00 (Above the previous breakdown block). Target 1: 1,709.06 (Recent low). Target 2: 1,680.00 (Psychological support). Target 3: 1,650.00 (Extended target). Risk/Reward: 1:2.5 Invalidation: A 1H candle close back above 1,850.00, signaling a massive V-shaped reversal. Do not FOMO into a falling candle. Wait for the market to cool off, respect your stop loss, and never risk more than you can afford to lose. Would you dare to catch this falling knife, or are you waiting for a clear reversal signal? $ETHUSDT #ByXIMPACT
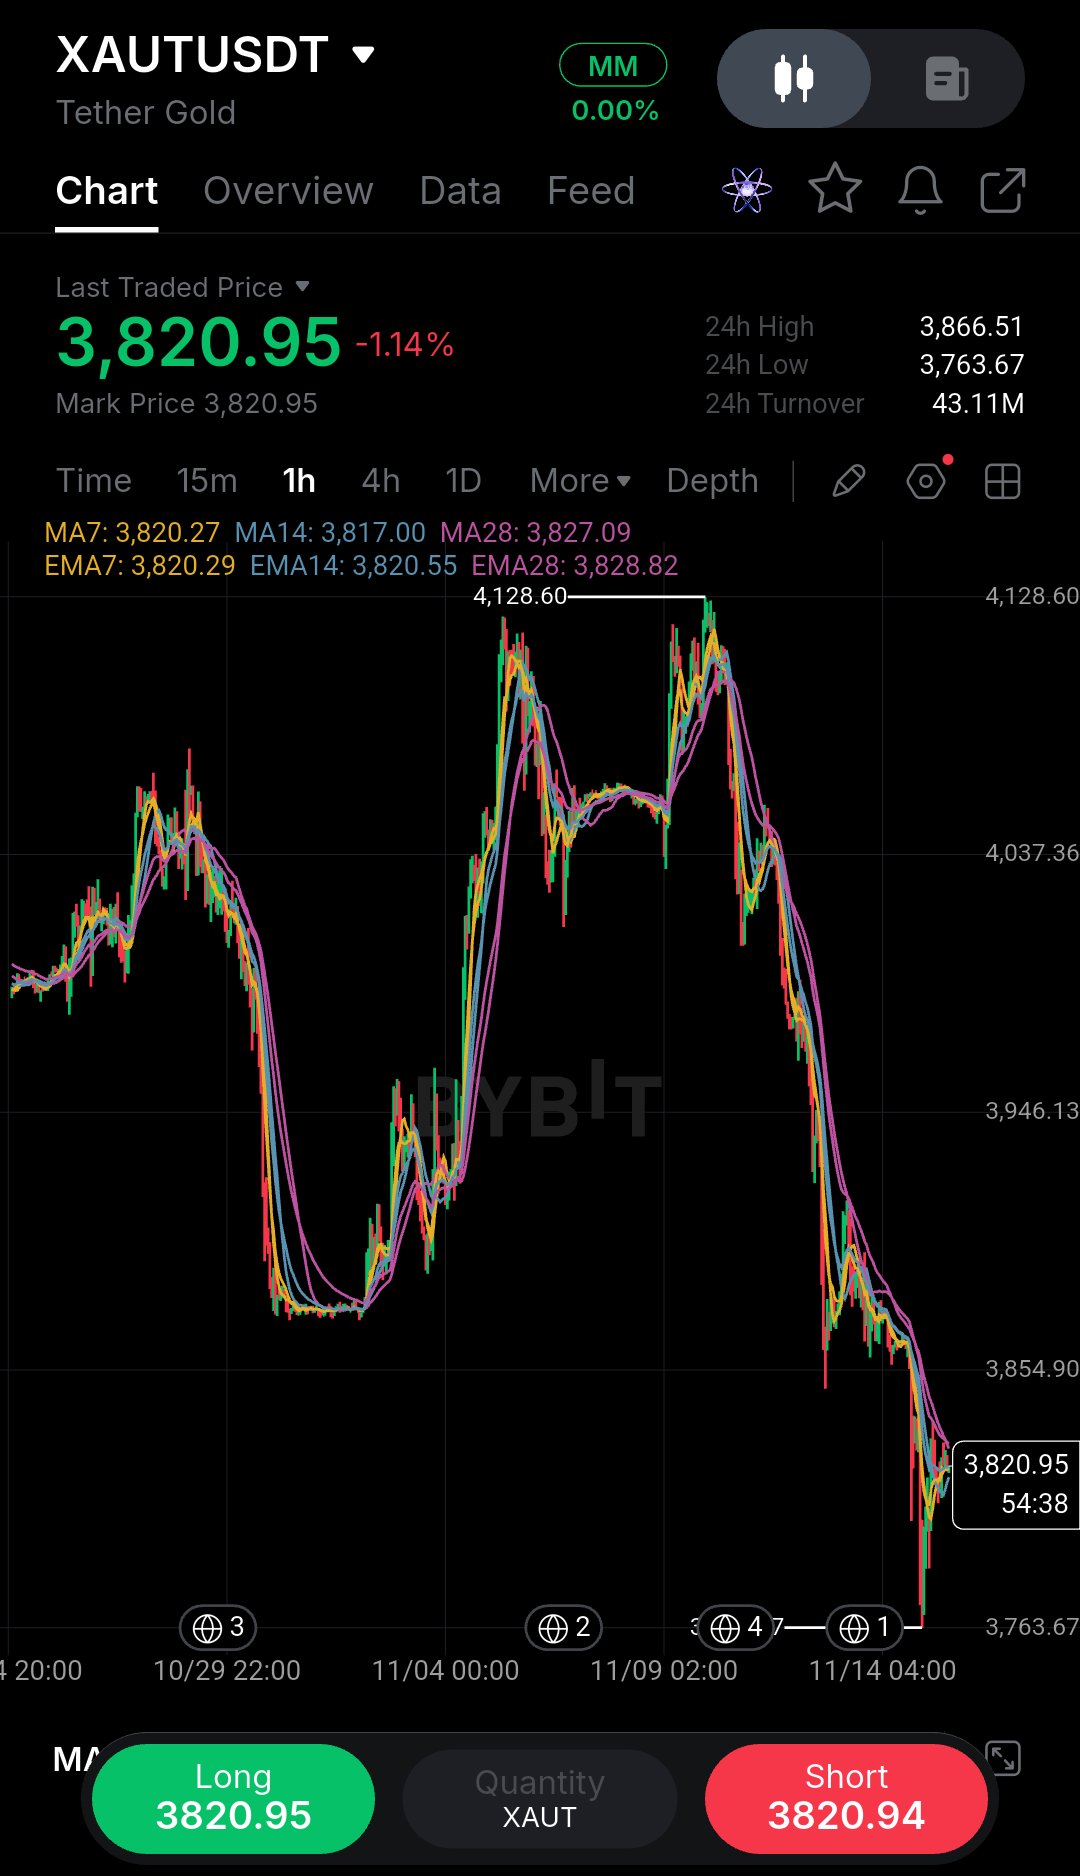
The first thing I ask myself looking at this XAUT chart is whether I’d actually risk my own money here right now. Honestly, the answer is no—not in the middle of this heavy sell-off. But it’s a perfect example of why waiting for confirmation matters. Looking at the 1-hour timeframe, the macro trend is clearly bearish. We’ve bled from the 4,128.60 peak, and the recent price action is pure capitulation. A heavy -1.14% drop just sliced straight through support, tagging a low of 3,763.67. Right now, price is hovering at 3,820.95, and the moving averages are stacked heavily above us. The MA7 (3,820.27), MA14 (3,817.00), and MA28 (3,827.09) are all acting as dynamic resistance. This is a textbook bearish alignment. When price goes vertical like this, there is very little structural support underneath it. A lesson I’ve learned from taking too many early entries is that oversold does not always mean it’s time to buy. I always let the market prove it can find a floor before entering. Trade Plan: Bias: Bearish (Waiting for a dead-cat bounce or structural base). Entry Zone: 3,825.00 – 3,830.00 (Looking for a retracement to the MA cluster, only if it forms a clear rejection). Stop Loss: 3,866.00 (Above the previous breakdown block). Target 1: 3,763.67 (Recent low). Target 2: 3,750.00 (Psychological support). Target 3: 3,700.00 (Extended target). Risk/Reward: 1:2.5 Invalidation: A 1H candle close back above 3,850.00, signaling a massive V-shaped reversal. Do not FOMO into a falling candle. Wait for the market to cool off, respect your stop loss, and never risk more than you can afford to lose. Would you dare to catch this falling knife, or are you waiting for a clear reversal signal? $XAUTUSDT #ByXIMPACT