BitXenMaster
30097いいね37シェア342ファン14フォロー
Honest and simple 💖📈
Honest and simple 💖📈
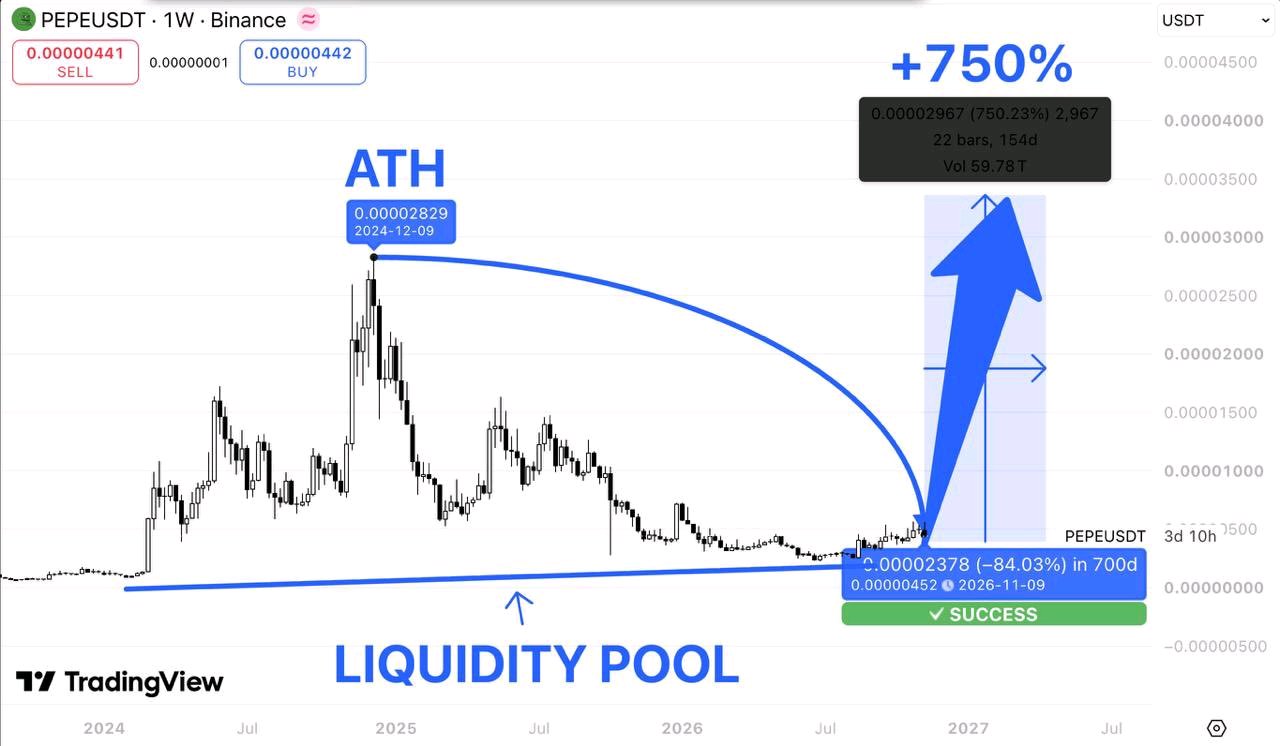
$PEPE is trading around $0.0000044.
And this weekly chart is showing a setup that could become very interesting. Remember when $PEPE reached its all-time high near $0.0000283 in December 2024? Since then, it's been a brutal correction. Lower highs. Failed recoveries. Months of persistent selling pressure. Now price is down more than 84% from its previous peak. But look at where we're sitting. $PEPE has returned to a major long-term liquidity zone, near the same historical price region that preceded its earlier explosive rallies. And that's what caught my attention. After months of declining prices, the market is beginning to stabilize near its lows. Could this be the foundation for another major expansion? Possibly. But buyers still need to confirm it. Here's my roadmap. $0.000007 — First resistance to reclaim. $0.000010 — Important psychological level. $0.000016 — Major historical resistance. $0.0000283 — Previous ATH. And $0.000034? That's my aggressive bull scenario. The chart illustrates a potential 750% rally from its marked historical reference point. But here's the important part. A return to historical support doesn't automatically mean the bottom is in. I want to see $PEPE establish higher lows, reclaim $0.000007, and eventually break above $0.000010 with sustained buying volume. That would provide stronger evidence that the weekly structure is shifting. Without those confirmations, the broader downtrend remains intact. Still, the psychology is fascinating. When $PEPE was trading near its all-time high, everyone wanted exposure. Now it's more than 80% below that peak, and sentiment looks very different. But meme coins can remain depressed for much longer than traders expect. The 750% projection is a speculative scenario, not a guaranteed outcome. For now, I'm watching whether buyers can defend this historical base. If the weekly structure finally reverses, $PEPE could become one of the more interesting recovery setups to follow.
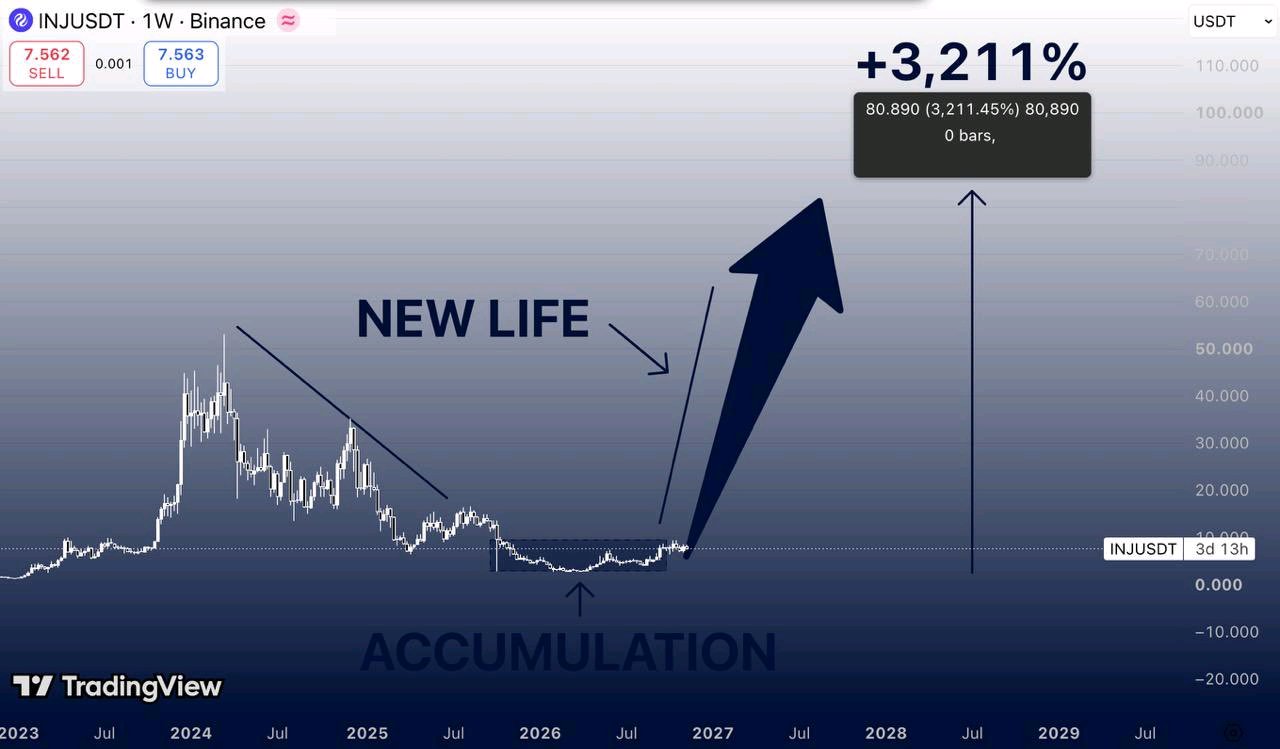
$INJ is trading around $7.56. And this weekly chart is starting to show something very interesting. Remember when $INJUSDT was trading above $50? Back in 2024, Injective was one of the strongest performers in the altcoin market. Then everything changed. Lower highs. Failed recoveries. Nearly three years of persistent selling pressure. But look at where price is sitting now. After a massive correction, $INJ has returned to a long-term accumulation zone near its historical lows. And something interesting is developing. Price has spent months consolidating inside this range, while the previous downtrend has started to lose momentum. Could this be the beginning of a new market cycle? Possibly. But the structure still needs confirmation. Here's my roadmap. $10 — First resistance to reclaim. $15–18 — Next important recovery zone. $30–35 — Major historical resistance. $45–50 — Previous cycle highs. $60 — Potential breakout continuation. And $80–85? That's my extreme bull scenario. The chart illustrates a potential 3,211% rally from its marked historical base. Sounds ambitious? Absolutely. But remember, $INJ has already demonstrated how aggressively it can move when market conditions turn favorable. Still, there's a massive difference between a potential accumulation zone and a confirmed bullish reversal. First, I want to see $INJ reclaim $10 and establish a clear sequence of higher highs and higher lows on the weekly timeframe. A sustained breakout above $15–18 would strengthen the case for a larger structural reversal. Without those confirmations, the broader downtrend remains a risk. But here's what makes this setup interesting. In 2024, traders were chasing $INJ above $40. Now it's trading below $8, and the excitement has almost completely disappeared. That doesn't automatically mean the bottom is in. But if buyers finally defend this long-term base and break the bearish structure, sentiment could change much faster than most expect. The $80 target is speculative. What matters first is whether $INJ can turn this consolidation into a genuine bullish trend. I'm watching the accumulation zone. The next major move could be worth paying attention to.
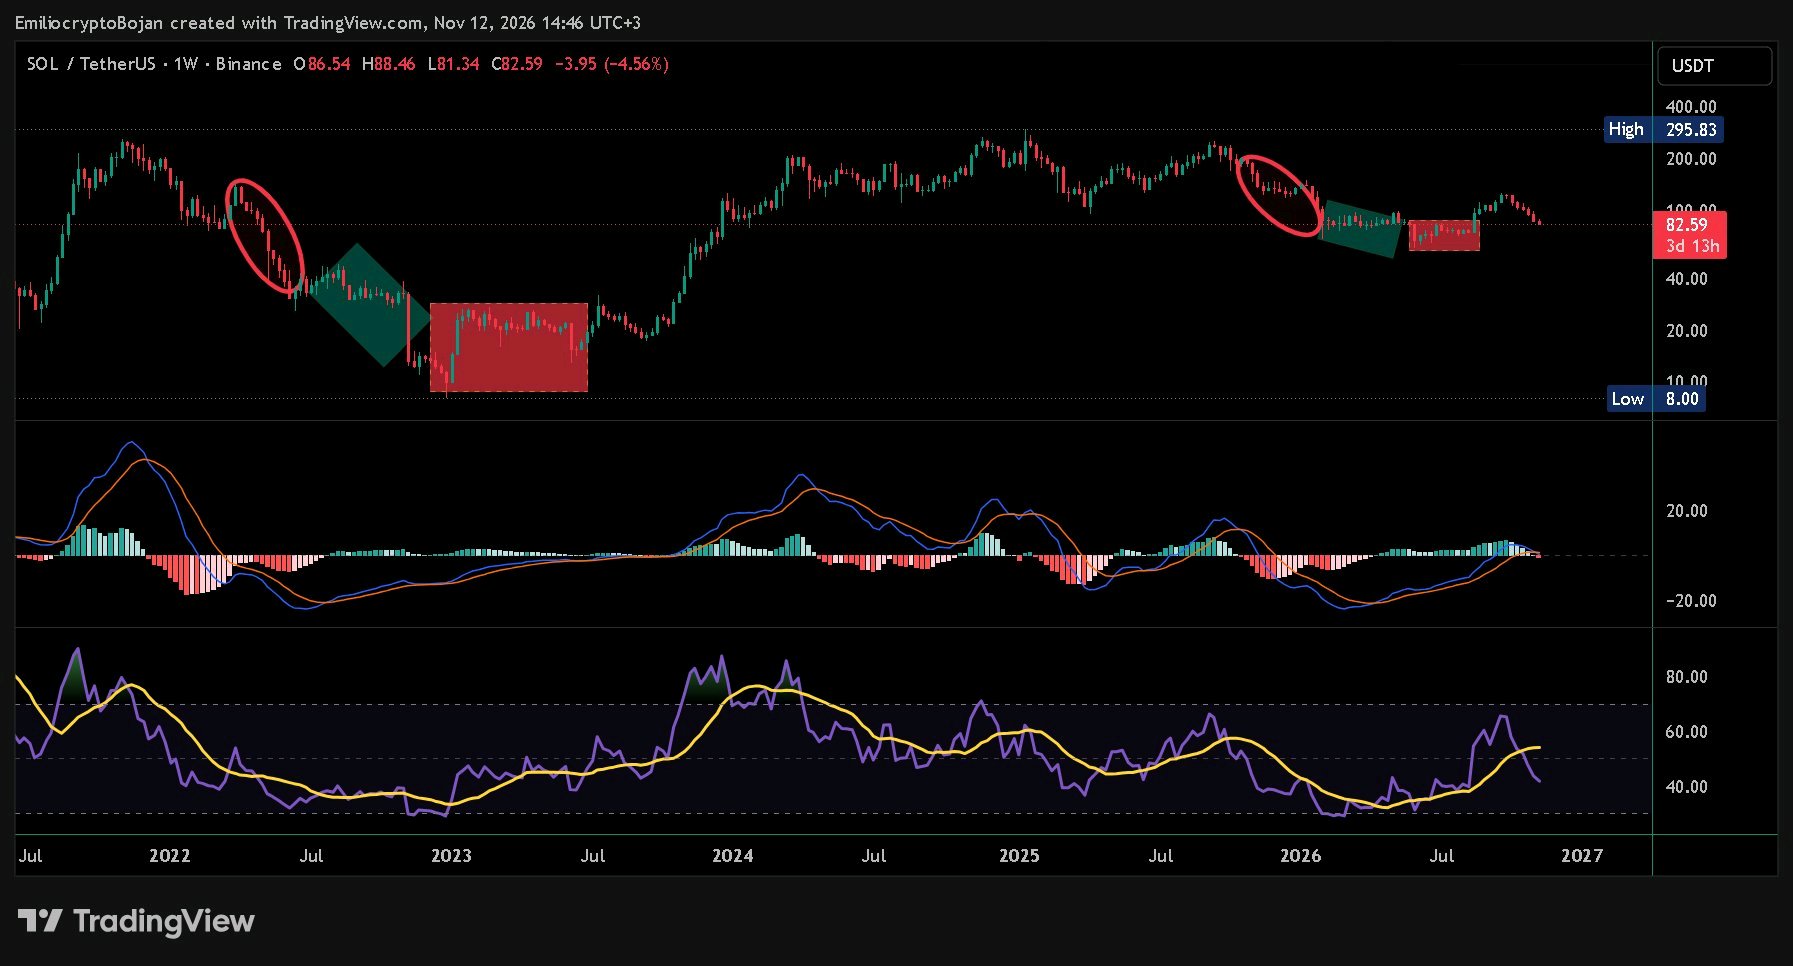
$SOLUSDT の強気派にとって、今日はMACD上で大きな打撃となっています。週足チャートで初めてヒストグラムがマイナス圏に転じました。これは売り圧力が強まり、弱気クロスオーバーに向かっていることを示唆しています。 弱気派のターンが来たなら、その勢いを見守るまでです。ただし、だからといって大局を見失ってはいけません。 今回のサイクルで私が確信しているのは、5月や6月に見られたような安値には、もう戻らない可能性があるということです。あの時期は、アルトコインにとってベア市場構造から強気フェーズへと向かう大きな転換点でした。 私のチャートをよく見てください。$SOLのこれまでの動きに見られる反復的なパターンをトレンドラインで描きました。以前、特に2023年に展開されたのと似たような構造が見て取れます。 歴史は完全に繰り返すとは限りませんが、こうした類似性には注目する価値があります。 今、市場は私たちの確信を試しています。多くの人がこの段階で諦めてしまうでしょうが、一方で大局に集中し続ける人もいるはずです。 この暴落を生き抜いた人こそ、1,000倍のパンプを享受する資格がある。🚀 #WSOT2026 #米国のインフレ率は高止まりし、利上げ観測が高まる #サンディスクが8対1の株式分割を発表 #AnthropicIPOValuationTest #米中間選挙後、ビットコインが2か月ぶりの安値を記録 $BTCUSDT
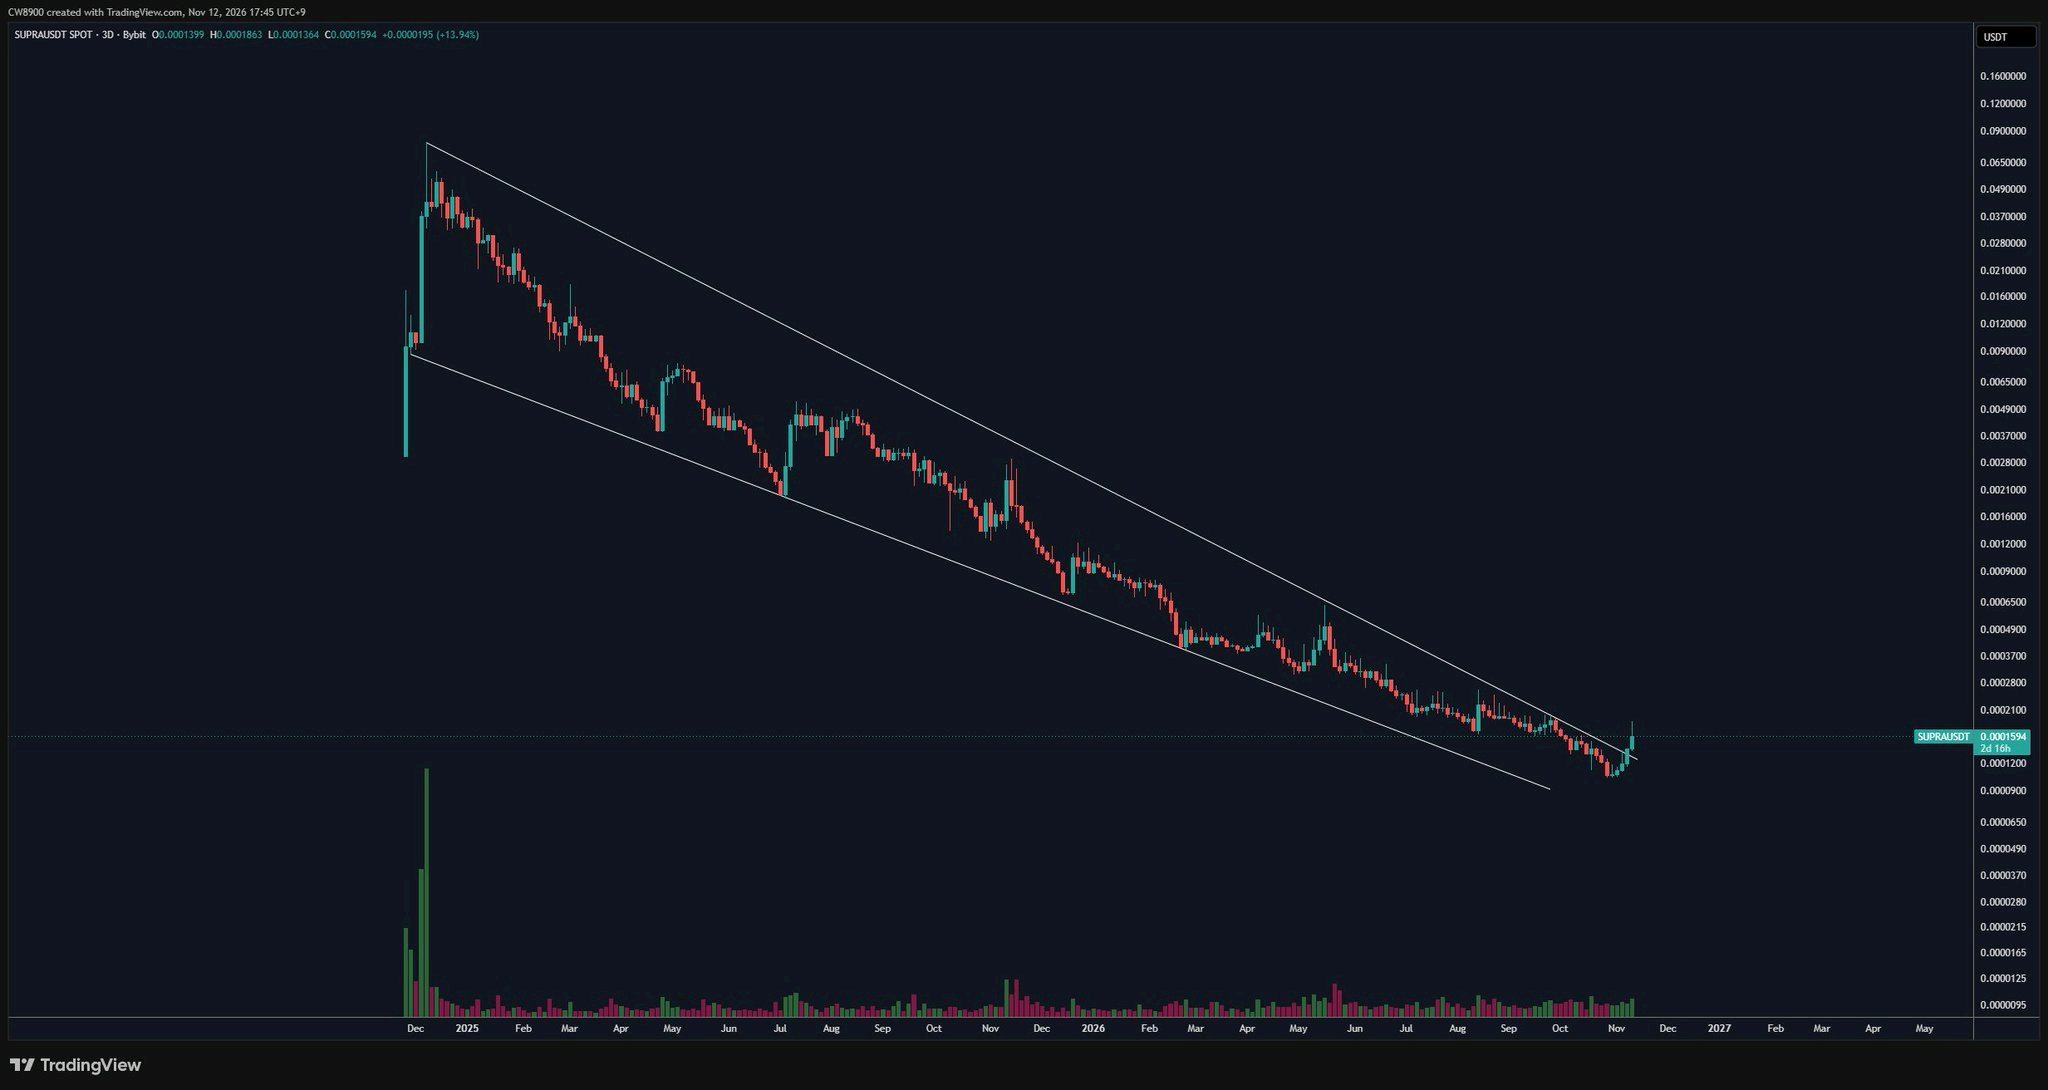
$SUPRAUSDT has broken out of a massive falling wedge pattern. The downtrend has ended, and an uptrend is beginning. #USPayrollsAndRateDecisionsDriveMacroWeek #NovUSCPIWatch #DeutscheBankLaunchesDigitalAssetCustody #AITechSelloffErases2Point5TrillionFromNasdaq100 #PiecesOf8
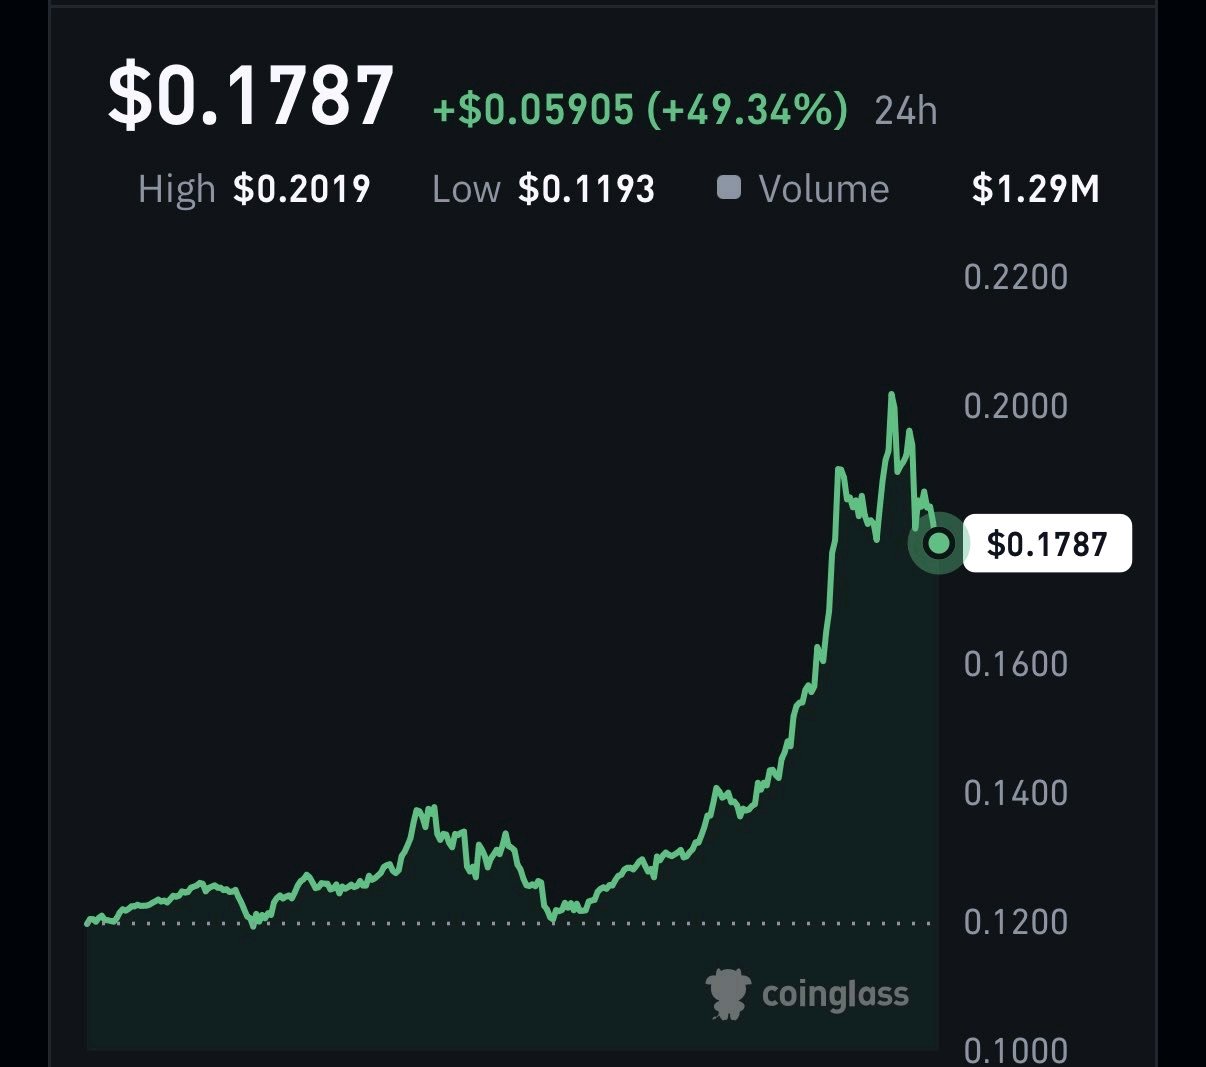
Let Me Tell You What I’m Watching on $INITUSDT First, look at the Open Interest.We can see that $INIT Open Interest is around $20.1M, up 130.65% in the last 24 hours. This is a significant increase in open positions. Trading activity and volume are also picking up, suggesting that market participation is increasing. But here’s what makes things interesting. The funding rates are extremely negative. Binance is showing around -1.3648%, Bybit around -2.0254%, and Hyperliquid around -2.6507%. This indicates that short positions are paying funding to long positions. At the same time, the short-term long/short ratio shows that around 58% of traders are short, while only 42% are long. So, we have sharply rising Open Interest, increasing volume, deeply negative funding rates, and more traders positioned short. In my view, if buying pressure continues, these heavily crowded short positions could create conditions for a short squeeze. However, with Open Interest rising so quickly, volatility and sudden price swings are also possible.Keep an eye on the next move. NFA. DYOR. #NovUSCPIWatch #WSOTPicktoEarn10U #WSOT2026 #USPayrollsAndRateDecisionsDriveMacroWeek #OilVolatilityTracksIranPeaceTalks
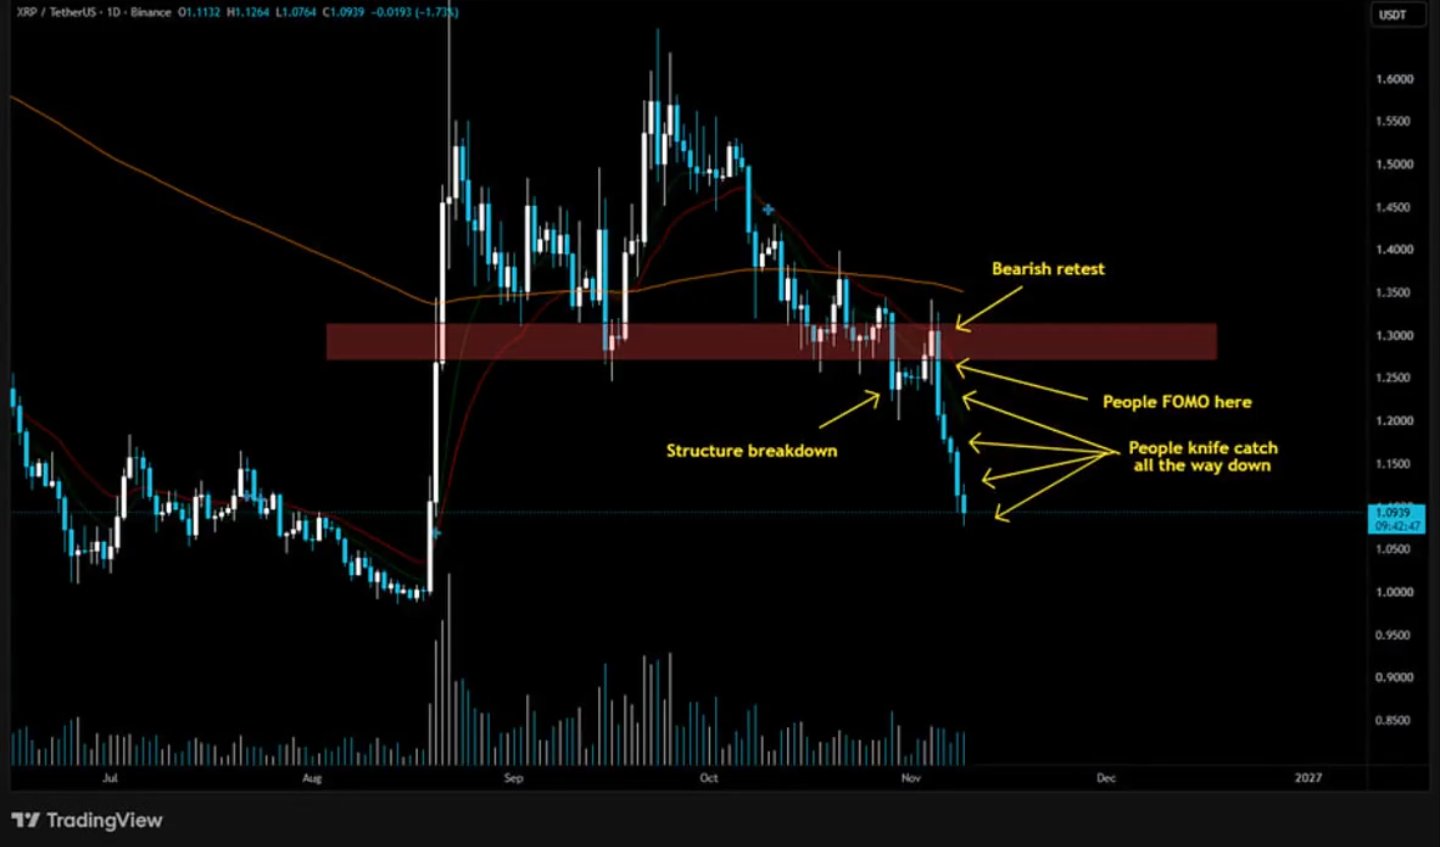
Just because $XRPUSDT is cheap doesn’t mean it’s a good buy. This recent downturn has taught the market an important lesson. When key support levels are decisively broken, a lower price does not necessarily represent a better buying opportunity. On the contrary, it often signals that sellers have taken control and that the market’s adjustment phase may not yet be over. Personally, I prefer to wait for the price to reclaim key levels and for buying interest to return before considering an entry. Levels to watch: $1.10 → $1.05 → $1.00 If support fails to hold, don’t rush to "buy the dip." Only look for potential rebound opportunities if the price manages to climb back above key resistance levels. Don’t try to catch a falling knife just to nail the absolute bottom. Protect your capital and wait for a genuine opportunity. #WSOT2026 #NovUSCPIWatch #WSOTPicktoEarn10U #USPayrollsAndRateDecisionsDriveMacroWeek #OilVolatilityTracksIranPeaceTalks $MNTUSDT
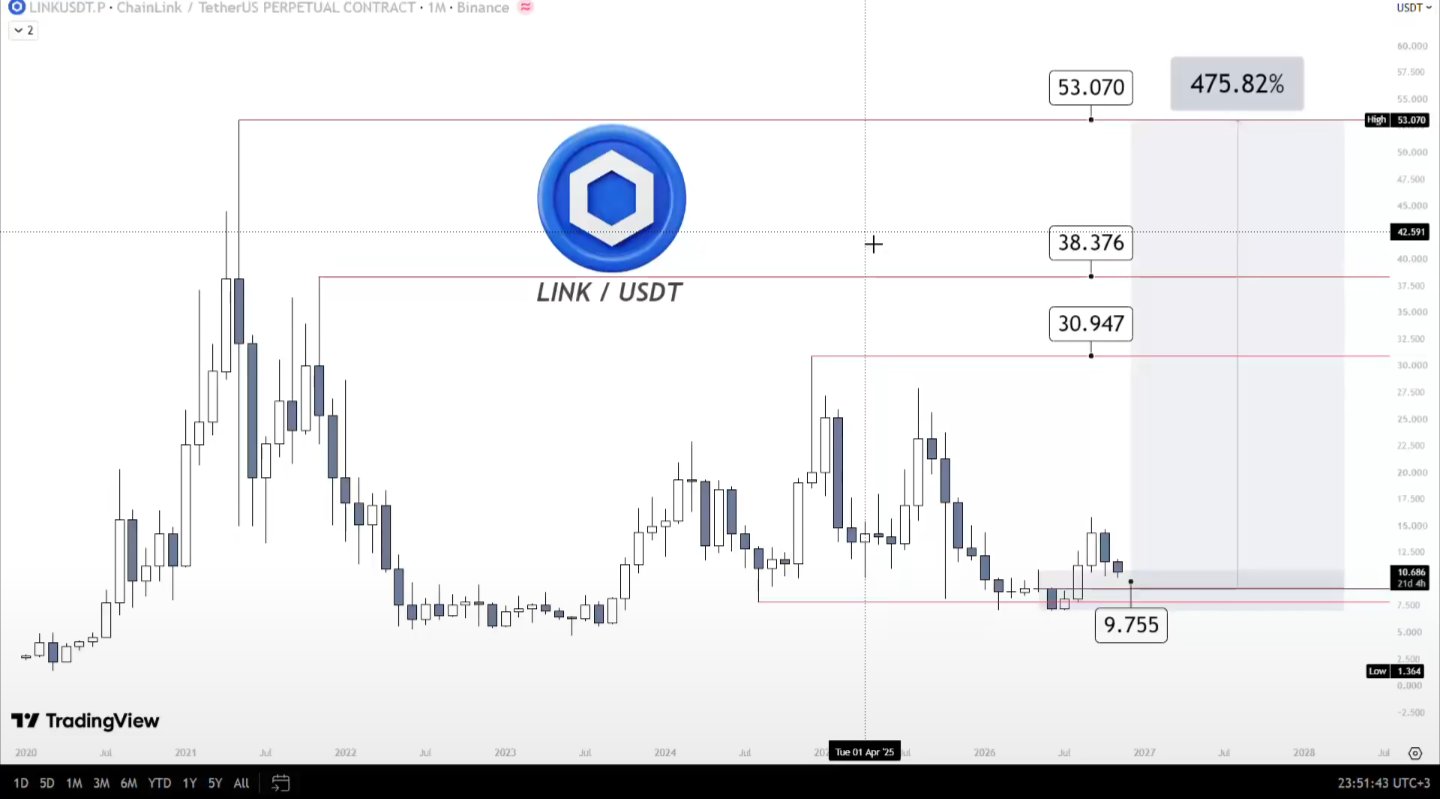
$LINKUSDT - 500%の可能性を秘めたチャンス🚀 私はChainlink(リンク)を、次の主要なアルトコイン相場の拡大に先駆けて仕込むべき、最も興味深いインフラプロジェクトの一つだと考えています。 Chainlinkとは何か? Chainlinkは、ブロックチェーンと現実世界のデータ、そして伝統的な金融インフラを接続する分散型オラクルネットワークです。 その技術は、スマートコントラクトが外部データにアクセスしたり、ブロックチェーン間での情報転送を行ったり、現実資産(RWA)のトークン化をサポートしたりすることを可能にします。 なぜLINKなのか?主な注目ポイント RWA(現実資産)の採用。株式、債券、その他の金融資産のトークン化により、信頼性の高いブロックチェーンインフラへの需要が生まれています。 機関投資家の採用。Chainlinkは、SWIFT、Mastercard、および主要な金融機関との統合やパートナーシップを確立しています。 CCIP(クロスチェーン相互運用プロトコル)。そのクロスチェーンインフラは、異なるブロックチェーンネットワーク間での安全な通信と送金を可能にします。 Chainlink Reserve(リザーブ)。ネットワークサービスからの収益はLINKに変換可能であり、トークンの需要をさらに押し上げる要因となります。 市場心理 多くの個人投資家は、資産がすでに大幅な上昇を見せた後に興味を持ち始めます。 私は、ファンダメンタルズは発展し続けているものの、価格変動がまだその進歩を反映していない、市場の関心が低い時期にプロジェクトを見極めることを好みます。 ここに、LINKにおける興味深いチャンスがあると考えています。 スマートマネー分析 私の主な買い増しポイントは9.755ドル付近です。 現在の価格より下にある流動性と、次の上昇局面の前にさらなる調整が入る可能性を注視しています。 ただし、必ずしも価格が9.755ドルに達する必要はありません。より早い段階で流動性が吸収され、強気な構造が形成されれば、この水準よりも上で反転する可能性があります。 私は相場を追いかけません。リスクとリターンのバランスが取れた場所で仕込みたいと考えています。 私の目標価格:53ドル 9.75ドルの蓄積エリアから見ると、約443%の上昇余地となります。 私の見解は以下の3つの要素に基づいています: 1. 機関投資家による採用の拡大。 2. RWAおよびクロスチェーンインフラの拡大。 3. ファンダメンタルズの強いアルトコインへの流動性の回帰の可能性。 目的はシンプルです。次の大きな拡大の「後」ではなく、「前」に仕込むことです。 #WSOT2026 #11月米国CPIウォッチ #WSOTPicktoEarn10U #米国雇用統計と金利決定が主導するマクロ週 #原油価格の変動がイランの和平交渉に連動 $ETHUSDT
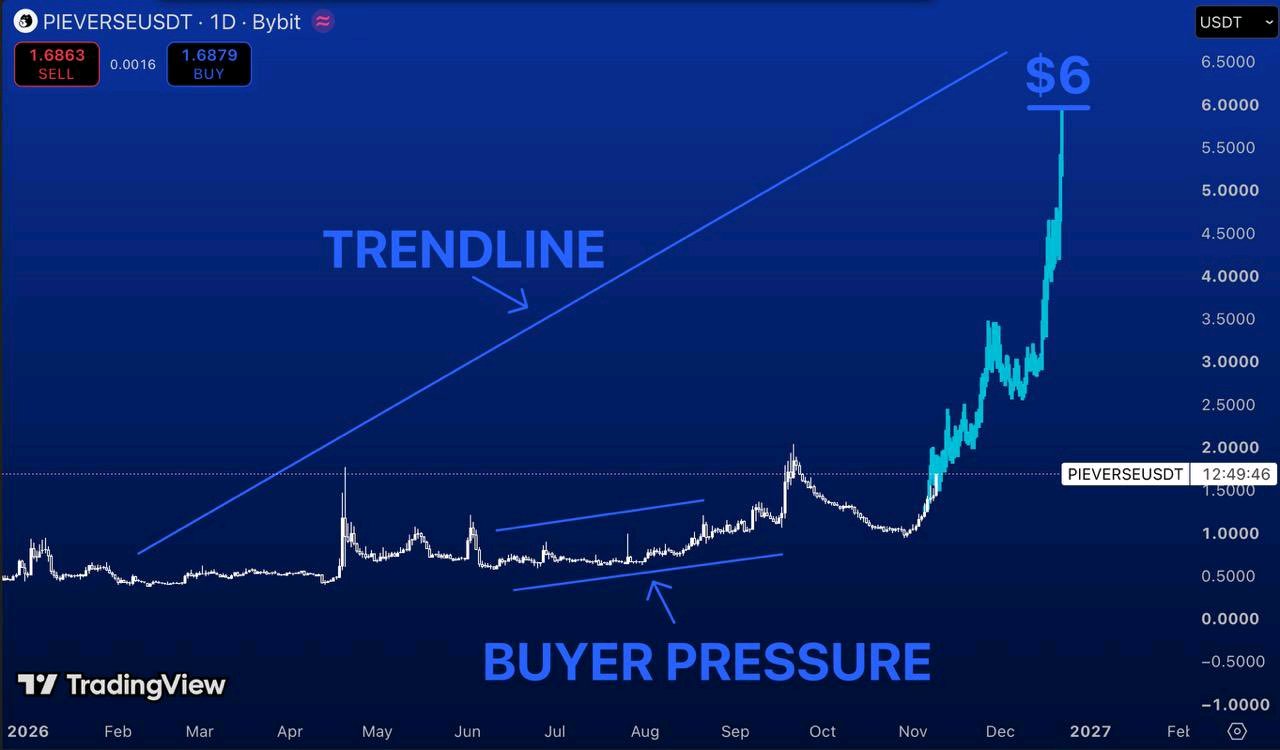
$PIEVERSEUSDT is trading around $1.69. And unlike most altcoins, this chart is actually showing signs of strength. Look at the daily timeframe. After months of consolidation, buyers started stepping in around $0.50–0.70. Higher lows began forming. Selling pressure weakened. Then price broke out and made a strong move toward $2. What's interesting is the structure behind that move. We're no longer looking at a coin stuck in a downtrend. We're looking at an asset attempting to establish a new bullish trend. Here's what I'm watching. $2 - The first major resistance to reclaim. $3–3.50 - The next area where sellers could step in. $4.50 - A potential continuation target. And $6? That's my aggressive bull scenario. The chart illustrates a possible move toward the upper trendline, but that doesn't make the target guaranteed. I want to see $PIEVERSE hold above $1.50 and continue building higher lows. Lose that structure, and the bullish thesis starts weakening. Because the most important part of this chart isn't the $6 target. It's whether buyers can keep control after the initial breakout. And right now, that's exactly what I'm watching. #WSOT2026 #NovUSCPIWatch #WSOTPicktoEarn10U #USPayrollsAndRateDecisionsDriveMacroWeek $MNTUSDT #OilVolatilityTracksIranPeaceTalks
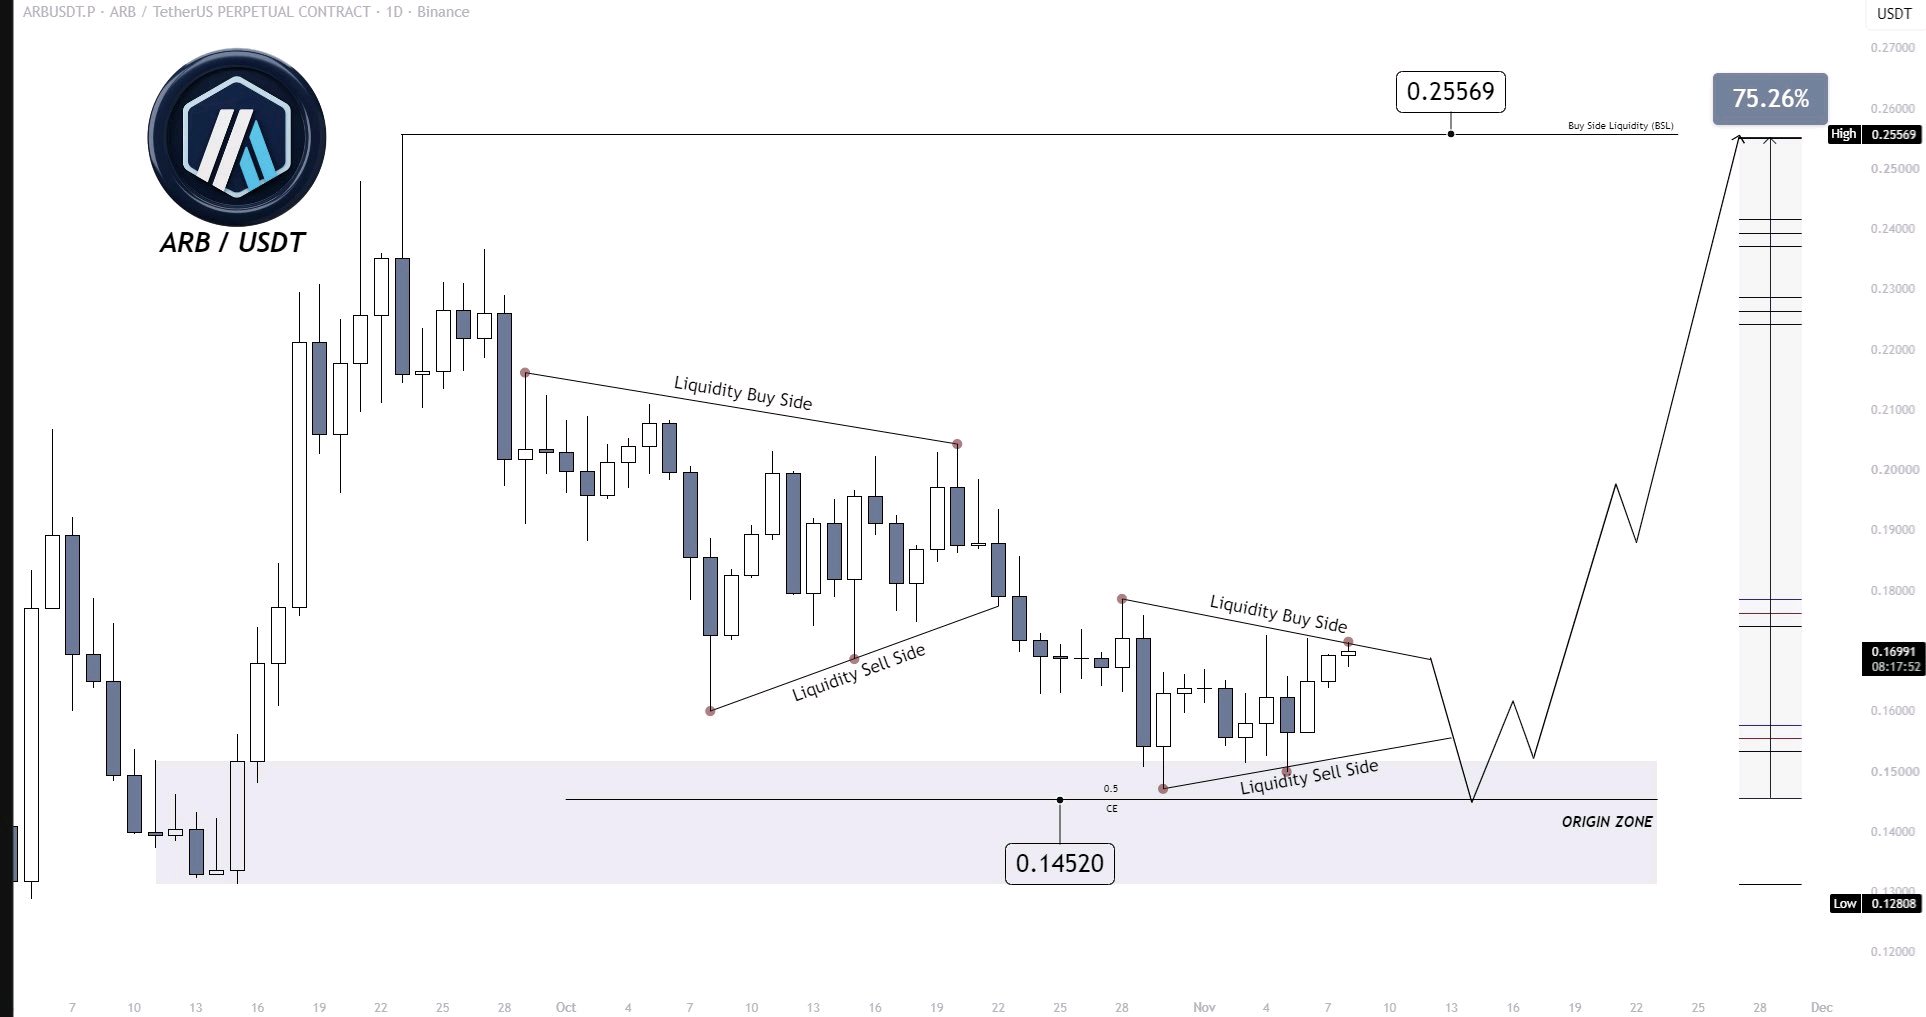
$ARBUSDT – Another liquidity manipulation before a potential reversal?👀 Previously, ARB formed a similar accumulation pattern, broke below the structure, but never retested our key 0.1452$ level Now, price appears to be forming almost the same setup again. The interesting part is what happens next. Will ARB break out and start moving higher, or are we about to see another liquidity sweep to the downside before a full reversal? My current expectation is a move lower, but I’m not rushing to open short positions. If price manages to reclaim the structure and establish itself above it, I’ll start looking for long opportunities instead. My targets: Short-term: 0.2557$ Long-term: 0.60$ #NovUSCPIWatch #WSOTPicktoEarn10U #USPayrollsAndRateDecisionsDriveMacroWeek #WSOT2026 #OilVolatilityTracksIranPeaceTalks $DOGEUSDT
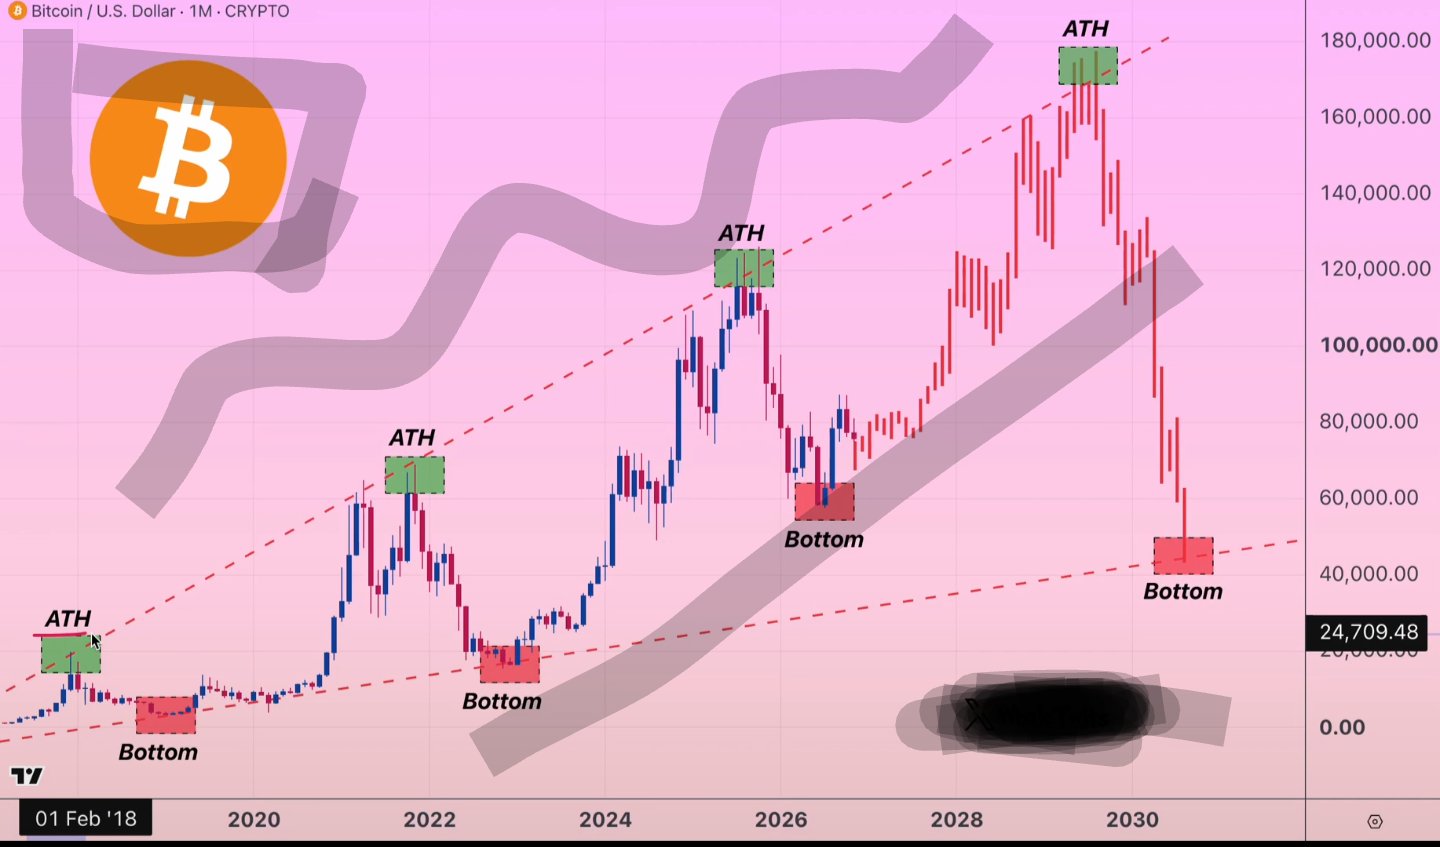
🚨 BITCOIN $BTCUSDT IS SETTING THE SAME TRAP THAT WIPED OUT RETAIL INVESTORS IN 2018 AND 2022. AND I BELIEVE THE NEXT MOVE COULD CREATE MILLIONAIRES. Look at this chart. 2018: CRASH → RECOVERY → NEW ALL-TIME HIGH. 2022: CRASH → RECOVERY → NEW ALL-TIME HIGH. 2026: CRASH → RECOVERY → NEW ALL-TIME HIGH? DIFFERENT YEARS. SAME MARKET PSYCHOLOGY. First, Bitcoin crashes. Retail investors panic. Everyone shouts that crypto is dead. Then selling pressure starts to fade. $BTC slowly recovers. But nobody believes it. “Just another dead cat bounce.” Then Bitcoin breaks through resistance. The rally accelerates. And suddenly, the same people who were afraid to buy start chasing the price higher. AT THE POINT WHEN THE BEST OPPORTUNITY MAY ALREADY HAVE PASSED THEM BY. Here’s what most investors don’t understand. The biggest opportunities usually don’t come when everyone is confident. They come when fear is everywhere. WHEN BUYING FEELS LIKE THE STUPIDEST POSSIBLE DECISION. I’ve seen this before. In November 2022, I told everyone that Bitcoin would bottom at $16,000. I also predicted the cycle top of $126,000 in October 2025. Now I’m preparing for the next big opportunity. BUT I’M NOT BUYING BLINDLY. I still believe there could be one final capitulation. And I want to see sellers exhausted, the key support level holding, and a confirmed reversal before I make my next move. Because if the historical cycle repeats, the prices everyone fears today could become the prices they desperately want to buy at. History is no guarantee. But ignoring the possibility of another major recovery could be a costly mistake. SAVE THIS CHART. Follow + turn on notifications. When I see my next big BUY signal, I’ll share it HERE FIRST. THE CROWD WON’T BE BULLISH UNTIL THEY SEE BITCOIN MAKING NEW HIGHS. I’M WAITING FOR THE OPPORTUNITY BEFORE THAT HAPPENS. DON’T LET FEAR MAKE YOUR DECISIONS FOR YOU. #WSOT2026 #NovUSCPIWatch #WSOTPicktoEarn10U #USPayrollsAndRateDecisionsDriveMacroWeek #BybitAIEvolving
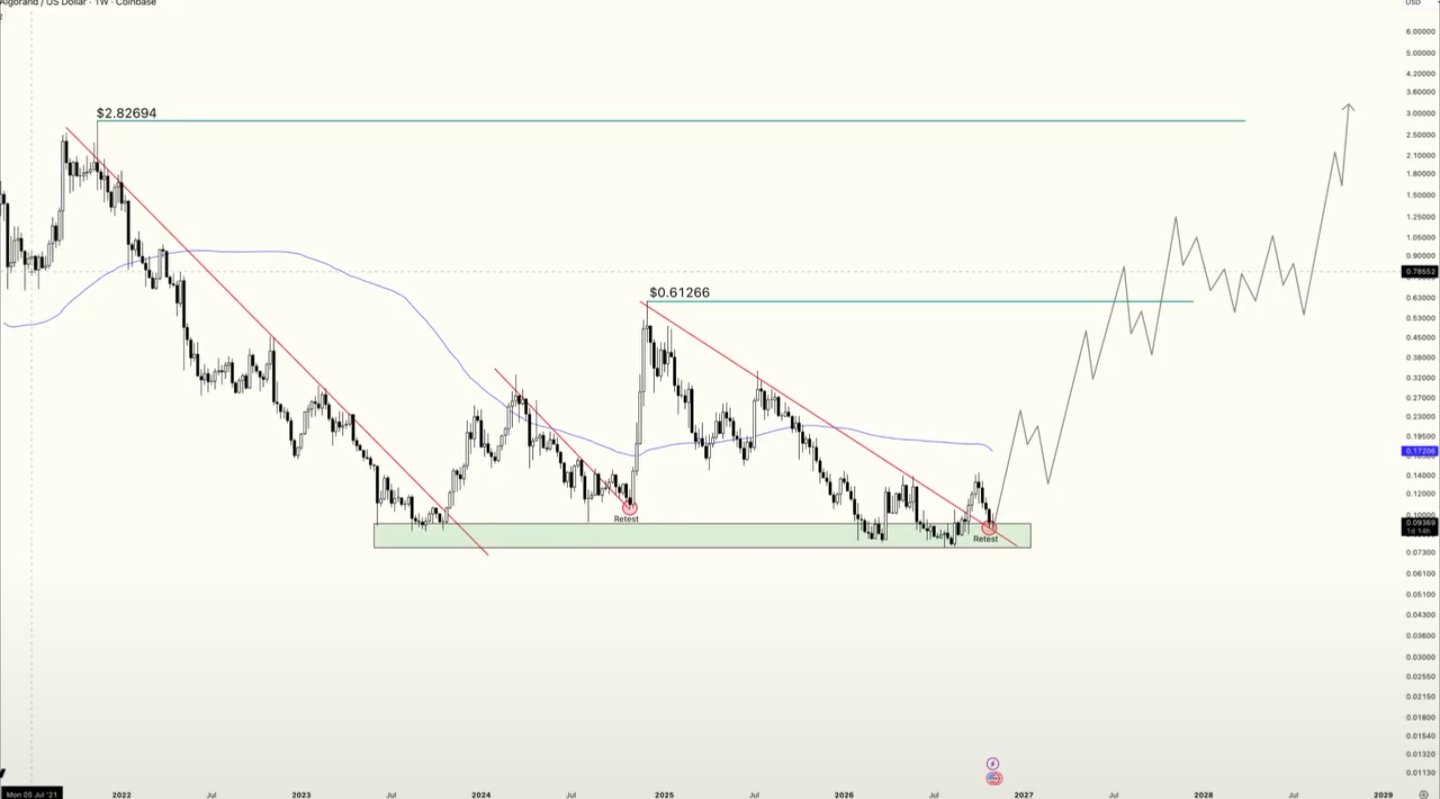
🚨 $ALGO IS TESTING ONE OF ITS MOST IMPORTANT LEVELS SINCE OCTOBER 2024. There's a historical pattern in Algorand that I'm watching closely: Break above a major bearish trendline. Retest that broken trendline. Strong rally follows. We've seen similar setups play out before. Right now, $ALGOUSDT has broken its long-term downtrend and is testing that trendline again. This is the level that matters. If support holds and buyers step in, the setup could become very interesting. I'm still confident in $ALGO's long-term potential, but I want to see confirmation before getting ahead of the market. $ALGO is one of the few altcoins I'm monitoring closely right now. Follow me and turn on notifications for more market updates. #ALGO #Algorand #Crypto #Altcoins #WSOTPicktoEarn10U #NovUSCPIWatch #USPayrollsAndRateDecisionsDriveMacroWeek #WSOT2026
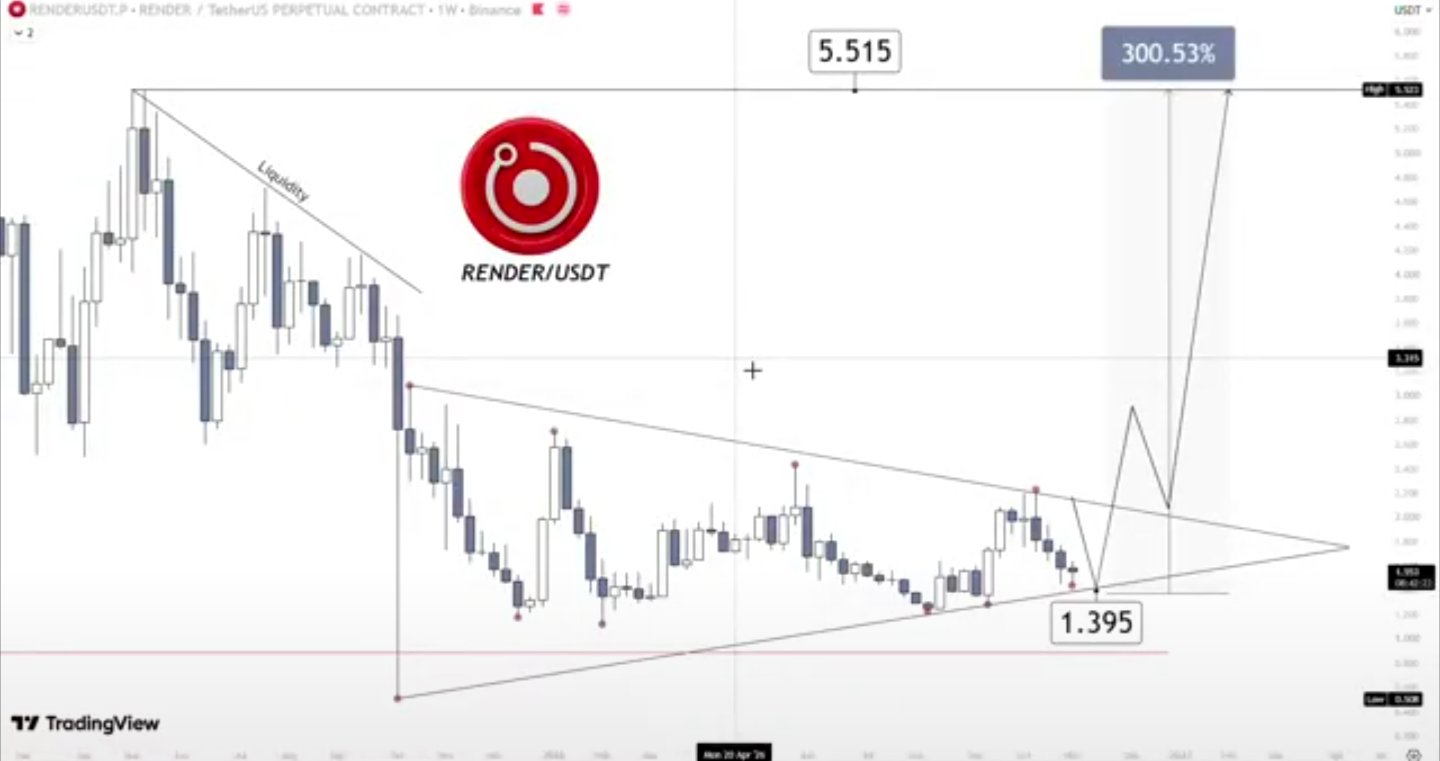
$RENDER – This structure deserves your attention🚨
One of the most interesting charts I’m watching right now. On the weekly timeframe, $RENDERUSDT is forming a large symmetrical triangle, with price approaching the apex of the structure. We’re also seeing massive liquidity sitting above the current price. Here’s why I’m paying attention: 1. Price is approaching a critical decision zone where a major breakout could develop. 2. A potential liquidity sweep towards 1.395$ could provide the final manipulation before a bullish reversal. 3. A confirmed breakout above the descending resistance could trigger a strong expansion towards the upper liquidity levels. But there’s another reason why I’m interested in $RENDER The fundamentals are developing: 1. The network has already processed more than 82.5 million rendered frames. 2. SaladCloud has introduced RENDER payments and rewards, expanding real-world demand within the ecosystem. 3. On November 16, Render will showcase Quantum Stargate, an immersive 8K artwork powered by its decentralized GPU network. This is exactly why I believe RENDER deserves a place on your watchlist. My chart shows a potential upside of approximately 300%, with 5.515$ as the major target. Of course, confirmation is everything. I want to see the structure break before considering the bullish scenario activated. Don’t ignore this chart. The next major move could be closer than many expect🚀 #MidtermsMarketWatch #AnthropicIPOTestsTheAIBoom #BOERateDecision #BybitAIEvolving #OilVolatilityTracksIranPeaceTalks
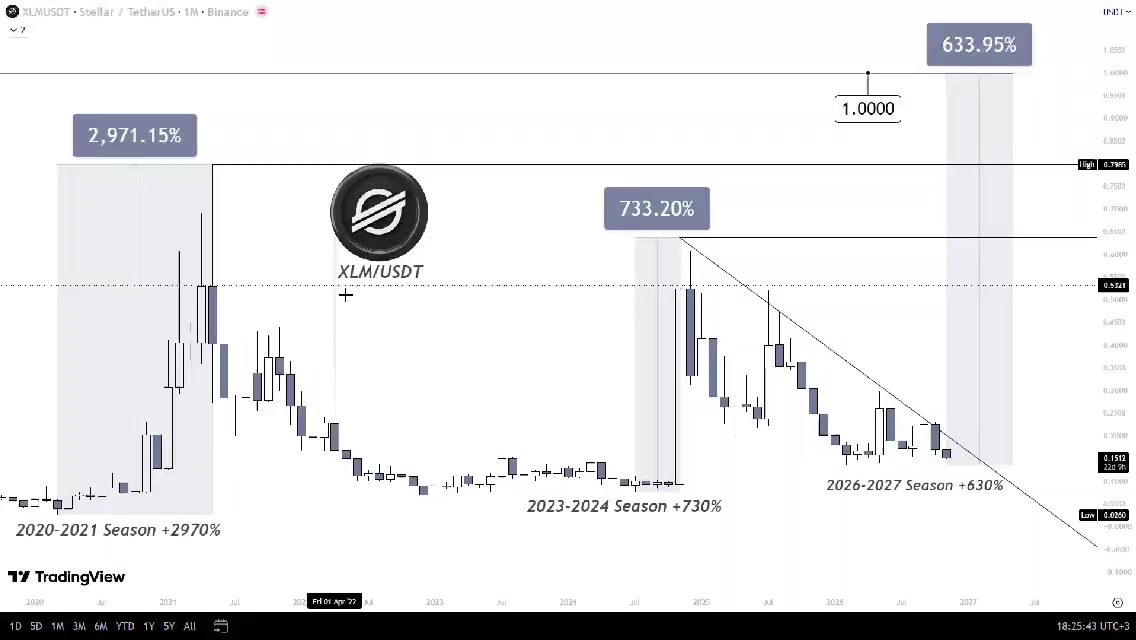
$XLMUSDT – Could Stellar be preparing for another 600%+ rally🚀 Let’s look at its historical performance. During the 2020–2021 bull market, XLM delivered an incredible +2970% rally. During the 2023–2024 season, it gained another +733% Now, heading into the 2026–2027 cycle, something interesting is developing. XLM is forming a large descending triangle on the monthly timeframe and is currently trading near its key historical lows. Here’s what I’m watching: 1. A breakout above the descending resistance. 2. A confirmed change in market structure. 3. Strong buying pressure and increasing volume. 4. A potential retest of the breakout zone before continuation. If this structure breaks to the upside, my chart maps a potential move of approximately +630% with 1$ as the target. But there’s one important factor I want everyone to pay attention to: Institutional adoption. Stellar is positioning itself as infrastructure for global payments and real-world asset tokenization. Its growing connections with major financial institutions could significantly strengthen the long-term ecosystem. If institutional adoption accelerates and capital flows back into the crypto market, XLM could become one of the interesting altcoin plays of the 2026–2027 cycle. History doesn’t guarantee a repeat, but this chart deserves attention. $XAUTUSDT
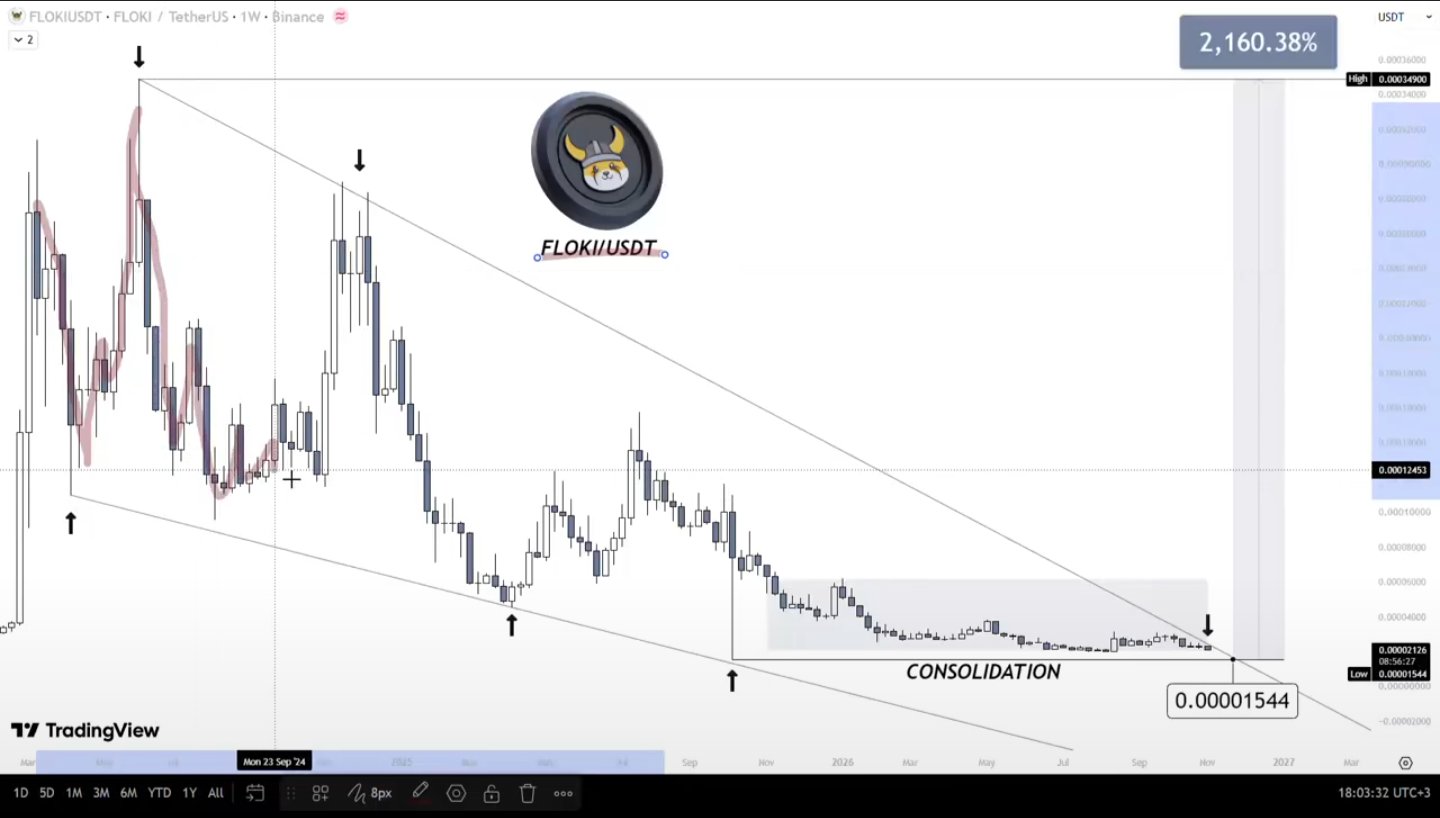
$FLOCKUSDT – Could this memecoin deliver a 2,000% rally during the 2026/27 bull run? 🚀 Here are 5 factors that could trigger a massive upside move: Massive meme coin season If capital starts flowing aggressively into the meme coin sector, FLOKI could become one of the major beneficiaries thanks to its established brand and large community. Valhalla ecosystem growth Valhalla is FLOKI flagship blockchain gaming project. If user adoption increases and the game attracts a larger audience, it could create additional demand for the ecosystem. Growing real utility FLOKI is building beyond the traditional memecoin narrative, with products such as FlokiFi, TokenFi, and its Trading Bot. Greater adoption could strengthen its long-term fundamentals. Exchange and institutional exposure Listings on major platforms, including Robinhood, alongside European ETP exposure, could help attract new investors and increase market accessibility. Token burns and growing demand Parts of the ecosystem’s revenue contribute to token burns. If product adoption grows while market demand increases, this could create a stronger supply-demand dynamic. My take: FLOKI already has something many new memecoins lack: brand recognition, an established community and a growing ecosystem. If the next bull run brings massive liquidity back into altcoins and meme coins, I believe FLOKI deserves a place on the watchlist. A 2000% move is an aggressive speculative scenario, not a guaranteed target. But this is exactly the kind of potential I will be watching during the next cycle. What do you think? Can $FLOKI deliver 20x+ in the next bull run?👀 #MidtermsMarketWatch #AnthropicIPOTestsTheAIBoom #BOERateDecision #BybitAIEvolving #OilVolatilityTracksIranPeaceTalks
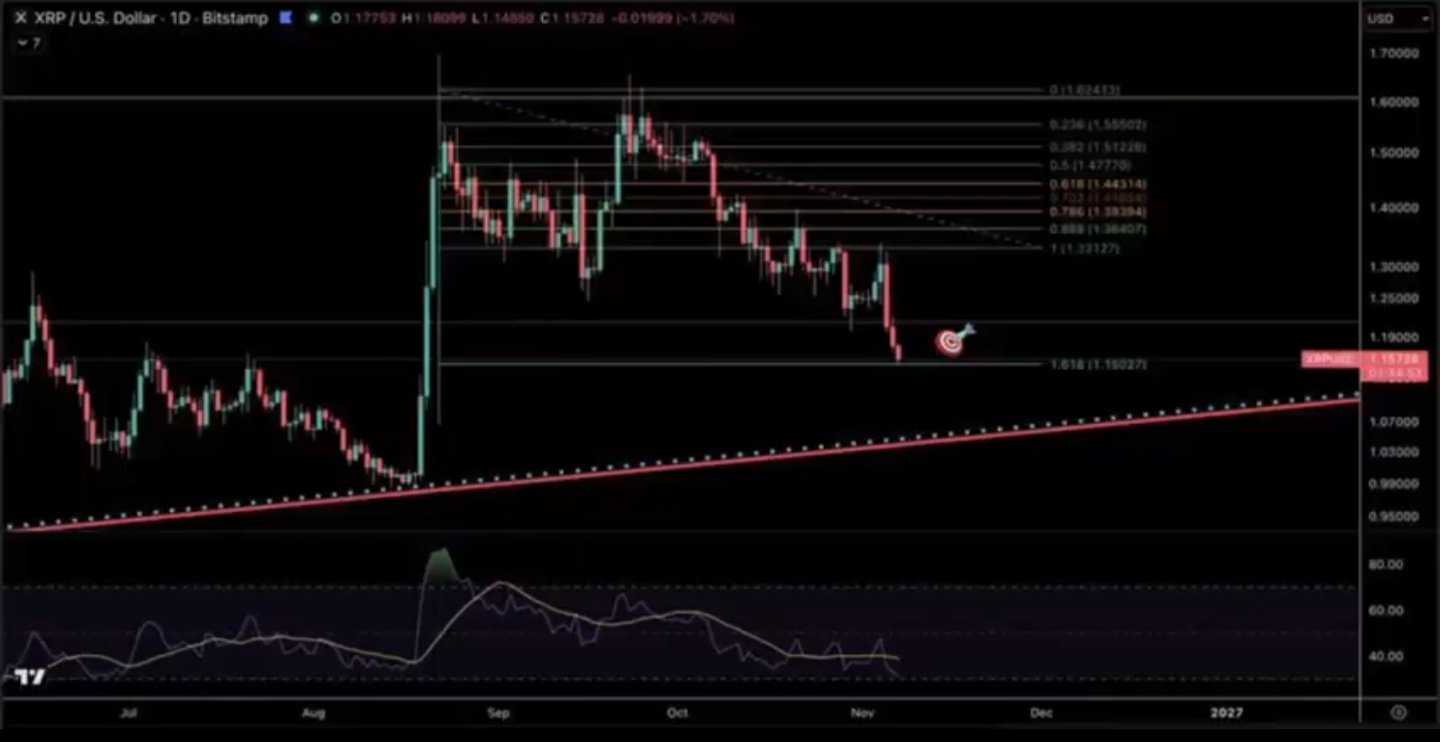
XRPUSDT : 1.15ドルは今、注目すべき重要なサポートラインです! 日足チャートを見ると、XRPは大幅な調整局面を経て、現在1.15ドル付近のフィボナッチ・エクステンション1.618のレベルを試しています。 ここは強気派が是が非でも守らなければならない重要なゾーンです。 もし1.15ドルで踏みとどまり、明確な買い反応が見られれば、価格は徐々にリバウンドしていくと予想します: 1.15ドル → 1.20ドル → 1.33ドル → 1.44ドル 特に、1.20ドルを回復できれば、短期的なトレンド改善の最初の兆候となるでしょう。 もし1.15ドルを割り込んでしまった場合は、下方にある長期上昇トレンドラインを注視する必要があります。早まった底打ち判断には注意してください。 個人的には、1.15ドルは細心の注意を払うべきレベルですが、本格的な反転にはプライスアクションによる確認が必要だと考えています。 #XRP #Ripple #暗号資産 #Byximpact
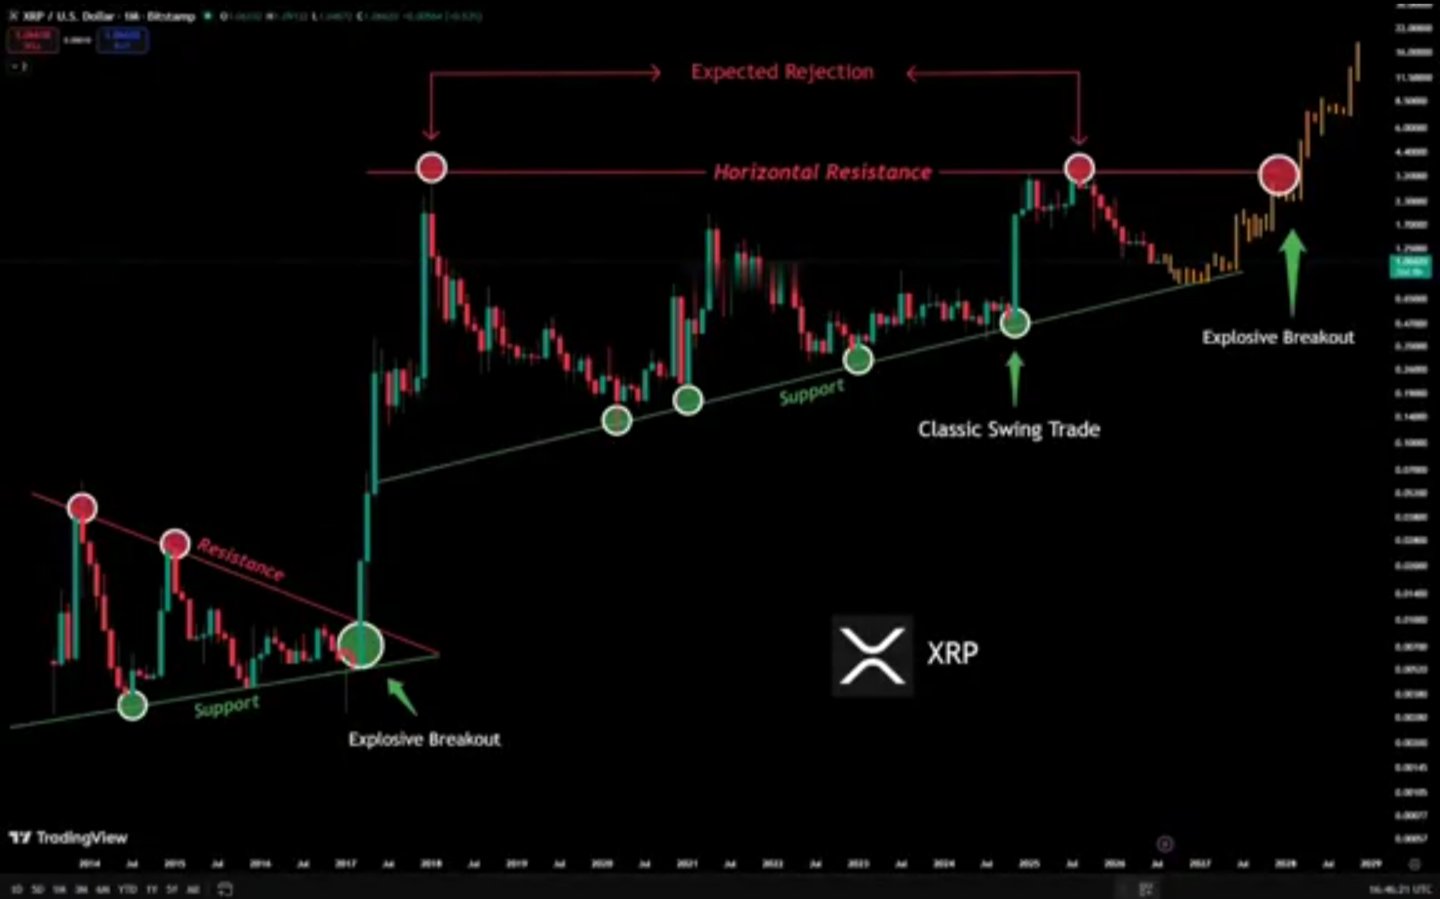
短期的な値動きに動揺して、$XRPUSDTのポジションに対する自信を失わないでください。 チャート構造を見ると、$XRPは安値を切り上げており、上方の水平レジスタンスラインを繰り返し試しています。サポートラインが徐々に切り上がっており、価格は大きな方向性を持ったブレイクアウトに向けて準備している可能性があります。 私の予想価格パス: $1.40 → $1.55 → $1.85 → $2.20+ 価格が高出来高を伴って水平レジスタンスを突破し、それがサポートへと転換すれば、さらなる上昇の扉が開かれる可能性があります。 ただし、ブレイクアウトが確定するまでは、「ダマシ(フェイクアウト)」や調整(プルバック)には十分注意してください。 短期的なパニックに駆られて衝動的な判断をすることは避け、常にリスク管理を怠らないようにしましょう。 焦らずにトレンドが確定するのを待ち、市場が強気の勢いを見せるのを見極めましょう。 #IMPACTbyTrade
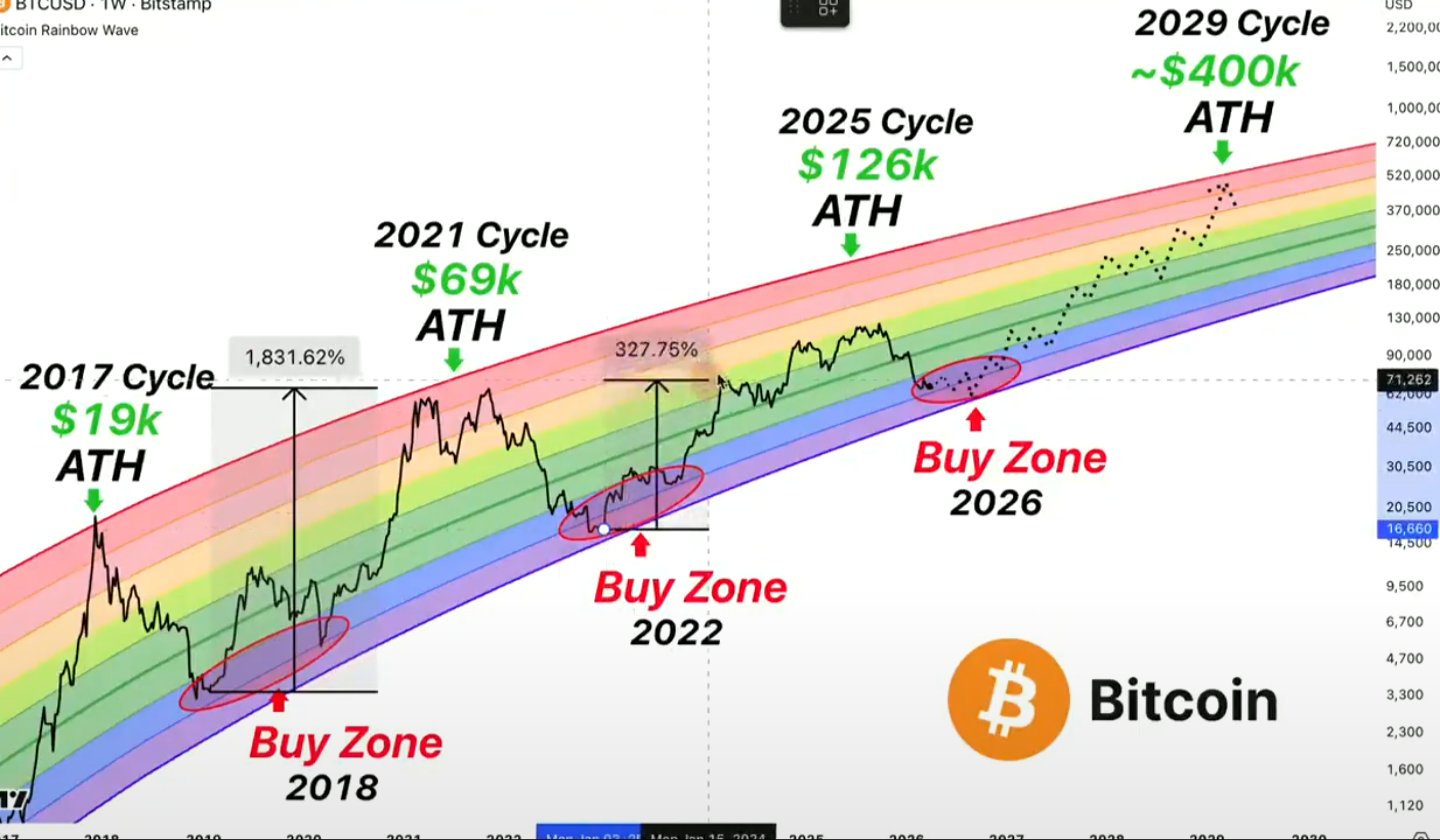
🚨 18歳以上の方は、以下を注意深くお読みください。 今後12ヶ月は、あなたの経済人生において最も重要な期間になるかもしれません。 なぜなら、市場は歴史上最大級の富の移転に向けた準備を整えているからです。 まず、株式市場が最後の吹き上げ局面に入ります。 そして仮想通貨市場が、人々がこのサイクルは「永遠に終わらない」と信じ込むような急騰を見せます。 そして、誰もが自分は金持ちになったと確信したその瞬間に… リセッション(景気後退)が襲いかかります。 ここが、財産が築かれ、そして破壊される場所です。 この12ヶ月で、記録的な数の新しい億万長者が生まれる可能性があります。 このチャンスを無駄にしないでください。 多くの人は、それでも無駄にしてしまうでしょう。 買うべき時に躊躇し、売るべき時にFOMO(取り残される恐怖)に駆られるのです。 そして、この局面が終わってからようやく何が起きたのかを理解するのです。 このような機会は極めて稀です。 今これを読んでいるなら、まだ間に合います。 私は単に価格を追っているわけではありません。 センチメント、流動性、そして次に資金がどこへ動くのかを追跡しています。 そして今、あなたに伝えます。 あなたはまだ早い段階にいます。 しかし、それも長くは続きません。 念のため:私はビットコインの前回のサイクル天井を12万6000ドルで予測し、6月にビットコインが6万ドルの時に買うよう伝えました。 次の予測は、それ以上に重要になるかもしれません。 いつものように、ここで公に投稿します。 通知をオンにしておいてください。 まだフォローしていないなら、なぜそれが間違いだったのか、後でわかることになるでしょう。 $BTCUSDT #IMPACTbyTrade
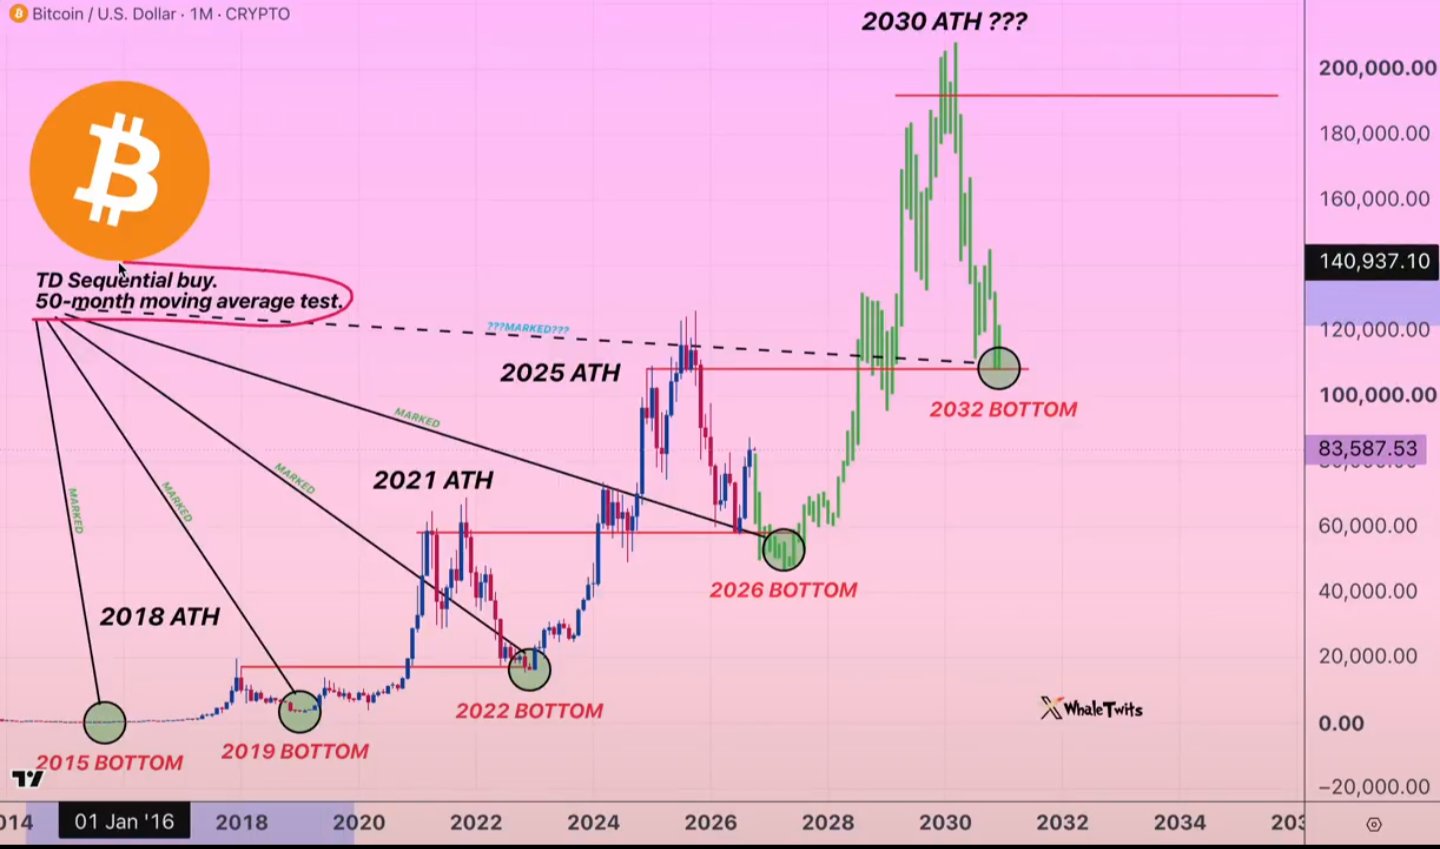
🚨 ビットコインの4年サイクルは、数百万人の投資家に後悔をもたらそうとしている。 そして私は、2026年がこの10年で最大の買い場の一つになる可能性があると確信している。 このパターンを見てほしい。 2013年:売り 2017年:売り 2021年:売り 2025年:売り 歴史的に見て、ビットコインは4年ごとにサイクルの大天井を迎えてきた。 そしてそのたびに、その後のベアマーケット(弱気相場)が、多くの投資家が恐怖で手を出せなかった絶好のチャンスを生み出してきたのだ。 では、フルサイクルを見てみよう。 2011年:買い 2012年:ホールド 2013年:売り 2014年:ベア 2015年:買い 2016年:ホールド 2017年:売り 2018年:ベア 2019年:買い 2020年:ホールド 2021年:売り 2022年:ベア 2023年:買い 2024年:ホールド 2025年:売り 2026年:ベア 何が起きているか分かるだろうか? もしこの歴史的パターンが続くなら、次に起こり得るのはこれだ。 2027年:買い 2028年:ホールド 2029年:売り 2030年:ベア そして、ここからが面白いところだ。 多くの投資家は、ビットコインがこれ以上暴落しないことを必死に祈っている。 私は逆だ。 なぜなら、最大の富はみんなが最高値更新を祝っている時に作られるのではないからだ。 市場が完全に絶望的に見える時に積み上げることで作られるのだ。 私の過去の予想を思い出してほしい。 私は2022年にビットコインの1万6000ドルという底値を公言した。 2025年10月には12万6000ドルというサイクル天井を警告した。 そして2026年6月、私は6万ドル付近を買い場として特定した。 今、私は次の大きなエントリーに備えている。 だが、ほとんどの人が理解していないことがある。 4年サイクルは歴史的なパターンであり、保証ではないということだ。 カレンダーが2027年になったからといって、盲目的に買うつもりはない。 私は真の降伏(キャピチュレーション)が見たい。 売り手が疲弊しきった姿を。 重要なサポートゾーンを。 そして、売り圧力がついに消滅したという確証を。 その時こそ、私は準備を整える。 今、ベアマーケットでビットコインを買うことを恐れている同じ人々が、次のブルラン(強気相場)が始まったら、10万ドルを超えて追随することになるかもしれない。 その時には、最大のチャンスはすでに過ぎ去っているだろう。 このチャートを保存してほしい。 2027年にまた見に来てくれ。 フォローして通知をオンにすることをお忘れなく。 次の大きな底値の形成が見えたら、ここで公開する。 今日みんなが恐れているビットコインの価格こそ、明日になって「あの時買っておけばよかった」と後悔する価格になるかもしれない。 $BTCUSDT #IMPACTbyTrade
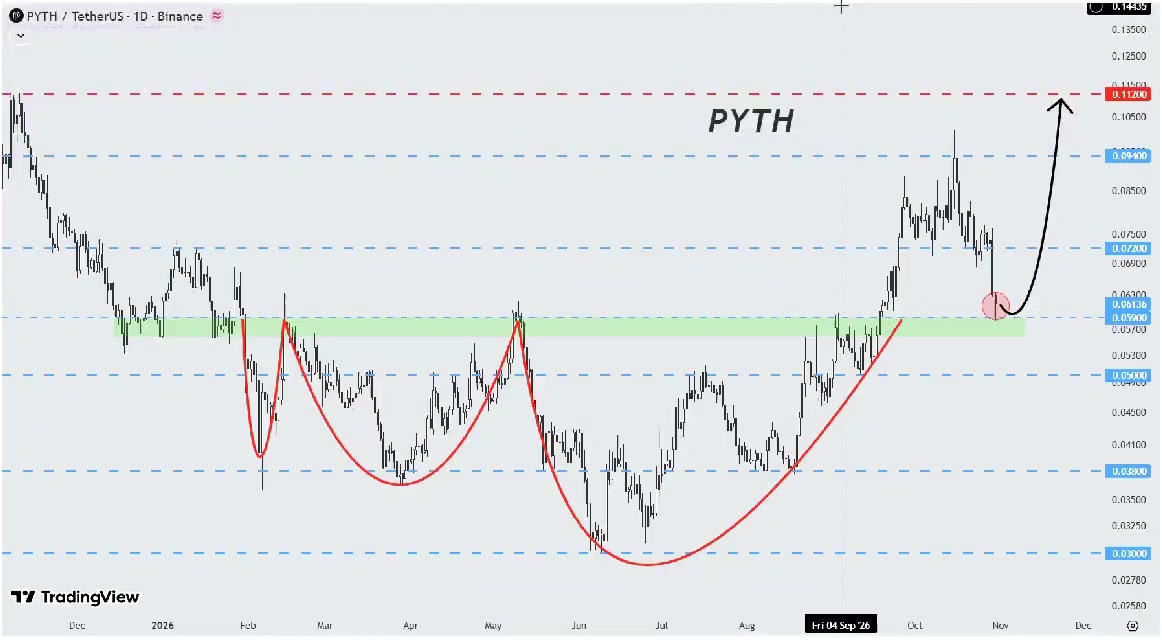
$PYTHUSDT 取引高2兆ドル。リテスト進行中 👀 Pyth Networkは、日足チャートにおいて完成したラウンドボトムのネックラインをリテストしています。 - Pythオラクルによって31億ドル以上が確保されています。 - 第3四半期の取引高2兆ドルをサポート。 - 機関投資家向けに米国財務省のフィードが新たに追加されました。 インフラは構築されました。あとは価格が反発するのを待つのみです。 ターゲットレベル: 🎯 $0.072 🎯 $0.094 🎯 $0.112
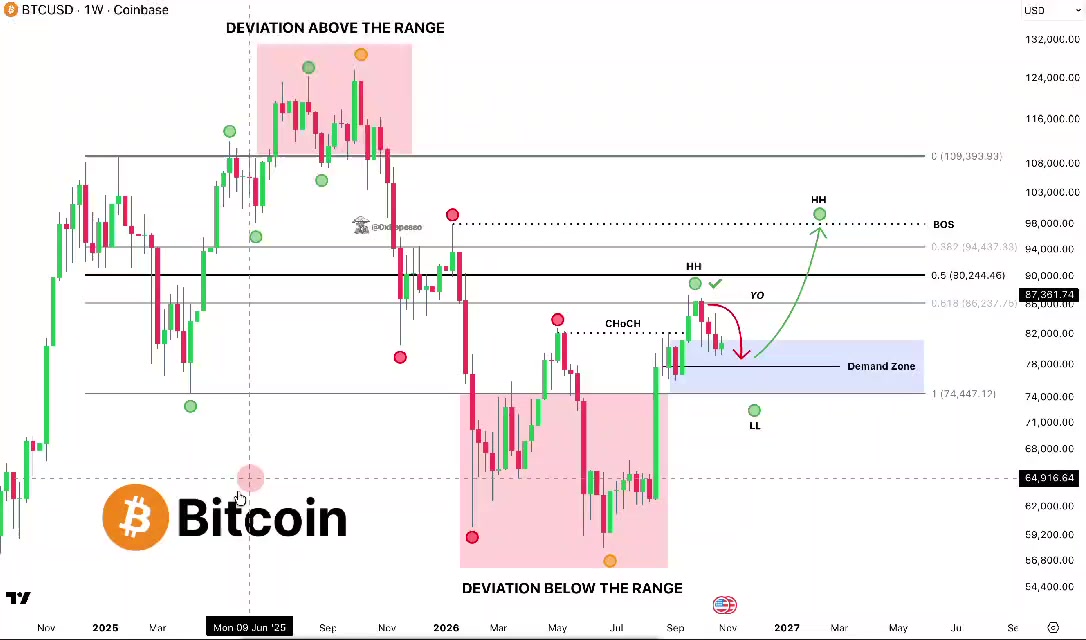
🚨 ビットコイン($BTCUSDT)が、数ヶ月前にチャートに描いていた「買いゾーン」に完全に入ってきました。 6万ドルの底打ち、CHoCH(トレンド転換の兆候)ラリー、そして年初来オープン価格(Yearly Open)での高値更新拒否。 すべての段階が計画通りに進んでいます。 現在、価格は7万8000ドル~8万2000ドルの需要ゾーンへ調整中。 ここで現物をガッツリ仕込む予定です。 これまでのサイクルと似た構造をたどっています: 6万ドルの底打ち -> CHoCH -> YO(年初来オープン)でのHH(高値更新) -> 需要ゾーンへの調整 -> HL(切り上げ) -> 新たなATH(史上最高値)へのラリー ここでしっかりとしたHL(安値切り上げ)が形成され、9万4000ドルを上抜ければ、上昇トレンドへの回帰が確定します。 勘でトレードしているわけでも、追っかけ買いをしているわけでもありません。 ゾーンが近づいてきているので、エントリーについてはまた報告します。 #ByXIMPACT