ALCHEMIST
5194いいね0シェア272ファン704フォロー
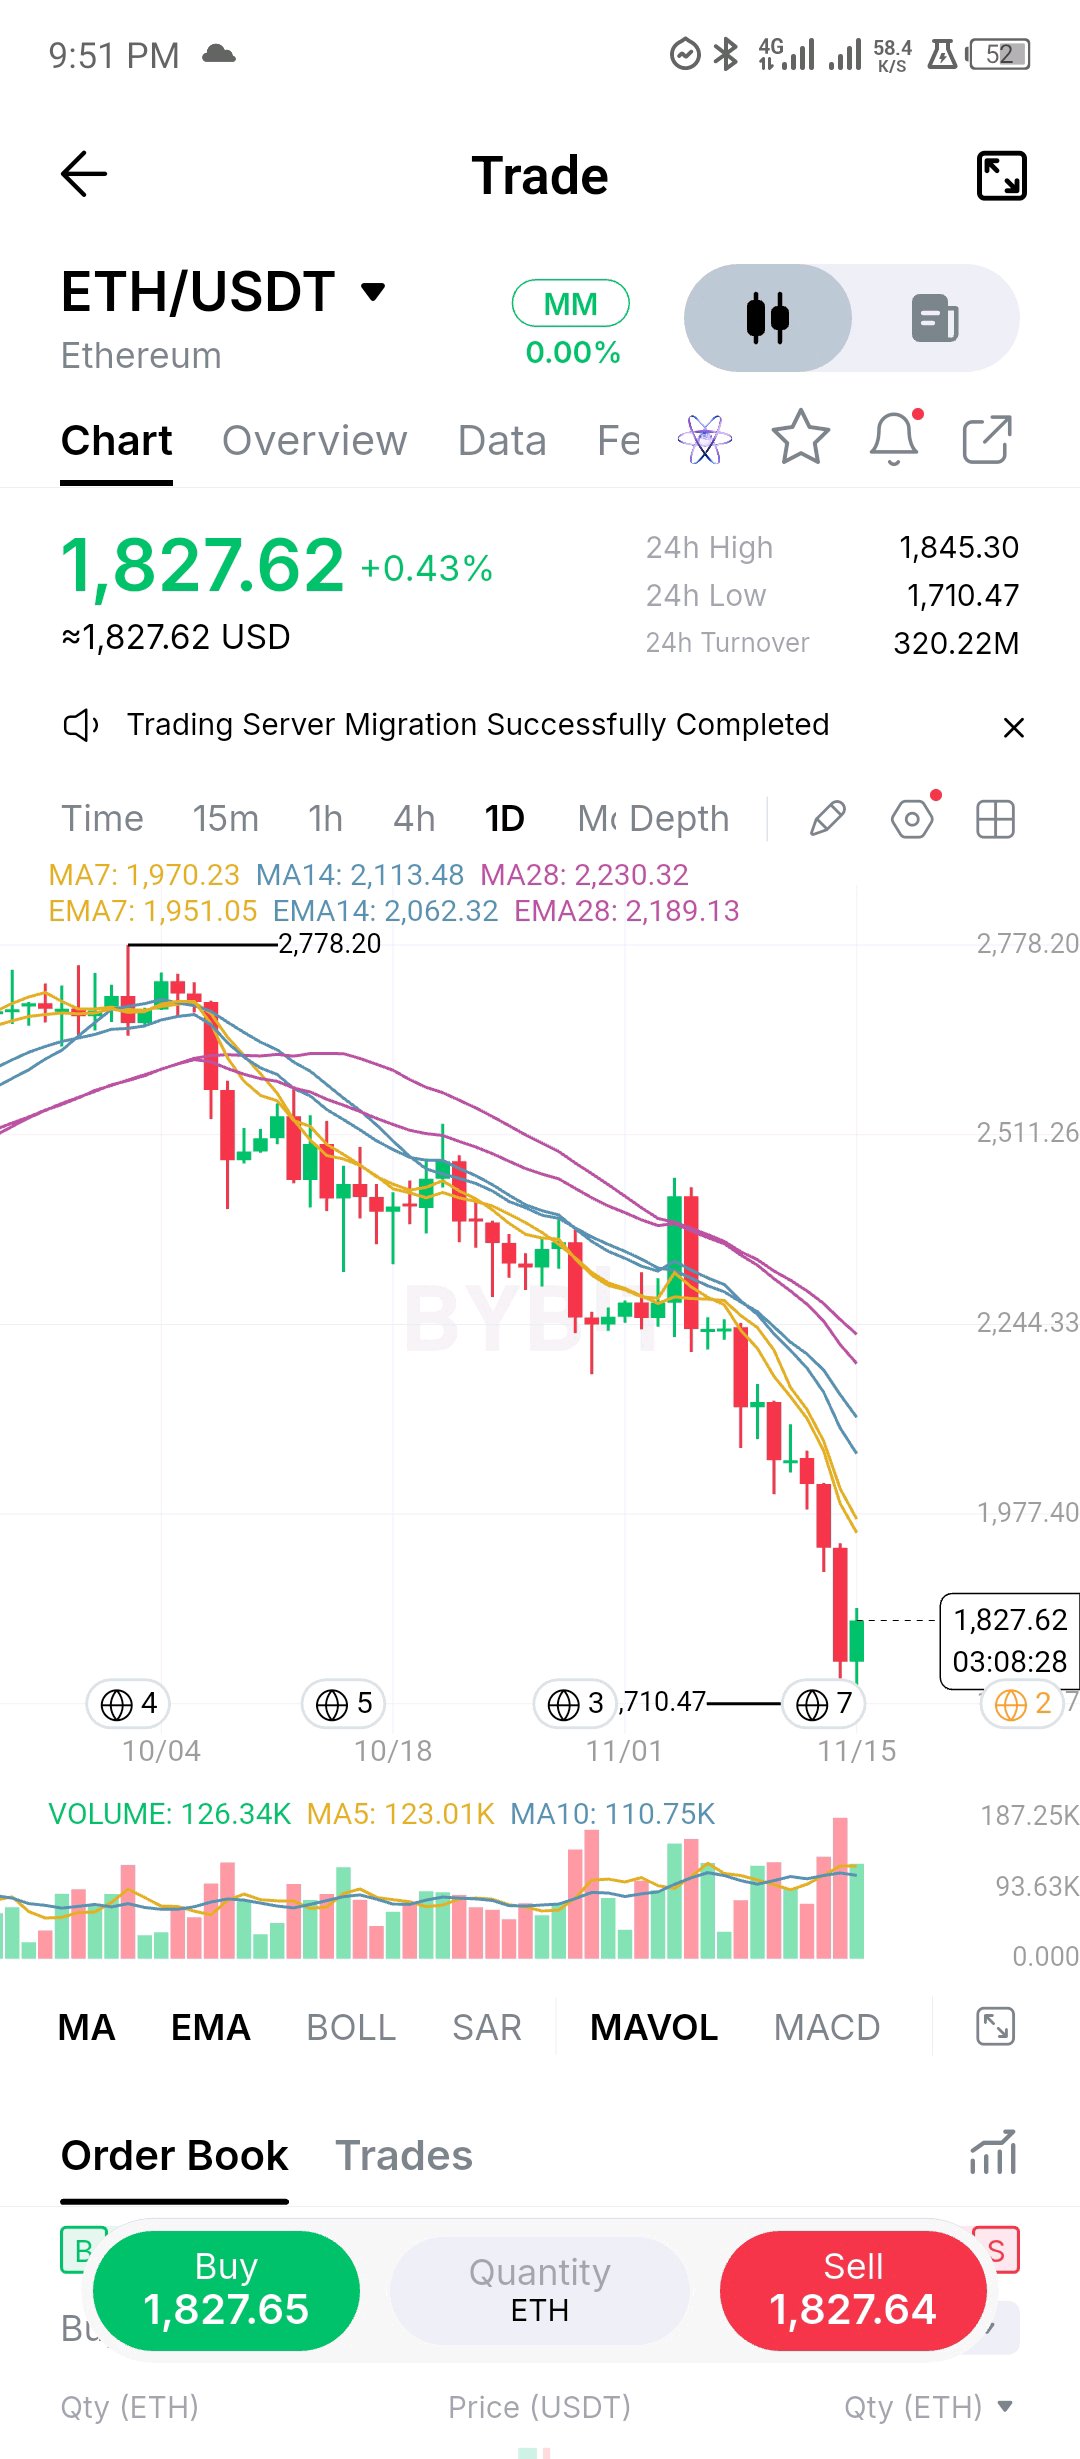
ETH/USDT 日次テクニカル分析: ローカルサポートの防衛とボリューム急増によるMA7奪還への探り Ethereum ($ETH$) は、1,710.47という鋭い日中安値を守り抜いた後、小幅ながら+0.43%上昇し、1,827.62付近まで日次回復を見せています[span_0](start_span)[span_0](end_span)。価格は、2,778.20の主要なピークからの急激な調整局面を経て、安定化を試みている状況です[span_1](start_span)[span_1](end_span)。 • 考察: 1,710.47までの直近の急落は、活発な出来高の拡大(126.34Kの当日出来高 vs 123.01KのMA5ベースライン)を誘発しました[span_2](start_span)[span_2](end_span)。これは、数ヶ月ぶりの構造的な安値圏において、短期的な買い圧力が強力に吸収されたことを示唆しています。 • 出来高と売買代金: 当日出来高は126.34Kで[span_3](start_span)[span_3](end_span)、5日移動平均(123.01K)および10日移動平均(110.75K)を上回っています[span_4](start_span)[span_4](end_span)。また、24時間の売買代金は320.22M USDTという堅調な水準です[span_5](start_span)[span_5](end_span)。 • 注目すべき水準: 当面の攻防戦は、上値の動的な抵抗となるMA7(1,970.23)とEMA7(1,951.05)付近で繰り広げられています[span_6](start_span)[span_6](end_span)。 • サポートとレジスタンス: - サポートライン: 1,710.47(24時間安値)[span_7](start_span)[span_7](end_span) および 3,710.47のヒストリカルな蓄積ゾーン[span_8](start_span)[span_8](end_span)。 - レジスタンスライン: MA14(2,113.48、EMA14は2,062.32)および長期MA28(2,230.32)[span_9](start_span)[span_9](end_span)。 • 強気・弱気の判断: - 強気の確認: EMA7(1,951.05)/ MA7(1,970.23)のクラスターを明確に上回る日足の終値が確定すれば[span_10](start_span)[span_10](end_span)、売り圧力の枯渇が確認され、MA14の2,113.48水準に向けた明確な道筋が開かれます[span_11](start_span)[span_11](end_span)。 - 弱気の確認: 売りボリュームを伴いながら1,710.47のサポートフロアを維持できなければ[span_12](start_span)[span_12](end_span)、目先の底固めシナリオは無効となり、より深い流動性の空白(リクイディティ・ギャップ)が露呈することになります。 • トレードプラン、無効条件、リスク管理: 積極的なトレーダーは、ローカルな節目を奪還した際の押し目買いを狙いつつ、1,710を下回る厳しい損切り設定を検討してください。高出来高を伴う24時間安値のブレイクダウンが発生した時点で、プランは無効となります。ボラティリティの高い調整チャネルでは、ポジションサイジングを慎重に行ってください。 • 主要数値: - 現在価格: 1,827.62 USDT (+0.43%)[span_13](start_span)[span_13](end_span) - 24時間高値 / 安値: 1,845.30 / 1,710.47[span_14](start_span)[span_14](end_span) - 24時間売買代金: 320.22M USDT[span_15](start_span)[span_15](end_span) - MAスタック: MA7: 1,970.23 | MA14: 2,113.48 | MA28: 2,230.32[span_16](start_span)[span_16](end_span) - EMAスタック: EMA7: 1,951.05 | EMA14: 2,062.32 | EMA28: 2,189.13[span_17](start_span)[span_17](end_span) あなたはこの1,820の需要帯で2,100に向けた平均回帰のバウンスを狙いますか?それともMA7ラインを明確に上抜ける終値を確認するまで待ちますか?[span_18](start_span)[span_18](end_span) $ETHUSDT #ByXIMPACT $XRPUSDT
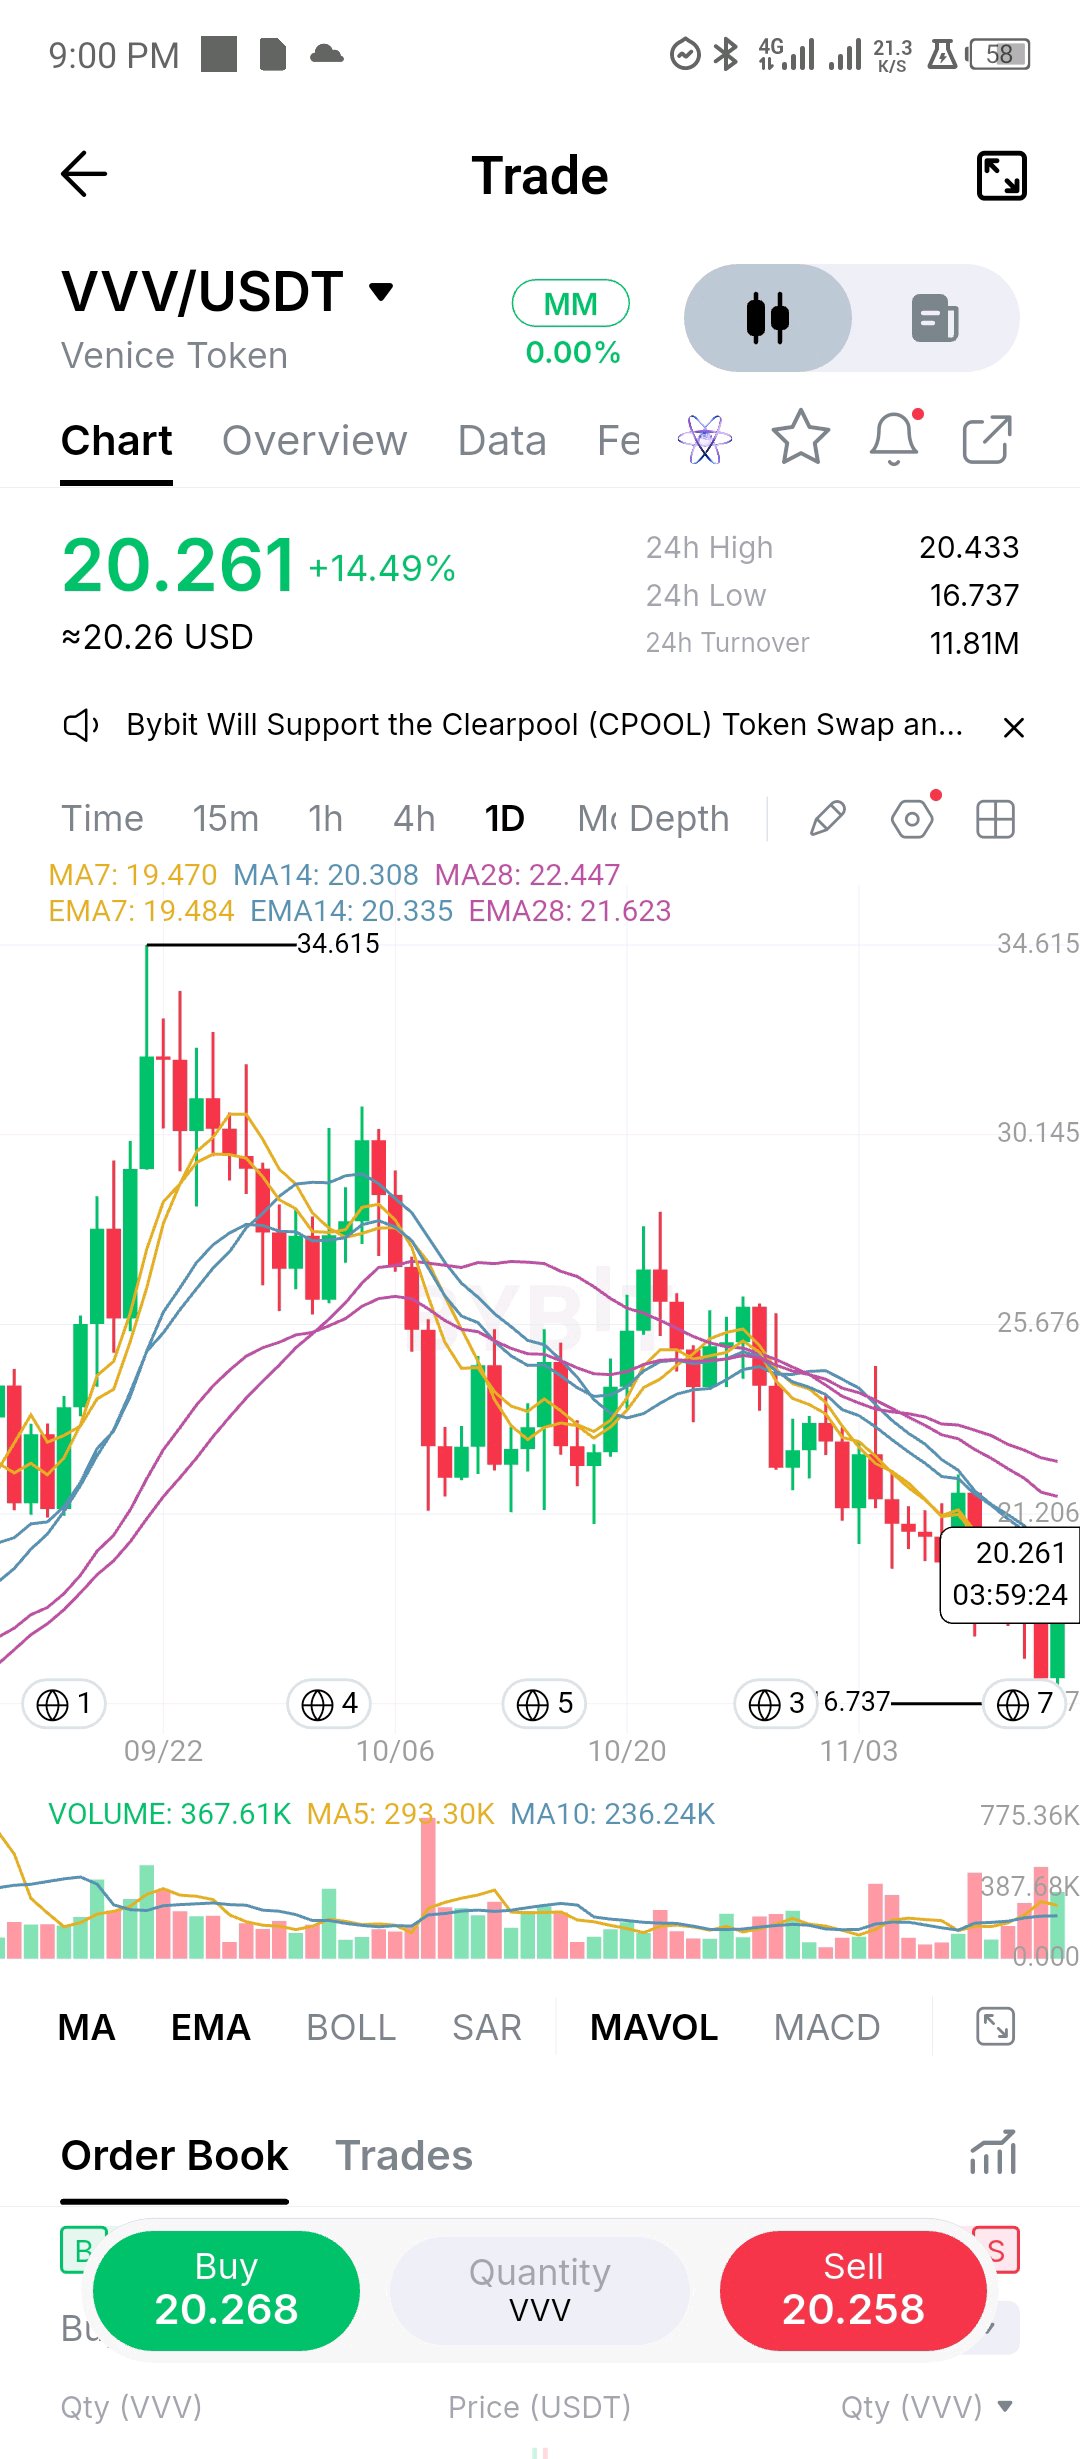
VVV/USDT: 16.74まで急落後、14日移動平均線に向け21%反発 考察: 34.615から52%下落した後、VVVは過去24時間で16.737まで急落し、約21%反発して20.261まで回復しました。価格は7日移動平均線を回復し、14日移動平均線(20.308)の直上に位置していますが、28日移動平均線(22.447)は依然として上値で下降しています。そのため、より長期の移動平均線を奪還するまでは、下降トレンド内での反発という位置づけになります。 出来高と売買代金: 出来高は残り4時間弱で367.6Kとなり、5日平均(293.3K)の約1.25倍、日次ペースでは約1.5倍です。24時間の売買代金は11.81M USDTと妥当な流動性がありますが、20%の日次レンジがあるため、スリッページが急拡大する可能性があります。 注視すべき水準: 14日移動平均線およびEMA14が重なる20.31〜20.34。この水準を上回って日足が確定すれば、下降トレンドが停滞し始めた最初のサインとなります。 サポートとレジスタンス: サポート: 19.47(7日移動平均線およびEMA7)、次に急落安値の16.737。 レジスタンス: 20.433(24時間高値)、21.62(EMA28)、22.447(28日移動平均線)。 トレードプラン、無効化の条件、リスクに関する注記: プラン: 20.34を上回る日足確定を待ち、その後19.47での再テストによるサポートを確認する。無効化条件: 19.47を下回る日足確定で反発が危険に晒され、16.737を下回れば急落安値を割り込む。リスク注記: 20%の反発後は再テストが入ることが多いため、まずはリスクを定義し、ポジションサイズを小さく抑えること。これは私の個人的な見解であり、投資助言ではありません。 強気の確認: 5日平均を上回る出来高を伴い20.34を超えて日足が確定すれば、21.6および22.45に向けた追随の動きが期待できる。 弱気の確認: 14日移動平均線での拒絶に続き、19.47を下回って日足が確定した場合、16.737の安値が再び意識される。16.737を下回って確定すれば、さらなる安値更新を意味する。 主要データ: 価格 20.261 (+14.49%)。24時間レンジ 16.737〜20.433。MA7/14/28: 19.470 / 20.308 / 22.447。EMA7/14/28: 19.484 / 20.335 / 21.623。高値 34.615、安値 16.737。出来高 367.61K(5日平均 293.30K)。売買代金 11.81M USDT。 $VVVUSDT #ByXIMPACT $SOLUSDT
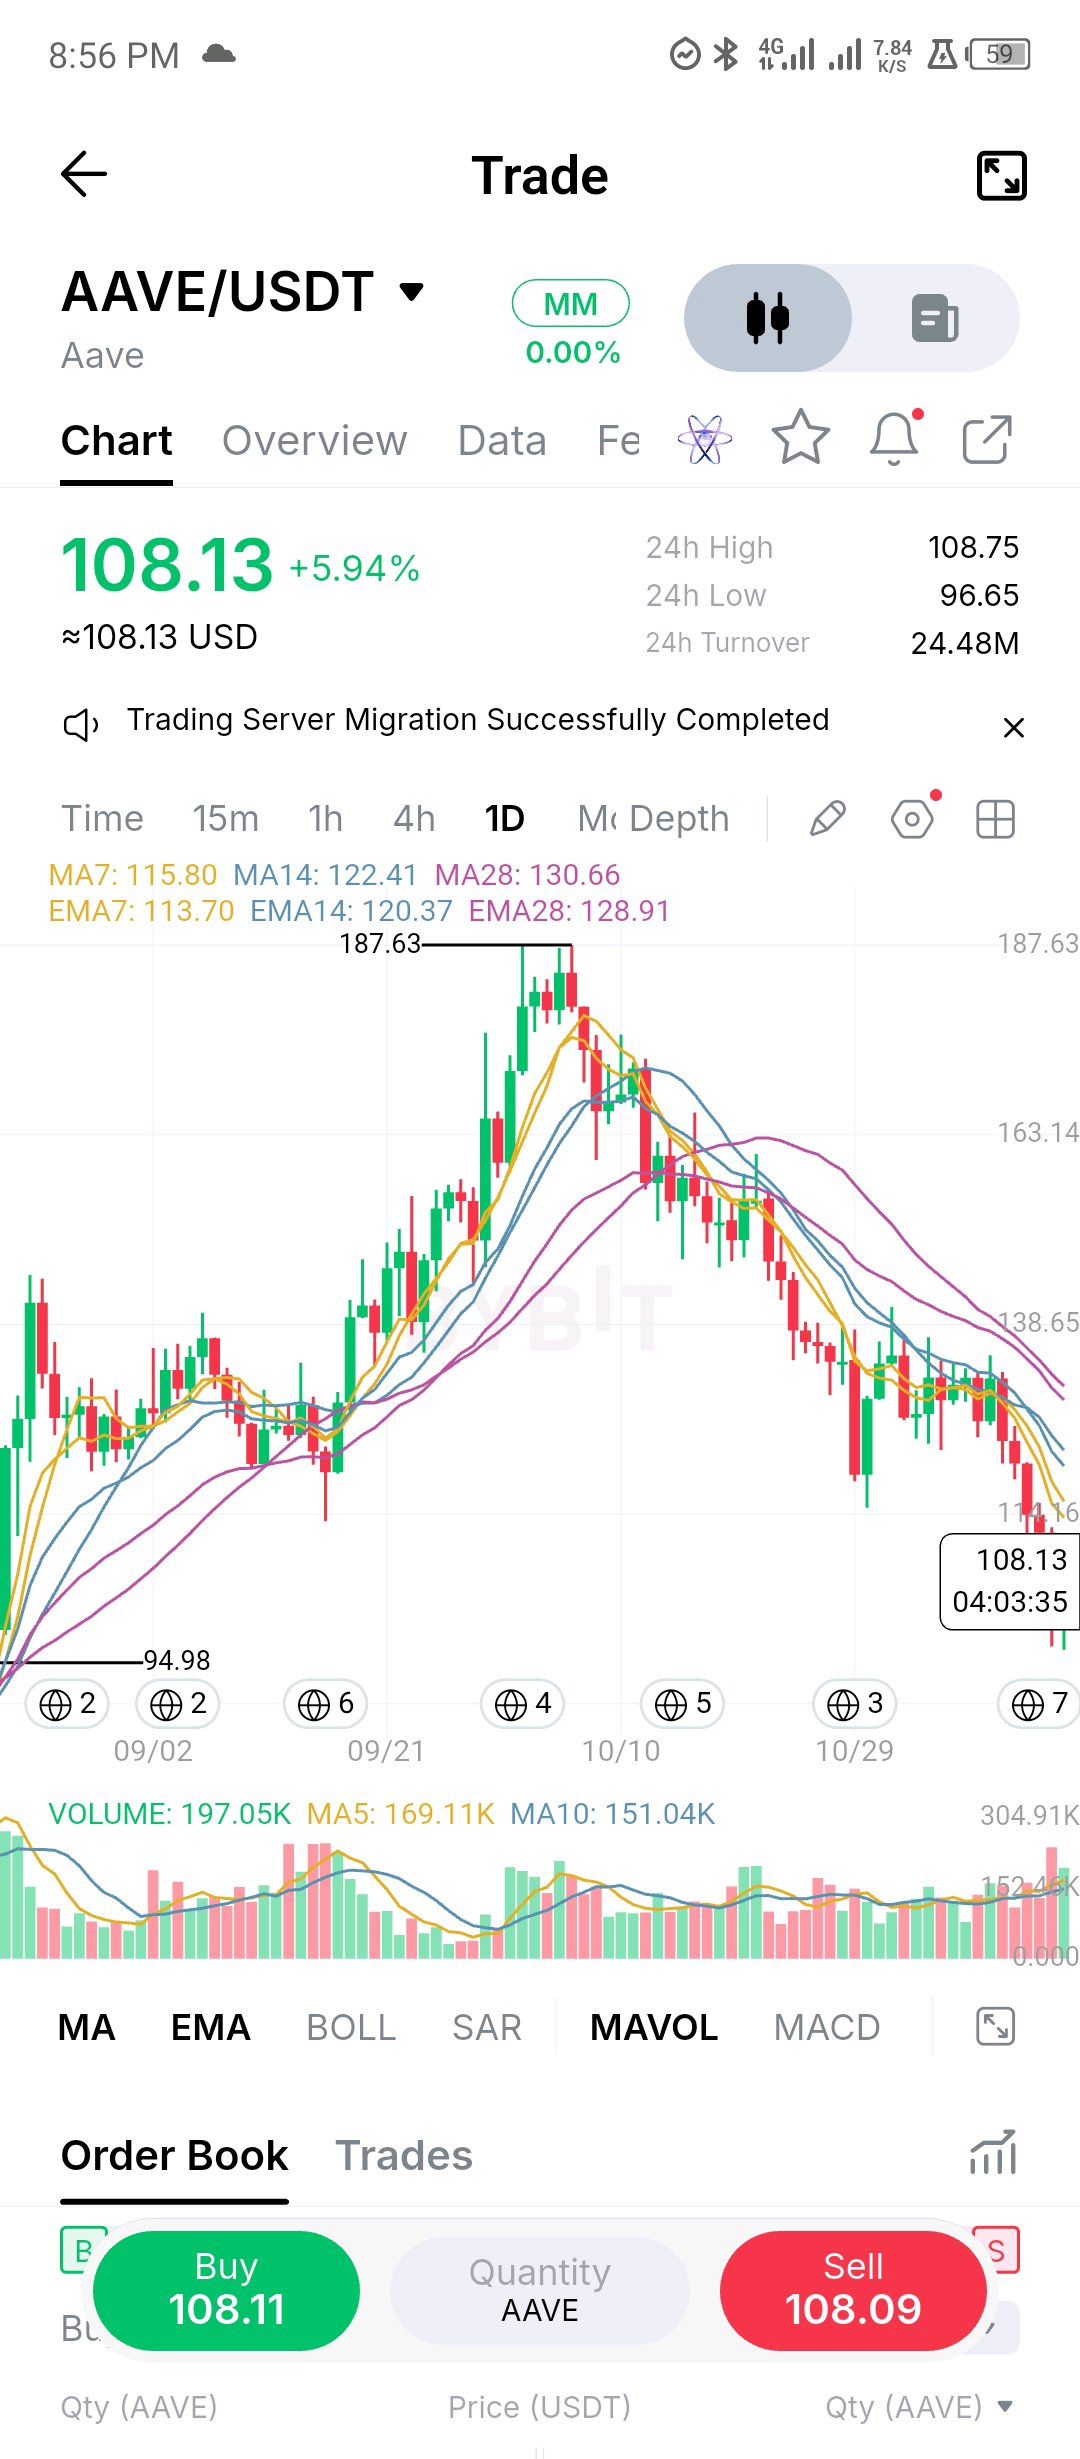
AAVE: BUYERS ARE RESPONDING, BUT THE DAILY DOWNTREND HAS NOT BEEN BROKEN Aave is an important part of decentralized finance, providing non-custodial lending and borrowing infrastructure. Its ecosystem allows users to earn interest by supplying assets and access liquidity through overcollateralized borrowing. Beyond its utility, AAVE has a notable value-accrual mechanism: the Aave DAO's $50 million annual buyback programme, funded through protocol revenue. However, strong fundamentals do not automatically translate into immediate price appreciation. The daily chart presents a market that is still attempting to recover from a prolonged decline. KEY FIGURES - Current price: $108.13 - 24-hour change: +5.94% - 24-hour high: $108.75 - 24-hour low: $96.65 - 24-hour turnover: $24.48M - Displayed volume: 197.05K AAVE MARKET CONSIDERATION AAVE has fallen substantially from its marked $187.63 peak. The recent recovery is encouraging, but price remains below the major moving averages. The current technical configuration is particularly important: - MA7: $115.80 - MA14: $122.41 - MA28: $130.66 - EMA7: $113.70 - EMA14: $120.37 - EMA28: $128.91 The averages remain bearishly aligned. This means buyers are attempting to establish a recovery while the broader daily trend still carries downside pressure. VOLUME AND TURNOVER The displayed trading volume is 197.05K, above both the MA5 reading of 169.11K and MA10 reading of 151.04K. This is a constructive development. Buying activity has improved relative to the recent volume averages. The 24-hour turnover of $24.48M also provides useful context for the level of market activity. However, one stronger volume reading is not enough to confirm sustained accumulation. SUPPORT, RESISTANCE AND LEVELS TO WATCH Immediate resistance: - $108.75 — displayed 24-hour high. - $113.70–$115.80 — first major moving-average resistance zone. - $120.37–$122.41 — next recovery barrier. - $128.91–$130.66 — broader resistance cluster. Support: - $104–$105 — near-term monitoring area, not yet confirmed as established support. - $96.65 — displayed 24-hour low. - $94.98 — previous marked chart low. BULLISH CONFIRMATION A sustained move above $108.75 would be the first positive development. The more meaningful confirmation would be a daily close above $115.80, preferably supported by expanding volume. Reclaiming $122.41 would further strengthen the recovery structure. BEARISH CONFIRMATION Failure to overcome the $113.70–$115.80 resistance region could invite renewed selling. A decisive breakdown below $96.65 would weaken the recovery thesis and bring the historical $94.98 area into focus. TRADE PLAN Bullish scenario: Avoid chasing the initial bounce. Watch for a confirmed breakout above $115.80, followed by a successful retest. The next technical areas of interest would be $120.37–$122.41 and subsequently $128.91–$130.66. Bearish scenario: If price rejects resistance and loses $96.65, avoid assuming the correction is over. Watch how price behaves around the $94.98 historical low. INVALIDATION For the bullish breakout setup, a failed reclaim followed by a sustained move back below $108.75 would weaken the immediate continuation argument. A decisive loss of the $96.65 support reference would invalidate the broader recovery thesis presented here. RISK NOTE AAVE remains volatile, and the prevailing daily moving-average structure is bearish. Breakout entries should be confirmed rather than anticipated. Position size should reflect the distance to the chosen invalidation level, and no trade should risk more than the trader can afford to lose. MY FINAL TAKE What interests me about AAVE is the contrast between improving participation and an unresolved higher-timeframe downtrend. Buyers are showing signs of returning, but they still have several resistance levels to overcome before the market can establish a convincing bullish reversal. I'm watching the $115.80 region closely. That is where the recovery will face its first meaningful structural test. Would you trust this recovery enough to consider a breakout above $115.80, or would you rather wait for stronger confirmation of a daily trend reversal? $AAVEUSDT #ByXIMPACT $BTCUSDT
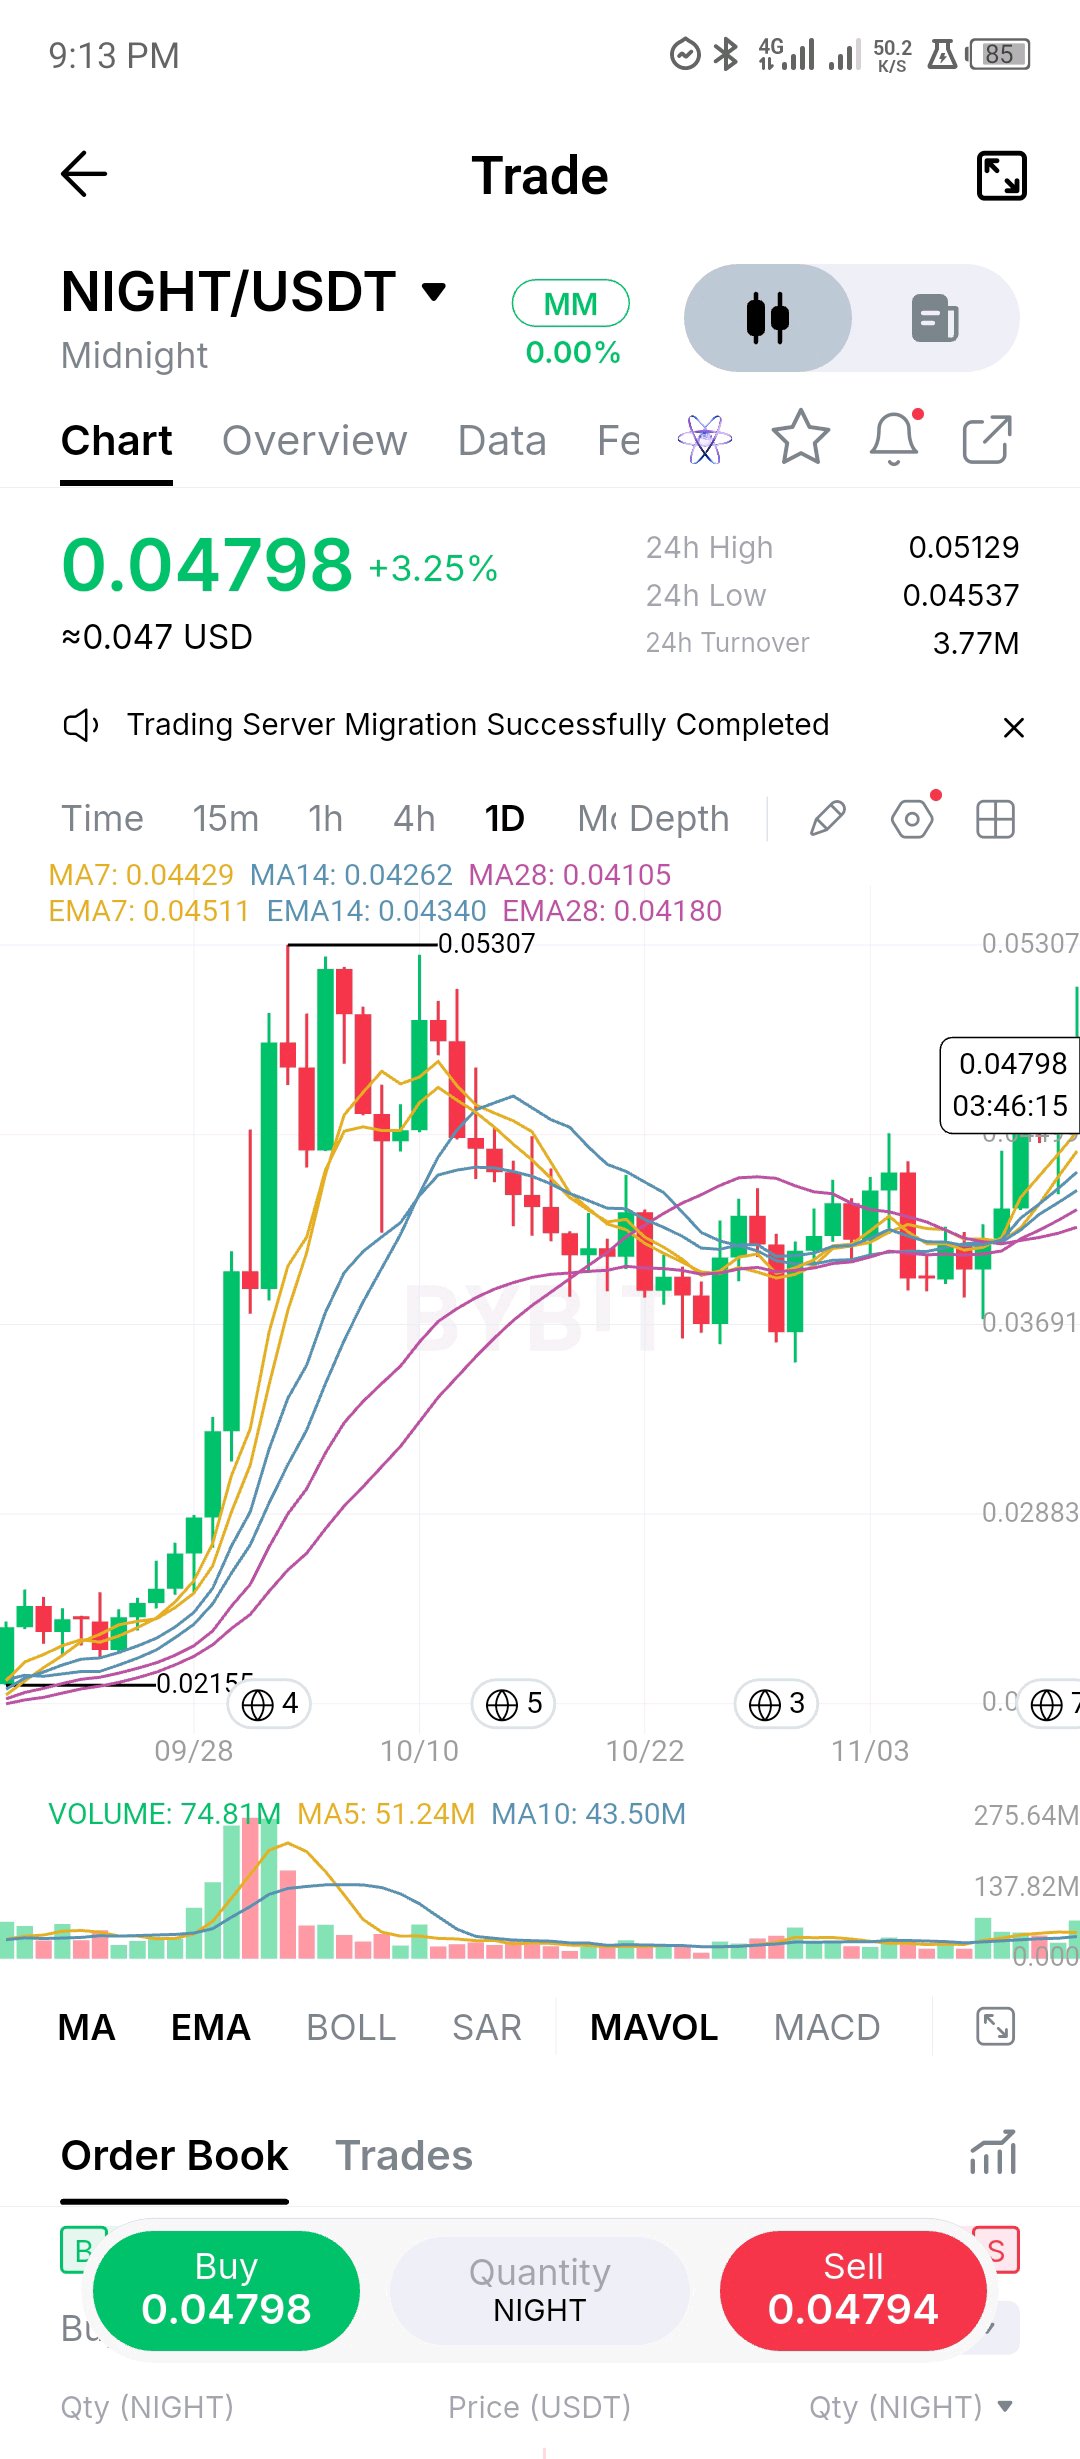
NIGHTが5週間のベースから抜け出そうとしている。9月と10月に0.02155から0.05307まで146%上昇した後、約0.035から0.046の間で数週間揉み合いが続き、7日、14日、28日の移動平均線がタイトなバンド(0.0443、0.0426、0.0411)に収束していた。今日のローソク足は価格を0.04798まで押し上げ、そのレンジの上限を突破した。出来高は75Mで、終了まで残り4時間を切った時点で既に5日平均の約1.5倍に達している。 確認は取れている。価格は3本の移動平均線および指数平滑移動平均線(EMA)すべての上にあり、これらは現在上向きに転じている。また、10月の高値後のプルバックは終値ベースで0.035〜0.036のエリアを維持した。ベースからのメジャードムーブ(レンジの幅をトップに加算)は、0.05307の高値を上回る約0.056を示唆している。 注目レベル:0.05129(本日の高値)と0.05307(10月の高値)が最初のレジスタンスとなる。押し目局面では、0.0455(以前のレンジ上限、現在はサポート)と7日移動平均線の0.0443が、本物のブレイクアウトであれば維持すべき水準だ。終値が0.0443を下回れば、それは「ダマシ」のポップアップとなるだろう。 レンジ上限の再テストでサポートが確認されるのを確認してから動きたい。今の急騰を追うのは控えよう。 $NIGHTUSDT #ByXIMPACT $SOLUSDT
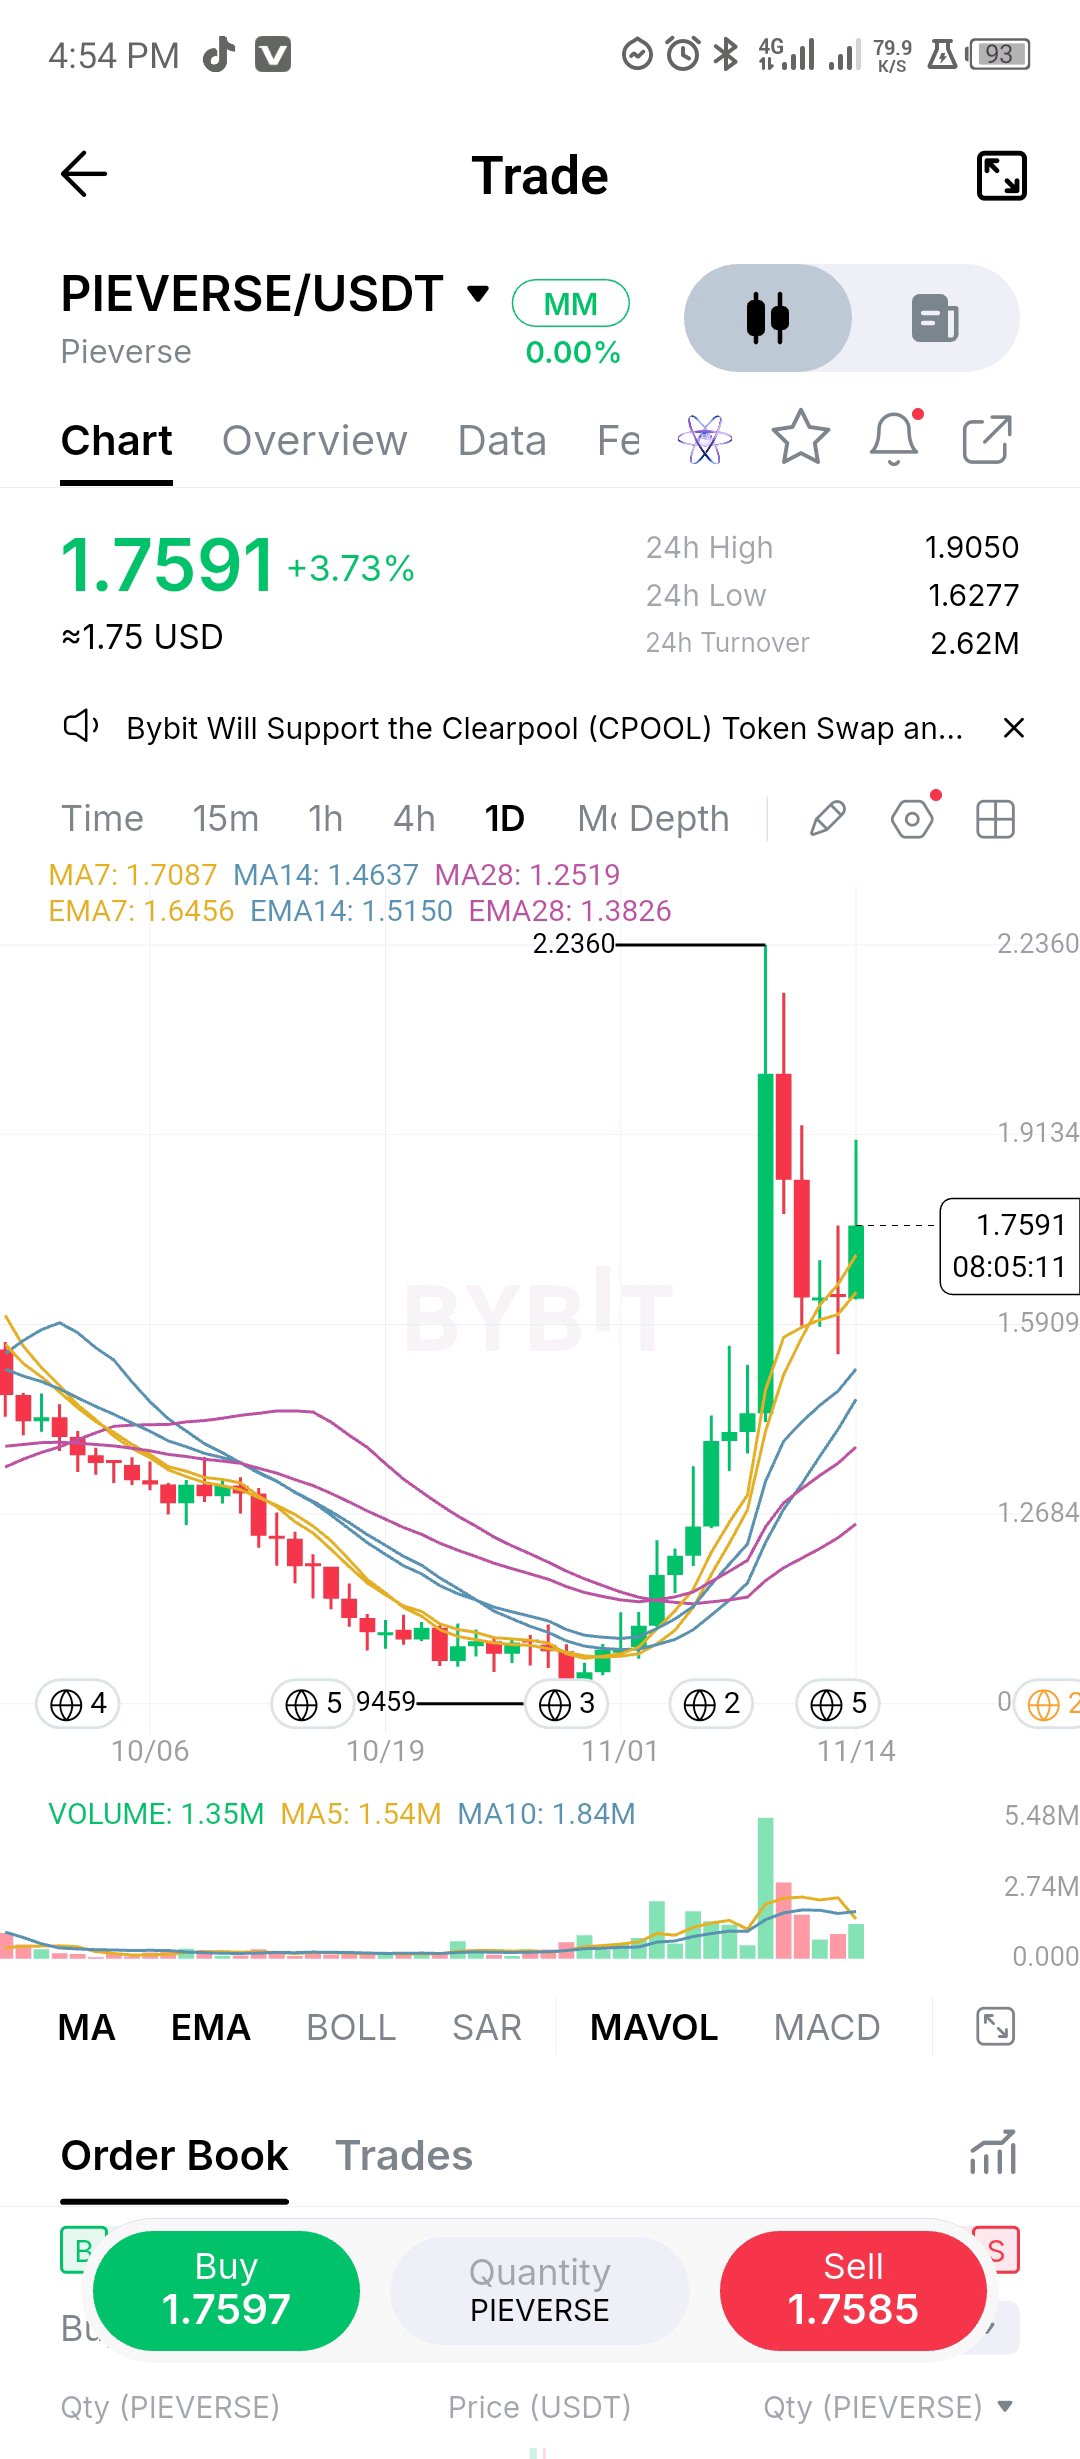
PIEVERSE did what healthy trends do: it ran 136% off the 0.9459 low to 2.236, pulled back roughly 30% to about 1.54, and is now bouncing from a higher low. Price is back above the 38.2% retrace of the whole move (1.743) and has reclaimed the 7 day MA (1.7087), with volume about 1.3x its 5 day average at the pace of the day. The structure is still clean on the bullish side. The 7, 14 and 28 day MAs (1.7087, 1.4637, 1.2519) are fanned and rising, and price sits 20% above the 14 day and 40% above the 28 day. The pullback respected the 50% retrace area near 1.59 and never reached the 14 day MA. What decides it: the 1.9050 24h high and the roughly 2.01 top of the thrust candle are the first resistance, then the 2.236 high. A daily close above 2.01 would be the first higher high. Support is the 7 day MA near 1.71, then 1.6277 (today's low) and 1.59, and a close under 1.46 would mean the pullback is deeper than a flag. This is the first real test of the trend since the spike, and so far it passes. $PIEVERSEUSDT #ByXIMPACT $BTCUSDT
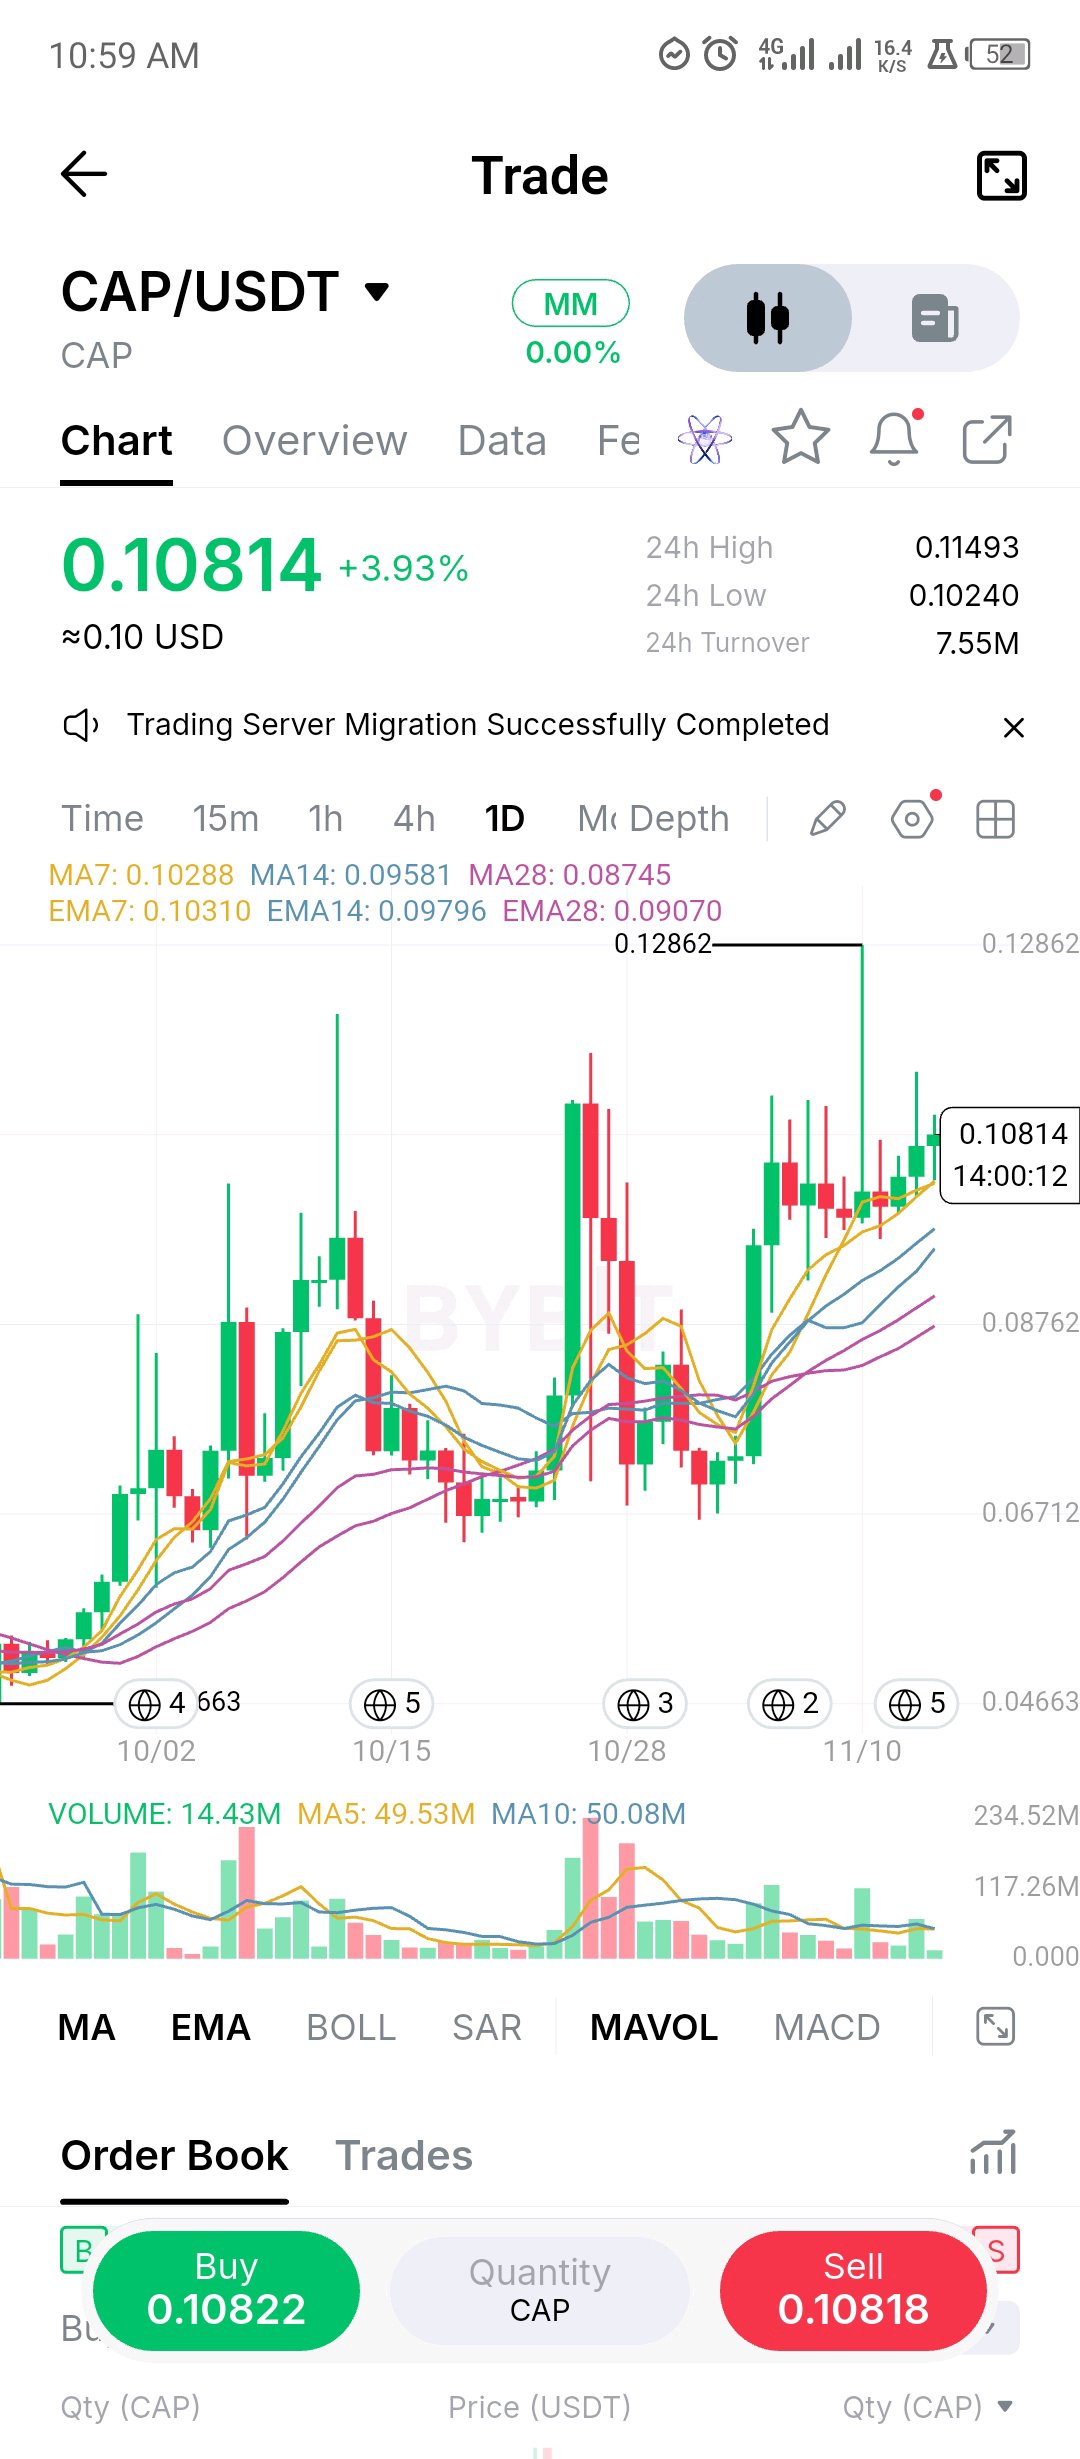
CAP ($CAP): Buyers Are Building Momentum, But One Resistance Zone Stands Between Them and a Stronger Breakout. CAP is showing an encouraging recovery on the daily timeframe. Trading around $0.10814, the token is up 3.93% in the displayed 24-hour session. More importantly, its recent price behaviour suggests that buyers have gained control of the short-term structure. What makes this setup interesting is the alignment of the moving averages. - MA7: $0.10288 - MA14: $0.09581 - MA28: $0.08745 The EMA readings tell a similar story, with all three averages positioned below the current price. This alignment supports the bullish structure and suggests that recent buying has shifted the short-term trend in favour of buyers. But I wouldn't overlook the resistance overhead. The $0.11493 level is the immediate test. A convincing break above this area could strengthen the bullish continuation argument and potentially bring the previous $0.12862 chart high back into focus. On the downside, $0.10240 is the immediate support reference. If buyers fail to defend this area, attention shifts toward the $0.09796–$0.09581 region, where the short-term averages provide additional technical support references. There is also a volume detail worth watching. Current displayed volume is 14.43M, considerably below the MA5 and MA10 readings of 49.53M and 50.08M. Price is advancing, but participation has not yet matched those earlier volume levels. That makes the next breakout attempt particularly important. Stronger volume would provide better confirmation that demand is expanding rather than simply reflecting a low-participation recovery. My reading of the market: CAP currently has a constructive daily structure. Buyers have reclaimed the moving averages, and the sequence of recent candles suggests improving price control. However, the market still needs to overcome $0.11493 to make a stronger continuation case. I'm watching whether buyers can turn that resistance into support. Until then, the bullish setup is promising, but confirmation remains the missing piece. Would you be looking for a breakout above $0.115, or waiting for a pullback toward $0.102 before considering an entry? $CAPUSDT #ByXIMPACT $BTCUSDT
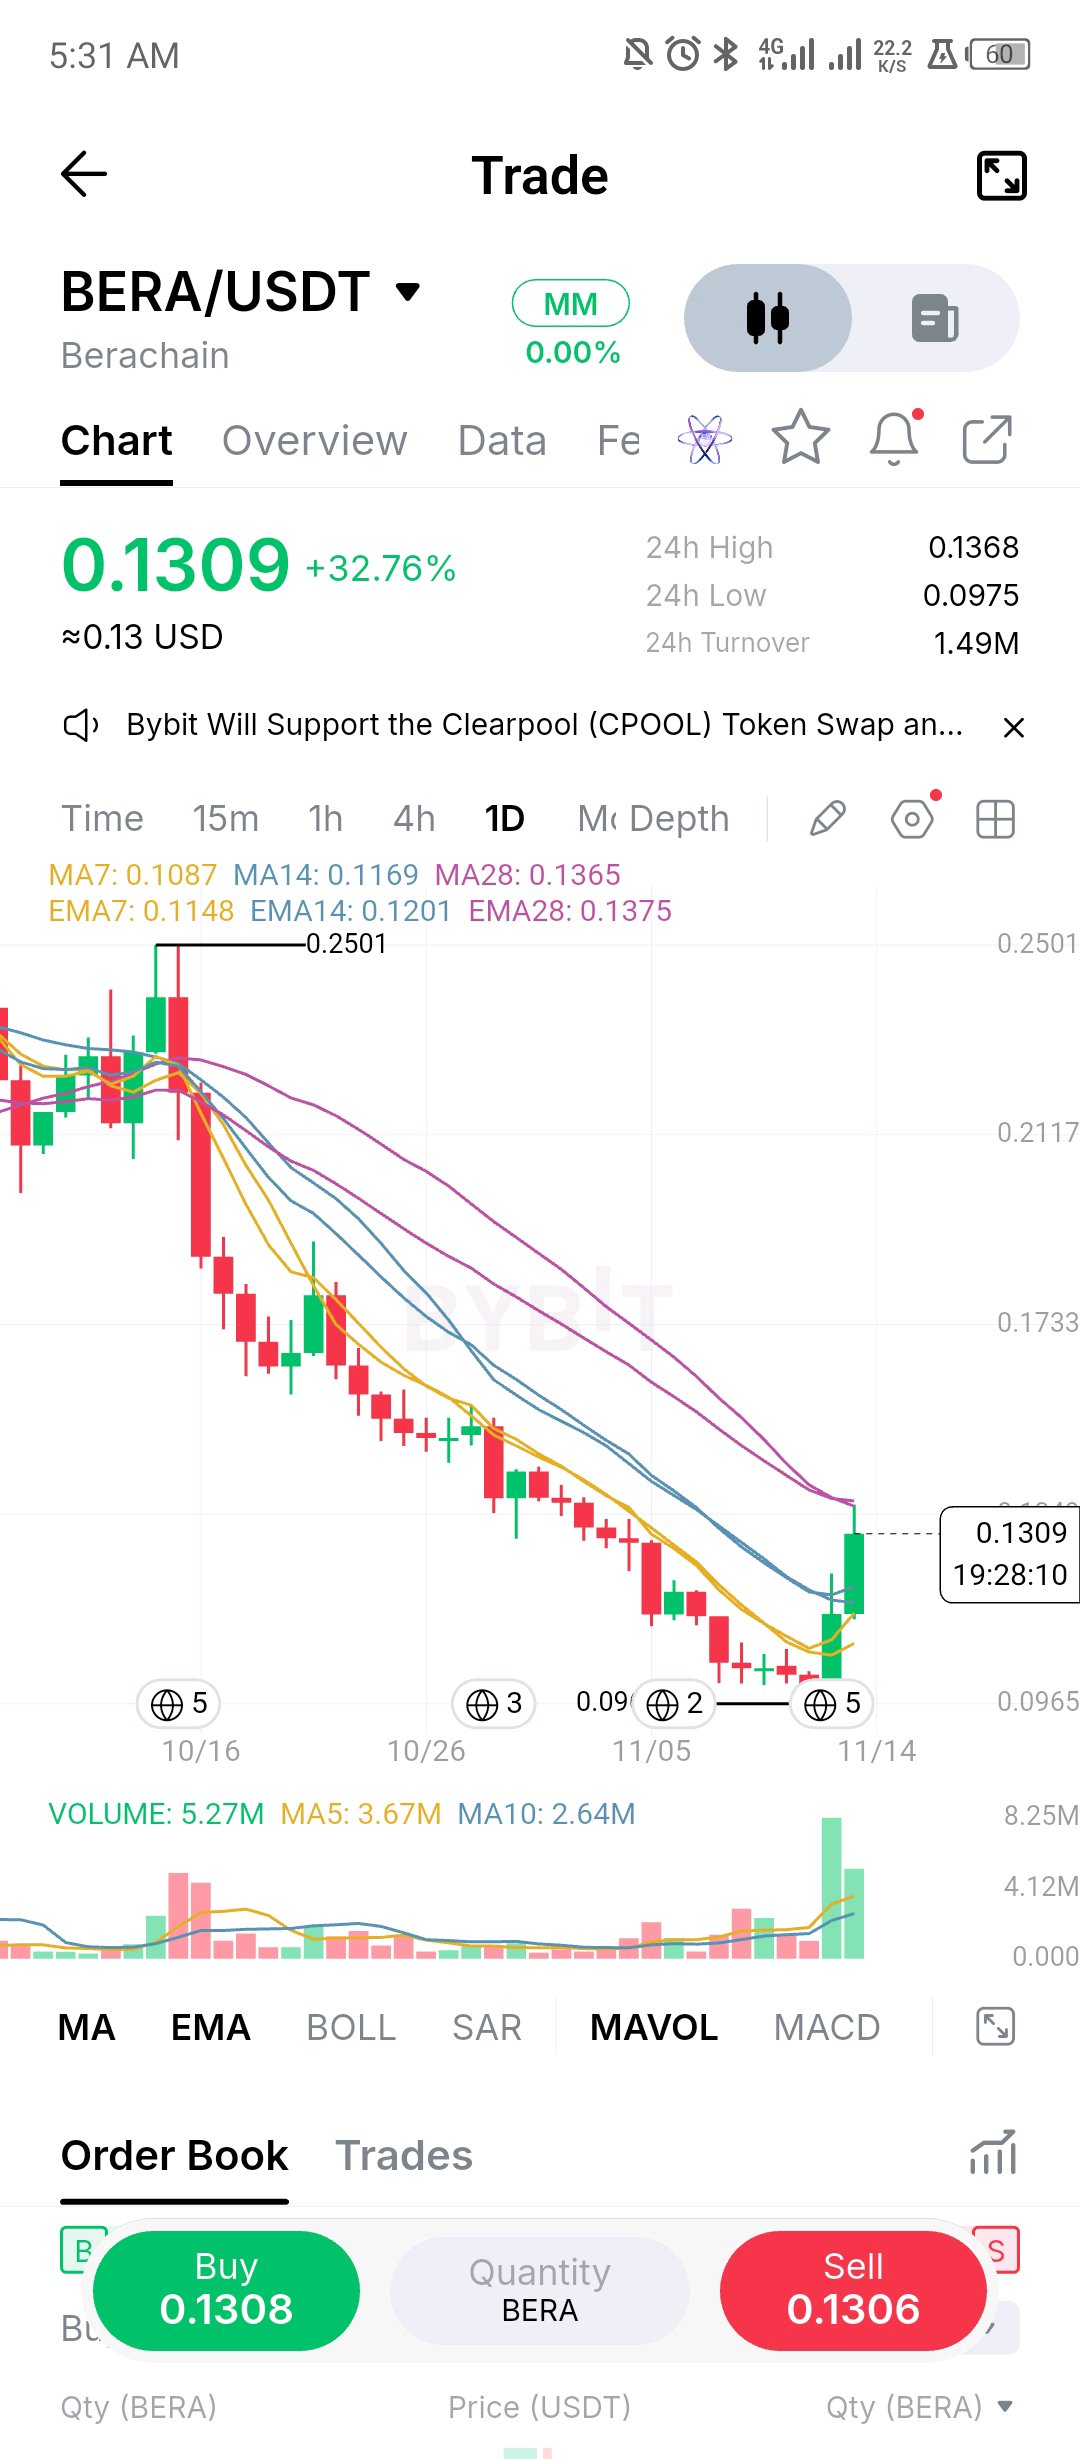
BERACHAIN ($BERA): 力強い反発だが、トレンド転換は本物か? BERAに興味深い動きが見られます。 0.2500ドル付近からの長期的な下落を経て、Berachainのネイティブトークンは急激な回復を見せ、直近24時間で32.76%上昇し、約0.1309ドルで取引されています。 これは大きな動きですが、より重要なのは、これが構造的なトレンド転換の始まりなのか、それとも積極的な自律反発(レリーフラリー)に過ぎないのかという点です。 日足チャートを見ると、いくつかの注目すべき点があります。 この回復には確かな勢いがあります。 BERAは7日および14日の移動平均線を上抜けています: - MA7: 0.1087ドル - MA14: 0.1169ドル - MA28: 0.1365ドル 短期的な回復は心強いものの、28日移動平均線が依然として上値に控えています。EMA(指数平滑移動平均線)の構成を見ても同様で、より長期の平均線は約0.1375ドルに位置しています。 このため、0.1365ドルから0.1375ドルの間に重要なレジスタンスゾーンが形成されています。 出来高はこの動きの信頼性を高めています。 表示されている出来高は527万に達しており、MA5の367万、MA10の264万を上回っています。この拡大は、反発の背後により強力な参加者がいることを示唆しています。 しかし、出来高の増加だけでトレンド転換が確定するわけではありません。 注目すべき水準: - 0.1365ドル~0.1375ドル:当面の主要レジスタンスであり、買い手にとって最初の正念場。 - 0.1200ドル~0.1210ドル:価格が押し戻された場合に監視すべき重要な短期回復エリア。 - 0.1087ドル:7日移動平均線であり、もう一つの潜在的なサポートの目安。 - 0.0975ドル:直近の安値。ここを割り込むと、回復のシナリオは著しく弱まるでしょう。 私のトレード視点: 出来高の拡大と短期移動平均線の奪還は心強い兆候です。とはいえ、0.1365ドル~0.1375ドルのレジスタンスゾーンを明確に上抜けて定着するまでは、強気トレンドへの転換と断定するつもりはありません。 ブレイクアウトに成功し、その水準を維持できれば、より広範な回復への余地が生まれるでしょう。 逆に、このゾーンで拒絶され、その後0.1200ドルを割り込むようなことがあれば、売り手が依然として長期的な下降トレンドを守っていることを示唆します。 興味深いのは、数週間にわたる弱気相場の後、BERAがついに意味のある買い意欲を集めたという点です。今、市場はこの需要が最初の主要なレジスタンス試験を乗り越えられることを証明する必要があります。 皆さんはこれを本格的なトレンド転換の初期段階だと考えますか?それとも0.1375ドルを上回って日足が確定するのを待ちますか? $BERAUSDT #ByXIMPACT
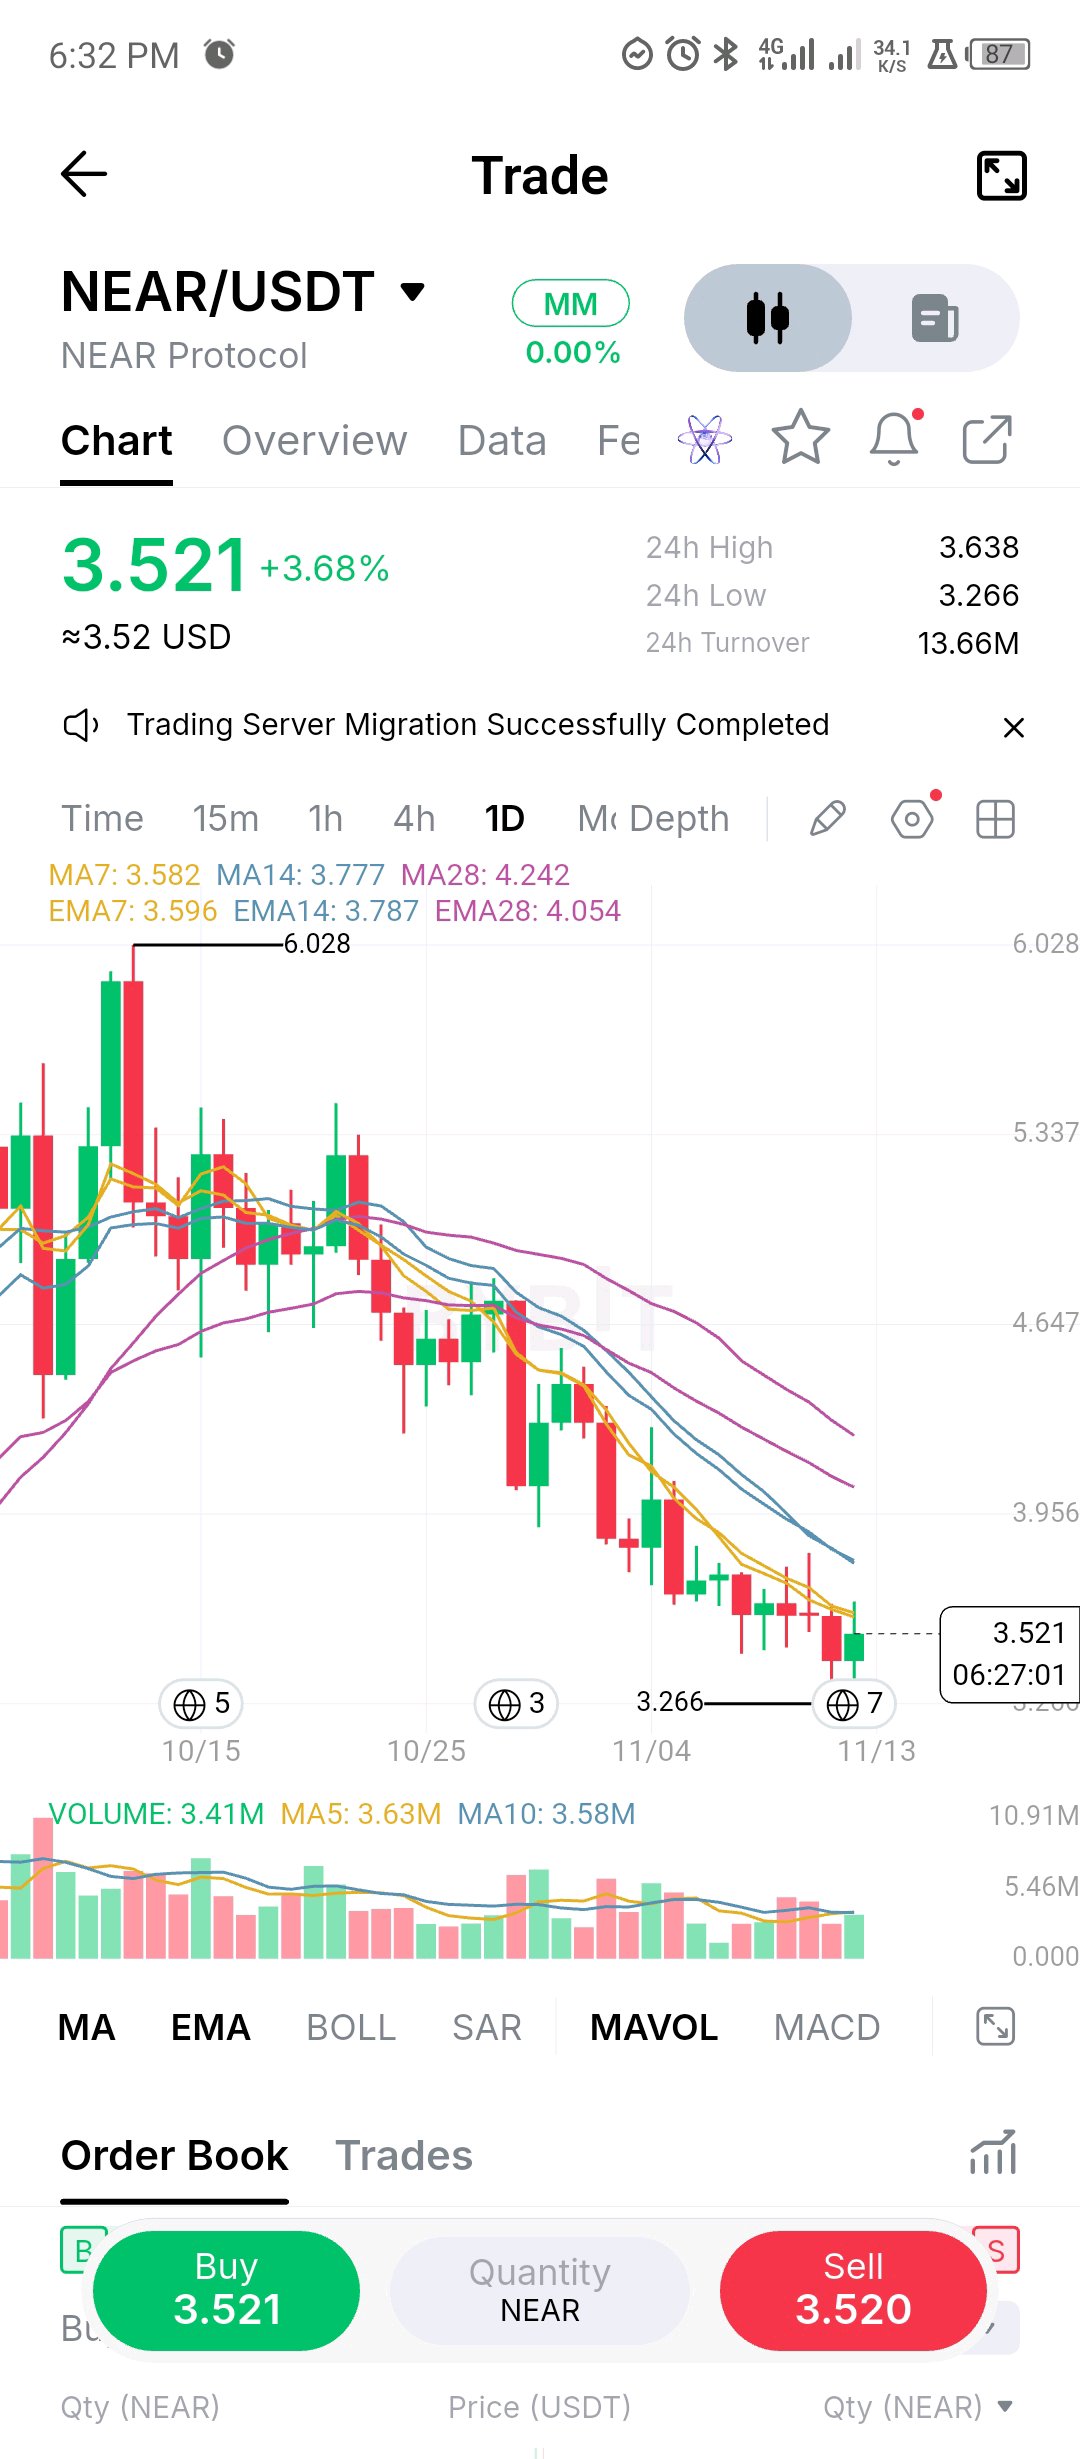
NEAR has now retraced about 67% of its entire 2.298 to 6.028 rally. The 50% level at 4.16, which was the key support last week, is now a ceiling about 18% overhead. Today's 3.266 low got bought and price is up about 8% off it at 3.521, right on the 7 day MA (3.582) and EMA7 (3.596). The trend filter hasn't changed. The 7, 14 and 28 day MAs (3.582, 3.777, 4.242) are stacked bearishly and falling, and price is 17% under the 28 day. What's different is that volume is holding up, about 1.3x its 5 day average at the pace of the day, at the first meaningful reaction after weeks of steady selling. Levels: 3.638 (today's high) and the 61.8% retrace at 3.72 are the first tests, with the 14 day MA at 3.777 behind them. Support is 3.266, then the 78.6% retrace near 3.10. A daily close over 3.78 would be the first sign the downtrend is stalling, and a close under 3.266 would target 3.1. Controlled bounce, no confirmation yet. Closes decide it. $NEARUSDT #ByXIMPACT
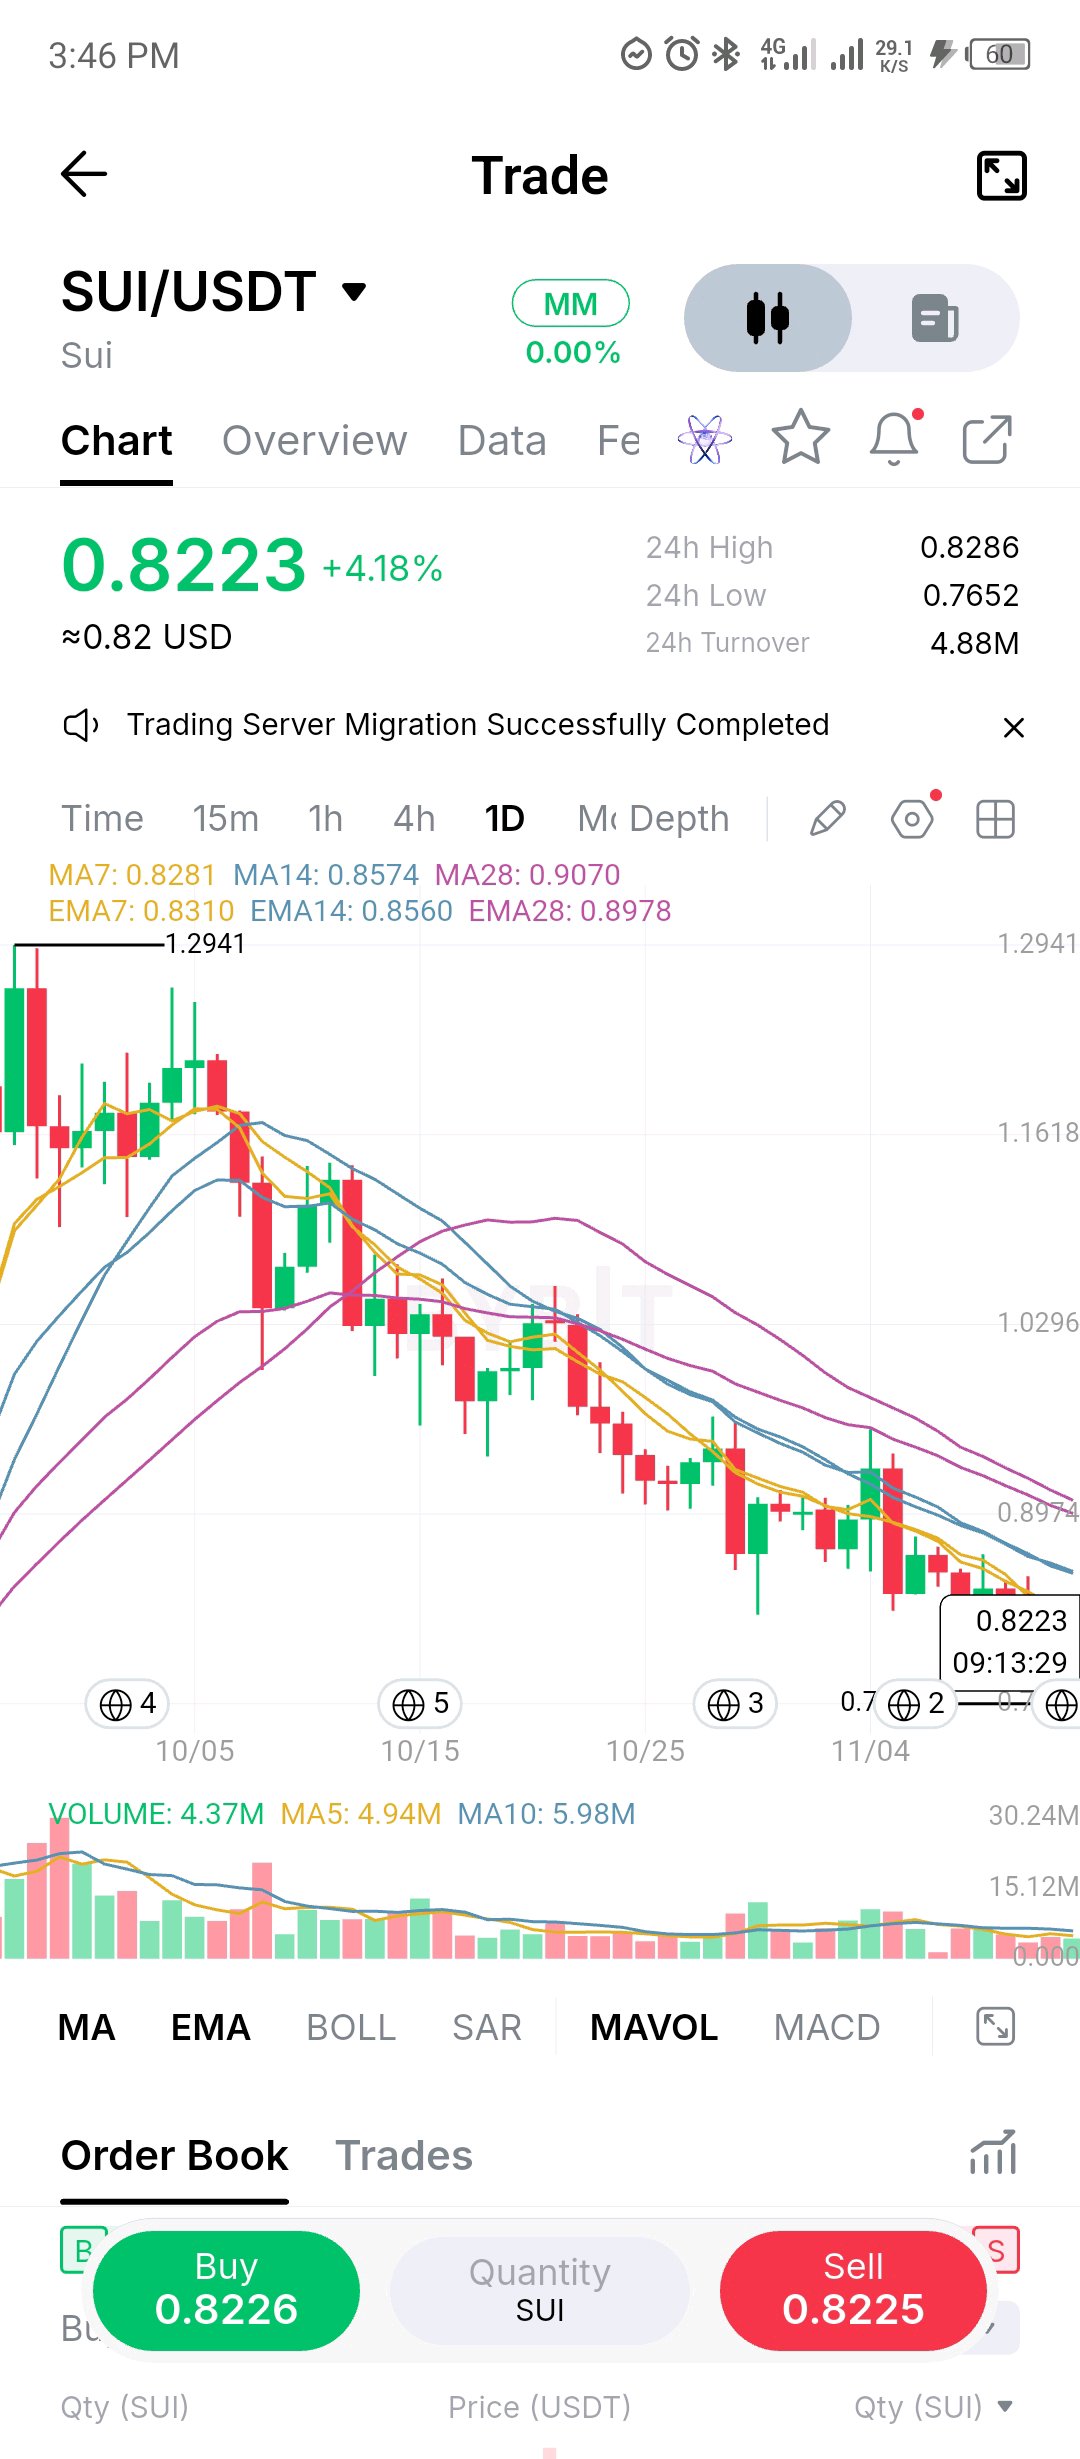
$SUIUSDT SUI/USDT Daily Technical Outlook: Fast Moving Average Test Probing Local Resistance Sui ($SUI) is trading up +4.18% around 0.8223 after defending its recent 0.7652 intraday support low. Price action is attempting to establish a short-term relief structure following a prolonged downside correction from the 1.2941 macro peak. Core Technical Metrics: • Moving Average & EMA Stack: Price is hovering just beneath the fast MA7 (0.8281) and EMA7 (0.8310) lines. The medium-term MA14 sits at 0.8574 (EMA14 at 0.8560) and the macro MA28 rests at 0.9070 (EMA28 at 0.8978). • Volume Dynamics: Daily volume reads 4.37M, trading close to the 5-day baseline (4.94M) and 10-day moving average (5.98M), signaling active buyer absorption near current lows. • Immediate Range Boundaries: The 24h high at 0.8286 serves as the immediate breakout hurdle, while downside protection is anchored by the 0.7652 low. Execution Scenarios: • Bullish Reclaim: A decisive daily close above the 0.8281 MA7 / 0.8310 EMA7 resistance cluster confirms short-term buyer absorption, opening a path toward testing the 0.8574 MA14 zone. • Bearish Invalidation: Losing the 0.7652 support floor on increasing sell volume invalidates the immediate reversal setup and extends the broader downside channel. Are you bidding this SUI support bounce toward the 0.85 handle, or waiting for a confirmed close past the MA7 line? #ByXIMPACT
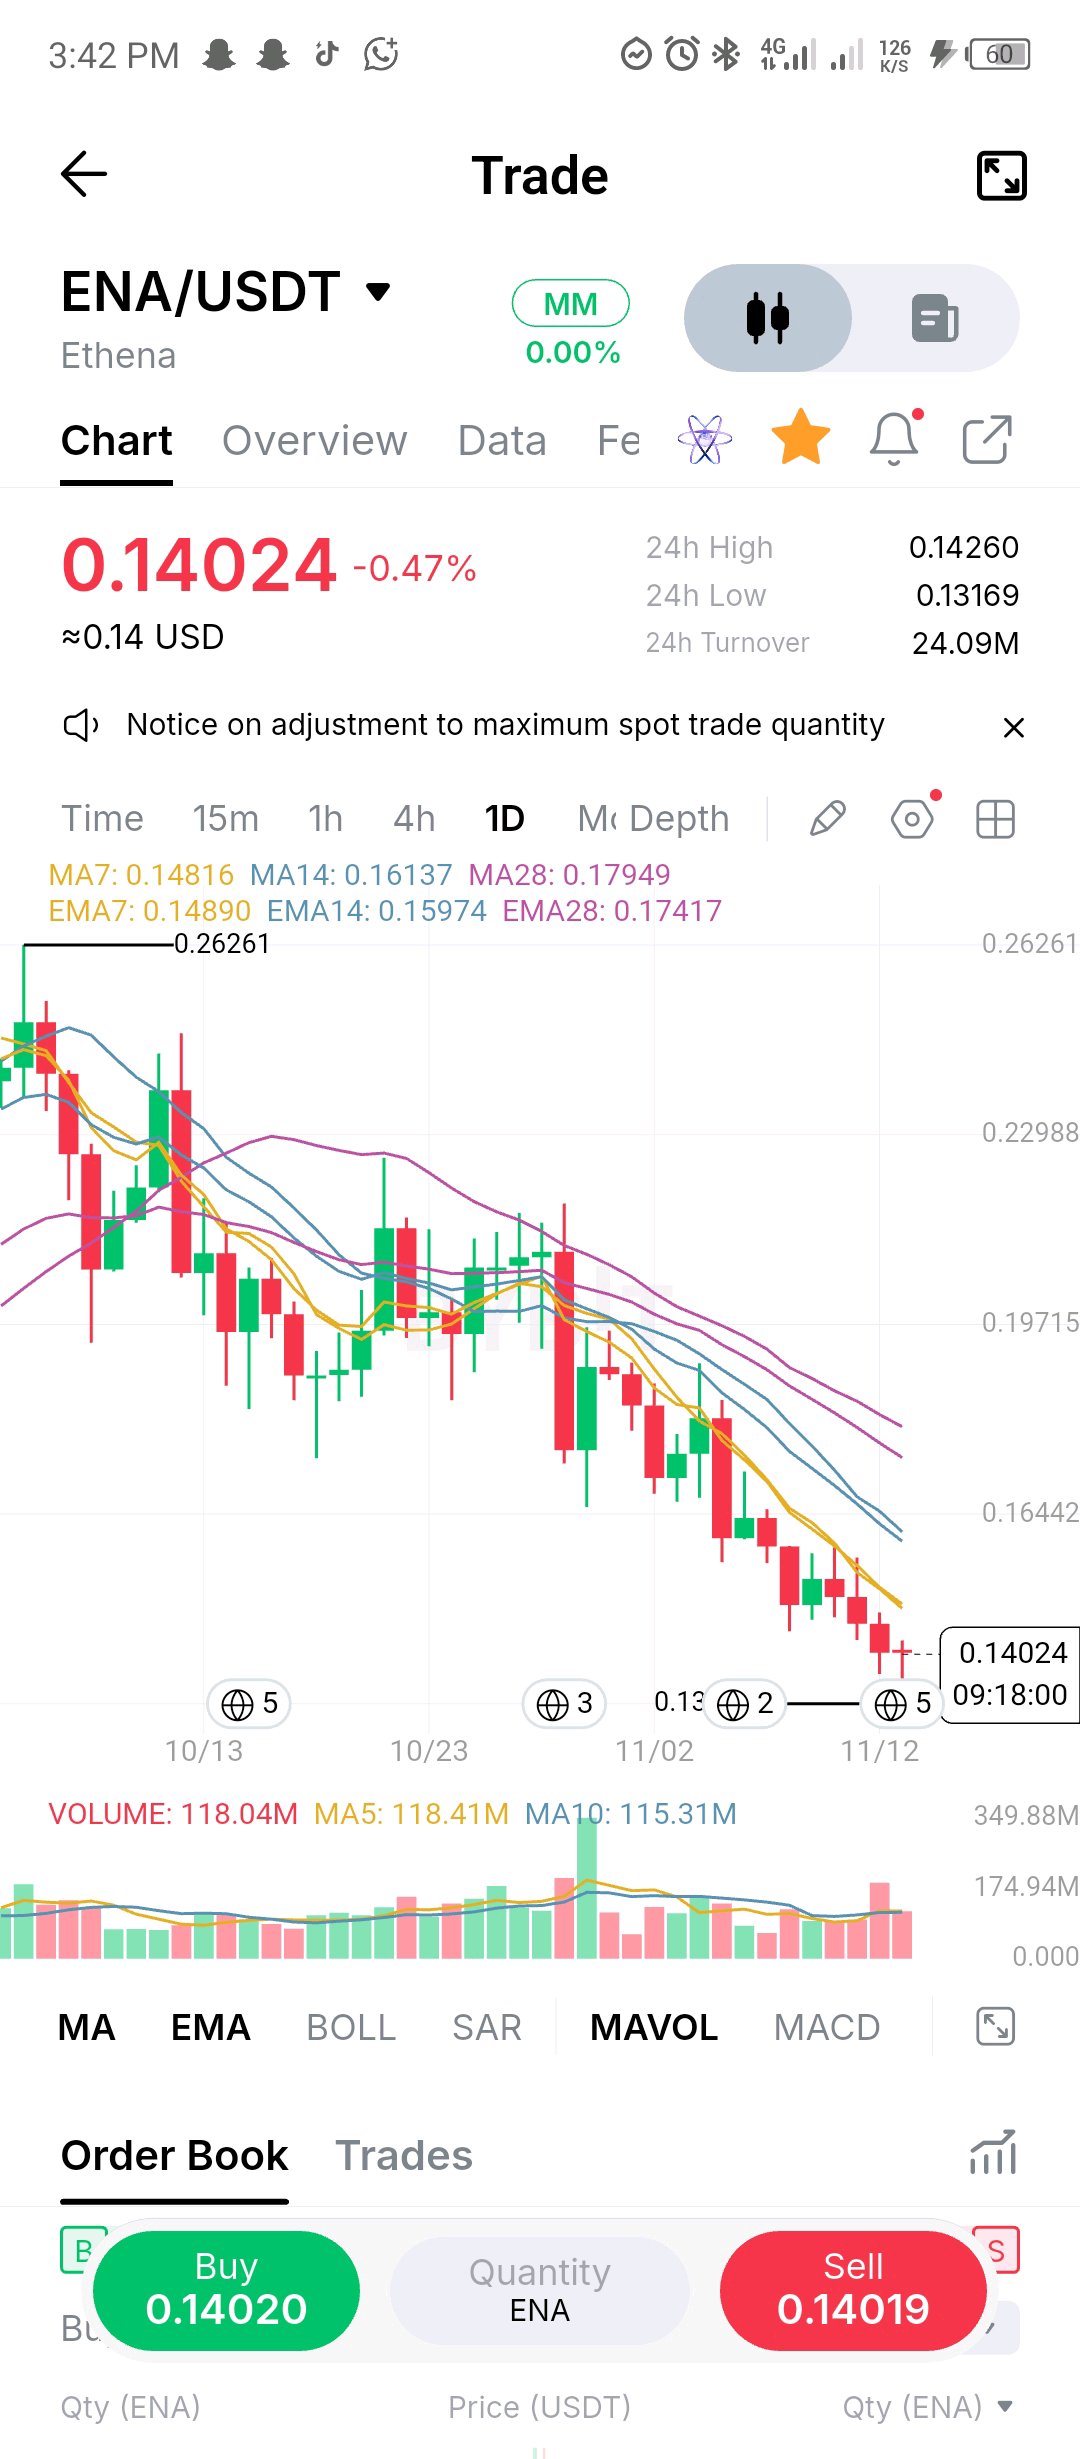
$ENAはちょうど9月の安値を更新(スウィープ)してから反発しました。過去24時間で価格は0.13169まで下落し、全体的な上昇の起点となった0.13473のレベルを約2%下回りましたが、その後0.14024まで回復しました。この回復時の出来高は、一日の残りが約40%ある時点ですでに5日平均と並ぶ水準に達しています。0.29465の高値から96%の往復を経て、この安値がチャート上の最後の主要レベルでした。 このようなスウィープは最初のテストであり、結論ではありません。平均線は依然として弱気な並び(ベアリッシュ・スタック)で下落しており(7日平均0.14816、14日平均0.16137、28日平均0.17949)、価格は7日平均を5%、28日平均を22%下回っています。0.1494、0.1675、0.174といったかつてのサポートライン(床)は、現在ではレジスタンスとして頭上に重くのしかかっています。 注目すべき点:0.1482(7日移動平均線)を上回って日足が確定すれば、買い手が最初の平均線を奪還したことを示します。逆に0.1347を下回って確定すれば、今回のスウィープは単なる一時的なものではなく本格的なブレイクとなり、下に目立ったサポートがなくなります。 ハイステークス(高リスク)な水準であるため、どちらのシナリオになるか、日足の確定を待って判断します。 $ENAUSDT #ByXIMPACT $ENAUSDC
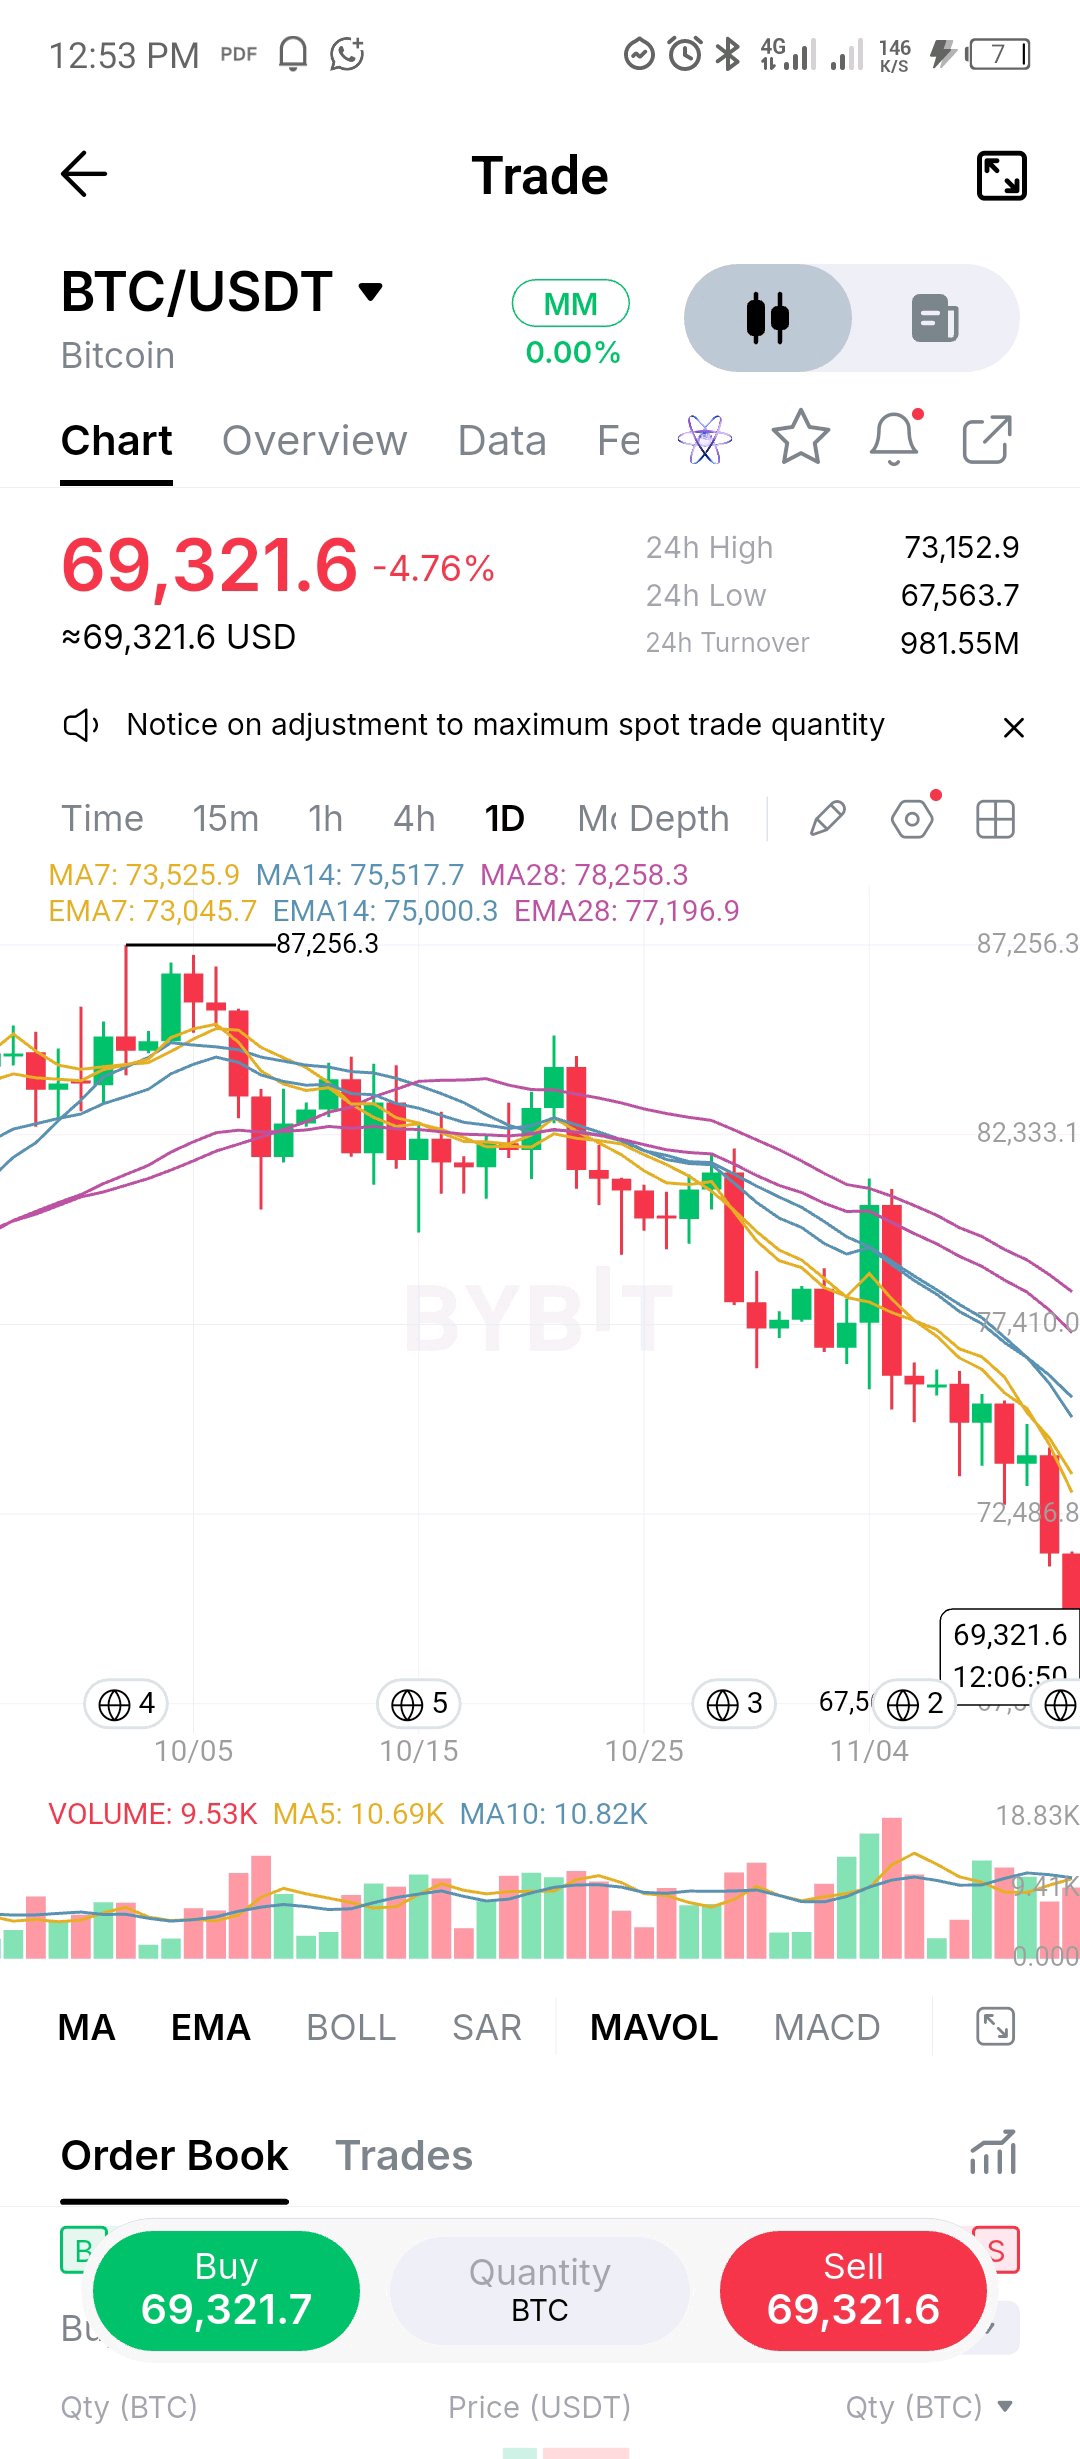
BTC just lost the last floor on this chart. After the 74,920 base broke earlier this week, the 73.3k low went today. Price flushed to 67,564 and bounced to about 69.3k, an 8% daily range, on volume tracking roughly 1.8x its 5 day average. It's now about 21% below the 87,256 high. The averages are all overhead and falling in order: 7 day 73,526, 14 day 75,518 and 28 day 78,258, with the EMAs just under them. That makes the former floors at 73.3k and 74.9k layered resistance, with 70k as the first round-number test. What matters from here is whether 67.5k holds on a closing basis. A flush on heavy volume that closes well off the low can mark a short-term low. A close at the lows opens 65k with nothing marked beneath it. For a real reclaim, BTC needs to get back over 70k, then 73.3k. Volatility expansion cuts both ways, so I'm watching the daily close, not the intraday swing. $BTCUSDT #ByXIMPACT
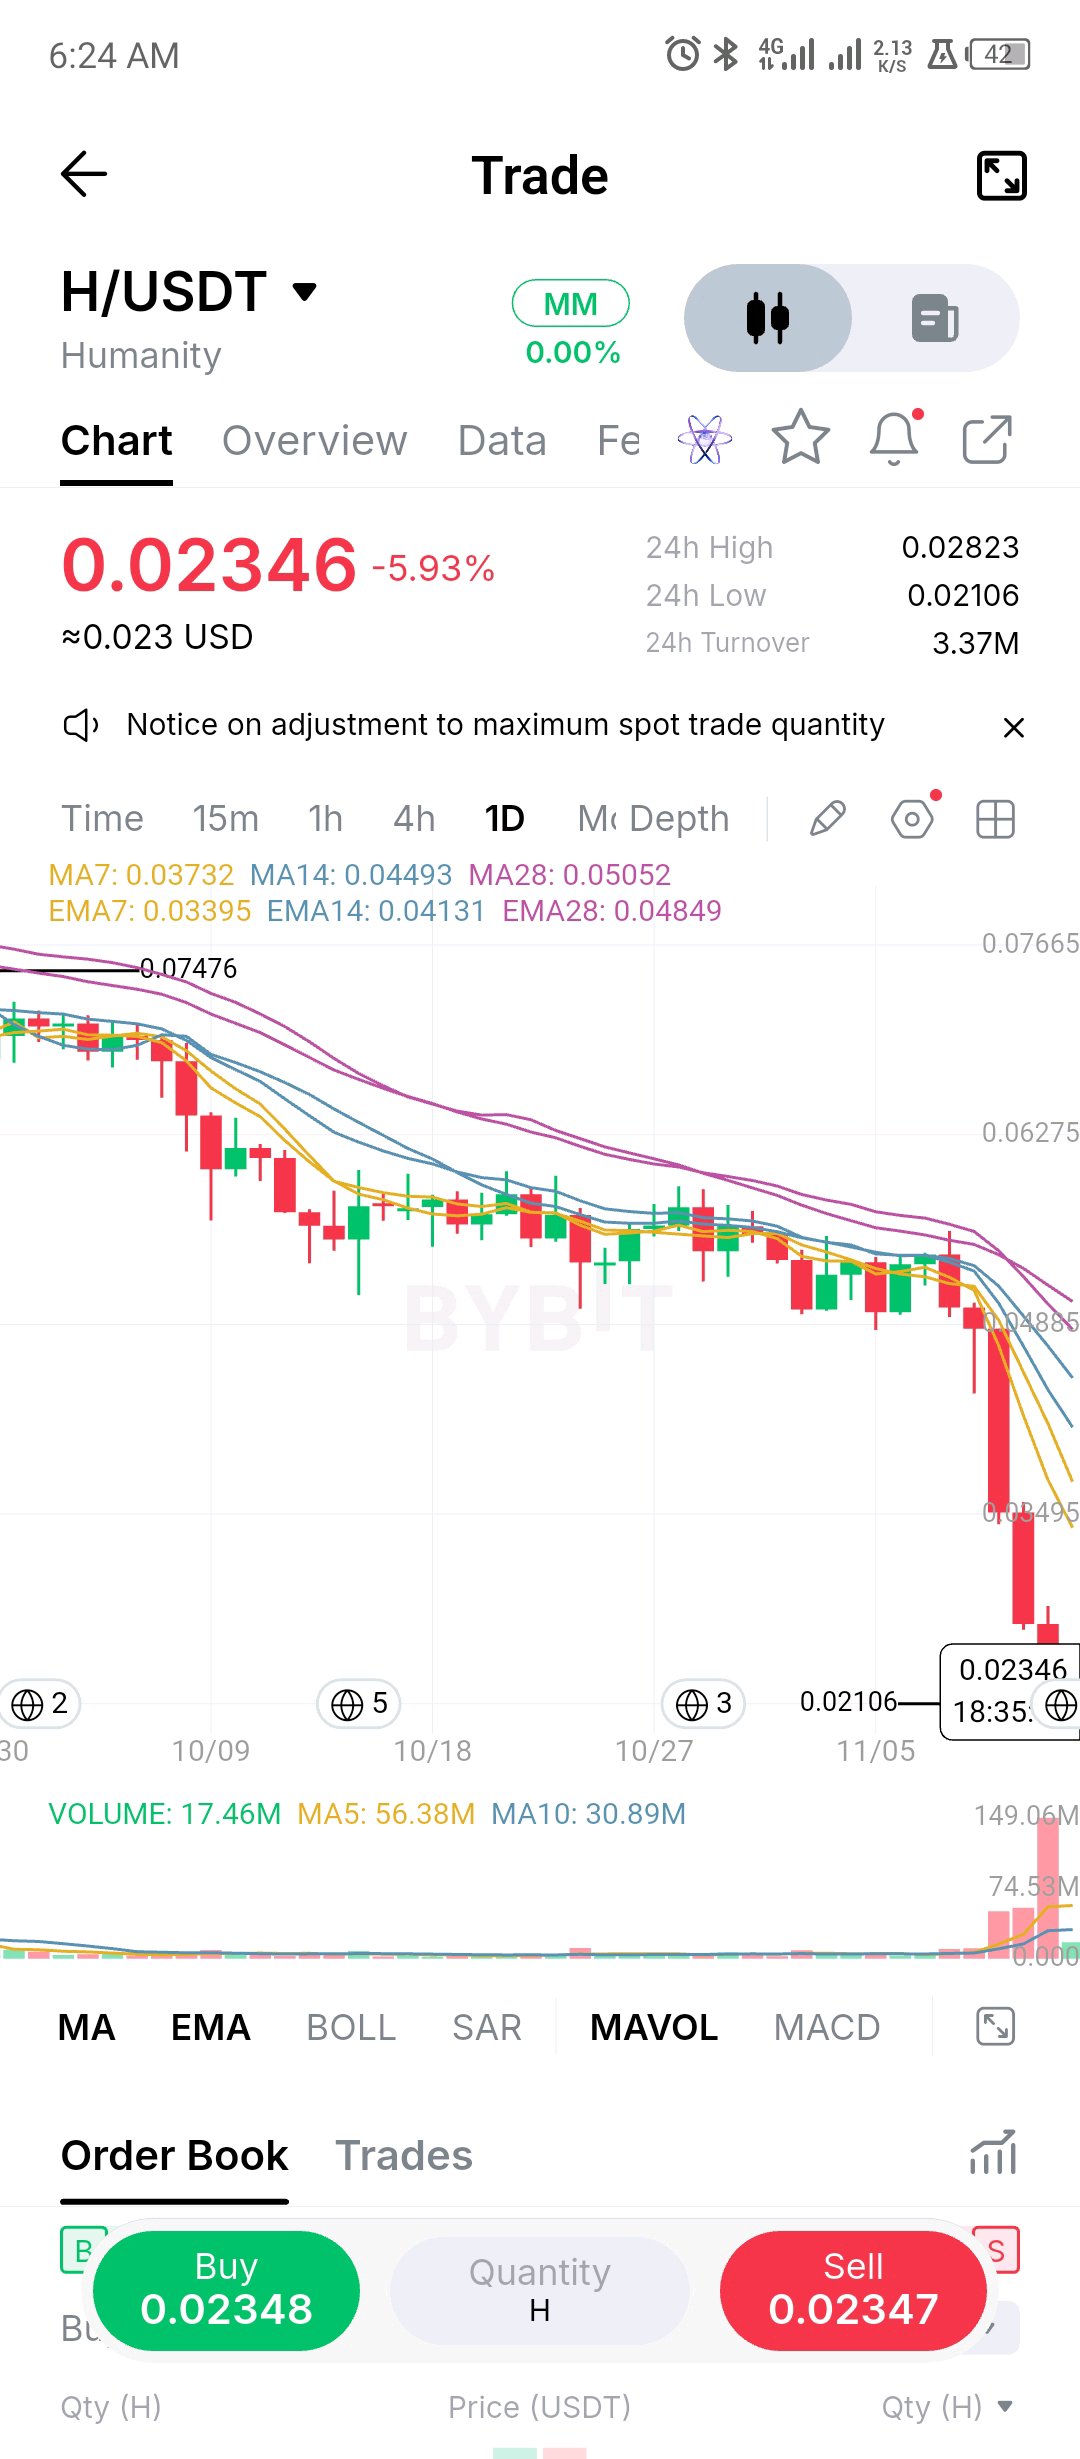
$H has gone from a quiet coil to a waterfall. After weeks in a tight band around 0.050-0.056, with the averages flat and bunched together, price broke down roughly four sessions ago and lost more than half its value in that stretch. That included a day of volume near 150M, more than double the 5 day average. Price is now 0.02346, with a 24h range of 0.02106 to 0.02823, a 34% swing in a single day. That swing is the story. A bounce to 0.0282 got sold into and the market is back near the lows. Price is about 37% under the 7 day MA (0.03732) and 54% under the 28 day (0.05052), which is about as stretched as a chart gets, and the broken range now sits far overhead as supply. Levels: 0.02106 (the low) is the line to watch, with nothing marked beneath it. A reclaim of 0.0282 (the 24h high) would be the first sign buyers can hold a bounce, and the first real resistance after that is the 7 day MA at 0.0373. Waterfalls that look cheap can keep falling. I'd wait for the low to be defended on a closing basis before treating any bounce as more than a squeeze. $HUSDT #ByXIMPACT
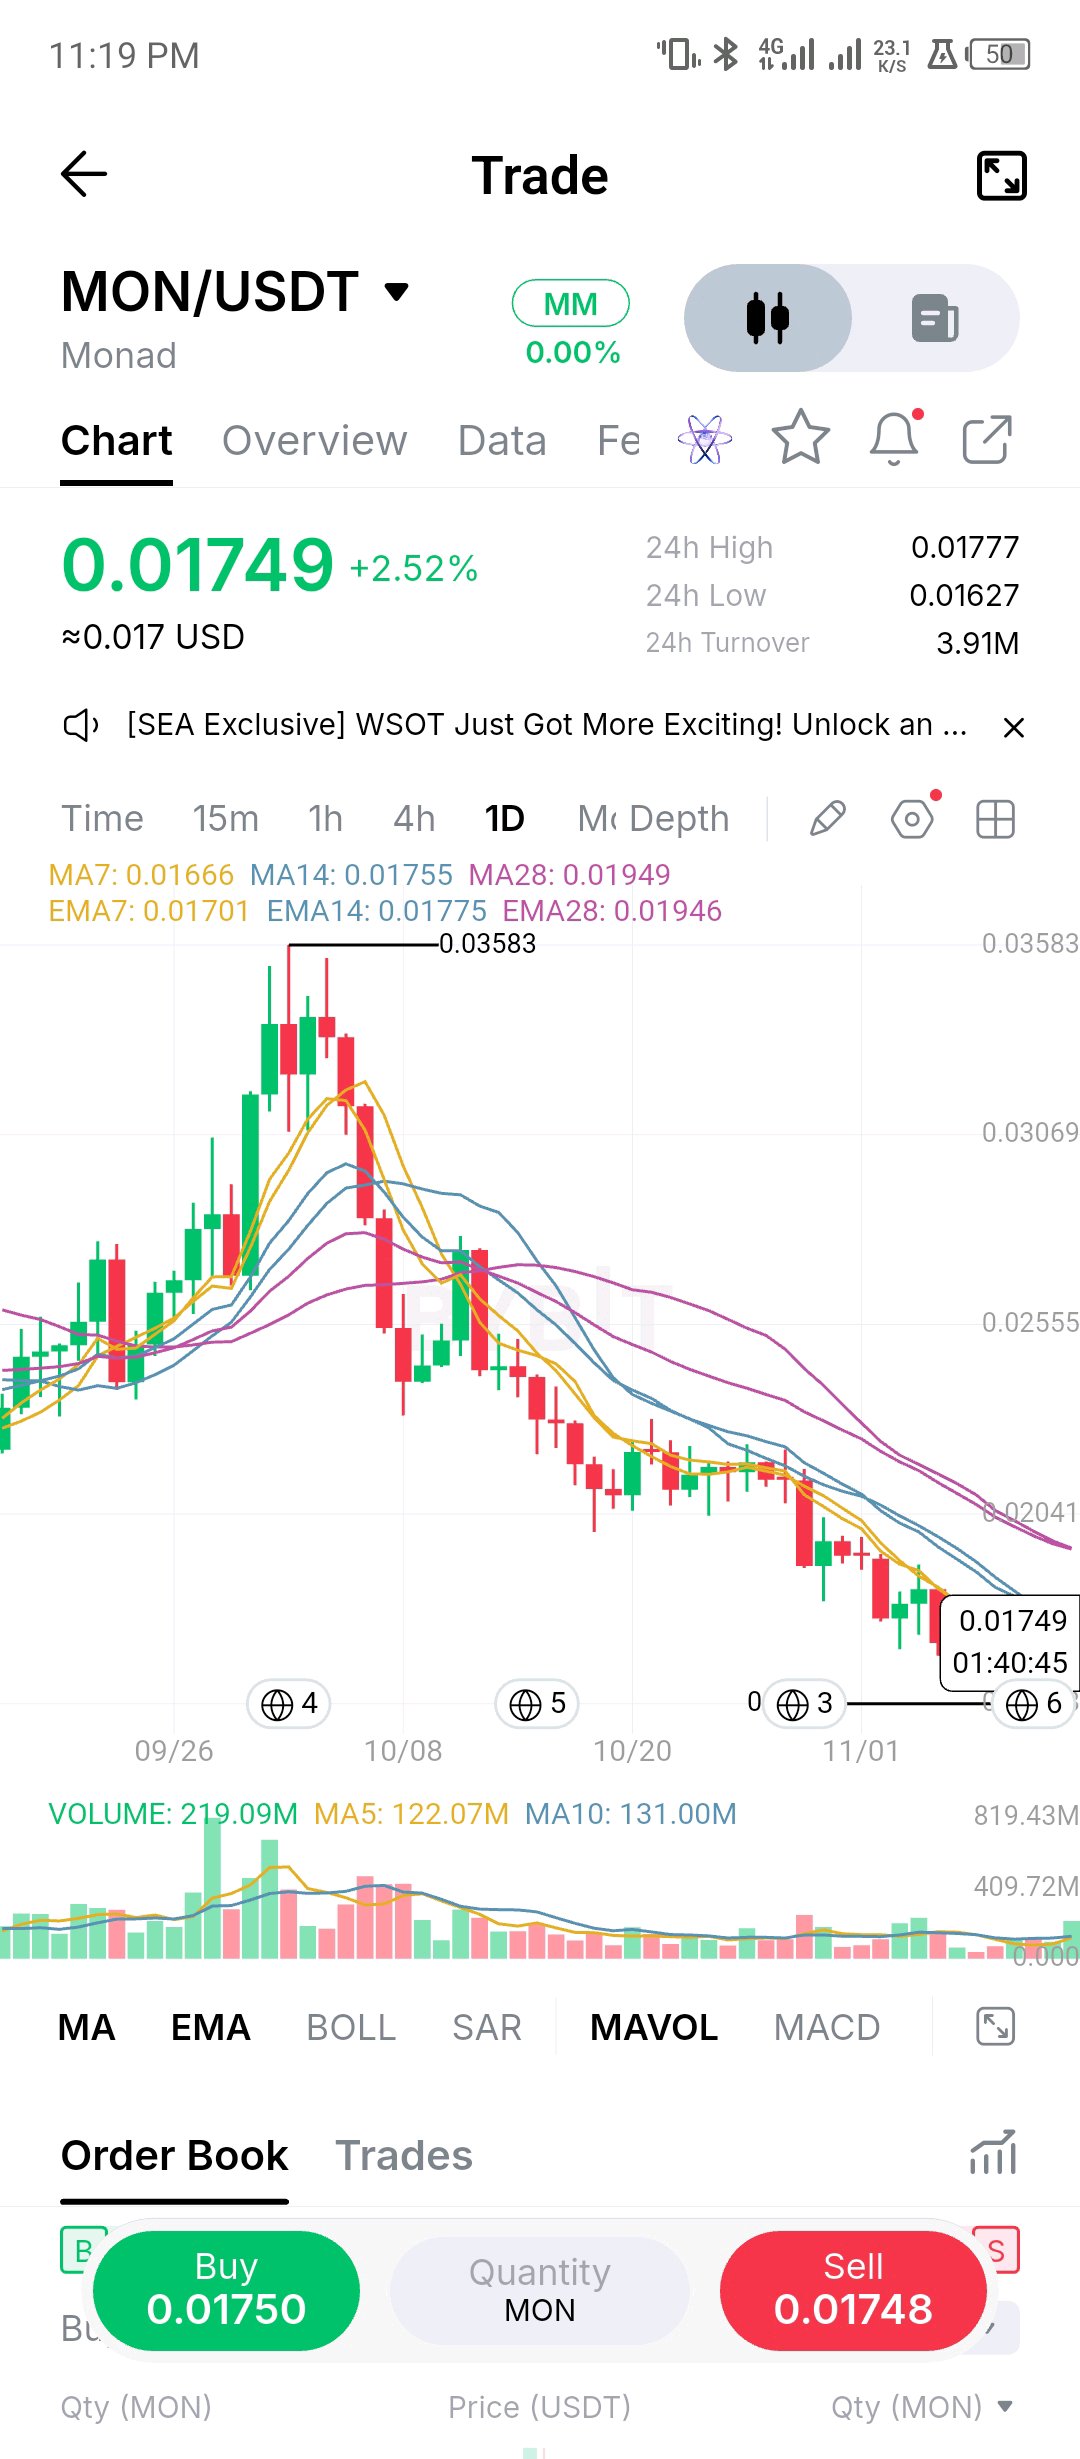
MON/USDT 日足テクニカル展望:短期移動平均線回復、目先のレジスタンスを試す展開 Monad ($MON) は直近のイントラデイ安値 0.01627 を守り、2.52% 上昇の 0.01749 付近で推移しています[span_2](start_span)[span_2](end_span)。価格は 0.03583 のマクロ最高値からの長期的な下落修正を経て、短期的な回復構造の構築を試みています[span_3](start_span)[span_3](end_span)。 主要なテクニカル指標: • 移動平均線・EMAスタック: 価格は短期MA7 (0.01666) とEMA7 (0.01701) を上回る水準まで押し戻しており、直近のMA14 (0.01755) とEMA14 (0.01775) を試しています[span_4](start_span)[span_4](end_span)。中期的なMA28は 0.01949、EMA28は 0.01946 に位置しています[span_5](start_span)[span_5](end_span)。 • ボリューム動向: 日次出来高は 2.1909億 を記録しており、5日ベースライン (1.2207億) および10日平均 (1.3100億) を上回っています[span_6](start_span)[span_6](end_span)。これは反発の背後に活発な買い意欲があることを示唆しています。 • 目先のレンジ境界: 24時間高値の 0.01777 が目先のブレイクアウトの障壁となり、下値支持は安値 0.01627 が防衛ラインとなっています[span_7](start_span)[span_7](end_span)。 執行シナリオ: • 強気派の再奪還: EMA14レジスタンスである 0.01775 を明確に上回って日足が確定すれば、短期的な買いの吸収が確認され、MA28ゾーンである 0.01950 を試す道が開けます[span_8](start_span)[span_8](end_span)。 • 弱気派の無効化: 出来高を伴ってMA7サポートの 0.01666 を割り込んだ場合、短期的な反転シナリオは無効となり、再度 0.01627 の需要フロアが試されることになります[span_9](start_span)[span_9](end_span)。 このMONの短期MA回復を機に0.0195付近までのスイングトレードで買い増ししますか?それとも0.017を超えての確定を待ちますか? $MONUSDT #ByXIMPACT
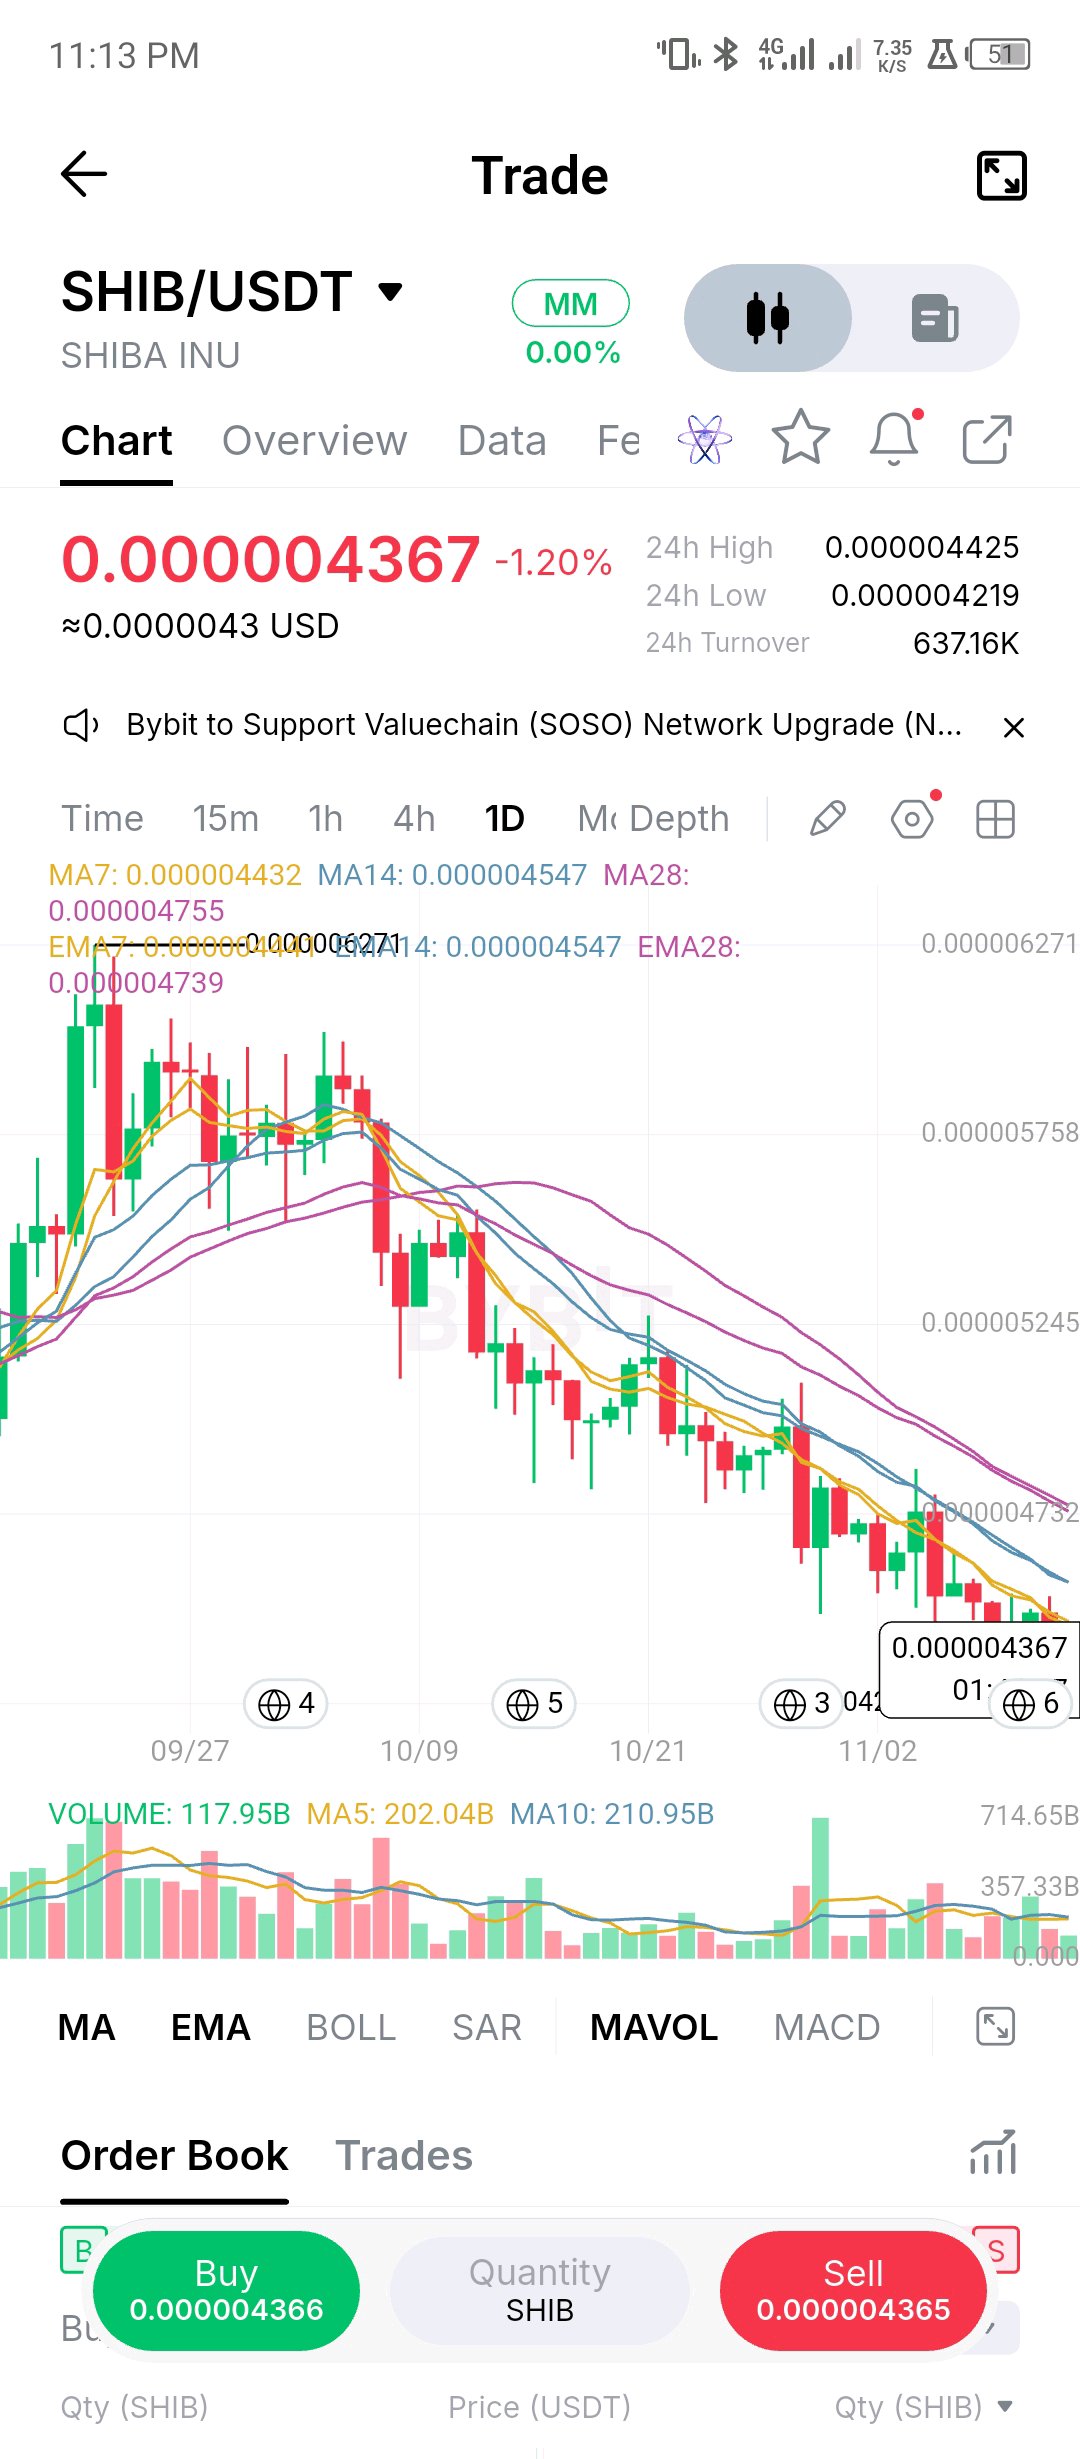
SHIB/USDT 日次テクニカル展望:下降移動平均線の下でローカルサポートを再テスト中 Shiba Inu($SHIB$)は、0.000004219の当日安値のすぐ上で推移しており、-1.20%下落の0.000004367前後で取引されています[span_0](start_span)[span_0](end_span)。価格動向はマクロのスイングハイからの緩やかな下降トレンドを経て調整局面が続いており、ローカルな需要フロアに向けてタイトに収束しています[span_1](start_span)[span_1](end_span)。 主要なテクニカル指標: • 移動平均線のスタック:短期から中期のすべての移動平均線が依然として頭上で弱気な並びとなっており、短期MA7は0.000004432、MA14は0.000004547、MA28は0.000004755となっています[span_2](start_span)[span_2](end_span)。強気派にとっての最初の要件は、MA7を奪還することです[span_3](start_span)[span_3](end_span)。 • 出来高のダイナミクス:日次出来高は1179.5億で、5日ベースライン(2020.4億)および10日移動平均(2109.5億)を下回っており[span_4](start_span)[span_4](end_span)、サポート付近での低ボラティリティな膠着状態を反映しています[span_5](start_span)[span_5](end_span)。 • 直近のレンジ境界:24時間の高値0.000004425が直近の上値抵抗線として機能し、下値の防衛ラインは0.000004219の安値によって支えられています[span_6](start_span)[span_6](end_span)。 執行シナリオ: • リリーフ・リクレイム(反発):0.000004432のMA7レジスタンスを上回って日足が確定すれば、現在の安値圏での買い需要が示唆され、0.000004547のMA14付近を試す展開が開かれます[span_7](start_span)[span_7](end_span)。 • 下値の無効化:0.000004219のサポートフロアを割り込むと、現在のベース形成(蓄積)は無効となり、より広い下降チャネルが継続することになります[span_8](start_span)[span_8](end_span)。 皆さんは、0.0000045へのリリーフバウンス(反発)を狙ってこの0.0000043の需要ゾーンで買い注文を入れていますか?それともMA7ラインの確実な奪還を待っていますか? $SHIBUSDT #ByXIMPACT
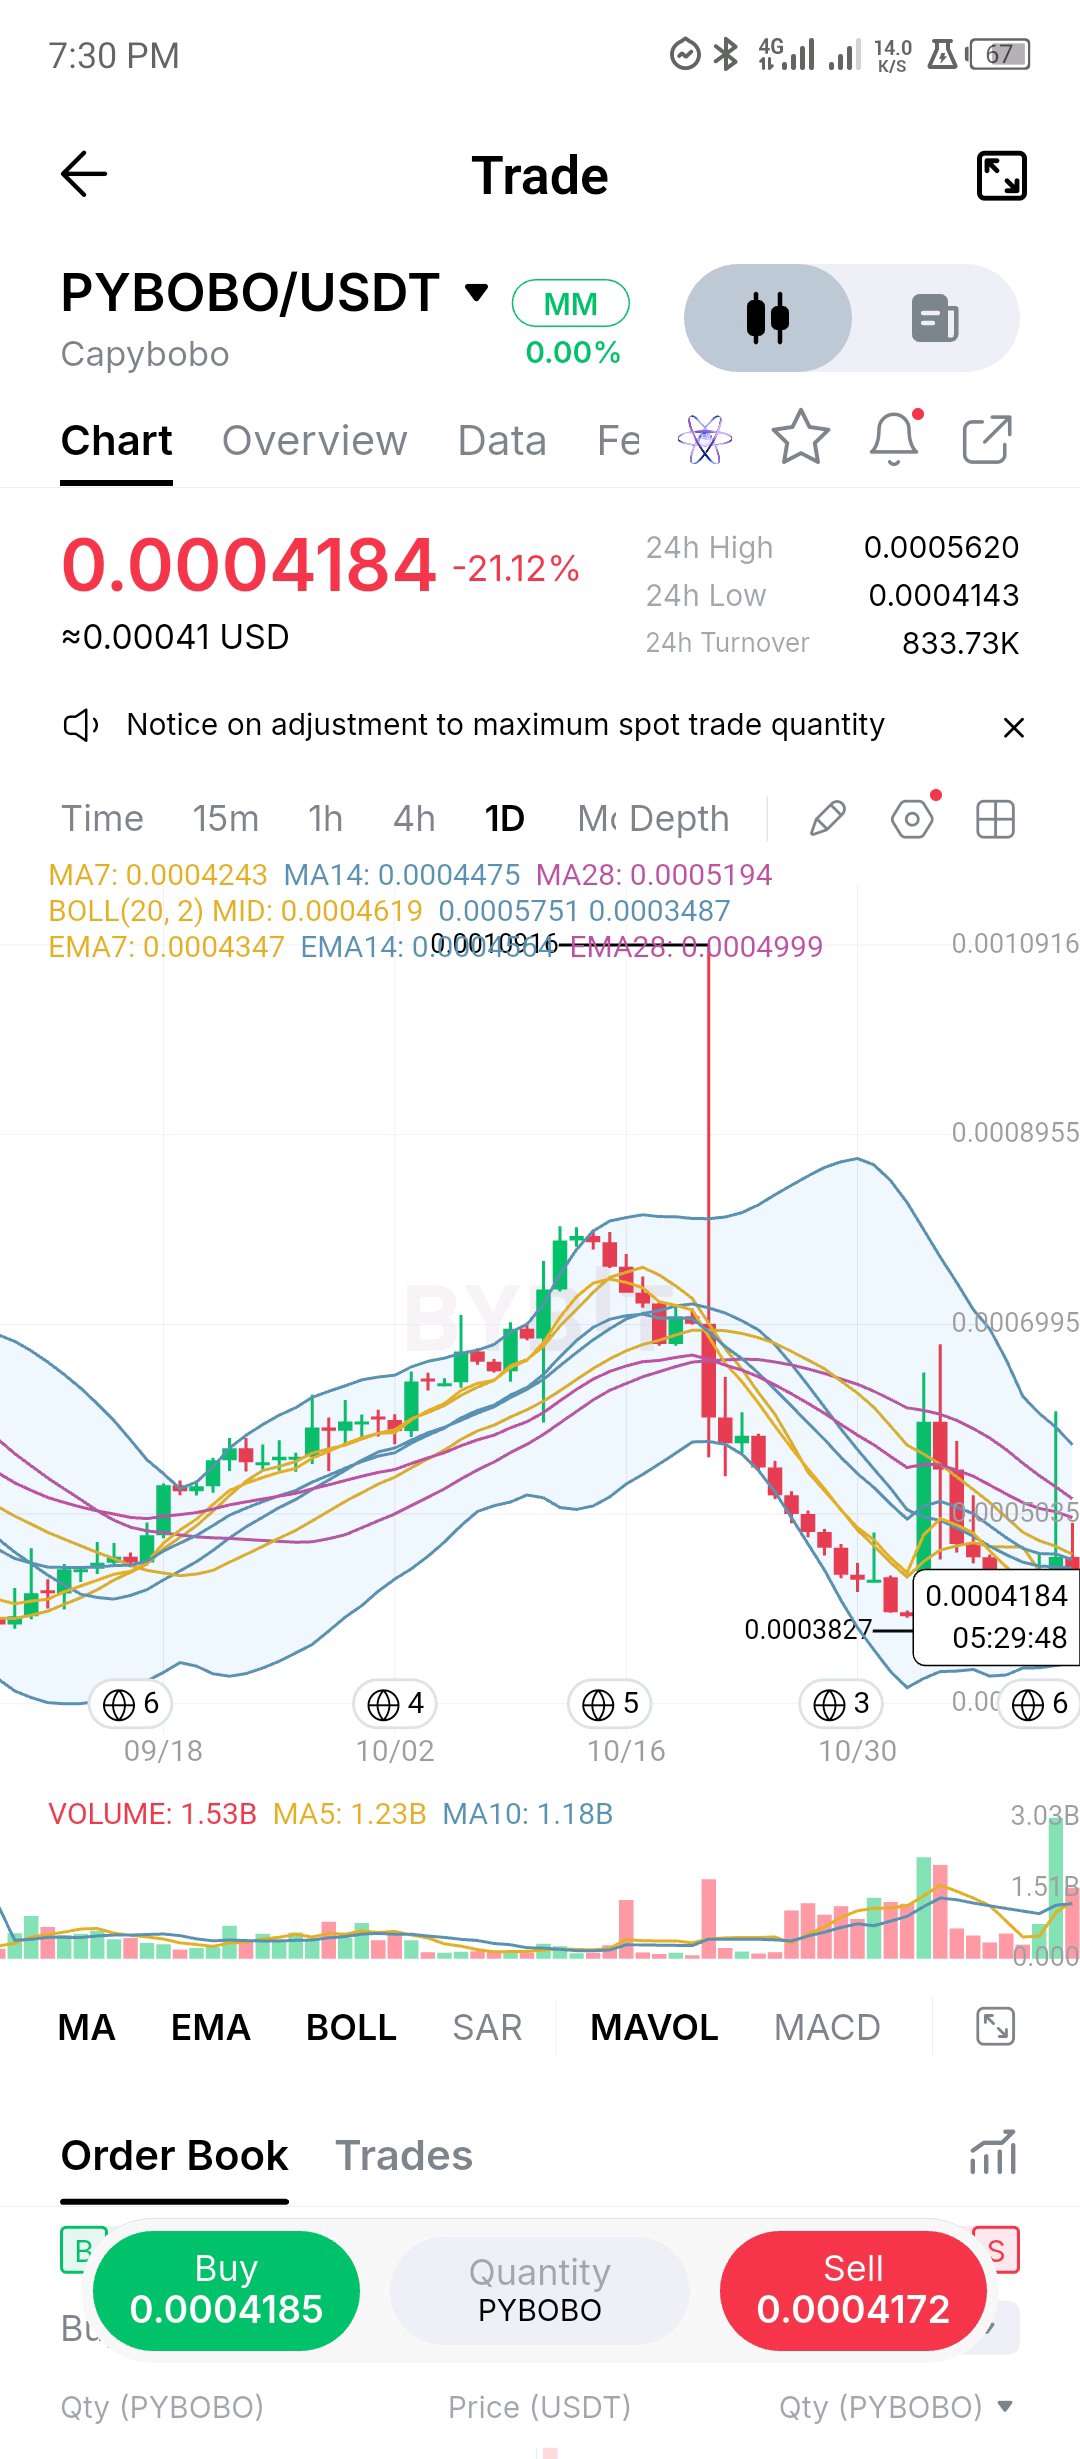
$PYBOBO/USDT Daily Technical Outlook: Testing Lower Bollinger Support Amid Sharp Volatility Contraction Capybobo ($PYBOBO$) is trading down -21.12% around 0.0004184, hovering just above its 0.0004143 intraday low[span_0](start_span)[span_0](end_span). Price action is compressing tightly near the lower Bollinger Band boundary (0.0003487), reflecting heavy selling pressure following the recent rejection from its macro highs[span_1](start_span)[span_1](end_span). Core Technical Metrics: • Moving Average & EMA Stack: Short-to-medium term moving averages are aligned bearishly overhead, with the fast MA7 at 0.0004243, MA14 at 0.0004475, and MA28 at 0.0005194[span_2](start_span)[span_2](end_span). Exponential moving averages mirror this structure with EMA7 at 0.0004347 and EMA14 at 0.0004746[span_3](start_span)[span_3](end_span). • Bollinger Bands (20, 2): The midline rests at 0.0004619 while the upper band sits at 0.0005751[span_4](start_span)[span_4](end_span), showing an expanding volatility channel as price hugs the lower support envelope[span_5](start_span)[span_5](end_span). • Volume & Range Boundaries: Daily volume reads 1.53B, remaining above the 5-day baseline (1.23B) and 10-day average (1.18B)[span_6](start_span)[span_6](end_span), indicating active volume absorption at current lows. The 24h high stands at 0.0005620[span_7](start_span)[span_7](end_span). Execution Scenarios: • Relief Reclaim: A decisive daily close back above the 0.0004243 MA7 resistance signals potential buyer absorption, opening a path toward testing the 0.0004619 Bollinger midline[span_8](start_span)[span_8](end_span). • Downside Invalidation: A breakdown below the 0.0003827 structural floor[span_9](start_span)[span_9](end_span) invalidates the current Bollinger band support defense and extends the broader downside channel. Are you bidding this lower Bollinger Band support for a mean-reversion bounce toward 0.00046, or waiting for a confirmed reclaim of the MA7 line[span_10](start_span)[span_10](end_span)? Share your trading plan below! $PYBOBOUSDT #ByXIMPACT
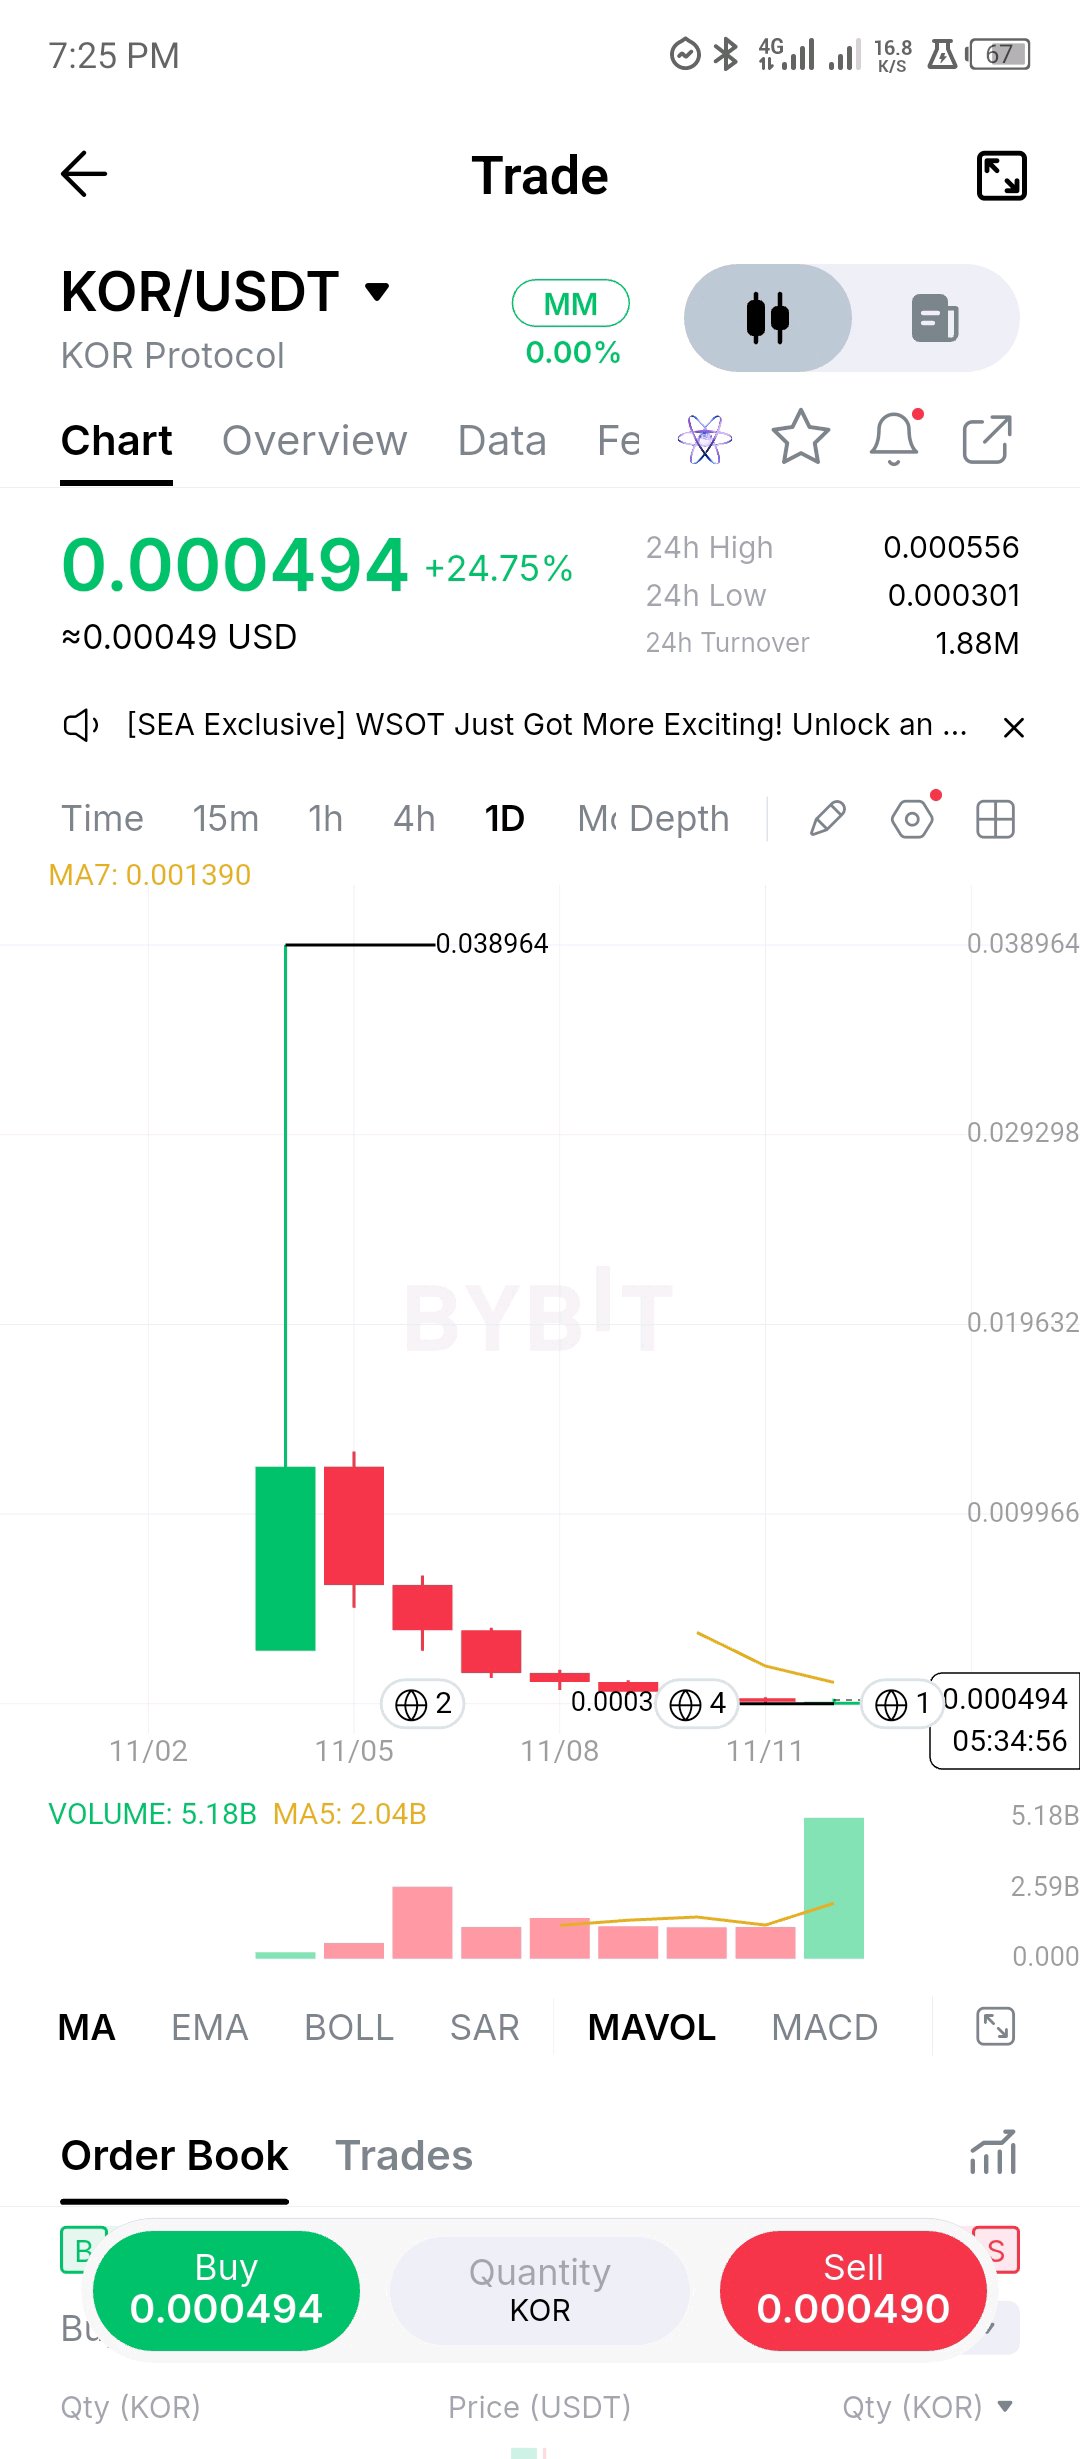
$KOR did what the low needed it to do: it held 0.000301 and bounced. Price is now 0.000494, about 64% above that low, and today's candle is the first green daily candle since listing day, on volume of 5.2B that is already 2.5x the 5 day average with a quarter of the day left, the heaviest bar on the chart. That's a real change in behavior after a week of nothing but red candles, but context matters. Price is still roughly 96% below the first-day close, and the 7 day MA (0.00139) sits almost 3x above price, so this recovery has to be judged against the recent range, not the listing spike. Levels: 0.000556 (the 24h high) is the first test, and a close above it would extend the bounce. Support is 0.000301, then nothing marked. If volume stays elevated on the next candle while the low holds, that's the beginning of a floor. If it fades, today is a squeeze in a market that still has no structure. Thin and new: small size or watching only. $KORUSDT #ByXIMPACT
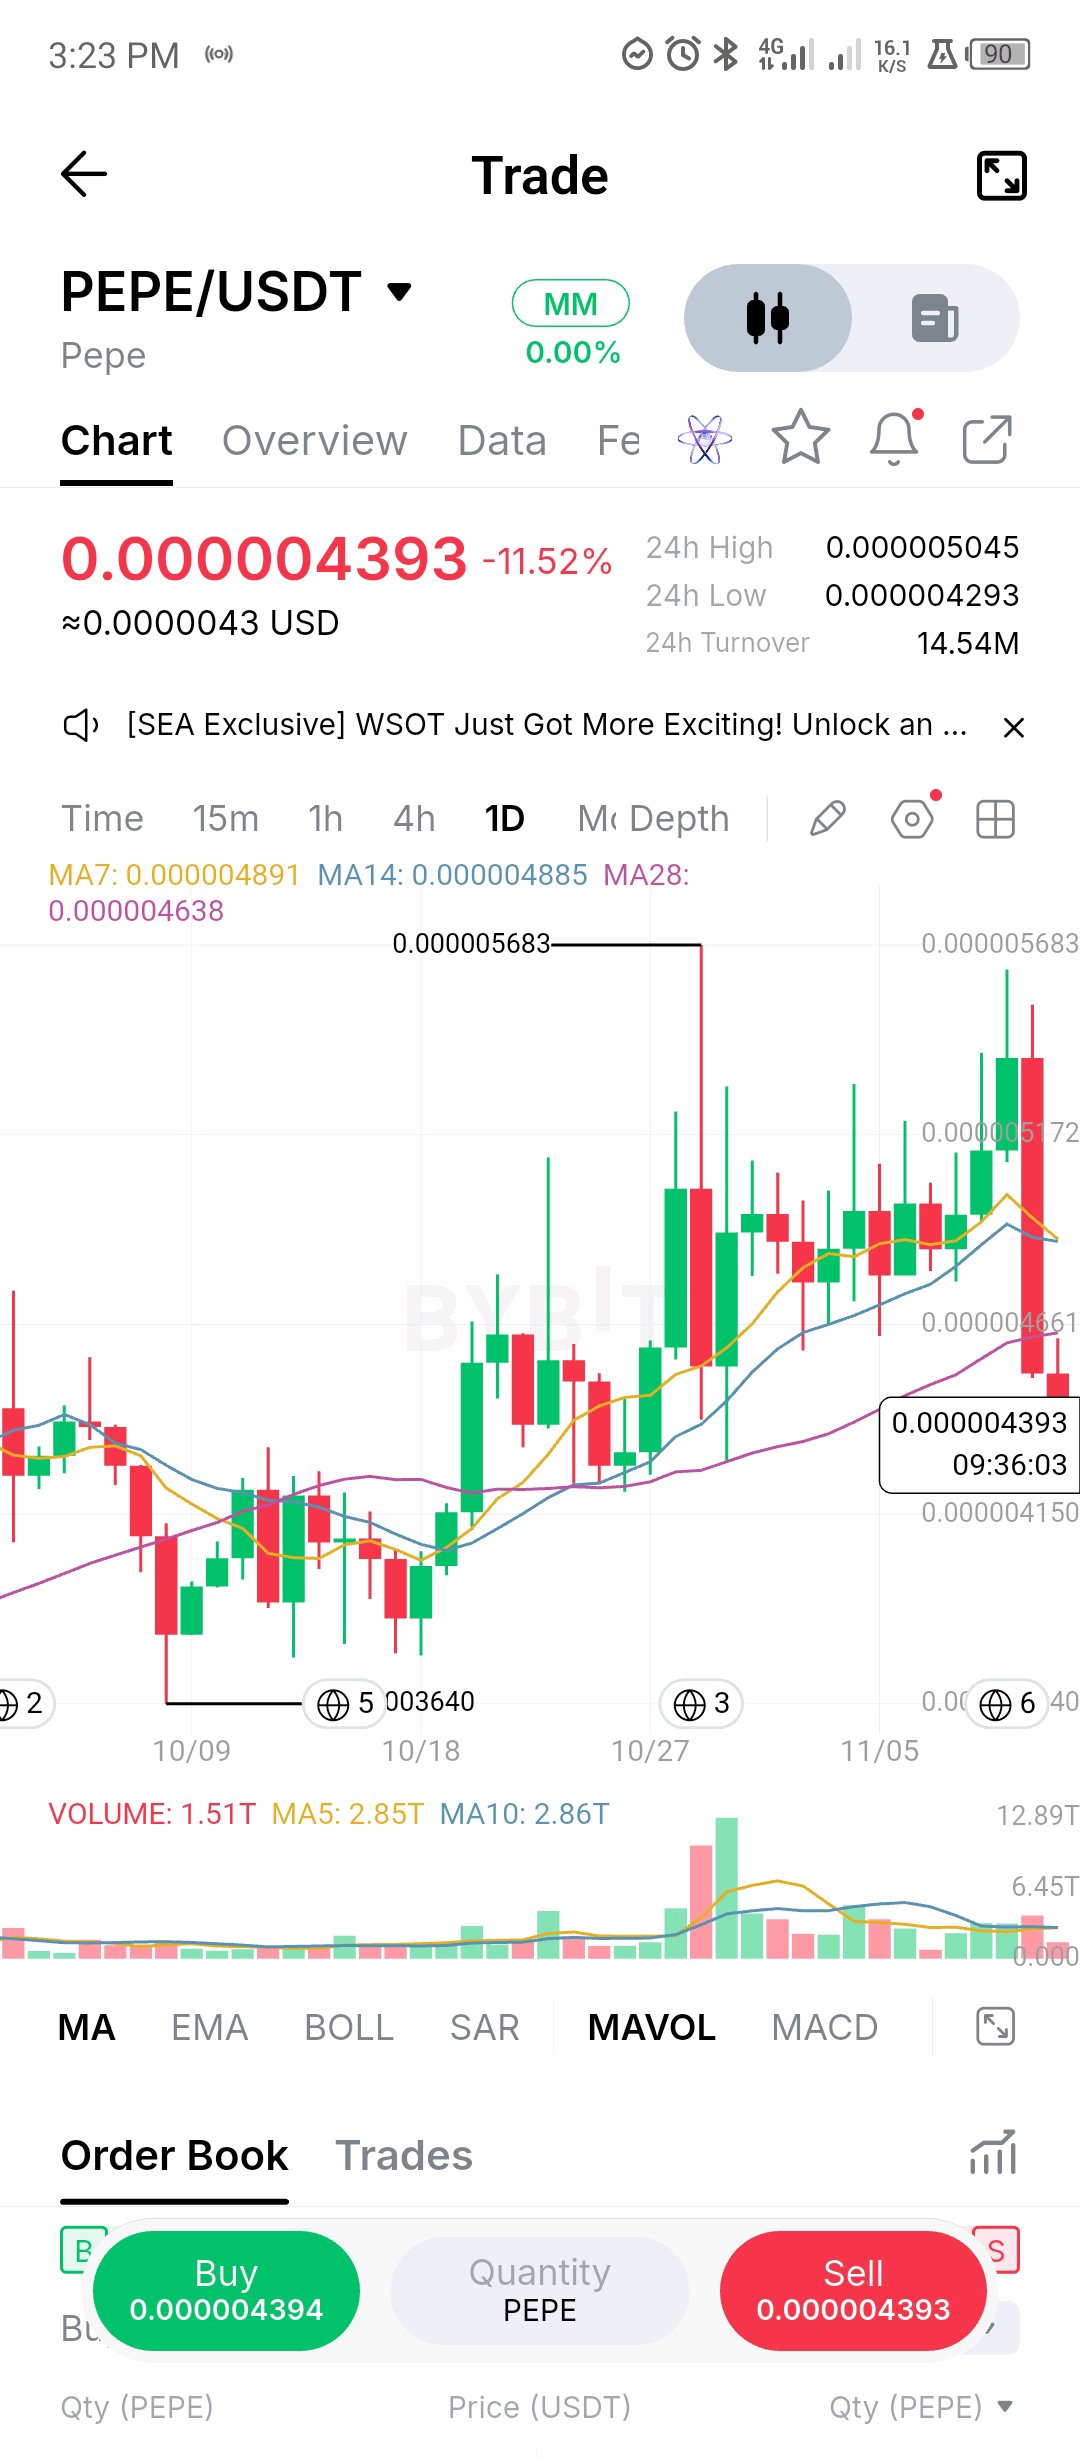
PEPE ($PEPE):上昇の勢いが失速。これはリセットか、それともさらなる調整の始まりか? PEPEは最近、$0.000003640の領域から興味深い回復を見せ、最終的に$0.000005683付近まで押し上げました。この動きは買い手を引きつけ、日足チャートの構造を一時的に改善させました。 しかし、最新の値動きは勢いが変化していることを示唆しています。 現在の取引価格は$0.000004393付近で、過去24時間のセッションでは11.52%の下落となっています。さらに重要なことに、直近の高値からの反落により、価格は3つの移動平均線すべてを割り込みました。 注目すべき点は以下の通りです: - MA7:$0.000004891 - MA14:$0.000004885 - MA28:$0.000004638 短期的な平均線が現在価格を上回っており、より長期の平均線も上値抵抗線として機能しています。これにより、最近の回復局面は圧力を受けています。 私が注視しているレベル: $0.000004293が直近のサポート基準であり、これは24時間の安値と一致しています。このレベルを明確に割り込むと、市場はさらなる下落局面にさらされる可能性があります。 一方で、買い手はまず$0.000004638を奪還する必要があります。$0.000004885から$0.000004891の領域を安定して上回る動きがあれば、勢いが回復しているというより強力な証拠となるでしょう。 出来高はこのセットアップに別の側面を加えています。現在の表示出来高は1.51Tで、MA5およびMA10の平均であるそれぞれ2.85Tおよび2.86Tに対して低調です。それらの平均と比較して市場参加は比較的落ち着いているため、確信を持てる回復にはより強い需要が必要です。 私が最も関心を持っているのは、サポートライン周辺の挙動です。 前回の上昇局面では、買い手が低価格帯で積極的に参加する姿勢を示しました。現在の下落局面は、その需要がより大きな蓄積フェーズの始まりであったのか、それとも単なる一時的な戻り相場であったのかを試すことになるでしょう。 現時点でどちらの方向への反転が確定したと呼ぶ準備はできていません。サポートラインをうまく防衛し、その後移動平均線を奪還できれば、状況は変わる可能性があります。直近の安値を維持できなければ、弱気シナリオが中心となるでしょう。 PEPEはその上昇局面で多くの注目を集めてきましたが、次に意味のあるシグナルは、この調整局面をどのように処理するかによってもたらされる可能性があります。 私たちは力強い回復後の健全なプルバックを見ているのか、それともPEPEは次の下落局面に向けて準備しているのか? $PEPEUSDT #ByXIMPACT
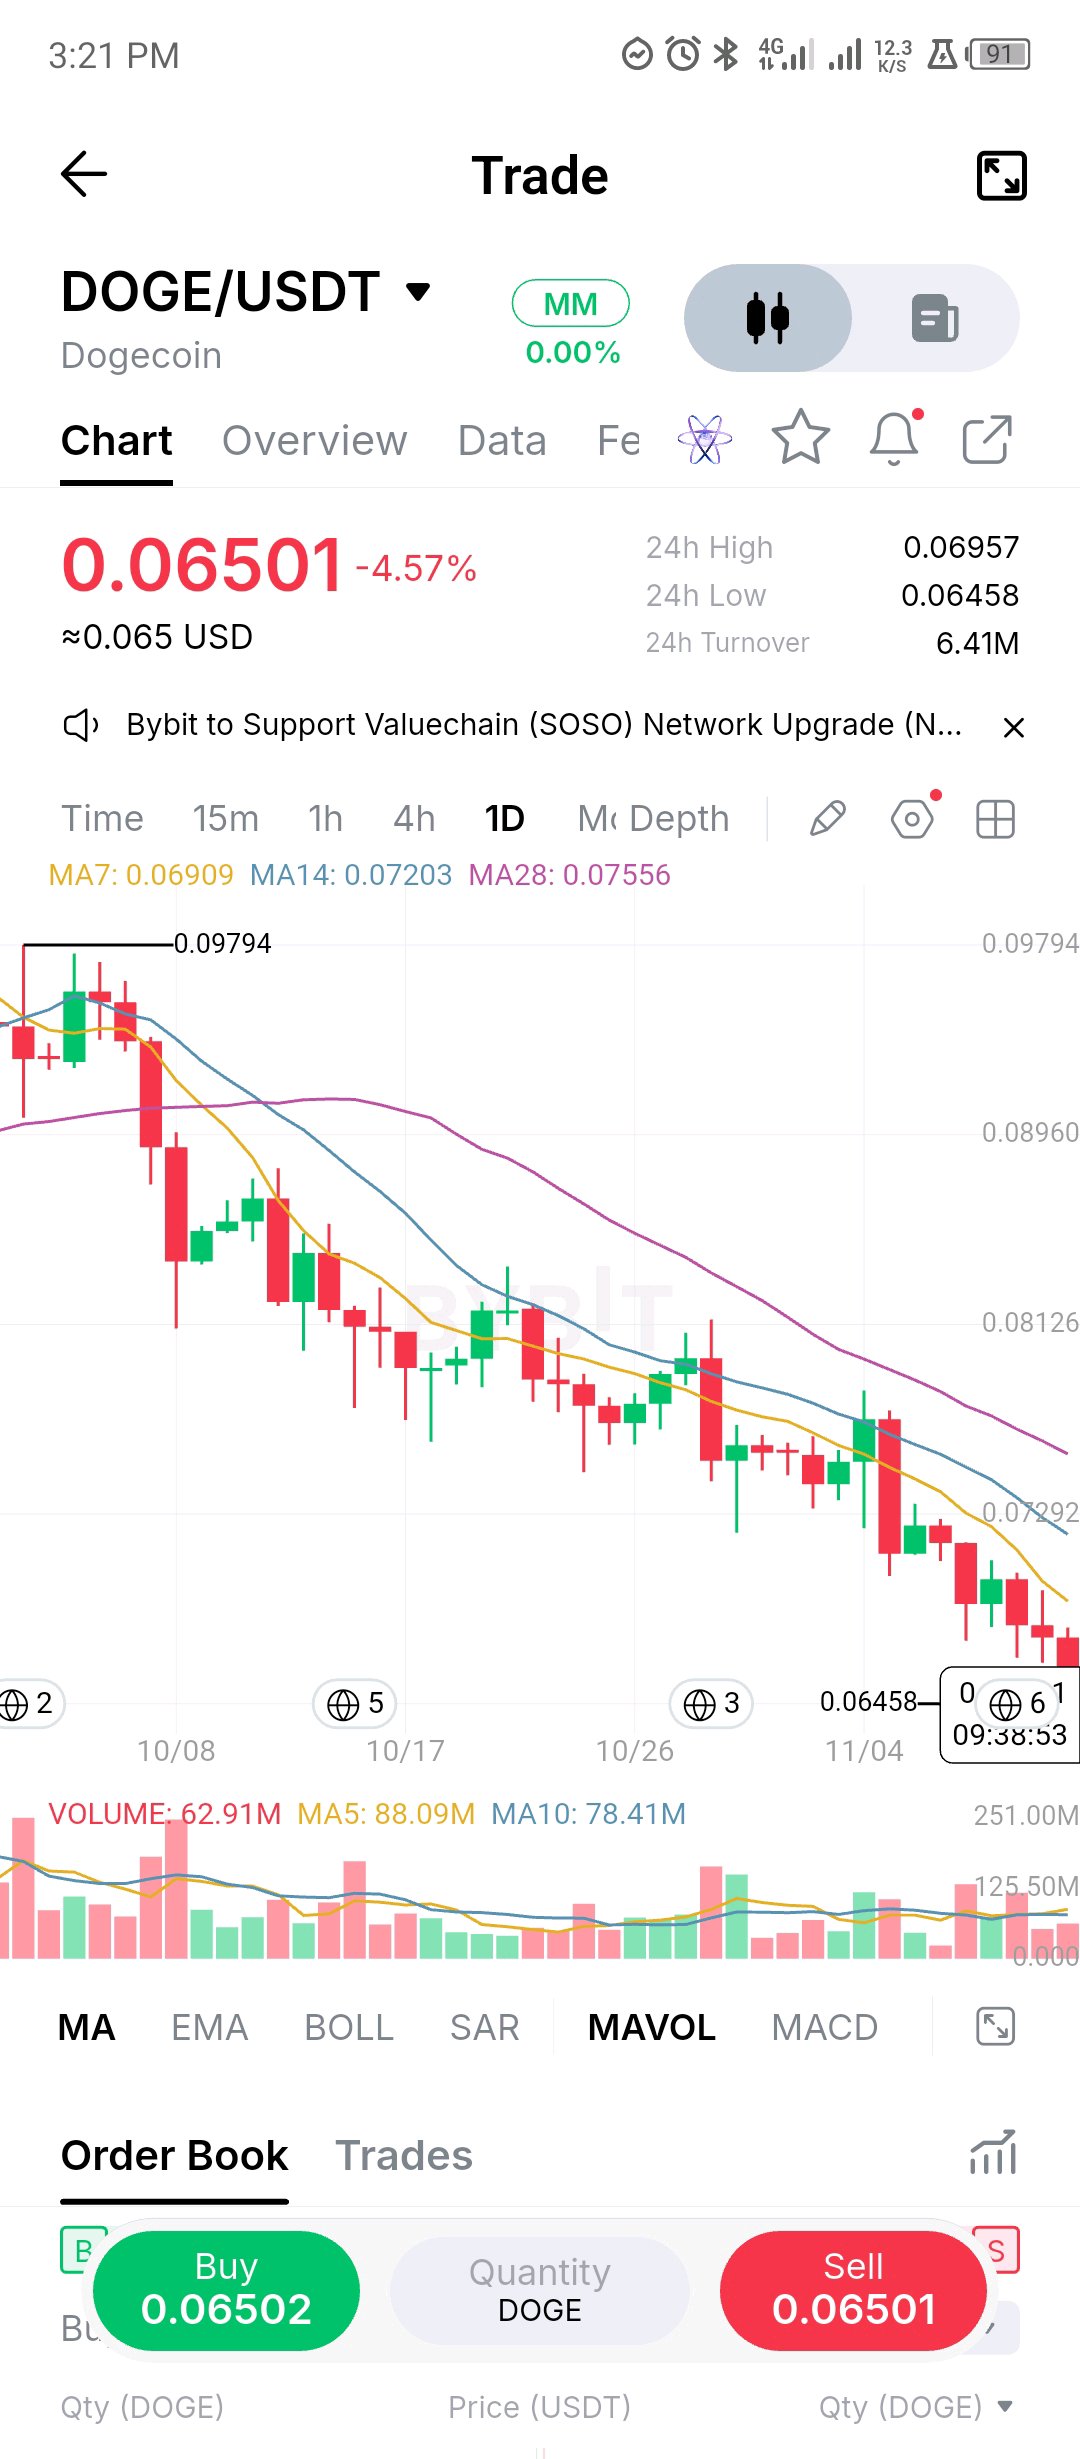
DOGECOIN ($DOGE): Selling Pressure Is Building, But Watch the Floor. Dogecoin started as an internet-inspired cryptocurrency but has evolved into one of the most recognized community-driven digital assets. Beyond its meme identity, DOGE operates as a peer-to-peer payment network using Scrypt Proof-of-Work. Its monetary model is particularly interesting: miners receive a fixed 10,000 DOGE for every block, with new blocks targeted approximately every minute. This creates continuous issuance rather than a fixed maximum supply. That supply mechanism is worth remembering when evaluating DOGE's long-term market dynamics. But right now, the daily chart is telling a much more immediate story. DOGE is trading around $0.06501, down 4.57% in the displayed 24-hour session. More importantly, the broader price structure continues to deteriorate. Since the rejection around $0.09794, the market has repeatedly printed lower highs and lower lows. Attempts to recover have struggled to produce sustained upside momentum. The moving averages reinforce this weakness: - MA7: $0.06909 - MA14: $0.07203 - MA28: $0.07556 All three remain above the current price and are sloping downward. This suggests that sellers still have structural control, while any short-term bounce may encounter resistance. The battle around $0.06458 is particularly important. This is the recent low visible on the chart and the immediate level I'm watching. A decisive daily breakdown could open the door to further downside exploration. However, if buyers defend this area and push DOGE back above $0.0690, the first indication of improving momentum would emerge. A stronger recovery would require reclaiming $0.0720 and eventually challenging the longer moving average. Volume currently sits at 62.91M, below both its displayed MA5 and MA10 averages. That makes a convincing reversal harder to establish without renewed participation. My take: DOGE doesn't need another aggressive bounce to prove itself; it needs to demonstrate that sellers are losing control. Until price reclaims important resistance levels, treating every green candle as a reversal could be premature. I'm watching the reaction around $0.06458 closely. That response may reveal whether the market is preparing to stabilize or whether downside pressure still has room to run. Is DOGE approaching a potential accumulation zone, or are buyers still waiting for a deeper correction? $DOGEUSDT #ByXIMPACT
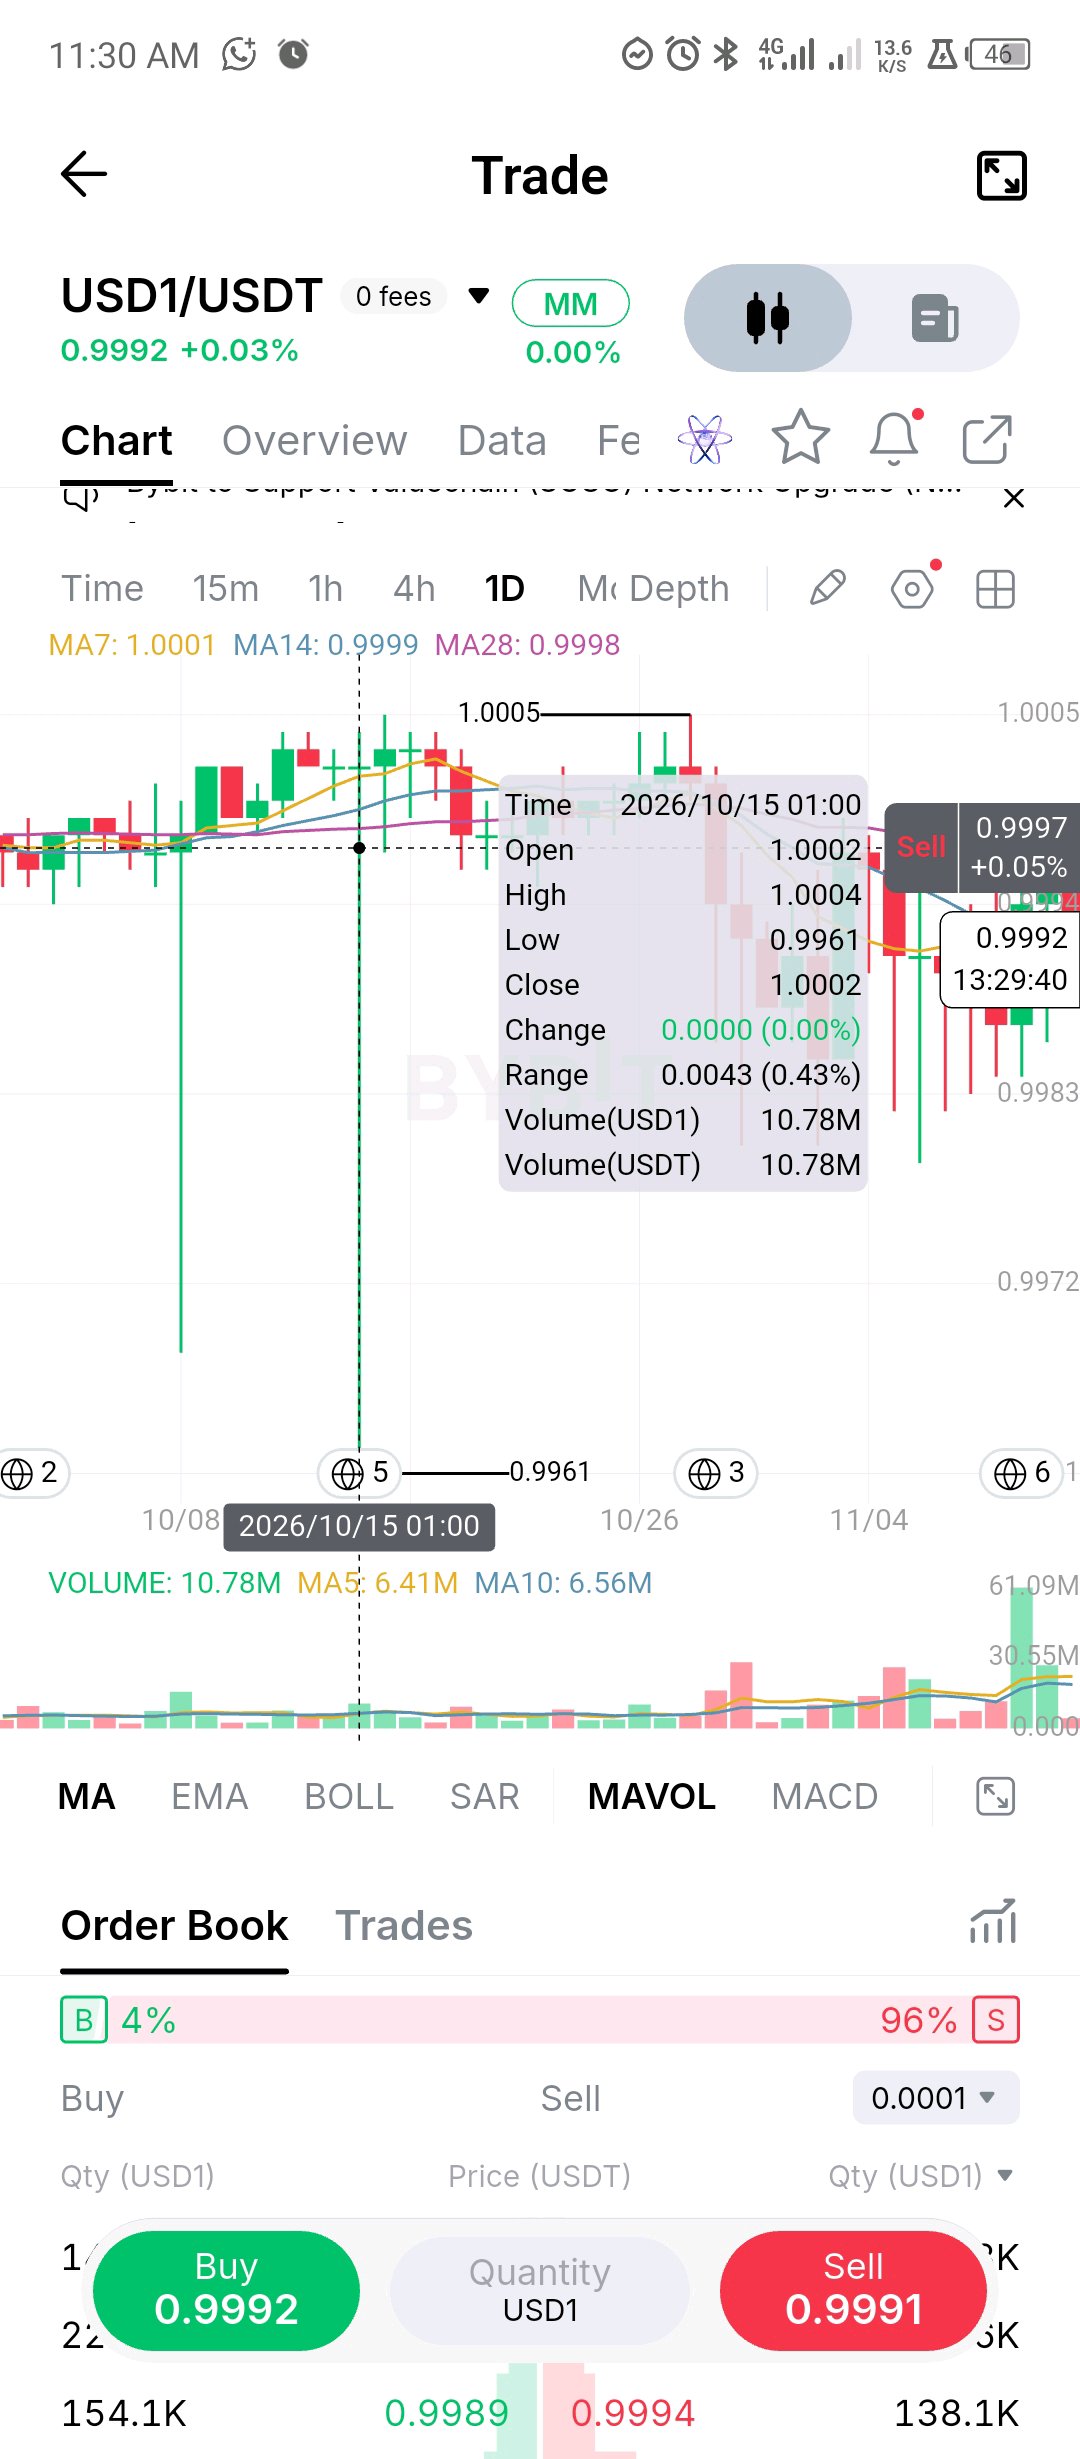
$USD1/USDT Daily Technical Outlook: Tight Peg Compression Amid Skewed Order Flow USD1 is trading at 0.9992 (+0.03%) on the daily timeframe, holding tightly near its parity peg. Price action continues to coil within a narrow range between the 0.9961 structural floor and the 1.0005 macro peak, reflecting stable arbitrage and consistent order execution. Core Technical Metrics: • Moving Average Convergence: Short and medium-term moving averages are compressed tightly around parity (MA7 at 1.0001 | MA14 at 0.9999 | MA28 at 0.9998), signaling a flat trend baseline typical of stable valuation bands. • Order Book Sentiment: The immediate order flow ratio shows a heavy ask-side skew (4% Buy vs 96% Sell pressure), highlighting an active sell wall right above current trading levels. • Volume & Range Boundaries: Daily volume shows localized spikes, with immediate overhead resistance anchored at the 1.0005 high and downside cushioning near the 0.9961 baseline. Execution & Market Context: For a stablecoin pair like USD1, this range compression points to steady peg maintenance rather than directional expansion. Monitoring brief wicks outside the 0.9961 – 1.0005 range helps identify transient liquidity shifts. How are you utilizing stablecoin pairs during choppy market phases? Let's discuss below! $USD1USDT #ByXIMPACT
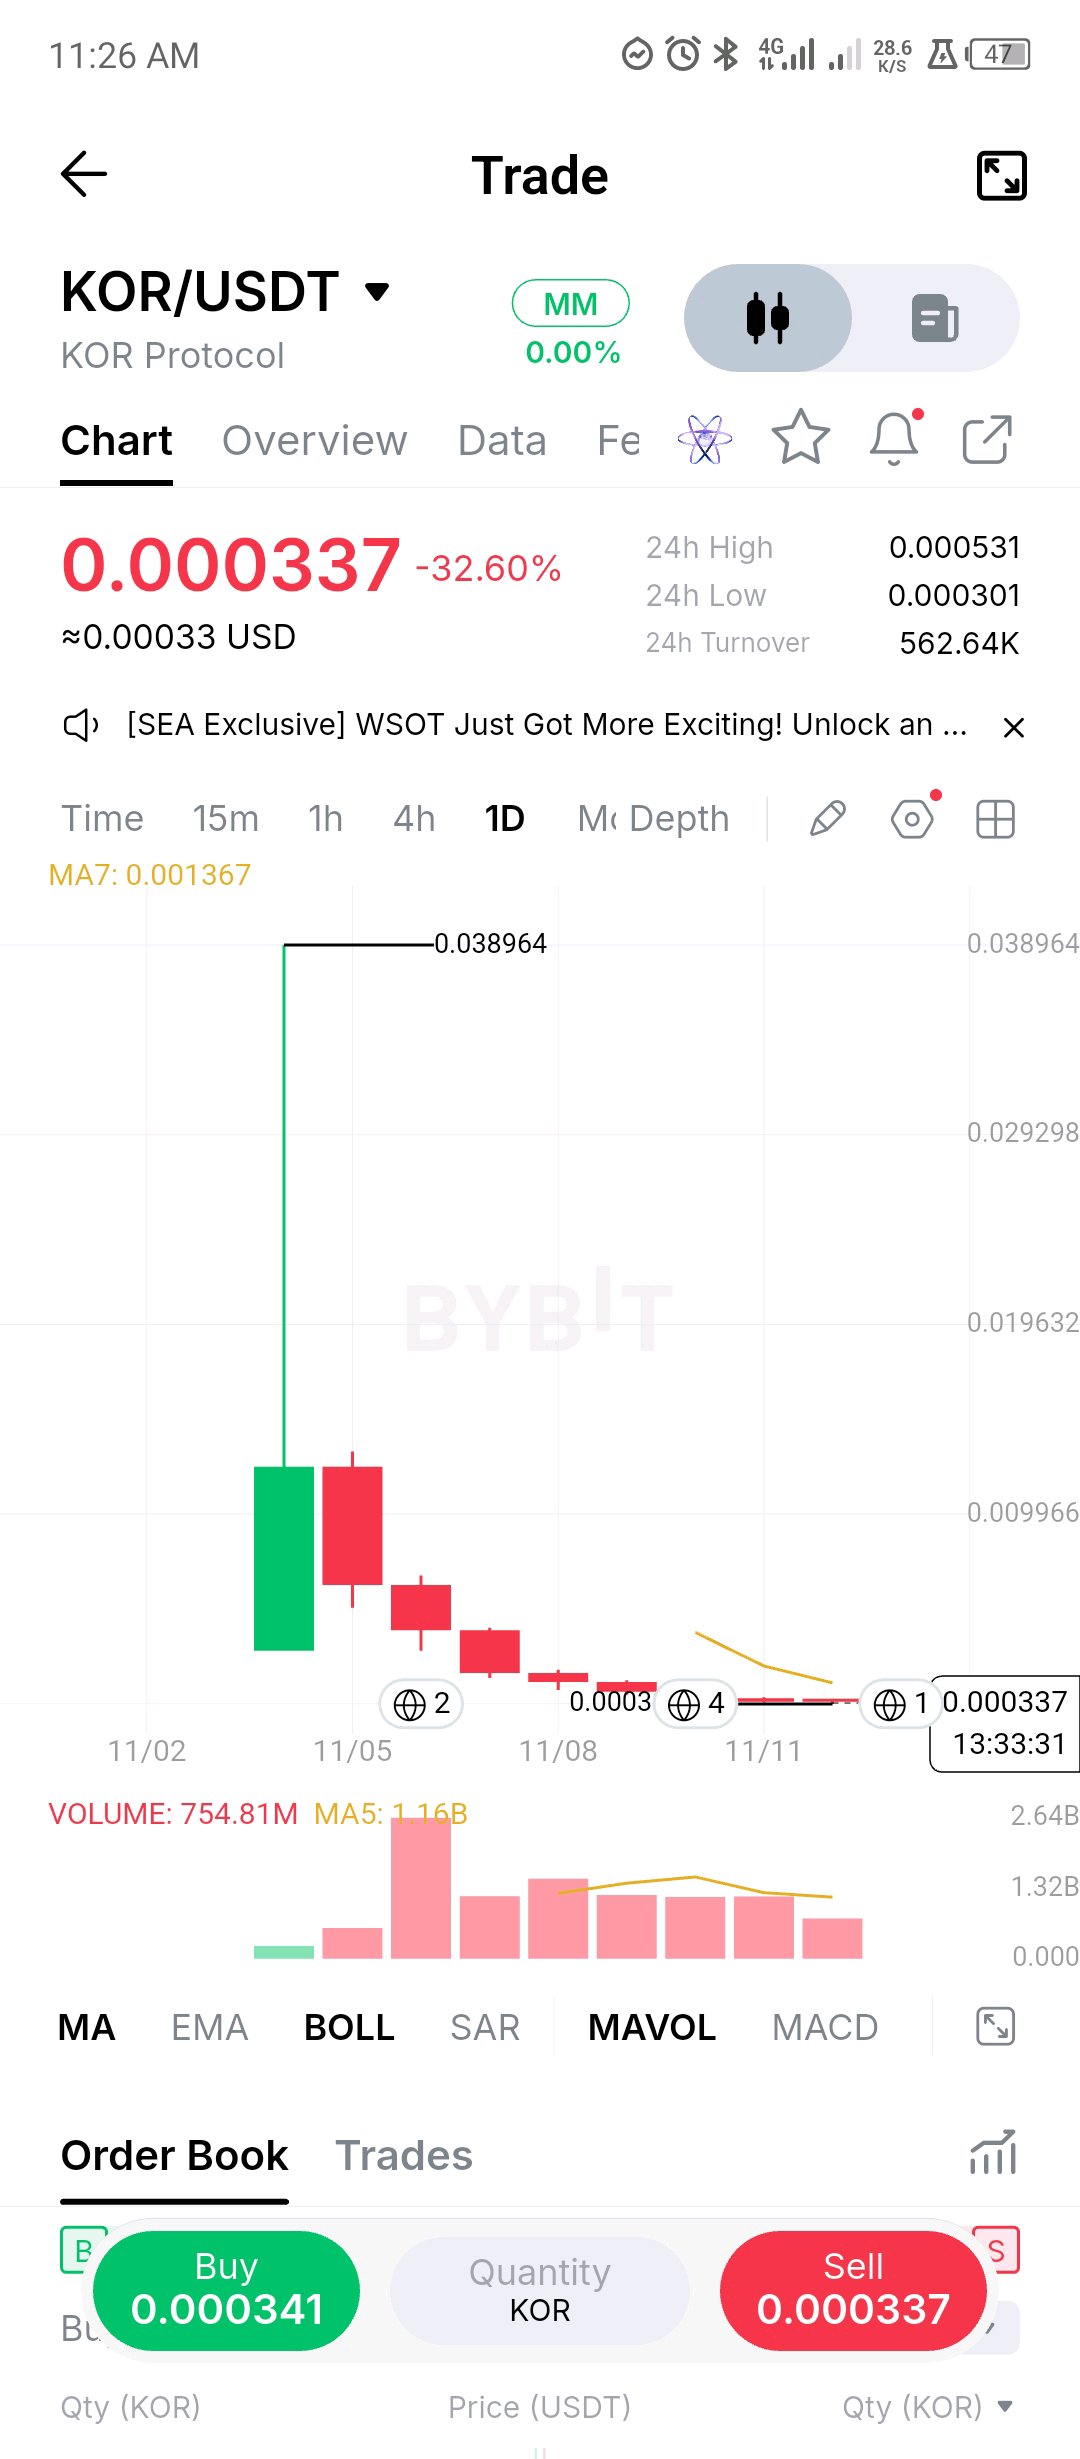
$KOR is a case study in what price discovery looks like after a new listing. The first session printed a spike to 0.038964 and closed around 0.012, and a week later it trades at 0.000337. That's roughly 97% below that first close, and down 33% in the last 24 hours alone, with a 24h range of 0.000301 to 0.000531. There's no chart structure to trade yet. No base, no higher lows, and every daily candle since the first has been red. Volume peaked a few sessions ago and has faded since, which could be the first sign of exhaustion, but price hasn't confirmed it. What I'd watch is 0.000301. If that low holds on a couple of daily closes with falling volume, price discovery may be finding a floor. If it doesn't, there's nothing marked below it on this chart. For anyone tempted by a 97% discount: that's a function of the first day's price, not of value. New listings can keep falling long after they look cheap, so size accordingly or just watch. $KORUSDT #ByXIMPACT