MuzammilWeb3
7793いいね0シェア97ファン21フォロー
🚀 Crypto Signals for Byx Traders | Trade Smart, Profit Smart 💰
🚀 Crypto Signals for Byx Traders | Trade Smart, Profit Smart 💰
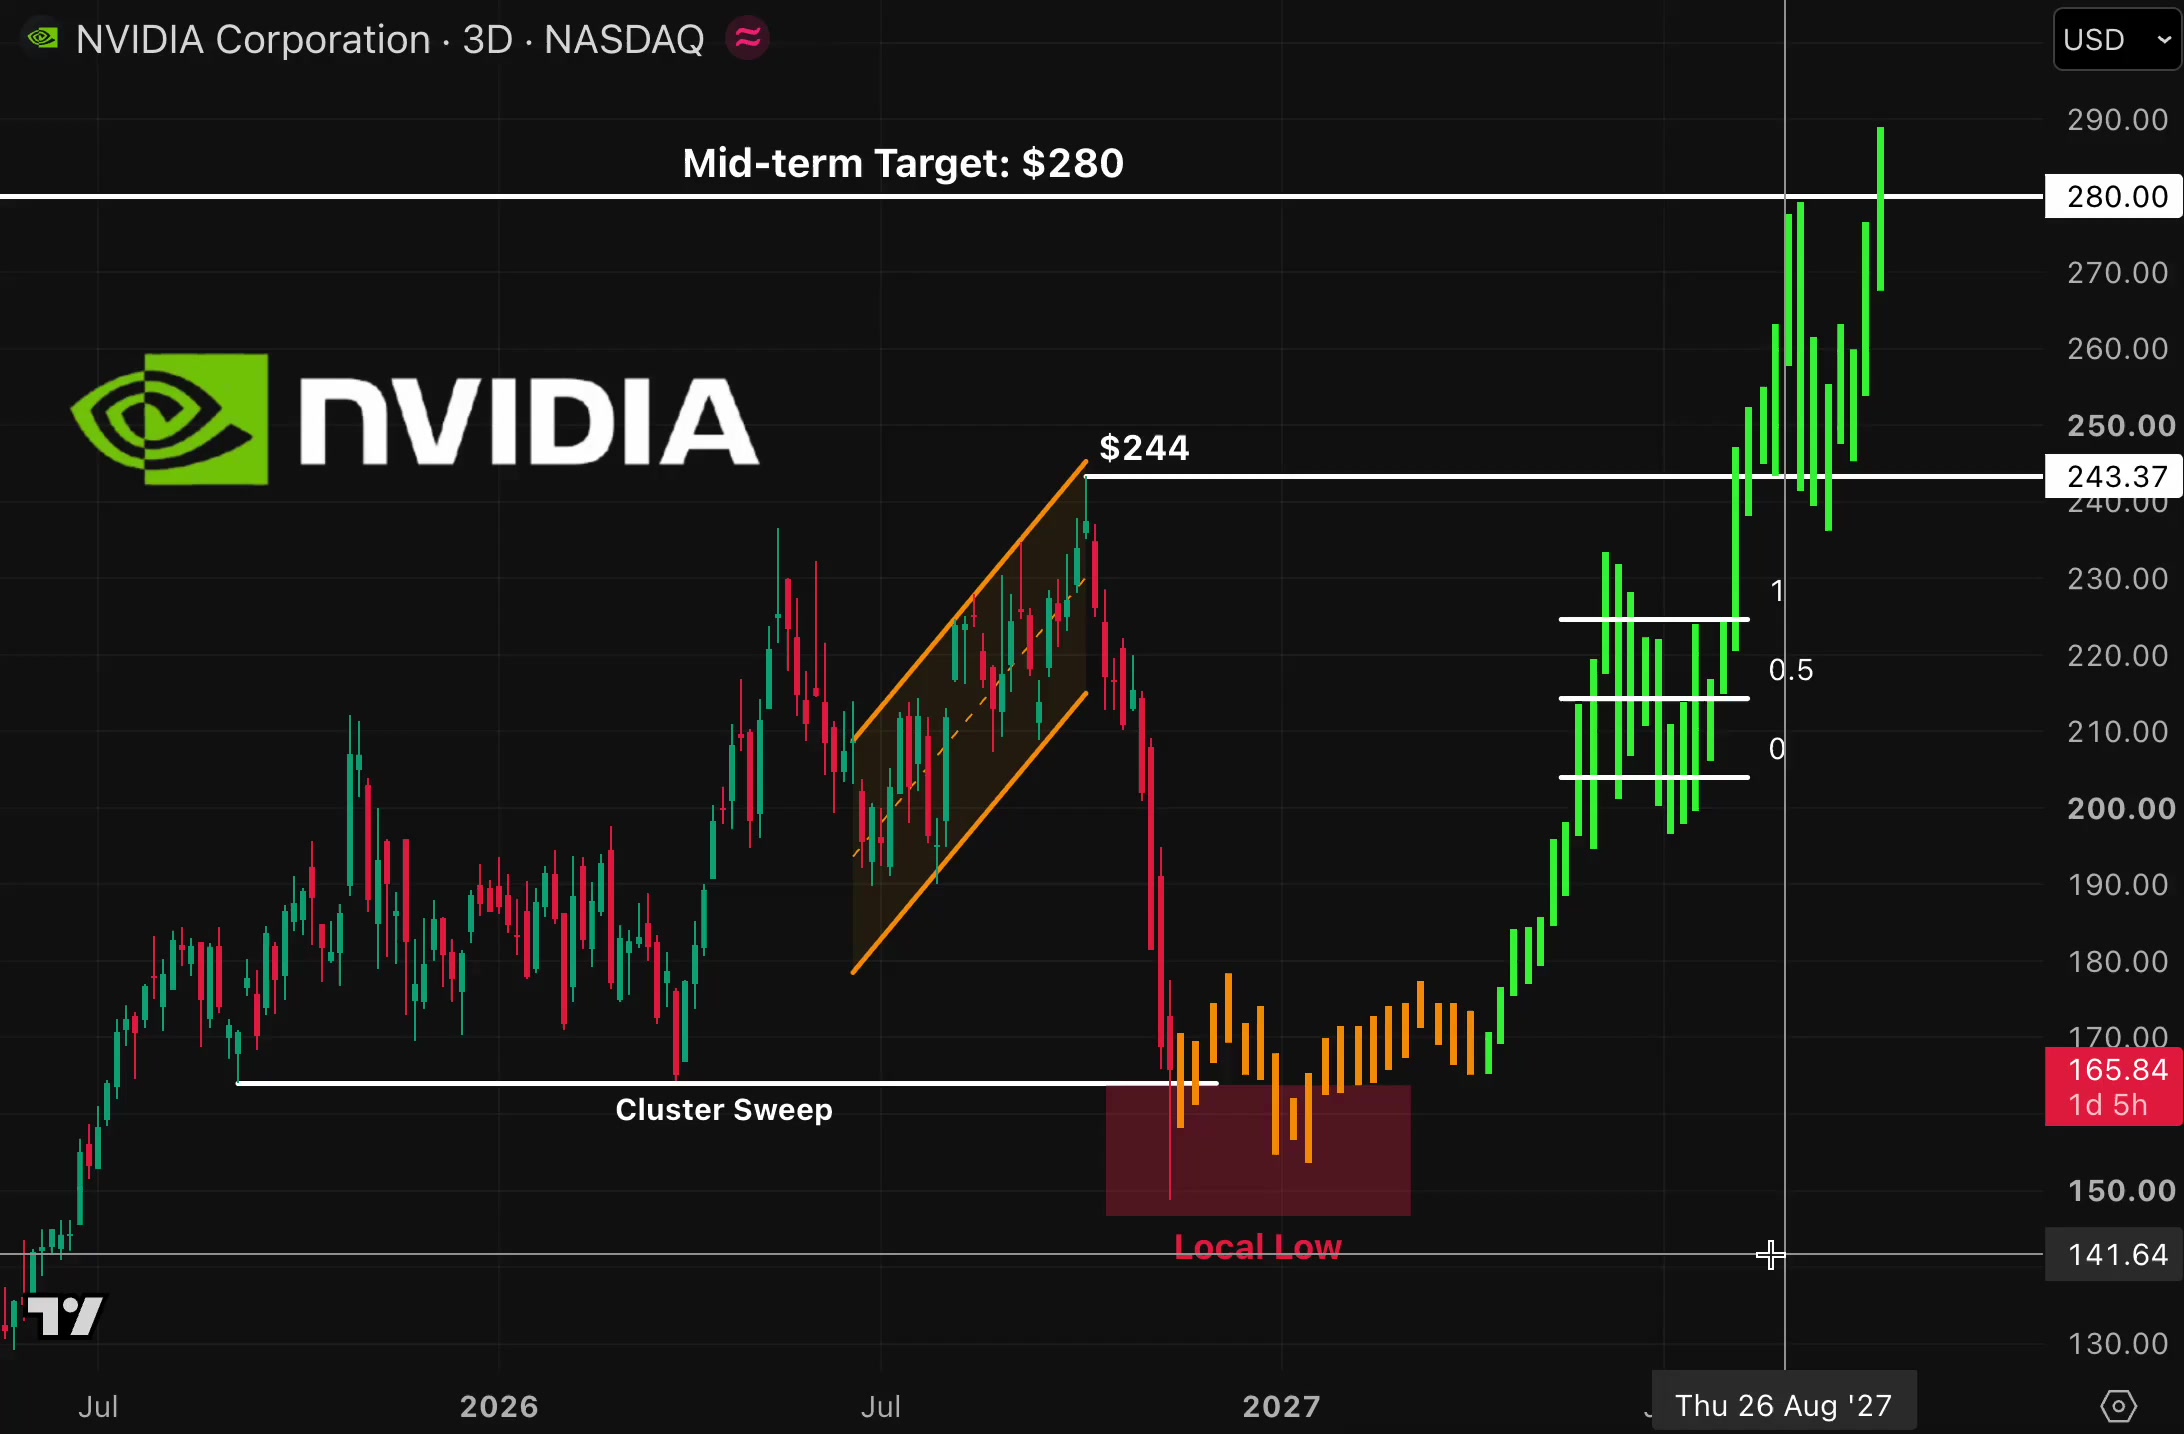
NVDA has gone from a hard slide to a quiet base, and a quiet base is the kind of chart where I'd rather buy a small dip than chase the high. The chart attached is only background on the bigger picture. The trade below stands on today's Bybit 1h and 15m charts alone. $NVDAXUSDT is at 161.55 (+1.12%), inside a 24h range of 156.15 to 161.74 That puts it 97% of the way up the range, 3.5% above the low and 0.1% under the high. Turnover is 54.23M. The levels I'm watching: Up: 161.74 (24h high) -> 163.99 (chart gridline, an area) -> 171.84 (1h chart high) Down: 160.89 (1h MA7) -> 160.80 (1h MA14) -> 160.70 (15m MA14) -> 160.35 (1h MA28) On the 1h, price is over MA7 (160.89), MA14 (160.80) and MA28 (160.35), by 0.4%, 0.5% and 0.7% The three have flattened and bunched after the slide from 171.84, so I read 160.35 to 160.90 as one support zone, and price is only now stepping away from it. On the 15m, price is over MA7 (160.85), MA14 (160.70) and MA28 (160.84), by 0.4%, 0.5% and 0.4% All three are tightly stacked and turning up, and the last candles are a clean run of green into the 24h high. I don't want to buy the top of that run, I want it to come back to the stack. I'm watching volume. The 15m bar is 2.79K against MA5 2.66K and MA10 2.38K with 06:42 left, so the push is above both averages but still forming. The 1h bar is 12.87K against 8.80K and 8.64K with 06:37 left, also above both. Participation is picking up on the way up, which is what I want from a base, but it is still small next to the flush earlier in the week. The trade, buying the dip into the stack: - Entry: 160.60 to 161.00 (limit, needs a 0.3% to 0.6% dip) - Stop: below 159.90 - Target 1: 162.30 (~1.7R from 160.80) - Target 2: 163.60 (~3.1R) Invalid if the 15m closes below 159.90, because that loses the 1h MA28 and the whole stack together. My thinking is to stay small, since this is a TradFi perp with thin liquidity and price is already at the 24h high. Limit orders, small size, and no dip, no trade. #IMPACTbyTrade
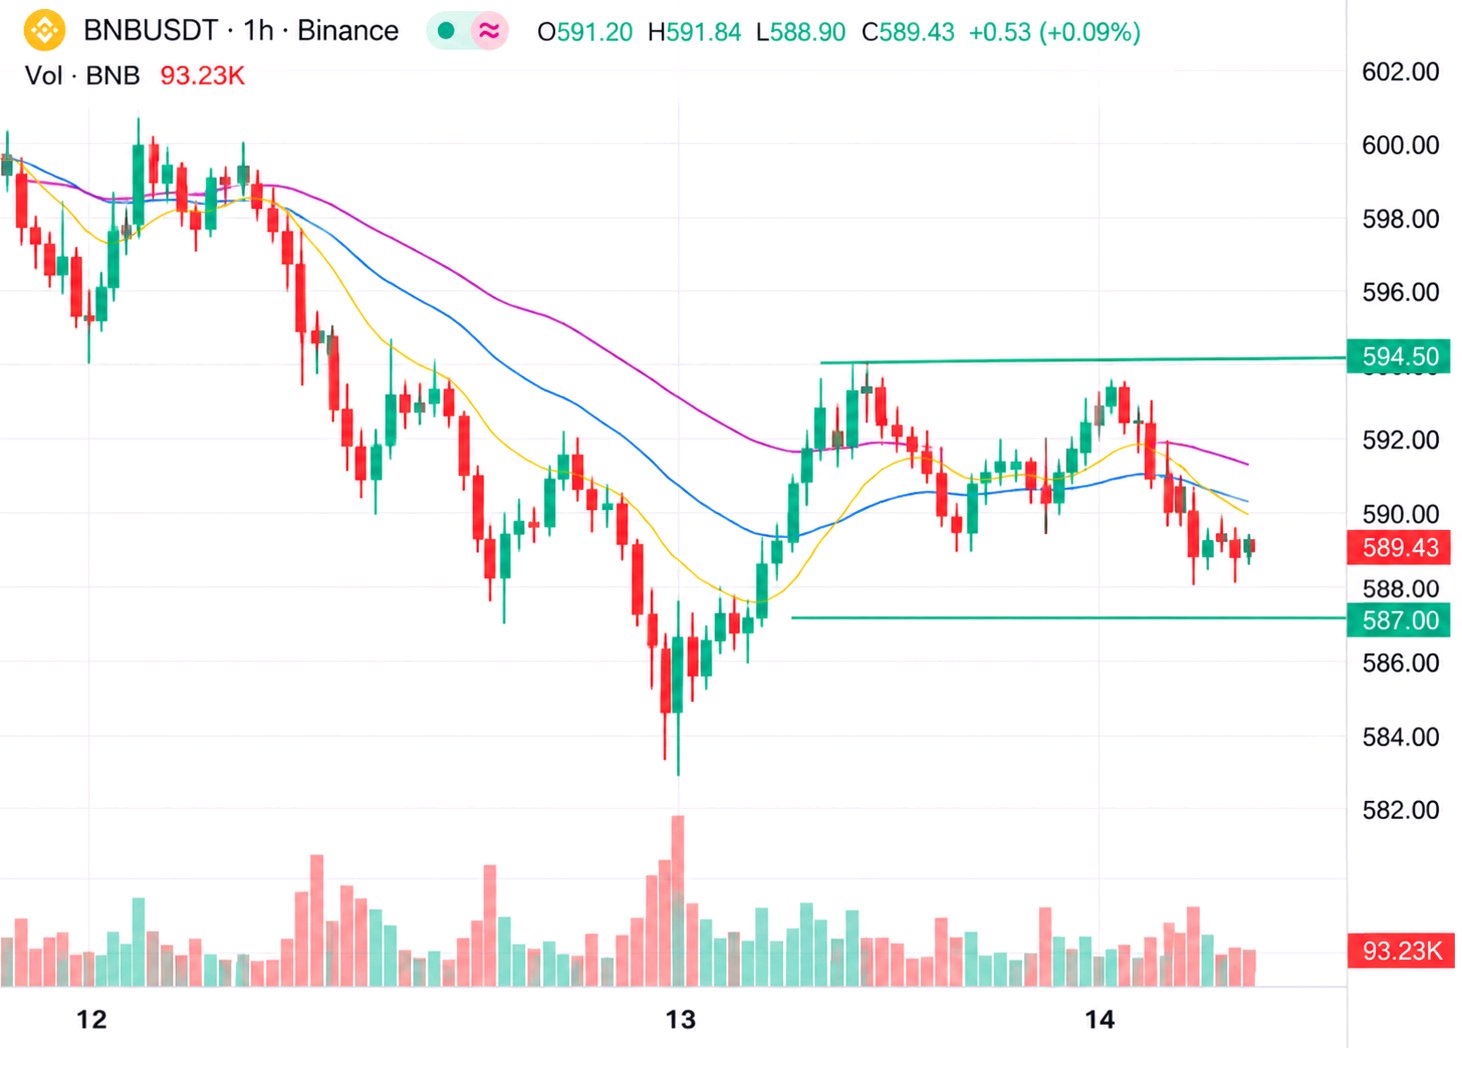
BNB gave back its whole afternoon in a couple of candles and is now sitting right on the hourly line it just lost. I'd rather sell the first push back up than the dip itself. $BNBUSDT is at 589.43 (+0.09%), inside a 24h range of 565.52 to 599.47. That puts it 70% of the way up the range, 4.2% above the low and 1.7% under the high. Turnover is 57.15M. What I'm marking: Up: 592.55 (15m MA14) -> 592.97 (1h MA14) -> 593.76 (1h MA7) -> 594.83 (15m MA28) -> 599.47 (24h high) Down: 589.89 (1h MA28) -> 585.70 (recent swing low, my read) -> 582.49 (chart gridline, an area) On the 1h, price is under MA7 (593.76), MA14 (592.97) and MA28 (589.89), by 0.7%, 0.6% and 0.1%. The three have flattened and bunched after the long slide from 658, and price has just slipped back under all of them, so I read 592.5 to 594.8 as one ceiling, not four lines. On the 15m, price is level with MA7 (589.47) and under MA14 (592.55) and MA28 (594.83), by 0.5% and 0.9%. Both of those are sloping down, and the last candles are small red ones with no real push back up. I'm watching volume. The 15m bar is 92.630 against MA5 217.778 and MA10 434.612 with 02:19 left, so it is still forming and I won't judge it. The 1h bar is 93.230 against 1.16K and 2.19K with 47:13 left, barely opened. The biggest bars came on the morning bounce, and the last few hours have been very quiet, which is why I'm waiting for the lift and not chasing the drop. The trade, selling the retest of the 1h averages: - Entry: 592.50 to 594.50 (limit, needs a 0.5% to 0.9% bounce) - Stop: above 596.50 - Target 1: 587.00 (~2.2R from 593.50) - Target 2: 583.00 (~3.5R) Invalid if the 15m closes above 596.50. That would take back the whole hourly cluster and the 15m MA28 together, and I'd step aside. My thinking is to keep it small, since the day is flat and the range is tight. Limit orders, modest size, and no lift, no trade. #IMPACTbyTrade

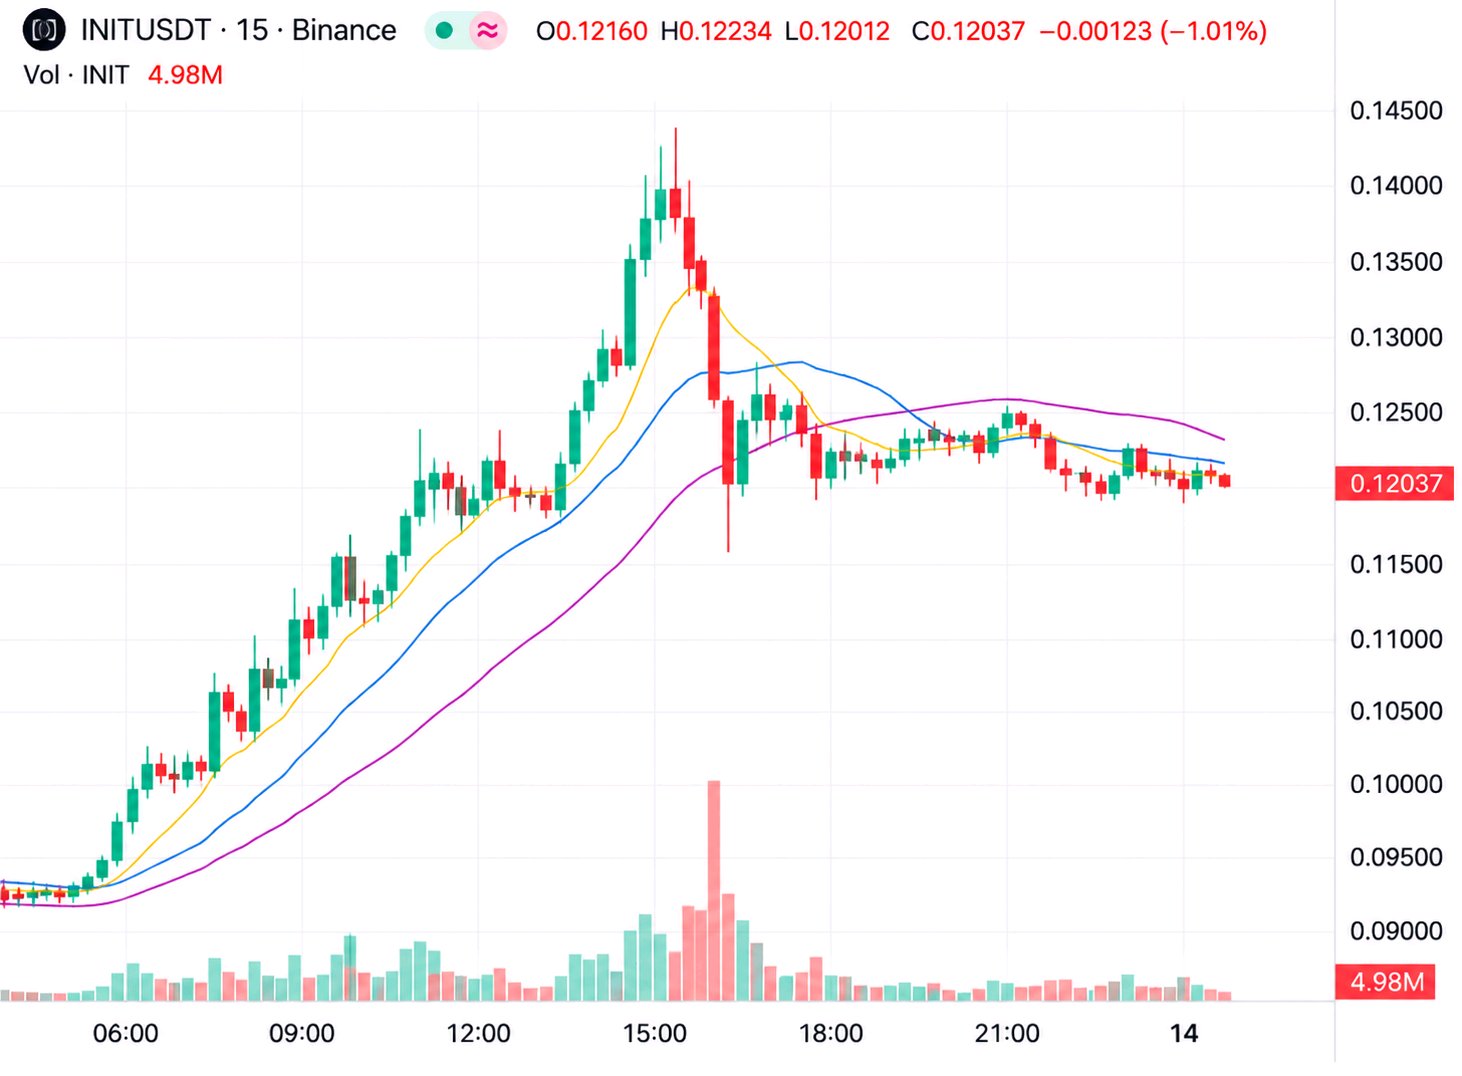
INITは依然として1日で23%上昇していますが、この上昇相場全体で最も出来高が大きいのは、トップから落ちてきた時の赤い棒グラフであり、価格はすでに短期平均線を割り込んでいます。今の押し目は買いません。反発して戻せるのか、そこまで戻れるのかを見極めたいところです。 $INITUSDTは現在0.12037(+23.19%)で、24時間の値幅は0.09279から0.14280です。レンジの中間から55%の位置にあり、安値から29.7%上、高値から15.7%下にあります。売買高は57.63Mです。 私が使っているマップ: 上:0.12415(15分足 MA7) -> 0.12443(15分足 MA28) -> 0.12517(1時間足 MA7) -> 0.1265(暴落後の小さな棚のトップ、エリアとして認識) -> 0.12928(15分足 MA14) -> 0.14280(24時間高値) 下:0.1178(フラッシュクラッシュのヒゲ安値) -> 0.11353(1時間足 MA14) -> 0.10626(1時間足 MA28) -> 0.09279(24時間安値) 1時間足では、価格はMA7(0.12517)を4.0%下回っていますが、MA14(0.11353)とMA28(0.10626)よりはそれぞれ5.7%と11.7%上にあります。 その両方とも、上昇相場からの流れで下から切り上がってきているため、上位時間軸はまだ壊れていません。だからこそ、追いかけ売りはせず、リテストを待ちたいのです。 15分足では、MA7(0.12415)、MA28(0.12443)、MA14(0.12928)のすべてが価格の上に位置しており、それぞれ3.1%、3.4%、7.4%上回っています。 短期線は反転しており、最後のローソク足は0.1242の下で小さく積み重なっており、買い手が支配を取り戻したというよりは、下落後の小休止のように見えます。 出来高も監視しています。17:00のローソク足はチャート上で最も大きく、軸から読み取ると約24Mです。 現在の15分足は4.98Mで、MA5の6.33M、MA10の10.14Mに対して、残り02:36なのでもうすぐ確定します。1時間足は17.04Mで、40.15Mおよび34.82Mに対して静かな1時間となっています。フラッシュクラッシュは大きな出来高を伴いましたが、それ以降は落ち着いています。 トレード戦略:平均線へのリテストで売りを入れる - エントリー:0.1242から0.1252(指値、3.1%から4.0%の上昇とそこで停滞が必要) - ストップ:0.1295の上 - ターゲット1:0.1150(0.12466から約2.0R) - ターゲット2:0.1075(約3.5R) 15分足が0.1295を超えて引けたら無効とします。その場合、価格は15分足のMA14と棚の高値を両方とも上回ることになるため、手を出さないことにします。 ストップは約3.9%の距離にあり、このコインは今日すでに23%動いているので、ポジションサイズは小さく抑えます。 指値注文のみとし、もし戻してこなければそのまま見送ります。 #IMPACTbyTrade

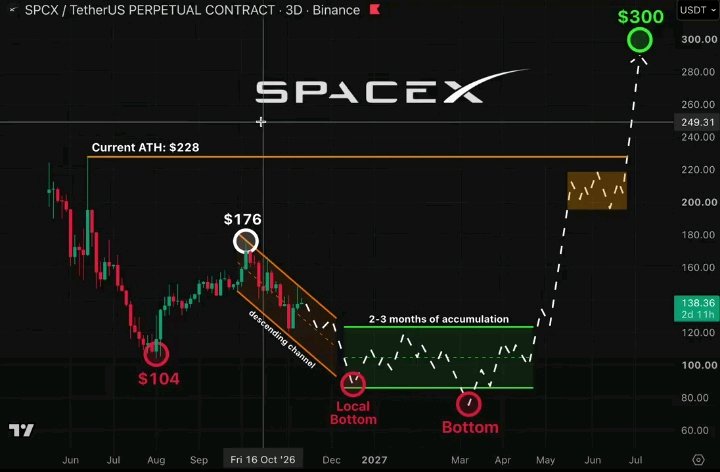
SPCXは夜間の安値から約4%上昇し、現在は高値のすぐ下に位置していますが、自分は飛びつき買いをするつもりはありません。もしエントリーするなら、これまでサポートとして機能していた平均線への押し目待ちです。 $SPCXXUSDTは現在138.56(+1.88%)で、24時間のレンジは133.53〜138.62です。これはレンジの上限から99%の位置、安値から3.8%上昇、高値から0.04%下の水準で、出来高は17.54Mです。これだけの大幅な動きにしては出来高が伴っていないため、慎重に見ています。 現在のチャート分析: 上値:138.62(24時間高値) -> 139.80(下落前に停滞したエリア、明確なレジスタンスではない) -> 143.15(1時間足高値) 下値:138.35(15分足MA7) -> 138.12(15分足MA14) -> 137.84(1時間足MA7) -> 137.72(15分足MA28) -> 137.00(1時間足MA14) -> 133.53(24時間安値) 1時間足で見ると、価格はMA7(137.84)、MA14(137.00)、MA28(136.16)をそれぞれ0.5%、1.1%、1.7%上回っています。3本とも上昇傾向にあり、間隔も広がっているため、この反発にはしっかりとした根拠があります。 また、143.15から133.53までの下落幅に対して約半分(52%)を回復しており、自然な調整局面と言えます。 15分足では、価格はMA7(138.35)、MA14(138.12)、MA28(137.72)をそれぞれ0.2%、0.3%、0.6%上回っています。 移動平均線が順番に並んで上昇しており、ローソク足は短期線に沿って推移しています。これは健全なトレンドですが、現時点では割安感はありません。 出来高については確信が持てません。15分足の出来高は553.87で、MA5の588.72、MA10の888.39に対して、残り時間07:57でまだ形成中なので判断を保留します。 1時間足は出来高1.66Kで、MA5の4.06K、MA10の3.91Kに対して、残り時間37:53とまだ序盤です。最大の出来高は下落時と安値からの最初の反発時に記録されており、その後の上昇は出来高を伴っていません。買いが弱いため、ブレイクアウト狙いではなく押し目を待ちます。 押し目買いのトレードプラン: - エントリー:137.72〜138.12(指値注文、まずは0.3%〜0.6%の押しが必要) - ストップ:137.40割れ - 利確1:138.55(137.92から約1.2R) - 利確2:139.80(約3.6R) 15分足が137.40を下回って引けた場合は無効とします。その場合、価格が15分足のMA28と直近の押し安値(約137.5)の両方を下回ることになるため、撤退します。 これはTradFiの無期限先物であるため、主要な仮想通貨よりも流動性が低く、約定スリッページが発生する可能性があります。そのため、ポジションサイズは小さめにし、指値注文のみを使用します。押し目が来なければ、高値を追いかけることはしません。 #IMPACTbyTrade

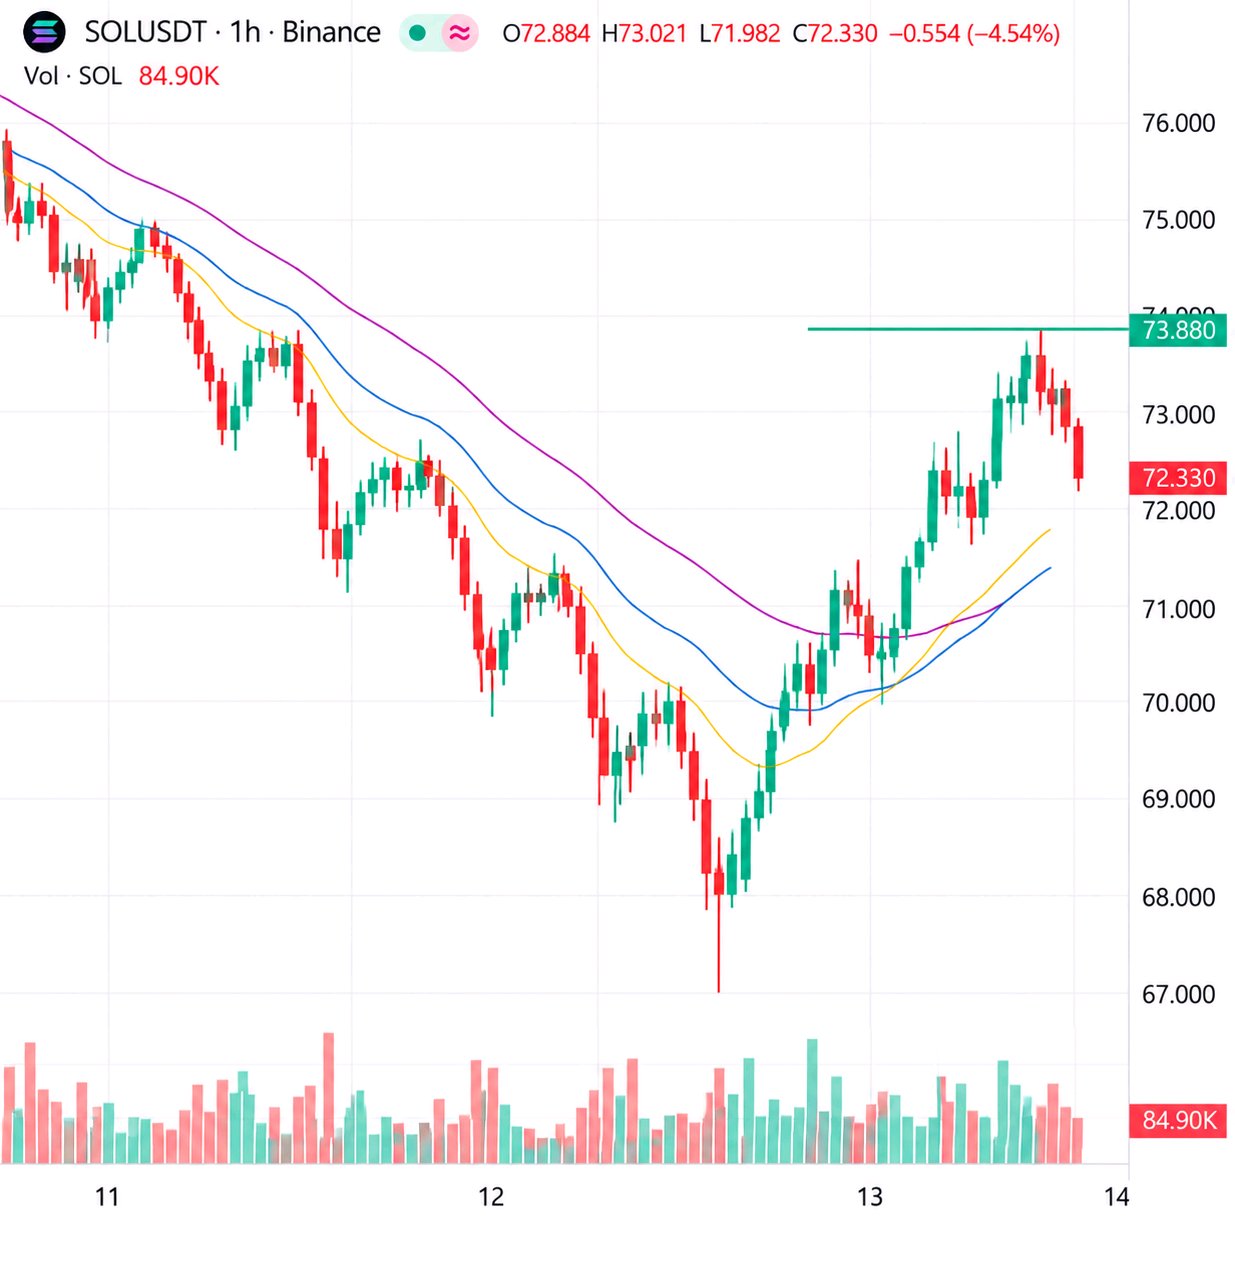
SOL has climbed 7% off the low and walked right up to the one hourly line that has turned it back all week. Before I trust the bounce, I want to see what happens when it touches. $SOLUSDT is at 72.330 (-4.54%), inside a 24h range of 67.320 to 76.020. That puts it 58% of the way up the range, 7.4% above the low and 4.9% under the high. Turnover is 930.11M. The map I'm using: Up: 72.540 (15m chart high) -> 73.880 (chart gridline, an area) -> 76.020 (24h high) Down: 72.034 (15m MA7) -> 71.615 (15m MA14) -> 71.083 (15m MA28) -> 67.320 (24h low) On the 1h, price is over MA7 (71.177) and MA14 (70.583), by 1.6% and 2.5%, but only 0.3% over MA28 (72.132), and that line is still sloping down from the 82 area. Price is sitting on a falling average that has not been tested yet, so I read 72.1 to 72.7 as the first real wall. On the 15m, price is over MA7 (72.034), MA14 (71.615) and MA28 (71.083), by 0.4%, 1.0% and 1.8% The stack is rising, but the last candles are small and overlapping right under 72.540, which looks like hesitation, not momentum. I'm watching volume. The 15m bar is 52.82K against MA5 40.79K and MA10 86.20K with 04:07 left, still forming, so I won't judge it. The 1h bar is 84.90K against 299.35K and 345.31K with 34:03 left, early in the candle. The tall bars on this chart are the red ones on the drop, and the recovery has been far lighter than that. The trade, selling the rejection at the 1h MA28: - Entry: 72.45 to 72.70 (limit, needs a 0.2% to 0.5% lift) - Stop: above 73.00 - Target 1: 71.65 (~2.2R from 72.575) - Target 2: 71.10 (~3.5R) Invalid if the 15m closes above 73.00. That would put price over the 1h MA28 and the 72.54 high together, and I'd step aside. My thinking is to keep it small, since the bounce is real and could still extend. Limit orders, modest size, and no lift, no trade. #IMPACTbyTrade

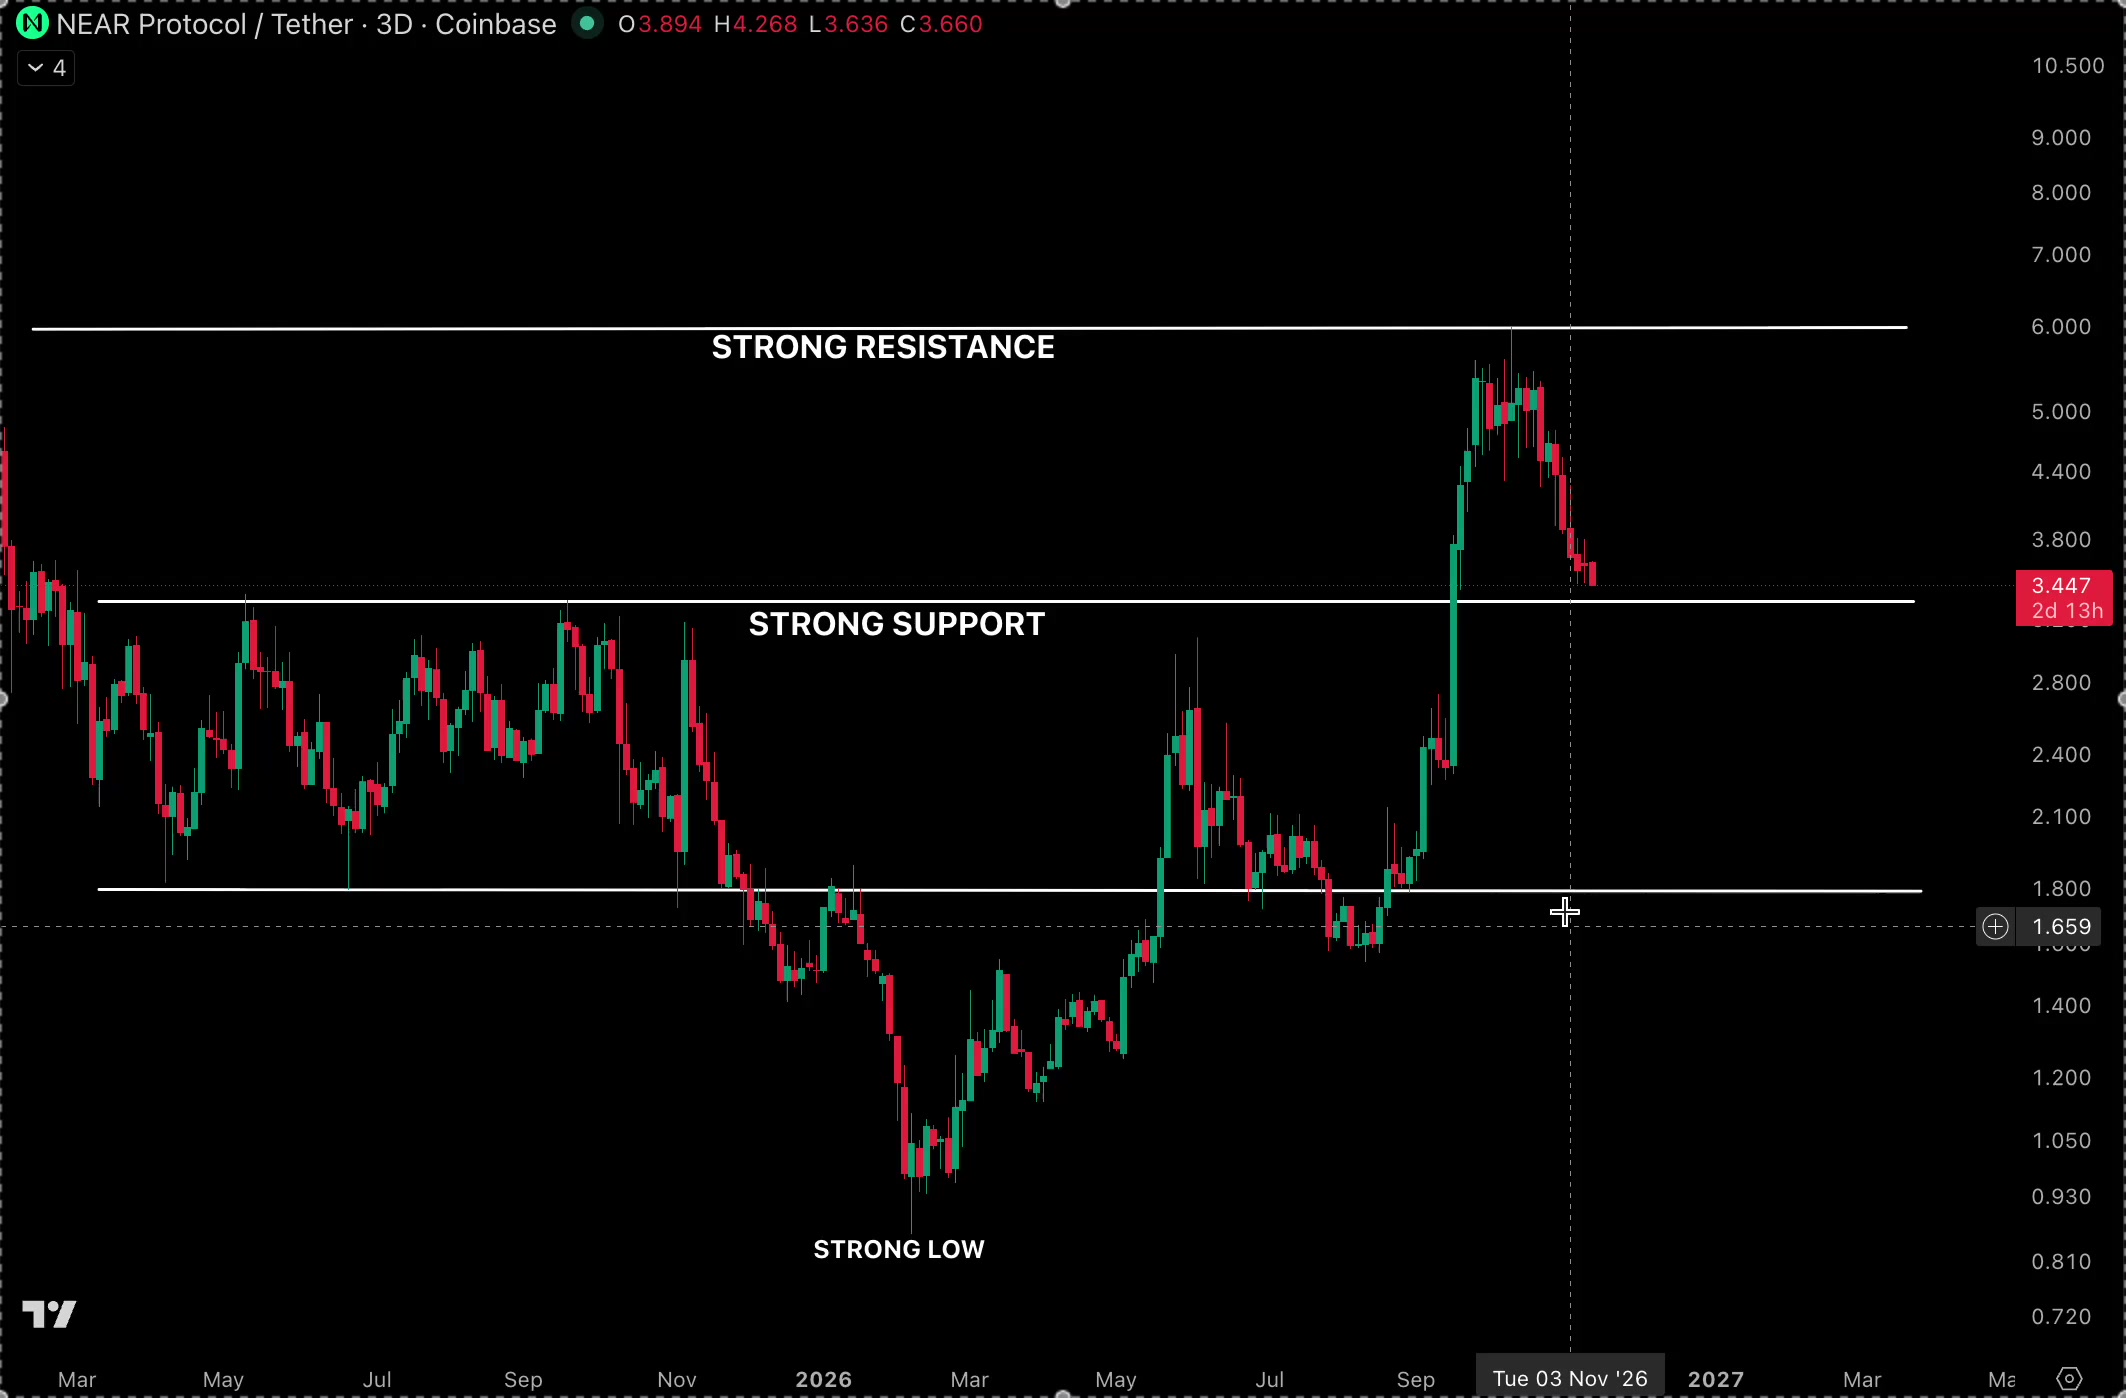
もうNEARの下落を拾いに行くのはやめた。今気に入っているのは、ずっと上値を抑えていたラインをようやく上抜けて引けたことだ。 $NEARUSDTは3.1740(-4.51%)で推移しており、24時間のレンジは2.8670から3.3510。レンジの63%の位置にあり、安値から10.7%上昇、高値から5.3%下落した水準。出来高は218.58M。 注目しているポイント: 上値: 3.1970(15分足高値) -> 3.2394(チャートのグリッドライン、ゾーン) -> 3.3510(24時間高値) 下値: 3.1687(15分足MA7) -> 3.1510(1時間足MA28) -> 3.1435(15分足MA14) -> 3.1362(1時間足MA7) 1時間足では、価格はMA7(3.1362)、MA14(3.0801)、MA28(3.1510)をそれぞれ1.2%、3.0%、0.7%上回っている。 MA28はこれまでの反発をことごとく抑え込んできたラインであり、そこを上抜けて引けたので、このラインがサポートとして機能するかどうかを見極めたい。 15分足では、価格はMA7(3.1687)、MA14(3.1435)、MA28(3.1366)をそれぞれ0.2%、1.0%、1.2%上回っている。 3本の移動平均線は順番に並んで上昇しており、正午以降のローソク足は小さく重なり合っているため、下落の継続(フェード)ではなく、一時停止と読める。 出来高を注視している。15分足の出来高は281.99Kで、MA5の594.75K、MA10の692.69Kに対してまだ07:05残っており、形成中だ。 1時間足の出来高は902.84Kで、2.15Mおよび2.25Mに対して残り37:01、こちらもまだ確定していない。この一時停止局面での参加者は少ないため、焦らず計画通りに進める。 トレード戦略:1時間足MA28への押し目買い - エントリー: 3.1400~3.1650(指値、0.3%~1.1%の押し目が必要) - ストップ: 3.1100割れ - ターゲット1: 3.2250(3.1525から約1.7R) - ターゲット2: 3.2700(約2.8R) 15分足が3.1100を下回って引けた場合は無効。その場合、1時間足MA28と15分足の移動平均線の並びが崩れるためだ。本日はまだ4.5%下げている状態なので、ポジションサイズは小さく抑えるつもりだ。 指値注文で、無理のないサイズで。押し目がなければトレードは見送り。 #IMPACTbyTrade
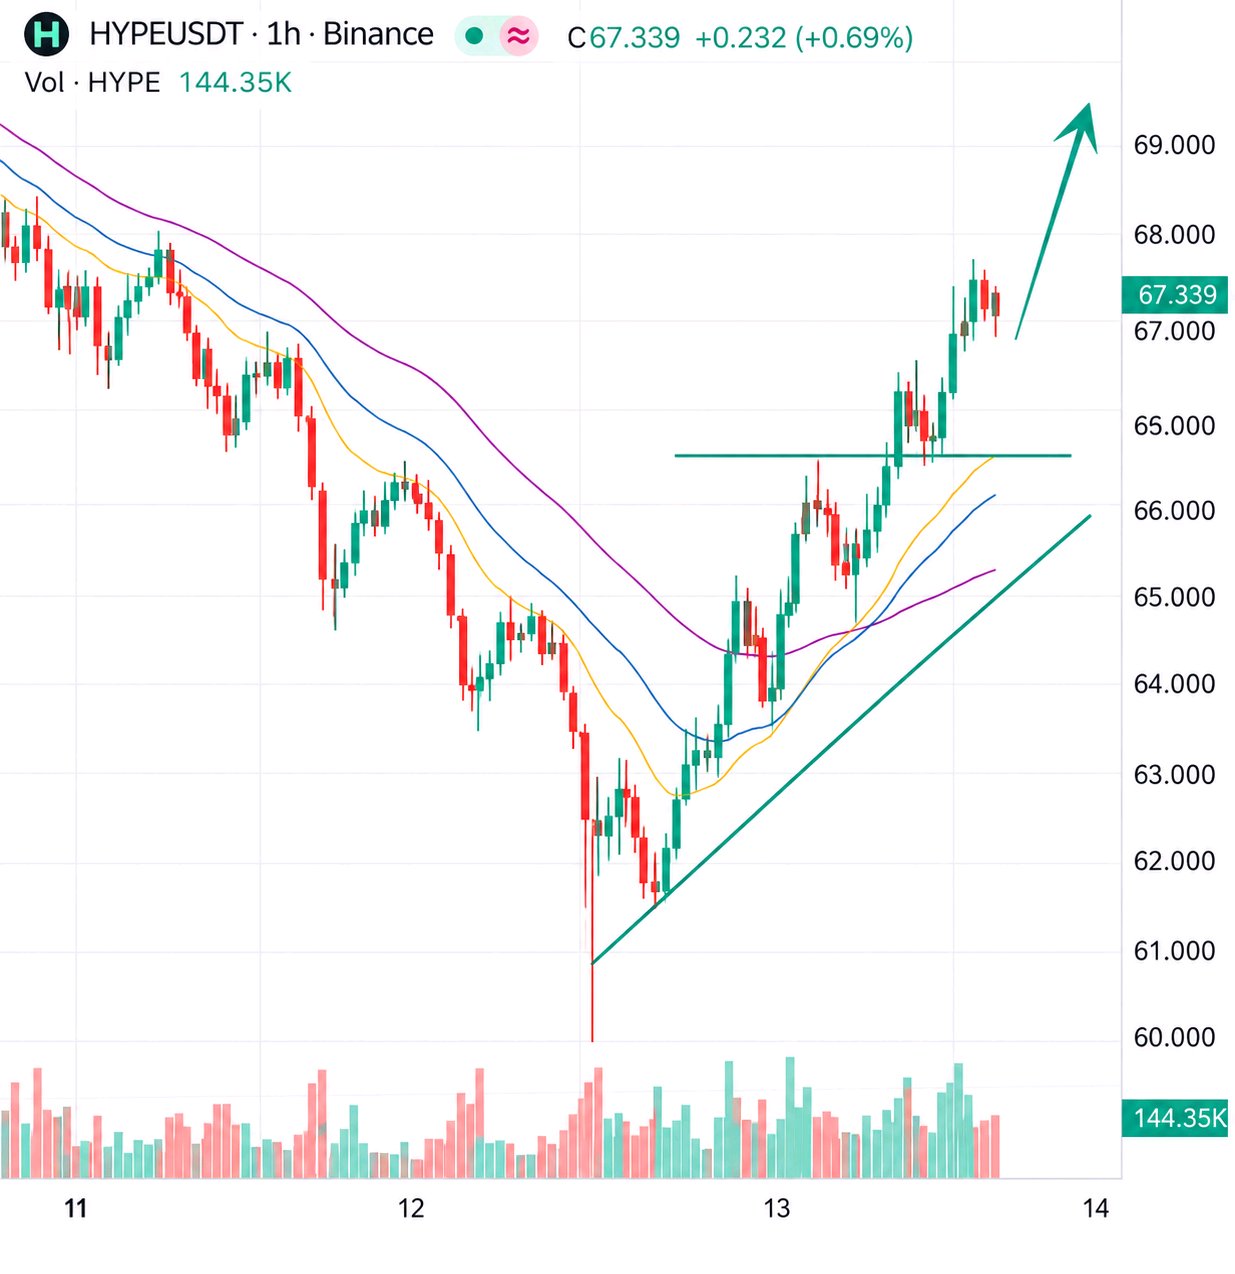
HYPEはただ反発しただけでなく、これまで上値を抑えていた時間足平均線を上抜けてきました。このラインで価格がどう動くかが、今回のトレードのすべてです。 $HYPEUSDTは現在67.339(-2.07%)で推移しており、24時間のレンジは60.017から69.678です。レンジの上位76%の位置にあり、安値から12.2%上昇、高値からは3.4%下落した水準です。売買代金は462.22Mです。 注視しているポイント: 上値:67.593(15分足高値) -> 69.678(24時間高値) 下値:66.250(1時間足MA28) -> 65.879(15分足MA7) -> 65.590(15分足MA14) -> 60.017(24時間安値) 1時間足では、価格はMA7(65.883)、MA14(64.698)、MA28(66.250)をそれぞれ2.2%、3.9%、1.6%上回っています。 価格が長い下落トレンドを経てMA28を回復したので、66.25がサポートとして機能するかが鍵です。そのすぐ下に短期のペアが控えているのがクッションになるでしょう。 15分足では、価格はMA7(65.879)、MA14(65.590)、MA28(65.814)をそれぞれ2.2%、2.6%、2.3%上回っています。 3本とも上向きで綺麗に重なっており、最後のローソク足は長く勢いのある陽線で、平均線から一気に離れました。このような足の後に追っかけ買いはしたくないので、調整を待ちます。 出来高も見ています。15分足の出来高は20.92K(MA5 54.31K、MA10 36.79Kに対し)、残り時間は07:39で、まだ形成中です。 1時間足の出来高は144.35K(MA5 107.01K、MA10 191.47Kに対し)、残り時間は37:37。ローソク足が半分も過ぎていない段階ですでにMA5を超えており、これこそがリクレイム(価格回復)時に見たい参加の勢いです。 トレード戦略:1時間足MA28の再テストで買い - エントリー:66.10から66.55(指値、1.2%〜1.8%の押し目が必要) - ストップ:65.55割れ - ターゲット1:67.55(66.33から約1.6R) - ターゲット2:68.40(約2.7R) もし15分足が65.55を下回って確定したら無効です。そうなれば1時間足MA28と15分足の重なりを再度下抜けることになるので、手を出さないことにします。安値からすでに12%反発しているため、ポジションサイズは小さく抑えるのが計画です。 指値注文、少額ポジション。押し目がなければ見送りです。 #IMPACTbyTrade

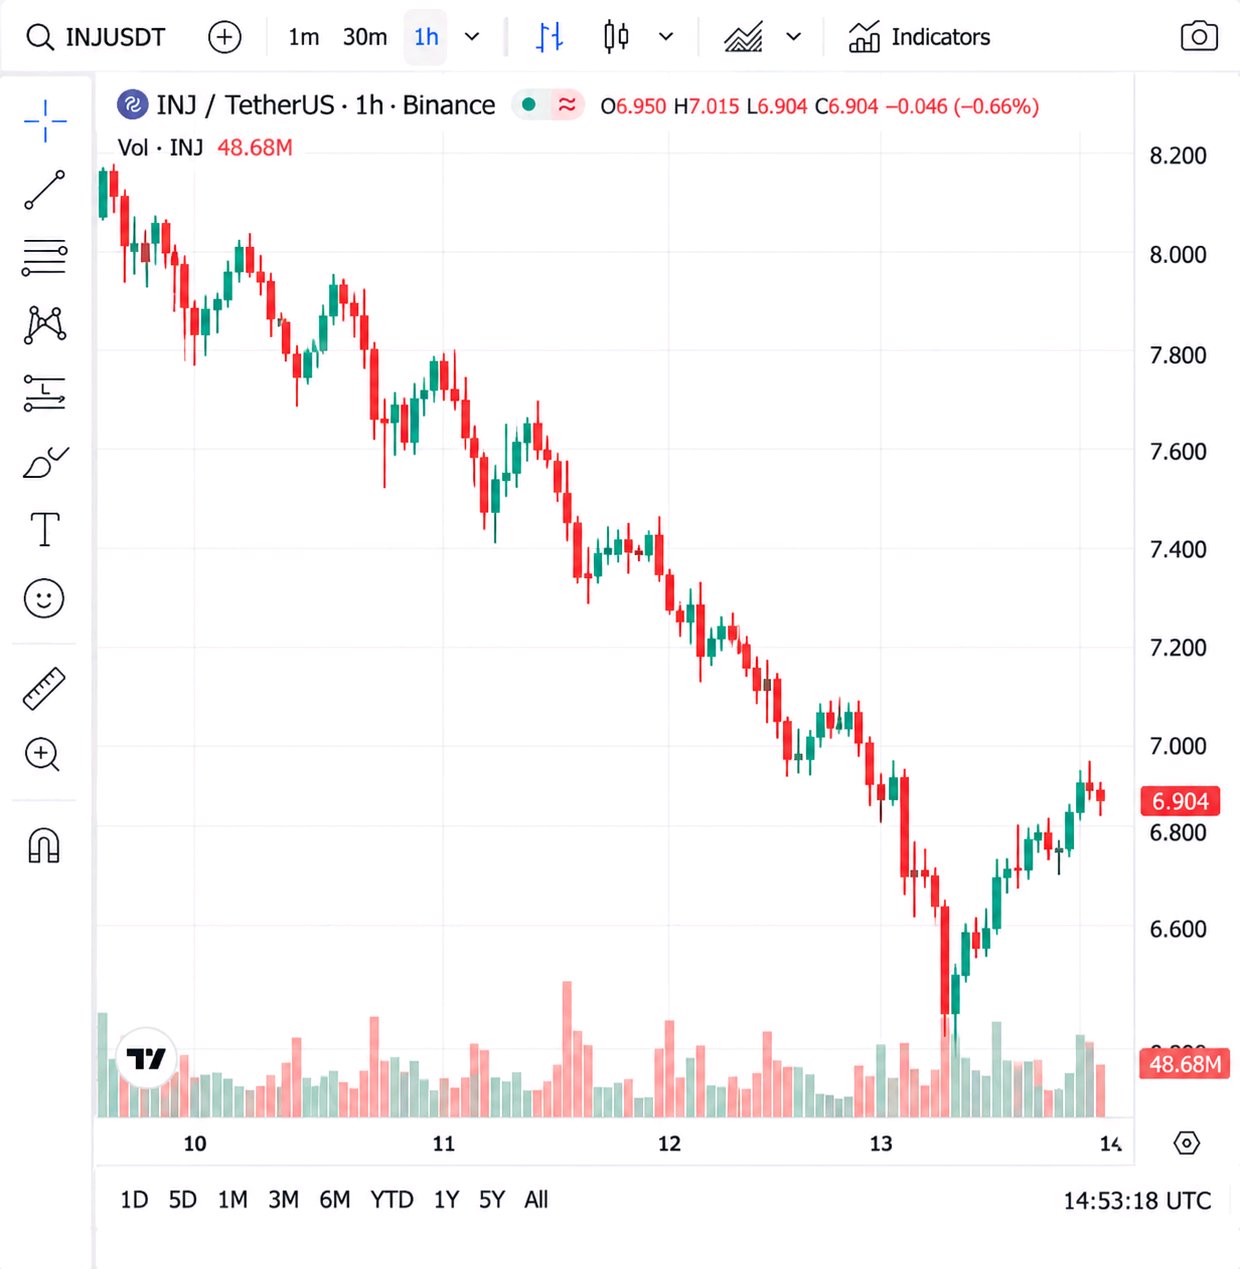
INJの反発は24時間レンジの約38%を戻したところで平均線を割り込み始めており、信用できない。 $INJUSDTは6.9040で-13.76%となっており、安値6.5540からは5.3%上、高値8.0540までは16.7%の距離がある。これは24時間レンジの約23%の位置で、出来高(ターンオーバー)は4,868万だ。 安値は午前6:45頃につけ、反発は10:15頃に7.12付近で頭打ちとなった。それ以来、6.95から7.10のシェルフ(保ち合い)から滑り落ち、現在は15分足の3本の平均線すべてを下回っている。 出来高を見る限り、この反発は薄い。15分足のローソク足は15.33Kで、MA5(19.24K)とMA10(25.22K)に対してそれぞれ約0.8倍、0.6倍となっており、足が確定する間際の状態だ。 1時間足は15.36Kで、107.30Kと173.81Kに対して推移しているが、まだ始まったばかりなので、これについては何も読み取れない。重い出来高は下落時についており、反発時にはそこまで届いていない。 平均線: 1h MA14 6.9041(0.0%、現在価格はちょうどここに位置) 15m MA28 6.9370(+0.5%) 1h MA7 6.9551(+0.7%) 15m MA7 6.9767(+1.1%) 15m MA14 7.0040(+1.5%) 1h MA28 7.3284(+6.1%) 6本のうち4本が6.937から7.004の1%のバンド内に集中しており、このバンドが注目すべきゾーンだ。 上値:6.937 / 6.955 / 6.977 / 7.004 -> 7.12(反発高値) -> 7.328(1h MA28) -> 8.054(24時間高値) 下値:6.904(1h MA14、現在地) -> 6.554(24時間安値) 私なら、リテスト(再試行)での売り以外はしない。 エントリーは6.937から7.004。価格がこのゾーンまで戻して停滞した後だ。そのためにはまず0.5%から1.5%の反発が必要になる。 損切りは7.12の反発高値を超えた7.13以上に設定する。 ターゲット1:6.60(6.554の安値のすぐ上、約2.3R) ターゲット2:6.45(安値を割り込んだ場合、約3.3R) 6.554以下には目立ったレベルがないため、これは計算上の目標値となる。 もし1時間足が6.9041を下回って確定し、リテストなしに下落が続けば、追わない。逆に15分足が7.13を上回って確定したら、反発は本物だと判断して撤退する。 Rはゾーンの中間点(6.9705)から計算し、損切りは約2.3%離している。ストップが広いため、ポジションサイズは通常より小さくするつもりだ。 -13%の日には誰もが押し目買いをしたくなるものだが、私は7.00で誰が持ちこたえているかを見極めたい。 #IMPACTbyTrade

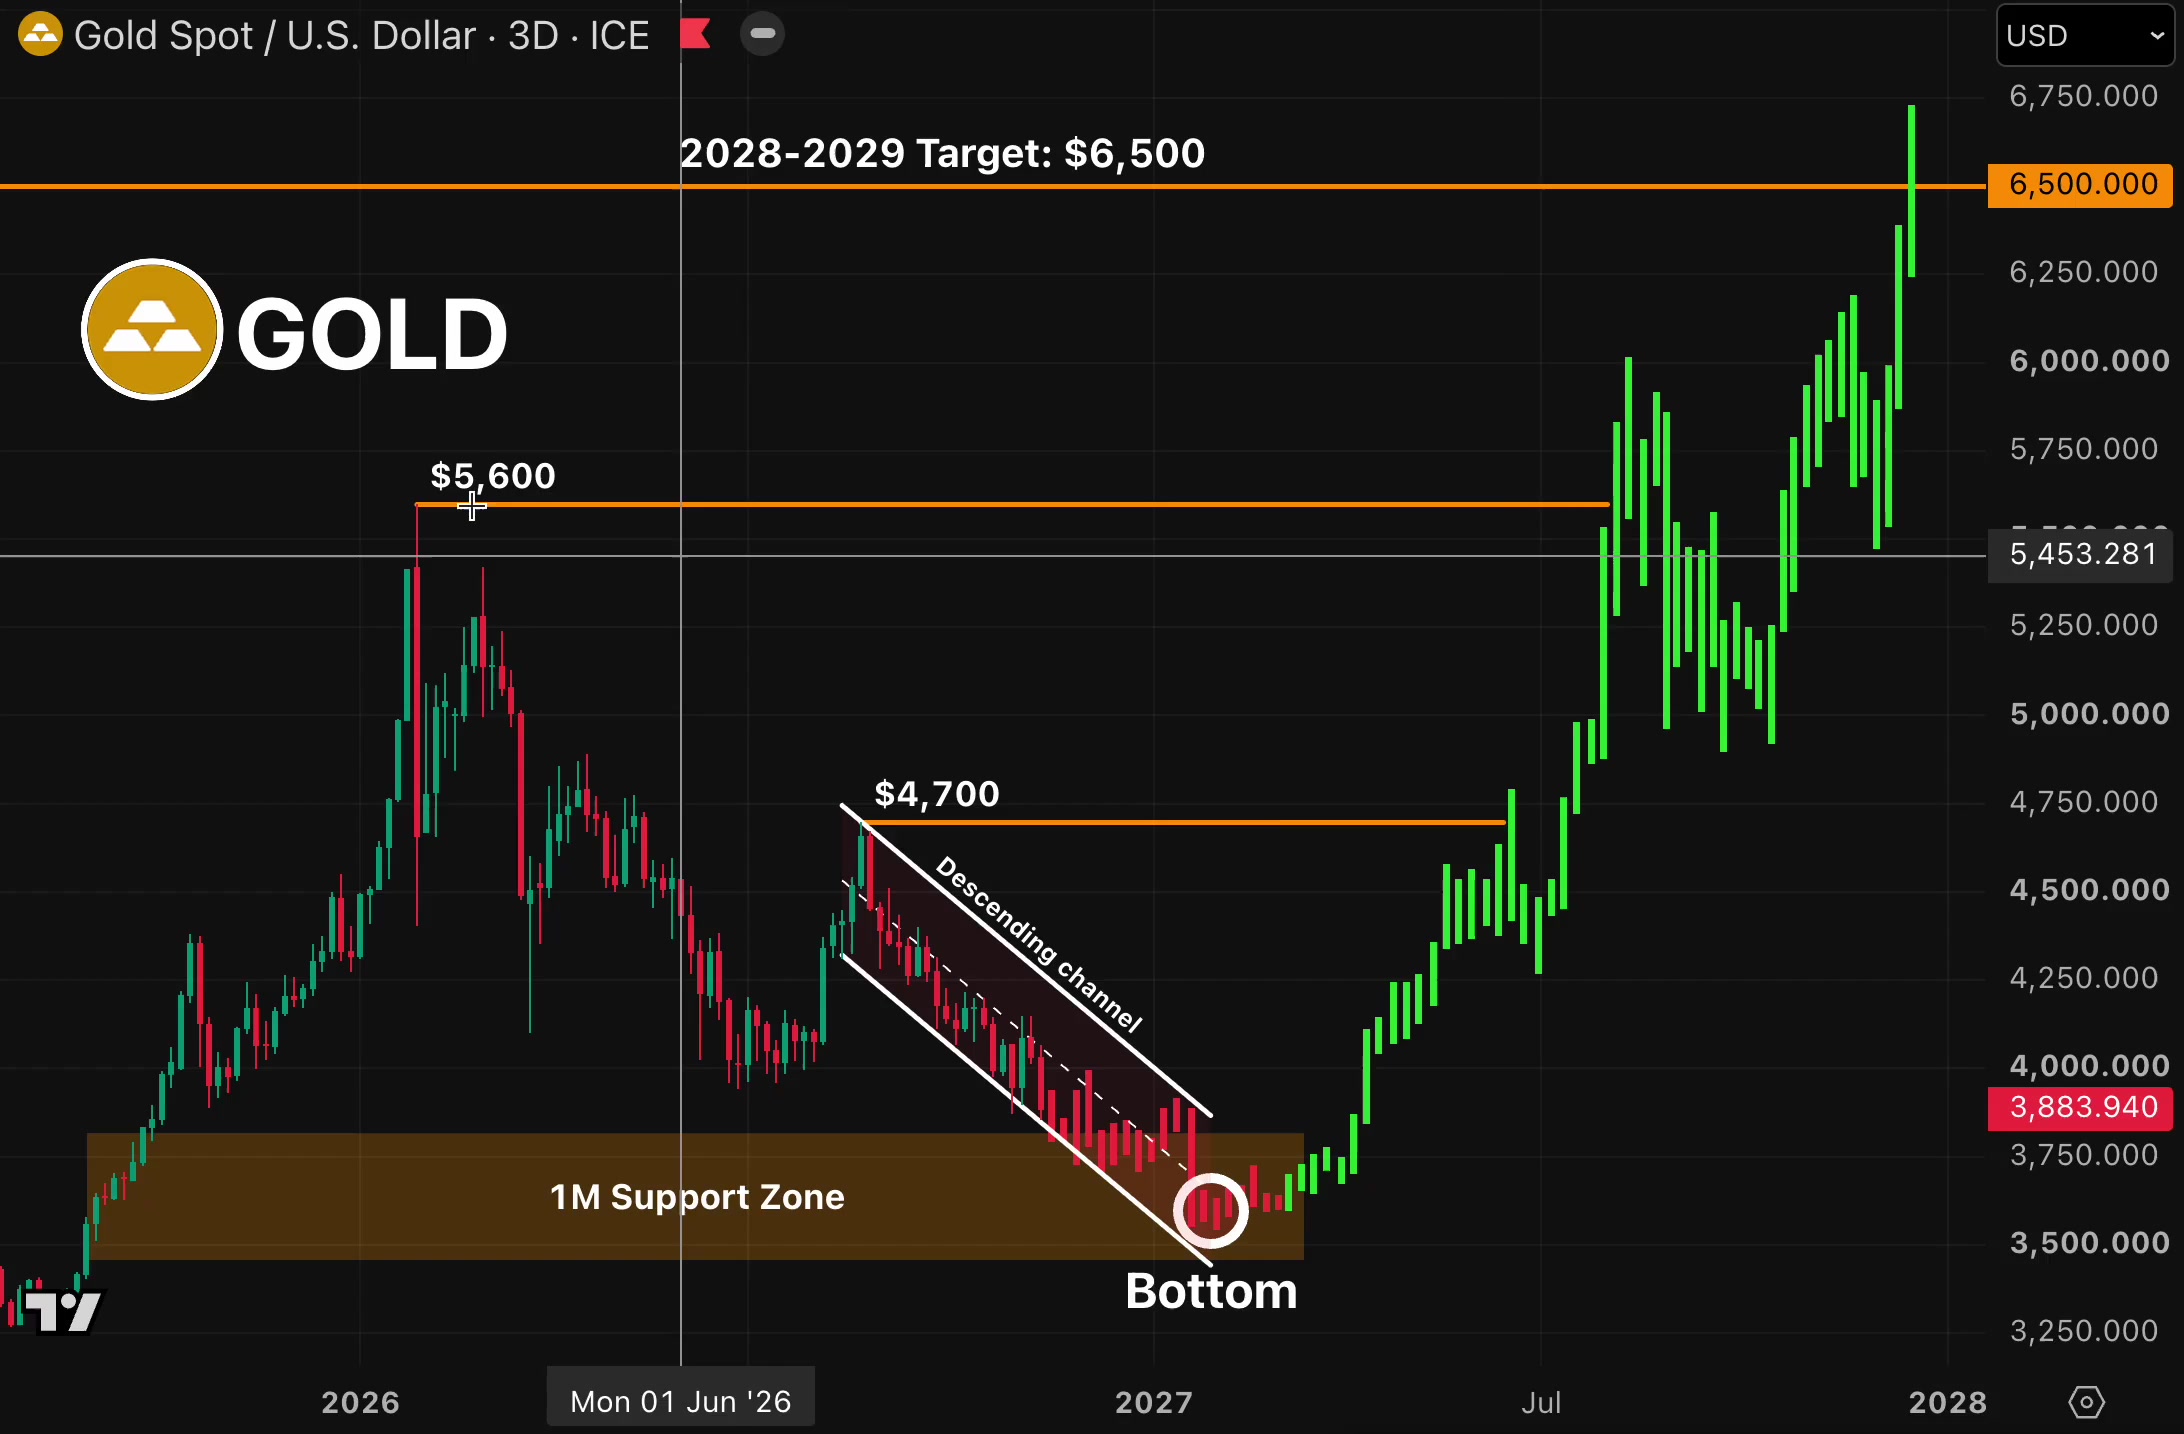
ゴールドはすべての移動平均線の上に位置しており、価格の方向性が定まらない時は、方向を予測するよりもポイントを絞って取引する方がいい。 $XAUTUSDTは3,835.26(-1.27%)で推移しており、24時間のレンジは3,777.66から3,888.21。レンジ内の52%地点にあり、安値から1.5%高く、高値から1.4%低い位置にある。売買高は139.29M。 注目ポイント: 上値:3,853.10(1時間足 MA28) -> 3,857.55(チャートグリッドライン、ゾーン) -> 3,881.30(15分足の高値) 下値:3,829.59(1時間足 MA14) -> 3,800(自身の予測) -> 3,777.66(24時間安値) 1時間足では、価格はMA7(3,835.61)と並んでおり、MA14(3,829.59)の0.1%上、MA28(3,853.10)の0.5%下に位置している。MA28は3,957付近から依然として下向きに傾斜しているため、価格のすぐ上にある最初の試金石は下降ラインとなる。 15分足では、MA7(3,834.07)、MA14(3,837.19)、MA28(3,833.70)がいずれも価格から0.1%以内の範囲にある。ここではトレンドが出ていないため、中途半端な位置で取引はせず、1時間足ラインへの上昇を待ちたい。 出来高を注視している。15分足のバーは35.812で、MA5の78.281、MA10の99.338に対して残り06:34。1時間足のバーは35.812で、492.822および1.17Kに対して残り51:30となっており、どちらのローソク足も始まったばかりで判断はできない。 両パネルで最も高いバーは3,777.66への急落時の赤いバーであり、その後の回復は静かなものだ。 トレード戦略:1時間足MA28へのリテストで売り - エントリー:3,848~3,858(指値、0.3%~0.6%の上昇が必要) - ストップ:3,870超え - ターゲット1:3,826(3,853から約1.6R) - ターゲット2:3,800(約3.1R) 15分足が3,870を超えて引けた場合は無効とする。1時間足のMA28を超えて引けるようなら、急落分が吸収されたと判断し、撤退するつもりだ。 ゴールドはギャップが生じる可能性があるため、指値注文でポジションサイズは小さく。上昇しなければトレードしない。 #IMPACTbyTrade
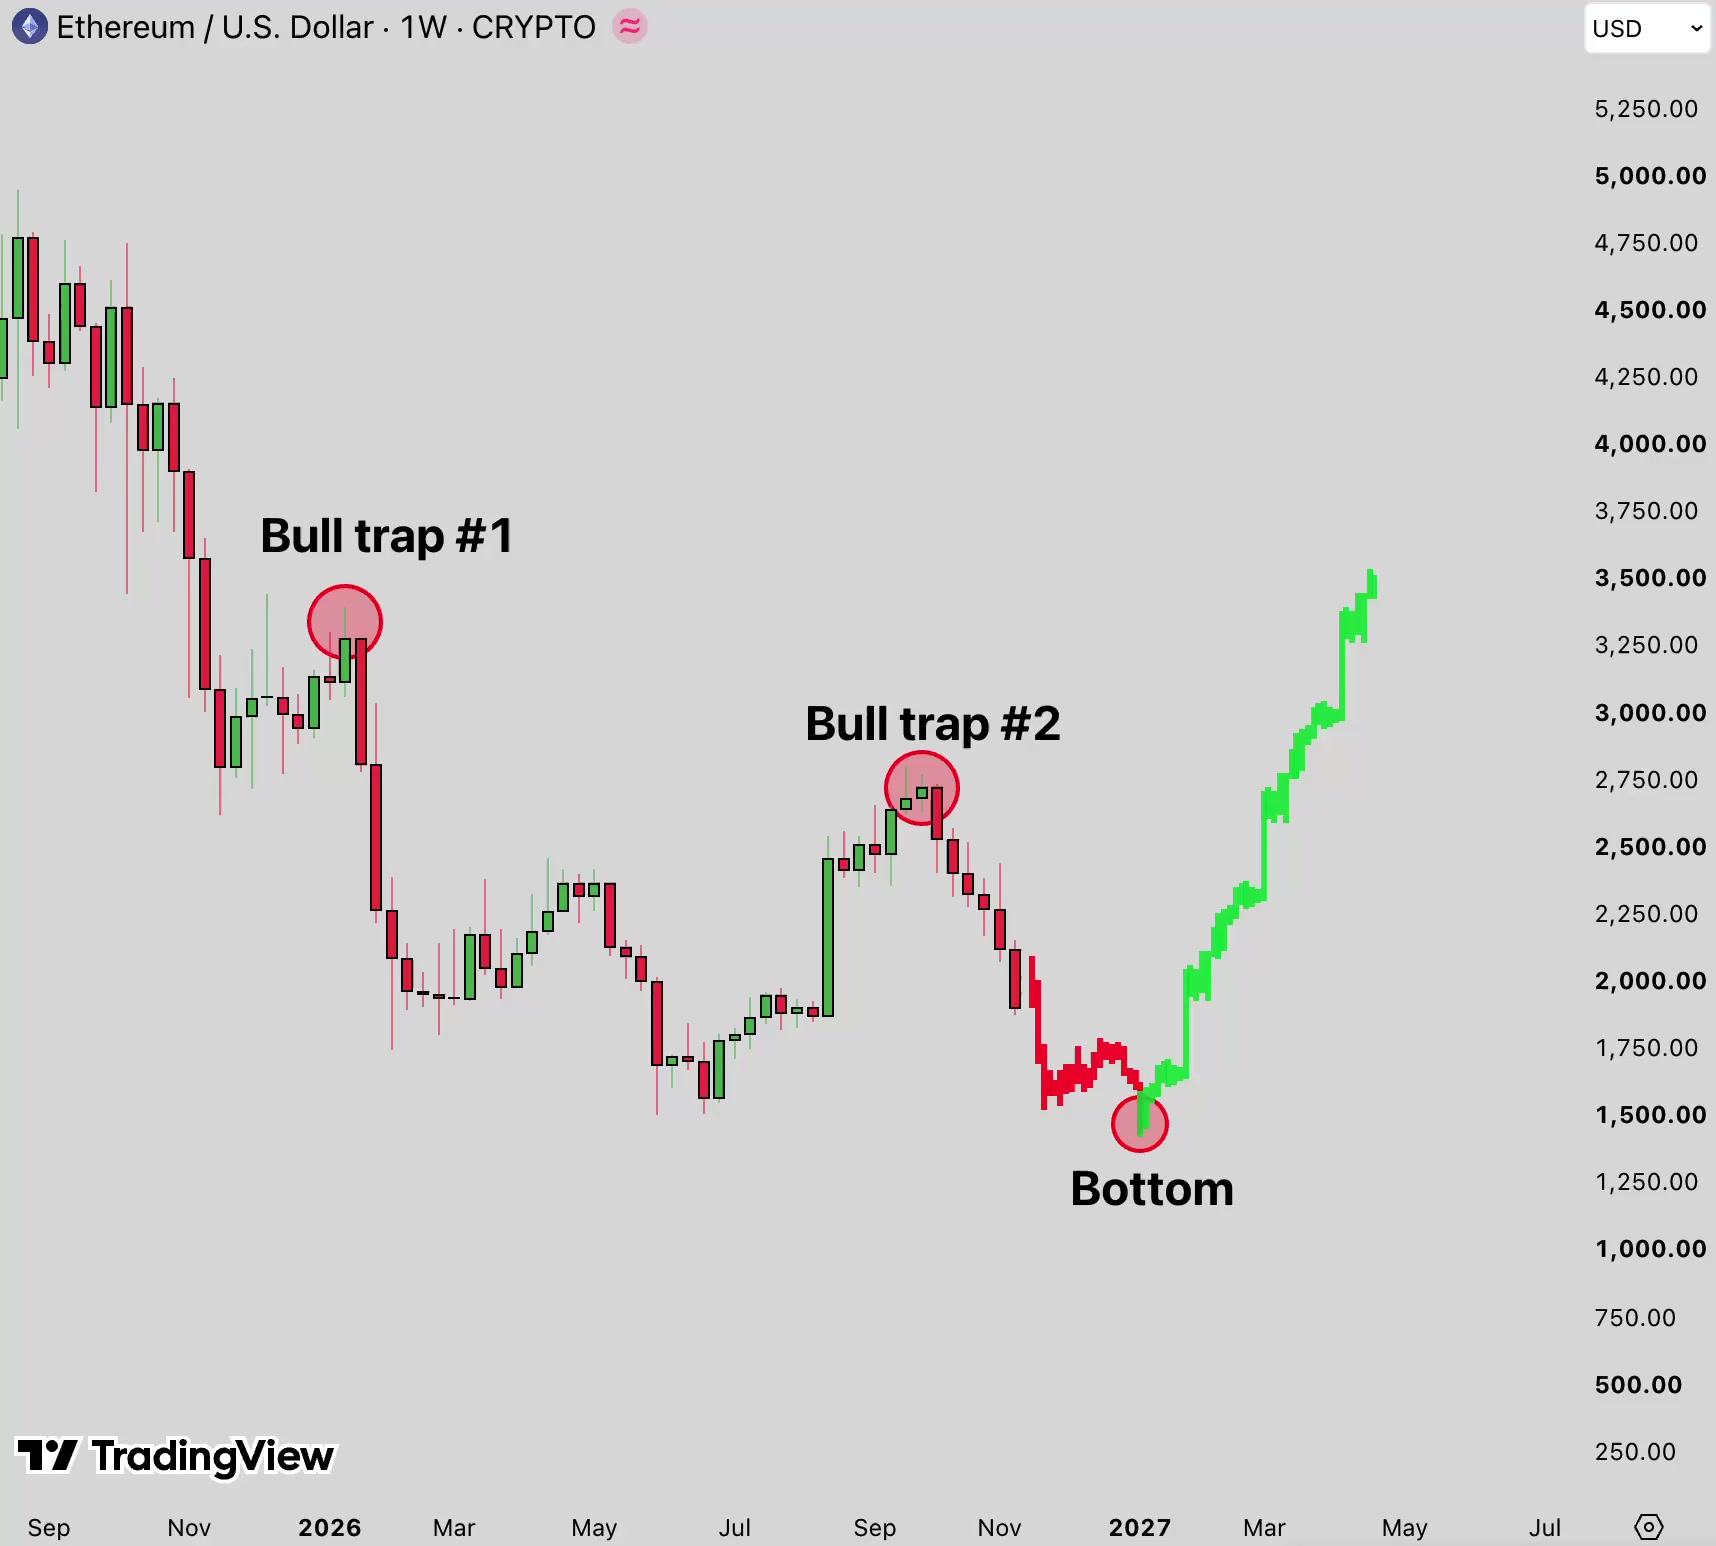
Everyone has a bottom call for ETH right now. I don't need one, I just need a dip I can define, and the hourly chart is giving me one. The video attached shows the bigger picture of ETH's bull traps and where the last flush ended. That's the backdrop. The trade below is built only on today's hourly and 15m charts. $ETHUSDT is at 1,808.04 (-4.72%), inside a 24h range of 1,709.06 to 1,919.14. That puts it 47% of the way up the range, 5.8% above the low and 5.8% under the high. Turnover is 4.08B. The levels I'm watching: Up: 1,816.60 (15m MA7) -> 1,832 (bounce high, my read) -> 1,843.98 (1h MA28) Down: 1,794.39 (1h MA14) -> 1,784.34 (1h MA7) -> 1,777.00 (15m MA28) -> 1,709.06 (24h low) On the 1h, price is over MA7 (1,784.34) and MA14 (1,794.39), by 1.3% and 0.8%, and 2.0% under MA28 (1,843.98). The fast pair has bunched together right under price after the bounce, so I read 1,784 to 1,794 as one support zone. MA28 is still falling, which is why I'm only treating this as a bounce. On the 15m, price is 0.5% under MA7 (1,816.60), 0.1% over MA14 (1,806.53) and 1.7% over MA28 (1,777.00). The last candles are small red ones drifting back toward the averages, which is the kind of dip I'm willing to buy. I'm watching volume. The 15m bar is 2.84K against MA5 6.35K and MA10 12.88K with 12:19 left, still forming. The 1h bar is 2.86K against 97.32K and 124.78K with 57:15 left, just opened. The bounce came on a big green bar and the pullback so far is quiet, so I'm not seeing sellers rush back in. The trade, buying the dip into the 1h pair: - Entry: 1,786 to 1,798 (limit, needs a 0.6% to 1.2% dip) - Stop: below 1,770 - Target 1: 1,830 (~1.7R from 1,792) - Target 2: 1,844 (~2.4R) Invalid if the 15m closes below 1,770, because that loses the 15m MA28 and the 1h MA7 together and the bounce is over. My thinking is to stay small, since the bigger trend is still down. Limit orders, small size, and no dip, no trade. #IMPACTbyTrade
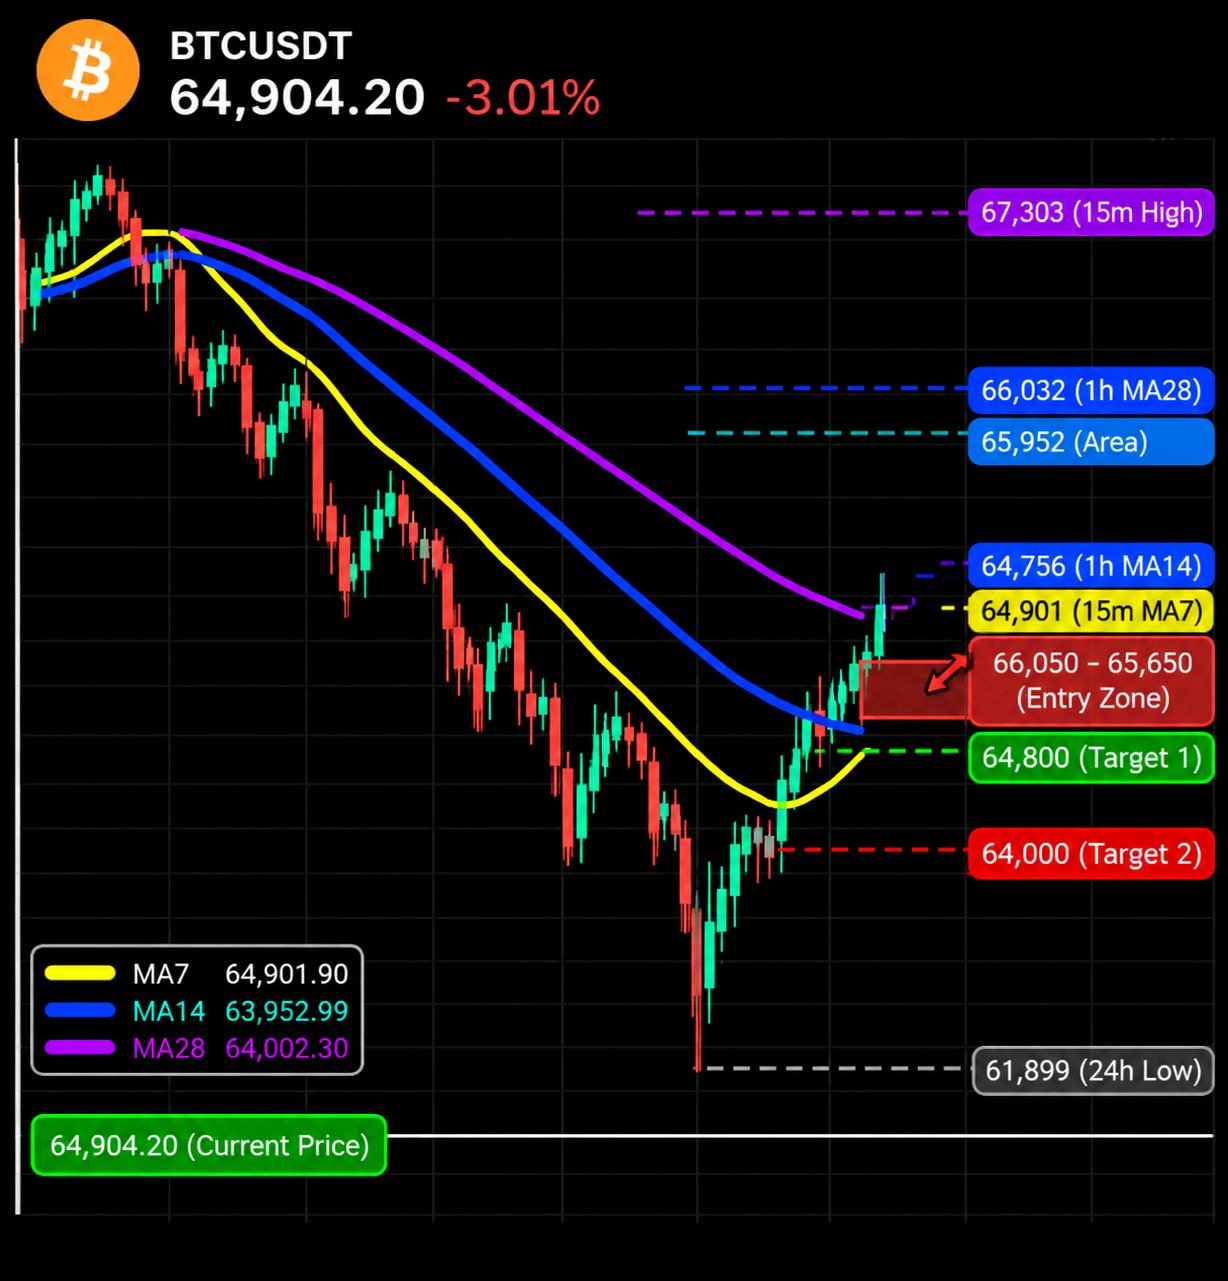
下落相場の中での5%の反発は、何かの始まりか、あるいは罠かのどちらかだ。価格の上にある1時間足の移動平均線が、どちらかを教えてくれるだろう。 $BTCUSDTは64,904.20 (-3.01%)で、24時間のレンジは61,899.20から67,496.00だ。 これはレンジの54%の位置で、安値から4.9%上、高値から3.8%下にある。 売買高は99.3億ドルだ。 私が使っているマップ: 上値:65,952(チャートのグリッドライン、エリアとして) -> 66,032(1時間足 MA28) -> 67,303(15分足チャートの高値) 下値:64,757(1時間足 MA14) -> 64,002(15分足 MA28) -> 61,899(24時間安値) 1時間足では、価格はMA7(63,975.22)とMA14(64,756.66)を1.4%と0.2%上回って戻したが、依然としてMA28(66,032.35)を1.7%下回っている。その線は数日間、平坦な動きを見せることなく下向きに推移している。 この反発は一本の大陽線によるものなので、MA28はゴールではなく、最初の真の試金石として扱う。 15分足では、価格はMA7(64,901.90)のちょうど上にあり、MA14(63,952.99)とMA28(64,002.30)をそれぞれ1.5%、1.4%上回っている。 ラダー(MA群)は価格の下で上向きに転じており、それなりの反発だが、直近の数本のローソク足は小さく重なっており、二段上げではなく小休止のように見える。 出来高を注視している。15分足の出来高は530.289で、MA5の1.79K、MA10の3.18Kと比較している。1時間足の出来高は7.29Kで、11.14Kや9.59Kと比較しており、どちらも残り11分ほどなので確定ではない。 1時間足パネルで最も長いバーは下落時の赤色のバーであり、この反発にまだ余地があると信じるには、本格的な急騰が必要だ。 トレード戦略:1時間足MA28へのリテストで売り - エントリー:65,650〜66,050(指値、1.1%〜1.8%の反発が必要) - ストップ:66,450超え - ターゲット1:64,800(65,850から約1.8R) - ターゲット2:64,000(約3.1R) 15分足が66,450を超えて引けたら無効。1時間足MA28を超えて引ければ、この下落局面全体が底固めになってしまうと考えているので、その場合は手出し無用とする。 指値注文、控えめなサイズで。リテストがなければトレードなし。もし価格が65,650まで戻らなければ、ただ見守るだけだ。 #IMPACTbyTrade

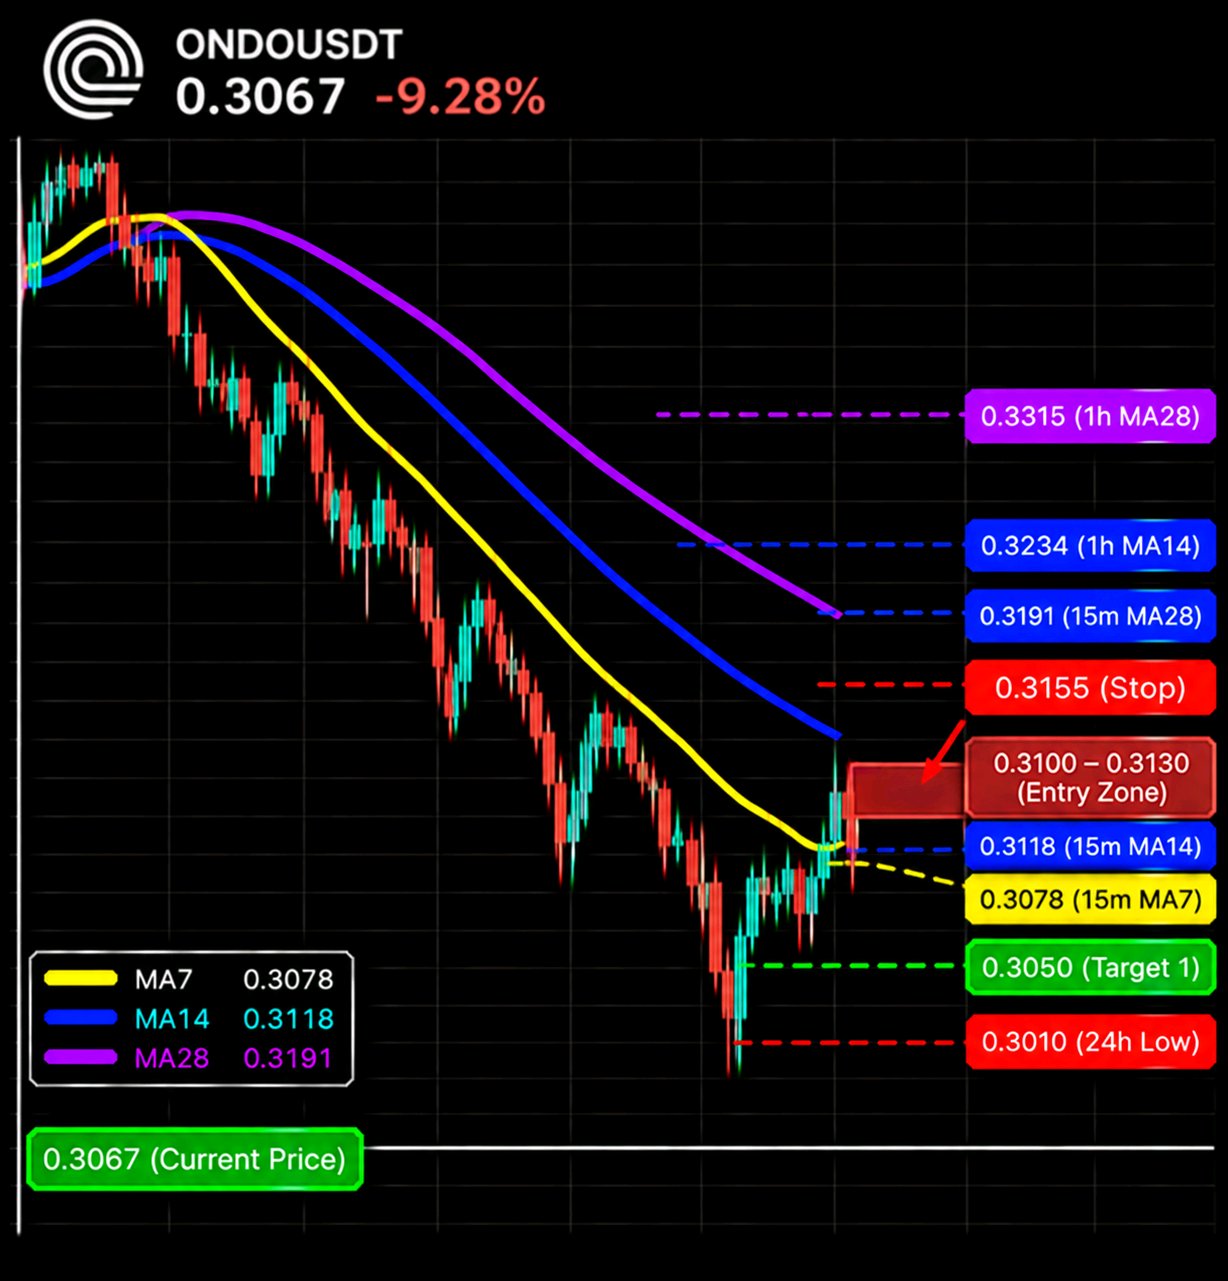
ONDO is down almost a tenth on the day and the chart still doesn't look finished to me. Every average above price is falling, and that's the part I trust more than the percentage $ONDOUSDT is at 0.3067 (-9.28%), inside a 24h range of 0.3038 to 0.3465. That puts it 7% of the way up the range, 1.0% above the low and 11.5% under the high. Turnover is 30.40M My levels: Up: 0.3078 (15m MA7) -> 0.3118 (15m MA14) -> 0.3173 (1h MA7) -> 0.3191 (15m MA28) Down: 0.3038 (24h low) -> 0.3010 (my estimate) On the 1h, price is under MA7 (0.3173), MA14 (0.3234) and MA28 (0.3315), by 3.5%, 5.4% and 8.1%. They are fanned out in order and every one is sloping down, and the last few 1h candles fell through them with barely a pause On the 15m, price is under MA7 (0.3078), MA14 (0.3118) and MA28 (0.3191), by 0.4%, 1.7% and 4.0%. After the flush there is a small base of candles at the low, but none of them has closed back over the fast average, so I'm waiting for the bounce to come to the MA14, not selling the floor I'm watching volume. The 15m bar is 234.05K against MA5 1.62M and MA10 2.19M with 11:16 left, still forming, so I'm not judging it. The 1h bar is 1.10M against 8.40M and 5.04M with 41:12 left, just opened. The tallest bars on both charts are the red ones on the drop, and the base since has been light The trade, sell the bounce into the 15m MA14: - Entry: 0.3100 to 0.3130 (limit, needs a 1.1% to 2.1% bounce) - Stop: above 0.3155 - Target 1: 0.3050 (~1.6R from 0.3115) - Target 2: 0.3010 (~2.6R) Invalid if the 15m closes above 0.3155. My thinking is that a reclaim of the 1h MA7 area would mean the flush is being bought, and I'd stay out Limit orders, small size after a move this fast, and no bounce, no trade. I would rather miss it than short the low. #IMPACTbyTrade

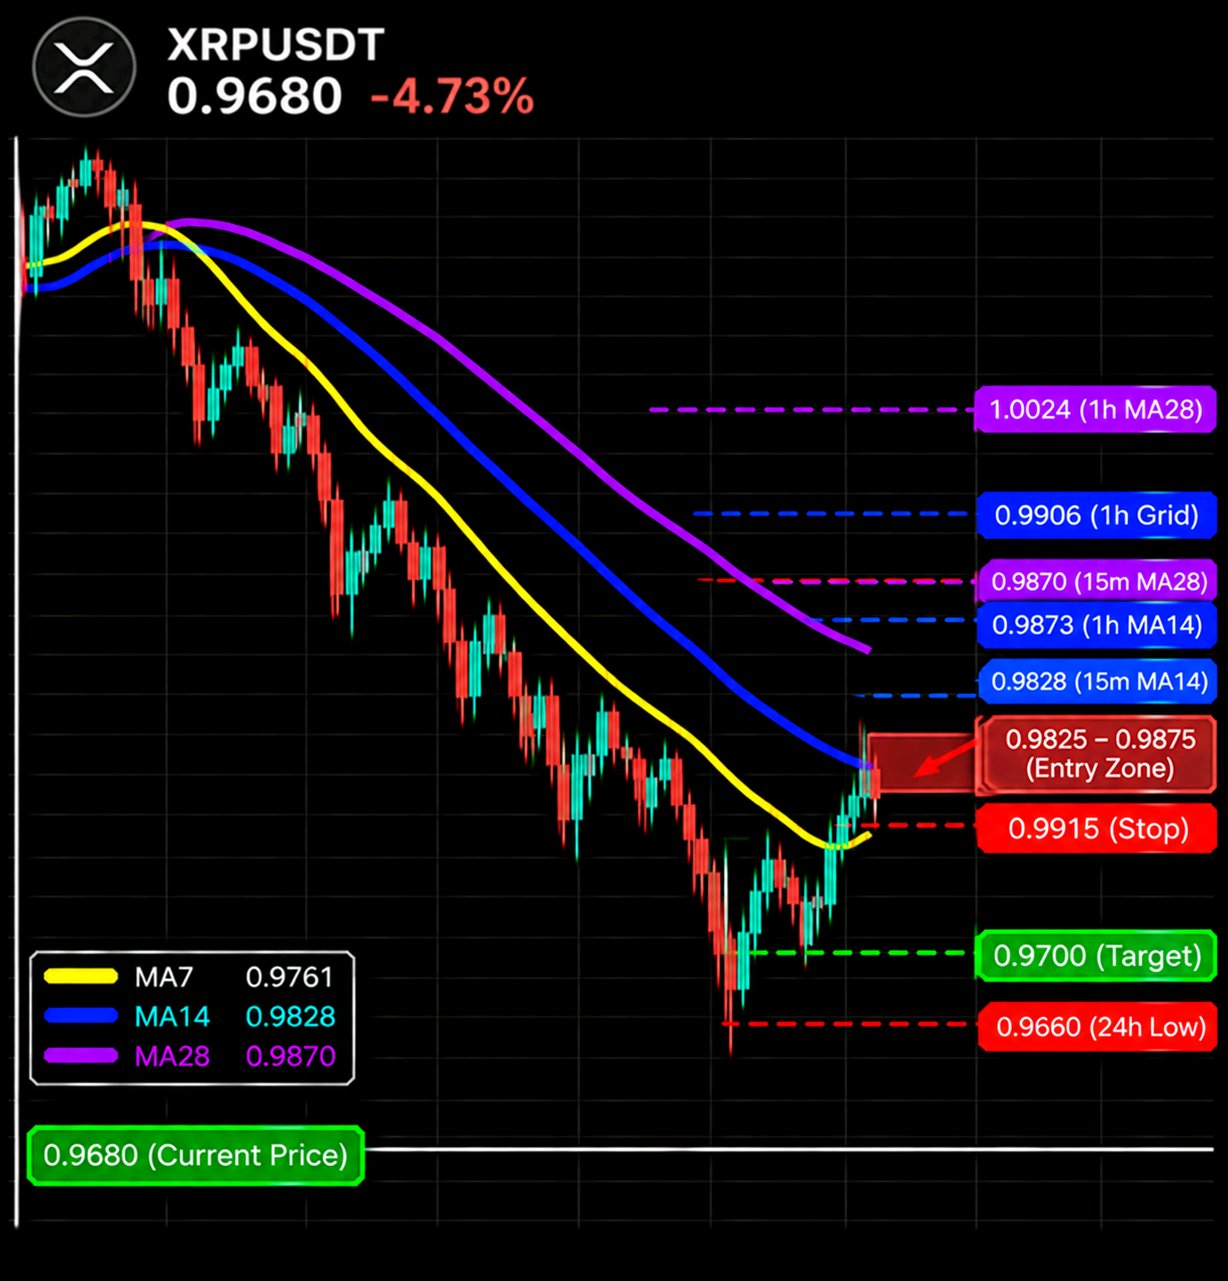
Five coins on my screen are down 5% to 10%, and XRP is sitting 0.2% off its low. I'm not selling that low. I'm waiting for it to climb back to the shelf it just fell through $XRPUSDT is at 0.9680 (-4.73%), inside a 24h range of 0.9660 to 1.0294. That puts it 3% of the way up the range and 6.0% under the high, on 364.39M of turnover. On the 1h it has slid 9.3% from 1.0645 to 0.9660, and the 15m shows it holding a shelf around 0.979 to 0.992 for hours before it let go The zone I'd use is 0.9825 to 0.9875: Up: 0.9761 (15m MA7) -> 0.9828 (15m MA14) -> 0.9847 (1h MA7) -> 0.9870-0.9873 (15m MA28 / 1h MA14) -> 0.9906 (1h gridline) -> 1.0024 (1h MA28) Down: 0.9660 (24h low) On the 1h, MA7 (0.9847), MA14 (0.9873) and MA28 (1.0024) are in bearish order and all pointing down, with price 1.6%, 1.9% and 3.4% under them. On the 15m, MA7 (0.9761), MA14 (0.9828) and MA28 (0.9870) fall the same way, with price 0.8%, 1.5% and 1.9% under them. Four averages are stacked inside half a percent right where the old shelf used to be The volume says the drop wasn't a fluke. The 1h bar on the move to 0.9660 is one of the biggest on the chart. The current 15m candle shows 2.05M with about six minutes left, against 9.61M and 8.54M, so I'm not calling that low yet, and the 1h candle just opened, so I'm ignoring its 2.06M My plan, selling the bounce into the old shelf: - Entry: 0.9825 to 0.9875 - Stop: above 0.9915 - Target: 0.9700 (~2.3R from the 0.9850 midpoint) No second target from me, because I can't see a level under the 24h low. It needs a bounce of 1.5% to 2.0% to reach the zone, and I only want it if price stalls there. I'm wrong if a 15m candle closes above 0.9915, back over the shelf and every average. How I see it: if the bounce stalls under that stack, the 0.9660 low gets tested again before anything else happens On a day like this, a stop of about 0.6% can get wicked by one candle. I'd keep size modest and use limit orders. If price never bounces into the zone, I simply have no trade I'd rather sell a shelf that already broke than a low that's still printing #IMPACTbyTrade

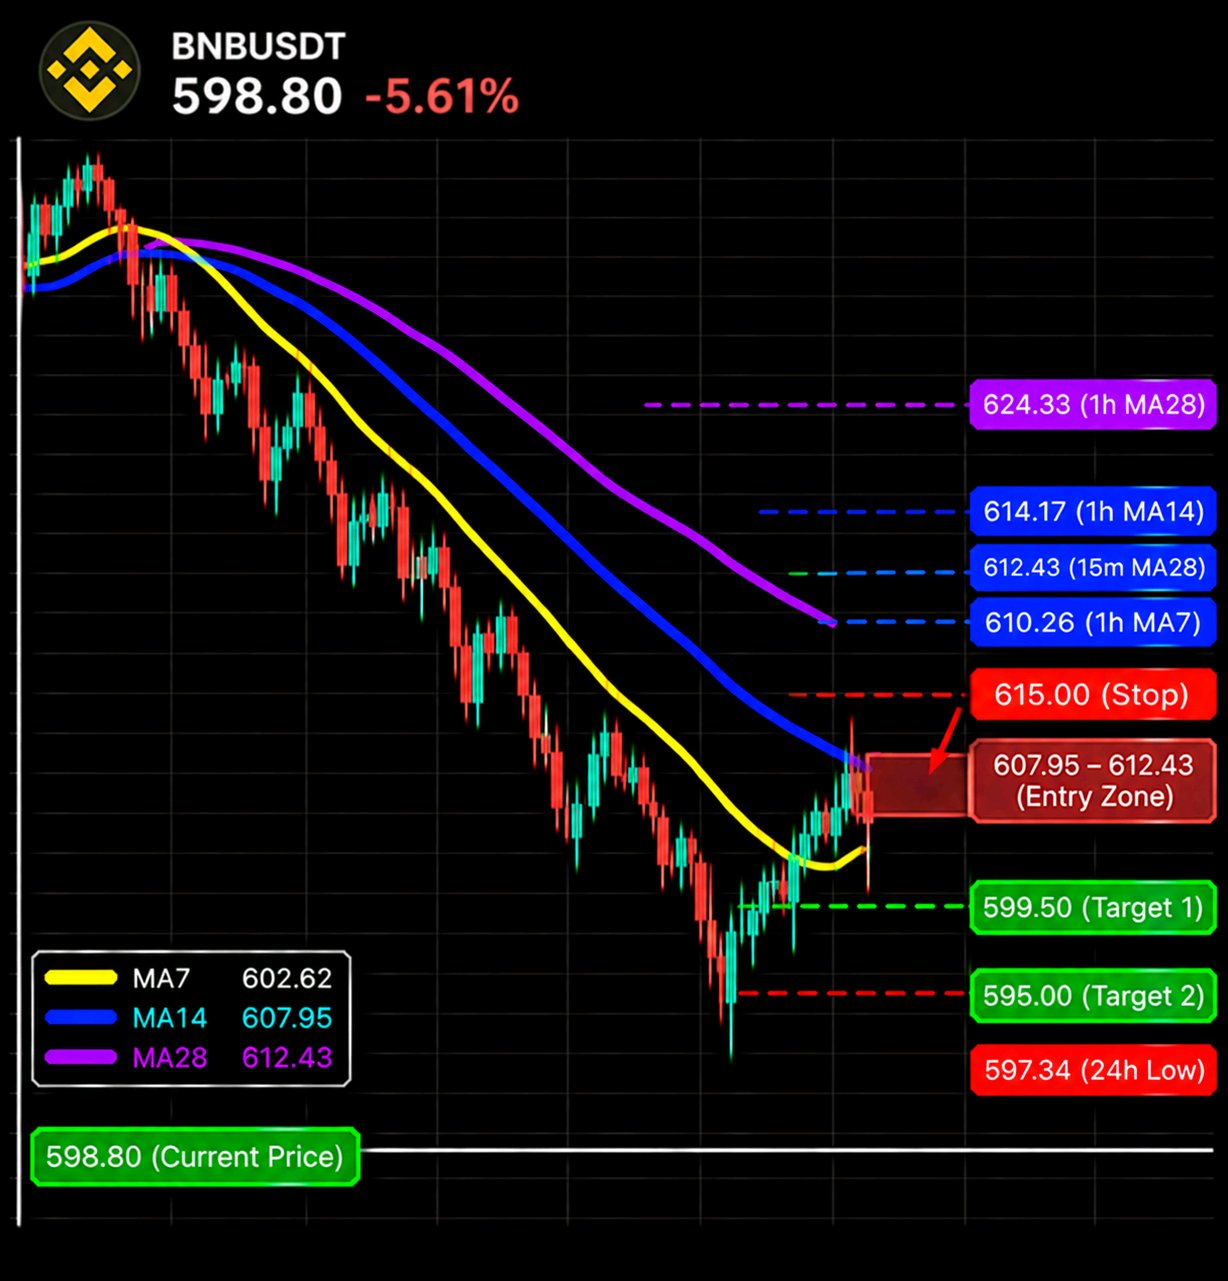
BNBは午後6時頃から一直線に下げ続けており、私が唯一エントリーを検討するのは、ようやく反発して戻したタイミングです。 $BNBUSDTは現在-5.61%の598.80で、安値597.34から0.24%高く、高値638.95から6.7%低い水準です。24時間レンジで見ると底に近い約3.5%の地点で、取引高は31.09Mです。 これまでの滞留レンジだった615から621のエリアを突き抜け、その後は反発もほとんどないまま、陰線が連続して出現しました。 私が注目しているのは、売り圧力が落ち着いてきた点です。直近の15分足を見ると、出来高は428で、MA5の1.57K、MA10の1.33Kに対して約0.3倍にとどまっており、それまでの大きな出来高を伴うローソク足が続いていた後としては変化が見られます。 1時間足の出来高は431で、MA7の3.06K、MA14の2.30Kに対してという状況ですが、まだ始まったばかりの時間足です。安値圏での沈静化は反発が近いサインかもしれません。とはいえ、売り手が完全に引いたわけではないので、戻りを待ってからエントリーしたいと考えています。 移動平均線(すべて現在価格より上): 15分 MA7 602.62 (+0.6%) 15分 MA14 607.95 (+1.5%) 1時間 MA7 610.26 (+1.9%) 15分 MA28 612.43 (+2.3%) 1時間 MA14 614.17 (+2.6%) 1時間 MA28 624.33 (+4.3%) 15分MA7(602.62)は短期線であり、安値に近すぎるため売るには不向きです。私が注目しているゾーンは15分MA14、1時間MA7、15分MA28が重なる607.95から612.43のエリアです。 上値:602.62 -> 607.95 / 610.26 / 612.43 -> 614.17 -> 624.33 -> 638.95 (24時間高値) 下値:597.34 (24時間安値)、それ以下の明確なサポートなし 今回のトレード(反発が見られた場合のみ): エントリー:607.95から612.43。価格が到達し、そこで停滞を確認した後(612.43を超えて引けないローソク足が1〜2本出る)。つまり、一旦1.5%から2.3%の反発があるということです。 損切り:615.00の上、1時間MA14の614.17の上方 ターゲット1:599.50、安値597.34の少し上(リスクリワード約2.2R) ターゲット2:595.00、安値を割った場合(リスクリワード約3.2R)。597.34以下はマップされていないため、測定による目安です。 もし反発せずに597.34を下回って推移した場合は、手出し無用です。もし15分足が615.00を超えて確定したら、売り手が反発を制圧したと判断し、このシナリオは無効です。 R(リスク)はゾーンの中央(610.19)から算出し、損切り幅は約0.8%離した位置に設定します。損切りが痛手にならないよう、ポジションサイズは小さく抑えてください。投資助言ではありません。 正直なところ、安値で何もせずに待つのが一番辛いですね。 #IMPACTbyTrade

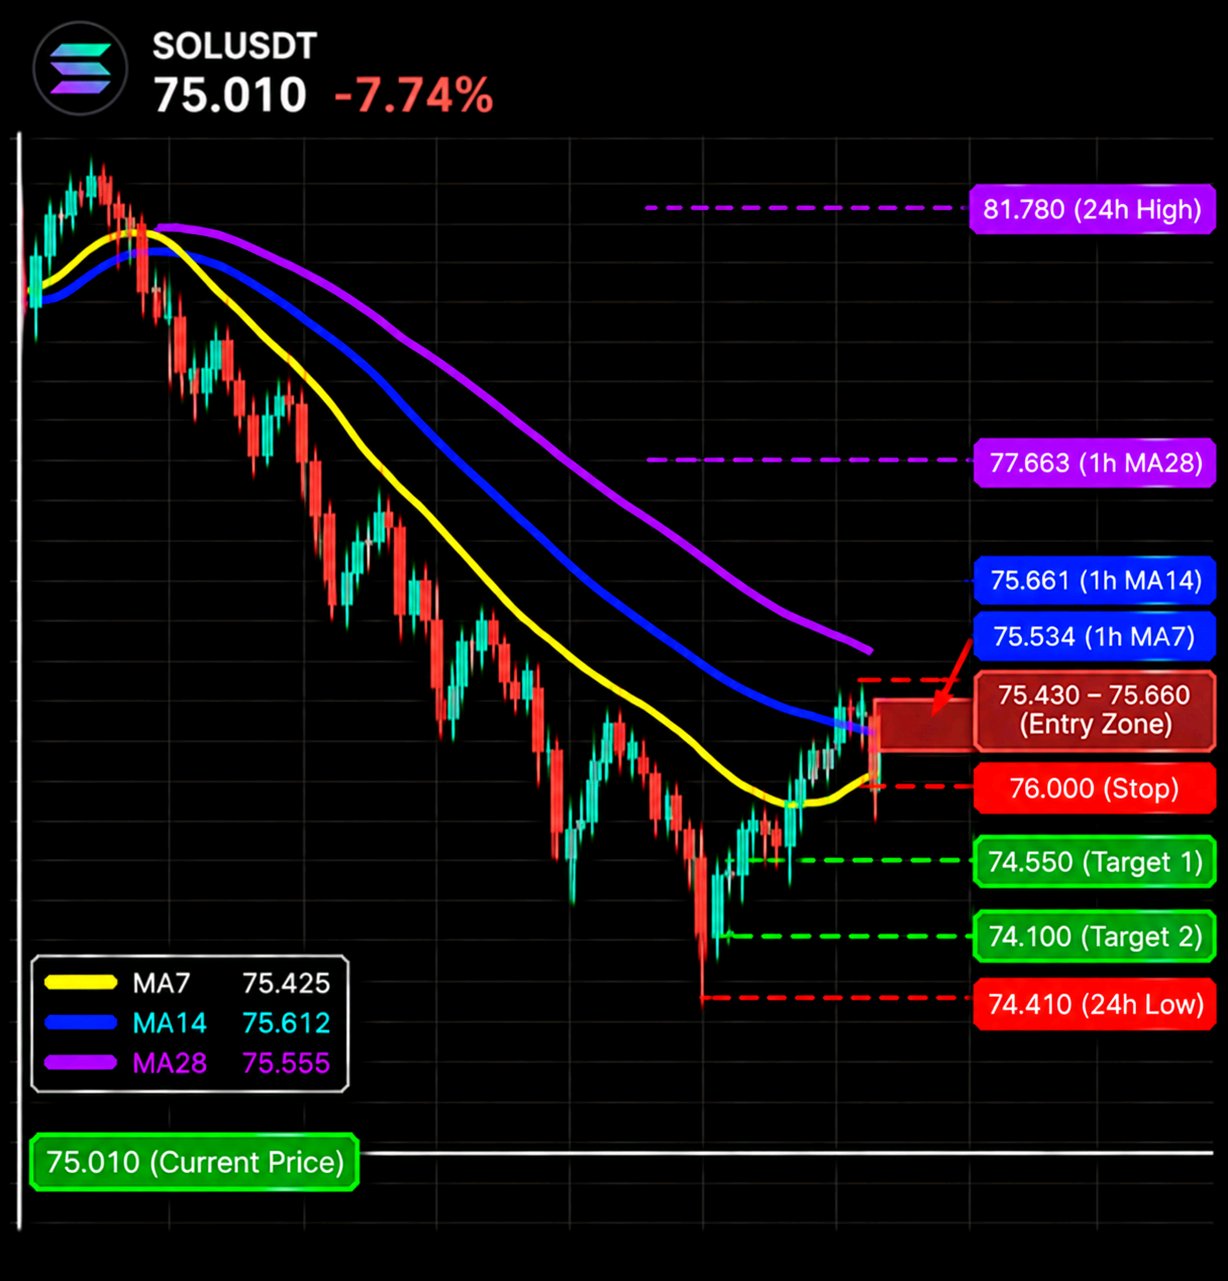
SOLは6時間停滞していたが、一本のローソク足で底を割った。深追いはしない。まずは反発が失敗するのを確認したい。 $SOLUSDTは現在-7.74%の75.010で、安値74.41から0.8%上、高値81.78から9.0%下と、24時間レンジのわずか8%程度の位置にいる。この通貨が停滞していたレンジはおおよそ75.0から75.9(12:15〜18:45)だった。 出来高は6億892万で、今日見た他のどの銘柄よりも10倍以上多く、これらの水準は決して薄いものではない。 ここでのポイントは出来高だ。15分足で258.82K(MA5の103.61K、MA10の71.92Kに対して約2.5倍、3.6倍)。1時間足も258.96Kとほぼ同じ数字なので、1時間足が始まったばかりで、たった一本のローソク足がすべてを叩き出したことになる。 これはすでに1時間足のMA5(182.41K)の1.4倍、MA10(193.16K)の1.3倍に達している。どちらの足も形成中なので、確定足で裏付けが必要だ。 移動平均線(すべて価格より上): 15m MA7 75.425 (+0.6%) 15m MA28 75.555 (+0.7%) 15m MA14 75.612 (+0.8%) 1h MA7 75.534 (+0.7%) 1h MA14 75.661 (+0.9%) 1h MA28 77.663 (+3.5%) 15分足の3本は0.25%のバンド内に収まっており、1時間足のMA7とMA14もそこに重なっている。6本の別々の線ではなく、1つのクラスター(75.43〜75.66)として見ている。 上値抵抗: 75.43 / 75.56 / 75.61 -> 75.66 -> 77.66 (1h MA28) -> 81.78 (24h高値) 下値支持: 74.41 (24h安値)、それより下は未知数 プラン: リテスト時のみ売り。 エントリーは75.43から75.66の間で、価格が到達して停滞した場合のみ。これにはまず0.6%から0.9%の反発が必要だ。 ストップは76.00の上、レンジの上端と1時間足MA14の上。 ターゲット1: 74.55、安値74.41の少し上(約2.2R) ターゲット2: 74.10、安値を割った場合(約3.2R) 74.41より下に明確な水準は見当たらないため、これは計測に基づく移動となる。 もし74.41を割り込んでそのままリテストなしで続落しても、追わない。もし15分足が76.00を超えて確定したら、レンジが維持されているということであり、自分のシナリオは間違いだ。 Rはゾーンの中間(75.545)から計算し、ストップは0.6%離した。ストップが小さいため、ポジションサイズも小さくする。投資助言ではない。 誰か他にこの銘柄で75.43〜75.66を監視している人はいる? #IMPACTbyTrade

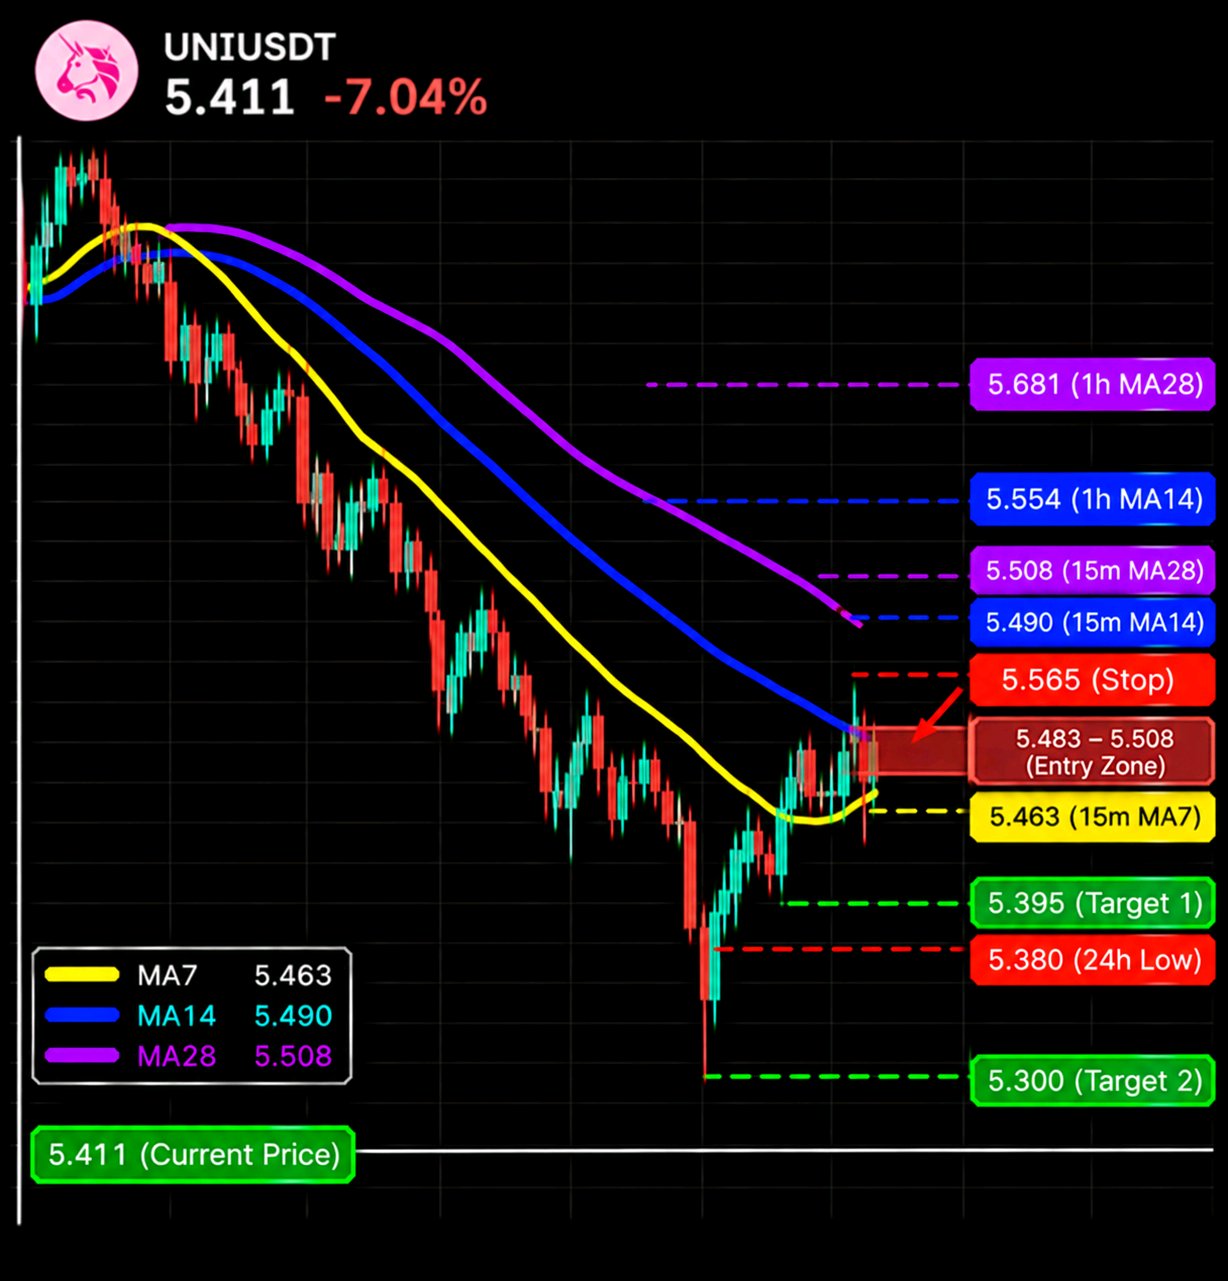
Everything on my list is bleeding, but UNI is the only one I'd want to sell, and only after it bounces $UNIUSDT is at 5.411 (-7.04%), only 0.6% above the 5.380 low and about 5% of the way up a 24h range that tops out at 6.022 (11.3% overhead). Turnover is 34.73M, so there is real money behind this move Volume read: the current 15m candle shows 210.25K against 79.67K (MA5) and 56.41K (MA10), roughly 2.6x and 3.7x The 1h bar shows 210.41K, almost the same number, which tells me the hour has barely started and nearly all of it came in one candle. It already beats the 1h MA10 (191.43K). Both candles are still open, so I treat it as heavy selling that the close still has to confirm The averages (all above price): 15m MA7 5.463 (+1.0%) 15m MA14 5.490 (+1.5%) 15m MA28 5.508 (+1.8%) 1h MA7 5.483 (+1.3%) 1h MA14 5.554 (+2.6%) 1h MA28 5.681 (+5.0%) Fast under slow on both timeframes and price under all six. Up: 5.463 / 5.490 / 5.508 -> 5.554 -> 5.681 -> 6.022 (24h high) Down: 5.380 (24h low), nothing visible below it My plan (sell the bounce only): Entry 5.483 to 5.508 (1h MA7 plus the 15m MA14 / MA28). That needs a 1.3% to 1.8% bounce first, and I want to see price reach the zone and stall there, not tag it and short blindly Stop above 5.565 (a reclaim of the 1h MA14 at 5.554 means this is no longer a weak bounce) Target 1: 5.395, just above the 5.380 low (about 1.4R) Target 2: 5.300 if the low gives way (about 2.8R) There is no level visible under 5.380, so that one is a measured move, not a mapped one. If it slides through 5.380 without ever bouncing, I don't chase it. I let that one go and wait for the next retest. R is counted from the middle of the zone (5.4955) with a stop about 1.3% away, so a stop-out stays small. Size it that way. Not financial advice. Would you rather wait for the bounce or take the low? I know which one has hurt me more. #IMPACTbyTrade

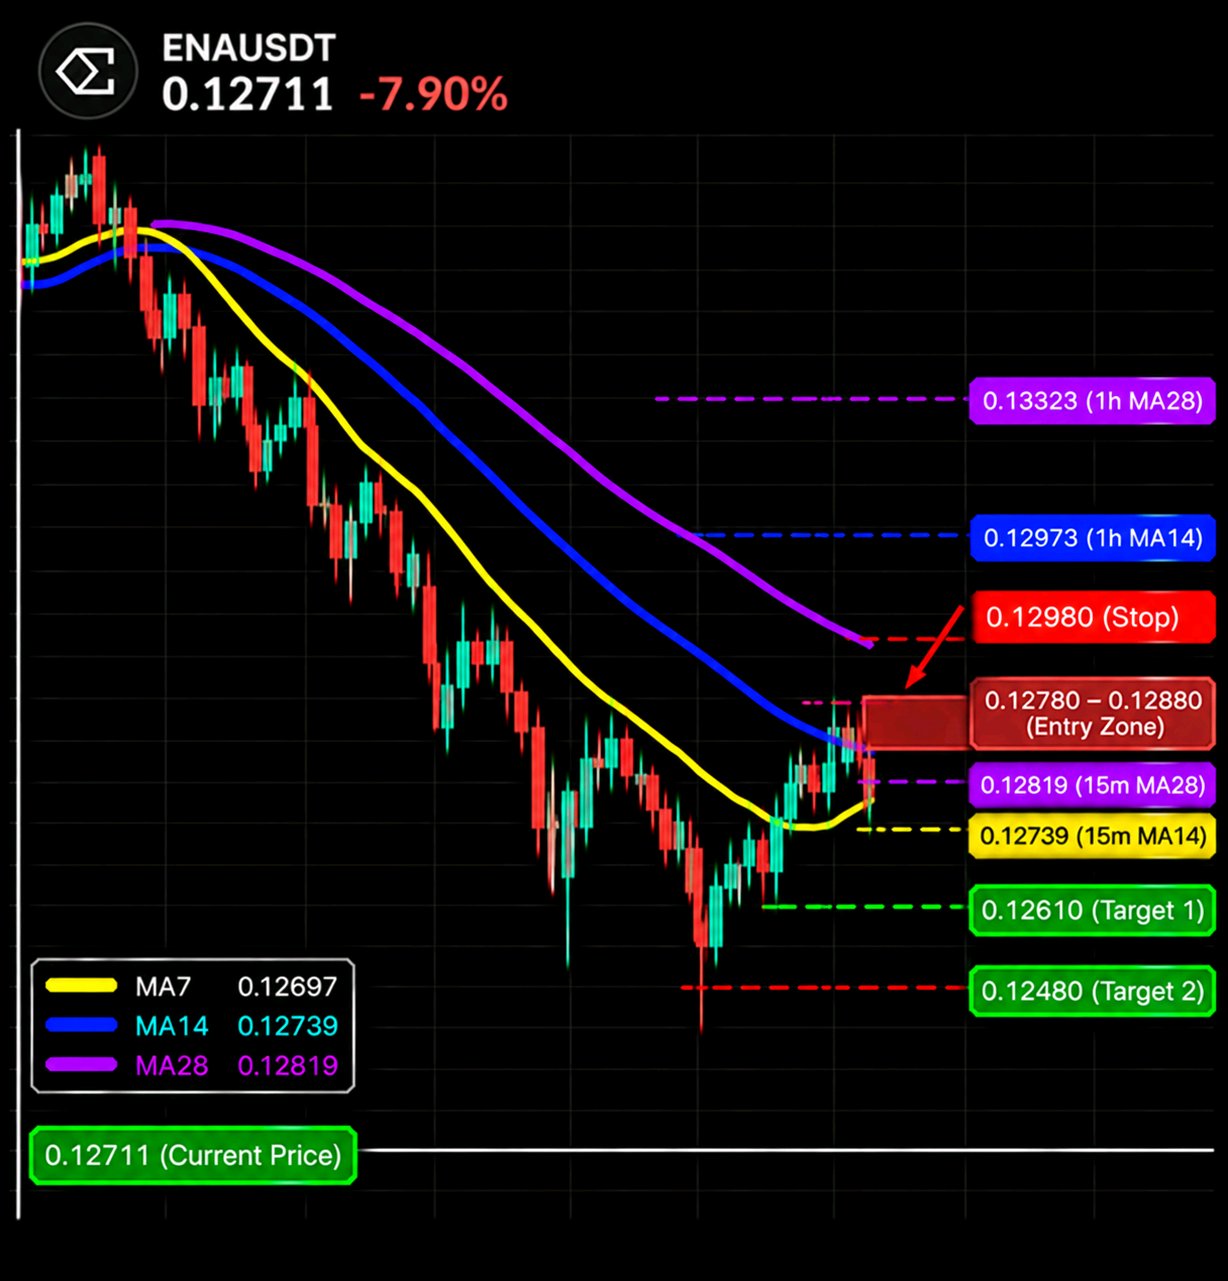
ENAを見ていると、8%下げてもまだ割安感がないということを思い知らされる。すべての時間足の移動平均線が上にあって、どれも横ばいになっていないからだ。 $ENAUSDTは0.12711 (-7.90%)で、24時間のレンジは0.12598から0.14258。レンジの下限から7%の位置にあり、安値から0.9%上、高値から10.9%下となっている。出来高は75.54M。 注目ポイント: 上値: 0.12739 (15分足 MA14) -> 0.12772 (1時間足 MA7) -> 0.12819 (15分足 MA28) -> 0.12973 (1時間足 MA14) 下値: 0.12598 (24時間安値) -> 0.12480 (想定ライン) 1時間足では、価格はMA7 (0.12772)、MA14 (0.12973)、MA28 (0.13323) をそれぞれ0.5%、2.0%、4.6%下回っている。これらはパーフェクトオーダーで綺麗に並んでいて、幅も開いており、3本とも下向きのままなので、買い方が主導権を握っているような区間は全くない。 15分足では、価格はMA7 (0.12697) を0.1%上回っているが、MA14 (0.12739) を0.2%、MA28 (0.12819) を0.9%下回っている。ローソク足は短期線の周りで揉み合っているので、この中途半端な位置でショートは打ちたくない。戻りを待って、しっかり利益を狙いたい。 出来高にも注目している。15分足は残り12分39秒で出来高396.20K(対MA5: 2.95M、MA10: 3.52M)、1時間足は残り57分37秒で405.97K(対MA: 10.72M、20.37M)。どちらもローソク足が始まったばかりなので判断は早いが、両チャートとも出来高が急増したのは下落時であって、その後の小さな戻りではない。 個人的な見解:戻りが頭打ちになりそうな最初のスポットは、1時間足MA7と15分足MA28付近で、これらは互いに0.4%以内に収まっている。その上の1時間足MA14を超えてくれば、戻りが本物だと判断できるラインになる。 トレード戦略(戻り売り): - エントリー: 0.12780 ~ 0.12880 (指値、0.5%~1.3%の戻りが必要) - 損切り: 0.12980超え - ターゲット1: 0.12610 (0.12830から約1.5R) - ターゲット2: 0.12480 (約2.3R) 15分足が0.12980を超えて確定したら、シナリオ崩れ。価格が1時間足MA14を奪還したことになるので、その時は撤退する。 ロットは小さめに、指値のみで。0.12780まで戻らなければ、トレードは見送り。 #IMPACTbyTrade

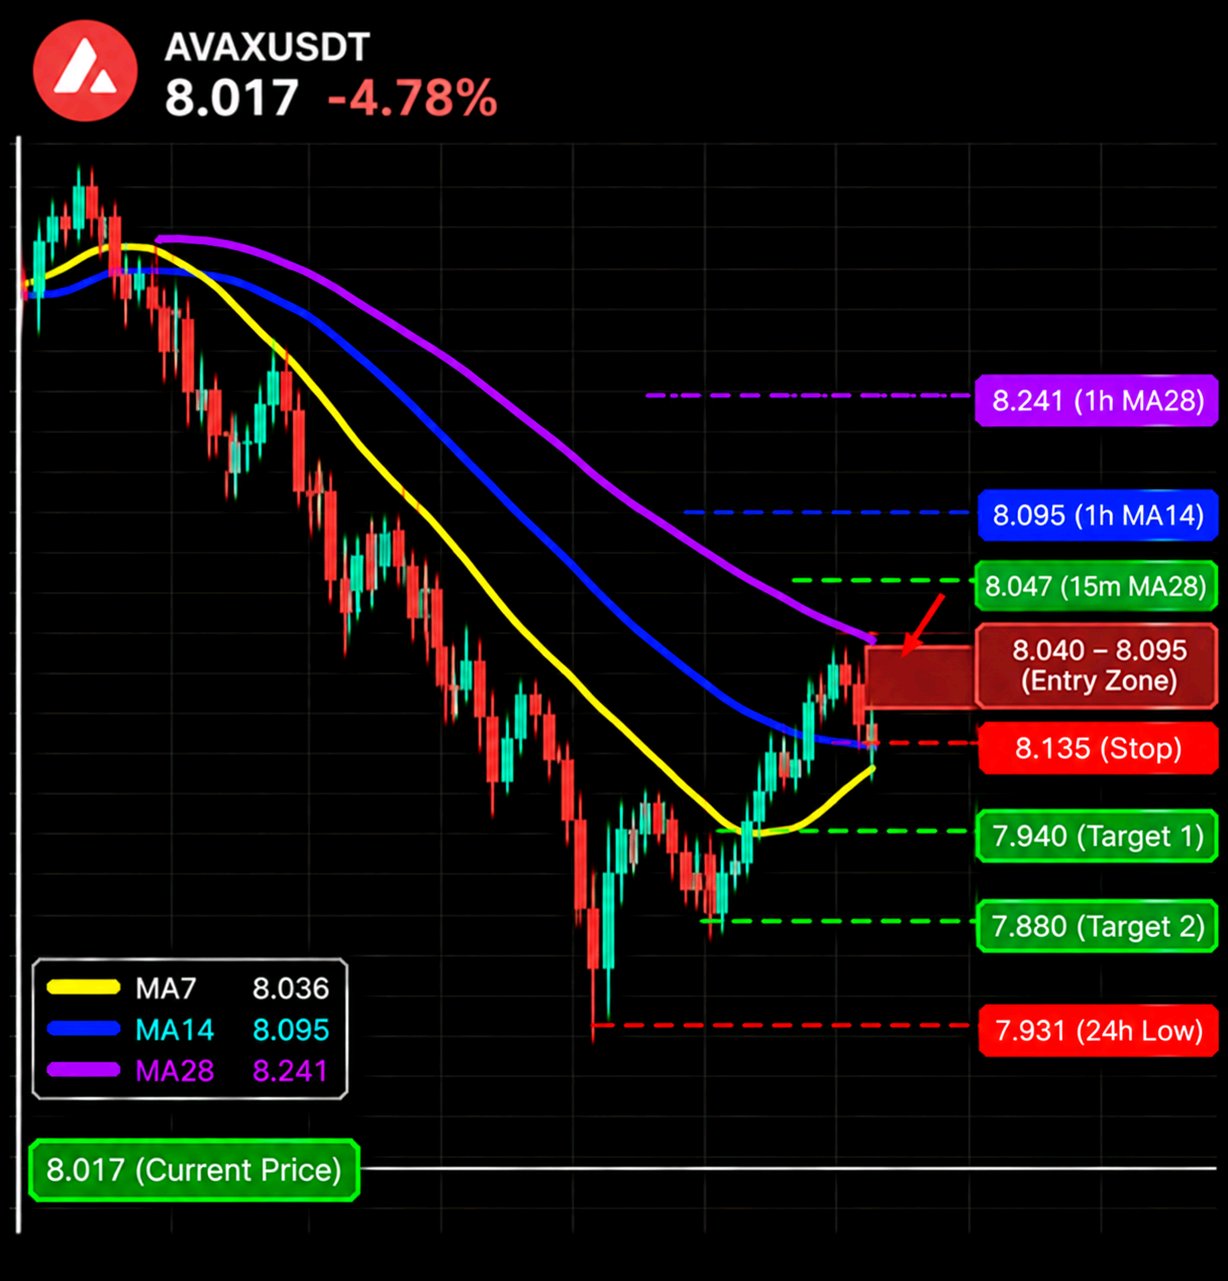
AVAX has been giving back the same ground all afternoon, and the hourly chart shows exactly where each bounce has been running out of air. $AVAXUSDT is at 8.017 (-4.78%), inside a 24h range of 7.931 to 8.629. That puts it 12% of the way up the range, 1.1% above the low and 7.1% under the high. Turnover is 29.73M Here is the map I'm using: Up: 8.036 (1h MA7) -> 8.047 (15m MA28) -> 8.095 (1h MA14) -> 8.241 (1h MA28) Down: 7.931 (24h low) -> 7.880 (my estimate) On the 1h, price is under MA7 (8.036), MA14 (8.095) and MA28 (8.241), by 0.2%, 1.0% and 2.7% The three are fanned out and pointing down, and every bounce since the 8.45 area has topped out at the fast line, so I read 8.04 to 8.10 as the area where the next one has to prove itself. On the 4h, price is also under MA7 (8.208), MA14 (8.279) and MA28 (8.378), by 2.3%, 3.2% and 4.3%, so the bigger picture is leaning the same way. On the 15m, price is level with MA14 (8.018) and 0.1% over MA7 (8.012), but 0.4% under MA28 (8.047). The last candle is a small green one that has only just reached the fast lines, so I'm not selling this exact price, I'm waiting for a little more. Volume is light. The 1h bar shows 15.23K against MA5 119.19K and MA10 141.10K with 44:26 left, so it is still early in the candle and I won't judge it. The 15m bar was 12.48K against 18.32K and 20.09K when I looked. The tall bars on this chart came on the drops and this bounce has none, so I lean toward selling into it. My plan, selling the bounce into the 1h averages: - Entry: 8.040 to 8.095 (limit, needs a 0.3% to 1.0% bounce) - Stop: above 8.135 - Target 1: 7.940 (~1.9R from 8.068) - Target 2: 7.880 (~2.8R) I'm wrong if the 15m closes above 8.135, because then price has taken back the 1h MA14 and I'd step aside. Small size, limit orders only. If it never reaches 8.040, there is no trade, and I'm fine with that. #IMPACTbyTrade

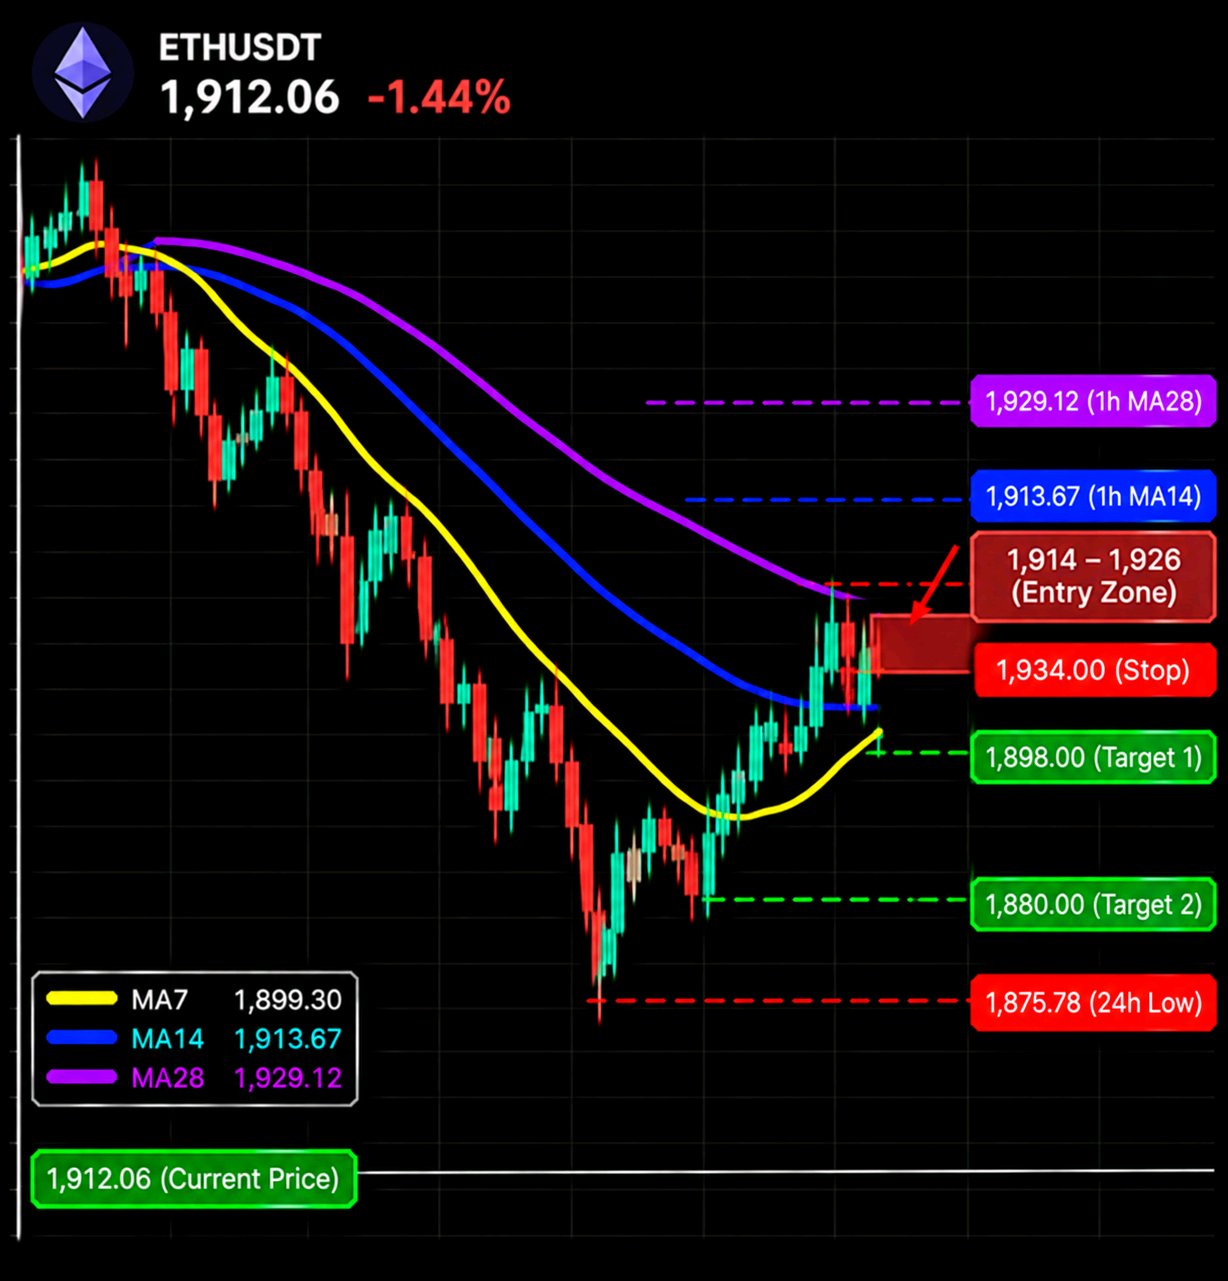
ETH has spent the last few hours climbing off 1,875, and the climb is walking straight into the hourly averages, which is the one place I'd expect it to get tired. $ETHUSDT is at 1,912.06 (-1.44%), inside a 24h range of 1,875.78 to 1,988.67. That puts it 32% of the way up the range, 1.9% above the low and 3.9% under the high Turnover is 2.39B. The ceiling I'm marking: Up: 1,913.67 (1h MA14) -> 1,929.12 (1h MA28) -> 1,952.21 (15m chart high) Down: 1,903.73 (15m MA7) -> 1,899.67 (15m MA28) -> 1,875.78 (24h low) On the 1h, price is 0.7% over MA7 (1,899.30), but 0.1% under MA14 (1,913.67) and 0.9% under MA28 (1,929.12). MA14 and MA28 are both still sloping down from the 2,053 area, so price has just reached the first of two falling lines, and I'm treating 1,914 to 1,929 as one zone. On the 15m, price is over MA7 (1,903.73), MA14 (1,901.56) and MA28 (1,899.67) by 0.4%, 0.6% and 0.7% The averages have turned flat and the last candle is a long green one with a wick above it, so buyers have shown up, but they have not yet been tested at the hourly line. Volume is the honest part. The 15m bar shows 17.98K against MA5 8.26K and MA10 7.79K with 00:52 left, so it is above both averages and still forming, which means this bounce has real buying behind it. The 1h bar is 38.38K against 33.07K and 52.08K with 00:39 left, above the MA5 but below the MA10. That is why I'm waiting for the zone and not shorting here. My plan, selling into the hourly averages: - Entry: 1,914 to 1,926 (limit, needs a 0.1% to 0.7% rise) - Stop: above 1,934 - Target 1: 1,898 (~1.6R from 1,920) - Target 2: 1,880 (~2.9R) I'm wrong if the 15m closes above 1,934, because that puts price over the 1h MA28 and the bounce becomes a reversal, so I'd leave it. Limit orders, small size, and if the climb never reaches 1,914 I simply don't have a trade. #IMPACTbyTrade

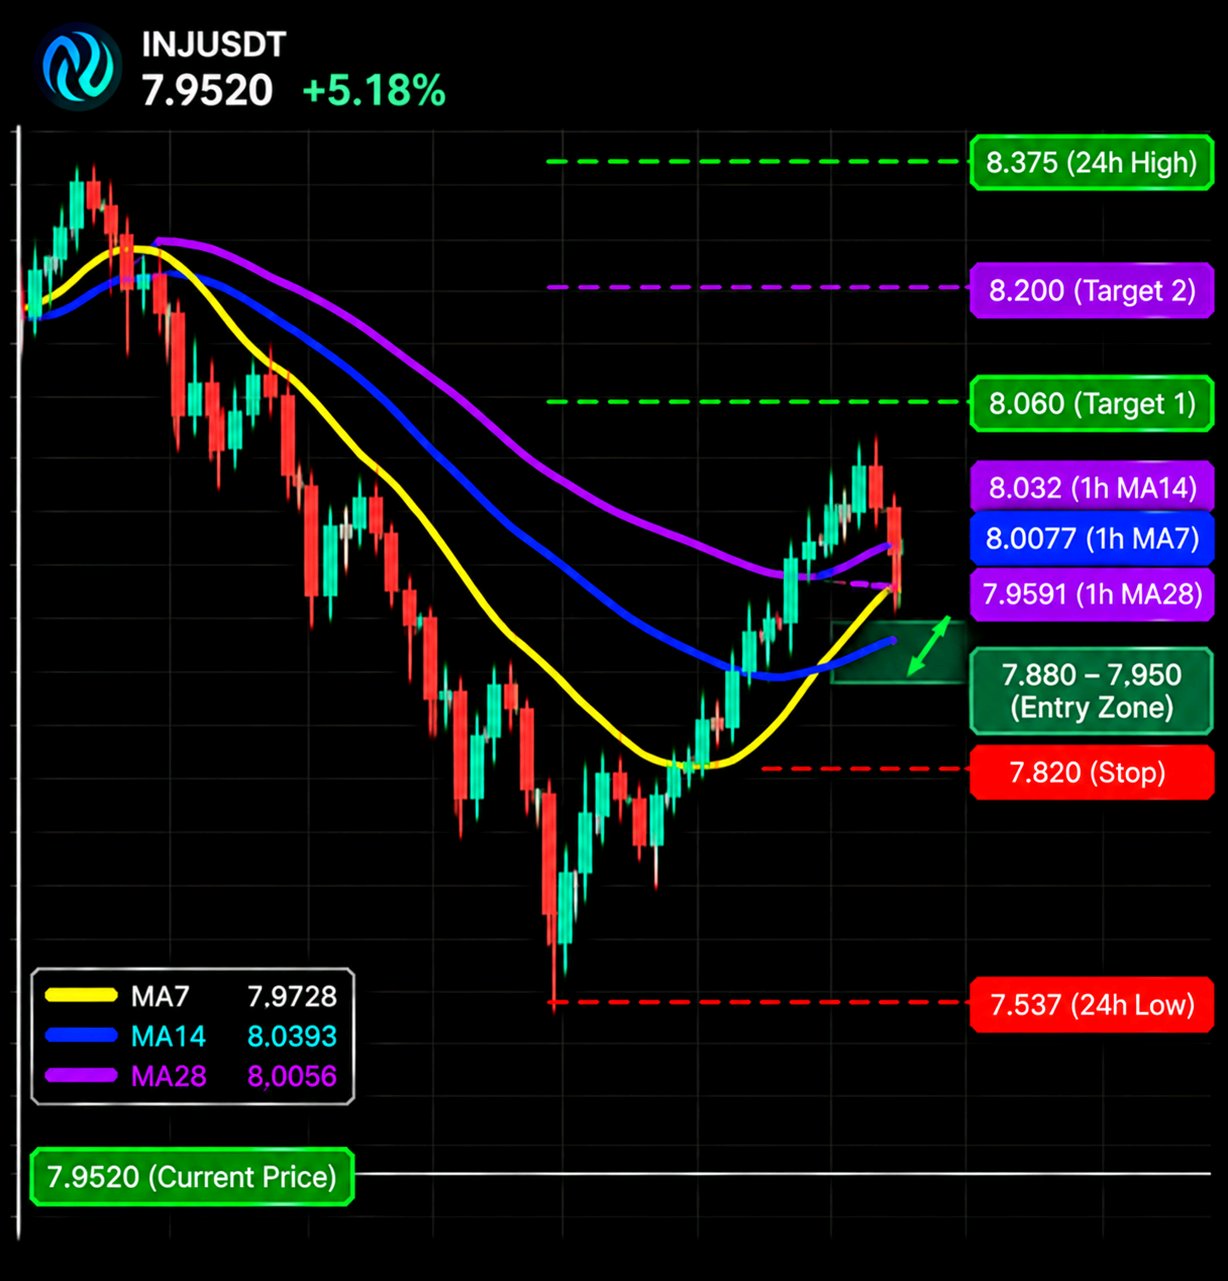
画面上のチャートはINJを除いて軒並み安値を更新しているけど、INJだけは5%プラスを維持していて、1時間足の上昇平均線まで押し目を作っている。そのコントラストが目に留まった。 $INJUSDTは7.9520(+5.18%)で、24時間のレンジは7.5370から8.3750。レンジのちょうど中間あたりで、安値から5.5%上、高値から5.1%下という位置。出来高は44.54M。 注目しているライン(シェルフ): 上:7.973(15分足 MA7) -> 8.006(15分足 MA28) -> 8.032(1時間足 MA14) -> 8.375(24時間高値) 下:7.959(1時間足 MA28) -> 7.859(15分足安値) -> 7.537(24時間安値) 1時間足で見ると、価格はMA7(8.0077)より0.7%下、MA14(8.0318)より1.0%下で、MA28(7.9591)のちょうど上に位置していて、0.1%下回っている。MA28は7.45エリアから急上昇しているラインなので、ここが今回のトレードの肝。耐えれば押し目、割れば天井ということになる。 15分足では、価格はMA7(7.9728)、MA14(8.0393)、MA28(8.0056)をそれぞれ0.3%、1.1%、0.7%下回っている。 8.3360までスパイクした後に短期線が垂れてきているので、今の価格では買わない。まずは軽く突っ込んでシェルフにタッチするのを待つ。 出来高は落ち着いている。15分足は残り13分24秒で1.60K。MA5の26.87K、MA10の36.98Kに対してまだ形成中なので、判断は保留。 1時間足は残り58分21秒で2.24K。MAの172.61K、177.13Kに対して、まだ始まったばかり。上昇時のプッシュは今回の押し目よりもずっと大きな出来高を伴っていたので、これは買い目線の押し目として理想的な形。 トレードプラン:シェルフへの押し目買い - エントリー:7.880〜7.950(指値、最大0.9%の下げが必要) - ストップ:7.820割れ - ターゲット1:8.060(7.915から約1.5R) - ターゲット2:8.200(約3.0R) 15分足が7.820で確定したら撤退。つまり、1時間足のMA28と15分足の安値の両方が崩れ、押し目が反転に変わったと判断する。 指値注文で、サイズは小さめに。7.95で約定しなければ、ポジションなしで終わるだけ。 #IMPACTbyTrade