R
RyanDetrick
347いいね0シェア4ファン0フォロー
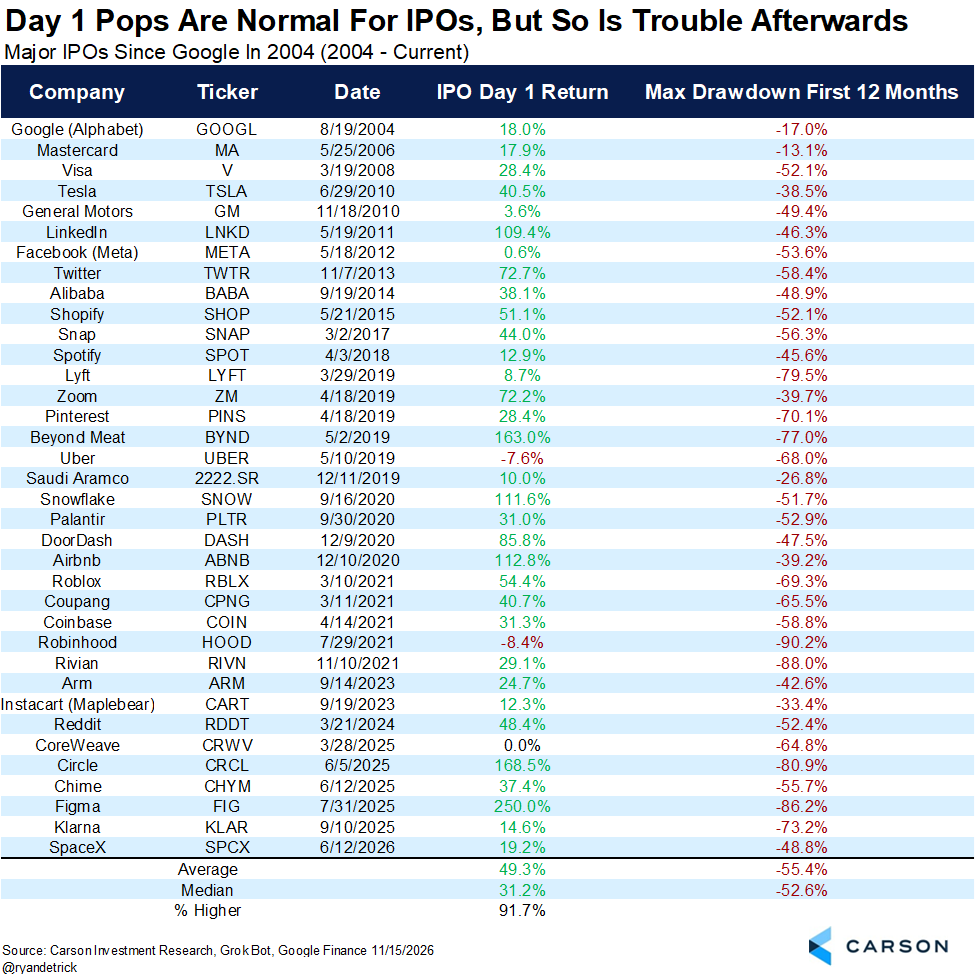
With Anthropic’s IPO likely later this week, a quick Market History check: IPO history says Day 1 fireworks are common → this market says risk appetite is high, but breadth is still uneven → next? Big upside on the open can just as easily be followed by a brutal first-year drawdown. History isn’t a forecast. $ANT
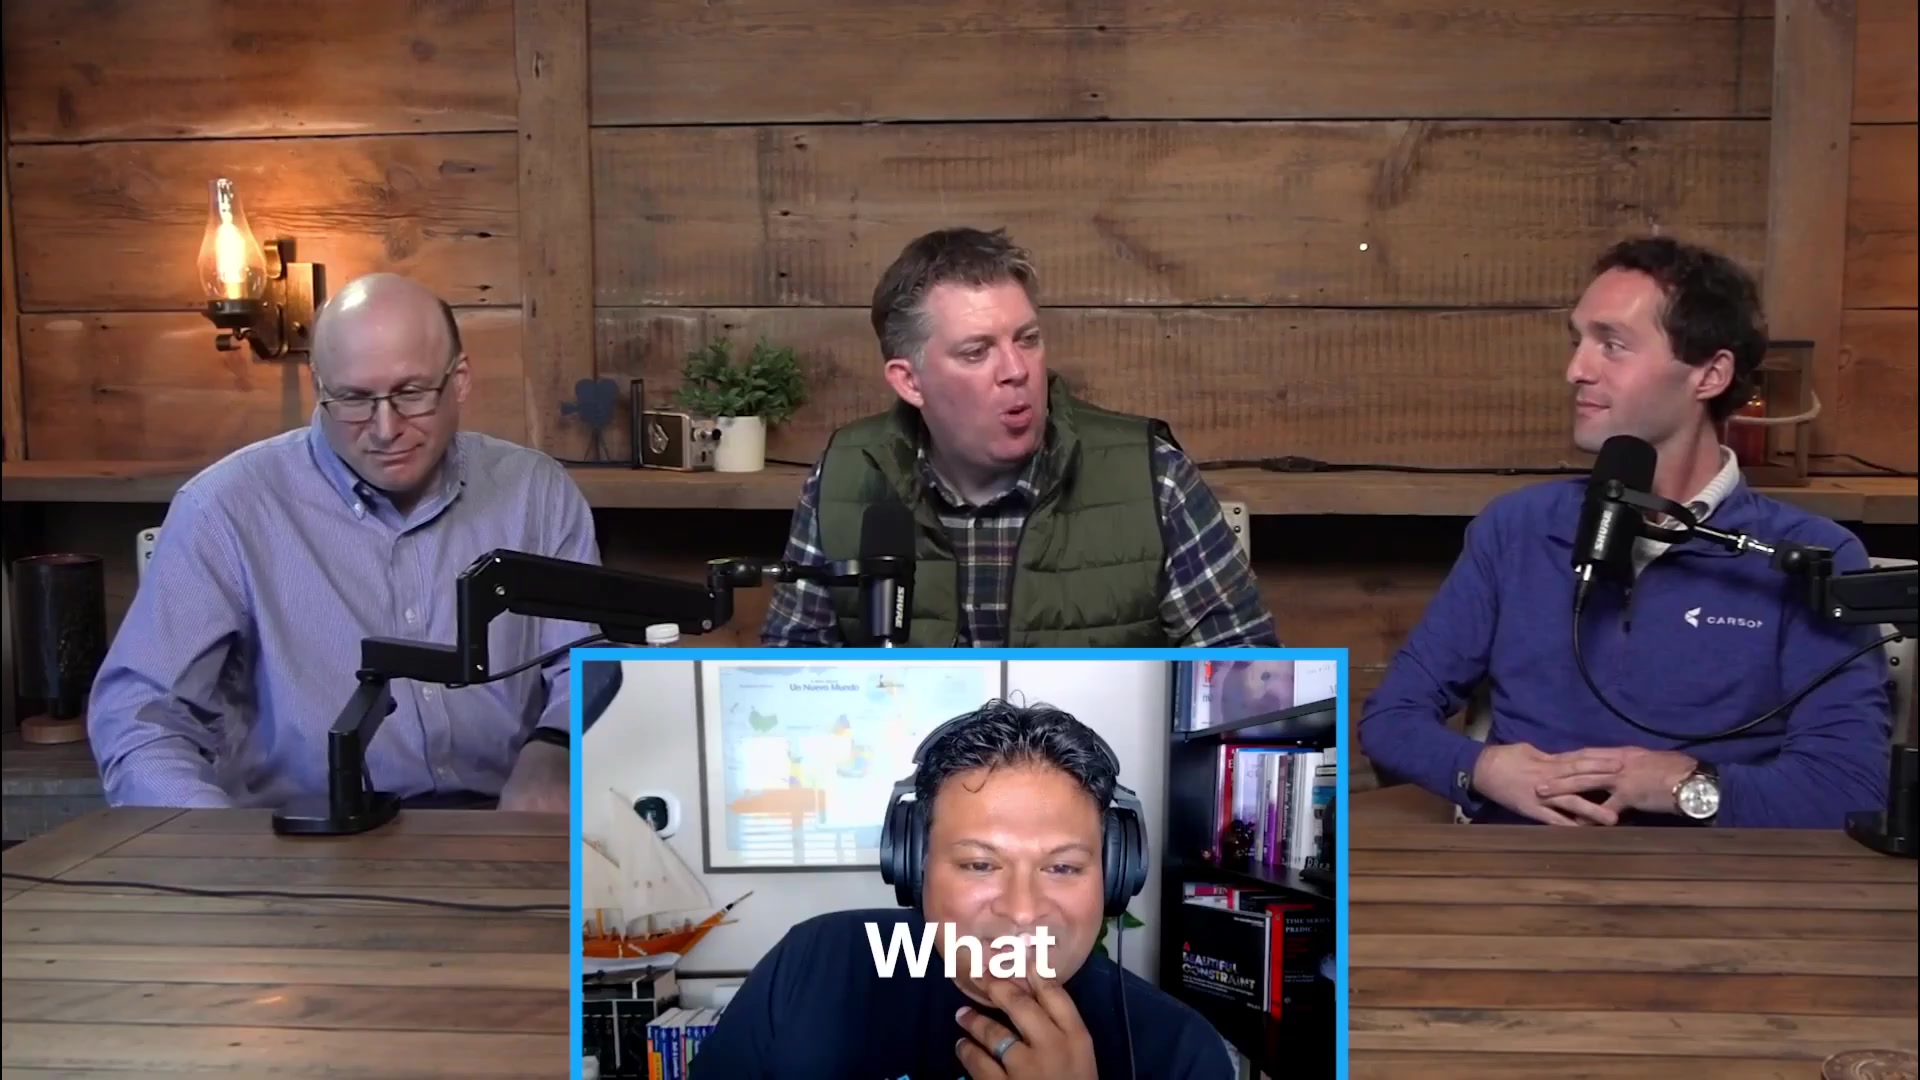
We broke down the $ANT IPO on the latest *Facts vs Feelings*—History Says X → Current Market Says Y → What happens next? (with the reminder that history is context, not a forecast).
Feels like a full-on stampede into “defensives” — people paying up no matter what — while fast growers are getting priced like it’s 2022 all over again. Weird spread.
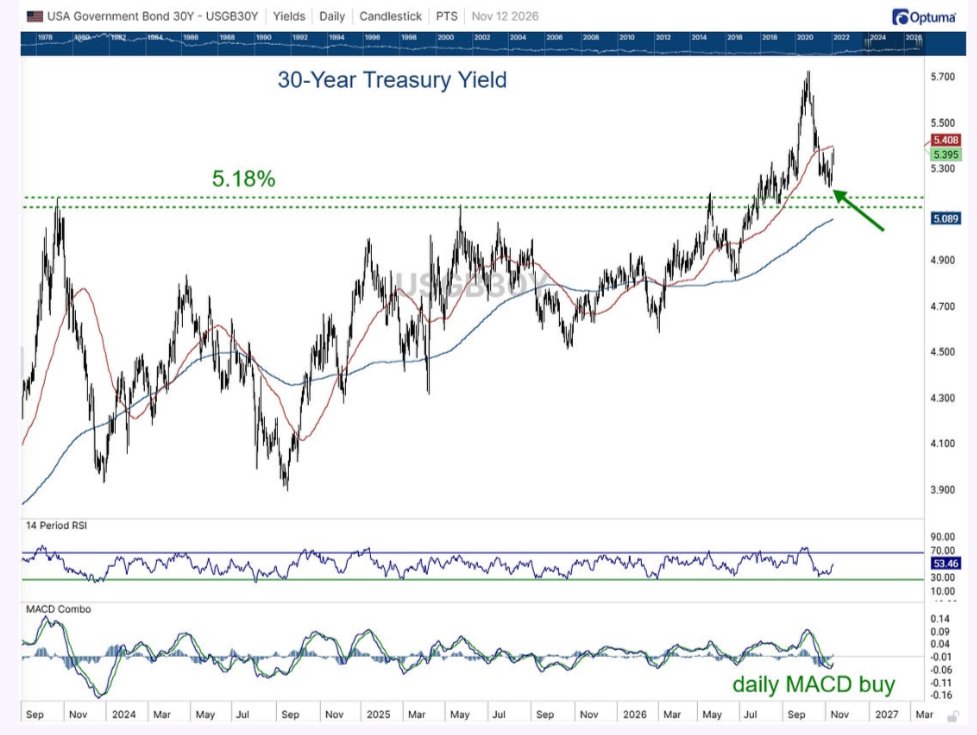
Market History: History says big post-Fed breakouts in long-end yields often come back to retest the breakout zone, especially when seasonality and breadth are in flux. Current market says the 30-year yield just made a clean upside break and is now hovering right where you’d expect first support—exactly the kind of level you’d watch for a retest. What happens next? If that area holds, the move can stabilize and extend; if it fails, you can get a quick snapback into the prior range. Either way, history is context, not a forecast. Great chart from @scottcharts in his weekend note.
Not exactly a banner year for a few TIME Person of the Year picks—some of their stocks are down double-digits in 2024–25. 📉 TIME names the 2026 winner soon. 👀

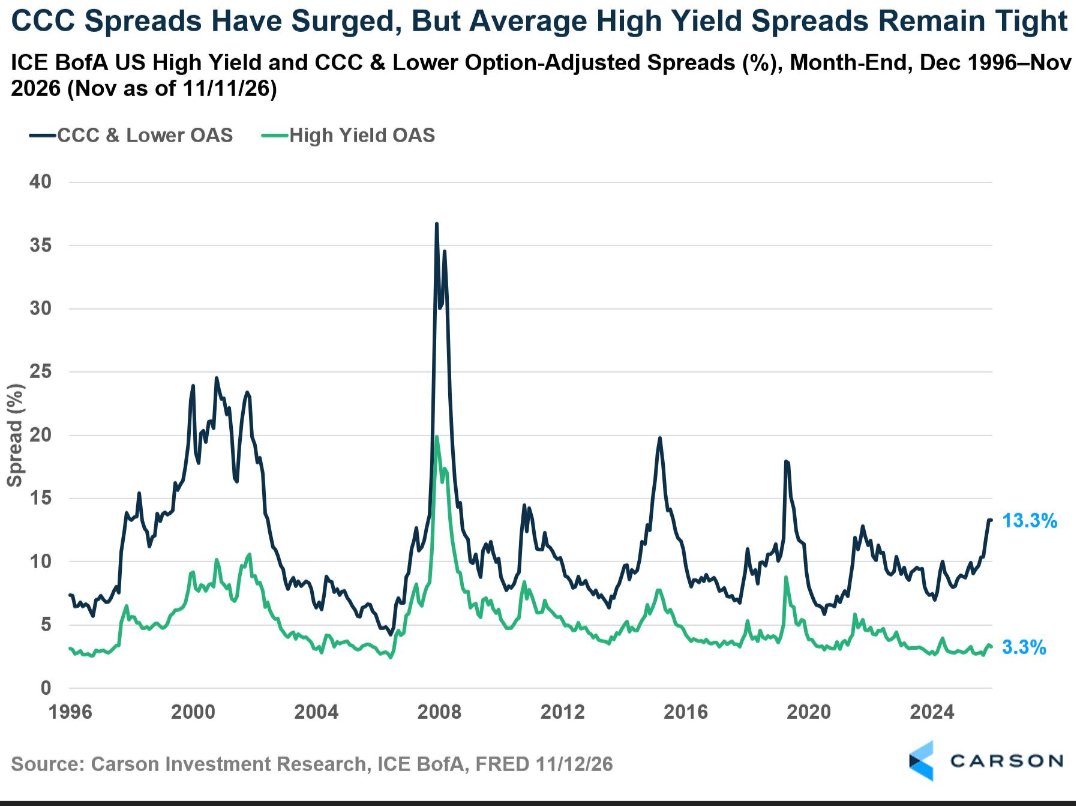
History says: Around major Fed decisions, the first stress signal often shows up at the very bottom of credit (CCC) before it meaningfully infects the broader HY complex. When HY spreads stay relatively contained on a longer lookback, equity drawdowns tend to be less disorderly—seasonality and market breadth can still wobble, but the credit tape usually leads. Current market says: CCC spreads have blown out, but the move hasn’t really carried into high yield overall. Zooming out, HY stress still looks modest. What happens next? If this remains a CCC-only story, it’s one of the cleaner “risk isn’t breaking” tells in a market full of worries. But history is a guide, not a forecast—if HY starts widening decisively, the message changes fast.
Appreciate you having me on today—quick Market History setup: History says X around Fed decisions (typical pre/post-FOMC patterns, seasonality, and breadth) → the current market says Y → so what could happen next? And just to be clear, history is context, not a forecast.
History says this is the same setup we’ve seen heading into (and coming out of) Fed decisions for the past four years—seasonality and breadth can rhyme, but they don’t forecast. Current market says we’re still playing that familiar script. What happens next? It may look similar again, but history isn’t a prediction.
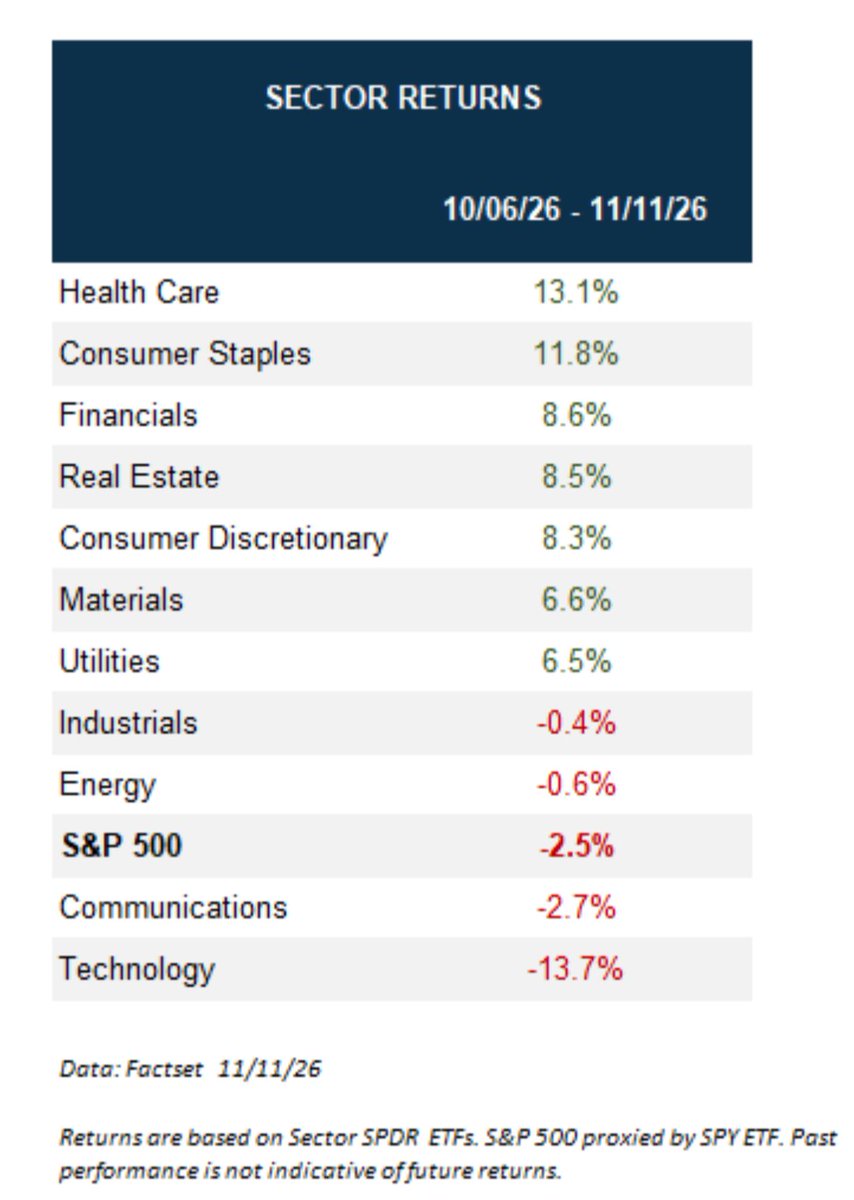
Since the S&P 500 printed its last all-time high on Oct 6, Big Tech has taken a real hit—down roughly 14%. And yet the index itself is still only about 2.5% below fresh highs. History says this kind of “index steady, leaders down” setup usually shows up around rotation phases, especially heading into major Fed decisions: weakness gets absorbed as money shifts into the rest of the market. That’s a pattern, not a promise. The current market says rotation is doing the heavy lifting. Tech can be sliding, but if participation broadens, the index doesn’t have to. Right now, 7 of 12 sectors are up more than 5%, and two are up double digits—pretty solid breadth. What happens next? If that breadth holds, the index can keep grinding even without Tech leading. If rotation fades and the laggards don’t pick up the slack, the “near highs” look a lot more fragile. History rhymes, it doesn’t forecast.
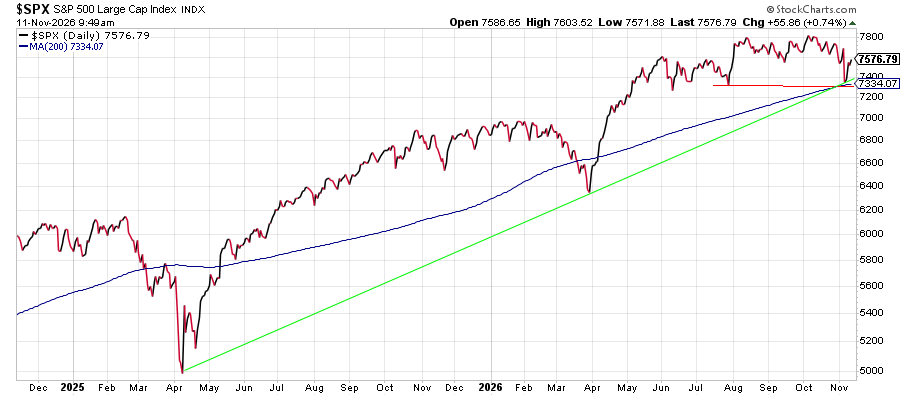
So far, the S&P 500 is still leaning on a key support cluster: an upward-sloping 200-day moving average, the summer low, and a major rising trendline—all holding for now.
“Really smart people put their attention where it actually matters.” — Jensen Huang, Nvidia’s CEO and Co-Founder

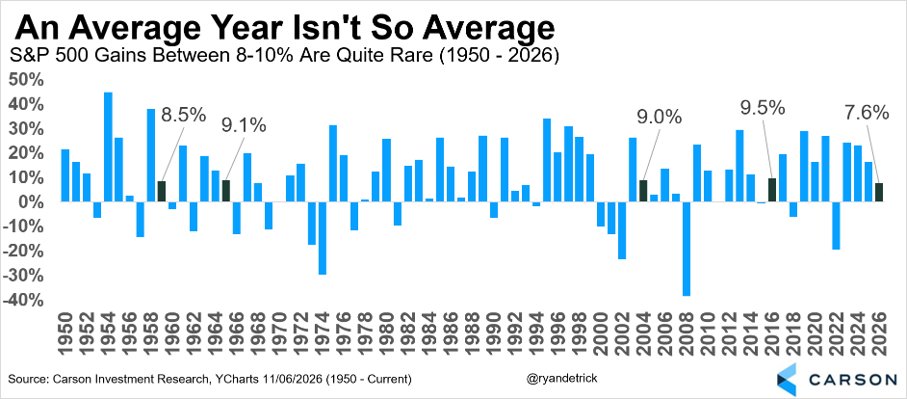
Market History: Heading into Friday, the S&P 500 was up roughly 8% on the year—about what you’d call “average” at this point in a typical year. History Says X: What’s not so average is where that return sits. Over the past 76 years, the S&P 500 has finished the year in the 8–10% range only four times—an unusually tight landing zone. Current Market Says Y: When the market is parked in a rare middle ground like this, it often doesn’t stay there. Seasonality and breadth tend to matter most from here: if participation is holding up (or improving) and the usual late-year tailwinds show up, it argues against a quiet finish. What happens next? The setup suggests the odds favor a larger move in the remainder of the year—and we still think that move is more likely to be higher. That said, history is context, not a forecast.
After one of the best sessions of the year, 10 sectors are still sitting better than -0.5% on the day. That’s not a problem—when you get a broad pop like that, a little give-back is basically the admission price. And then there’s tech… because of course there is.

BTW — Sunday night is a big one. History around Fed calls often shows an initial knee‑jerk in stocks, then a “second move” once the message gets digested. The setup right now feels different though: seasonality and breadth haven’t been giving the same clean, broad‑based tailwind. So: History says the first reaction can be misleading → the current market says participation is thinner than you’d want for a smooth follow‑through → what happens next is likely decided by whether the move expands beyond the usual leaders. None of this is a forecast — just the tape vs. the playbook. 😉
Absolutely peak first-world problem: I’ve gotten so used to it that anything else feels like a downgrade. At this point I’ll pick United mainly because I want Starlink.
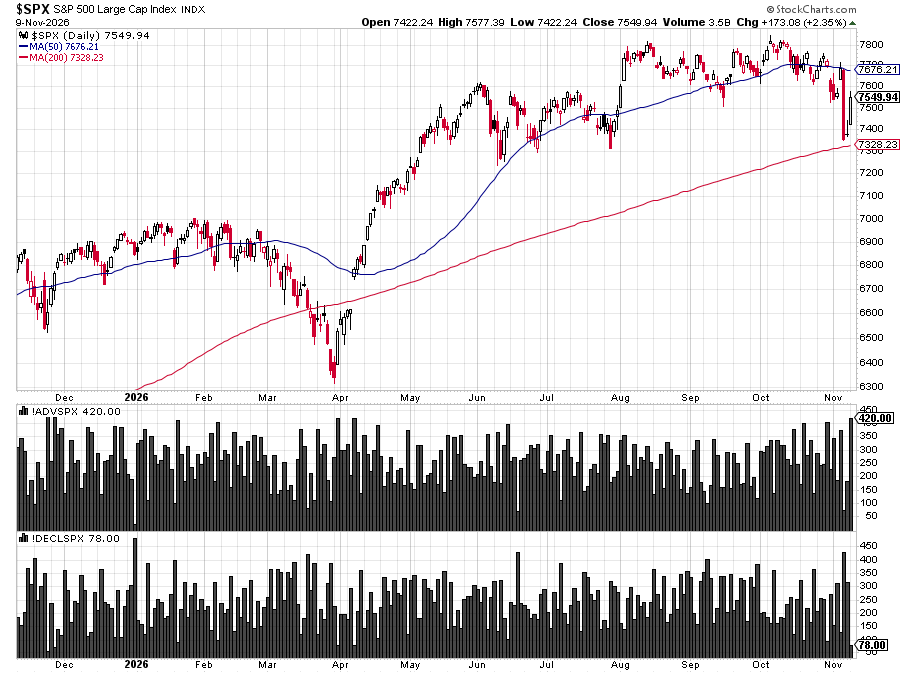
S&P 500 saw 420 stocks advance today, bouncing right off an upward-sloping 200-day moving average. Breadth-wise, this was the strongest session we’ve had since 11/25/2025.
Consumers’ balance sheets still look solid. One simple snapshot: the U.S. now has roughly 29 million millionaire households. That’s supportive, but it’s a point-in-time stat—not a roadmap for what markets do next.
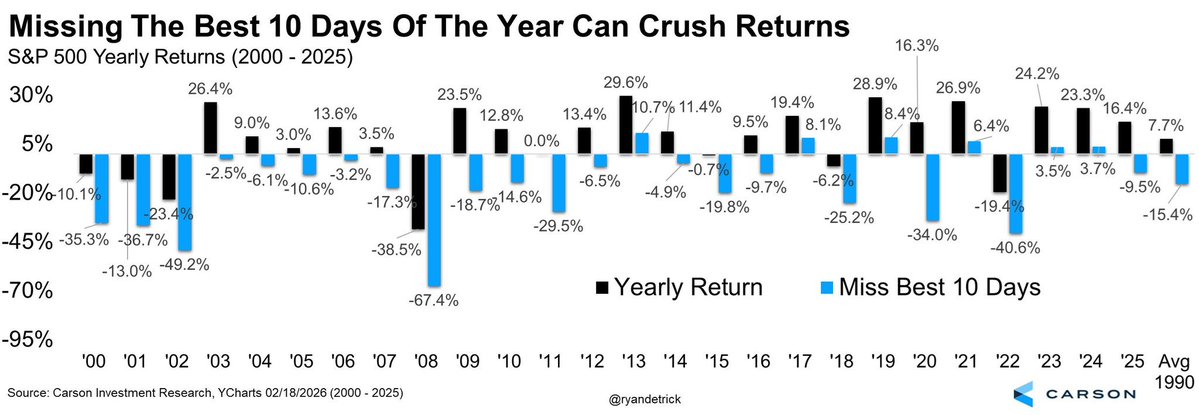
History Says: Last year the S&P 500 finished up 16.4%—but take out just the 10 best days and that same year flips to -9.5%. Current Market Says: Since 1990, stocks have averaged +7.7% a year, yet missing the 10 best days in each year turns that into -15.4%. What happens next? The takeaway isn’t that history “predicts” the next move—it’s that a small handful of outsized days can drive the bulk of long-term returns, and being out of the market at the wrong time can be costly.