IBRAHIMcrypto
64394いいね0シェア1782ファン40フォロー
PRO CRYPTO TRADER / MENTOR CRYPTO GUY 💯 /NFTs lover🎨/GAMER💻🎮/🏋
PRO CRYPTO TRADER / MENTOR CRYPTO GUY 💯 /NFTs lover🎨/GAMER💻🎮/🏋
If you think $HYPEUSDT has permanently topped just because the rest of crypto is digital trash, take a hard look at its ever expanding fundamentals Why does this matter? Because Hyperliquid is a revenue machine where every dollar of collateral and every dollar of trading volume contributes to deflationary $HYPEUSDT buybacks More adoption → less circulating $HYPE overtime. Its that simple and no other asset has this. $TSLA ran hard off its early-November low, broke the prior swing high, and is now pulling back. I'm leaning long, but I'm not buying here. I want price to come down into a specific pullback zone first. Chasing the middle of a pullback is how you get a bad entry. The drop from the recent high looks like a retracement inside the up-leg, not a trend change. The 12h still prints higher lows. Why the zone matters: - The 4h, 12h and daily moving averages stack at the same level - The 62% retracement of the last up-leg lands there too - Recent equal lows sit just below it Four separate reasons on one shelf make a bounce there mean more. The ICT read: those equal lows hold a pool of stop orders. A sweep through them that snaps back into the discount zone is the setup I'd take. Targets are the liquidity resting above the recent swing highs. Where I'm wrong: if price gives up the 12h swing low, the daily 200-day average and the bottom of the optimal retracement band together, the pullback read is dead and I step aside. Risks: Nvidia earnings on Nov 18 and December rate-hike worries could shake AI and high-beta names. Thin weekend pricing means the Monday open can gap. Not investment advice. All decisions and responsibility are your own. $BTC has only been oversold on the weekly 4 times in it's entire history 📉 But, an oversold weekly RSI hasn't always marked the final bear-market bottom. 📉 2015: BTC bottomed 210 days later. 📉 2019: Oversold RSI coincided with the bottom. 📉 2022: BTC bottomed 147 days later. 2026: Already 280 days since the initial oversold signal, with a definitive bottom still to be confirmed. When BTC first became oversold this cycle, it was trading around $60,000. Yesterday's flush saw BTC trade as low as $62,000, meaning price has spent 280 days without establishing a sustained recovery. This is the longest period between an initial weekly oversold RSI signal and a confirmed cycle bottom among the historical examples examined. Only in 2019 did the oversold RSI coincide with the final bottom. The other examples tell us, an oversold weekly RSI doesn't guarantee an immediate reversal. Historically, it has often been followed by months of further consolidation or downside before a definitive bottom forms. #IMPACTbyTrade
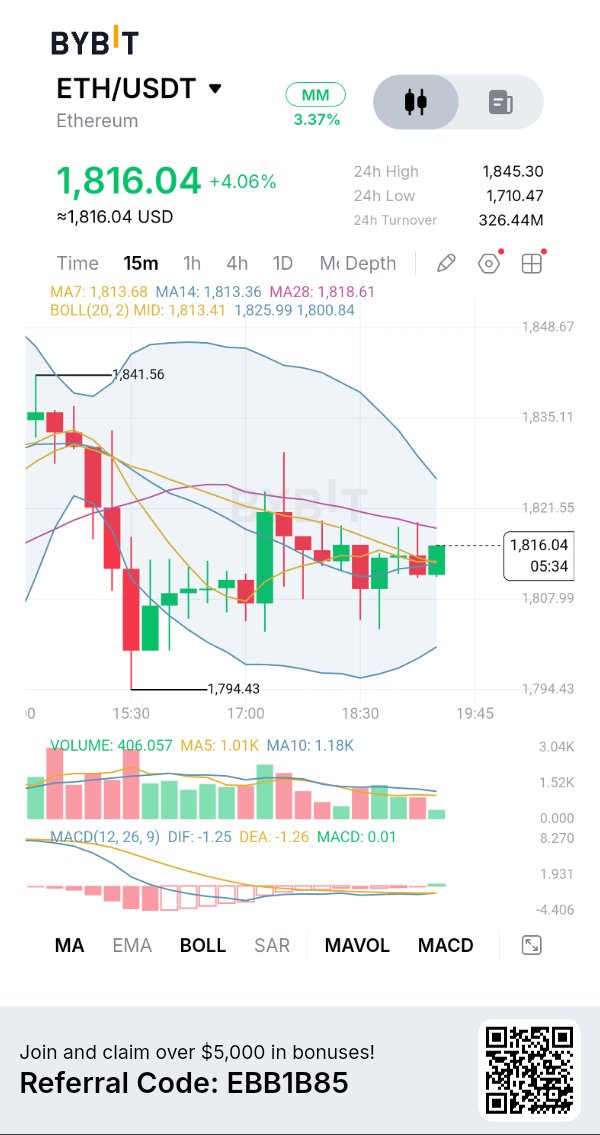
ETHが1,816ドル超への回復を試みる:買い手は力強い反転への準備をしているか? イーサリアムは、かなりの売り圧力に見舞われた後、短期的な安定の兆しを見せていますが、現在の回復にはまだ確認が必要です。ETHは1,794.43ドルへの下落の後、何とか1,800ドル台を回復しており、現在は1,816ドル付近で勢いを取り戻そうとしています。 重要な疑問は、この回復が持続的な上昇トレンドに発展するのか、それとも売り手がこの反発を主導権を取り戻すための新たな機会として利用するのかということです。 チャート+テクニカル分析 私のBybit $ETHUSDT 15分足チャートによると、ETHは1,816.04ドル前後で取引されており、約4.06%上昇しています。24時間の高値は1,845.30ドル、安値は1,710.47ドルです。 直近のプライスアクションは、急落後の回復と調整を示しています。買い手は1,794.43ドルのスイング安値を守りましたが、価格は依然として複数の上値抵抗線に近づいています。 移動平均線は興味深い状況を示しています。MA7は1,813.68ドル前後、MA14は1,813.36ドル前後、MA28は1,818.61ドル前後です。ETHは短期平均線を上回って推移していますが、MA28よりは下にあるため、1,818.61ドルが重要な目先の抵抗線となります。 ボリンジャーバンドは、ミドルバンドが1,813.41ドル付近、アッパーバンドが1,825.99ドル付近、ロワーバンドが1,800.84ドル付近となっています。ミドルバンドを上回って推移し続ければ回復が強まる可能性がありますが、アッパーバンド付近で拒絶されれば、買い手が依然としてかなりの抵抗に直面していることを示唆することになります。 MACD+出来高分析 MACDは初期の改善を示しており、DIFは-1.25、DEAは-1.26、ヒストグラムは約+0.01です。 わずかにプラスのヒストグラムは、弱気モメンタムが緩和していることを示唆しています。しかし、両方のMACDラインは依然としてゼロを下回っており、完全な強気モメンタムへの反転はまだ確認されていません。 出来高は現在約406.057で、MA5(1.01K)およびMA10(1.18K)を下回っています。この回復は強い参加を伴わずに展開しているため、重要な懸念事項です。 この動きを確信的な反転と判断する前に、上方向へのブレイクアウト時に出来高が拡大するのを確認したいところです。 強気シナリオ ETHが1,813ドル〜1,814ドルのサポートを維持し、1,818.61ドルを首尾よく奪還した場合、1,821.55ドルへの続伸を注視します。 より強いブレイクアウトがあれば、ボリンジャーバンドの上限と一致する1,825.99ドルへの道が開ける可能性があります。 私個人のエントリー手法としては、抵抗線を上回る決定的な15分足の終値を待ち、その後の出来高を伴った健全なリテストを確認するのを好みます。 1,807.99ドルを割り込んで推移し続ければ、この目先の強気セットアップは弱まるでしょう。 私のトレードプラン ETHがサポートとレジスタンスの間で取引されている間は、現在の回復を追うことはしません。 ロングポジションについては、買い手が1,818.61ドルを奪還し、ブレイクアウトを確認し、より強い出来高を示すのを見届けたいと思います。 ショートポジションについては、1,807.99ドルを下回るブレイクダウンの確認と、回復の失敗を待ちます。 $IMPACTbyTrade
QNTが10%急騰、強気派が157ドルに接近
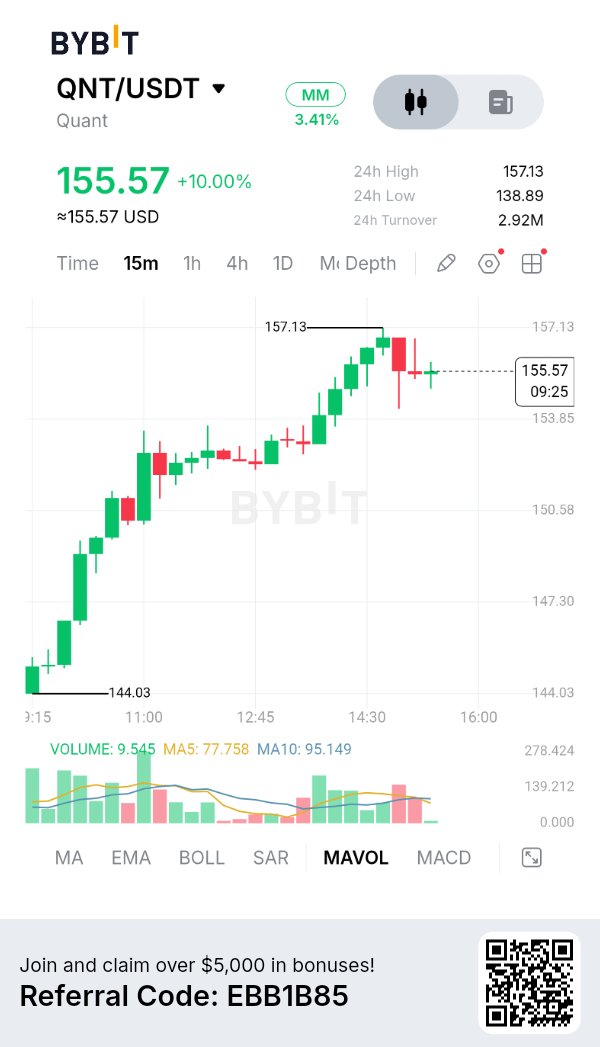
QuantのQNTは、144ドル付近から157.13ドルまで上昇し、その後一部売り圧力に直面したものの、日中を通して強い買いモメンタムを示しています。約10%の上昇は大きなものですが、直近の調整局面は、買い手が次の上昇を試みる前に、利用可能な売り圧力を吸収する必要があることを示唆しています。 私のBybit $QNTUSDT の15分足チャートでは、価格は155.57ドル前後で推移しており、24時間の高値は157.13ドル、安値は138.89ドルとなっています。市場構造は現在強気であり、高値と安値が切り上がっていることから、観察されたセッションの大半において買い手が優勢を維持していることがわかります。 チャート+テクニカル分析 最も重要な進展は、目に見える安値である144.03ドルからの強い回復です。QNTは147.30ドルおよび150.58ドルの領域を通過し、157.13ドルに向けて上昇を拡大しました。 この動きはかなりの短期的な買い意欲を示しています。しかし、セッション高値付近での拒絶を受けて、現在は155.57ドル付近で調整局面に入っています。 目先のレジスタンスは157.13ドルです。この水準をより強い出来高を伴って明確に突破できれば、さらなる上値余地が生まれる可能性があります。 下値については、最初の重要なサポート基準として153.85ドルに注目しています。それを下回ると、150.58ドルが監視すべきより重要な水準となり、その次は147.30ドル付近となります。 出来高と市場参加 チャート上の出来高は現在約9.545Kですが、MA5は77.758K、MA10は95.149Kとなっています。 これは重要な観察点です。QNTは印象的な価格上昇を記録しましたが、直近の取引活動は出来高の平均を大幅に下回っています。 私の解釈では、市場が次のブレイクアウトを維持するには、新たな参加が必要です。より強い買い活動がなければ、現在の調整がより深い押し目につながる可能性があります。 特に、価格が再び157.13ドルに近づいたときに出来高が拡大するかどうかを注視したいと思います。 ファンダメンタルズの視点 Quantは、Overledger技術を通じてブロックチェーンインフラセクターにおいて興味深いポジションを占めています。 その広範な提案は相互運用性に焦点を当てており、異なる分散型台帳ネットワークと既存の金融インフラが通信し、情報を交換できるようにするものです。 これは、金融機関がトークン化、デジタル資産インフラ、およびブロックチェーン技術の既存システムへの統合を模索する中で、特に重要です。 また、QNTはネットワークサービスへのアクセスやプラットフォームの経済モデルのサポートなど、Quantエコシステム内でユーティリティ(有用性)を持っています。 強気シナリオ もしQNTが153.85ドル付近のサポートを維持し、より強い買い出来高を伴って157.13ドルを上抜けることに成功すれば、再び強気な継続の可能性を検討します。 次なる上値のターゲットは160ドル、その次はさらなる拡大として163ドルとなります。 エントリーを検討する前に、15分足での確定的なブレイクアウトとその後のリテストの成功を確認したいと考えます。 153.85ドルを下回る動きが続けば、この目先の強気セットアップは弱まります。 弱気シナリオ もしQNTが157.13ドルを繰り返し上抜けられず、その後153.85ドルを15分足の終値で明確に割り込んだ場合、リテストの失敗を確認してから弱気なチャンスを検討します。 次の下値ターゲットは150.58ドル、その次は147.30ドルとなります。 これらの水準への深い調整は、広範な回復基調を即座に台無しにするわけではありませんが、買い手が即時の優位性を失いつつあることを示します。 157.13ドルを強く奪還すれば、この短期的な弱気シナリオは無効となります。 私のトレードプラン 約10%の日中上昇の後、QNTを追うつもりはありません。確認なしでレジスタンス直下でエントリーすることは、不必要なボラティリティにポジションをさらす可能性があります。 強気セットアップとしては、価格が153.85ドルを維持し、157.13ドルをブレイクし、そのブレイクアウト時に出来高が強まることを確認したいです。 弱気セットアップとしては、153.85ドルを下回る確定的なブレイクダウンと、その後の回復失敗を待ちます。 ポジションサイズは管理下に置き、あらかじめ決めたストップロスを設定し、最初のターゲットで部分的な利益確定を行います。 私の解釈 心強い進展は、144.03ドルからのQNTの回復の強さと、明確な日中の上昇トレンドが形成されていることです。 しかし、現在の価格付近で出来高が減少していることは、私が自信を持って次なる大きな上昇を予想する前に、買い手がさらなるコミットメントを示す必要があることを示唆しています。 私の短期的な見通しは、153.85ドルを維持している間は慎重ながらも強気です。 157.13ドルのレジスタンスが目先の試金石です。買い手がこれを納得のいく出来高で突破すれば、回復は続く可能性があります。失敗すれば、より低いサポートでのリテストの可能性が高まります。 現時点では、すでに拡大した動きを追うよりも、確認を待つ方を選びます。157.13ドル付近での次の反応が、QNTの次なる重要な方向性を決定するでしょう。 $IMPACTbyTrade
INTERESTING IS HAPPENING WITH $HYPE
While $HYPEUSDT continues to experience significant price volatility, CoinStats data reveals a completely different trend beneath the surface. The percentage of CoinStats users holding $HYPE has climbed from approximately 0.59% to over 1.10%. That's an increase of more than 85% in the proportion of users holding the token. And the most interesting part? The chart shows a sustained upward trend, with new highs appearing even after temporary pullbacks. To me, this suggests that interest in holding $HYPE has been expanding within the CoinStats user base, despite the uncertainty surrounding short-term price movements. Of course, this data represents CoinStats users rather than the entire Hyperliquid investor population, and it doesn't tell us how much $HYPE each person holds. Still, the direction is worth paying attention to. Prices can fall while the proportion of portfolio trackers holding an asset continues to rise. That's exactly the kind of divergence I like to monitor when evaluating market sentiment. The price chart shows volatility. The ownership trend shows growing participation. #IMPACTbyTrade
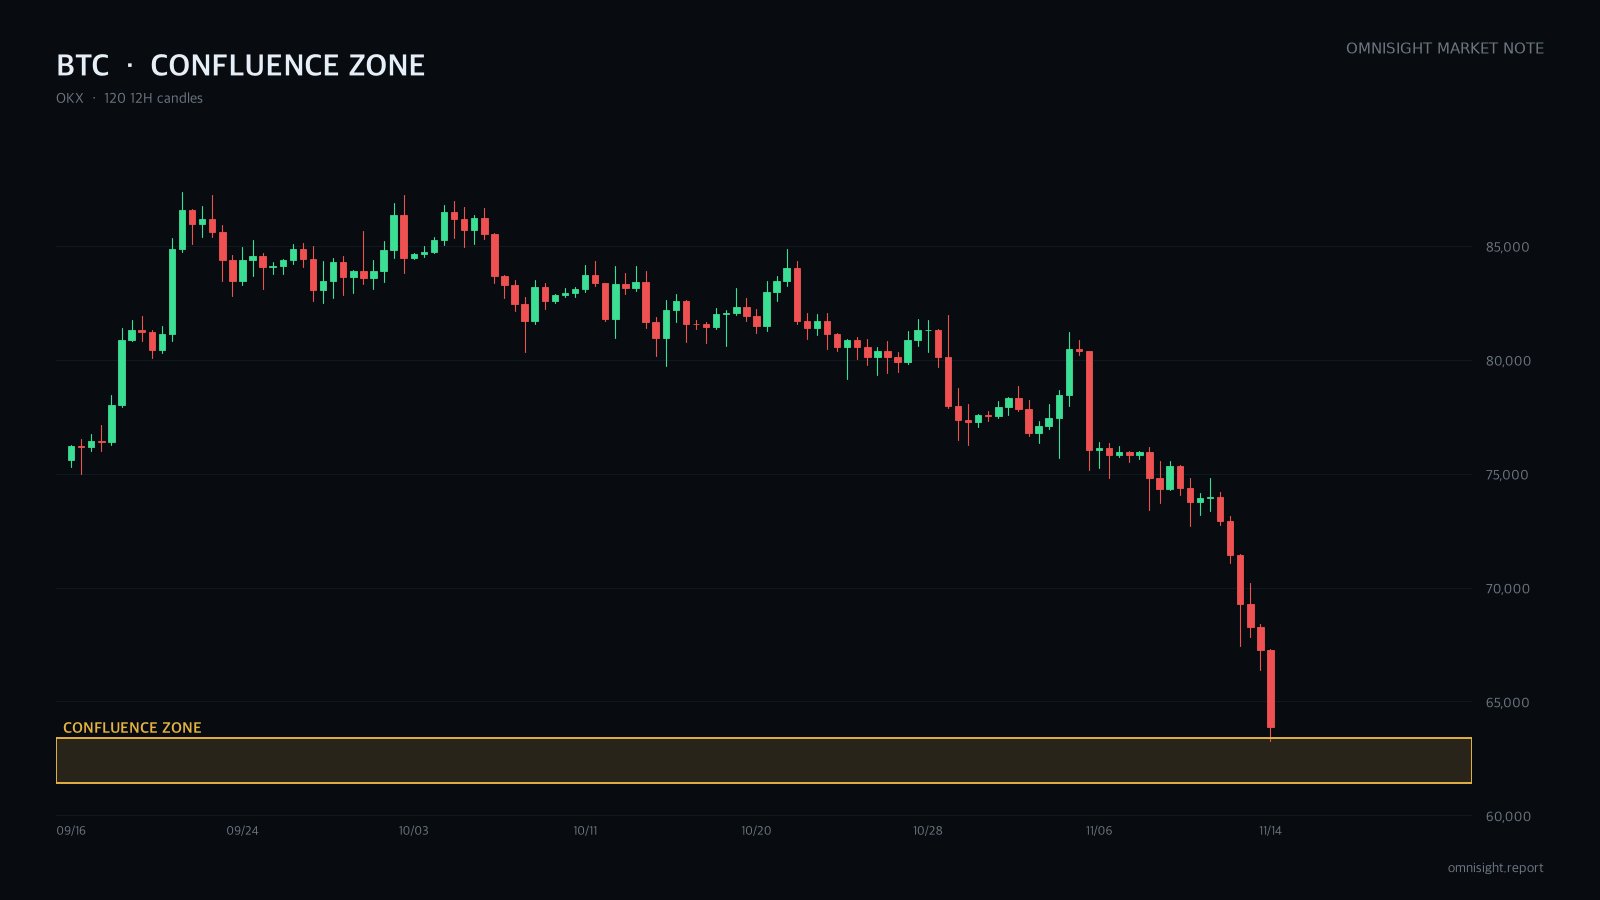
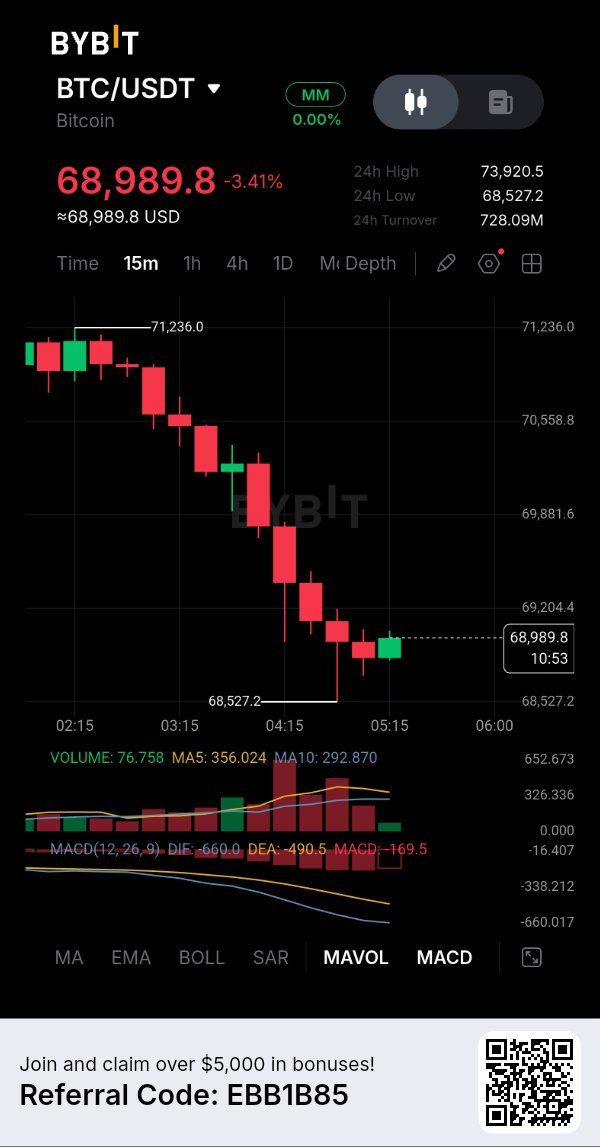
I'm leaning long $BTCUSDT, but not at the current price. It slid hard in under two weeks and is now sitting on the old base where the last rally started. I want a limit fill on one more flush under the lows. The catch: every timeframe is still in a downtrend. Context: it fell close to 6% this morning alone and sits below every moving average. Funding is negative and fear is extreme. Why I still lean up: - Three of four technical methods point long, and all three flag the same zone. - Volume on the daily, hourly and 15m charts printed range highs. That looks like capitulation. - On the 1h, price made a lower low while RSI made a higher low. Downside force is fading. Different methods, same area. That overlap is why I'd rest an order there. The Elliott read: the drop from the top is a clean five-wave move. Wave 5 already exceeds wave 1's length, so it's late. I'm waiting just above the extension targets for that last leg to finish. Where I'm wrong: a daily close below the old accumulation base, which also breaks the extension count. Then it's a deeper leg, not a bottom. Risks: Fed hike odds and ETF outflows keep macro bearish. Thin weekend liquidity can run stops fast. Not investment advice. All decisions and responsibility are your own. #IMPACTbyTrade
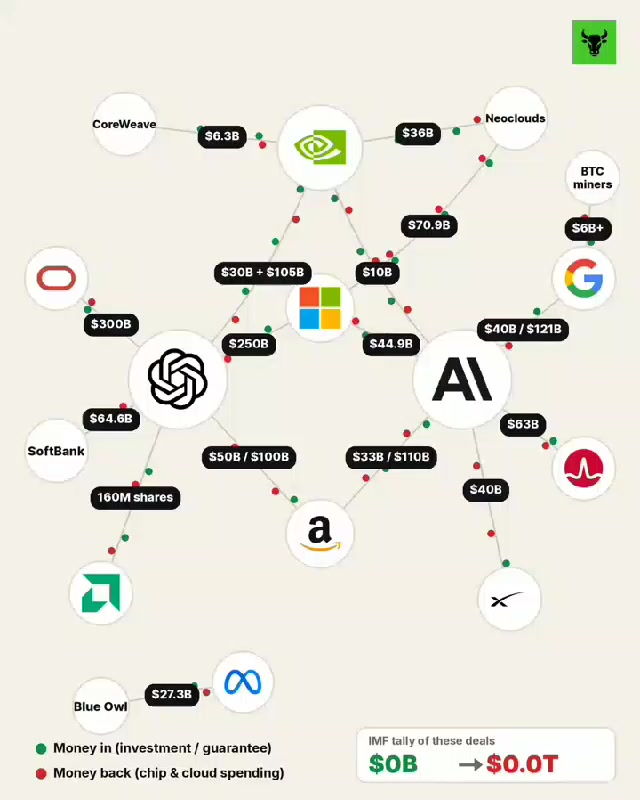
IMFが、AIブームに絡む循環的な資金調達取引が合計で1.4兆ドル(約1,900兆ウォン)という巨額に上っていると公式に警鐘を鳴らしました 🤯 要するに、ビッグテックや半導体メーカーが自社製品を購入する顧客に対して投資を行い、債務保証を行うことで、その資金がぐるぐると回り、最終的にビッグテックの収益として戻ってくるという仕組みです。まさに巨大な「ラウンドロビン(たらい回し)スキーム」ですね(笑) 現在市場に開示されている17件のAI循環取引の詳細をまとめました。数字を見ると、本当に正気とは思えません。 1. Nvidia $NVDAXUSDT ↔ OpenAI NvidiaはOpenAIに300億ドルを投資し、オハイオ州のデータセンター向けに最大1,050億ドルのリース債務を保証しています。OpenAIはそのデータセンターをNvidiaのチップで埋め尽くしています。 2. Oracle $ORCL ↔ OpenAI OpenAIはOracleと3,000億ドルのクラウド契約を締結しました。Oracleはその構築のために借り入れを限界まで行っています。 3. Microsoft $MSFT ↔ OpenAI MicrosoftはOpenAIの約27%を保有しており、OpenAIはMicrosoftのAzureクラウドに2,500億ドルを支出することを確約しています。 4. SoftBank ↔ OpenAI ソフトバンクはOpenAIに646億ドルを投じており、OpenAIはソフトバンク傘下のSB Energyからデータセンターを借り受けています。 5. Amazon $AMZN ↔ OpenAI AmazonはOpenAIに最大500億ドルを投資しており、OpenAIはAmazonクラウドとの契約をさらに1,000億ドル拡大しました。 6. AMD $AMD ↔ OpenAI AMDはOpenAIに対し、1株あたり0.01ドル(ほぼ無料)で最大1億6,000万株の株式を購入できるワラント(新株予約権)を与えています。その見返りとして、OpenAIはAMDのチップを購入します。 7. Google $GOOGL ↔ Anthropic GoogleはAnthropicに最大400億ドルを投資しており、AnthropicはGoogle Cloudに少なくとも1,210億ドルを支出することを確約しています。 8. Amazon ↔ Anthropic AmazonはAnthropicに最大330億ドルを投資しており、AnthropicはAWSに少なくとも1,1000億ドルを支出することを確約しています。 9. Broadcom $AVGO ↔ Anthropic 銀行団が特定目的会社(SPC)に630億ドルを融資し、その資金でBroadcomのチップを購入してAnthropicにリースしています。Broadcomは、これらの中古チップの残存価値まで保証しています。 10. Microsoft + Nvidia ↔ Anthropic 両社合わせて最大150億ドルを投資しており、AnthropicはMicrosoftのクラウドに少なくとも449億ドルを支出することを確約しています。 11. SpaceX $SPCXXUSDT ↔ Anthropic SpaceXは400億ドルの融資を受けてNvidiaのチップを購入し、そのコンピューティングパワーをAnthropicに再販しています。ちなみに、NvidiaはSpaceXの株主でもあります。 12. Nvidia ↔ CoreWeave $CRWV NvidiaはCoreWeaveの株式を約11%保有しており、同社の未使用のキャパシティ(処理能力)を63億ドル分買い取ることを保証しています。もちろん、CoreWeaveはその資金でNvidiaのチップを購入します。 13. Nvidia ↔ Neoclouds Nvidiaは、中小規模のAIクラウド企業から360億ドル分のキャパシティを買い取ることを約束しています。それらの企業は、この保証された収益を担保に資金を借り入れ、Nvidiaのチップを購入しています。 14. Microsoft ↔ Core Scientific, Nebius $NBIS, IREN $IREN Microsoftは彼らと最大709億ドルの契約を結んでおり、彼らはその資金を使ってGPUを購入しています。 15. Google ↔ 元ビットコインマイナー Googleは、TeraWulf $WULFおよびCipher Mining $CIFRに対し、株式取得の見返りとして数十億ドル規模のデータセンターリースを保証しています。 16. Meta $META ↔ Blue Owl $OWL 両社はジョイントベンチャーを通じて273億ドル規模のデータセンターを建設しており、Metaは280億ドルの保証でこれを裏付けています。 17. Anthropic IPO チップおよびクラウド供給元のNvidia、Google、AMD、Micron $MU、Broadcom、Microsoftが、AnthropicのIPOで260億ドル分の株式を購入しています。一方で、Anthropicはこれらの企業に対し、今後数千億ドルもの負債を抱えています 😂 なぜこれが重要なのでしょうか?資金が循環し、債務が借り換えられ続ける限り、ビッグテックから半導体、データセンターに至るまで、すべての企業の収益が急上昇しているように見え、四半期ごとに好決算が続きます。 しかし、問題はここからです。この1.4兆ドル規模のパーティは、最終消費者がAIサービスに巨額を投じない限り続きません。サプライチェーンの末端でマネタイズが期待を下回った瞬間、IMFが警告するように、設備投資(CAPEX)を賄うために借金をしたAIモデル企業やネオクラウド企業が最初に破綻し、彼らに株式投資やリース保証をしていたビッグテック企業がドミノ倒しのように打撃を受けることになるでしょう。 結論として、資金が流れているうちは世界で最も華やかな永久機関のように見えますが、ポンプが止まった瞬間、歴史的なドミノ崩壊に変わる可能性があります。そのため、収益の数字の裏にある保証や債務の中身をしっかりと確認する必要があるのです。 ※特定の銘柄の売買を推奨するものではなく、投資助言ではありません。ご自身の判断と責任において行ってください(Not Financial Advice) #IMPACTbyTrade
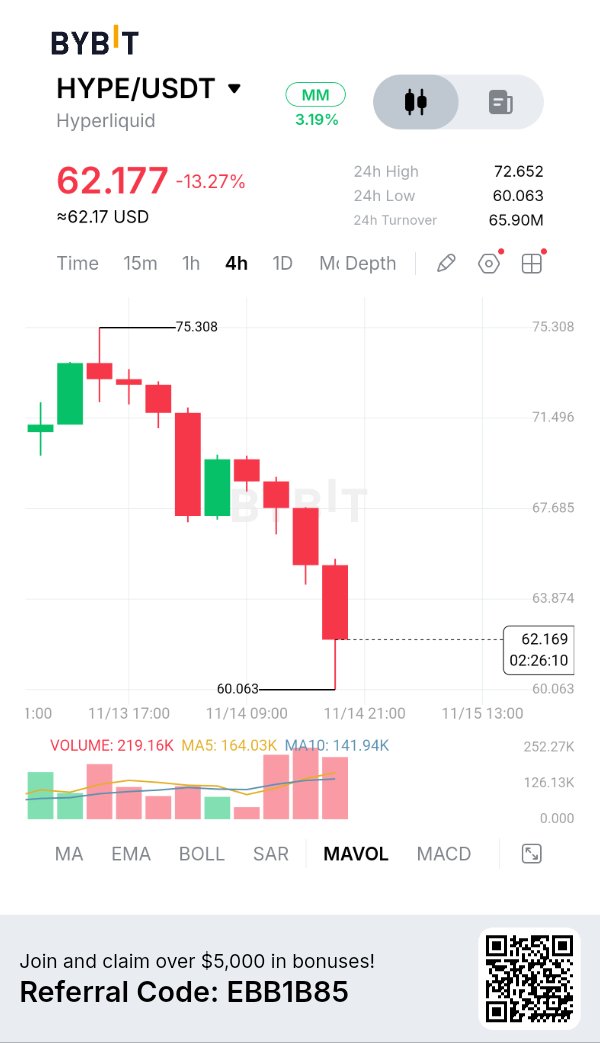
HYPEUSDTは1年平均線とこれまでのスイングローを1日の終値で割り込み、12%以上下落しました。 私のバイアスはショートですが、ここでの売りは考えていません。ブレイクダウンで残されたゾーンへの戻りを待ちたいです。穴(急落局面)で売るのは、たいてい最悪の約定になります。 下落のチャート形状はきれいです。4時間足と12時間足の両方で高値を切り下げ、EMAはベアリッシュに並んでいます。 複合的な判断の根拠は以下の通りです: - 4つのテクニカル分析手法のうち3つが下方向を示唆 - 日足終値が年間平均線と過去のサポートラインの両方を下回っている - リスクオフの背景:高いCPI、高水準の金利、ETFの資金流出 狭い範囲に重なった根拠が、売り手に優位性をもたらしています。 ICTの視点:価格はレッグのディスカウント側の深くに位置しています。プレミアム側には、下落時に埋められていないギャップ、ブレイクされた4時間足の安値、1時間足のEMA20、深いフィボナッチ・リトレースメントが重なっています。そこが私の売り場です。その下にある直近安値のセルサイド・リクイディティが最初のターゲットになります。 シナリオが崩れる場合:4時間足のインターナルハイと、ブレイクされた年間平均線を上に抜けた時。それはリトレースメント(戻り)ではなく、構造の転換(ストラクチャーシフト)です。 リスク:どのタイムフレームも売られすぎ水準にあり、エリオット波動の読みでは反発が予想されます。反発せずに価格がズルズル下がった場合、注文は約定せず、追撃もしません。 投資助言ではありません。すべての決定と責任はあなた自身にあります。 #IMPACTbyTrade
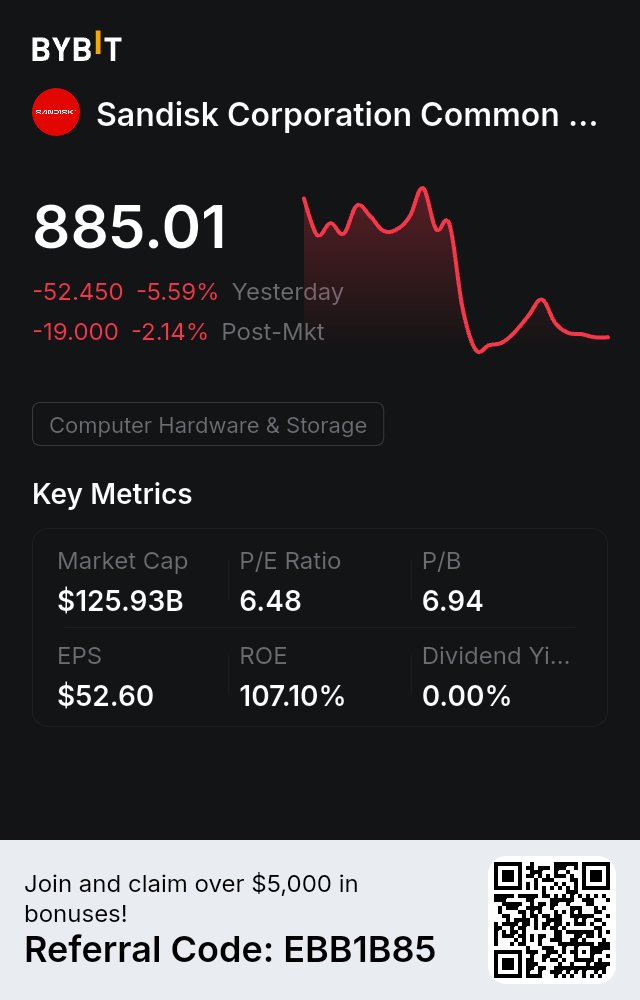
$SNDK fell another 8% or so today, down nearly 15% over two days. $MU fell 4% to 5%, and SK hynix fell about 5%. First, separate the fundamentals from the stock price. $MU posted $54.2 billion in revenue last quarter, up from just $11.3 billion a year earlier, with a GAAP gross margin of 86.8%. Its guidance calls for another roughly 13% increase next quarter. That performance would be top-tier in any industry. Yet $MU is down about 20% over the past month and has fallen more than 30% from its high. With numbers this good, why is the stock still falling? The most dangerous phase for memory stocks often isn't when they're losing money, but when margins are sky-high and the market starts pricing in the next wave of supply ahead of time. A gross margin of 86.8% in an industry known for its wild swings is enough to keep you up at night on its own. The selling isn't about this quarter; it's a discount for "how long can this peak last?" There's another layer of pressure this week. $NVDA is changing CEOs, and the market is worried that the pace of downstream AI compute orders could be disrupted. HBM is closest to $NVDA, so it's the first to get repriced. $SNDK makes NAND, so it's a bit further removed from $NVDA, but it had rallied even harder beforehand. On Wednesday, it rose more than 10% in a single day alongside $MU, so it's giving those gains back just as quickly over the past two days. But a few things haven't changed. Memory supply is still tight. $MU's new $4.5 billion plant in Taiwan recently halted work because of a labor dispute, so capacity expansion will only get slower. SK hynix has already sold half its supply for the next two years. $NVDA isn't the only company running AI; other companies' accelerators also need high-bandwidth memory. A $NVDA leadership change disrupts the timing, not where the demand comes from. So I'm still bullish on memory. But being bullish on memory doesn't mean catching the falling knife right now. A 5% daily move is normal for these stocks. Since October, $MU has moved more than 5% on a third of its trading days. With $NVDA's earnings and $ANT's listing still ahead, that volatility will only get bigger. Being bullish on an industry and deciding where to enter and how large a position to take are two different questions. I'll wait for two things: first, what $NVDA says about HBM and orders in its earnings report, and second, for $MU and $SNDK to stop falling and form their first higher low. Then I'll buy in stages, rather than jumping in halfway up the mountain. Demand is still there, and the cycle is still there. Both of those things have to be acknowledged. $NVDAXUSDT #SanDiskAnnounces8For1StockSplit #AITechSelloffErases2Point5TrillionFromNasdaq100 #IMPACTbyTrade
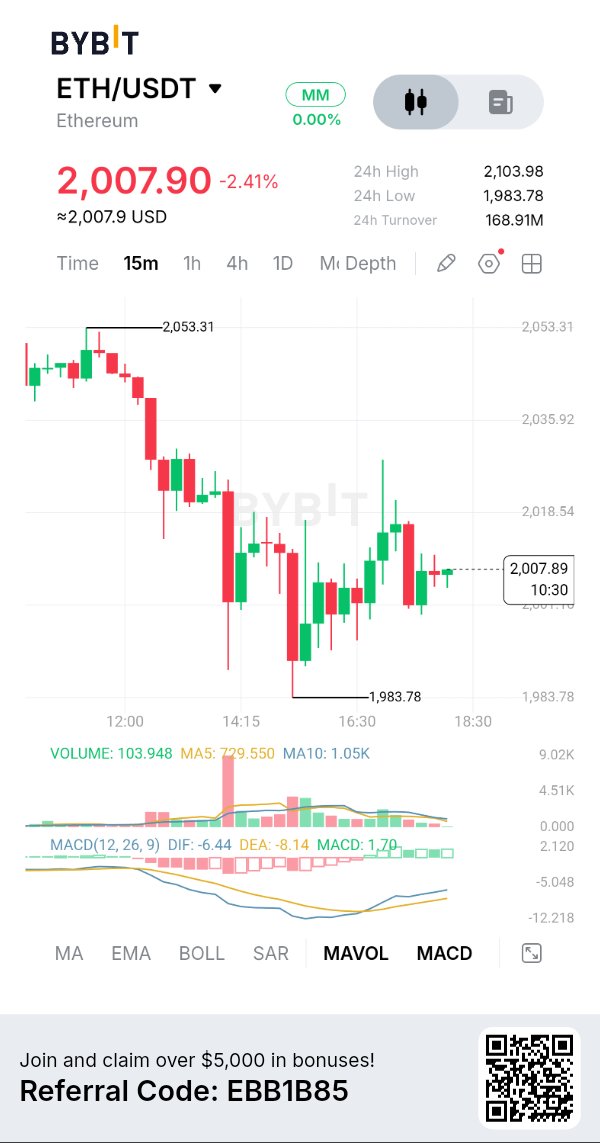
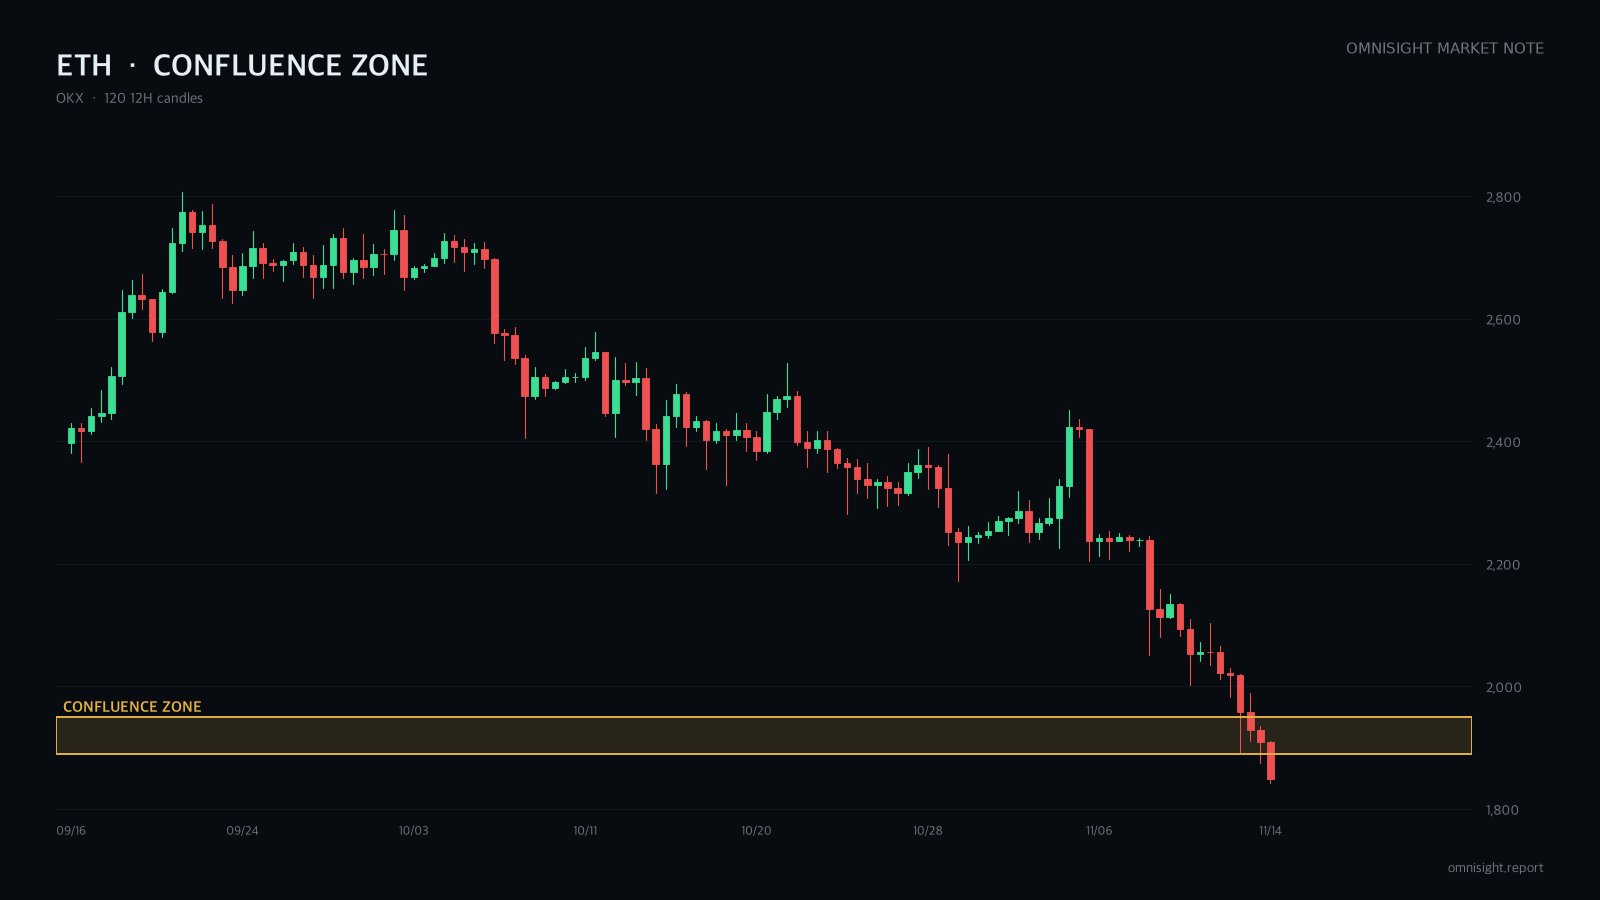
$ETHUSDTが、わずか1時間で過去50日間の最安値を記録しました。私の見立ては依然としてショートですが、この状況で売るつもりはありません。 サポートがレジスタンスに転換するゾーンまで反発するのを待っているところです。 懸念点:売られすぎの水準にあり、これは諸刃の剣です。 日足、12時間足、4時間足のすべてで高値切り下げ・安値切り下げが続いています。価格はそれらの時間足のあらゆる移動平均線を下回っています。 ショートの理由: - すべての上位時間足で構造的に下落トレンドであること。 - 強気のダイバージェンスが4時間足と1時間足でしか見られず、12時間足や日足では見られないこと。 - リスクオフの背景とETFからの資金流出が、引き金ではなく追い風(下落圧力)として働いていること。 4つのテクニカル分析のうち2つがショートを示唆しており、上位足のトレンドがその膠着状態をブレイクしています。 ICTの視点:4時間足でブレイクされたサポート、下落直前の最後の陽線、そして最後の下落レッグの中間地点が1つのエリアに重なっています。リトレースメントの戻り売りを狙うのが、ここでの最もクリーンなショート戦略です。 損切りライン:昨日の反発高値を超えると、高値切り下げの連続が崩れます。4時間足の実体が直前の反発高値を超えて確定した場合、注文を取り消します。 リスク:極端な売られすぎとマイナスのファンディングレートが急激な踏み上げを引き起こす可能性があります。また、反発なしに価格が下落し続けた場合、注文は刺さりません。 投資助言ではありません。すべての判断と責任はご自身で負ってください。 #IMPACTbyTrade
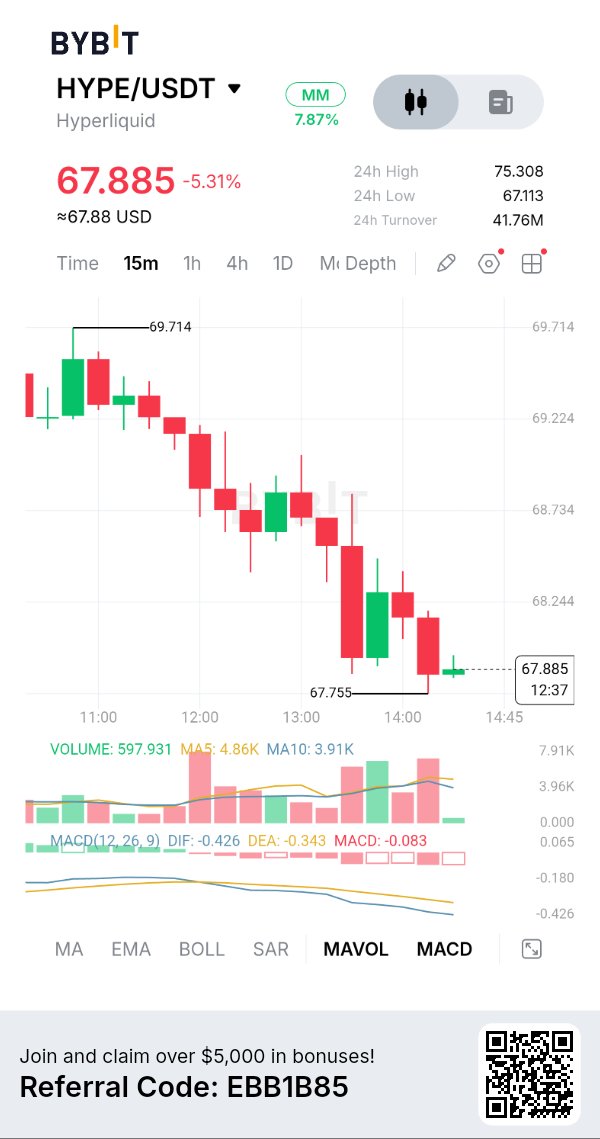
$HYPEUSDT lost the floor it held for two days, and it didn't just wick it. Two big hourly candles closed through on roughly 4x normal volume. I'm short-biased, waiting for a bounce back into that broken floor. The catch: it's already oversold, so no chasing. Since the cycle high, both highs and lows have been stepping lower on the daily and 12h. Why the retest area matters: - The broken floor, the daily 200 EMA and today's unfilled hourly gap stack in one place. - It also lines up with the deep retracement of today's drop. - A first retest of old support is where sellers tend to reappear. That overlap is why it's a zone, not a single line. On ICT, the liquidity below the floor wasn't swept and reclaimed. It was taken with closes. That turns the old floor into resistance, and the upper half of today's drop becomes the area to sell into, not chase. I'm wrong if a 4h close reclaims today's high along with the short-term averages. That's a reversal, not a pullback, and the short case is gone. Risks: BTC just hit a 12-week low after heavy liquidations, so sharp squeezes can hit. HYPE's own tailwinds (rising open interest, buybacks) may slow the drop. Not investment advice. All decisions and responsibility are your own. #IMPACTbyTrade
🚨 ビットコインが暴落し続ける理由
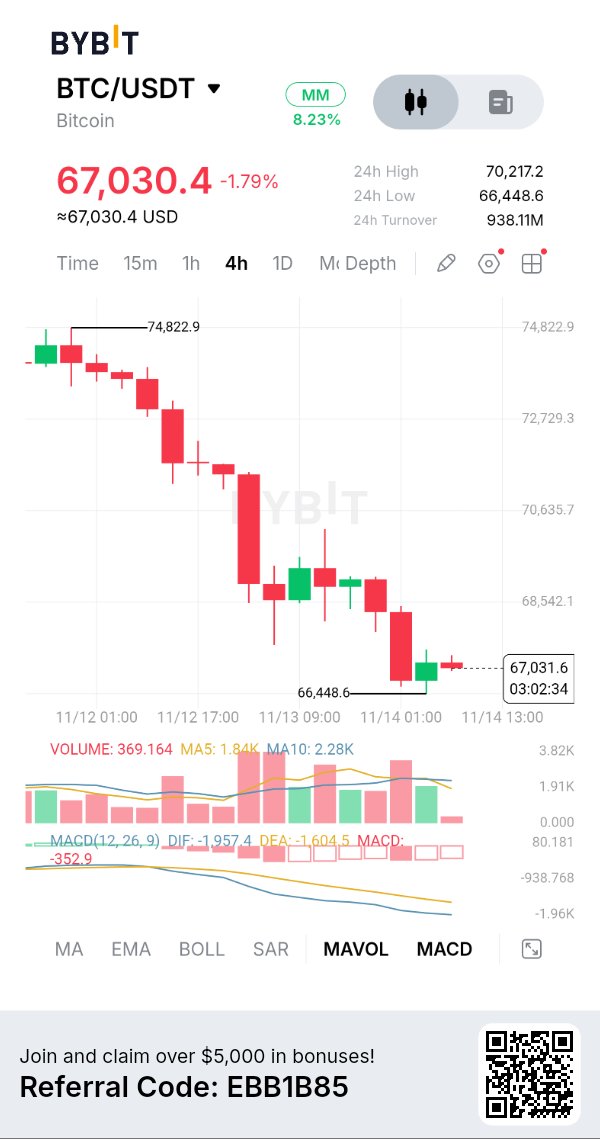
もしあなたがまだ $BTCUSDT を、需要と供給で価格が決まる資産のように取引されていると考えているなら、この記事を注意深く読む必要があります。 なぜなら、その市場はもはや存在しないからです。 今あなたが見ているのは、通常の価格変動ではありません。 これは単なるAI株の売り越しではありません。 予想を上回るインフレ指標によるものでもありません。 ましてや、個人投資家のパニック売りでも絶対にありません。 多くの人は何が起きているのか全く理解していません。 そして、すべてが明らかになった頃には、すでに手遅れなのです。 そして、すべてが明らかになった頃には、すでに手遅れなのです。 このサイクルは今日始まったわけではありません。 何年も前から水面下で静かに進行していたのです。 そして今、それが加速しています。 真実はこうです: ビットコインののエクスポージャーが紙(ペーパー)上で作成可能になった瞬間、2100万枚という上限はもはや価格を決定づけるものではなくなります。 そして、紙(ペーパー)が価格を決定する時、ビットコインはレバレッジと強制決済の言いなりになります。 まさにそれが今、ビットコインで起きていることです。 そしてそれは、すでに以下の市場を崩壊させたのと同じ類のものなのです: → 金(ゴールド) → 銀(シルバー) → 原油 → 株式 デリバティブが支配権を握った時点で、実際の買い手はコントロールを失います。 ビットコインの本来の投資テーゼは崩壊しました。 ビットコインの価値は、以下の2つの考えに基づいて構築されていました: → 2100万枚という厳格な供給上限 → 同じコインが二重に貸し出されることはないという事実 ウォール街がその上に以下の仕組みを構築した瞬間、その枠組みは死にました: → コインではなく現金で決済される先物 → 無期限先物契約 → オプション → ETF → ブローカーローン、ラップドBTC、スワップ それ以来、紙(ペーパー)のビットコインは事実上無制限になりました。 オンチェーン上では違いますが。 しかし、価格を決定する市場においてはそうであり、重要なのはそこなのです。 清算(リキデーション)。 すべてを説明できる唯一の指標です。 24時間で16億ドル以上のレバレッジポジションが消滅しました。ビットコインのロングポジションには8億7000万ドルの打撃がありました。現物ビットコインETFからは今月18億8000万ドルの流出が見られました。 紙(ペーパー)の売りが実際の買い手を圧倒すると、価格はもはや需要に反応しなくなります。 価格はポジション、ヘッジ、そして連鎖的な強制決済に反応するのです。 ウォール街は今、ビットコインを売ることができます。 彼らは方向性を推測しているわけではありません。 彼らはあらゆるデリバティブ主導の市場で行っていることを行っているだけです: 1⃣ ペーパーBTCを作成する 2⃣ 反発をショートする 3⃣ 強制決済を誘発する 4⃣ より低い価格でポジションを閉じる 5⃣ 繰り返す これは「賭け」ではありません。 これは在庫の創出です。 1つの現物BTCは、今や以下のようにカウントされます: → 1つのETFシェア → 1つの先物契約 → 1つの無期限先物契約 → 1つのブローカーローン これらすべてが同時に行われています。 単一のコインに対して4つの請求権が存在するということです。 それは自由市場ではありません。 ビットコインの仮面を被ったウォール街の価格決定システムです。 無視することもできますが、誰も警告しなかったなどと言わないでください。 $BTC は68,658ドルで取引されており、24時間で4.28%下落しています。これは8月以来の安値であり、高値の126,200ドルから45.6%下落しています。もし65,000ドルを割り込めば、トレーダーは次のターゲットである62,500ドルを注視することになるでしょう。 週末を通して、清算データやETFの資金フローは画面上に表示され続けるでしょう。私たちのフォローをして、確定データをいち早く入手してください。 #IMPACTbyTrade
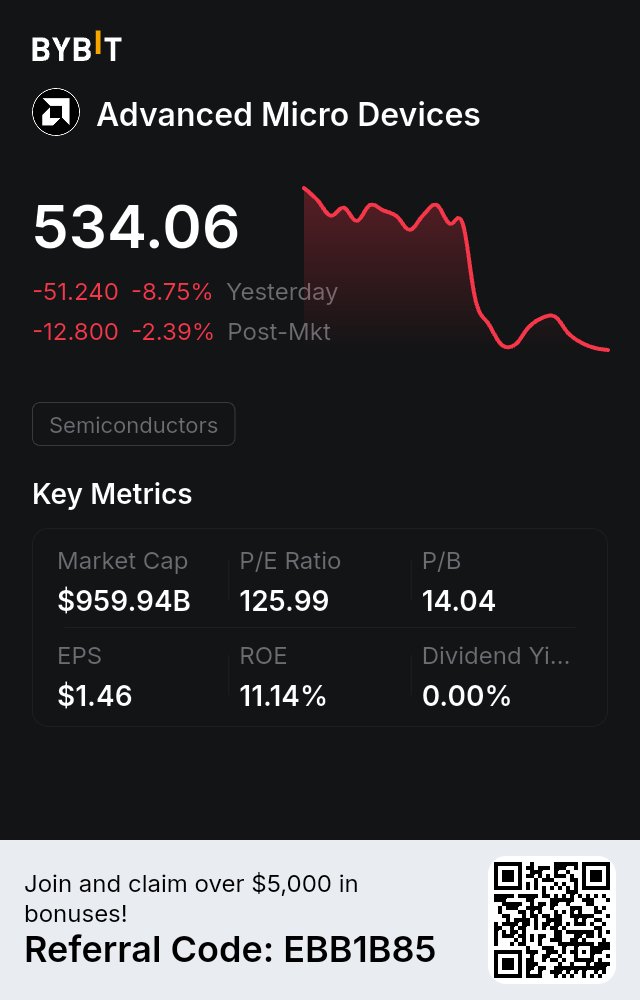
$AMD fell 10% in a single day, even harder than $NVDA. That’s the key thing to understand today. On Thursday, the day Jensen Huang stepped down, the market’s first reaction was to pull money out of $NVDA and move it into $AMD and $AVGO, betting that if Nvidia ran into trouble, orders would flow to its rivals. Today, that trade was unwound entirely: $AMD fell about 10% intraday, $AVGO about 5%, while $NVDA fell only 2% to 3%. The positions that had been moved over were pulled back in a single day, showing that the market wasn’t betting on who would take market share from whom, but was marking down the entire AI supply chain together. The reason for the markdown also came out into the open today. While Jensen Huang was there, $NVDA had been financing and guaranteeing loans for new cloud companies downstream, using its own money to help customers buy its own chips. The moment he left, the market’s first concern was whether that circular financing could keep turning. So the hardest hit today were new cloud companies like $CRWV and $NBIS, both down about 9% intraday. Britain’s Nscale revised its prospectus, with its net loss for the first nine months widening to $1.7 billion. $MSFT is also rumored to be reexamining its contracts with new cloud companies and planning to use fewer of them. Optical modules $LITE and $COHR, and servers $DELL and $HPE, fell anywhere from 6% to 11%. Where the money is flowing out is clear from the order of the declines: those most dependent on financing fell first, those living off $NVDA orders fell next, and the giants with the thickest cash flows fell the least. Interest rates are also working against the market. The 10-year U.S. Treasury yield climbed back above 5% on Thursday, rose above 5.1% intraday today, and the 30-year is around 5.4%. PPI was actually milder than expected, but the bond market isn’t buying it. Tech stocks with high valuations and heavy capital spending are the most sensitive to this number. The Nasdaq 100 fell about 1.7% intraday, the Dow was basically flat, and consumer staples were actually rising. Then there’s next week’s $ANT. Pricing is Wednesday, listing is Thursday, 825 million shares at $70 to $78 per share, raising as much as over $60 billion. With a subscription of that size, funds have to free up cash in advance, and the easiest way is to sell the AI stocks they already hold that have risen and are liquid. $NVDA itself also committed to subscribing for $10 billion in the placement, and now that Jensen Huang is gone, the market is also guessing whether that money will still come through. With these three things stacked on top of each other, a drop like today’s is not surprising at all. So why isn’t this a crash yet? Because only the AI chain is falling; the broader market hasn’t collapsed with it. The S&P fell less than 1% intraday, and the Dow was flat. Money is rotating within tech and hiding in defensive sectors, not selling everything. The kind of panic that sent the SOX down 12% in a single day on 11/5 did not show up today. Positioning has to be calculated carefully too. Through Thursday’s close, the SOX was about 12% higher than last Friday. The earlier rebound was too fast, and part of today’s drop is giving back that rebound. What comes next comes down to two things. One is $NVDA’s earnings on 11/17: how the new management talks about orders, and how it talks about financing for customers. The other is $ANT’s pricing and its first-day performance. If $ANT goes smoothly, it means the primary market is still willing to pay up for AI assets, and the money that was pulled out has a chance to flow back. If pricing is pushed to the bottom of the range or it even opens below the offering price, this round of selling will most likely go back to test the 11/5 lows. I won’t catch a falling knife like $AMD’s 10% drop in a single day this week, and I won’t bet on $NVDA’s earnings night either. Trim on the rebound, buy in batches when it reaches a level, and keep cash to get through next week. The companies are still the same companies. It’s just that right now, no one is willing to carry a bit more exposure before $ANT lists. #JensenHuangExitTestsNvidiasAILeadership $NVDAXUSDT #IMPACTbyTrade
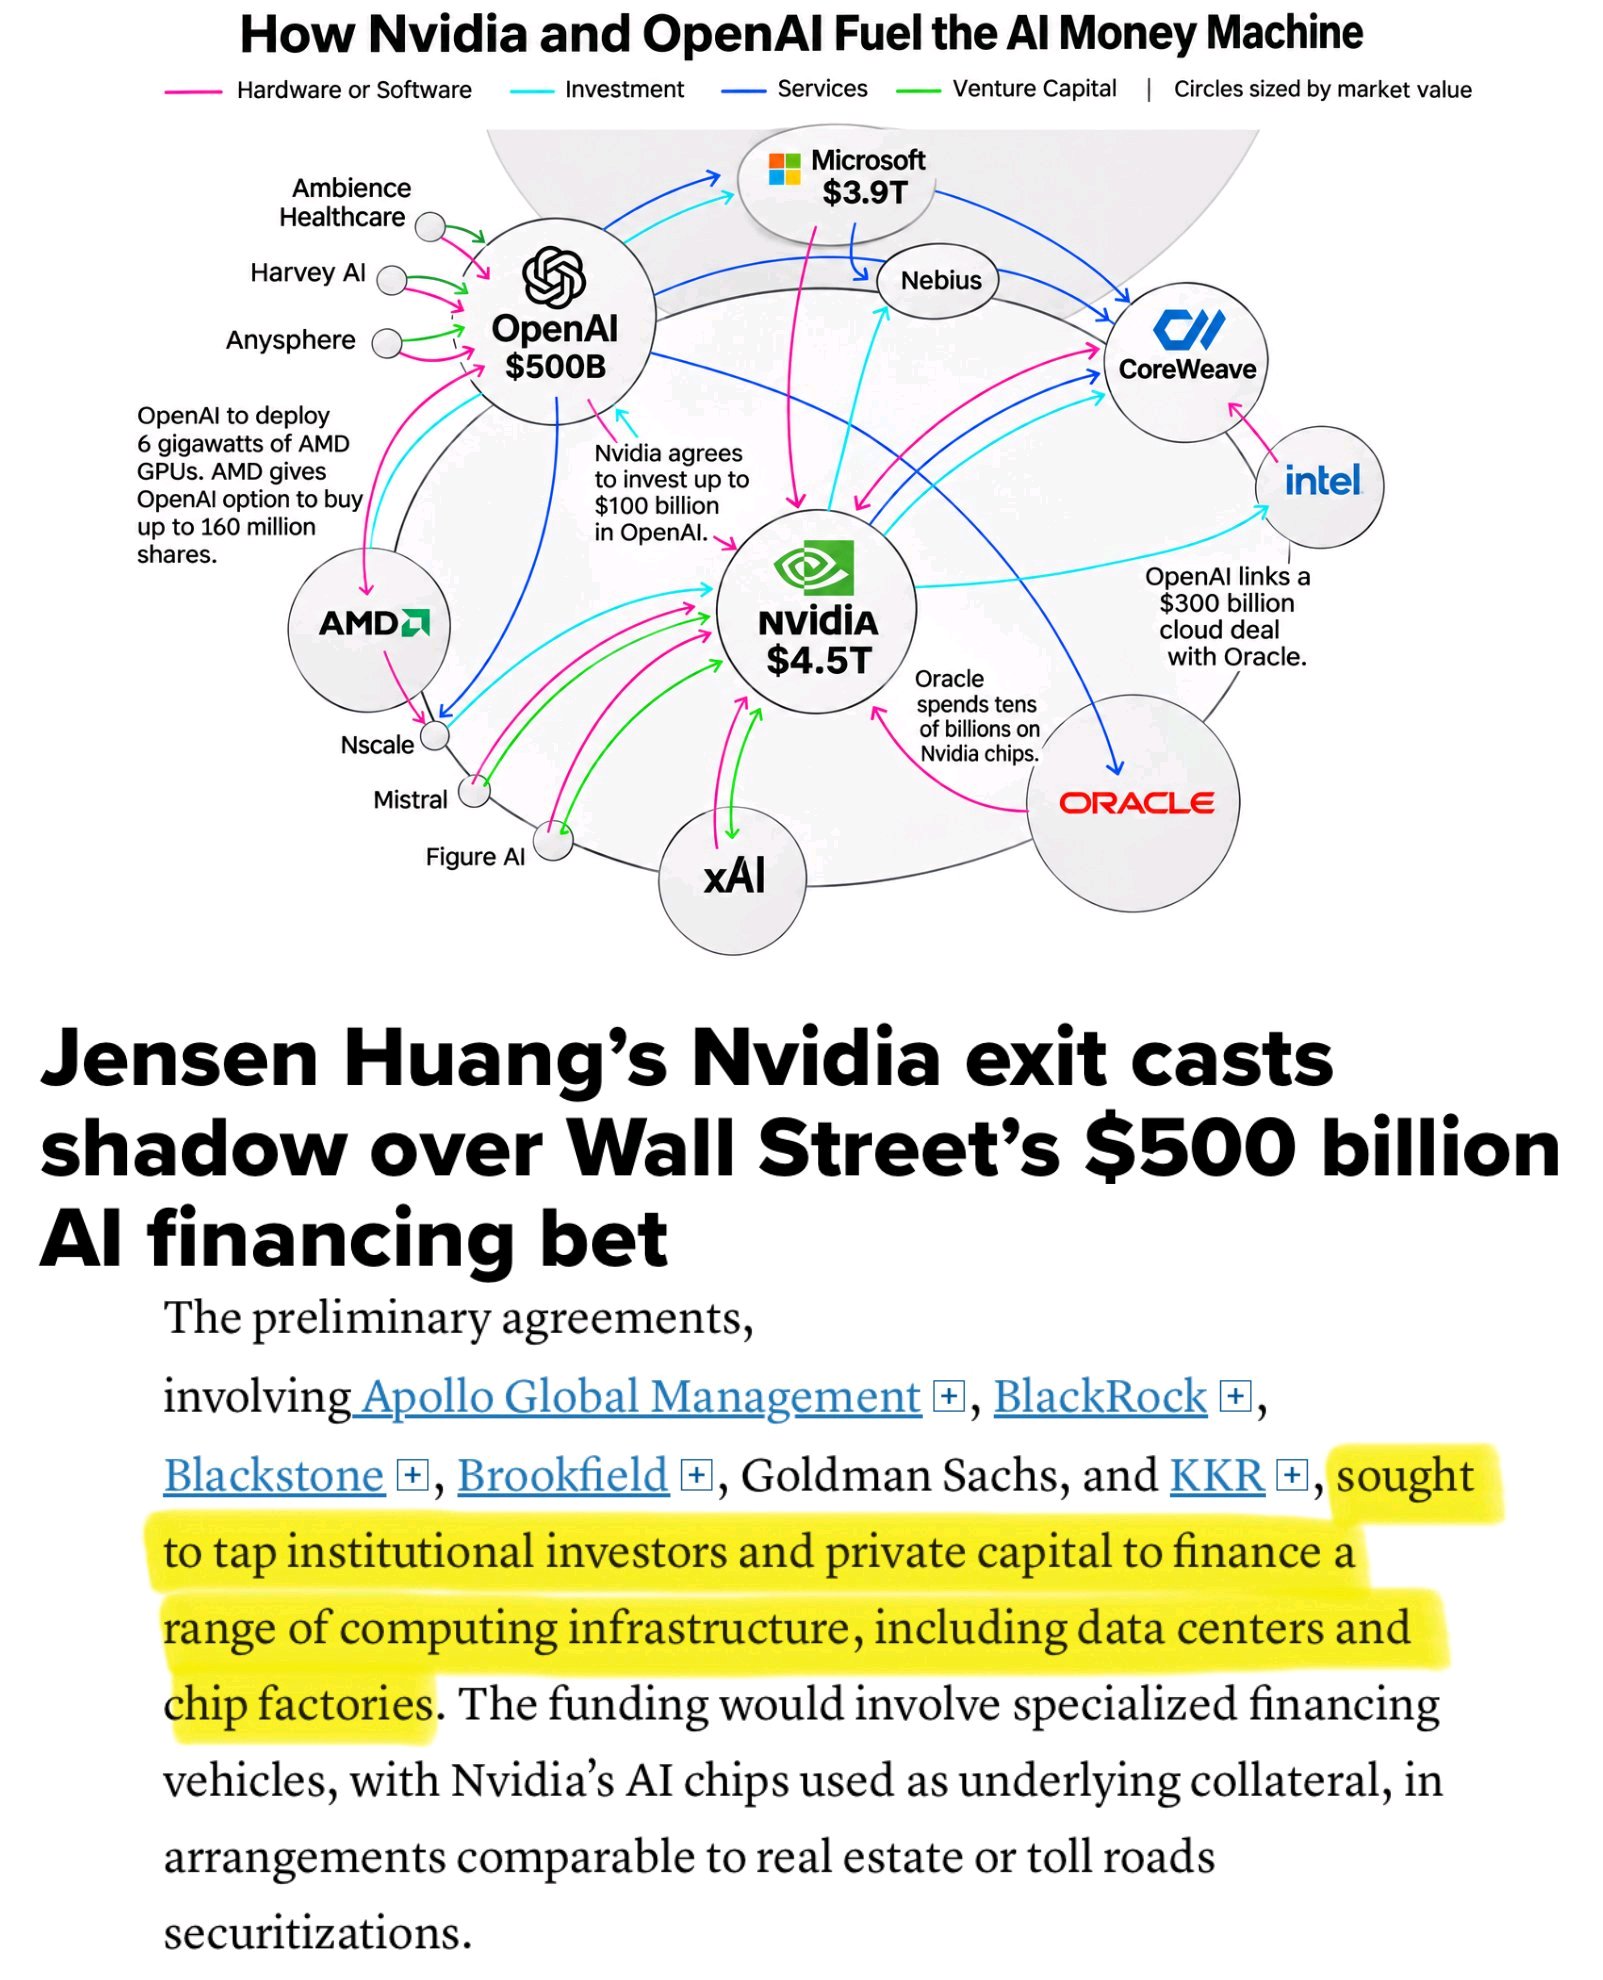
IMFが1.4兆ドル規模の循環的なAI取引を問題視。
巨大テック企業は、顧客が自社から買い続けられるように、顧客自身に資金を提供している。 現在判明しているAIの循環型融資の全容は以下の通りだ: 1. Nvidia ↔ OpenAI:NvidiaはOpenAIに300億ドルを投資し、同社のオハイオ州のデータセンターリース契約に対して最大1050億ドルの保証を行っている。OpenAIはそのデータセンターをNvidiaのチップで満たしている。 2. Oracle ↔ OpenAI:OpenAIはOracleと3000億ドルのクラウド契約を締結した。Oracleは、そのためのデータセンター建設に多額の借り入れを行っている。 3. Microsoft ↔ OpenAI:MicrosoftはOpenAIの約27%を所有している。OpenAIはMicrosoftのAzureクラウドに対して2500億ドルの支出を確約した。 4. SoftBank ↔ OpenAI:SoftBankはOpenAIに646億ドルを投資した。OpenAIはSoftBankのSB Energyからデータセンターを賃借している。 5. Amazon ↔ OpenAI:AmazonはOpenAIに最大500億ドルを投資している。OpenAIはAmazonとのクラウド契約を1000億ドル拡大した。 6. AMD ↔ OpenAI:AMDはOpenAIに対し、最大1億6000万株のAMD株式を1株0.01ドルで購入する権利を与えた。その見返りとして、OpenAIはAMDのチップを購入している。 7. Google ↔ Anthropic:GoogleはAnthropicに最大400億ドルを投資している。AnthropicはGoogle Cloudに対して少なくとも1210億ドルの支出を確約した。 8. Amazon ↔ Anthropic:AmazonはAnthropicに最大330億ドルを投資している。AnthropicはAmazonのクラウドに対して少なくとも1100億ドルの支出を確約した。 9. Broadcom ↔ Anthropic:銀行は、Broadcomのチップを購入してAnthropicにリースする特別目的会社に対し630億ドルを融資した。Broadcomは当該チップの転売価値を保証している。 10. Microsoft + Nvidia ↔ Anthropic:両社は合わせて最大150億ドルを投資している。AnthropicはMicrosoftのクラウドに対して少なくとも449億ドルの支出を確約した。 11. SpaceX ↔ Anthropic:SpaceXはNvidiaのチップを購入するために400億ドルを借り入れ、そのコンピューティング能力をAnthropicに販売している。NvidiaはSpaceXの株主である。 12. Nvidia ↔ CoreWeave:NvidiaはCoreWeaveの約11%を所有しており、同社の未使用キャパシティを63億ドル分購入することに合意した。CoreWeaveはNvidiaのチップを購入している。 13. Nvidia ↔ ネオクラウド企業:Nvidiaは、小規模なAIクラウド企業から360億ドル分のクラウドキャパシティを購入することに合意した。各社はその保証された収入を担保に借り入れを行い、Nvidiaのチップを購入している。 14. Microsoft ↔ Nscale, Nebius, IREN:Microsoftはこれら各社と最大709億ドルの契約を結んだ。各社はその資金をGPUの購入に充てている。 15. Google ↔ 元ビットコインマイナー:GoogleはTeraWulfおよびCipherとのリース契約において数十億ドルを保証し、その見返りとして両社の株式を取得している。 16. Meta ↔ Blue Owl:273億ドル規模のデータセンターが共同事業体を通じて建設され、Metaが280億ドルの保証によってこれをバックアップしている。 17. AnthropicのIPO:同社のチップおよびクラウドサプライヤーであるNvidia、Google、AMD、Micron、Broadcom、Microsoftが、Anthropic株を260億ドル分購入している。Anthropicはこれら同じ企業に対して、将来的な支出として数千億ドルの負債を抱えている。 資金が循環し続ける限り、これらのループによって各社の収益は見かけ上は非常に強固なものとなる。 $NVDAXUSDT #IMPACTbyTrade
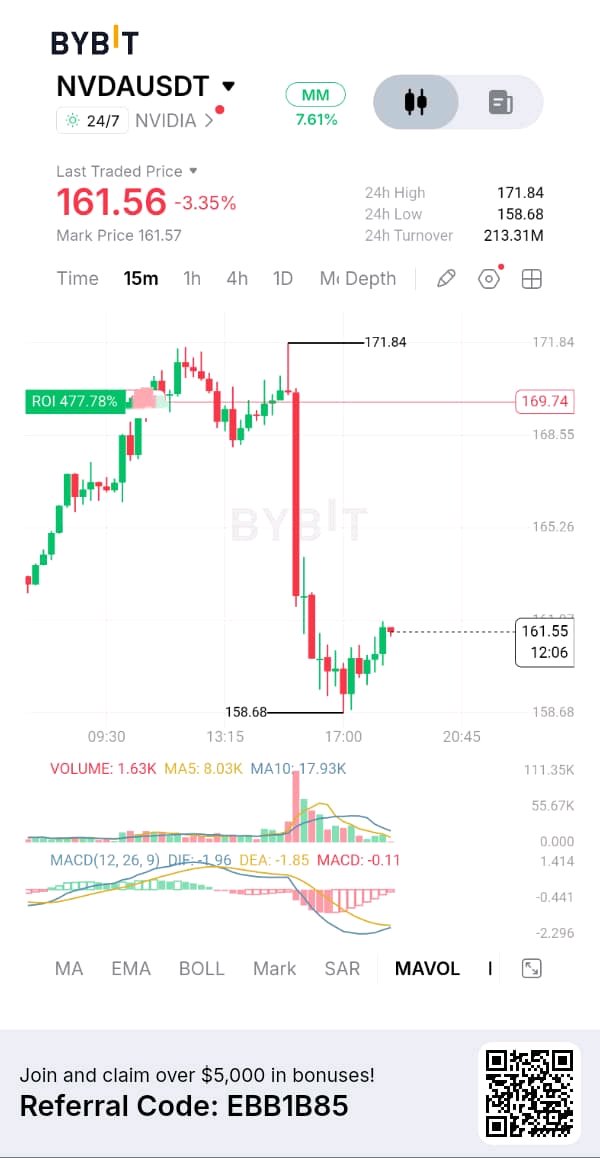
NVIDIA's NVDAUSDT market is experiencing significant selling pressure after a sharp intraday reversal from the $171.84 high. Although buyers have started defending the $158.68 region, the recovery remains relatively weak, and the market has not yet confirmed that the selling pressure is over. My Bybit 15-minute chart shows $NVDAXUSDT trading around $161.56, down approximately 3.35%. The price action suggests that sellers have regained short-term control following an earlier bullish move. The next reaction around $158.68 could determine whether this is simply a temporary correction or the beginning of another downward leg. CHART + TECHNICAL ANALYSIS The most important development is the aggressive bearish candle that pushed price from the $169 region toward $160, followed by another move that established an intraday low of $158.68. Buyers have attempted to recover from that low, gradually pushing price toward $161.56. However, the recovery has not yet reclaimed the previous breakdown structure. MACD remains negative, with DIF at -1.96, DEA at -1.85 and histogram around -0.11. Although the negative histogram suggests bearish momentum is easing slightly, the indicator has not confirmed a bullish reversal. FUNDAMENTAL PERSPECTIVE NVIDIA remains one of the most important companies in the global semiconductor industry, with its GPUs playing a central role in artificial intelligence training, data centers and accelerated computing. Its long-term growth opportunity is connected to continued AI infrastructure investment, demand for advanced chips and expansion of enterprise computing. However, strong company fundamentals do not prevent short-term market corrections. Valuation, earnings expectations, capital expenditure trends and broader technology-sector sentiment can all influence price performance. MACRO + MARKET CONDITIONS Technology stocks are sensitive to interest-rate expectations, liquidity conditions and changes in investor appetite for risk. A weaker broader equity market could increase pressure on NVDA, even if its company-specific fundamentals remain strong. I would also monitor the performance of major semiconductor stocks and the wider Nasdaq market. A recovery supported by the broader technology sector would provide stronger confirmation than an isolated bounce. MY TRADING PLAN I wouldn't chase the current bounce or enter blindly during the consolidation. For a bullish position, I want to see buyers defend $158.68, reclaim resistance and demonstrate stronger volume. For a bearish position, I would prefer a confirmed breakdown followed by a failed attempt to recover the lost support. Position sizing will remain controlled, with a predefined stop-loss and partial profit-taking at the first target. #IMPACTbyTrade
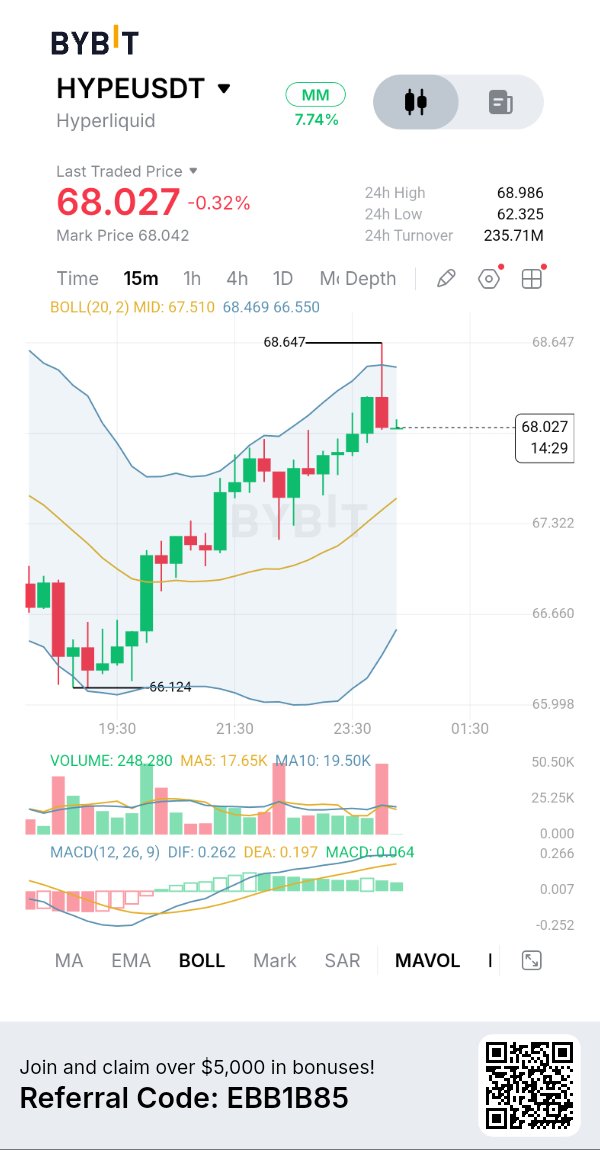
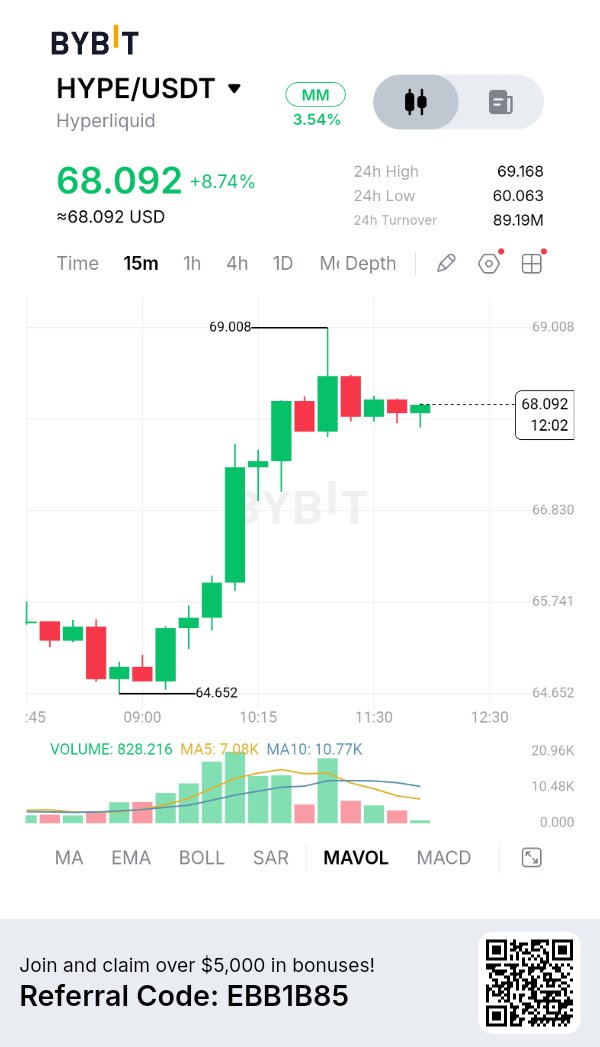
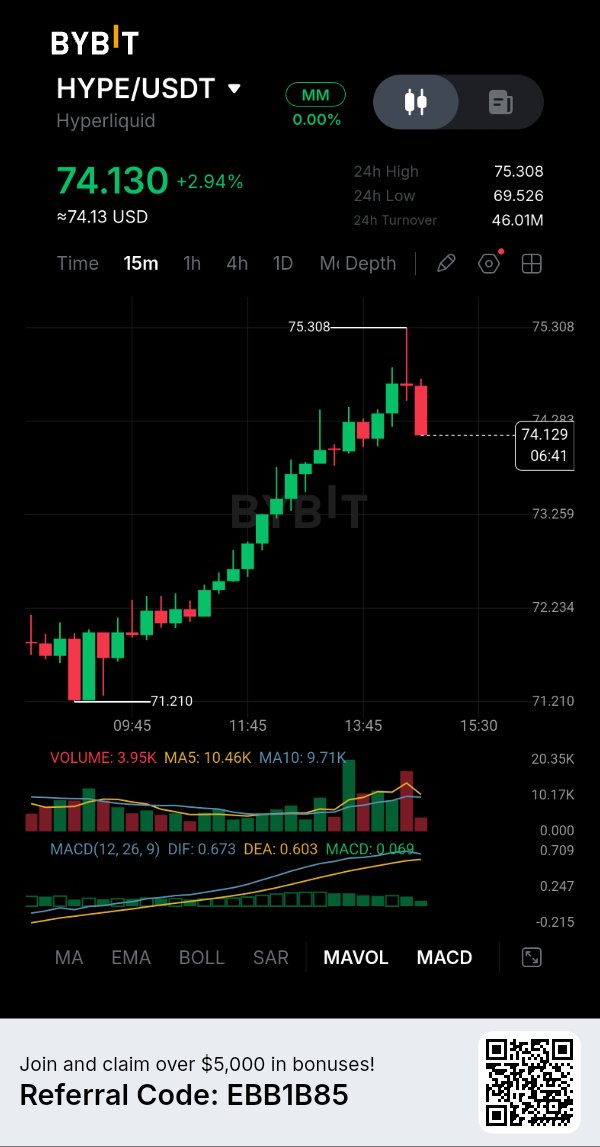
$HYPEUSDT is showing renewed buying strength after recovering from the $71 region, but the latest rejection near $75.30 suggests that the market is approaching an important decision point. Buyers have made considerable progress during this intraday recovery, although the next move will depend on whether they can overcome resistance with stronger volume and maintain the newly established bullish structure CHART + TECHNICAL ANALYSIS My Bybit $HYPEUSDT 15-minute chart shows price trading around $74.13, up approximately 2.94%. Price advanced from an intraday low of $71.210 to a high of $75.308, representing a strong recovery within the observed session. For HYPE, the important question is how increasing platform activity translates into sustainable token demand. A growing ecosystem can strengthen long-term fundamentals, but token appreciation still depends on market demand, liquidity and the economic value captured by the token. TOKENOMICS AND VALUE ACCRUAL HYPE has utility within the Hyperliquid ecosystem, including staking, validator participation and trading-related mechanisms. An important component of its token economics is the Assistance Fund, which uses protocol revenue to acquire HYPE through its fee-related mechanism. This creates a potential connection between platform activity and token supply reduction. The key levels on my chart are $75.308 resistance, $73.259 immediate support, $72.234 secondary support and $71.210 as the major visible intraday swing low. FUNDAMENTAL ANALYSIS Hyperliquid continues to develop its position as a major decentralized trading infrastructure platform. Its ecosystem includes perpetual futures, spot markets and HyperEVM, which expands the possibilities for decentralized applications and financial services. The HIP-3 framework is particularly interesting because it allows approved third-party deployers to introduce additional perpetual markets. This potentially expands the range of assets and trading opportunities available within the ecosystem. The candle structure shows a sequence of higher highs and higher lows, suggesting that short-term buyers have gained control. However, the latest rejection candle indicates that sellers are becoming active around the $75.30 resistance region. MACD remains positive, with DIF at 0.673, DEA at 0.603 and histogram around +0.069. This indicates that bullish momentum is still present, although the narrowing difference between the MACD lines makes it important to monitor whether momentum continues improving. Volume currently reads approximately 3.95K, below MA5 at 10.46K and MA10 at 9.71K. This is an important observation because a breakout without stronger trading participation may struggle to sustain itself. #IMPACTbyTrade

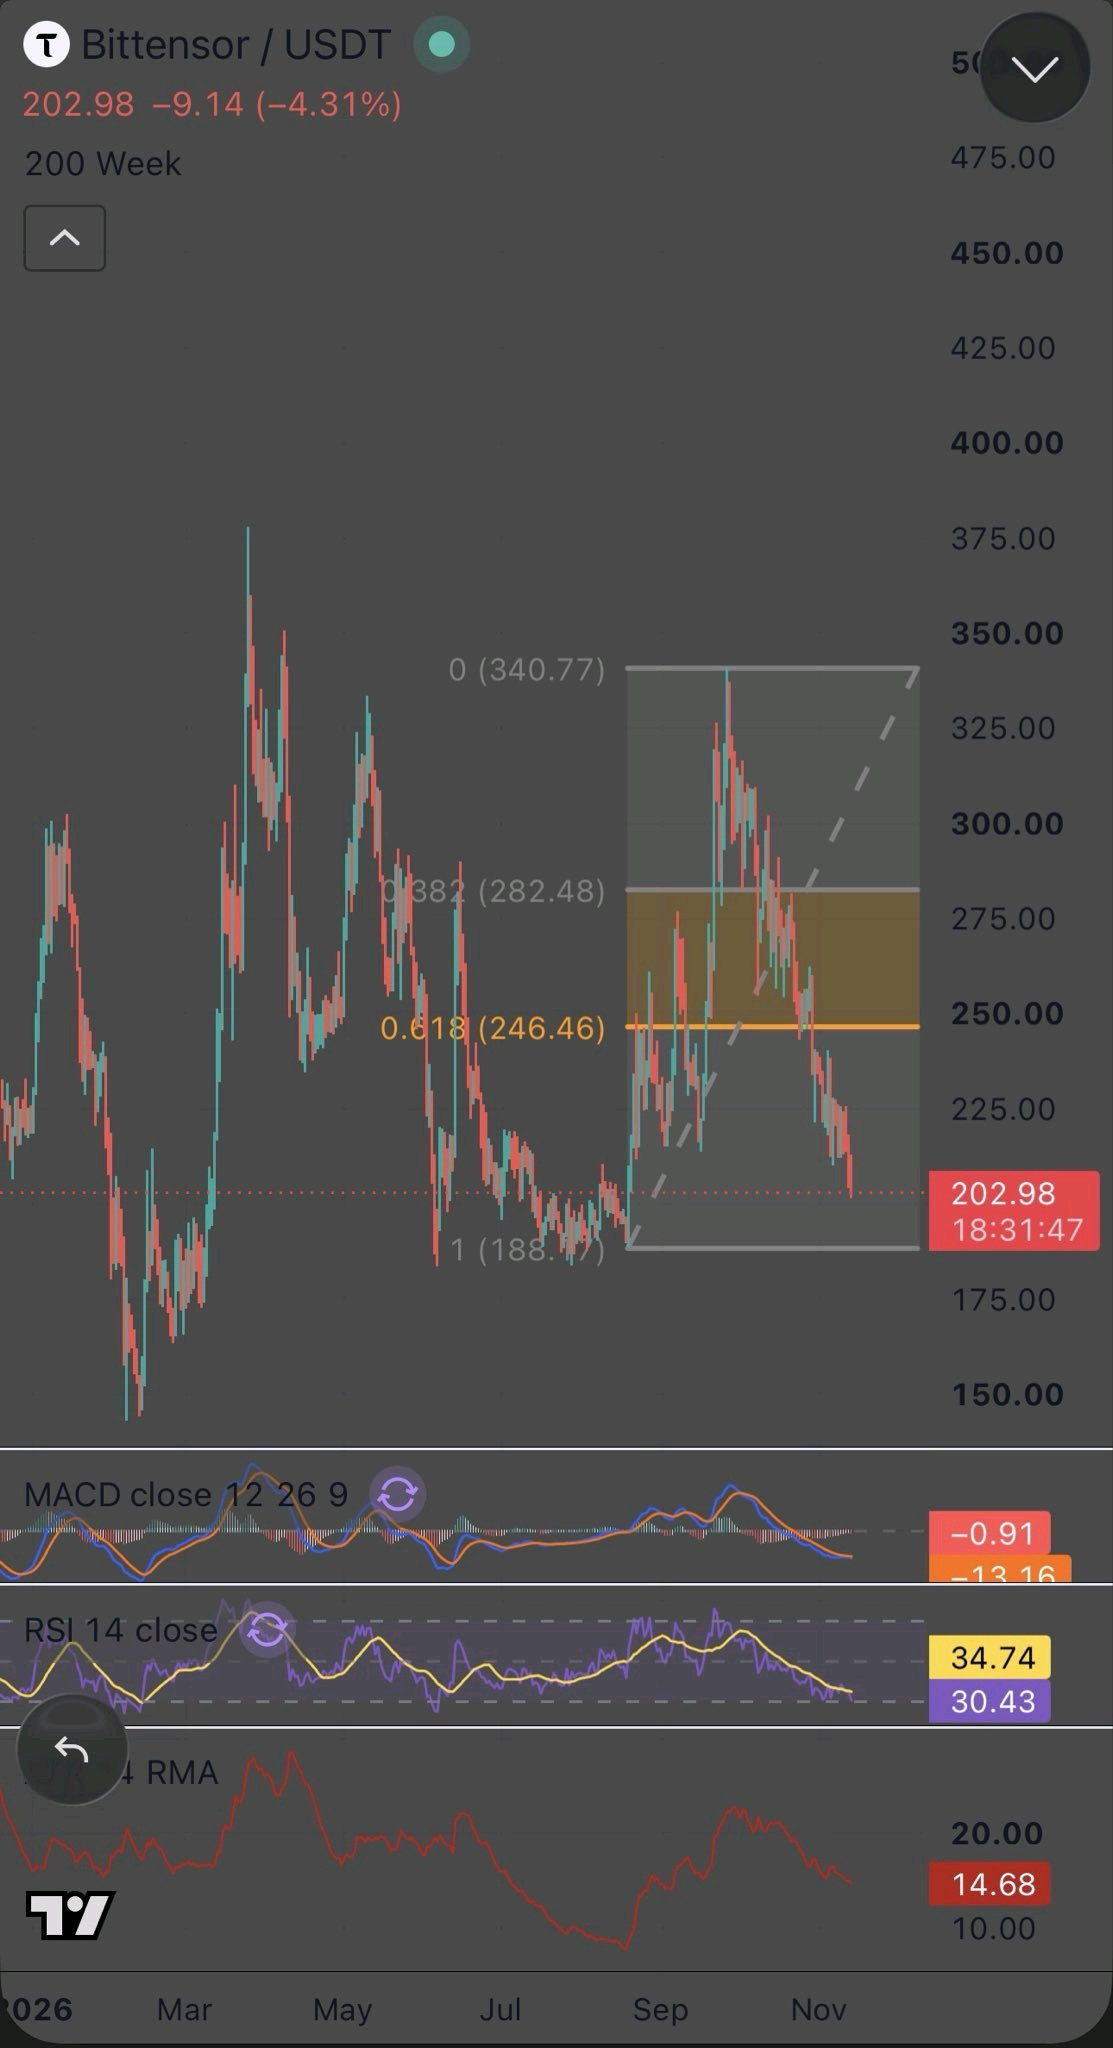
$TAOがようやく安全圏に入ったと感じて280ドルで購入した。 今、チャートを開いて203ドルという数字を見て、ポートフォリオの状況を誰かに聞かれる前にアプリを閉じる。 その気持ちはよくわかる。だからこそ、私は何週間もこの水準について投稿し続けていたんだ。 188ドルの安値から340ドルの高値まで引いたフィボナッチ: 0.382は282ドル 0.618は246ドル 全戻しは188ドル ゴールデンポケットは「一線」だった。10月下旬にそれを割り込んでから、どんな反発もその下で叩き潰されてきた。 現在、$TAOは203ドルで取引されている。 これは、多くの人がまだ340ドルへの回帰を待っていた頃に、私が指摘し続けたフロアから約7%上の水準だ。 現在のモメンタム: RSIは30近辺で、売られすぎ圏内をノックしている MACDはシグナルを下回っているが、ヒストグラムは縮小している 売り手は疲弊しつつあるが、まだ終わってはいない 決断の分かれ目は188ドルだ。 ここを維持できれば、7月のベースと合わせてダブルボトムになる。最初に奪還すべき壁は246ドルだ。 日足終値でここを割り込めば、このシナリオは無効となる。3月の安値である150ドル近辺が再び視野に入ってくる。 私は相場を当てずっぽうで予想したわけではない。何週間も前に地図を描いておき、価格がそれに従っただけだ。 今日あなたが感じている痛みは、それがあなたのポートフォリオに達するずっと前に、このチャート上に刻まれていたものなんだ。 $QNTUSDT $NVDAXUSDT #IMPACTbyTrade
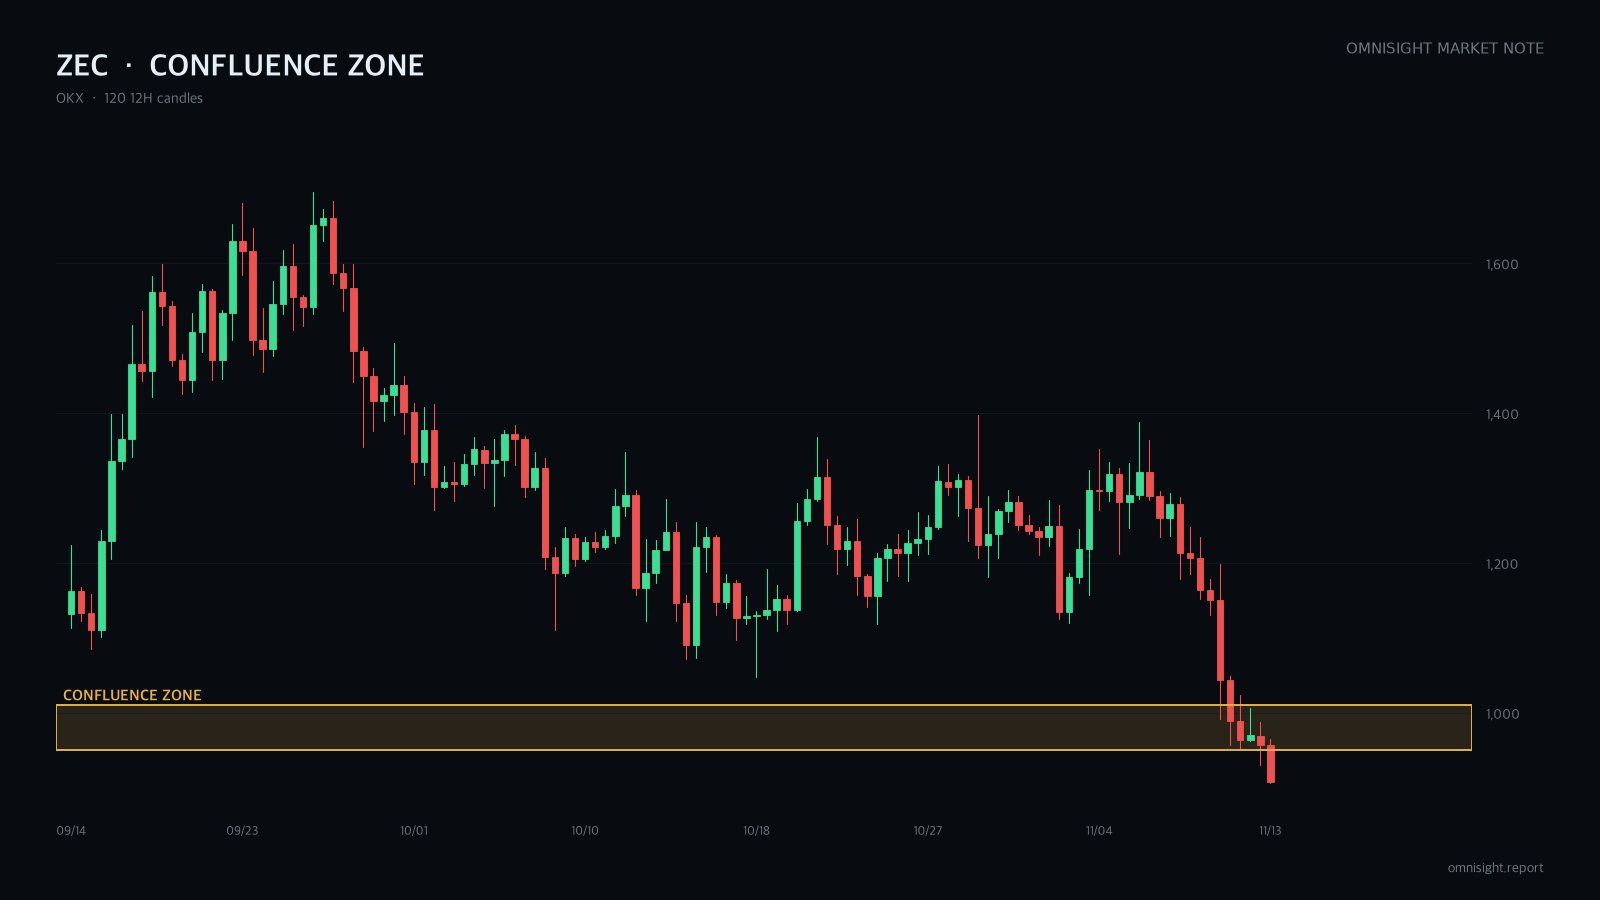
$ZECは出来高を伴って6週間のサポートラインを割り込み、日足チャートでは高値を切り下げる展開が4回続いている。ショート目線ではあるが、現時点では売らない。ブレイクダウンが発生したエリアまでの戻りを待ちたいと考えている。 懸念点:すでにかなり売られすぎているため、戻りがない可能性もある。 このサポートラインは6週間維持されていたが、2日間の強力な売りで崩壊した。その後、価格は12時間足の長期平均線も割り込んでいる。それ以降の日足の反発はすべて前回よりも低い水準で止まっている。 売りエリアとして意識しているライン: - 直近の4時間足での下落幅に対する50〜79%の戻り水準 - 直近の1時間足での反発高値 - ブレイクしたサポートラインの裏側(売り圧力が溜まっている場所) 同じエリアに3つの根拠が重なるため、追っかけずに待つことにしている。 ICT(インナー・サークル・トレーダー)の視点で見ると、上位足の構造はすでに崩れているため、戻りは reversal(反転)ではなく、プレミアムな売り場となる。買い側の流動性は直近の4時間足および12時間足のスイングハイ(高値)の上に溜まっている。ストップはその上方に置くため、単なるスイープ(狩り)では狩られない。 もし4時間足の終値が12時間足のスイングハイを上回ったら、自分の分析は間違いということになる。そうなれば高値を切り下げるトレンドは終了だ。 リスク:価格が戻ることなく日足の200 EMAまで一直線に下落し、注文が約定しない可能性がある。暴落後のBTCの値動きは上下に激しく振れることがある。 投資助言ではない。すべての判断と責任は自分自身にある。 $BTCUSDT #IMPACTbyTrade
$BTCUSDT は一直線に下落した後、直近安値を更新したね。弱気だけど、ここでの売りは控える。 ブレイクしたサポートラインへのリバウンドを待つよ。 リキッド・フラッシュ(強制決済の連鎖)の後に追いかけるショートは、大抵最悪な結果になる。 11月初旬の高値以来、日足、12時間足、4時間足のすべてで高値・安値の切り下げが続いている。今日の足は、昨晩から維持されていた4時間足のボックスを突き抜けた。 それでもショート目線を維持する理由: - 4つのテクニカル分析手法すべてが同じ方向を指している。 - RSIが価格とともに下落し続けている。強気ダイバージェンスは出ておらず、4時間足では隠れた弱気ダイバージェンスが見られる。 - マクロ環境が追い風(マイナス要因)になっている:CPIの上振れ、ETFからの資金流出など。 私の注目ゾーンは、ブレイクしたボックス、今日の下落幅の約38%戻し、そして1時間足のギャップが重なるエリアだ。サポートがレジスタンスに転換した最初の再テストポイントになる。 エリオット波動で見ると、第3波の下落幅が第1波と同じ長さになった。通常、第4波の反発はここで始まり、第5波の安値更新の前に、その戻り付近で停滞することが多い。 もし価格が直近の12時間足のスイングハイをクリアし、第(i)波の安値とオーバーラップしたら、私の見立ては間違いだ。そうなれば高値切り下げのシーケンスが崩れ、このカウントは無効になる。 リスク:長期間のスクイーズ(踏み上げ)の後の深い売られすぎ状態なので、リバウンドが激しくなる可能性がある。FRB関連やインデックスイベントで、3〜10日間ほどこの状況が続くかもしれない。 これは投資助言ではない。すべての判断と責任は自分自身にある。 #IMPACTbyTrade
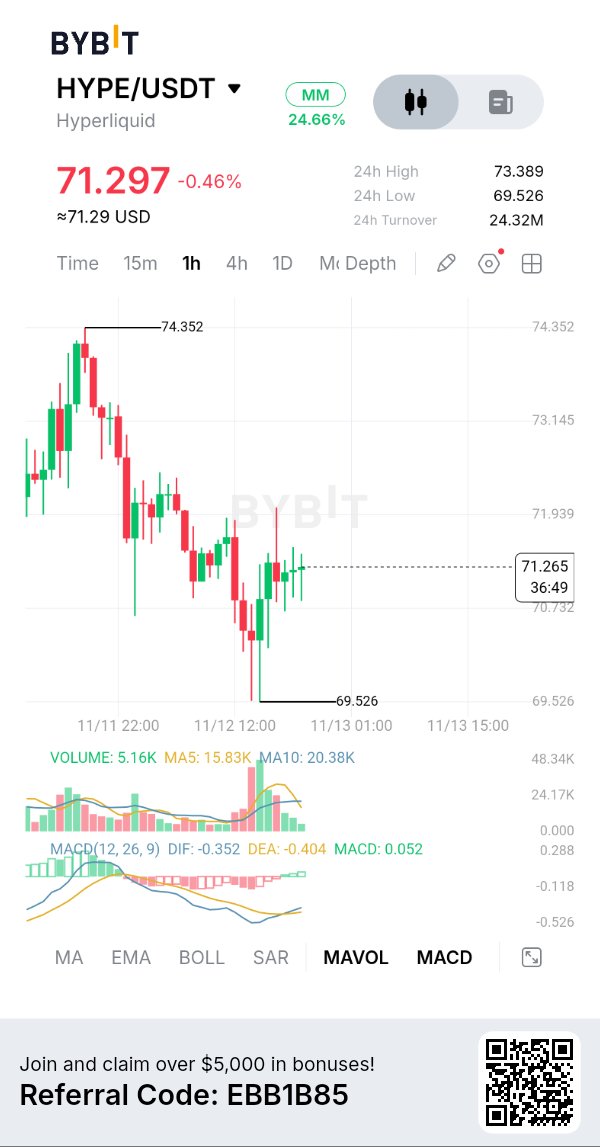
HYPEUSDTは日足、12時間足、4時間足のすべてで高値・安値を切り下げています。弱気(ベア)ですが、今の水準で売るつもりはありません。 価格は急落後、4時間足レンジのディスカウント(割安)ゾーンに位置しています。ここでのショートはリスクリワードが悪いため、上のゾーンまで戻すのを待っています。 前回高値以降、4時間足の反発は毎回その前の高値を下回っており、構造的な変化(構造転換)はまだ見られません。 上のゾーンが重要な理由: - 直近の下落波に対する0.618〜0.79の戻り水準であること - 4時間足の20EMAがちょうど通っていること - 下落前の最後の上昇ローソク足が残した供給ゾーン(サプライ)と重なっていること - 以前のサポートが、現在はレジスタンスとして機能する位置にあること 4つの根拠が1つの帯状領域に重なっています。ここが売り手が再び試すポイントになると予想しています。 ICT的視点:弱気のオーダーブロックはレンジのプレミアム(割高)半分をカバーしています。ここへの戻りを売ることで、損切りを構造上の高値に置くことができます。最初のターゲットはダブルボトムの下、売り注文(ストップロス)が溜まっている場所です。 私のシナリオが崩れる場合:4時間足/12時間足での直近高値をブレイクした場合。その時点で高値切り下げのシーケンスは終了となるため、私は撤退します。 リスク要因:直近の安値は日足の200EMAと重なっています。また、BTCは金利やNVIDIA CEOのニュースで12週間ぶりの安値を記録したばかりなので、相場は上下に激しく振れる可能性があります。 これは投資助言ではありません。すべての決定と責任はあなた自身にあります。 #IMPACTbyTrade
$ETHUSDT swept below its prior low today and snapped back. It looks like a bottom. I read it as fuel for a bounce I want to sell. Bias: short. I'm waiting for the bounce to reach today's broken support. The catch: the bounce could run past it. Context: daily, 12h and 4h all print lower highs and lower lows. Price sits below the 20, 50 and 200 EMAs on every timeframe. Today's inflation shock pushed it through a round-number floor before buyers stepped in. Why that zone: - Three of four technical methods (ICT, Wyckoff, Elliott) point short - Broken support, a 1h order cluster and the midpoint of the recent drop stack in one area - Macro and news are risk-off, so there's little fuel for a bigger rally When independent reads land on one zone, sellers have a reason to defend it. From an ICT lens, the sweep took out resting stops but didn't change structure. No break above the last 4h lower high yet, so rallies are retracements inside a downtrend. Where I'm wrong: a 4h close above that lower high breaks the sequence. Then I step aside. Risks: - Bullish divergence on 4h and 1h could stretch the bounce - If price drops without bouncing, the order never fills. I won't chase Not investment advice. All decisions and responsibility are your own. #IMPACTbyTrade