Sam Usman
4977いいね0シェア444ファン781フォロー
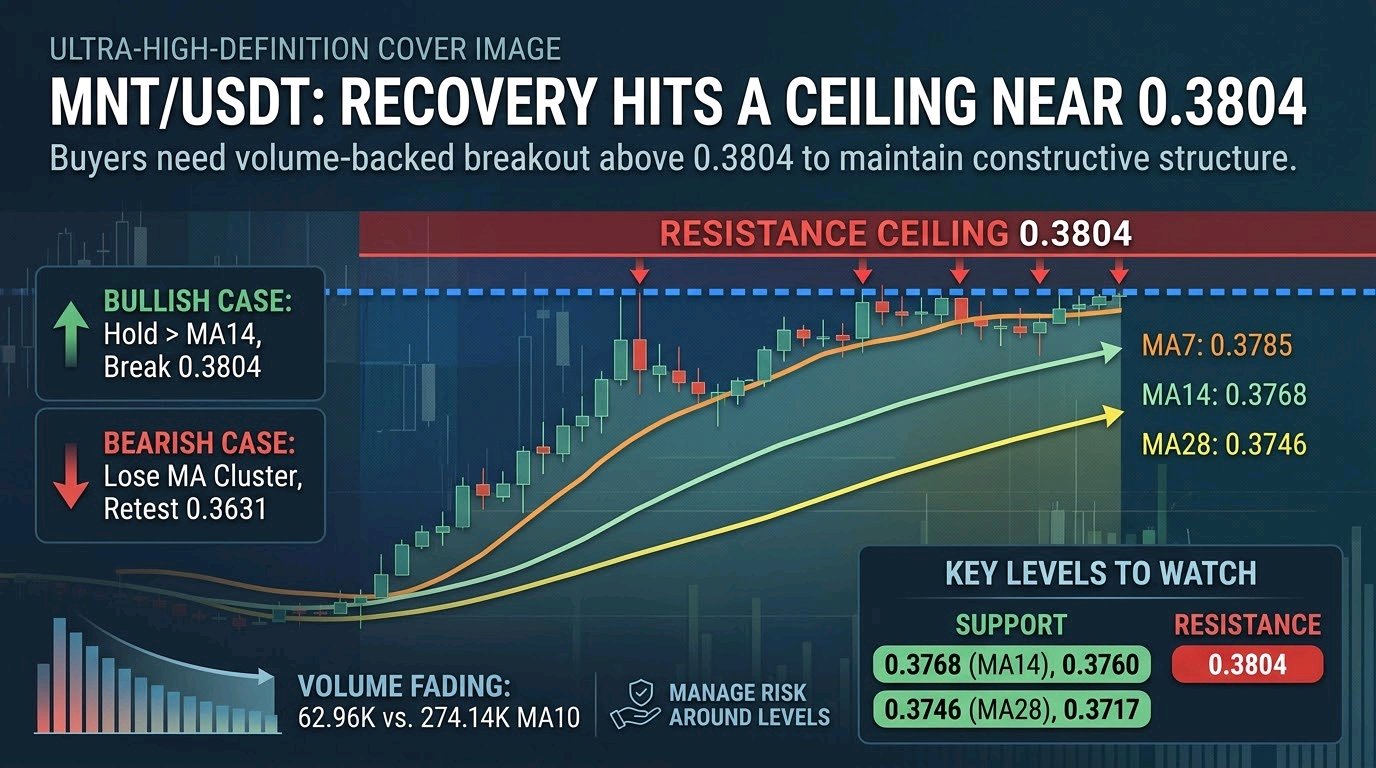
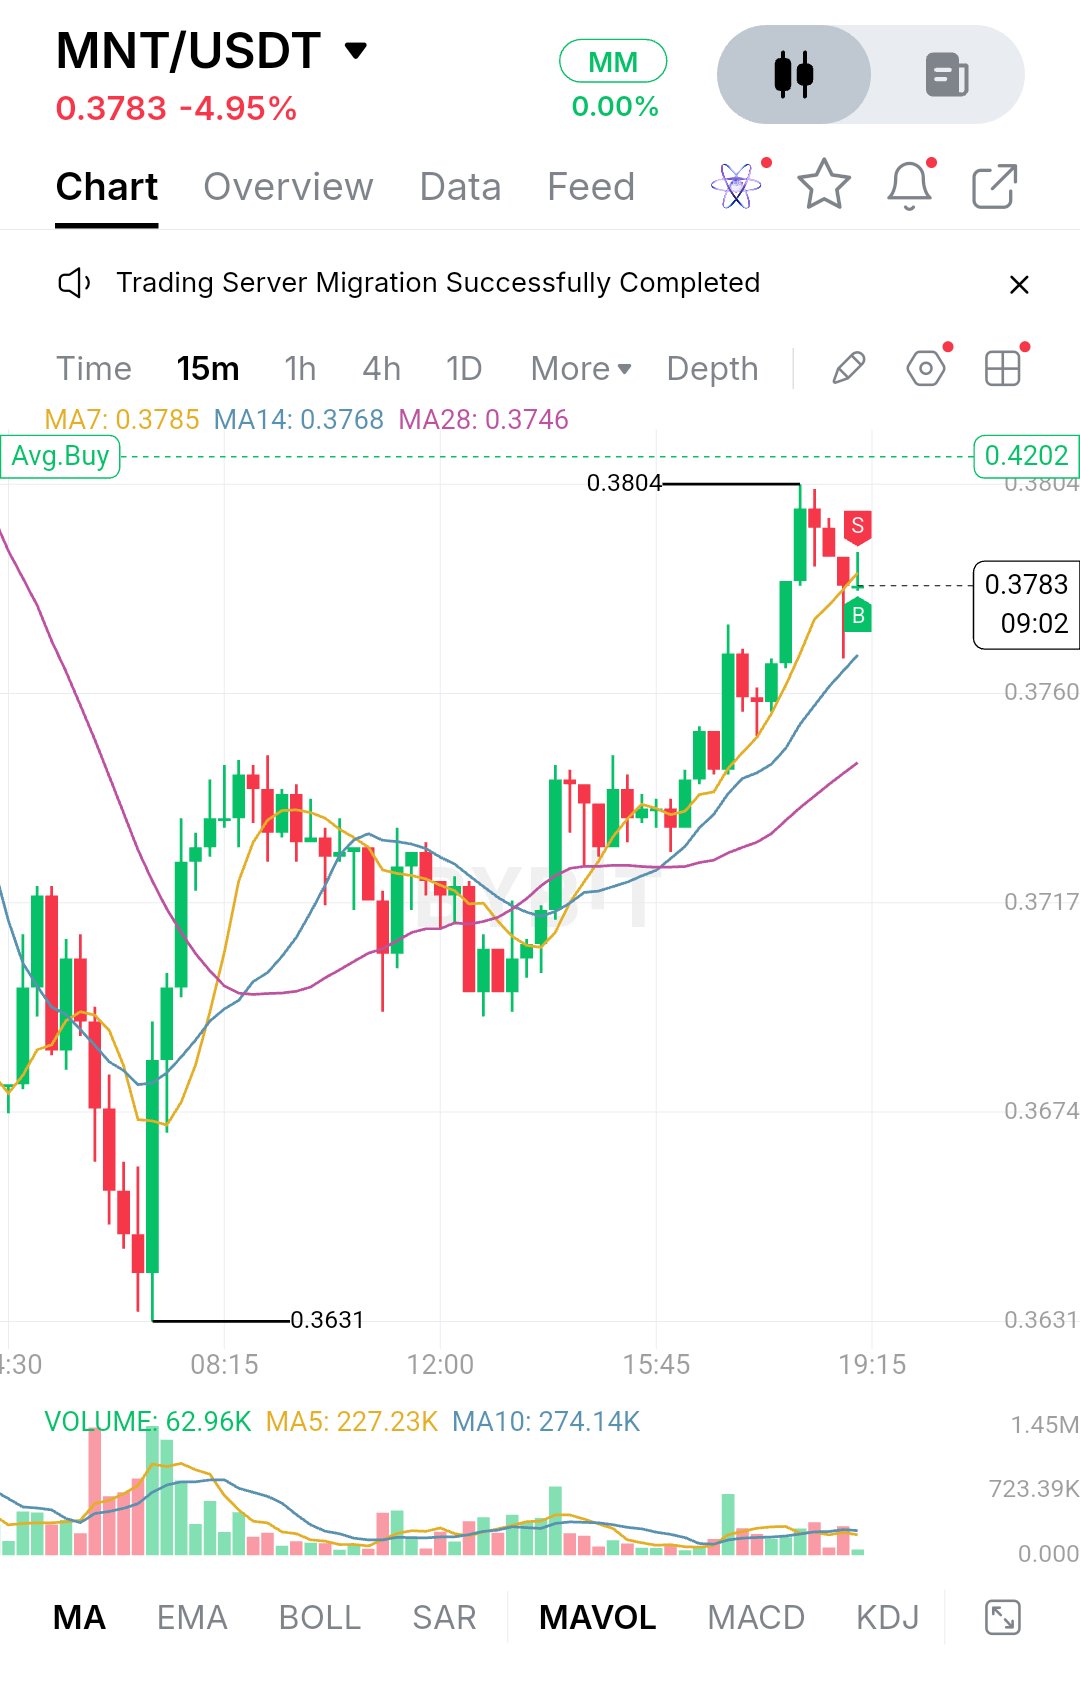
$MNTUSDT: Recovery Hits a Ceiling Near 0.3804 MNT is trading at 0.3783, down 4.95% on the day. That headline number hides the shape of the session. Sellers dominated the early hours and pushed price down to 0.3631, where a large buy candle absorbed the selling. Buyers then rebuilt the move step by step, and price climbed back to 0.3804 before sellers showed up again. The recovery was real, but the day is still negative. After the low, MNT did not shoot straight up. It spent the stretch from roughly 08:15 to 12:00 chopping sideways in the 0.3680 to 0.3730 area, with overlapping candles and wicks on both sides. That kind of base-building is slower and less exciting, but it usually makes for a sturdier recovery. Price finally broke out of the range in the afternoon with a run of strong green candles, which carried it to the session high. The last few candles, though, are red and the push higher has stalled. At the moment it looks like a market pausing at resistance rather than one that has clearly turned over. On the moving averages, MA7 sits at 0.3785, MA14 at 0.3768 and MA28 at 0.3746. They are stacked in the right order for a short-term uptrend, with the faster average on top and all three sloping upward. Price at 0.3783 is hugging MA7, so it is testing the short-term trend line right now. A small dip toward MA14 would be normal behavior in a healthy trend. What I'd be cautious about is volume. The latest candle shows 62.96K against a MA5 of 227.23K and a MA10 of 274.14K, so participation is well below recent averages. The earlier breakout leg had noticeably stronger volume, and the current pullback is quiet. That cuts both ways: it's not aggressive selling, but it also means buyers haven't stepped back in with conviction yet. For support, the first area is the MA14 zone near 0.3768, followed by the 0.3760 level on the chart axis. Price has been respecting the short averages during this climb, so a hold here would keep the structure intact. Below that, MA28 at 0.3746 is the next line to watch, then the 0.3717 and 0.3674 levels, which line up with the consolidation range that served as the launch pad for the breakout. The major floor remains 0.3631. A break below the moving average cluster would suggest the afternoon rally was just a bounce, and price could drift back into the old range. On the upside, resistance is clear: 0.3804 is the session high and the level that just rejected price, which is also where the red S marker sits on the chart. A clean move through it, ideally on better volume than we see now, would mark a higher high and push the structure forward. There is also a dashed Avg.Buy line at 0.4202 on the chart. That is your own average entry rather than a market level, but it shows how far price would need to travel to get back to breakeven, roughly 11% above the current price. I wouldn't treat it as a realistic near-term target. The bullish case is simple. Buyers need to defend the 0.3768 to 0.3760 zone, keep price above the rising MA14, and then close decisively above 0.3804. Volume should expand on that move. If it does, the next area to watch is higher up the chart, where there's no marked resistance, so momentum would have to do the work. The upper range toward 0.40 is a natural psychological reference, but nothing in this chart confirms it yet. The bearish case starts with a failure to reclaim 0.3804 and a loss of the short moving averages. If price slips under MA14 and then MA28 at 0.3746, sellers get control of the short-term structure, and a retest of 0.3717 or 0.3674 becomes likely. A drop under 0.3631 would erase the whole recovery and put the morning low in play as a breakdown level rather than support. **Key Price Levels** - Resistance: 0.3804 (session high) - Immediate support: 0.3768 (MA14) and 0.3760 - Secondary support: 0.3746 (MA28) and 0.3717 - Deeper support: 0.3674 - Major support: 0.3631 (session low) - Short-term trend line: 0.3785 (MA7) The structure is constructive but unproven. Price made a higher-low sequence out of a sharp selloff, yet it is now sitting under a clear ceiling on fading volume. What matters next isn't the daily percentage but how price behaves around 0.3768 and 0.3804. A hold above the averages with a volume-backed breakout would open the next expansion leg, while a loss of the moving average cluster would put the range back in charge. Let price confirm before assuming either direction, and manage risk around the levels above. This is chart analysis, not financial advice. #ByXIMPACT$BTCUSDT
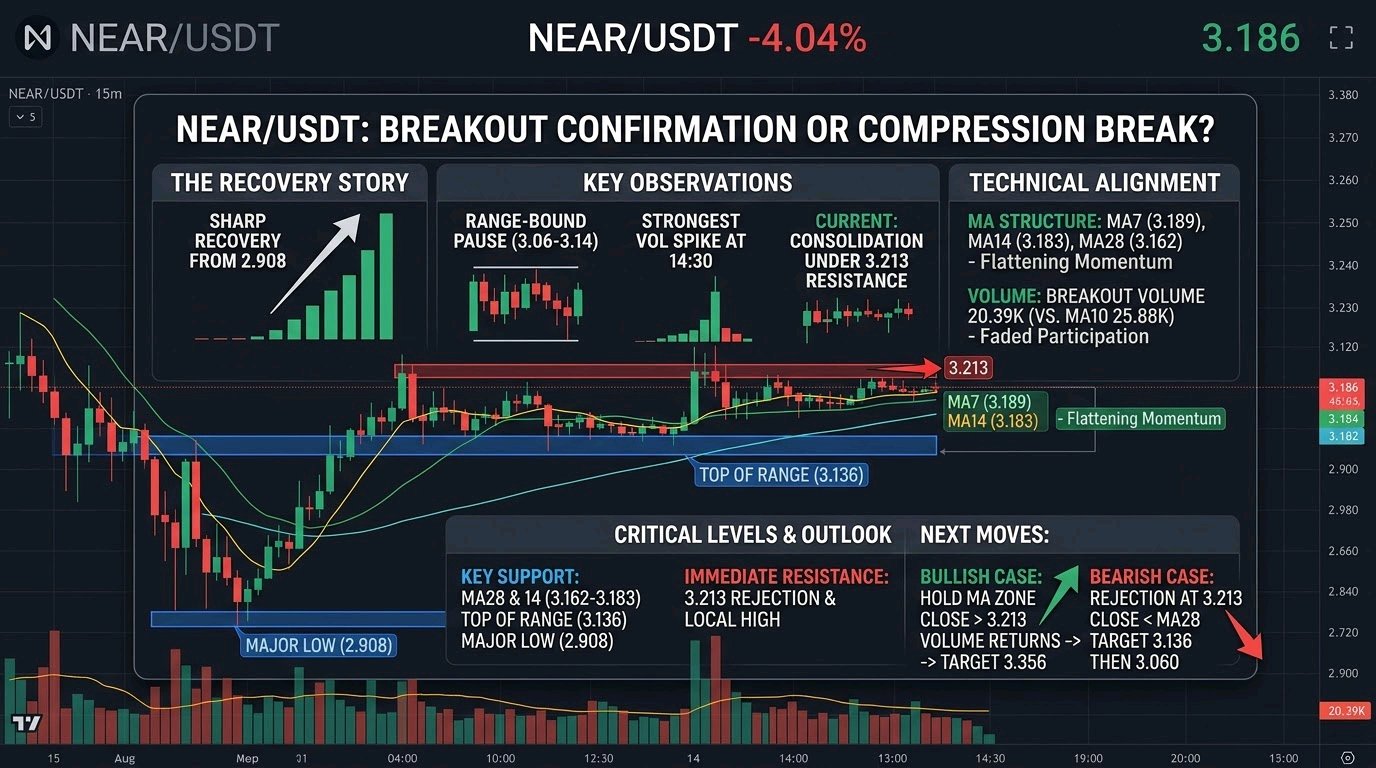
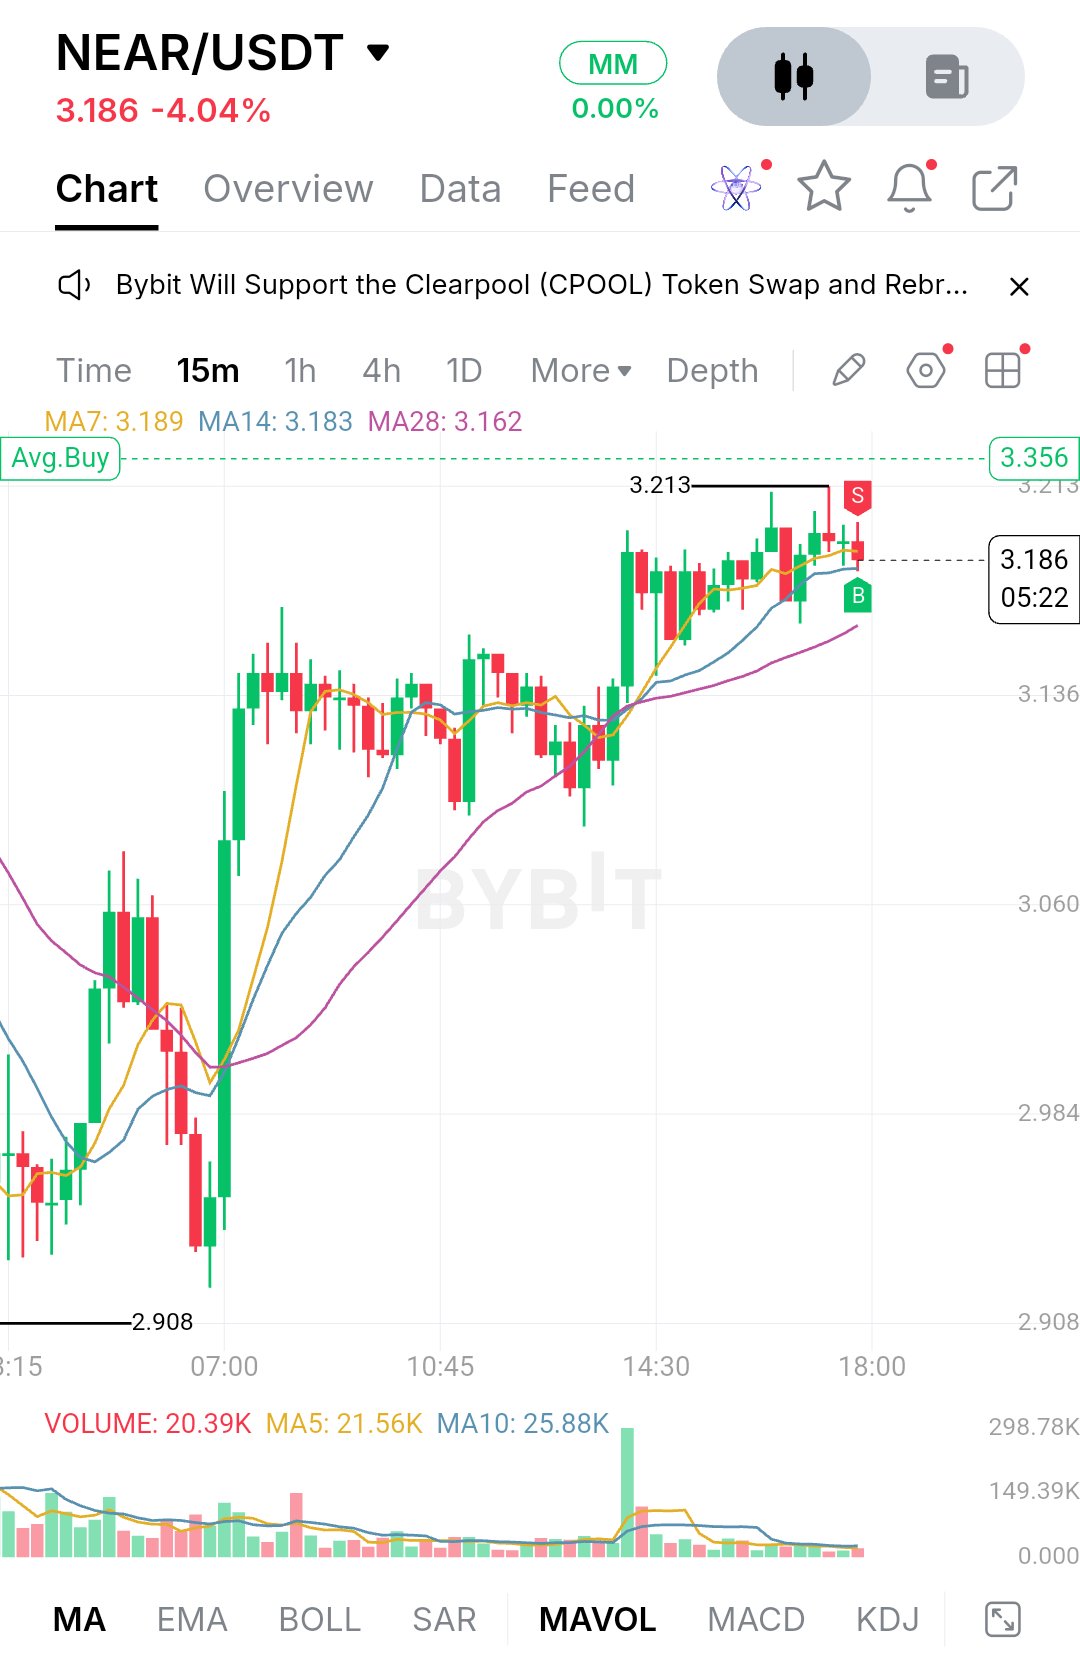
$NEARUSDT is trading at 3.186, down 4.04% on the day. That headline number hides a more interesting story. Sellers hit the pair hard earlier in the session and pushed it down to the 2.908 low, but buyers stepped in aggressively near the 07:00 mark. A large green candle drove price back up through the mid-range. The sellers who caused the drop have been mostly absorbed, and the market has been rebuilding since. After that sharp recovery, price spent several hours moving sideways between roughly 3.06 and 3.14, with candles overlapping and no clear direction. That kind of range is typically where the market decides whether the bounce was real. It resolved to the upside around 14:30, when a strong green candle broke out of the range on the biggest volume spike on the chart. Price then climbed to a local high of 3.213, where it stalled. The last several candles are small and indecisive, with a couple of upper wicks, so this looks like consolidation under resistance rather than a clean trend continuation. On the moving averages, the MA7 sits at 3.189, the MA14 at 3.183 and the MA28 at 3.162. Price is hugging the first two, which tells you momentum has flattened out for now. The structure is still constructive, though: the MA28 is sloping upward and sitting below price, and the shorter averages are stacked above it. Volume tells a similar story. The breakout spike was large, but participation has faded since, with the current bar at 20.39K and the MA5 and MA10 near 21.56K and 25.88K. A move without strong volume behind it tends to be easier to fade. The nearest support is the 3.162 to 3.183 area, where the MA28 and MA14 sit together. If buyers defend it, the structure of higher lows stays intact. Below that, the 3.136 level matters because it marks the top of the earlier range, and old resistance often turns into support after a breakout. A clean loss of 3.136 would put the 3.060 zone back in play, and below that 2.984 and finally the 2.908 low. Losing 2.908 would erase the entire recovery. Immediate resistance is the 3.213 high. Price has already rejected it once, and the red marker near that area shows sellers are active there. A decisive break above it, ideally on rising volume, would open the way toward the upper part of the chart, with 3.356 as the next visible reference level. For the bullish case, buyers need to hold the MA14 and MA28 area, close candles above 3.213, and bring volume back in. If that happens, price has room to extend toward 3.356. The bearish case starts with another rejection at 3.213 followed by a close below the MA28. That would suggest the breakout was only a squeeze, with price likely rotating back to 3.136 and potentially 3.060. Key price levels: - Resistance: 3.356 and 3.213 - Current price: 3.186 - Moving averages: MA7 3.189, MA14 3.183, MA28 3.162 - Support: 3.136, 3.060, 2.984 - Major low: 2.908 The big move has already happened, so the more important question is what comes next. Price is compressing just under resistance while holding above its short-term averages, and compressions like this usually end in expansion. Watch whether the 3.162 to 3.183 zone holds and whether volume returns on a push through 3.213. If both line up, the market has a clean path higher. If neither does, patience is the better trade. None of this is certain, and it should be treated as a read on structure rather than a prediction. Note: your screenshot shows the 15-minute chart, and it has no EMA200, RSI, MACD or Fibonacci levels on it. I only used what is visible, so I left those out rather than make up values. If you add them or send the 1h chart, I can fold them into the post. #ByXIMPACT$MNTUSDT
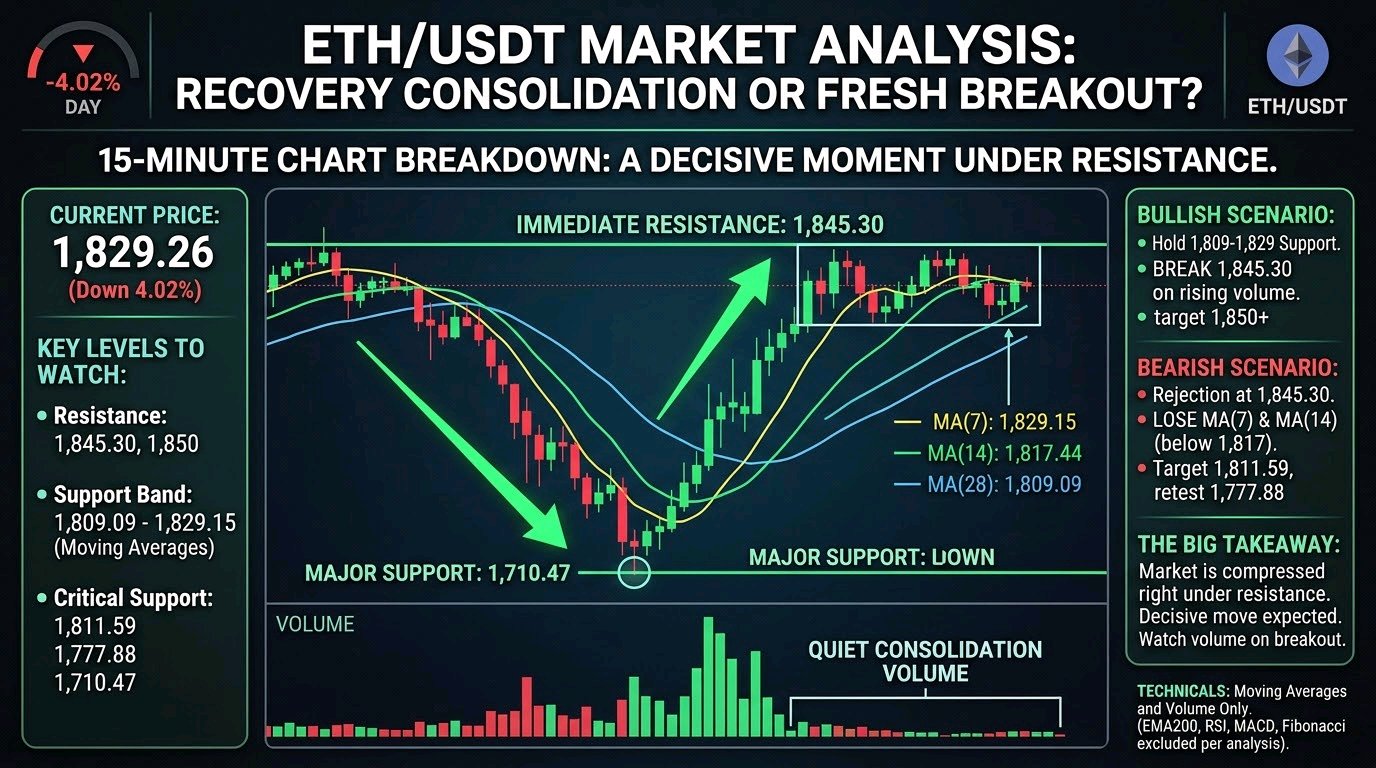
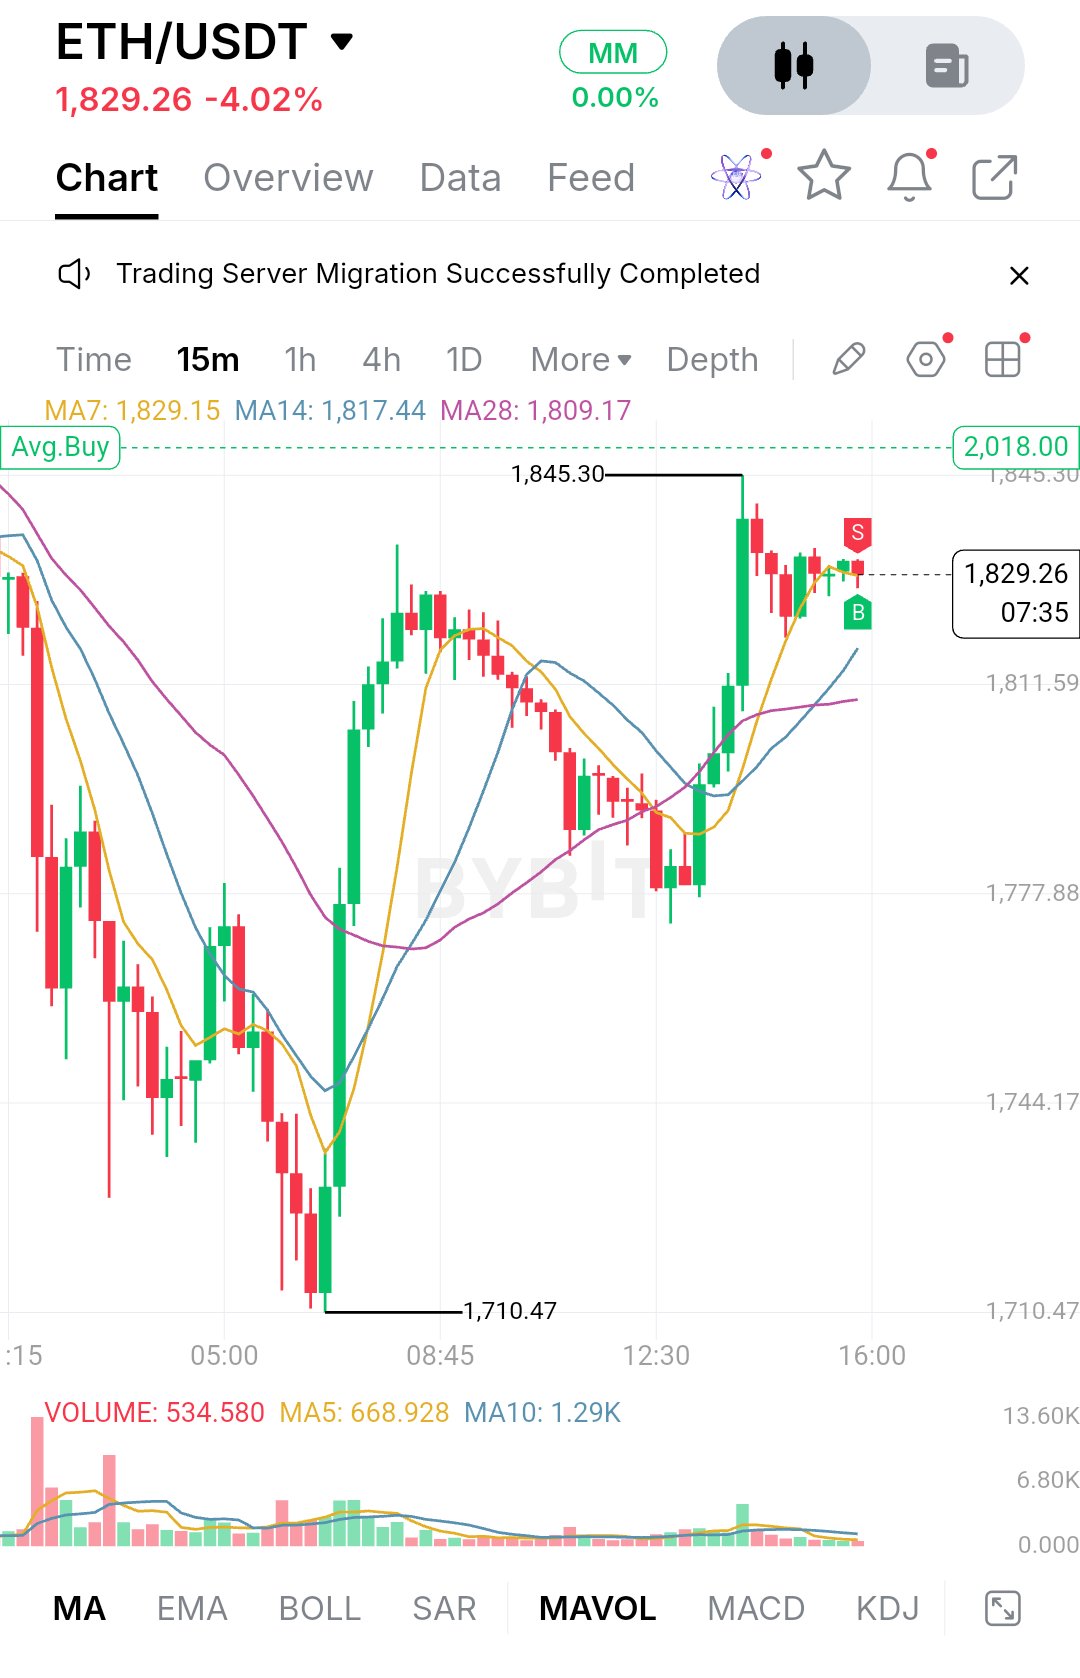
$ETHUSDT is trading at 1,829.26, down 4.02% on the day. The 15-minute chart shows the day's story clearly. Sellers pushed price hard through the early session, and the slide kept going until it bottomed at 1,710.47. That low also marks the extreme of the whole visible move. Buyers stepped in there with real force, and the long, heavy green candles that followed came with a clear pickup in volume. Price ripped back up to a swing high at 1,845.30, which recovered most of the damage in a few hours. Since that peak, the market has cooled off. The last stretch of candles is small and overlapping, with red and green bodies trading inside a tight pocket just under the high. That looks like consolidation after an impulsive recovery rather than a fresh push. Momentum hasn't flipped bearish, but it has slowed. The sellers who showed up at 1,845.30 have been enough to cap price without forcing a pullback so far. A note on the technicals: this screenshot is the 15-minute timeframe, not the 1-hour, and it only shows moving averages and volume. I can't comment on EMA200, RSI, MACD or Fibonacci levels because none of them are on the chart, and I won't make up readings. What is visible is MA7 at 1,829.15, MA14 at 1,817.44 and MA28 at 1,809.09. Price sits almost exactly on the MA7, with the MA14 and MA28 stacked below in bullish order. The MA7 has flattened out after the sharp climb, which fits the sideways chop. The slower averages are still sloping up, which keeps the short-term structure constructive as long as price holds above them. Volume tells a similar story. The surge during the recovery has faded to quiet, low bars, so the market is waiting for its next catalyst. For support, the first area to watch is the MA7 zone around 1,829, since price is sitting on it right now and losing it would be the first sign that the consolidation is breaking down. Below that sits the MA14 near 1,817, followed by the MA28 near 1,809. That 1,809 to 1,817 band is where the recovery leg was built, so it matters for structure. If buyers defend it, the higher-low pattern stays intact. A clean break below it would put the horizontal marker at 1,811.59 in play, and a failure there exposes the 1,777.88 area, where the chart shows earlier reaction. The full base of the move remains the 1,710.47 low. On the upside, the immediate ceiling is the 1,845.30 swing high. That is the level sellers defended once already, and price is pressing just beneath it. A convincing break and hold above it would confirm that the consolidation was a pause rather than a top. The round 1,850 zone sits just above it and will likely draw attention as a psychological level. Beyond that, the chart shows a dashed line at 2,018.00 labeled Avg. Buy, which looks like a position marker on this account rather than a market level, so it isn't a true technical target, though it is where price would head if a strong expansion follows. The bullish case is simple. Buyers need to hold the 1,809 to 1,829 band and then push through 1,845.30 on rising volume. A candle close above that high, followed by a retest that holds, would suggest the market is building higher lows into a continuation. That could open room toward 1,850 and then the bigger levels above, though nothing here is guaranteed. The bearish case starts with rejection at 1,845.30. If price keeps stalling under that high and then loses the MA7 and MA14, the recovery starts to look like a bounce within a larger down day. Sellers would then aim at the 1,811.59 area, and a break beneath it makes a retest of 1,777.88 realistic. The full 1,710.47 low only comes back into view if momentum shifts decisively. Key price levels: - Resistance: 1,845.30 (swing high), 1,850 (psychological), 2,018.00 (Avg. Buy marker on chart) - Current price: 1,829.26 - Moving averages: MA7 1,829.15, MA14 1,817.44, MA28 1,809.09 - Support: 1,811.59, 1,777.88, 1,744.17 - Major low: 1,710.47 Overall, ETH did the hard part by recovering from 1,710.47 to the 1,845.30 area, but the market is now compressed right under resistance, and compression like this usually resolves with a decisive move. Watch how price behaves around 1,845 and whether volume returns on a break. A hold above the moving averages with expanding volume favors upside continuation, while a slip below 1,809 would shift the tone. Let the structure show you the direction instead of anticipating it. This is not financial advice, and risk management matters more than any single read. #ByXIMPACT$SOLUSDT
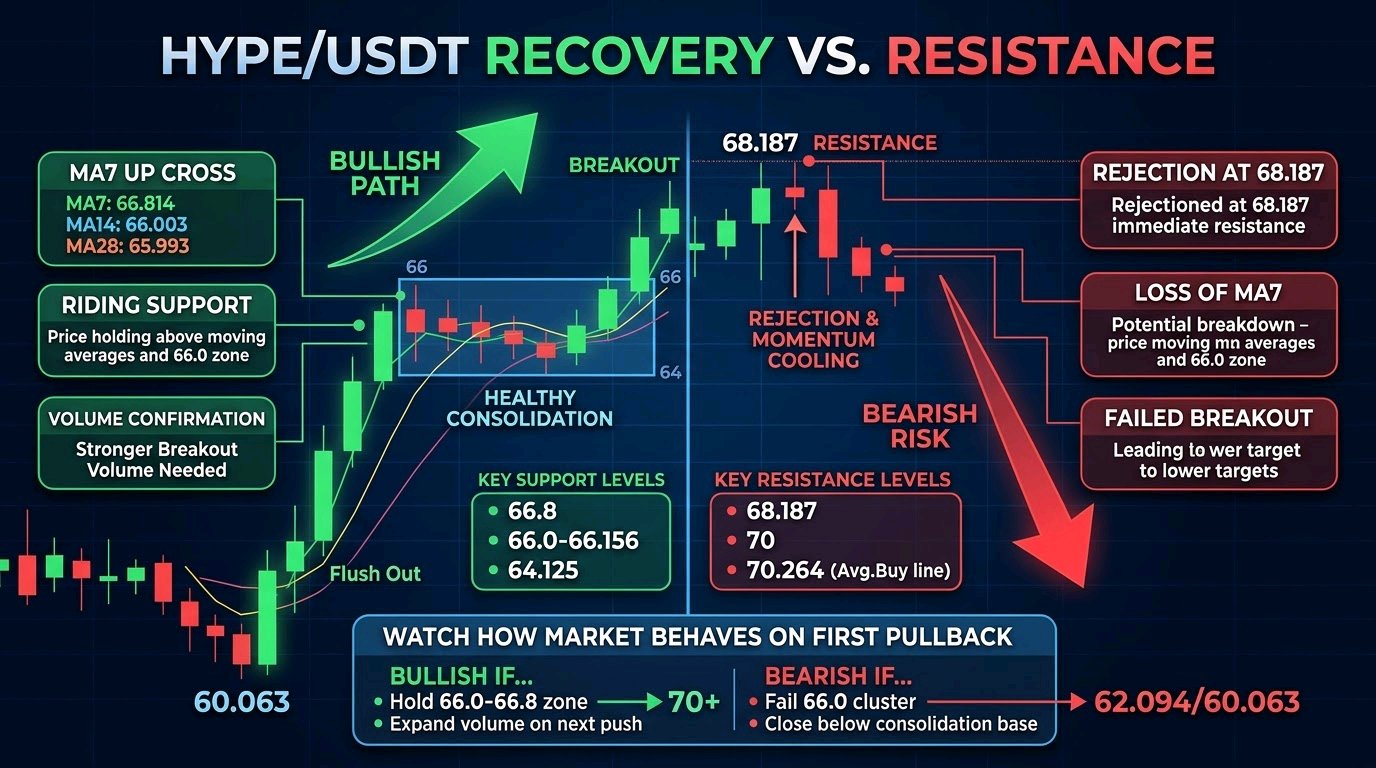
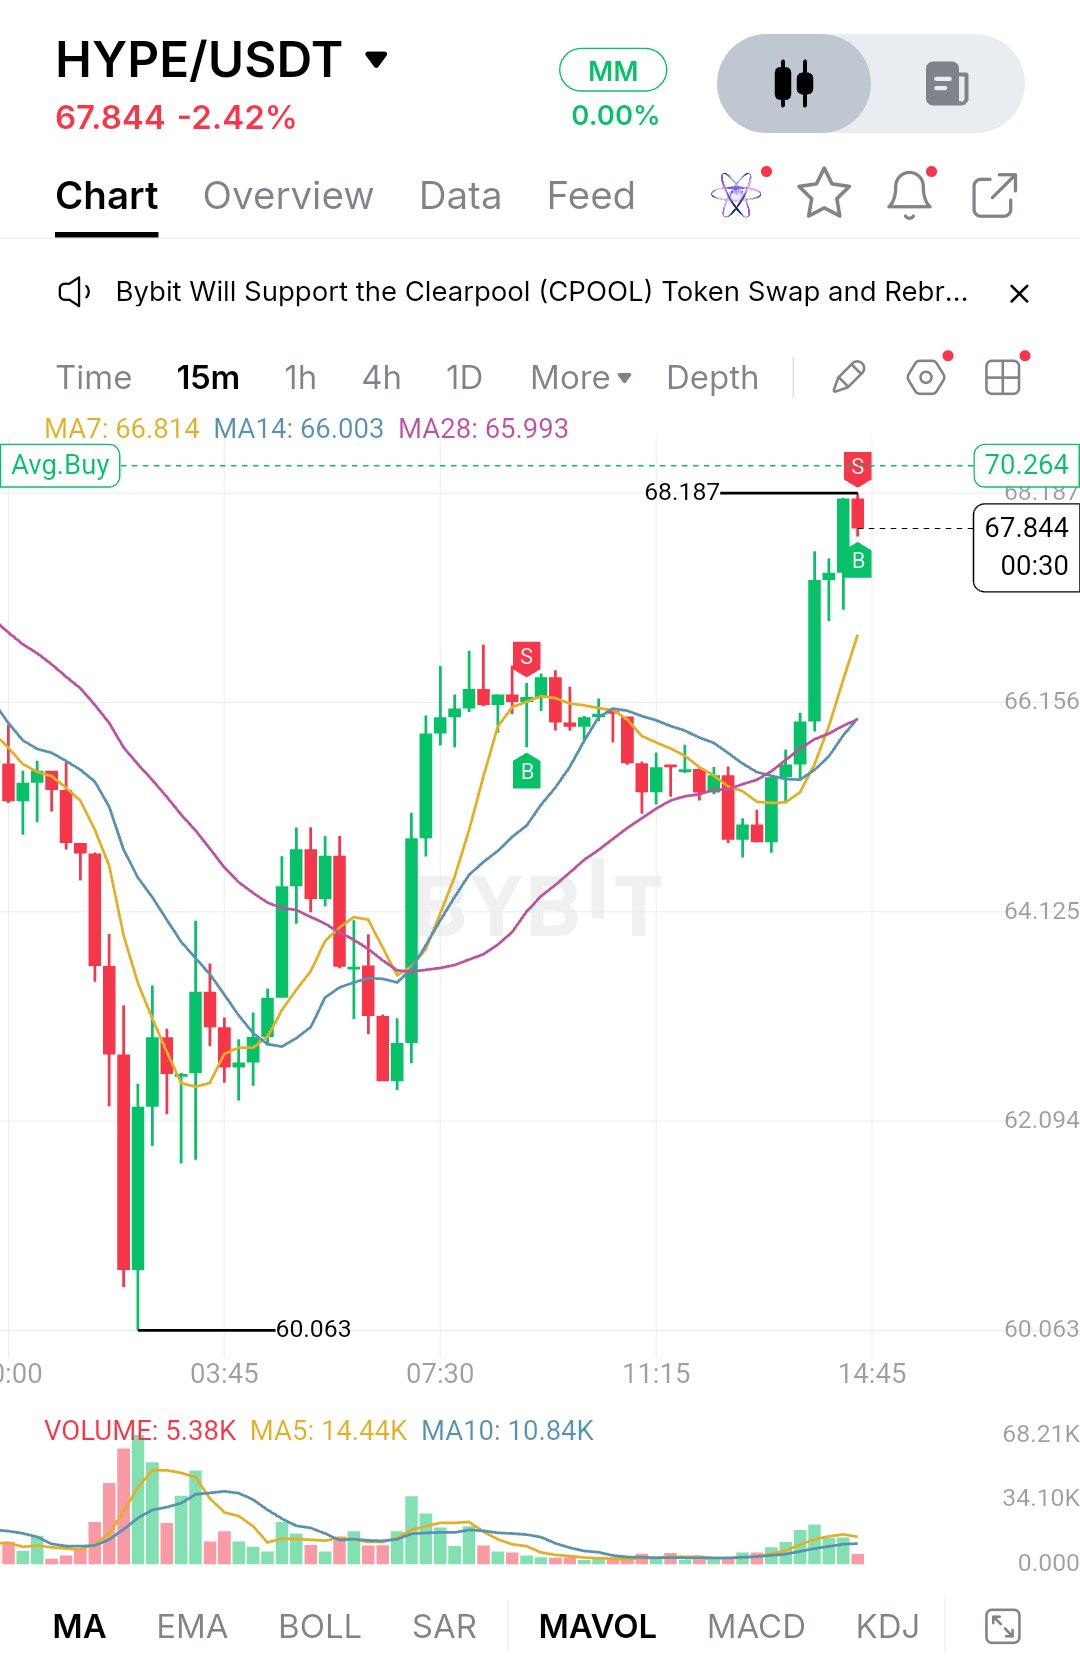
$HYPEUSDT is trading at 67.844, down 2.42% over the last 24 hours. The percentage looks mild, but the intraday action tells a more interesting story. Sellers pushed price all the way down to 60.063, where a long red candle flushed out late buyers. Buyers stepped in right there with a strong green recovery candle, and price has been climbing ever since. It has now pushed into the 68.187 area, which is where sellers showed up again. After the low, the market didn't bounce in a straight line. It rebuilt in stages. Price made a higher low, pushed up into the mid-66s, then spent several hours between roughly 64 and 66 working sideways. That range was healthy consolidation. The pullback inside it was shallow and it never retraced the whole recovery. Late in the session buyers took control again and a run of green candles broke the range to the upside, taking price to 68.187. The most recent candle is red and still open, so it's too early to call it a confirmed rejection, but momentum has cooled a little right under the highs. On the technical side, the moving averages show the shift clearly. MA7 sits at 66.814, MA14 at 66.003 and MA28 at 65.993. The three had been tangled together during the consolidation, a sign the market was indecisive. Now MA7 has turned sharply up and moved above the other two, with price riding well above all of them. That's a constructive structure for short-term traders. One caution is volume. The breakout candles printed decent participation, but the latest bar shows 5.38K against a MA5 of 14.44K and a MA10 of 10.84K. Part of that is because the candle is unfinished, but the follow-through needs to show up in volume for this move to last. For support, the first area is the MA7 near 66.8. Just below it is the more important cluster, where MA14 and MA28 sit almost on top of each other around 66.0, close to the 66.156 gridline. That zone was the top of the earlier consolidation, so if it now acts as support, it confirms the breakout was real. A close back below it would put the 64.125 area in play, which is where the range base formed. Below that, 62.094 and the 60.063 swing low are the deeper levels. Losing 60.063 would break the whole recovery structure. On the upside, immediate resistance is 68.187, the high of the move. Above it, the chart shows a dashed line at 70.264 labelled Avg.Buy, and the round 70 level sits just beneath it, so I'd expect reactions there. Sellers tend to defend psychological numbers, and breakouts through them often get tested more than once. The bullish case is simple. Buyers need to hold the 66.0 to 66.8 zone on any pullback and then push through 68.187 with real volume behind it. A clean close above that opens the way to 70, and then the 70.264 line. A pullback that finds support at the moving averages and bounces would be the healthiest way to continue. The bearish case starts with rejection at 68.187 and a loss of MA7. If price slips through the 66.0 cluster and closes below it, the breakout starts to look like a stretched move that has run out of fuel. That would likely drag price back into the 64.125 range base, and a break of that would revisit 62.094 and possibly the 60.063 low. Key price levels: Resistance: 68.187, 70 (psychological), 70.264 (Avg.Buy line) Support: 66.8 (MA7), 66.0 to 66.156 (MA14/MA28 and gridline), 64.125, 62.094, 60.063 Overall, the structure has moved from a heavy selloff to a recovery with higher lows and a range breakout, and that deserves respect. But price is now pressing against a level that already rejected it once. What I'd watch is how the market behaves on the first pullback. If buyers defend the 66 area and volume expands on the next push, the move toward 70 stays alive. If that zone fails, the rally has likely been a relief bounce inside a larger range. Let the reaction at those levels confirm the direction before committing, and keep risk defined either way. #ByXIMPACT$BTCUSDT
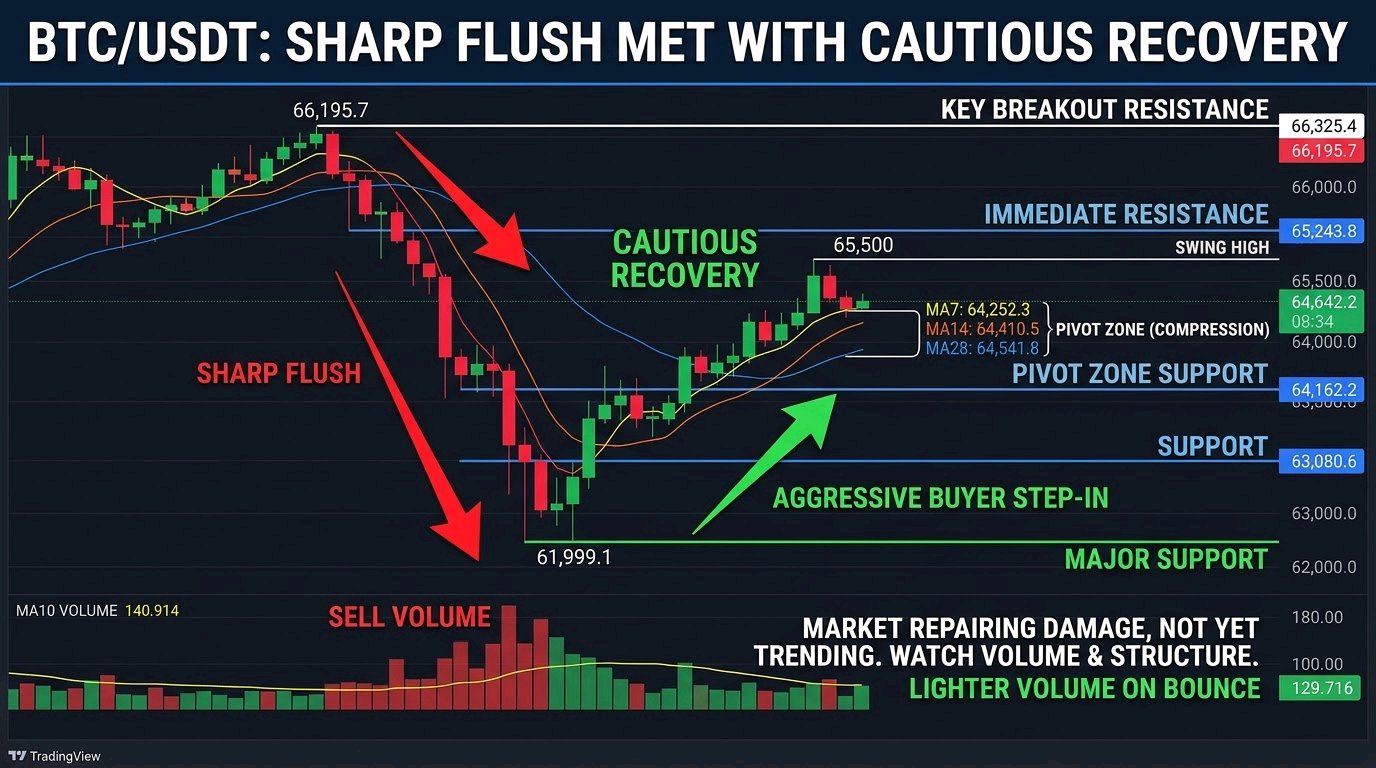
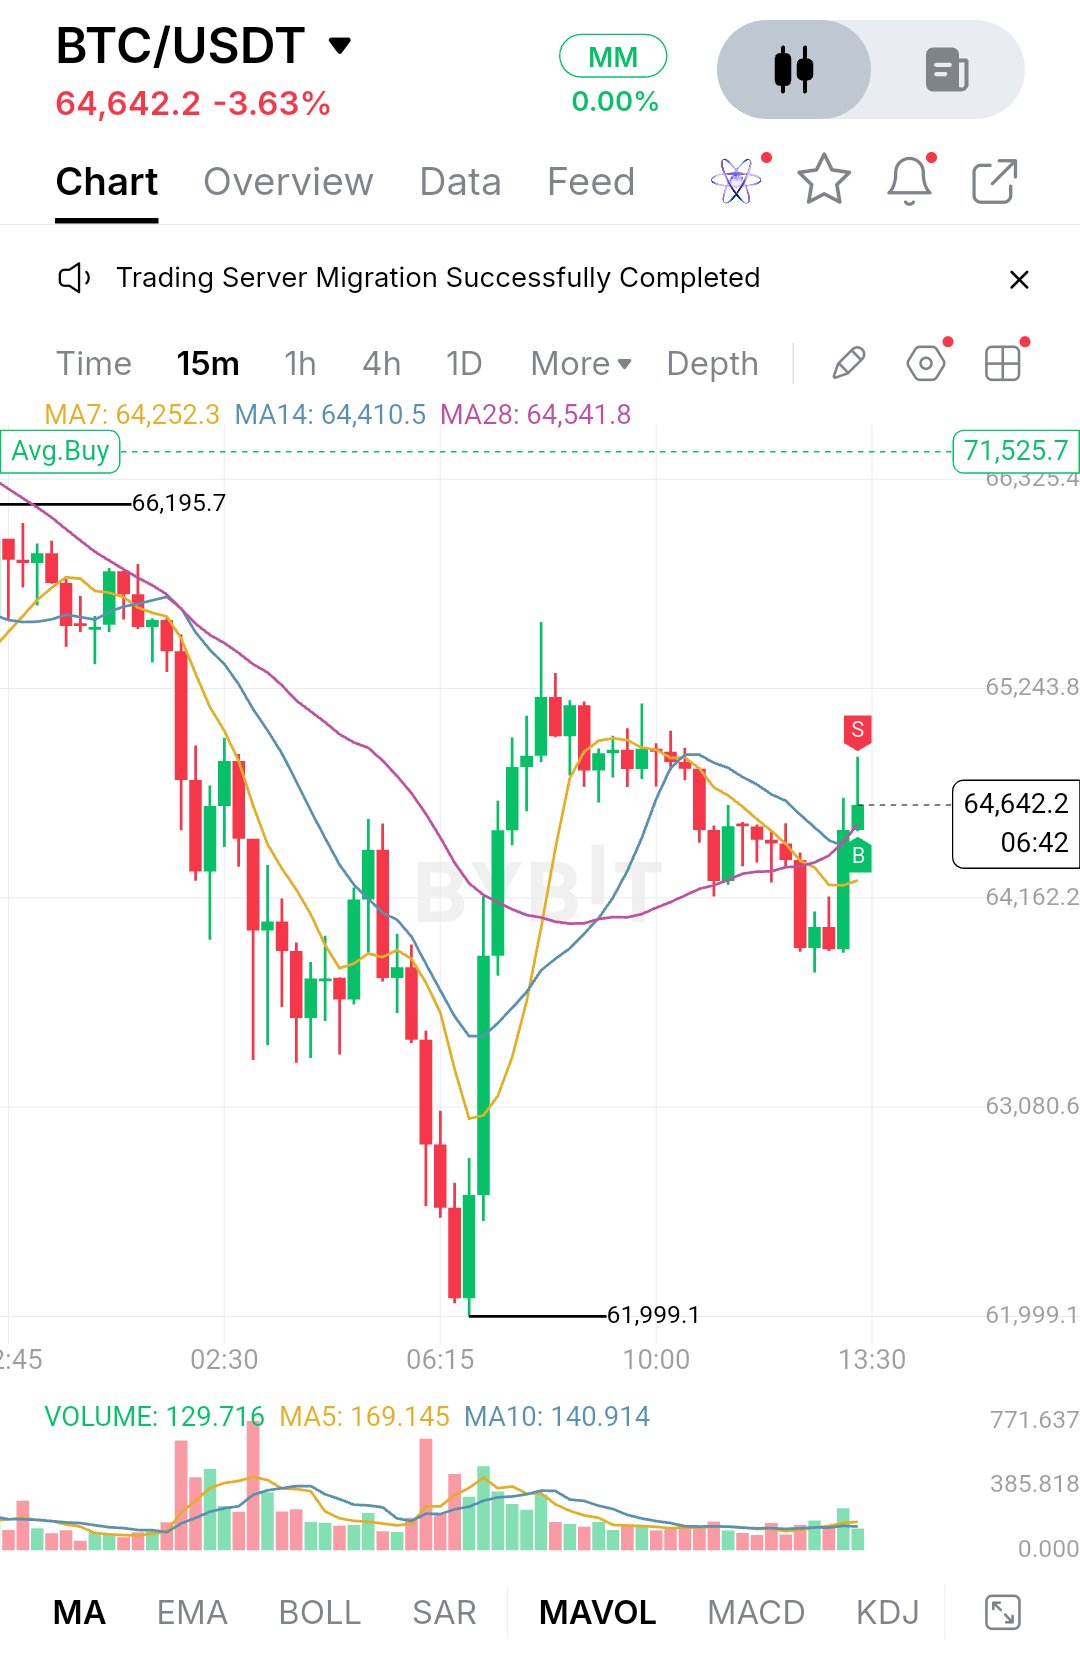
$BTCUSDT is trading at 64,642.2, down 3.63% on the day, and the chart tells a clear story of a sharp flush followed by a cautious recovery.** Earlier in the session, price was still hanging around the 66,195.7 area. Sellers took control from there and pushed Bitcoin down in a steady, heavy sequence of red candles, with the biggest volume bars of the session showing up during the drop. The move bottomed out at 61,999.1, where buyers finally stepped in aggressively and produced one of the largest green candles on the chart. That reaction told us the market was not ready to hand over that zone without a fight. After that bounce, Bitcoin moved into a recovery and then a choppy range. The rebound ran up toward the 65,500 area but stalled there, forming a lower high compared to the 66,195.7 peak. From that point price drifted sideways to lower, dipped toward the 63,900 region, and then printed a fresh green candle that lifted it back to the current level. So the structure right now is a V-shaped recovery that has not yet reclaimed the prior highs. Momentum has improved, but the market is still repairing damage rather than trending. On the technical side, the moving averages are worth a close look. Price is sitting just above all three: MA7 at 64,252.3, MA14 at 64,410.5 and MA28 at 64,541.8. They are bunched tightly together, which usually means the market is undecided and compressing before its next real move. The latest green candle pushed through that cluster, which is a constructive sign, but one candle is not confirmation. Volume is the other piece. The current reading is 129.716 against a MA5 of 169.145 and a MA10 of 140.914, so participation on the bounce is lighter than the average. Buyers are present, but they are not yet showing the conviction that was behind the selloff. That is something to keep an eye on. For support, the first area is the 64,162.2 grid level, which lines up closely with the moving average cluster. If price holds above it on pullbacks, it keeps the short-term recovery intact. Below that, 63,080.6 is the next meaningful zone, and the pullback low from the recent range formed above it. The major support is the 61,999.1 swing low. That level has already been tested once with a strong rejection, so it matters a lot. A clean break below it would shift the structure back to bearish and open the door to a deeper leg lower, since there is no visible support beneath it on this chart. On the upside, the immediate resistance sits around the recent rejection wick near 65,000, where the red "S" marker appears on the chart. Above that is the 65,243.8 level, followed by the swing high near 65,500. The key breakout level is 66,195.7, the high from before the selloff, with 66,325.4 just above it. A move through that area would take out the lower-high structure and change the tone completely. Psychologically, traders will also be watching the 65,000 and 66,000 round numbers. The bullish scenario is straightforward. Buyers need to hold price above the moving average cluster, keep 64,162.2 as support, and then push through 65,243.8 with stronger volume than we have seen on this bounce. If they get above the 65,500 swing high, the focus moves to 66,195.7 and then 66,325.4. A close above those levels would suggest the entire drop was absorbed and the market is ready to rebuild higher. The bearish scenario is a rejection from the 65,000 to 65,243.8 zone, followed by a loss of the moving averages and 64,162.2. That would confirm the bounce as a simple relief move inside a bigger downtrend, with 63,080.6 as the first target. If that gives way, a retest of 61,999.1 becomes likely, and a break below it would be the real warning sign. **Key Price Levels** - Resistance: 65,243.8 / 66,195.7 / 66,325.4 - Pivot zone: 64,162.2 to 64,541.8 (moving average cluster) - Support: 64,162.2 / 63,080.6 - Major support: 61,999.1 In the end, Bitcoin has done the hard part by defending 61,999.1, but it has not yet proven that the recovery has real strength behind it. The compression around the moving averages suggests an expansion is coming, and the direction will depend on whether price can hold above 64,162.2 and break 65,243.8 with improving volume. Watch how the market behaves around that pivot zone rather than chasing the candle. Structure and volume will tell the story, and none of this is a guarantee of where price goes next. Manage risk accordingly. #IMPACTbyTrade$ETHUSDT
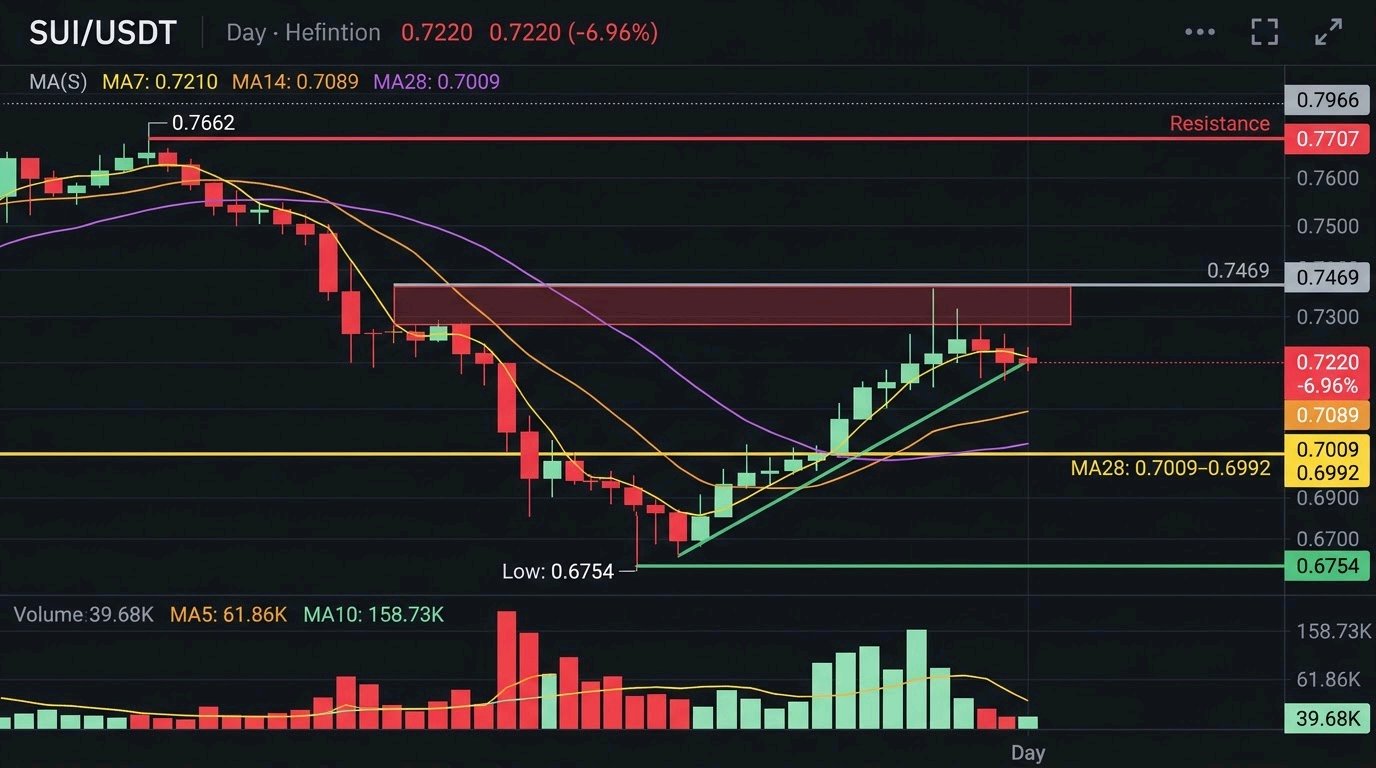
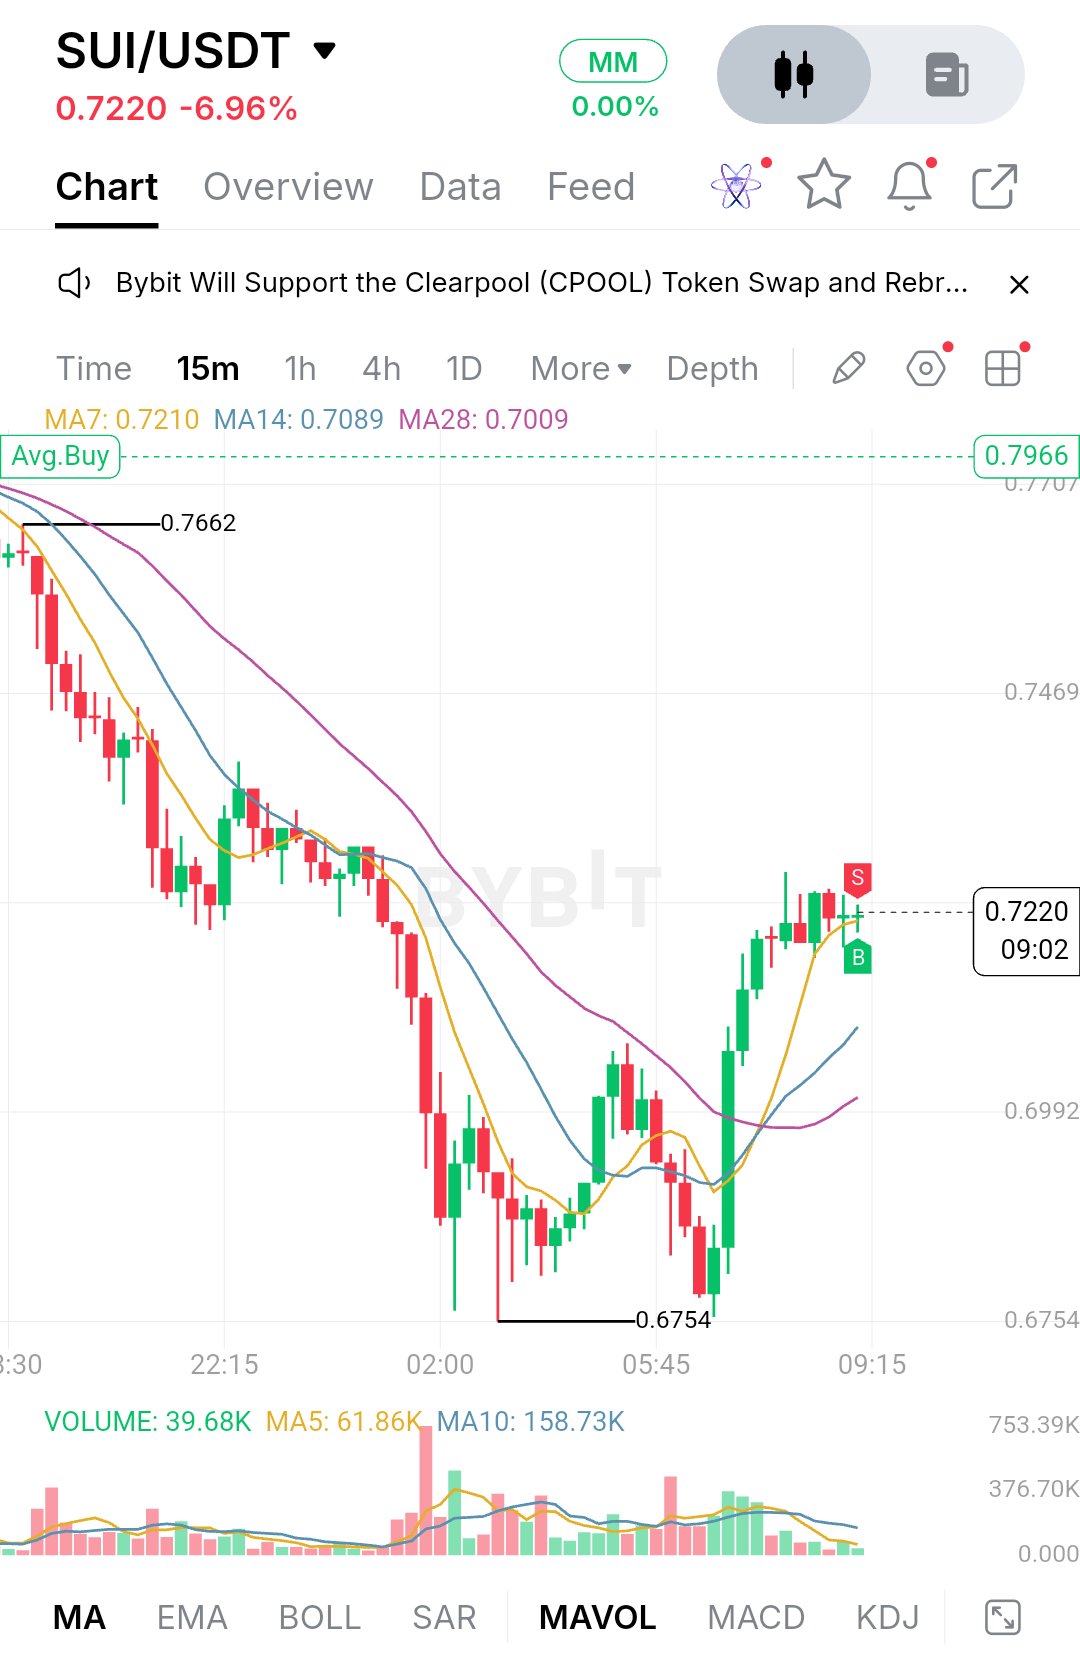
$SUIUSDT は現在0.7220で取引されており、過去24時間で6.96%下落しています。この日は、0.7662付近で売り手が主導権を握り、価格が天井を打って、ほぼ絶え間なく着実な下落が始まったところから始まりました。下落過程での躊躇はほとんど見られませんでした。ローソク足は次々と陰線で引け、小さな反発があるたびに売り込まれ、価格は0.6754まで急落しました。 その安値で状況が変わりました。底値付近で大きな出来高を伴い、売り圧力は新たな安値を更新できなくなりました。買い手が参入し、鋭いV字回復で価格を押し上げ、数時間で安値から約0.047ほど値を戻しました。 現在の構造は、まだ実力を証明しようとしている回復局面のように見えます。価格は3つの移動平均線すべての上に浮上しました。MA7は0.7210、MA14は0.7089、MA28は0.7009に位置しており、価格はその中で最も短期のMA7の上に位置しています。移動平均線も上向いており、MA7が他の2本を上抜け、MA14がMA28に向かって上向いています。これは勢いが変化しつつある初期の兆候ですが、長期の移動平均線は依然として以前の高値を大きく下回っているため、これが証明されるまでは、あくまで大きな下降トレンドの中での反発に過ぎません。 出来高が有用なヒントを与えてくれます。売りは大きな陰線の出来高を伴いましたが、回復は堅調であるものの、出来高はそれより低調です。現在の出来高は39.68Kで、MA5(61.86K)を下回り、MA10(158.73K)を大きく下回っています。反発は本物ですが、通常トレンドの反転を裏付けるような参加者にはまだ支えられていません。直近の数本のローソク足は実体が小さく方向感に欠けており、上部にヒゲによる拒否が見られることから、買い手が息切れしているか、売り手がこのゾーンを防衛し始めている可能性を示唆しています。 下値については、最初のサポートは0.7210から0.7089付近のMA7/MA14エリアです。価格が押し戻された場合、ここで買い手が現れる必要があります。その下では、MA28およびチャート上の目に見える水平レベルと一致する0.7009から0.6992のゾーンが注目されます。ここを下回って引ければ、回復局面全体が疑わしいものとなります。主要なサポートは0.6754の安値です。これを失えば反発は無効となり、新たな安値への道が開かれます。 上値については、直近のレジスタンスは現在価格のすぐ上、0.73から0.74付近の最近のヒゲによる拒否ゾーンにあります。その上には、チャート上の明確な水平レベルである0.7469があります。より大きなブレイクアウトゾーンは、この動き全体の高値である0.7662で、そのすぐ上に0.7707があります。勢いが本当に拡大すれば、チャート上の0.7966という水準が次の参照点となります。 強気シナリオとしては、買い手はMA7/MA14のクラスターを維持し、高値を切り上げ続け、より強い出来高を伴って0.7469を突破する必要があります。このレベルを明確に突破できれば、0.7662が視野に入ります。これを奪還できれば、売り圧力のすべてを吸収した最初の真の兆候となります。 弱気シナリオとしては、0.73から0.7469付近での拒否の後に0.7089を割り込むような動きがあれば、これは単なる一時的な反発だったことが示唆されます。0.6992を下回れば再び0.6754に焦点が戻り、その下で引ければ売り手が依然として支配的であることが確定します。 主要な価格レベル: - レジスタンス: 0.7300 ~ 0.7400 (最近の拒否ゾーン) - レジスタンス: 0.7469 - 主要レジスタンス: 0.7662 および 0.7707 - サポート: 0.7210 (MA7) および 0.7089 (MA14) - サポート: 0.7009 ~ 0.6992 (MA28 および水平レベル) - 主要サポート: 0.6754 (最近の安値) 全体として、SUIは0.6754を防衛し、短期平均線の上に回復するという困難な部分を成し遂げました。今重要なのは、0.73から0.7469付近での反応と、価格がそこに達した時に出来高が拡大するかどうかです。移動平均線の上でタイトに停滞し、その後に大きな出来高を伴ってブレイクアウトするのが最も健全なセットアップです。移動平均線で失敗するような弱いリテストは、全く別の物語を語ることになるでしょう。反発を追いかけるのではなく、価格がそれらのレベルでどのように振る舞うかを観察し、構造が次の動きを確認するのを待ちましょう。これは投資助言ではないため、リスク管理を適切に行ってください。 #IMPACTbyTrade$ETHUSDT
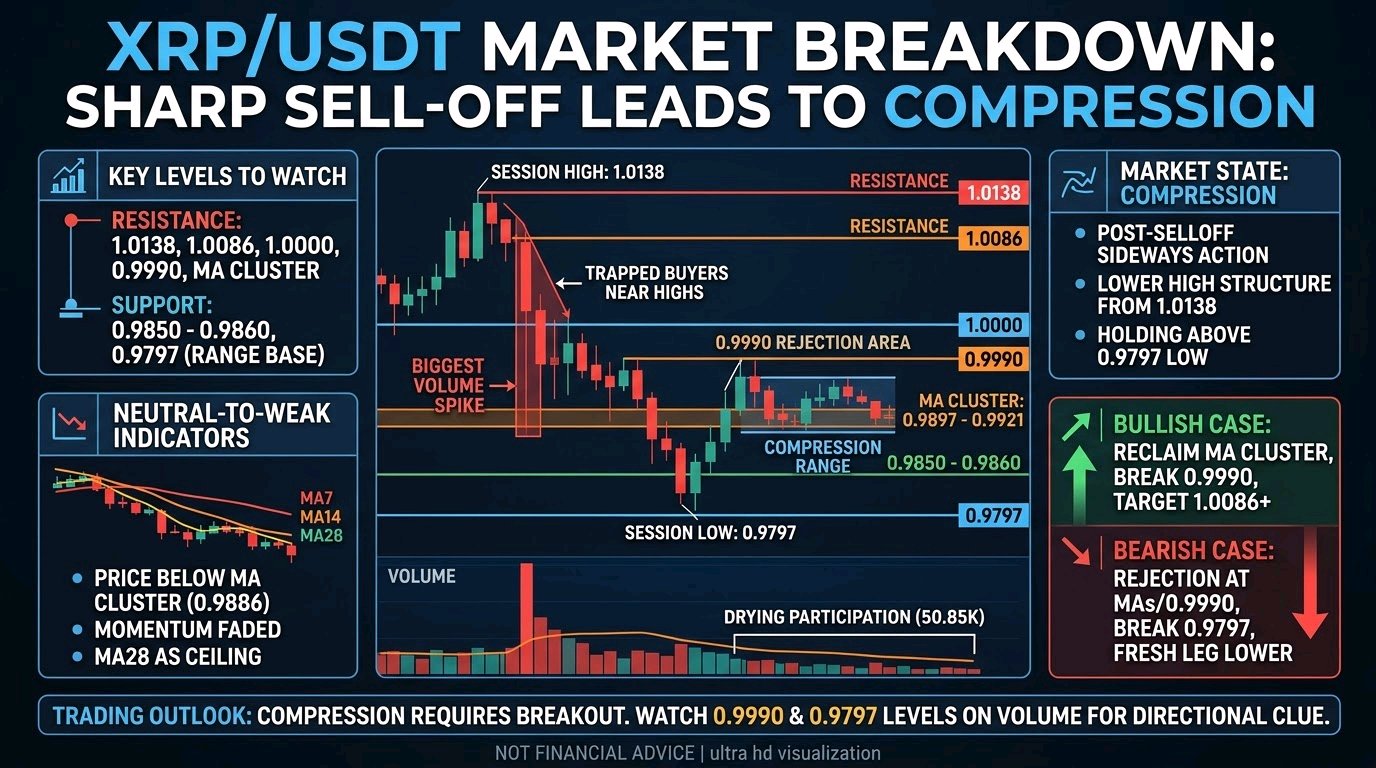
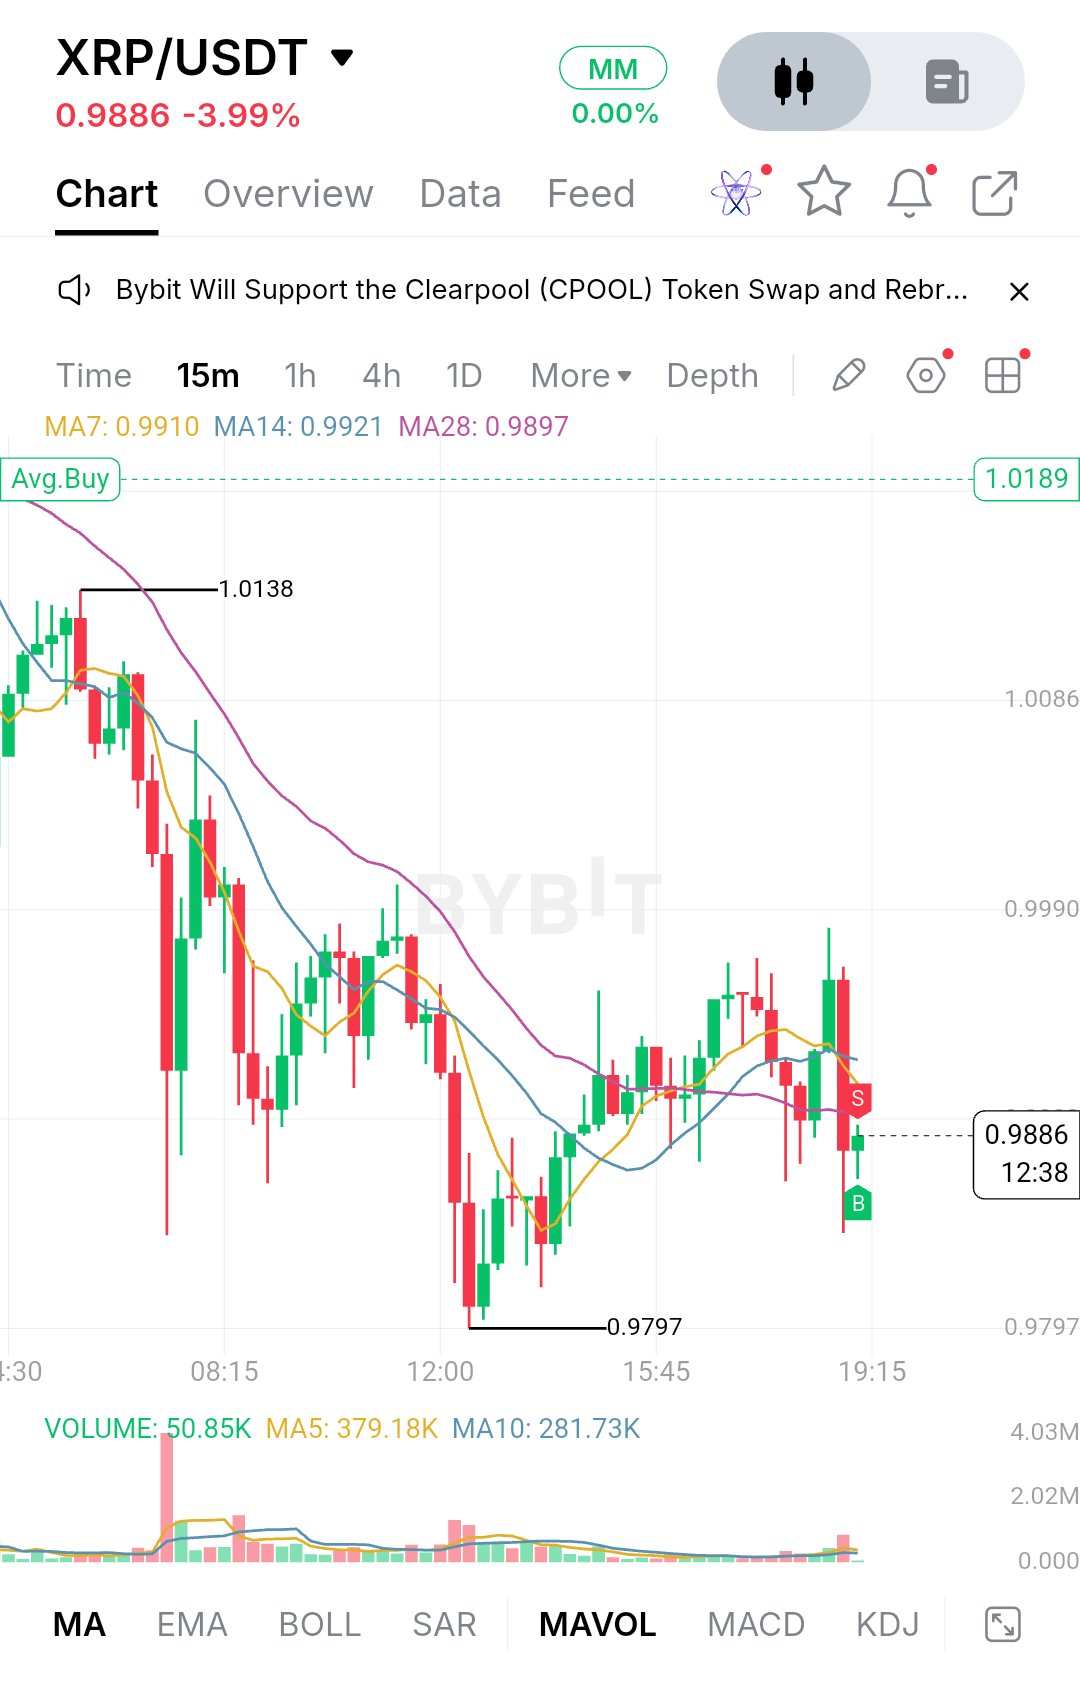
$XRPUSDTは0.9886で取引されており、1日で3.99%下落しています。その動きは緩やかなものではありませんでした。セッション序盤、買い手が価格を1.0138の高値まで押し上げましたが、そこで売り手が即座に参入しました。その後に続いたのは強烈な陰線の連続で、下落の最中にチャート全体で最大出来高を記録するバーが出現しました。こうしたスパイクは通常、一方のサイドが不意を突かれたことを意味し、今回は高値圏で飛びついた買い手がそれに当たります。 フラッシュクラッシュの後、XRPは失地を回復することはありませんでした。0.9990付近まで反発する場面もありましたが、伸び悩み、再び反落して日中安値の0.9797を形成しました。それ以降、価格は狭いレンジで推移しており、1.0000を下回る上昇のたびに売り手が蓋をし、下値は買い手が防衛するという展開が続いています。チャート構造を見ると、1.0138からここ数時間の1.0000割れの高値にかけて切り下げの連続となっており、一方で直近の押し目は0.9797の上を維持しています。これはトレンドが出ているのではなく、相場が収縮している状態です。出来高もそれを裏付けており、最新の数値は50.85Kで、MA5の379.18KやMA10の281.73Kを下回っており、直近の平均と比べて参加者が激減しています。 確認できるインジケーターを見る限り、状況は中立からやや弱気です。MA7は0.9910、MA14は0.9921、MA28は0.9897に位置しており、現在の価格0.9886はその全ての下で推移しています。移動平均線が密集して横ばいになっており、これは上下両方向への勢いが衰えていることを示しています。下落相場全体を通じてMA28が重い天井となっていましたが、短期線がそれに追いついてきたことは、売り圧力がどれほど沈静化したかを示しています。とはいえ、価格がこの密集地帯の下にある以上、短期的な優位性は売り手が握ったままと言わざるを得ません。 サポートについては、最初のゾーンは0.9850から0.9860のエリアで、直近で下ヒゲが買い支えられた場所です。その下では、0.9797が最も重要なレベルとなります。なぜなら、それがセッション安値であり、レンジ全体の底値だからです。買い手がここを守り続ければレンジは維持され、反発の可能性が高まります。出来高を伴って明確にこれを下抜ければ、フロアが崩れ、このチャート上では下に目立った構造物がないため、新たな下落トレンドの扉が開くことになります。 レジスタンスは、まず価格が奪還すべき0.9897から0.9921の移動平均線密集地帯から始まります。その上では0.9990が重要な水準です。これは直近の戻り高値と一致しており、心理的節目である1.0000のすぐ下に位置しています。XRPが1.0000をクリアすれば、次のターゲットは1.0086、続いてセッション高値の1.0138となります。Avg.Buyマーカーの1.0189はこれらすべての上に位置しているため、完全に回復した後に初めて意識されるでしょう。 強気シナリオはシンプルです。買い手が価格をMA密集地帯の上に戻し、そこで維持し、出来高を伴って0.9990をブレイクする必要があります。そのような動きがあれば、高値切り下げの構造が崩れ、1.0000や1.0086への上昇が現実味を帯びてきます。ただし、出来高の増加を伴わなければ、上昇しようとしても再び拒絶されるリスクがあります。 弱気シナリオは、価格がMA密集地帯または0.9990で失速し、再び反落することから始まります。そうなれば高値切り下げのパターンが延長され、0.9850が再び試されることになります。もしそこを割り込み、0.9797を下回れば、レンジは無効化され、短期的な相場の主導権は売り手に完全に移行するでしょう。 主要な価格水準: - レジスタンス:0.9897~0.9921(MA密集地帯)、0.9990、1.0000、1.0086、1.0138 - サポート:0.9850~0.9860、0.9797 - レンジの無効化:0.9797を下回る終値(強い出来高を伴う場合) XRPは急落後に収縮局面を迎えており、収縮は通常、決定的な動きによって終結します。次のキャンドルを追いかけるのではなく、0.9990を上抜けるか、0.9797を下抜けるかの価格の挙動を注視し、その際に出来高が伴うかどうかに注目してください。反発ではなく、ブレイクアウトの方向こそが、どちらの勢力が主導権を握っているかを教えてくれます。これは予測ではなく、次の拡大局面がどこから始まる可能性が高いかの地図に過ぎません。 $IMPACTbyTrade$BTCUSDT
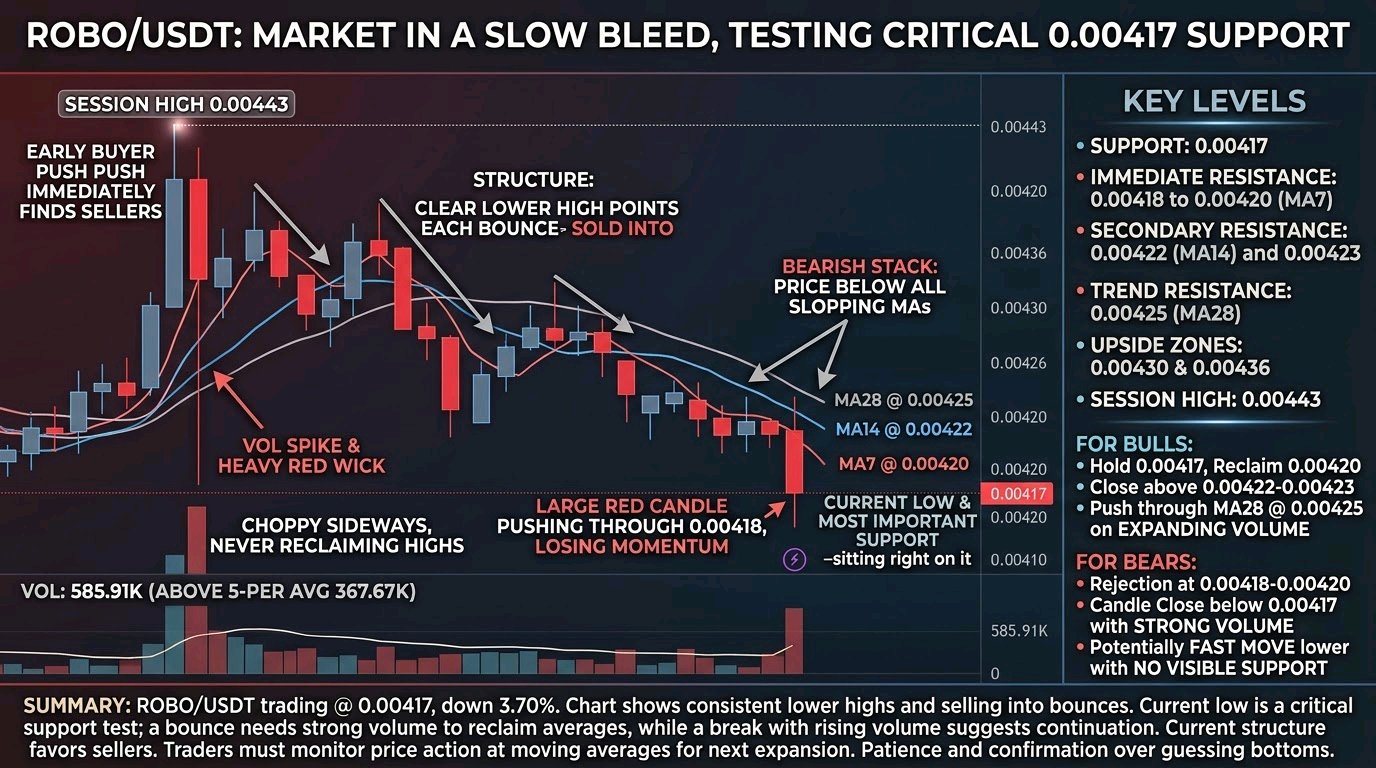
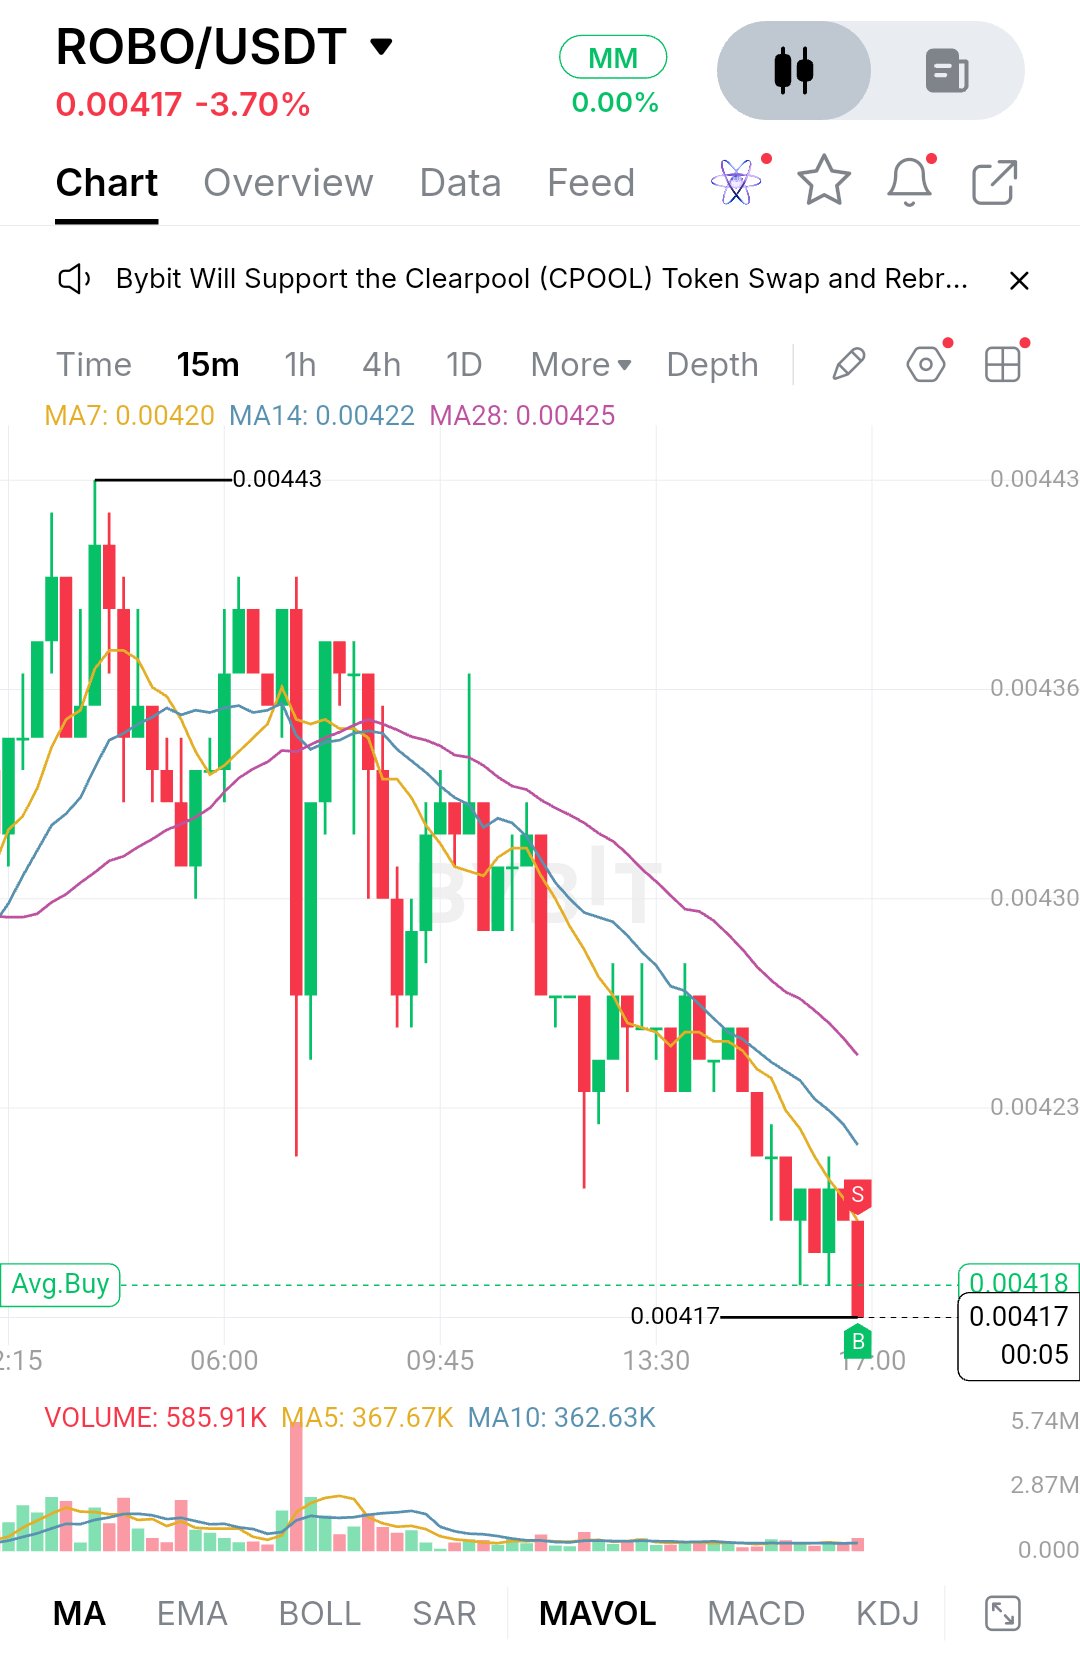
ROBOUSDTは現在0.00417で取引されており、日次で3.70%下落しています。セッションを通じてダラダラと下げ続ける展開となっています。価格は一日の高値である0.00443付近で始まりましたが、そこでは買いが抵抗線にぶつかり、すぐに売りが優勢となりました。それ以降、チャートは戻り高値を切り下げる展開が続いており、反発しても上値が追えず、売りに押される状況です。 チャート構造がすべてを物語っています。0.00443までの初期の上昇後、長い上ヒゲを伴う大きな陰線が価格を急激に押し下げ、その瞬間に出来高が急増しました。市場はその動きから一部回復し、しばらく横ばいで推移しましたが、買い手は高値を奪還することはできませんでした。セッション中盤以降、価格は小さな波を描きながら切り下げており、直近のローソク足は0.00418付近の揉み合いを明確に下抜ける大きな陰線となっています。これは基盤を構築している市場ではなく、勢いを失っている市場の姿です。 移動平均線もそれを裏付けています。MA7は0.00420、MA14は0.00422、MA28は0.00425に位置しており、すべての線が下向きで、価格がその下に位置する弱気なパーフェクトオーダーの形となっています。短期の移動平均線は長期の平均線を下回り、価格を抑え込んでいます。出来高も同様のパターンを示しています。セッション序盤の大きな急増は鳴りを潜め、現在は静かな取引となっていますが、現在の585.91Kという数値は5期間平均の367.67Kを上回っており、直近の下げにはこれまでのジリ下げよりも多くの参加者が関与していることを示しています。 最も重要なサポートラインは現在の安値である0.00417です。価格はちょうどその上に位置しており、その下には目立ったサポートレベルが確認できないため、ここを明確に割り込むと、買いが入るまでチャート上には明確な参照ポイントがなくなります。ここで持ちこたえれば、少なくとも市場はジリジリとした展開にとどまりますが、出来高を伴ってブレイクすれば、売り圧力が強まることを示唆します。 上値については、0.00418から0.00420が最初の抵抗帯となり、ここには崩れたレンジとMA7が重なっています。その上にはMA14(0.00422)と0.00423のレベルが第2のハードルとなり、続いてMA28(0.00425)が控えています。より大きなレジスタンスゾーンは0.00430と0.00436で、最終ターゲットはセッション高値の0.00443となります。 強気派が状況を打開するためには、0.00417を死守し、0.00420を奪還した上で、0.00422から0.00423のゾーンを上抜けて引ける必要があります。その先では、MA28(0.00425)を突破することが、戻り高値を切り下げるシーケンスが終了する最初のサインとなります。直近の反発は弱かったため、上昇局面では出来高の増加が伴うべきです。 売り手が主導権を握り続けた場合、0.00418から0.00420での拒絶後にさらなる下落を見せる可能性が高いでしょう。強い出来高を伴って0.00417を下回って引ければ、ブレイクアウトが確定し、下値余地がほとんどないため、下落が加速する可能性があります。もちろん確定的なことは言えませんが、現在の構造は証明されるまで売り手優位と言わざるを得ません。 主要価格レベル: - サポート: 0.00417 - 直近のレジスタンス: 0.00418から0.00420 (MA7: 0.00420) - 第2レジスタンス: 0.00422 (MA14) および 0.00423 - トレンドレジスタンス: 0.00425 (MA28) - 上値ゾーン: 0.00430 および 0.00436 - セッション高値: 0.00443 結局のところ、これは0.00417が維持できるかどうかのテストです。しっかりとした出来高を伴って0.00420を素早く奪還する反発が見られれば、それが最初の建設的なシグナルとなります。一方で、出来高を伴った下落となれば、トレンドは下向きのままです。トレーダーは次の価格変動が移動平均線付近から始まる可能性が高いため、その動きを注視すべきです。それまでは、底値を予測するよりも忍耐と確認が重要です。 IMPACTbyTradeGRAMUSDT
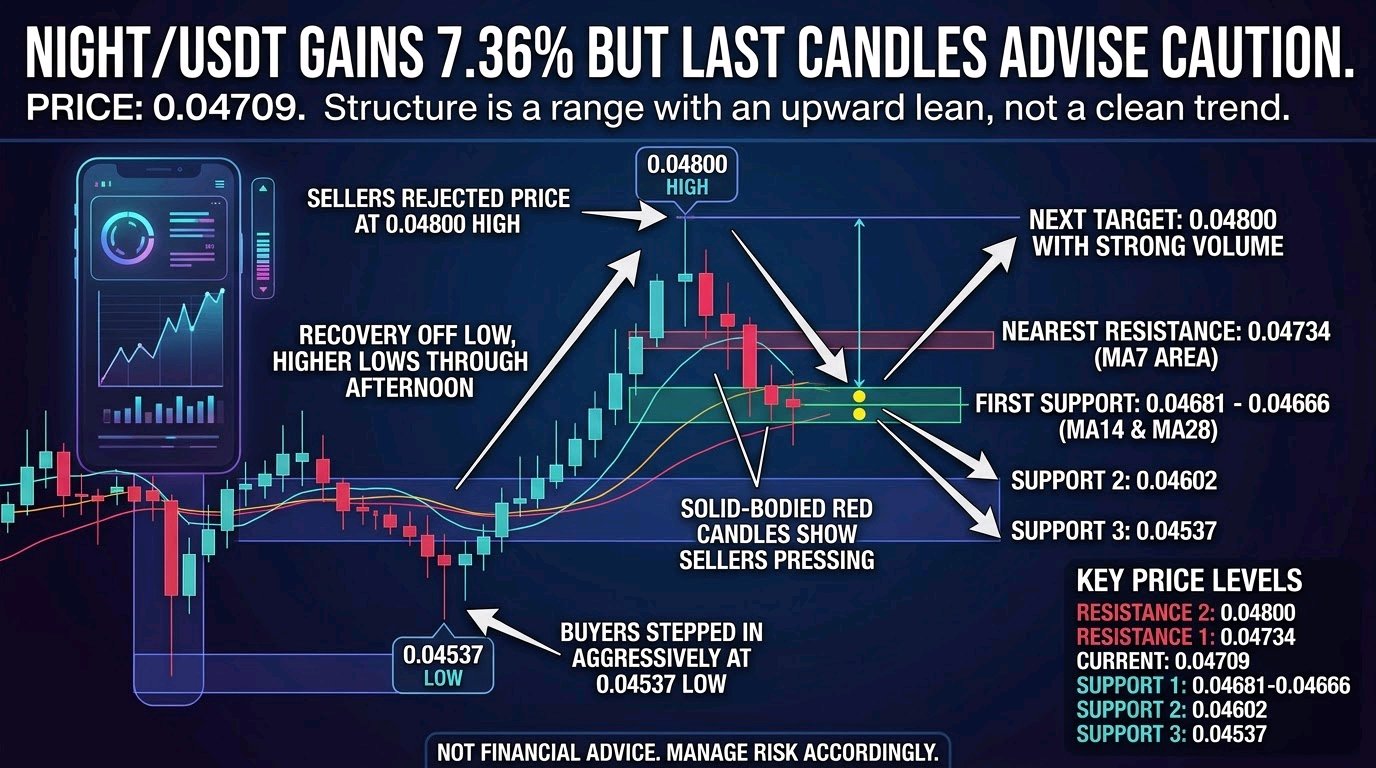
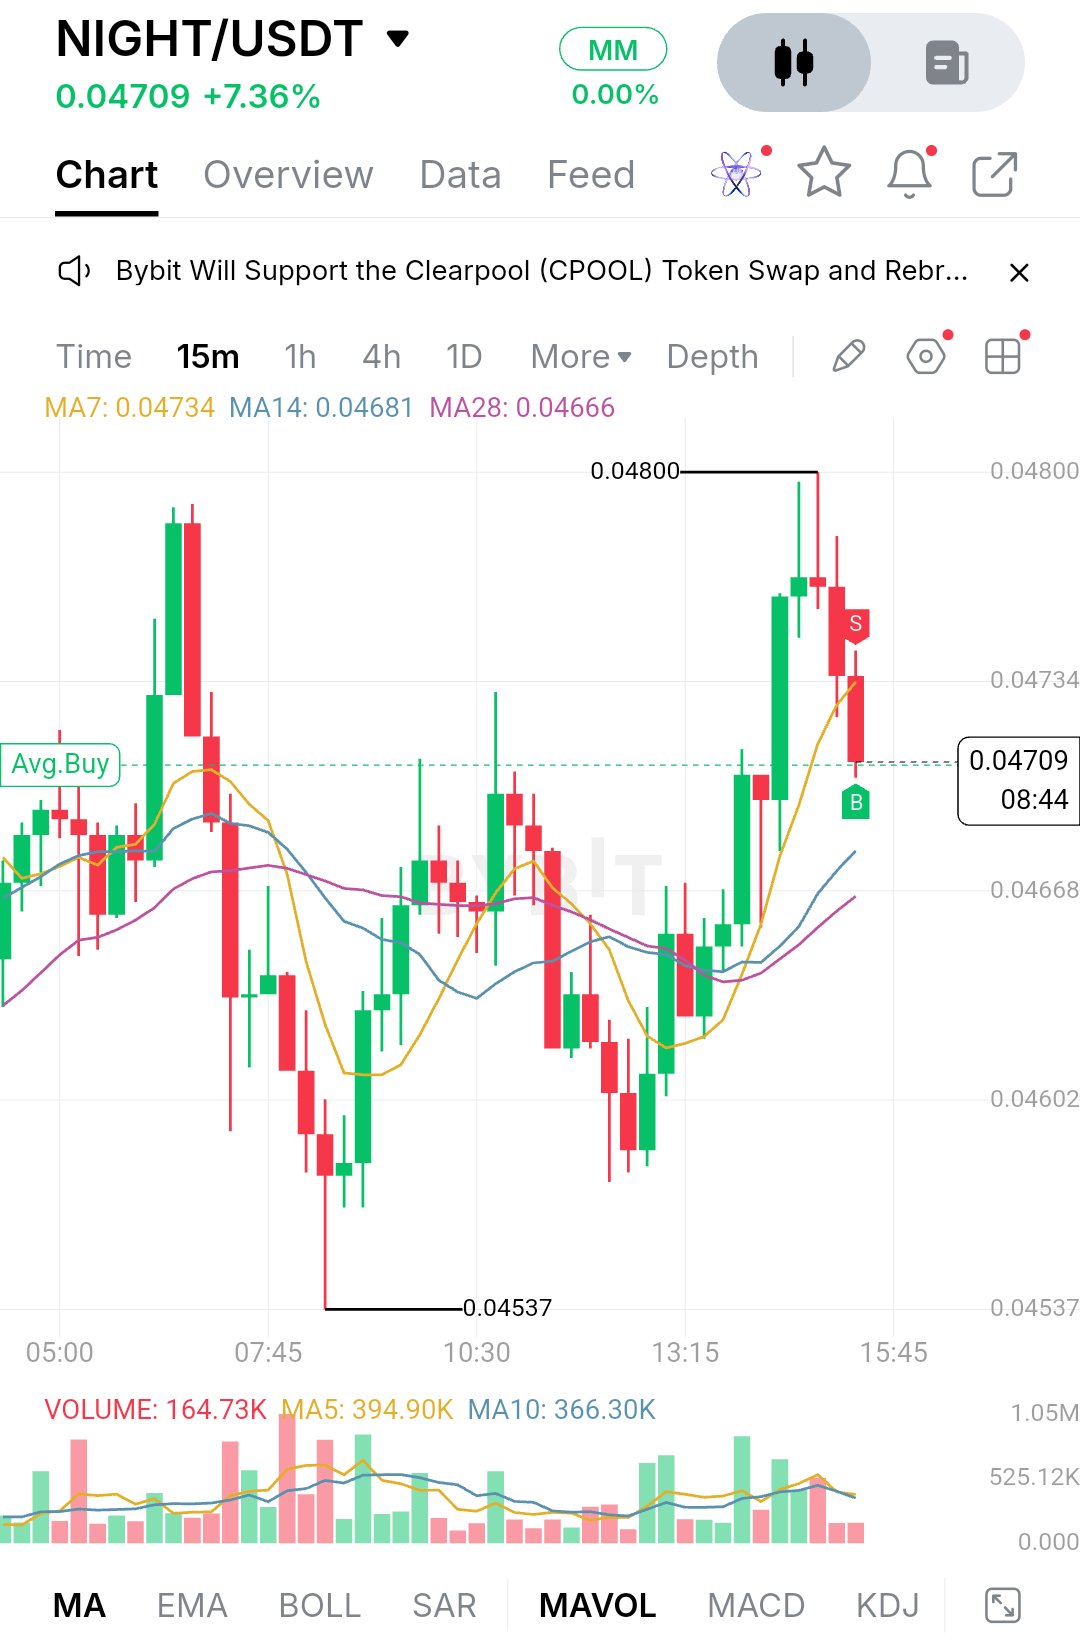
$NIGHTUSDT is trading at 0.04709, up 7.36% on the day, but the last few candles tell a more cautious story than the headline number.** Price spent the early session bouncing around 0.0465 to 0.0472, then dropped hard into the 0.04537 low just before the 08:00 area. That candle left a long lower wick, which shows buyers stepped in aggressively at that level. From there NIGHT rebuilt slowly through the middle of the session, and a stronger push after 13:00 carried it to the 0.04800 high. Sellers answered immediately. The candle at the top has a long upper wick and a small body, and the red candles since then have pulled price back down to the current area. The structure is a range with an upward lean, not a clean trend. The 0.04537 to 0.04800 band has contained nearly everything today, and the market has now tested both edges. The recovery off the low was constructive, with higher lows forming through the afternoon, but the rejection at the top shows momentum has cooled. The latest red candles are also solid-bodied, which suggests sellers are pressing rather than just taking profit. On the moving averages, MA7 sits at 0.04734, MA14 at 0.04681 and MA28 at 0.04666. Price is now below the fast MA7 while still above both slower averages. That's a short-term loss of momentum inside a larger recovery, not a full reversal. The MAs are also stacked in a bullish order and sloping up, with the slower ones fanning out from the earlier flat stretch. Volume is the weak point. The latest bar reads 164.73K against a MA5 of 394.90K and a MA10 of 366.30K, so the current pullback is happening on thin participation. That cuts both ways. Light selling volume means the drop isn't aggressive yet, but the bounce attempts have also lacked conviction. For support, the first area to watch is 0.04681 to 0.04666, where MA14 and MA28 cluster. This is the zone that most likely decides whether the afternoon uptrend survives. Below it, 0.04668 on the price axis lines up closely, which adds weight. If buyers defend it with a visible volume pickup, the higher-low structure stays intact. A clean loss of it would put 0.04602 in play, and below that the real floor is the 0.04537 session low. A break there would erase the whole recovery. On the upside, the nearest resistance is MA7 near 0.04734, which price needs to reclaim first. Above it, 0.04800 is the level that matters, since it's the session high and the spot where sellers showed up hard. The round figure just above it can act as a psychological magnet, but only a close above 0.04800 with strong volume would turn it into a real target. The bullish case is simple. Buyers need to hold the MA14/MA28 zone, push back above MA7 at 0.04734, and then challenge 0.04800 with volume well above the MA5 level of 394.90K. A close above that high would break the range and open room for continuation. The bearish case starts with another rejection near 0.04734 to 0.04800, followed by a break under 0.04666. That would shift the afternoon recovery into a failed higher-low sequence and likely send price back toward 0.04602, with 0.04537 as the larger risk. **Key price levels** - Resistance 2: 0.04800 (session high) - Resistance 1: 0.04734 (MA7 area) - Current price: 0.04709 - Support 1: 0.04681 to 0.04666 (MA14 and MA28) - Support 2: 0.04602 - Support 3: 0.04537 (session low) NIGHT is sitting in the middle of its range after rejecting the top, so the next move depends on how it handles the 0.04666 to 0.04734 pocket. A hold with rising volume keeps the range-expansion setup alive. A loss of the slower MAs says the bounce was just a swing inside the range. Either way, watch how price reacts at those levels rather than chasing the 7% on the day, because the next expansion will come out of that zone. None of this is financial advice, and levels can fail, so manage risk accordingly. #IMPACTbyTrade$LTCUSDT
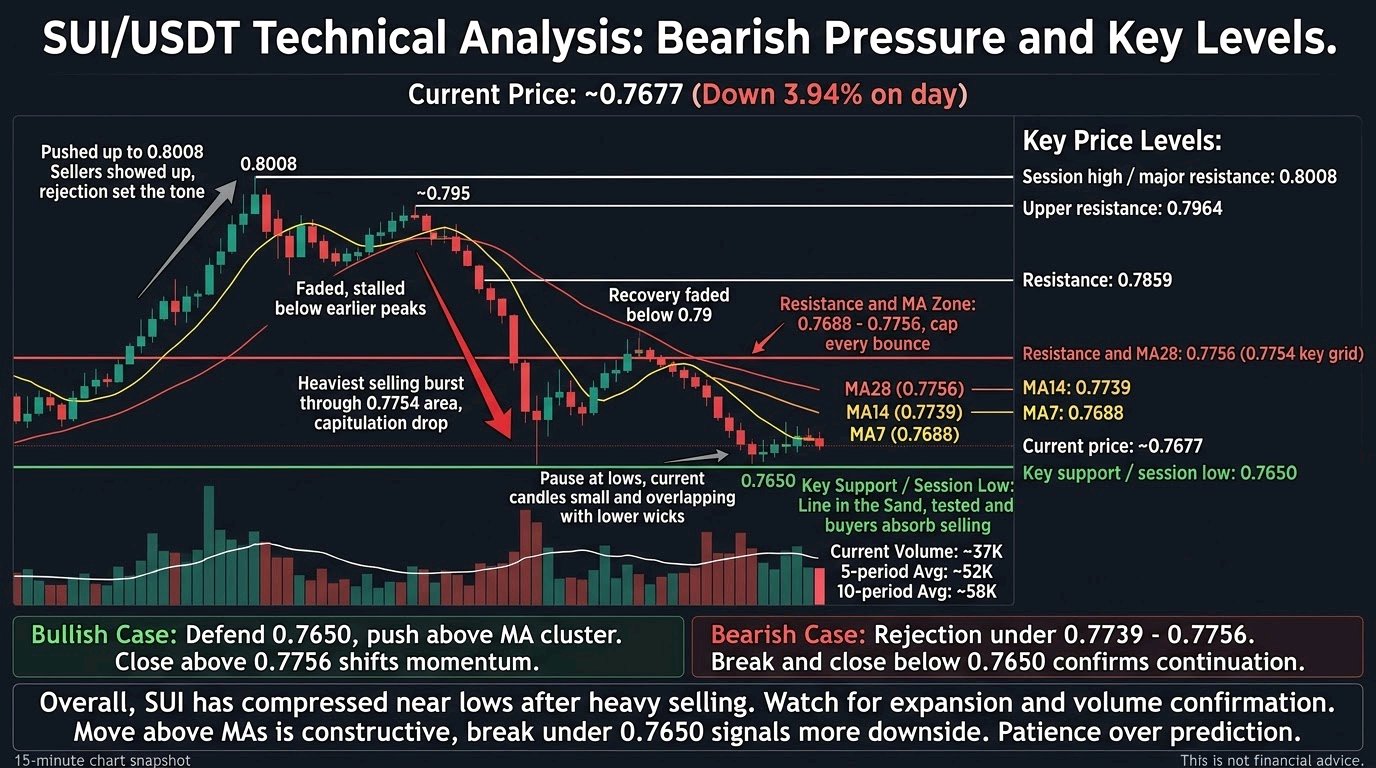
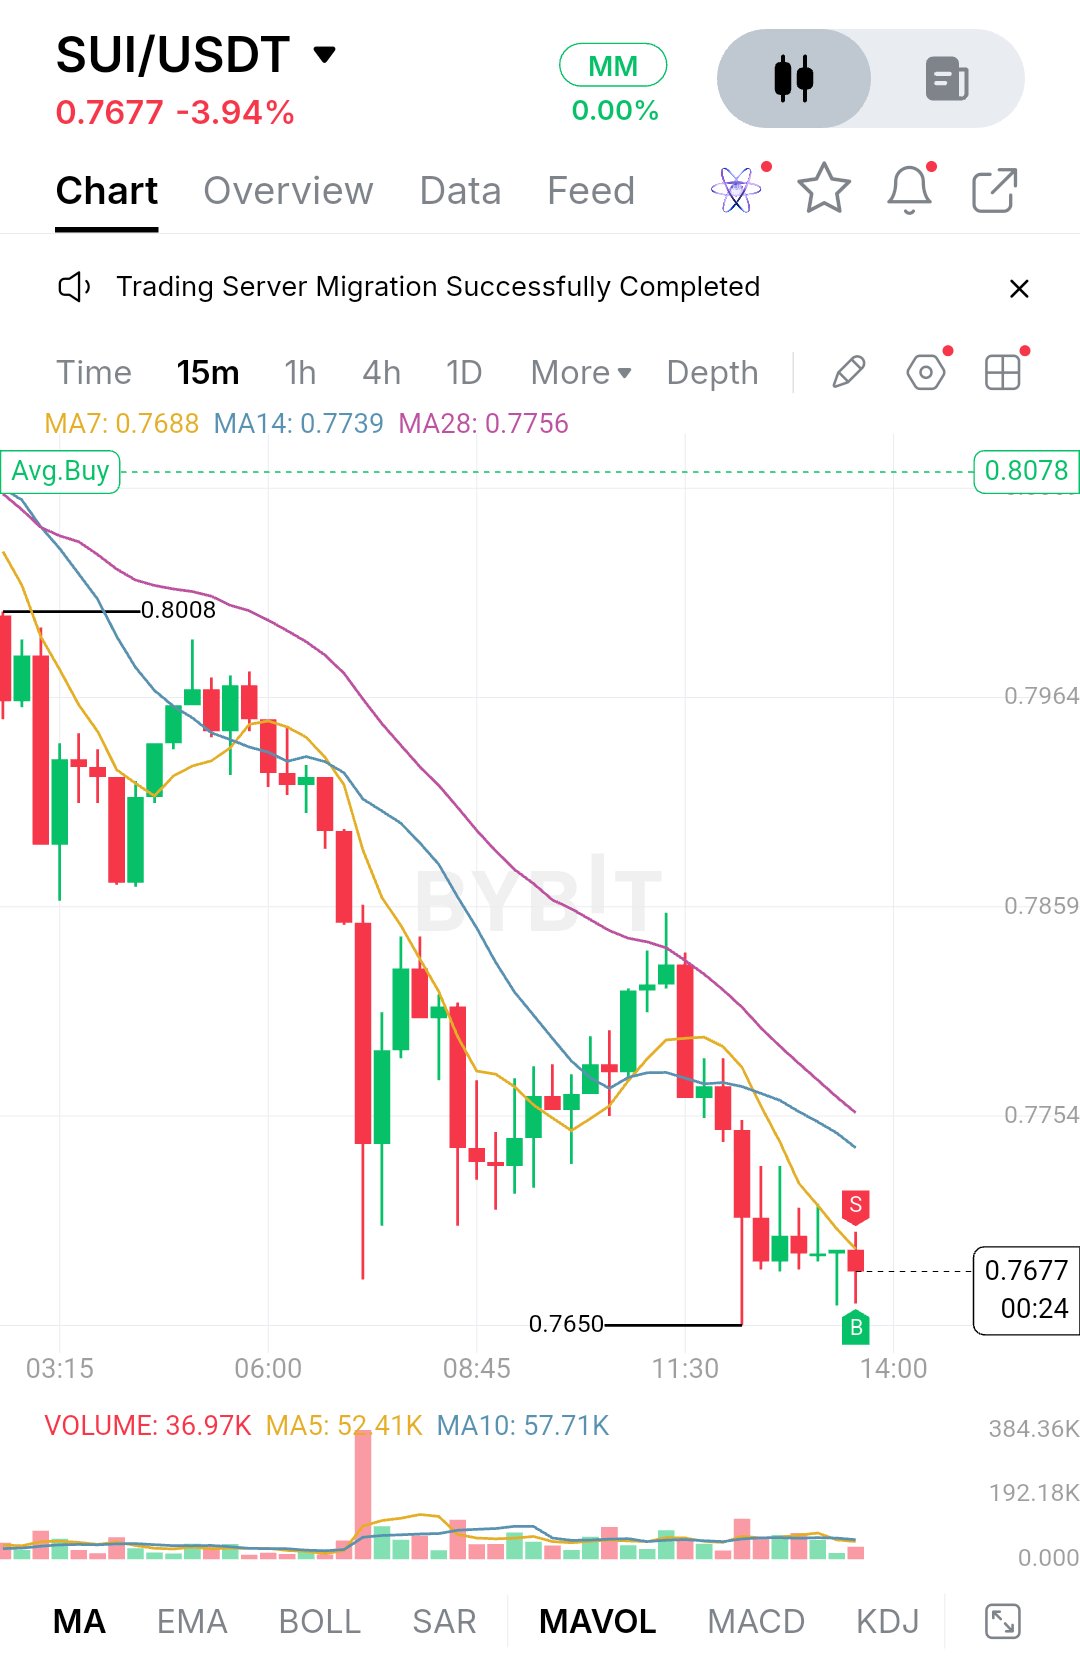
SUIUSDTは現在0.7677付近で推移しており、前日比3.94%安となっています。チャートを見ると、市場はセッションの大半をかけて地盤を切り下げてきたことがわかります。早い段階では価格は0.8008に向けて上昇しましたが、そこで売り手が現れ、その拒絶反応がその後の基調を決定づけました。その後反発も見られましたが、0.79半ばで失速し、再び下落しました。最大の売りは、単発の出来高の急増によって0.7754のエリアを一気に割り込んだ場面で見られました。その後買い手が介入して回復を試みましたが、0.79を下回ったところで力尽き、再びセッション安値の0.7650まで滑り落ちました。 その投げ売りのような下落の後、チャート構造は高値を切り下げる展開へと変わりました。午前遅くにかけての回復は本物でしたが、以前の高値を大きく下回る水準で頭打ちとなり、売り込まれました。安値圏での直近のローソク足は小さく重なり合っており、下ヒゲは押し目買いが入っていることを示していますが、決定的な反転の兆しは見えません。現時点では、底固めというよりは、安値での小休止のように見えます。出来高もその読みを裏付けています。現在のバーは約37Kで、5期間平均の約52K、10期間平均の約58Kを大きく下回っています。つまり、売り圧力は落ち着きましたが、買い手もまだ確信を持って参入していない状態です。 このスクリーンショットは15分足チャートで、表示しているインジケーターは移動平均線(MA7、MA14、MA28)と出来高のみです。EMA200、RSI、MACD、フィボナッチツールは表示されていないため、それらの値については言及しません。チャートが示しているのは、きれいなベアリッシュスタック(弱気並び)です。MA7が0.7688、MA14が0.7739、MA28が0.7756に位置し、すべて下向きで、価格は最も短期の移動平均線と同水準かそれ以下にあります。これは、短期的な勢いが依然として売り手側にあることを物語っており、反発するたびに、より遅い移動平均線に達したところで上昇が抑えられています。トレンドが改善したと言えるようになるには、市場がこれらの平均線を回復し、その上で推移する必要があります。 サポート面では、0.7650の安値が防衛ラインとなります。この水準はテストされて守られており、付近の下ヒゲは、売り手がこの価格帯で吸収されることを厭わない買い手がいることを示しています。もしこの水準が次の再テストでも維持されれば、特に出来高が減少する中で、短期的なレンジの底となる可能性があります。これを明確に割り込めば売り手が再び主導権を握ることになり、このビューでは下に明確な構造がないため、価格は急速に下落する可能性があります。サポートの失敗はしばしば急速な投げ売りにつながるため、この水準は慎重に扱うべきです。 上値については、最初のハードルは0.7688から0.7739にあるMA7とMA14のクラスターで、そのすぐ上に0.7756のMA28が控えています。このゾーンは激しい売りが始まった0.7754のエリアとも重なるため、実質的な上値抵抗として機能するはずです。その上には、0.7859と0.7964の基準レベルがあり、セッション高値の0.8008が主要な天井となります。0.80といったキリの良い数字は利益確定売りと新規のショートの両方を引き寄せやすいため、簡単にブレイクするとは思えません。 強気シナリオは、買い手が0.7650を守り、価格を短期移動平均線の上に戻すことから始まります。3本の移動平均線をすべてクリアする0.7756を上回って引ければ、勢いが変化し始めた最初のサインとなります。そこから0.7859が次のターゲットとなり、さらに出来高を伴って上昇すれば0.7964が視野に入ります。出来高の増加を伴わない反発は、単なる高値切り下げのパターンに終わる可能性が高いでしょう。 弱気シナリオはより単純です。価格が0.7739から0.7756の下で拒絶され続け、再び下落に転じるようなら、売り手は0.7650を再度試しに行くでしょう。その安値を割り込んで引ければ、下落トレンドの継続が確定し、底固めという見方は無効になります。下落する移動平均線への力弱い反発は、トレンドが拡大する前によく見られる動きです。 主要価格レベル: - セッション高値 / 主要レジスタンス: 0.8008 - 上方レジスタンス: 0.7964 - レジスタンス: 0.7859 - レジスタンスおよびMA28: 0.7756 (0.7754は売りが始まったグリッドレベル) - MA14: 0.7739 - MA7: 0.7688 - 現在価格: 0.7677 - 主要サポート / セッション安値: 0.7650 全体として、SUIは高値での明確な拒絶から激しい売り、不発に終わった回復、そして現在は安値圏での停滞へと動いています。市場は収束しており、収束は通常、拡散へと向かいます。次に注目すべきは、次の動きが本物の出来高を伴うかどうかです。移動平均線のクラスターを上回る動きがあれば建設的な最初の兆候となりますし、0.7650を割り込めば、この停滞はさらなる下落前の一時停止に過ぎなかったことを意味します。どちらかが起こるまでは、予測よりも忍耐が重要です。これは投資助言ではないため、各自でリスク管理を行ってください。 IMPACTbyTrade$BTCUSDT
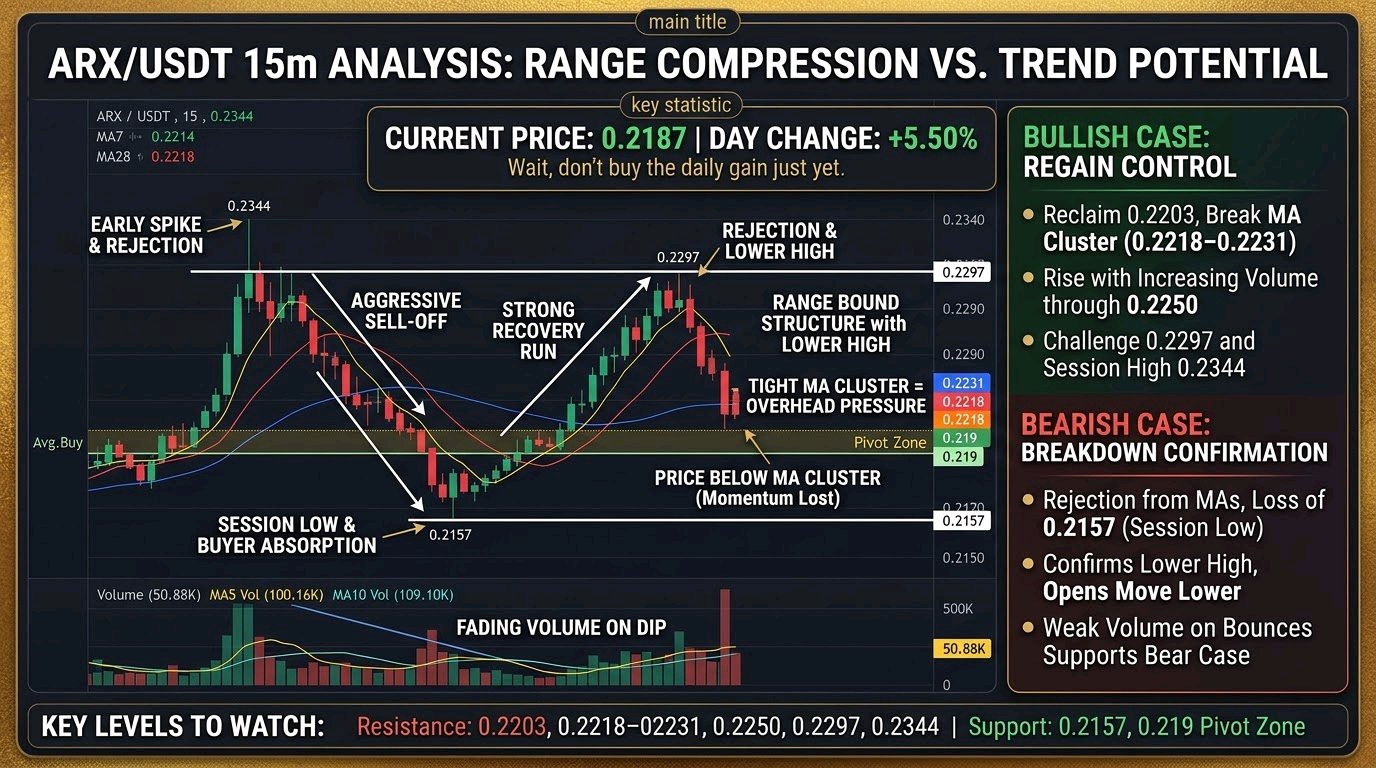
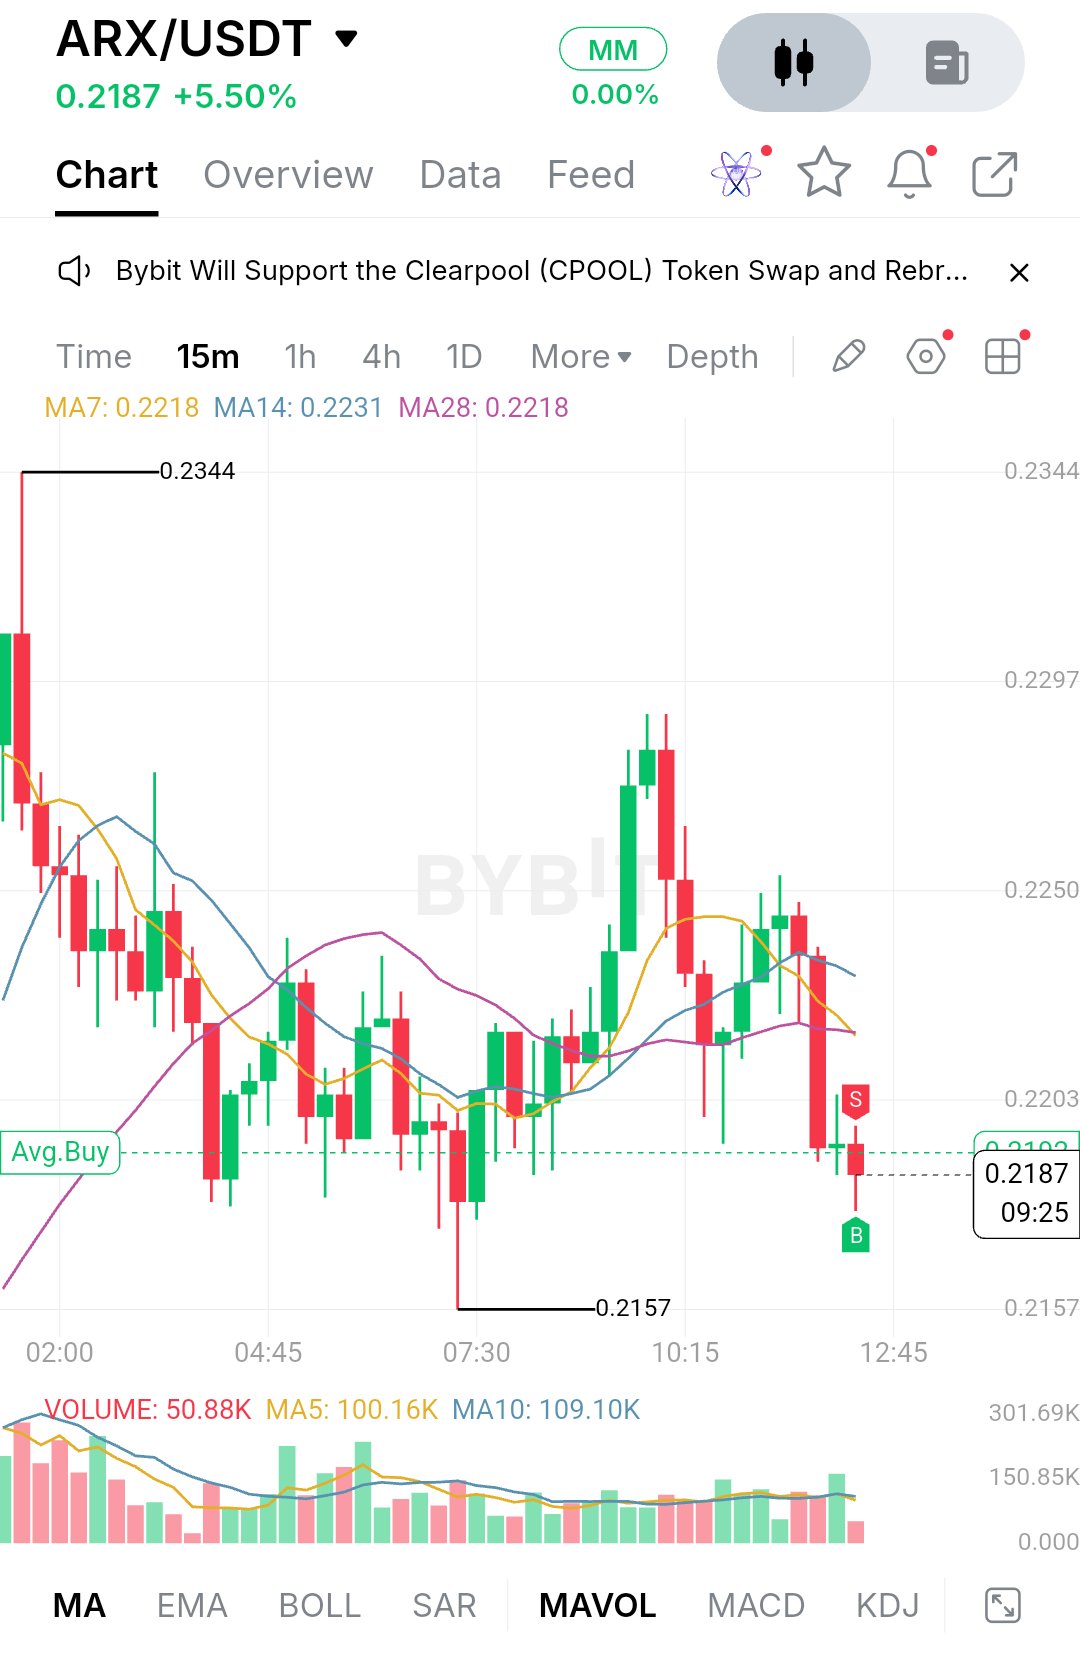
$ARXUSDTは0.2187で取引されており、1日で5.50%上昇していますが、チャートを見るとその数字が示すよりも慎重な見方が必要です。チャートの期間開始直後、価格は0.2344まで急騰しましたが、即座に売られました。大きな陰線がその上昇分の大半を打ち消し、午前中は売り手が主導権を握り続けました。その下落により、07:30頃には価格は0.2157まで押し下げられましたが、そこで長い下ヒゲが出現し、買い手が参入して売りを吸収していることが示されました。 その後の展開は、本格的な回復でした。中期セッションにかけて価格は押し戻され、10:15頃には力強い陽線がいくつか出現し、0.2297エリアに向けてきれいに上昇しました。そこで再び売り手が現れ、大きな陰線がその上昇のほとんどを打ち消しました。それ以降、価格は緩やかに下落しており、現在は3本の移動平均線をすべて下回っています。これは、反発が完全に失敗したというよりも、勢いを失ったことを示唆しています。 現在の構造は、高値を切り下げるレンジ相場です。市場はおおよそ0.2157から0.2297の間で推移しており、直近の拒絶反応は以前のピークを下回る位置で起きています。チャート上では、MA7が0.2218、MA14が0.2231、MA28が0.2218に位置しており、価格は現在、上値抵抗として機能するタイトな密集エリアの下にあります。また、各平均線は横ばいで、何度も交差しており、通常これは市場が方向感を欠いていることを意味します。出来高もその見方を裏付けています。直近のローソク足の出来高は50.88Kで、5期間平均の100.16Kや10期間平均の109.10Kを下回っています。つまり、現在の下落は積極的な売りによるものではなく、参加者の減少によるものです。価格はまた、0.219付近のAvg.Buyライン周辺で推移しており、ここが判断の分かれ目となっています。 最初のサポートはセッション安値である0.2157で、ここは長い下ヒゲで買い手が防衛したポイントです。もしここが再び維持されれば、レンジは維持され、上半分への再テストが可能になります。もし強い出来高を伴ってここを割り込めば、構造は安値を切り下げる形に変わり、このレンジは参考にならなくなります。 上値の最初のレジスタンスは0.2203で、その次は0.2218から0.2231の移動平均線密集地帯です。その上では、価格が何度か停滞した明確な水平線である0.2250があり、次に回復の頂点である0.2297、そして最後にセッション高値の0.2344となります。 強気派にとっての最初の課題は、0.2203を奪還して維持すること、そして0.2218から0.2231の密集地帯を上回って引けることです。出来高を伴って0.2250を超えれば、買い手が主導権を取り戻していることが示され、次のテストは0.2297になるでしょう。 弱気派にとって、移動平均線密集地帯からの拒絶、続いて0.2157を割り込む動きは、高値切り下げの構造を確定させ、セッション安値を下回る動きにつながる可能性が高いです。反発時の出来高の弱さは、その可能性をさらに強めます。 主要な価格レベル: - レジスタンス: 0.2203, 0.2218~0.2231 (移動平均線密集地帯), 0.2250, 0.2297, 0.2344 - サポート: 0.2157 (セッション安値), 0.219付近のAvg.Buyゾーン (ピボット) - 出来高の参考値: 5期間平均 100.16K, 10期間平均 109.10K 全体として、ARXは防衛された安値と拒絶された高値の間に挟まれており、日次上昇幅よりも、両端での価格の動きの方が重要です。移動平均線を抜ける際、または0.2157を再テストする際に出来高が戻ってくるかを確認してください。どちらの方向に実質的な参加を伴ってブレイクするかが、次の拡大局面の方向性を決定するでしょう。これは保証するものではありませんので、それらのレベルに基づいてリスクを限定してください。 補足:このスクリーンショットは15分足チャートであり、MA7/14/28、MA5/MA10を含む出来高、そしてAvg.Buyラインのみが表示されています。EMA200、RSI、MACD、フィボナッチレベルは表示されていないため、数値を捏造するのではなく、除外しました。もしこれらのインジケーターを表示した1時間足チャートを送っていただければ、それらを追加できます。 $IMPACTbyTrade
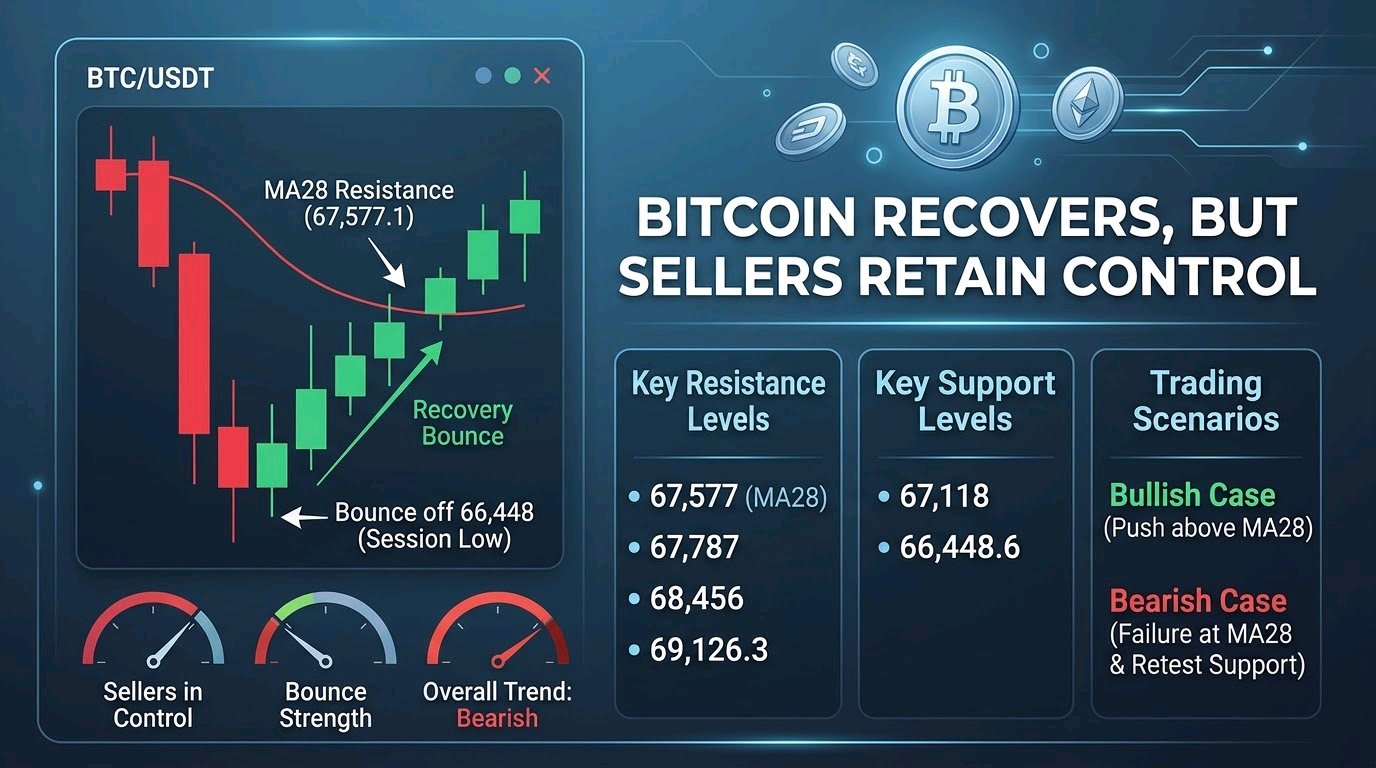
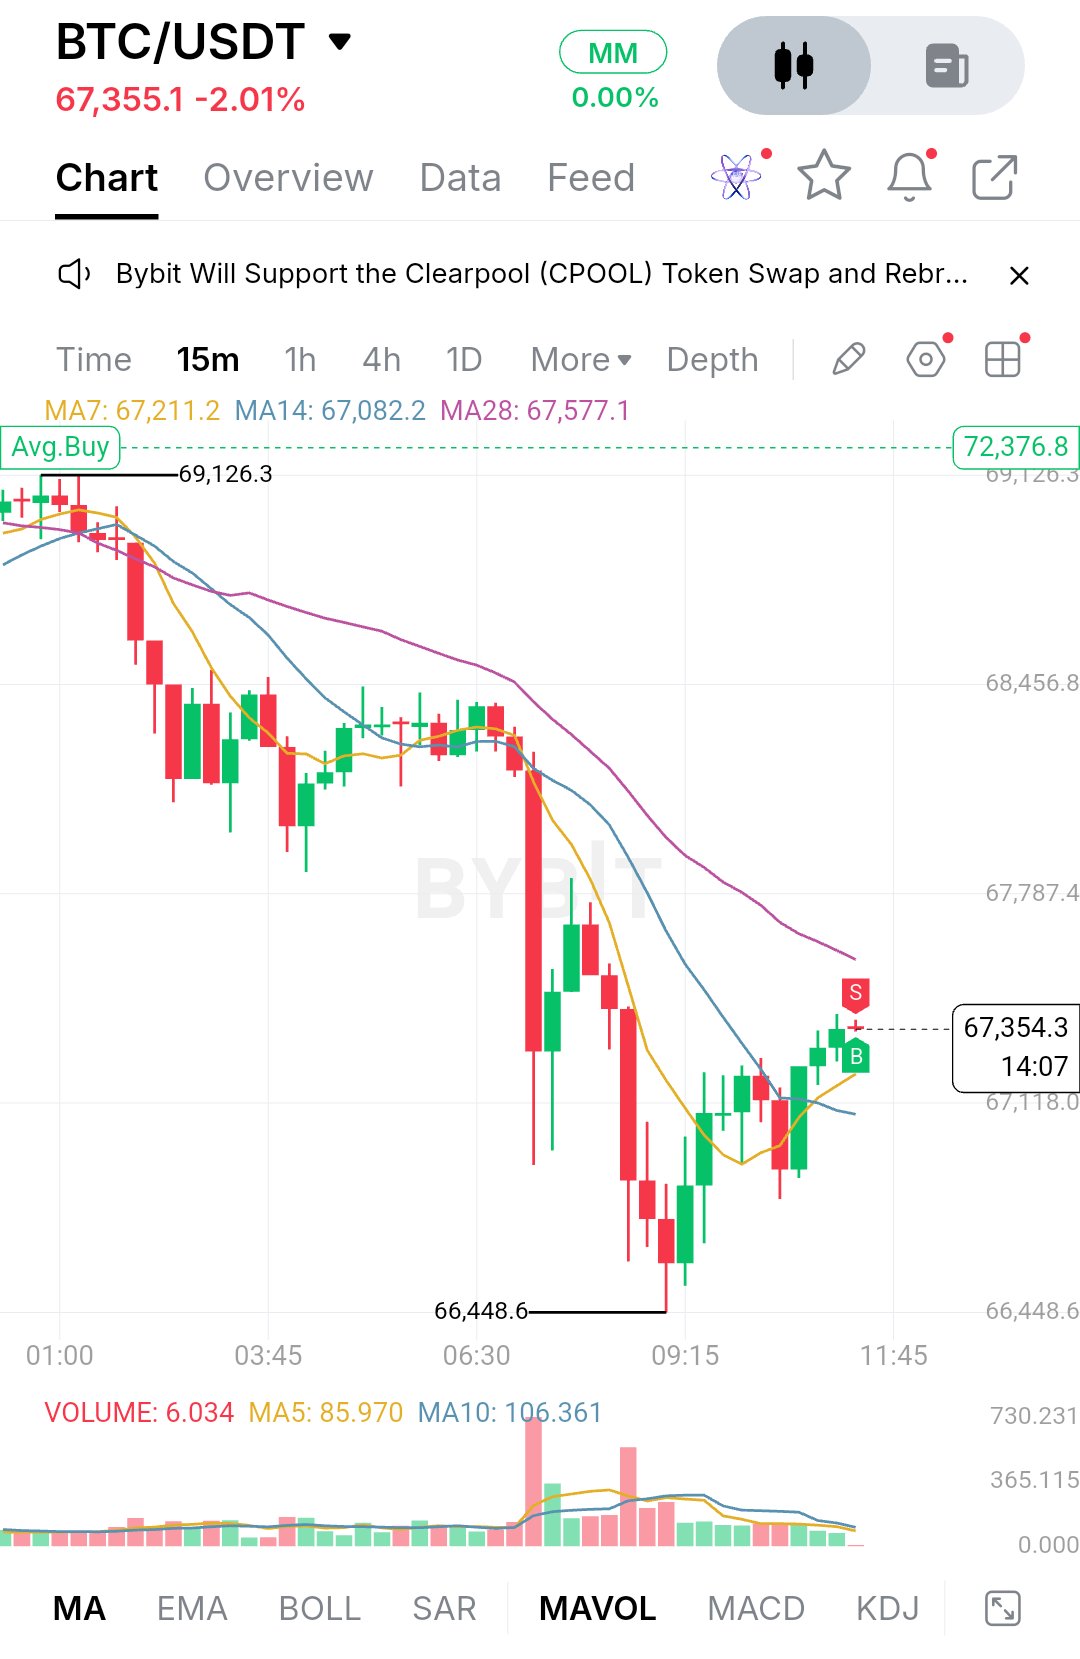
$BTCUSDT 分析:ビットコインは66,448で反発するも、依然として売り手が主導権を握る展開** ビットコインは67,355付近で取引されており、日次で約2.01%の下落となっています。セッション開始時は69,126のエリアを試す動きがありましたが、買い手が維持できず、そこから売り手が主導権を握りました。下落は2段階で発生しました。1段階目は早い時間帯を通じてのじりじりとした下げ、2段階目はセッション安値の66,448.6まで価格を押し下げた、鋭い高出来高のフラッシュ(急落)でした。この2段階目の下げこそが真のダメージであり、その際の出来高急増は、売り手がどれほど積極的に参入してきたかを示しています。 その安値の後、チャートの様相が変わりました。価格は新たな安値を更新することを止め、陽線を伴って高値を切り上げ、67,300を回復しました。これは広範な下降トレンドの中でのリバウンドに見え、まだ本格的な反転とは言えません。キャピテーション(投げ売り)のローソク足以降、出来高が顕著に減少していることから売り圧力は和らいでいますが、買い手も強い追撃の押し上げを見せていません。 使用しているチャートは15分足であり、1時間足ではないため、画面上の移動平均線に基づいて分析します。MA7が67,211.2、MA14が67,082.2、MA28が67,577.1です。価格はMA7とMA14を奪還しており、両線とも横ばいになり始めています。これは下落モメンタムが冷え込んでいる最初の兆候です。MA28は依然として価格の上で下向きに傾斜しており、朝の下落以降、回復の試みをことごとく跳ね返してきました。価格がこのMA28を上回って引けない限り、短期トレンドは弱気のままです。EMA200、RSI、MACD、フィボナッチについては、チャート上に表示されていないため、見えない数値を推測することを避けるため除外しました。 下値については、最初のサポートはMA14および直近の押し目ゾーンと重なる67,118付近にあります。買い手がこのエリアを守れば、高値切り上げの構造が維持され、リバウンドが発展する余地が生まれます。これを割り込めば、66,448.6の安値が再び意識されるでしょう。この安値が最も重要です。なぜなら、ここで大量の売りが吸収されたからです。特に出来高を伴ってこれを明確に下抜ければ、先ほどの急落がより大きな下落トレンドの始まりに過ぎなかったことを示唆し、新たな安値への道が開かれることになります。 上値については、目先のハードルは67,577付近のMA28であり、続いて下落中に反発のきっかけとなった67,787のエリアがあります。その上では、メインの売りが入る前に市場が崩れたゾーンである68,456が重要なレジスタンスとなります。頭上の主要レベルは、セッション高値の69,126.3です。68,000のラウンドナンバーも、売り手が現れやすい心理的節目として注目に値します。 強気シナリオでは、買い手が67,100~67,200のゾーンを維持し、MA28を突破し、その後67,787をサポートに転換する必要があります。もし陽線で出来高が増加しながらこれが実現すれば、68,456への動きが現実味を帯び、それを上抜ければセッション高値が視野に入ります。 弱気シナリオでは、MA28または67,787での拒絶を経て67,118を下回って引ければ、今回の反発は単なるリリーフラリー(一時的な戻り)に過ぎなかったことが示されます。その場合、売り手は66,448.6を再テストする可能性が高く、そこを下抜ければ構造的に決定的な下落となります。 主要価格レベル: - レジスタンス:67,577 (MA28), 67,787, 68,456, 69,126.3 - サポート:67,118, 66,448.6 (セッション安値) - 移動平均線:MA7 67,211.2, MA14 67,082.2, MA28 67,577.1 全体として、ビットコインは急激な出来高を伴う売りの後の回復局面におり、次の動きはMA28と67,787付近での価格の反応に依存します。出来高を伴った明確なブレイクアウトは、買い手が主導権を取り戻しているシグナルとなるでしょう。そこで失敗すれば、市場は依然として底固めをしているか、次の下落の準備をしていることを示唆します。反発を追いかけるのではなく、これらのレベルで価格がどのように反応するかを注視してください。これは投資助言ではないため、リスク管理を適切に行ってください。 チャートに関する注記:15分足チャートのため、1時間足での分析は行えませんでした。また、EMA200、RSI、MACD、フィボナッチは表示されていません。これらのインジケーターを表示した1時間足のスクリーンショットを送っていただければ、それに基づいて投稿を再構成します。また、緑色の「Avg.Buy 72,376.8」のラインは、市場のレベルというより個人のポジションマーカーのように見えるため除外しました。 IMPACTbyTrade$ETHUSDT
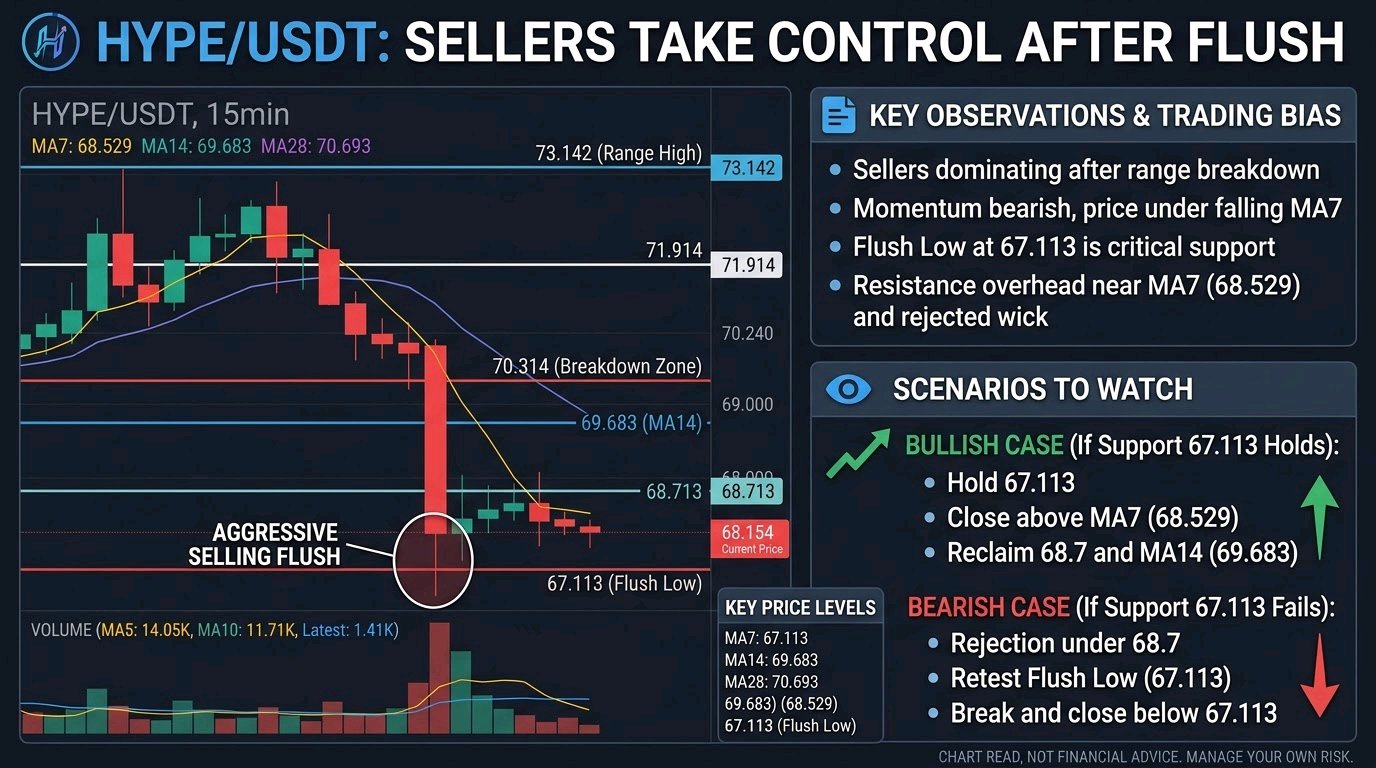
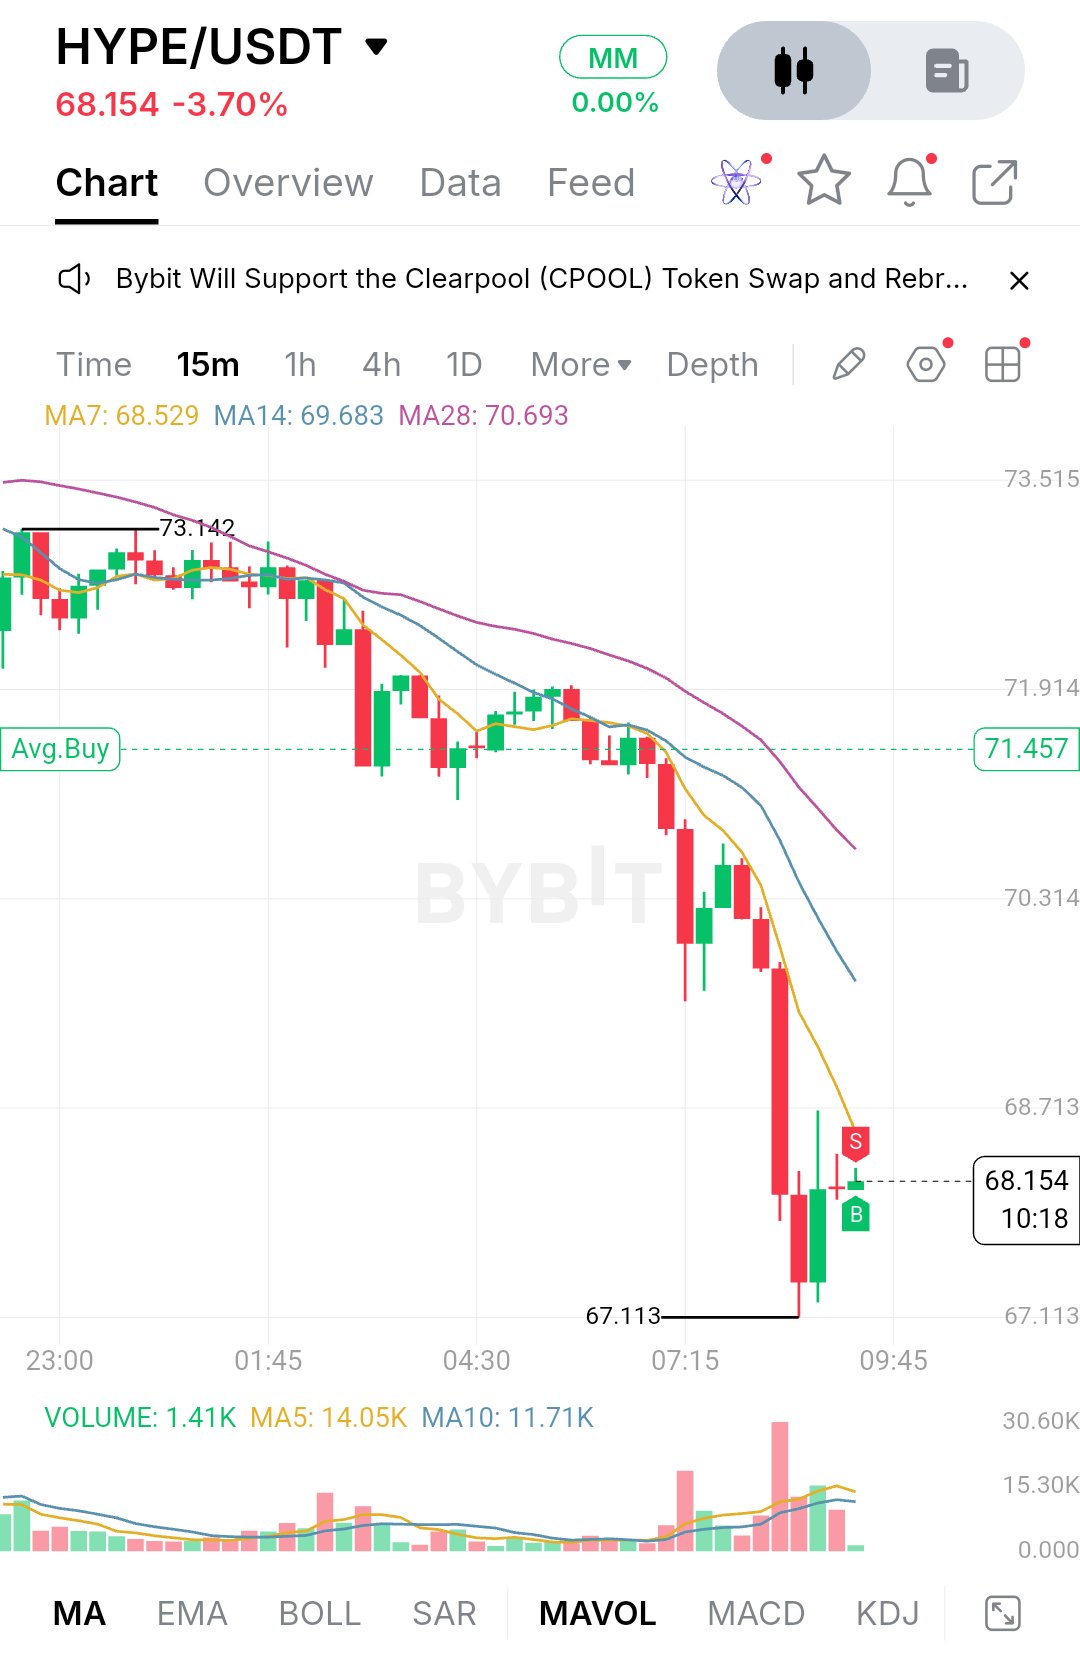
HYPEUSDTは68.154で取引されており、日次で3.70%下落しています。チャートは売り手が主導権を握っていることを明確に示しています。 セッションの大部分において、価格は高値73.142の直下で狭いレンジに留まっていました。ローソク足は小さく、上下にヒゲが出ており、どちらの側も決定打を欠いていました。その均衡は、価格が71.9のエリアを下回ったことで崩れました。売りが強まり、70.3のゾーンを割り込むと、67.113までの急激なフラッシュ(投げ売り)へと加速しました。最も積極的な売りは、この下落の中で最大の大陰線で発生し、チャート上で最大の出来高急増も伴いました。 このフラッシュの後、価格は安定しようとしています。安値からの小さな反発、68.7エリアに向けて上昇するも押し戻された長い上ヒゲのローソク足、そして現在の価格における小さなローソク足が見られます。これは回復というよりは、躊躇しているように見えます。買い手は67.113で参入しましたが、まだ意味のある水準を奪還するほどの力強さは示せていません。直近のローソク足の出来高はわずか1.41Kで、MA5の14.05KやMA10の11.71Kを大きく下回っており、非常に大きな動きの後で市場は現在静まり返っています。 15分足チャートでは、移動平均線は弱気な並び(逆パーフェクトオーダー)になっています。MA7は68.529、MA14は69.683、MA28は70.693に位置し、短期線が一番下にあり、3本とも下向きです。現在価格はMA7のわずか下にあり、短期的なモメンタムは依然として売り手にあることを示しています。MA7とMA28の乖離は大きく、通常これは価格が過熱(ストレッチ)していることを意味します。これによって自律反発が起こる可能性はありますが、下向きの移動平均線への反発はトレンド転換とは異なります。 最初のサポートはフラッシュの安値である67.113です。これが重要なのは、買い手が現時点で明らかに防衛した唯一の水準だからです。もしこの水準が、より小さなローソク足と売りの出来高の減少を伴いながら再テストに耐えれば、短期的なレンジの底となる可能性があります。もしここを割り込めば、このチャート上に目に見える構造はなく、下値を支えるものがないため、価格は急速に下落する可能性があります。67.7から68.0付近での反発は、最初の小さな反応が試される場所になるでしょう。 レジスタンスは、MA7と拒絶されたヒゲが重なる68.5から68.7付近に直近で存在します。その上には、次のグリッドレベルである68.713があり、MA14が69.7付近にあるため、このゾーンが回復の真価を問われる場所となります。その次はブレイクダウンエリアである70.314、続いてMA28に近い70.7、そして71.914となります。73.142の高値はかなり遠く、構造全体が変わらない限り考慮する必要はないでしょう。 強気ケースは、買い手が67.113を維持し、MA7と68.7のエリアを上回ってローソク足を確定させることから始まります。69.7付近のMA14を突破すれば明確な改善が見られ、その次は70.3から70.7のゾーンが主要なテストとなります。ここは以前のレンジが崩れた場所であるため、売り手が防衛する可能性が高いです。これより上の動きは、陽線で出来高が減衰するのではなく増加し始めれば、信頼性が高まります。 弱気ケースはより単純です。もし価格が68.7の下で拒絶され続け、MA7が天井として機能すれば、売り手が主導権を握り続け、67.113の再テストの可能性が高まります。特に出来高を伴ってここを明確に割り込み、下で確定すれば、サポートが存在しないため下落トレンド継続の扉が開かれます。 **主要価格水準** - レジスタンス: 73.142 (レンジ高値), 71.914, 70.693 (MA28), 70.314, 69.683 (MA14), 68.713 - 現在価格: 68.154 (MA7は68.529) - サポート: 67.113 (フラッシュ安値) 現在、市場は衝動的な下落の後の一時停止状態にあり、反転が確認されたわけではありません。次に重要なのは、67.113が維持されるかどうか、そして価格が相応の出来高を伴ってMA7と68.7のゾーンを奪還できるかどうかです。狭いベース形成の後にこのエリアを決定的に上抜ければ最初の強さの兆候となりますが、安値を割り込めば売りがまだ終わっていないことを示唆します。この圧縮局面での価格の動きを注視してください。次の拡大は、どちらかの方向にブレイクした側から起こるはずですから。 これはチャート分析であり、投資助言ではありません。トレーダーは各自のリスク管理を行う必要があります。 IMPACTbyTradeBTCUSDT
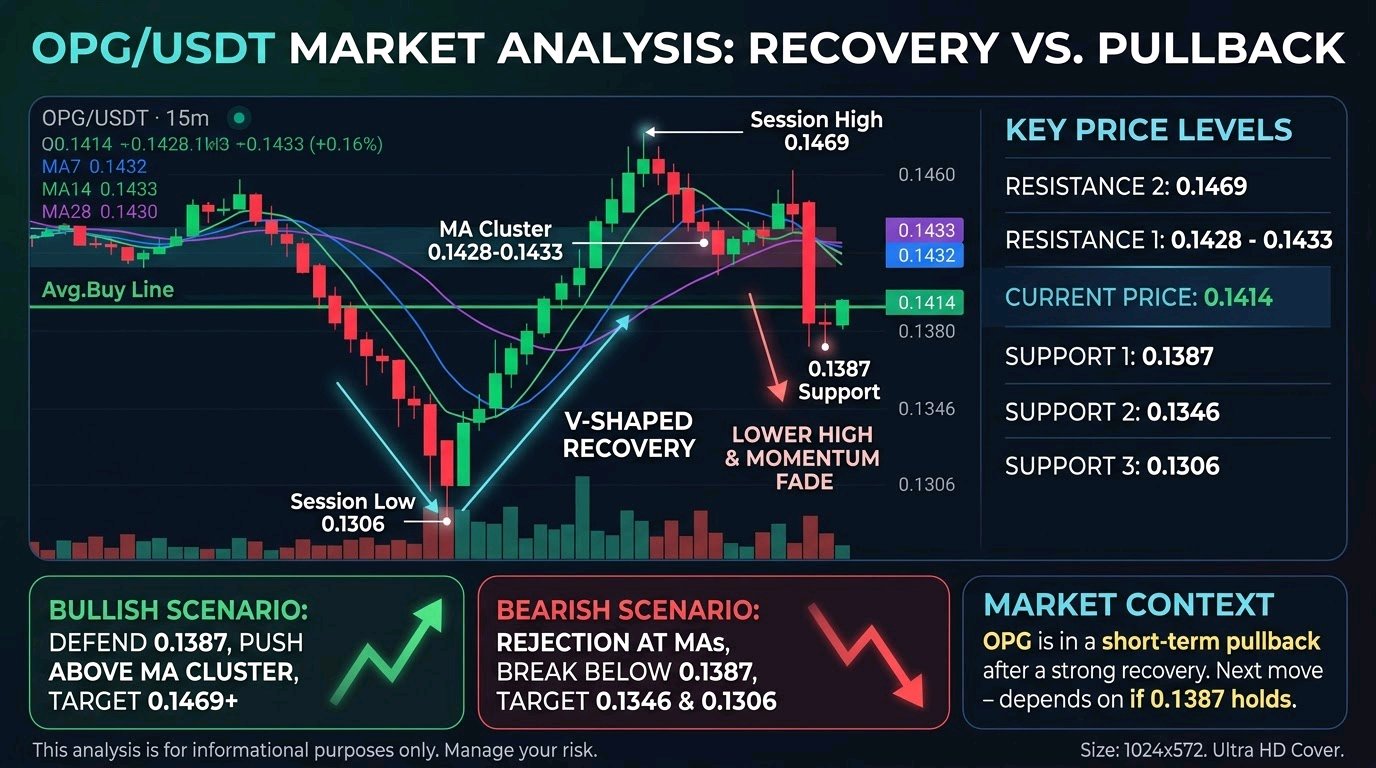
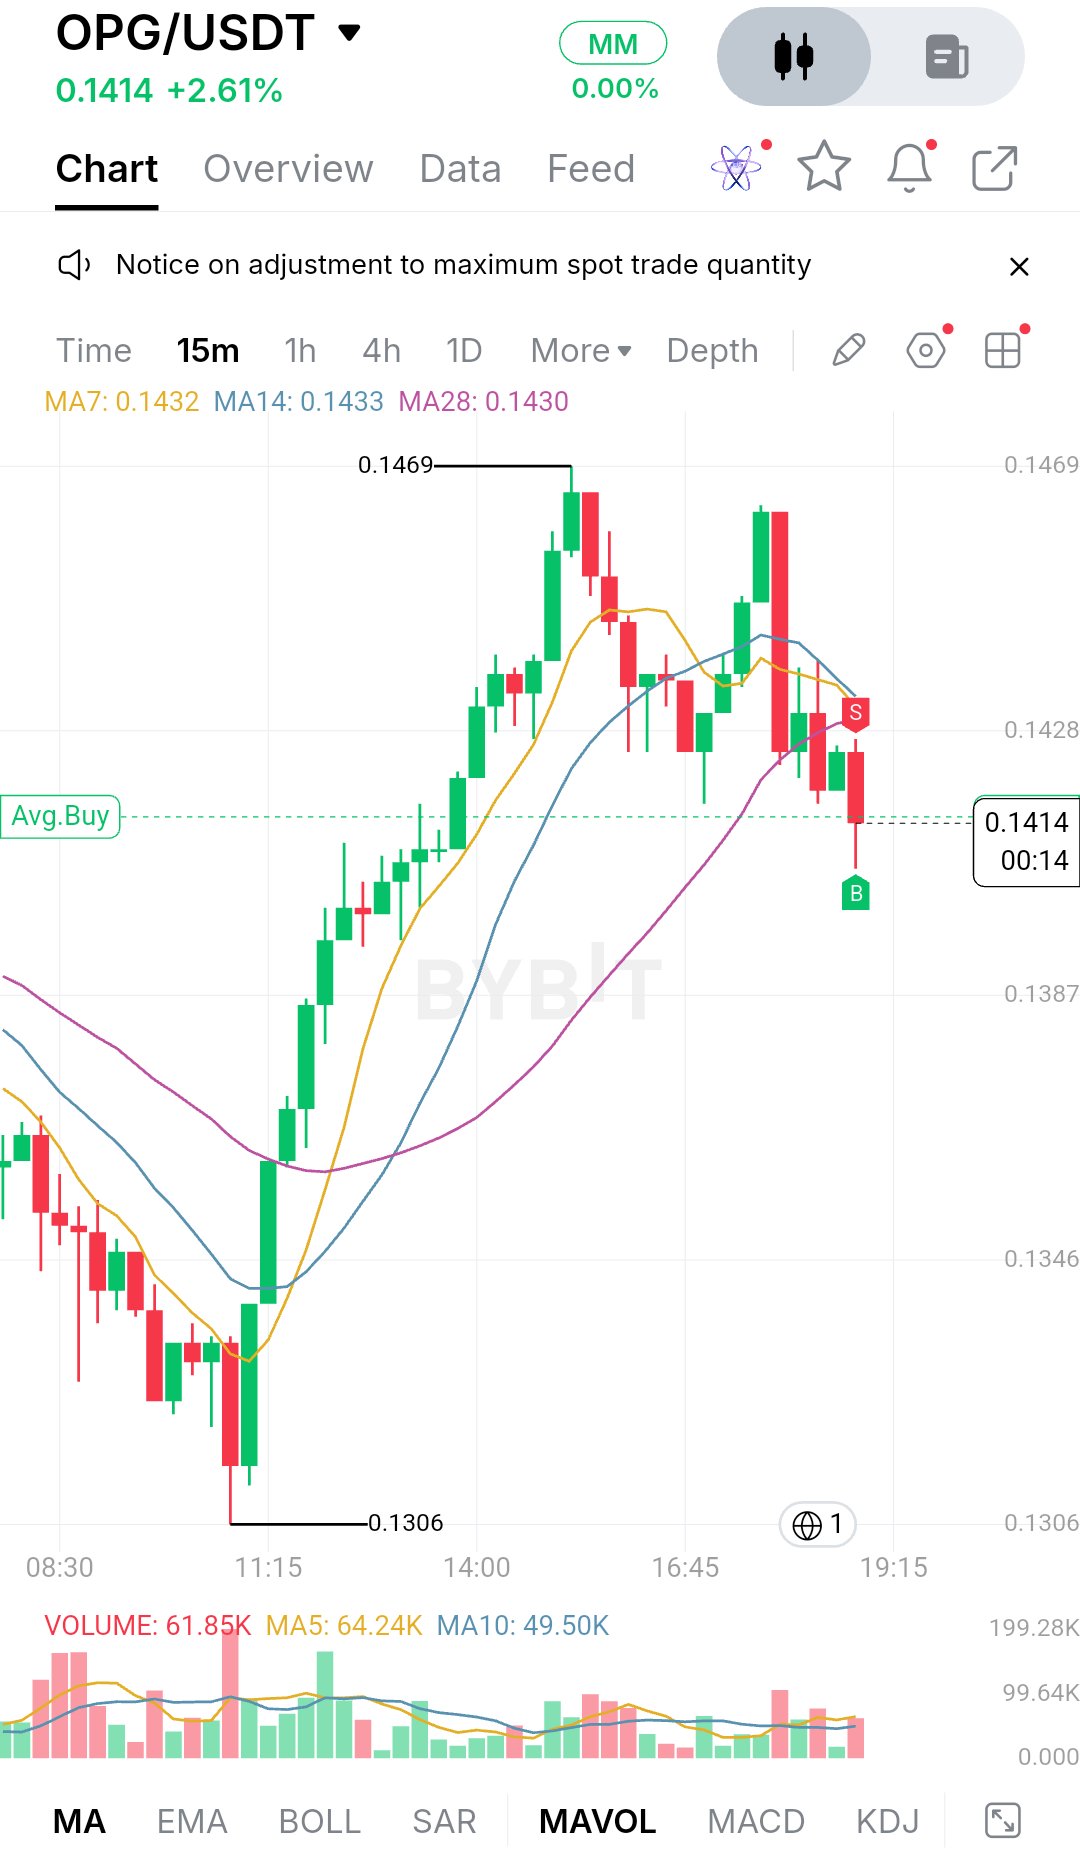
$OPGUSDTは0.1414で取引されており、本日2.61%の上昇となっています。本日のセッションには2つの明確なフェーズがありました。11:15頃に売り手が価格を0.1306まで押し下げましたが、そこで買い手が強く介入しました。その後、価格を0.1469まで押し上げる陽線が続きました。16:45近くに2度目の押し上げがあり、同様の高値を付けましたが、大きな陰線に阻まれ、上昇分のほとんどが急速に消し去られました。 この2度目の拒絶反応は構造上重要です。最初の動きはきれいなV字回復でした。2度目の試みは高値を切り下げ、実体の大きな陰線で売られたため、モメンタムは衰えています。価格は現在0.1428のエリアを割り込み、Avg.Buyライン(現在の価格に近い)上に位置しています。市場は、この反発がトレンド転換だったのか、それとも単なるリバウンドだったのかを見極めようとしているようです。 15分足チャートでは、MA7(0.1432)、MA14(0.1433)、MA28(0.1430)が横ばいとなり、収束しています。価格は現在そのすべてを下回っています。移動平均線がこのように収束し、価格がその下に入り込むと、市場は通常、短期的には方向性を失います。出来高も同様の状況を示しています。最新のバーは61.85Kで、MA5(64.24K)に近く、MA10(49.50K)を上回っているため、パニック売りではありませんが、枯渇しているわけでもありません。最も出来高が大きかったのは、0.1306からのリバウンド時と高値からの拒絶時であり、この2つの地点がこのセッションを定義しています。 サポートについては、最初のエリアは最新のローソク足の下ヒゲが到達した0.1387です。この水準は、上昇過程で市場が通過しなければならなかったため重要です。その下には、次の主要なポイントとして0.1346があり、0.1306のセッション安値は、回復全体の基盤となったラインです。0.1387で踏みとどまれば、買い手が依然として活発であることを示唆します。ここを明確に割り込めば0.1346への道が開かれ、0.1306を割り込めばその日の構造全体が崩れることになります。 上値については、最初のハードルは3つの移動平均線が集まり、最後のローソク足が失敗した0.1428〜0.1433のゾーンです。その上の0.1469のセッション高値が真のレジスタンスとなります。高値を更新し、トレンドを確定させるには、価格がこの水準を力強く奪還する必要があります。 強気シナリオは単純です。買い手は0.1387を守り、0.1430付近のMAクラスターを上抜け、それをサポートとして維持する必要があります。出来高を伴ってこれが実現すれば、0.1469が次のターゲットとなり、それを上回って引ければ、さらなる高値への扉が開かれます。 弱気シナリオは、MAゾーンでの拒絶から始まります。価格が0.1430を再テストして再び失敗すれば、高値切り下げの構造が確定します。0.1387を割り込めば0.1346へ向けた売りが加速し、その水準が崩れれば0.1306が再び視野に入ります。 主要な価格水準: - レジスタンス2:0.1469(セッション高値) - レジスタンス1:0.1428〜0.1433(MAクラスター) - 現在価格:0.1414 - サポート1:0.1387 - サポート2:0.1346 - サポート3:0.1306(セッション安値) 全体として、OPGは力強い回復の後の短期的な調整局面にあって、次の動きは0.1387が維持されるかどうかにかかっています。トレーダーはMAクラスター付近での価格の反応と、どちらかの方向にブレイクアウトする際に出来高が増加するかどうかを注視すべきです。このような狭いレンジは、しばしば大きな動きの前触れであり、どちらに先にブレイクするかを見極めることの方が、2.61%の上昇幅よりも多くの情報をもたらすでしょう。これは予測ではなく、市場がこのように不透明な時はリスク管理が最も重要です。 IMPACTbyTrade
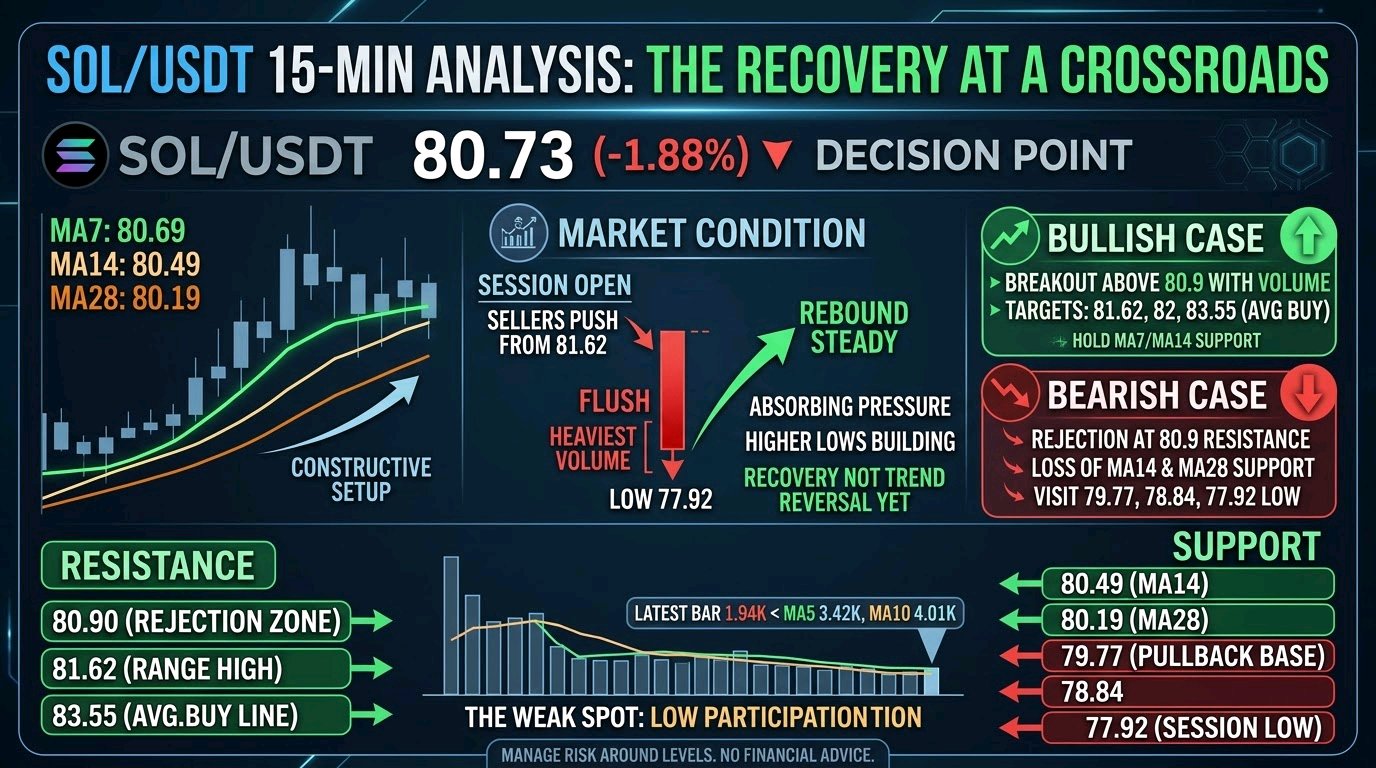
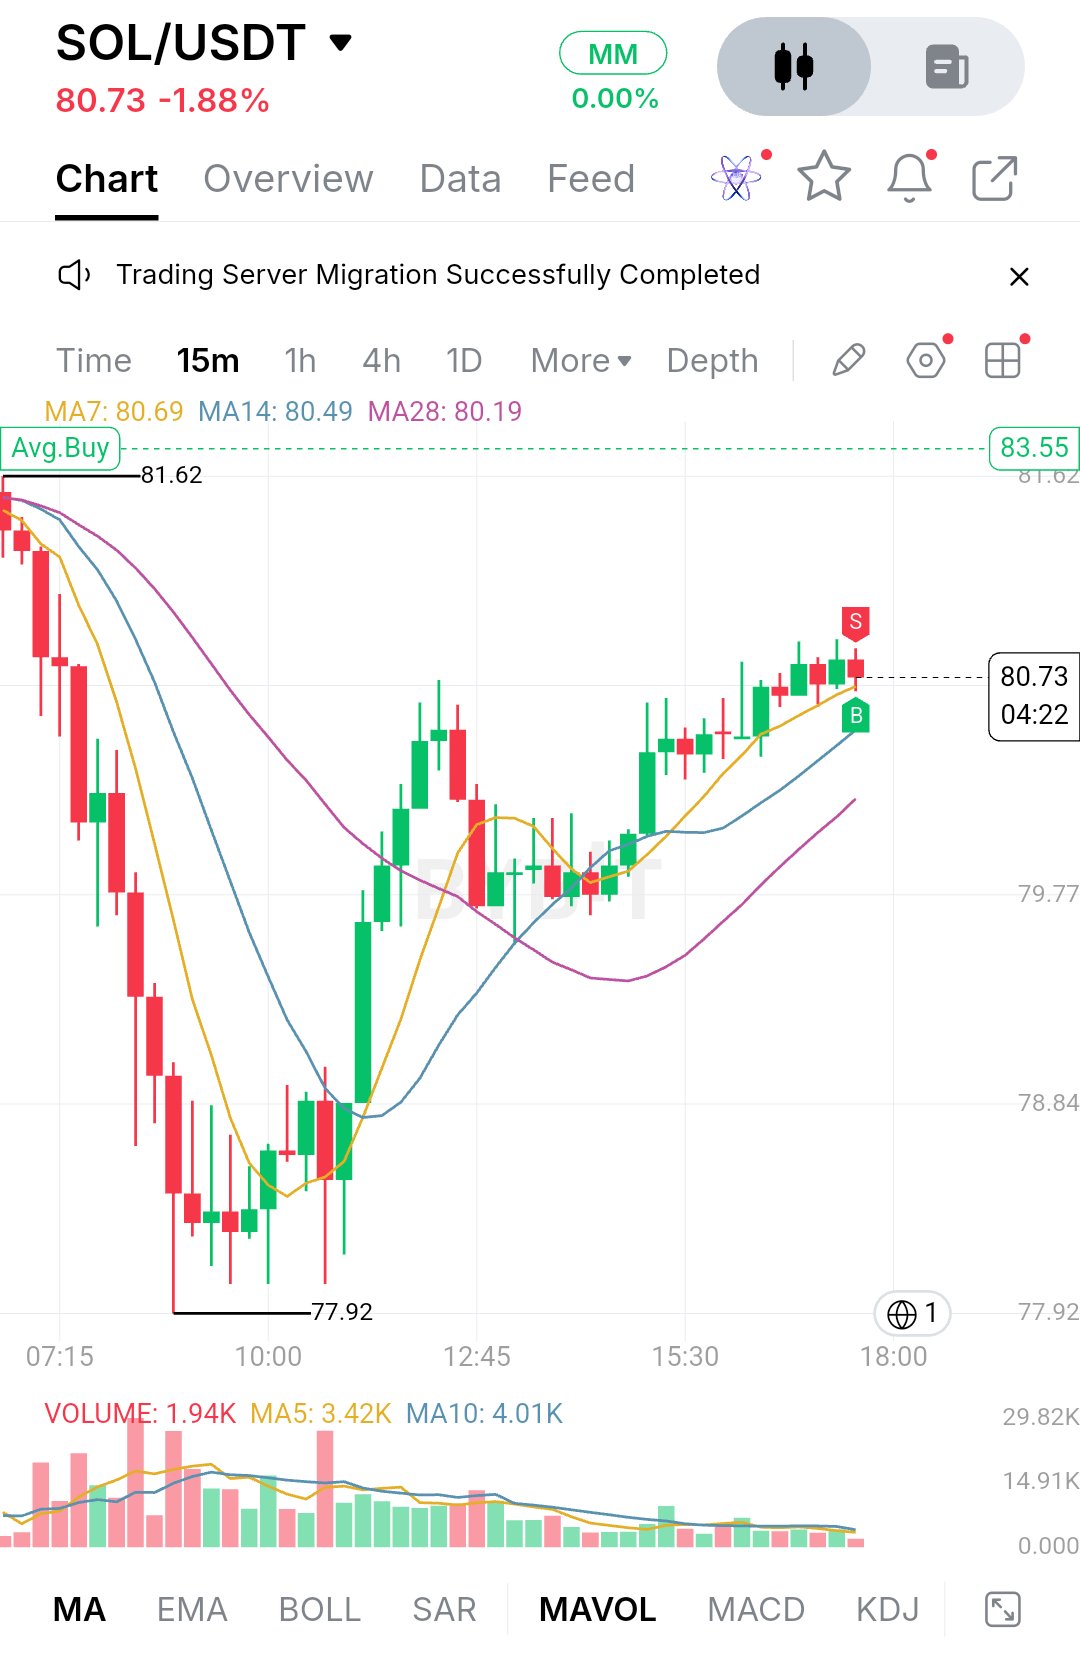
$SOLUSDTは80.73で取引されており、本日1.88%の下落です。セッション開始時は売り優勢で、81.62付近から価格が押し下げられ、一時77.92の安値をつけました。この下落は急激で、チャート上で最も出来高が膨らんだ局面でもありました。安値圏で買い手が参入し売り圧力を吸収し始めたため、それ以降は着実なリバウンドを見せています。 急落後、価格は新たな安値を更新せず、切り上げの動きを見せているため、これは単なるランダムな反発というよりは回復の兆しに見えます。ただし、明確なトレンド転換とまでは言えません。安値からの上昇は12:45頃の80.7付近で停滞し、79.7付近まで押し戻された後、現在は再び同水準まで戻しています。同じ天井を繰り返し試す回復の動きは、ブレイクアウトに向けたエネルギー蓄積か、あるいは燃料切れのどちらかであり、どちらになるかは出来高次第でしょう。 これは15分足チャートなので、その時間軸で分析します。移動平均線を見ると、MA7が80.69、MA14が80.49、MA28が80.19となっています。価格はMA7の直上にあり、他の2本よりも上に位置しており、いずれも上向きに転じています。特にMA28は長期の下落を経て上向きに転じており、短期的なセットアップとしては建設的です。弱点は出来高です。直近のバーは1.94Kで、MA5の3.42KやMA10の4.01Kを大きく下回っており、回復が薄い参加者によって支えられていることを示しています。出来高の増加を伴わないレジスタンス突破には懐疑的であるべきでしょう。チャートにはEMA200、RSI、MACD、フィボナッチレベルが表示されていないため、推測を避けるためこれらについては言及しません。 サポートはまず、MA14とMA28が推移する80.49と80.19にあります。これらを維持できれば、高値切り上げの構造は維持されます。その下では、押し目形成時に底値を固めた79.77付近、続いて78.84、そしてセッション安値の77.92が続きます。79.77を明確に下回れば、回復シナリオ全体が疑問視され、77.92が次の主要な試練となるでしょう。 直近のレジスタンスは80.7から80.9のゾーンで、ここは価格が2度拒絶されており、チャート上にも小さな売りシグナルのマーカーが現れています。その上には、以前のレンジ高値であり、最初の本格的なブレイクアウトレベルである81.62があります。チャートには83.55のAvg.Buyライン(平均取得単価線)も記されており、モメンタムが高まれば妥当な長期ターゲットとなります。その過程で、82というキリの良い数字がチェックポイントになります。 ブル派にとっての役割はシンプルです。MA7とMA14の上を維持し、出来高を伴って80.9を突破し、その後81.62を奪還することです。それを上回って引ければ、セッションの「高値切り下げ」構造が反転し、82、あるいは83.55に向けて道が開かれるでしょう。 ベア派にとってのシグナルは、80.7〜80.9で再び拒絶され、その後MA14とMA28を割り込むことです。そうなれば、この動きはリテスト失敗となり、価格は再び79.77を試すことになるでしょう。そこも割れれば、78.84や77.92の安値が再び意識されることになります。 主要価格レベル: - レジスタンス: 80.90, 81.62, 83.55 (Avg.Buyライン) - 現在価格: 80.73 - サポート: 80.49, 80.19, 79.77, 78.84 - セッション安値: 77.92 SOLはトレンド形成中というよりは、決断のポイントにあります。回復は秩序立っていますが、出来高の欠如がその強さを未証明のものにしています。次に重要なのは、価格が実需を伴って80.9を突破できるか、あるいは再び停滞して80.2から79.8のゾーンへ押し戻されるかです。出来高を伴うブレイクアウトは本格的な拡大の最初のサインとなり、失敗すればレンジ相場が続く可能性が高いでしょう。いずれも保証されているわけではないため、これらのレベルを参考にリスク管理を行ってください。 #IMPACTbyTrade$HYPEUSDT
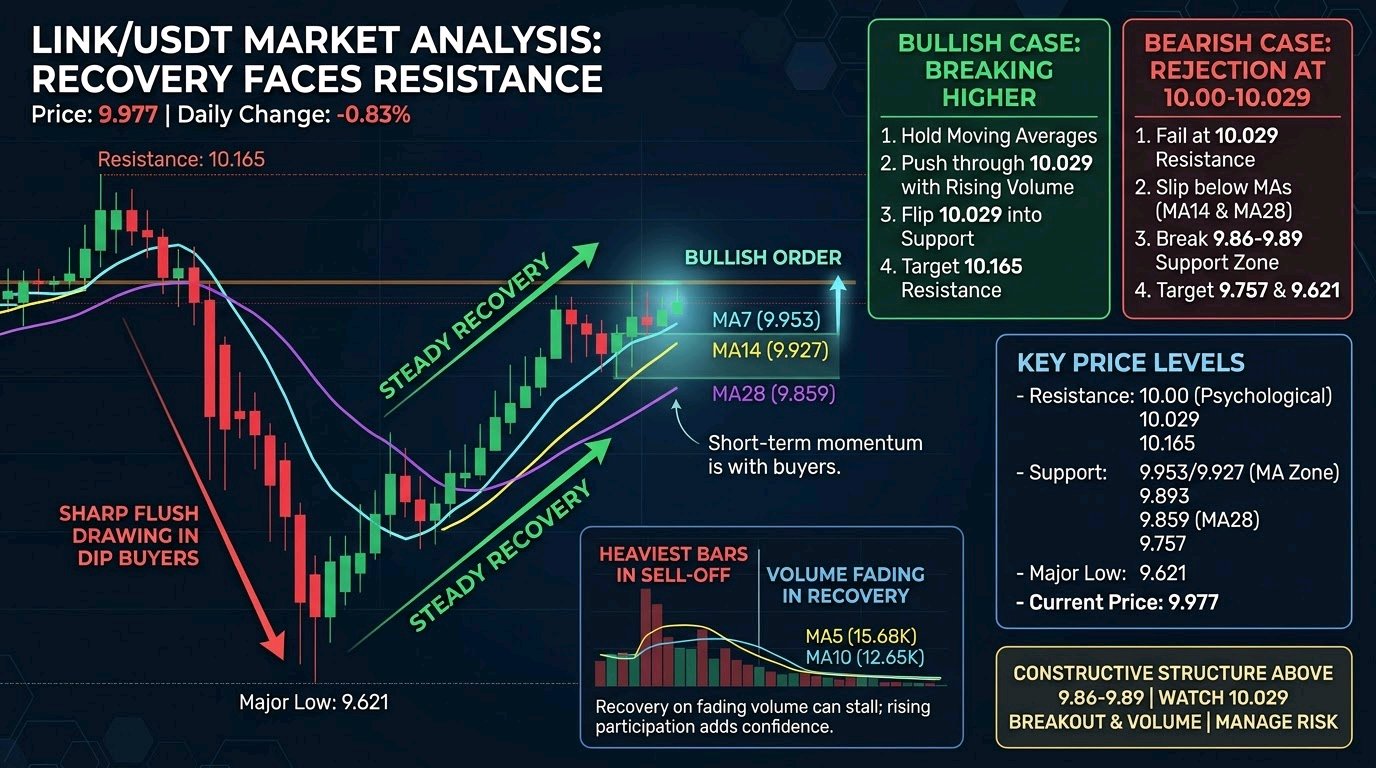
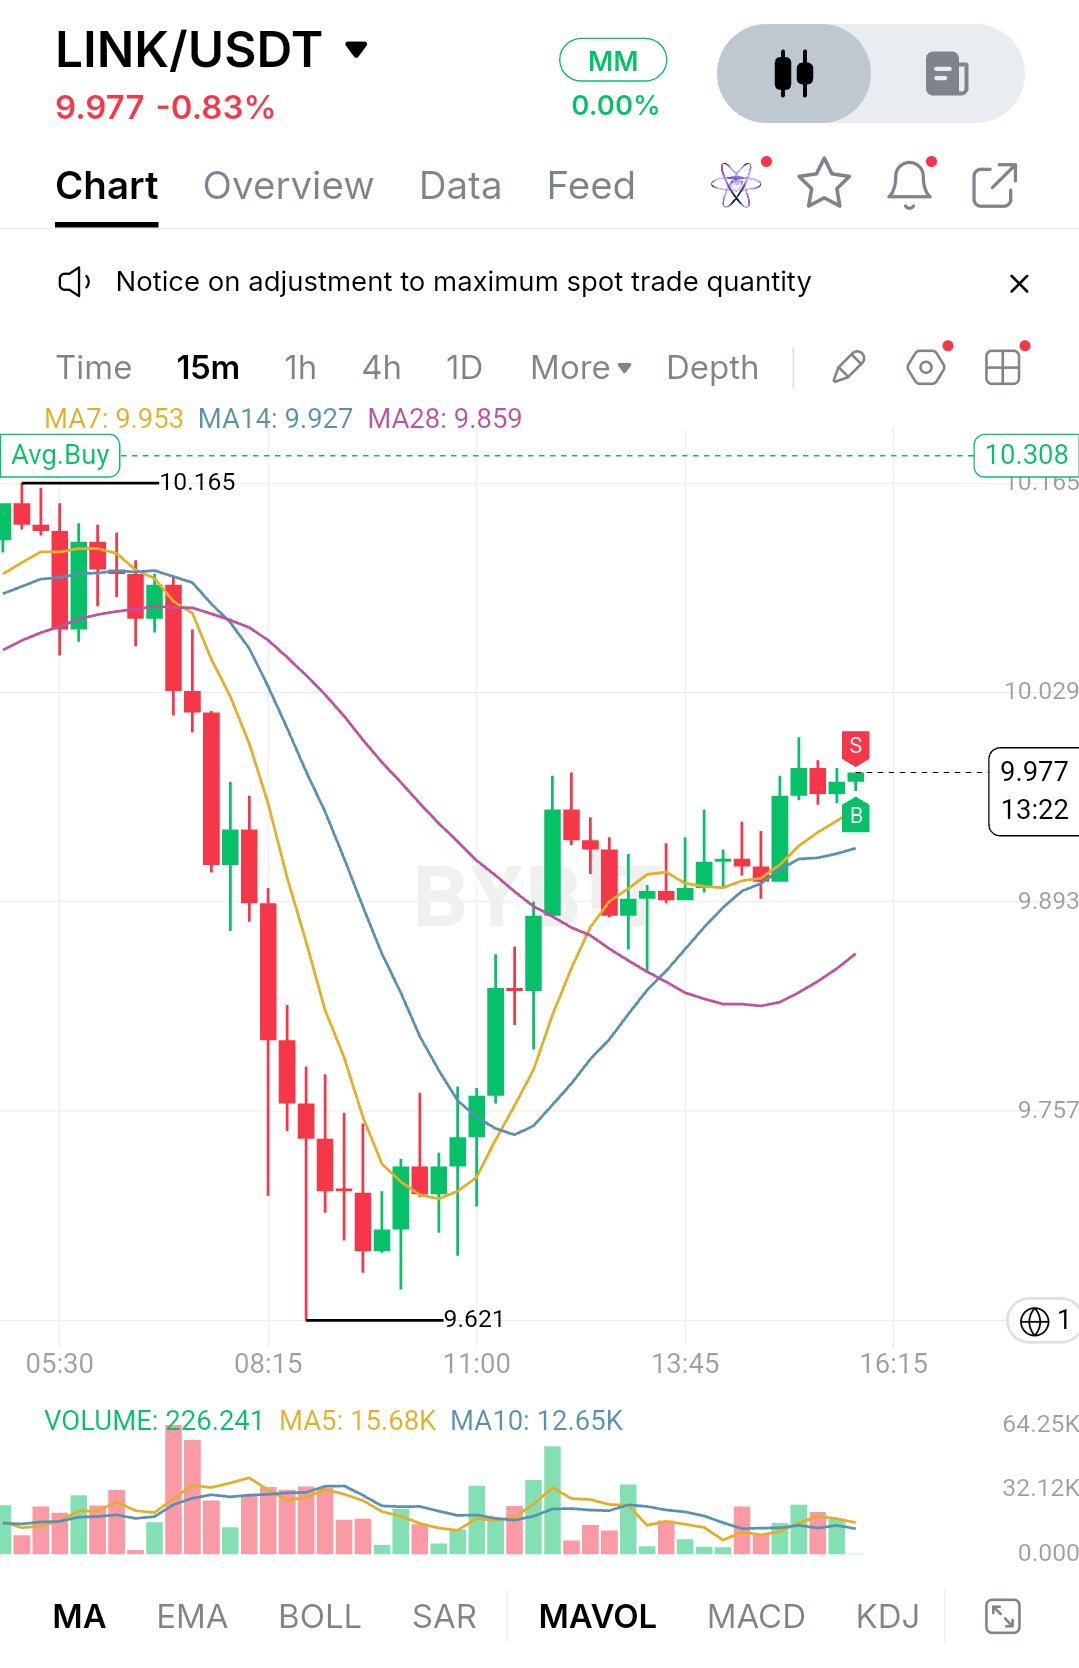
$LINKUSDT is trading around 9.977, down roughly 0.83% on the day. The move that defined the session was a sharp flush from the 10.165 area down to 9.621, where sellers pushed hard through the morning with a run of heavy red candles. That low drew in aggressive dip buyers, and the recovery since has been steady and surprisingly orderly. After the bounce, price has stopped chasing and started building. The rebound has retraced most of the drop, and the candles near the top are smaller, with a few wicks on both sides. That looks like a market digesting the recovery rather than running out of steam, but buyers haven't fully reclaimed the earlier breakdown zone either. Right now it reads as a recovery phase moving into a tight consolidation just under 10.029. On the chart, price sits above all three moving averages. MA7 is at 9.953, MA14 at 9.927 and MA28 at 9.859, stacked in a bullish order with price on top. The short averages have curled up and are tracking price closely, which shows momentum has shifted back to buyers, at least on this timeframe. The slower MA28 is still sloping gently upward after its long decline, so the broader trend hasn't fully turned. Volume tells a similar story. The heaviest bars came during the sell-off, and activity has cooled during the recovery, with the volume averages (MA5 around 15.68K, MA10 around 12.65K) drifting lower. A recovery on fading volume can stall, so a pickup in participation on the next push would add real confidence. For support, the first area is 9.953 to 9.927, where MA7 and MA14 sit just under price. Holding there keeps the short-term structure intact. Below that, 9.893 is a clear horizontal level on the chart and lines up closely with MA28 at 9.859, which makes the 9.86 to 9.89 band the most important pullback zone. If it holds on a retest, the higher-low structure stays valid. If it breaks, price likely revisits 9.757, and a loss of that level puts the 9.621 low back in play. On the upside, the nearest resistance is the psychological 10.00 mark, closely followed by the 10.029 level. Price has been pressing into this area, and the small red candle with a wick near the highs suggests sellers are active here. Above that, 10.165 is the major resistance and the high of the visible range, where the sell-off began. The bullish case is simple. Buyers need to hold the moving averages, push through 10.029 with a strong candle close and ideally rising volume, and then flip that level into support. A clean break would open the way to 10.165. A breakout above that would put price back above the entire range and weaken the case that the morning drop was anything more than a liquidity sweep. The bearish case starts with rejection at 10.00 to 10.029. If price fails there and slips below MA14 and then MA28, the recovery starts to look like a lower-high bounce inside a bigger downtrend. A break under 9.86 to 9.89 would confirm that shift, with 9.757 as the first target and 9.621 as the major downside level. **Key Price Levels** - Resistance: 10.00 (psychological), 10.029, 10.165 - Support: 9.953 / 9.927 (MA7 and MA14 zone), 9.893, 9.859 (MA28), 9.757 - Major low: 9.621 - Current price: 9.977 Overall, LINK has recovered well from the morning low, but it hasn't confirmed anything yet. The structure is constructive while price stays above the 9.86 to 9.89 zone, and the real test is whether it can clear 10.029 with conviction. Watch the volume on any breakout attempt and how price reacts to a pullback toward the moving averages. A strong close above 10.029 or a clean break below 9.86 will likely decide the next expansion. This is analysis, not a guarantee, so manage risk accordingly. $ETHUSDT#IMPACTbyTrade
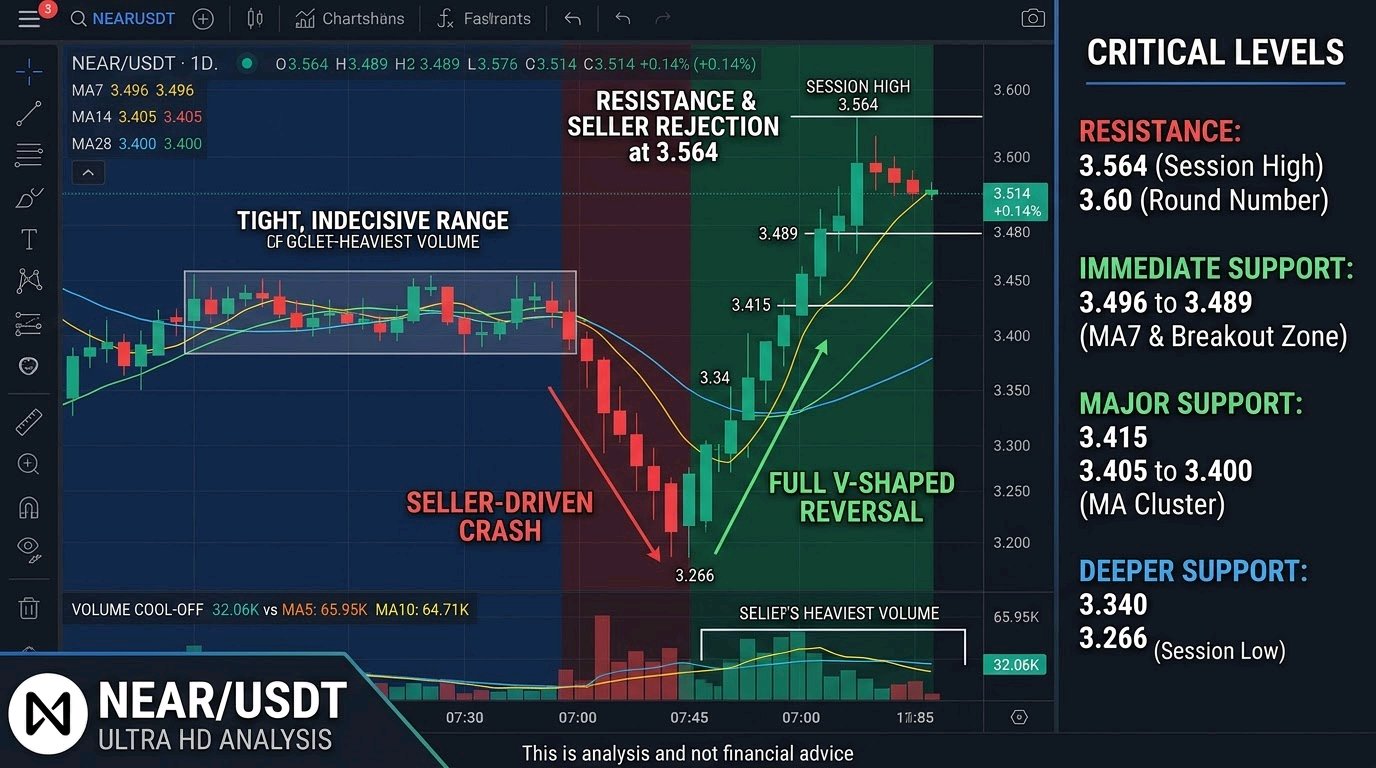
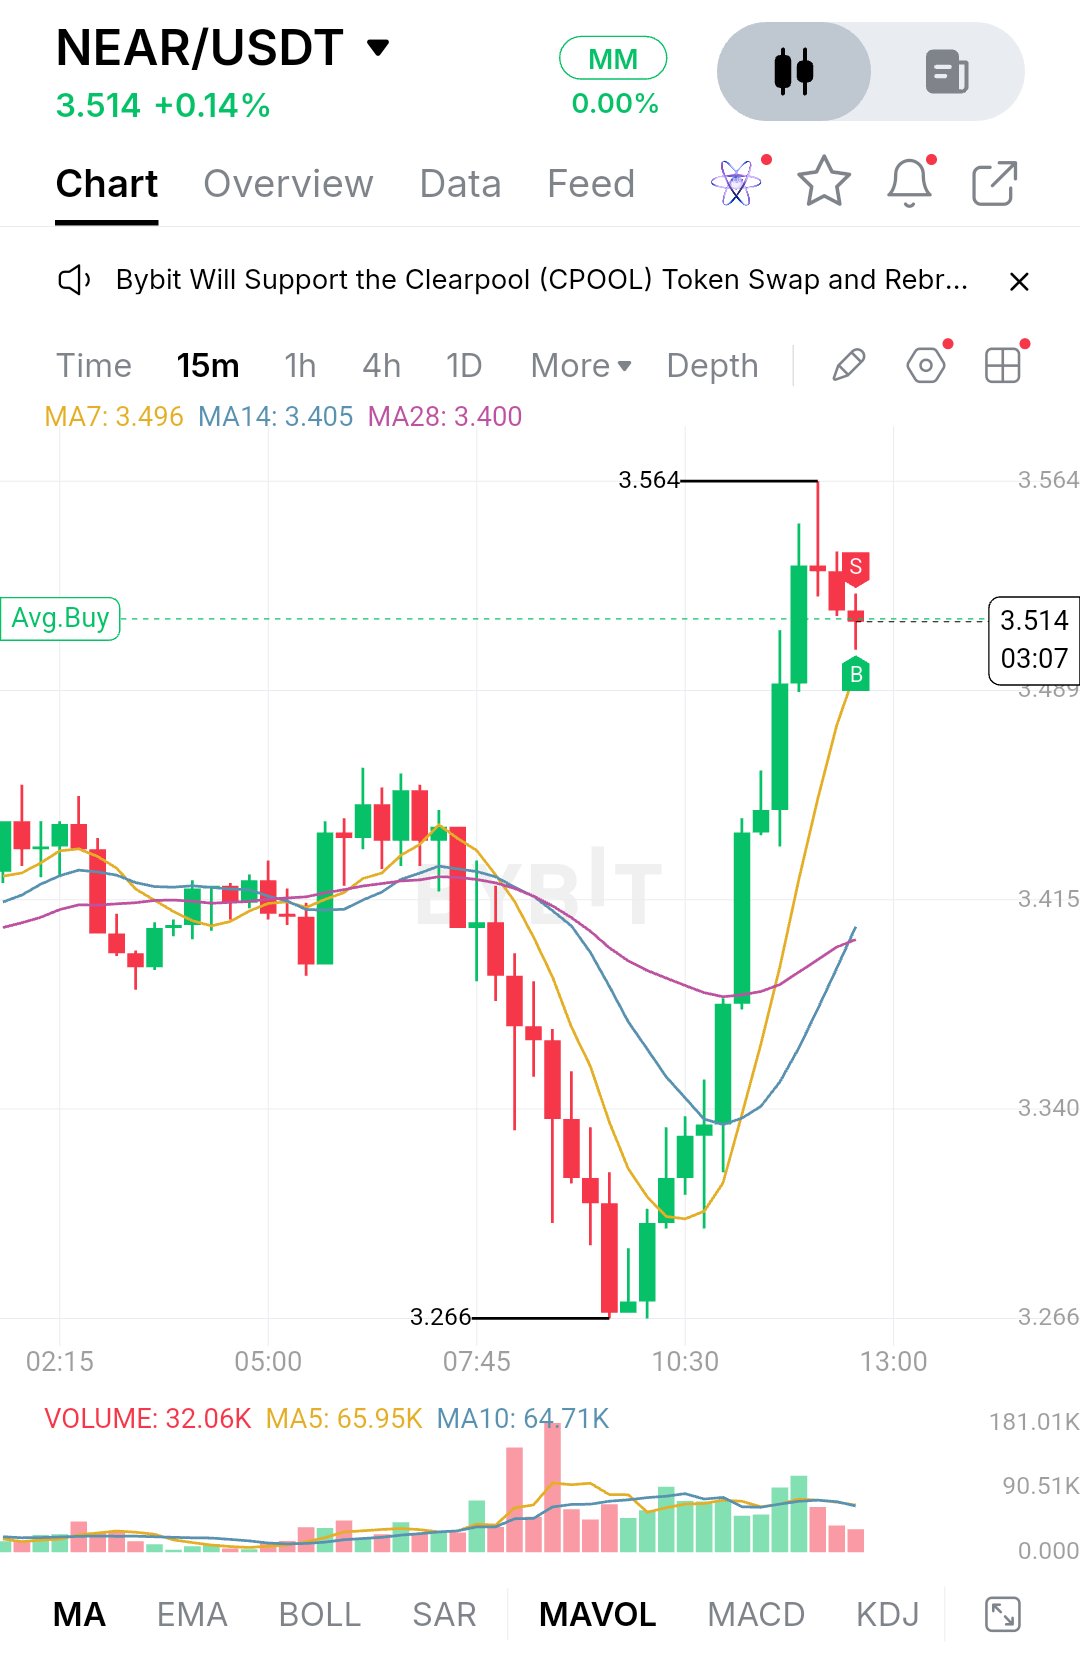
$NEARUSDT is trading at 3.514, up about 0.14% on the day. That flat number hides a pretty violent session. Price spent the morning drifting, then got hit hard by sellers, only to be bought back up with equal force. The first part of the session was a tight, indecisive range. From the early hours until roughly 07:45, candles kept overlapping around the 3.40 to 3.45 zone while the three moving averages tangled together, which is classic low-conviction behavior. Then sellers took control. A run of strong red candles pushed price down through the whole range, with the heaviest volume of the session printing on the way down. The low came in at 3.266, where the selling finally ran out of steam. What followed was the more interesting part. Buyers stepped in around that low and the recovery was fast: a string of strong green candles with rising volume carried price back through 3.34, 3.415 and 3.489, all the way to a session high of 3.564. That is a full V-shaped reversal. But the top of the move left a long upper wick at 3.564, which tells you sellers were waiting there, and the candles since have been small and mostly red as price settles back to 3.514. On the technical side, the structure has flipped from bearish to constructive. Price is now above MA7 (3.496), MA14 (3.405) and MA28 (3.400), and the short-term average has turned sharply upward. MA14 and MA28 are sitting close together just under the 3.415 area, so they now form a support cluster beneath the market. The weak spot is volume. The current bar shows 32.06K, well below the MA5 (65.95K) and MA10 (64.71K), so the push higher is cooling off. That's normal after a spike, but it means the next move needs fresh participation to be trusted. For support, the first area to watch is 3.496 to 3.489, where MA7 and the previous breakout zone overlap. If buyers defend it, the uptrend stays intact and this pullback looks like a pause. If it breaks, price likely slides toward 3.415, and below that the 3.405 to 3.400 cluster of MA14 and MA28 becomes the more important line. Losing that cluster would put the entire recovery in question and bring 3.340 and eventually the 3.266 low back into play. On the upside, resistance is clear at 3.564, the session high and the spot where sellers already showed up once. A clean break and hold above it would be the first real sign that the recovery is turning into a trend, and the round 3.60 figure is the natural next area to watch, since traders tend to react at psychological levels. The bullish case is straightforward. Buyers need to hold 3.489 to 3.496, rebuild volume, and then push through 3.564 with a decisive candle close rather than another wick. If that happens, continuation toward 3.60 becomes realistic. The bearish case starts with another rejection at 3.564, which would make it a potential double-top on this timeframe. Combined with weak volume, a break below 3.489 would suggest the move up was mostly a short squeeze and a retest of 3.415 and the moving average cluster would be likely. Key price levels: - Resistance: 3.564 (session high), then 3.60 (round number) - Immediate support: 3.496 to 3.489 (MA7 and breakout zone) - Major support: 3.415, then 3.405 to 3.400 (MA14 and MA28) - Deeper support: 3.340, then 3.266 (session low) Overall, NEAR has done the hard part by reclaiming its range and turning the short-term averages up, but it hasn't yet proven it can break the high it was just rejected from. Watch how price behaves around 3.49 and whether volume returns on the next push into 3.564. That reaction will say more about the next expansion than the small percentage change on the day. As always, this is analysis and not financial advice, so manage your risk accordingly. $BTCUSDT#IMPACTbyTrade
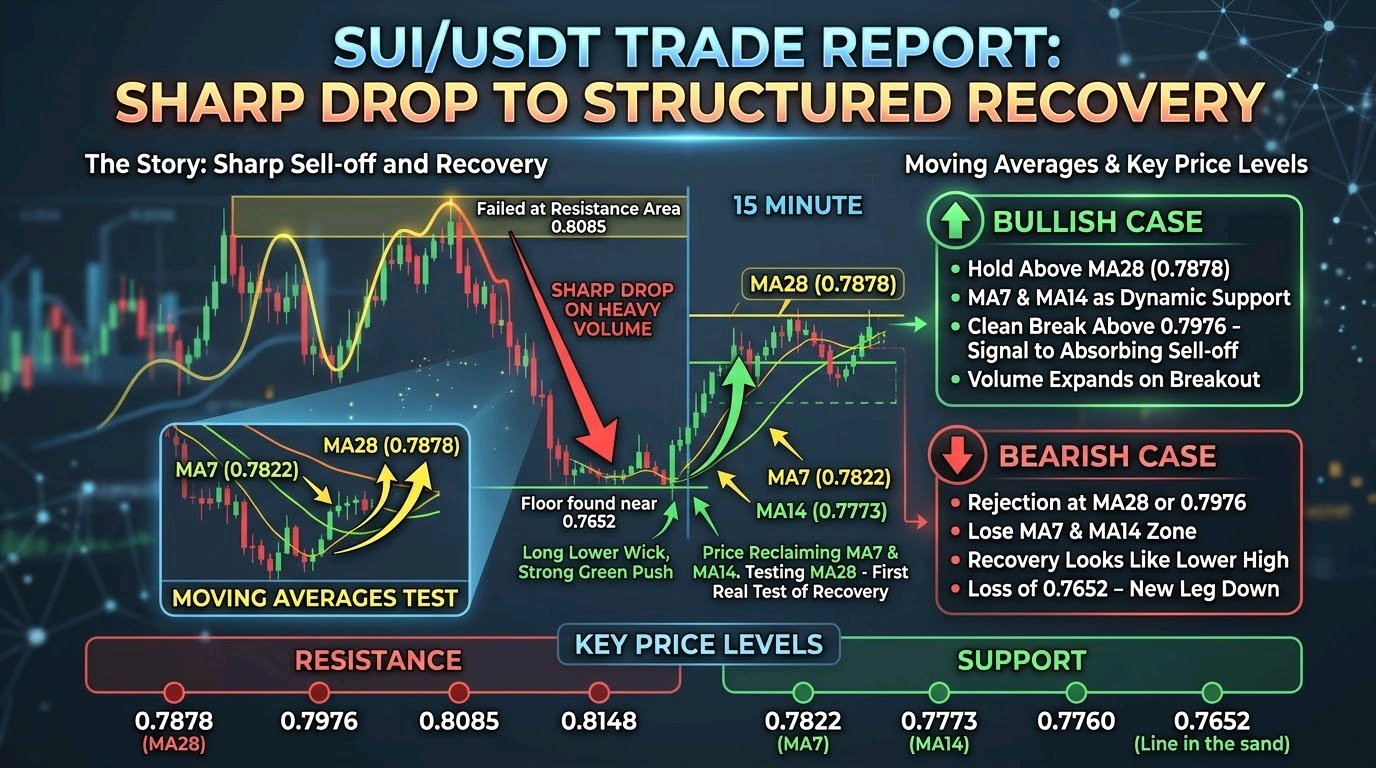
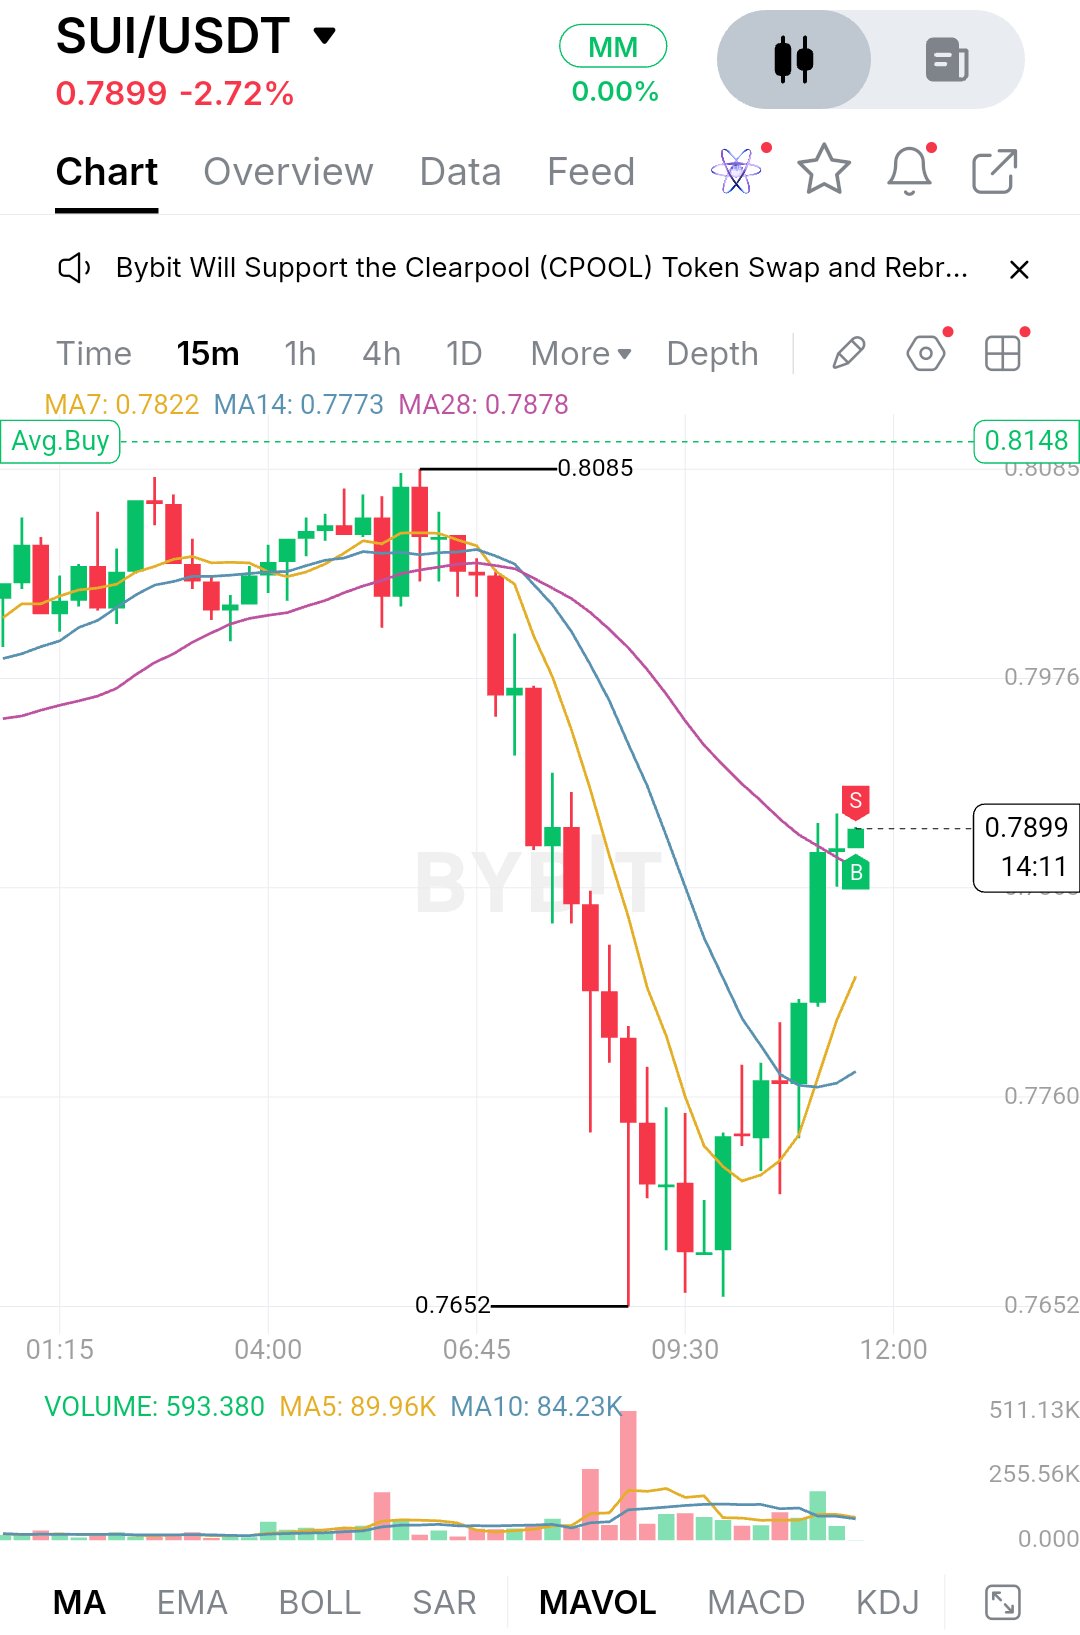
$SUIUSDTは0.7899付近で推移しており、本日2.72%安となっていますが、この数字にはもっと興味深いストーリーが隠されています。セッション開始時、価格は0.8085のエリアを試しましたが、そこで買い手が息切れし、売り手が主導権を握りました。その後に続いたのは一方的な急落で、価格は0.7652まで押し下げられました。その際の出来高バーは、このセッション全体で最も重いものでした。これは単なる緩やかな下落ではなく、本物の売りでした。 より重要なのは、その後に何が起きたかです。価格は安値圏で垂れ下がったり、揉み合ったりすることはありませんでした。0.7652付近で底を打ち、長い下ヒゲを形成した後、安値を切り上げながら力強い上昇を見せました。数時間のうちに、構造はきれいなダウントレンドから積極的な回復へと転じ、価格は下落分の大部分を取り戻しました。 15分足チャートでは、移動平均線が同じ物語を語っています。MA7は0.7822、MA14は0.7773、MA28は0.7878に位置しています。売りの局面では、価格はこれら3本の移動平均線を大きく下回り、平均線は下向きに並んでいましたが、これはトレンド相場の典型的な動きです。現在、価格はMA7とMA14を上抜け、MA28の上に位置しています。これが回復局面における最初の真の試練です。反発後に短期的な平均線を回復するのは容易ですが、最も遅行する平均線の上を維持できるかどうかが、単なる戻りか、短期的な主導権の真の転換かを見分ける分かれ目となります。MA7も鋭く上向いており、現時点ではモメンタムは明らかに買い手側にあります。 出来高についても触れておく必要があります。売り局面では出来高が急増しましたが、反発はより着実なもので、直近のバーは出来高平均(MA5:約89.96K、MA10:約84.23K)を上回っています。これは買い手が参加していることを示唆していますが、回復の勢いはまだ売りの強さには達していません。 サポートについては、最も近いゾーンはMA7とMA14が位置する0.7822から0.7773の領域です。もし価格が押し戻された場合、ここで再び買い手が登場する必要があります。ここで耐えれば、安値を切り上げるシーケンスが維持されます。その下では、チャート上でマークされている0.7760が次のラインとなり、本当の防衛ラインは0.7652の安値です。これを割り込めば回復の動きはすべて打ち消され、今回の反発が大きなダウントレンドの中での一時的な休止に過ぎなかったことが確定します。 上値については、当面のハードルはMA28の0.7878付近であり、価格は現在まさにそこを試しています。その上では、0.7976が次の明確な水準であり、ここはセッション序盤に市場が停滞した場所でもあります。さらにその先には、主要なレジスタンスである0.8085の高値があり、チャート上にマークされた0.8148のラインがそのすぐ上にあります。0.7976から0.8148までのこのクラスターは、売り手が一度防衛に成功している場所であるため、最も強い売り圧力が予想されます。 強気シナリオは極めて単純です。買い手は価格をMA28より上に維持し、押し目ではMA7とMA14を動的なサポートとして機能させ続ける必要があります。0.7976を明確に上抜けて維持できれば、売りが完全に吸収されたというシグナルとなり、0.8085再テストへの道が開かれます。その動きの中で出来高が減少せず拡大すれば、ブレイクアウトの信頼性は大幅に高まります。 弱気シナリオは、MA28または0.7976での拒絶から始まります。もし価格がそこで停滞し、MA7とMA14のゾーンを失えば、回復の動きは崩れた構造の下での「高値切り下げ(戻り高値)」のように見え始めます。そのシナリオでは、0.7760への回帰が現実味を帯び、0.7652を割り込めば、近くに支えとなるサポートがない新たな下落局面が始まるでしょう。 主要な価格水準: - レジスタンス:0.7878(MA28)、0.7976、0.8085、0.8148 - サポート:0.7822(MA7)、0.7773(MA14)、0.7760、0.7652 - 強気の確認:0.7878以上の維持、その後の0.7976の明確なブレイク - 弱気の確認:0.7773の喪失、その後の0.7652以下のブレイク 総じて、SUIは激しい売りから構造的な回復へと転じました。次の動きは、MA28と0.7976付近での価格反応次第です。日中の変動率(パーセンテージ)よりも、現在の構造の方がはるかに重要です。これらの水準以上で推移を維持できれば高値への次の拡大の準備が整いますが、拒絶されれば再び安値圏が視野に入ります。最初の押し目での値動きに注目してください。それが、反発を作ったローソク足そのものよりも、この反発の強さについて多くを物語るはずです。 $SOLUSDT#IMPACTbyTrade
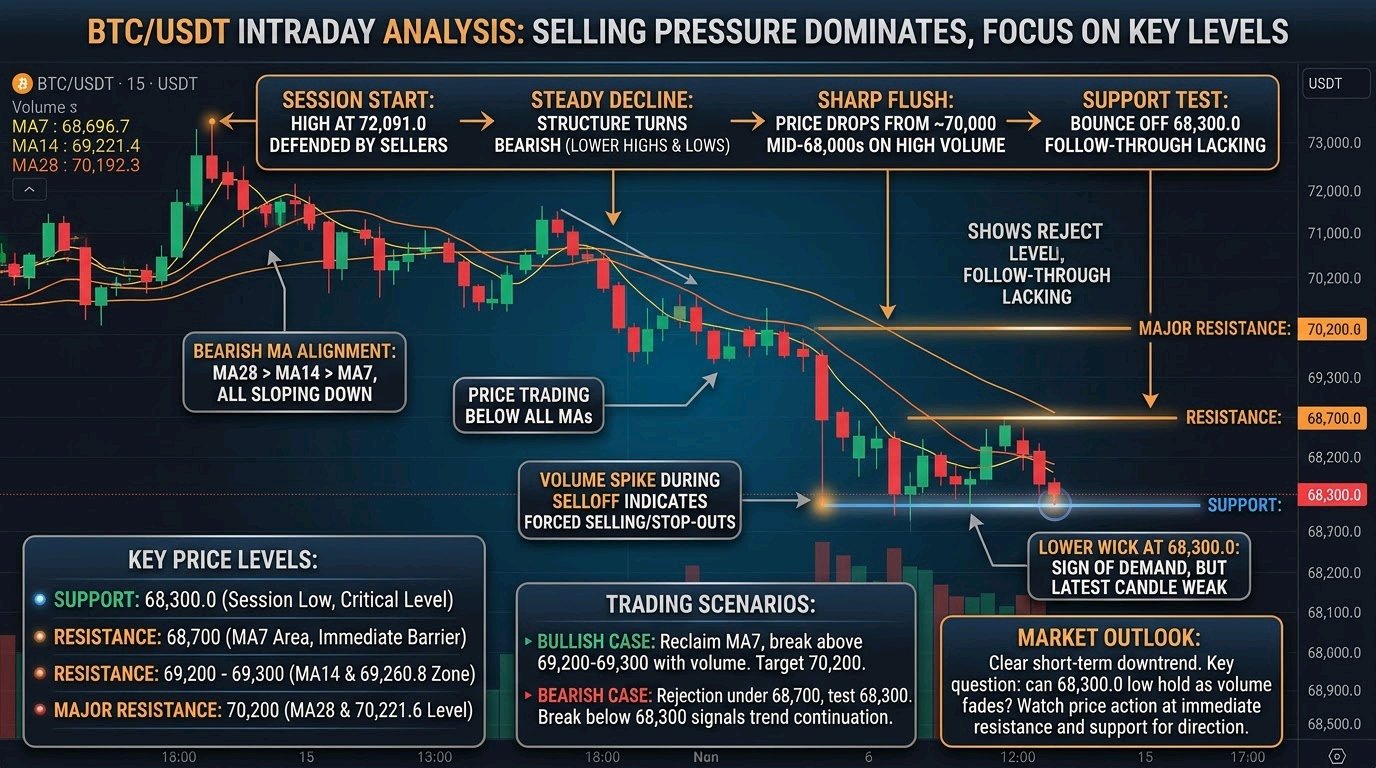
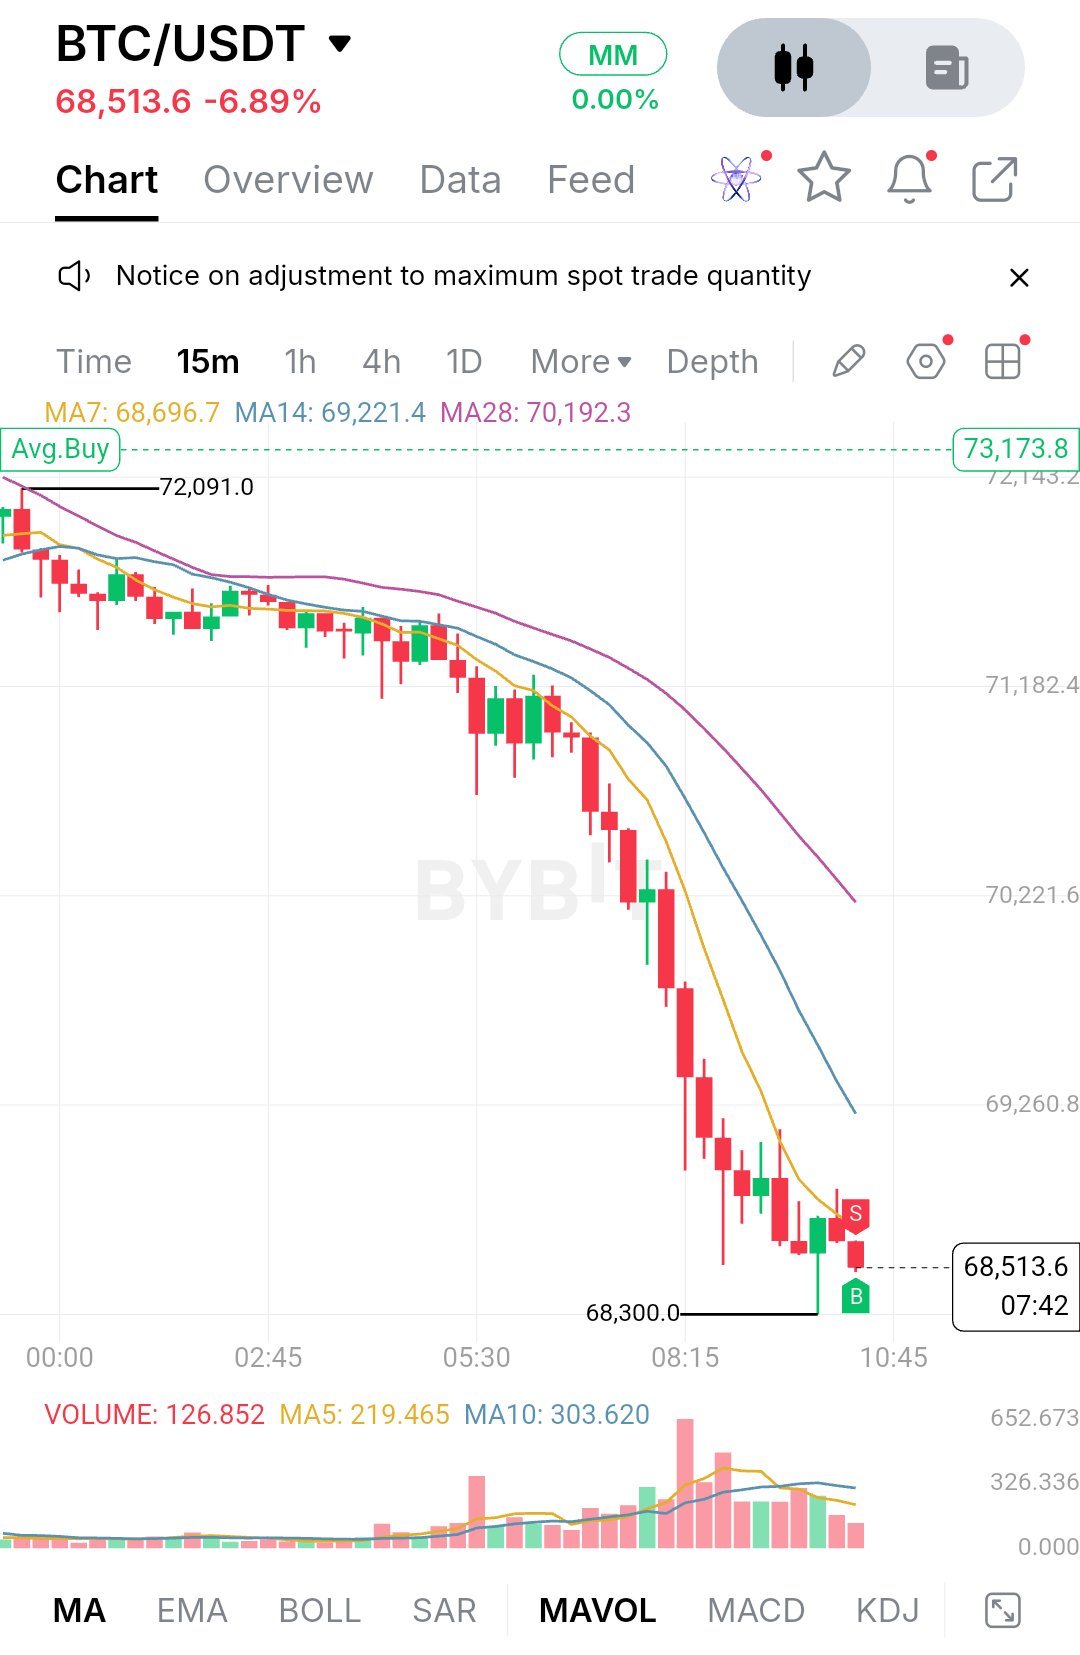
$BTCUSDTは68,513.6で取引されており、本日6.89%の下落となっています。チャートを見ればその状況は明らかです。セッション序盤、価格は72,000付近で推移しており、左端付近で72,091.0の高値を記録しました。そこで売り手が参入し、その後は手綱を緩めることはありませんでした。その後の展開は、緩やかな下落、セッション中盤の急激な投げ売りとなり、68,300.0に近づいて初めて買い手が現れました。 その高値以降、構造は明確な安値切り下げ(lower highs and lower lows)の連続となりました。動きの初期はゆっくりと抑制されており、小さなローソク足が移動平均線の下を漂う展開でした。その後、ペースが変化しました。大きな陰線の群れが価格を約70,000から68,000台半ばまで押し下げ、その過程で出来高が大幅に増加しました。このような出来高の急増は、静かなディストリビューション(売り抜け)というよりは、強制的な売りやストップロスを巻き込んだ動きを示唆することが多いです。68,300.0での反発は、長い下ヒゲを伴う単一の陽線でしたが、その後の追随はありませんでした。価格はその後再び陰線を形成し、安値圏で停滞しているため、これは確実な回復というよりは底値での一時停止のように見えます。 テクニカル分析の前に一点注意ですが、スクリーンショットは1時間足ではなく15分足チャートです。ここに表示されている情報のみで判断する必要があるため、EMA200、RSI、MACD、フィボナッチツールはこのビューにはなく、それらに関する測定値を捏造することはしません。チャートが示しているのは、MAセット(MA7が68,696.7、MA14が69,221.4、MA28が70,192.3)と、出来高およびその移動平均です。3本の移動平均線は完璧な弱気順(ベアリッシュ・オーダー)で並んでおり、最も速い線が一番下に、最も遅い線が一番上に位置し、すべて下向きに傾斜しています。価格は3本すべての下で取引されており、MA28と価格の乖離は大きく、動きがいかに引き伸ばされているかを示しています。MA7は価格に最も近く、少し平坦化していますが、上向きには転じていません。出来高に関して注目すべき点は、下落中に最大の棒グラフが現れ、直近の棒は細ってきていることです。これは、買い手が主導権を握ったわけではないものの、売り圧力自体は緩和していることを示しています。 サポート面では、最も重要なレベルはこれまでのセッション安値である68,300.0です。ここは唯一明確な反発のローソク足が形成された場所であり、すでに一度試されています。ここが再び維持され、価格が高値を切り上げ始めれば、リリーフ・バウンス(自律反発)の基盤となります。もしここを明確に割り込めば、特に出来高の増加を伴う場合、このチャート上にはそれ以下の構造が見当たらないため、価格は真空地帯に入り、さらなる大幅な下落の可能性があります。また、何も奪還できない弱い反発は、このレベルでの需要が薄いことを示すため、警戒信号となります。 レジスタンスはすぐ上の68,700付近のMA7から始まっており、直近のローソク足では価格がここで拒絶されています。次の層は69,200付近のMA14で、そのすぐ上にはチャート軸上の69,260.8の水平レベルが存在します。その後は、急激な売りが加速したゾーンであるMA28近辺の70,200および70,221.6のレベルが続き、価格が戻った場合には供給源となる可能性があります。さらに上では、71,182.4のレベルとセッション高値の72,091.0が、以前売り手が防衛した広いレンジを形成しています。 強気シナリオとしては、まず買い手が68,300.0を維持し、MA7を奪還した上で、MA14と水平レベルが重なる69,200から69,300を突破する必要があります。そのゾーンを上回って引ければ、売り構造が弱まっている最初の兆候となります。そこから70,200が自然なターゲットとなり、それを超えて初めて71,182.4が再び視野に入ります。理想的には、現在見られるような薄い参加者ではなく、陽線の出来高増加を伴う上昇が望まれます。 弱気シナリオはより単純です。もし価格が68,700以下で拒絶され続け、MA7が再び下を向けば、売り手が主導権を維持し、68,300.0の再テストが行われる可能性が高いです。これを決定的に下回れば、トレンドの継続が確定し、チャート上のサポートがない新たな安値へと価格がさらされることになります。69,200から69,300のゾーンへの弱い反発が売りに転じれば、それもまた下降トレンドを補強することになります。 重要な価格レベル: サポート: 68,300.0(セッション安値および反発ポイント) 直近のレジスタンス: 68,700(MA7エリア) レジスタンス: 69,200〜69,300(MA14および水平レベル) 主要レジスタンス: 70,200(MA28および70,221.6レベル) 上方レンジ: 71,182.4および72,091.0(セッション高値) 全体として、ビットコインは明確な短期下降トレンドにあり、大きな疑問は売り手が勢いを失う中で68,300.0の安値を維持できるかどうかです。下落は急激で、出来高は沈静化しており、移動平均線は価格よりも遥か上にあり、これはしばしば底固めか反発につながるセットアップですが、現時点ではどちらも確認できていません。68,700および69,200付近での価格の動きに注目してください。出来高を伴う奪還は構造変化の最初の兆候となり、一方で68,300.0の喪失はさらなる下落拡大の扉を開くことになります。いつものことですが、これらは保証ではありません。リスクを管理し、ポジションを取る前に価格の動きを確認するようにしてください。 $ETHUSDT#IMPACTbyTrade
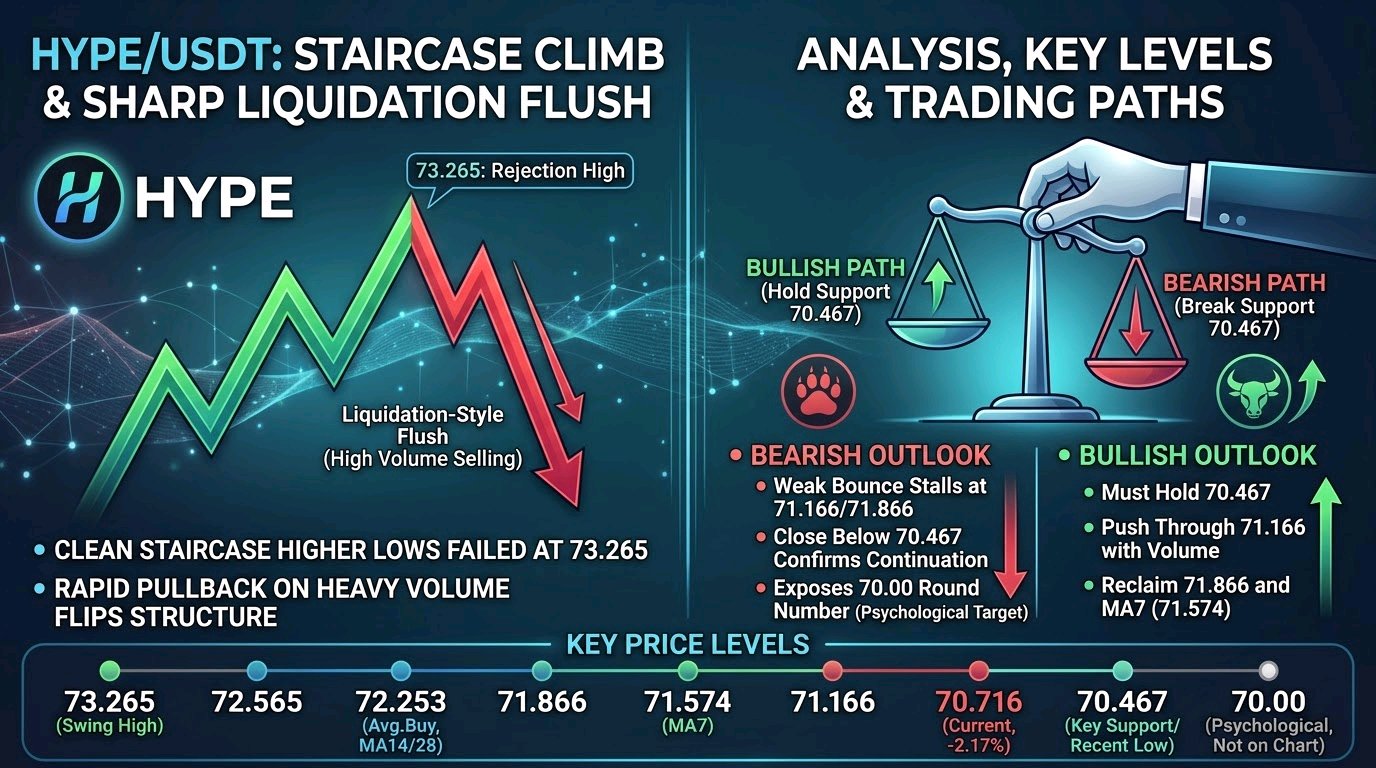
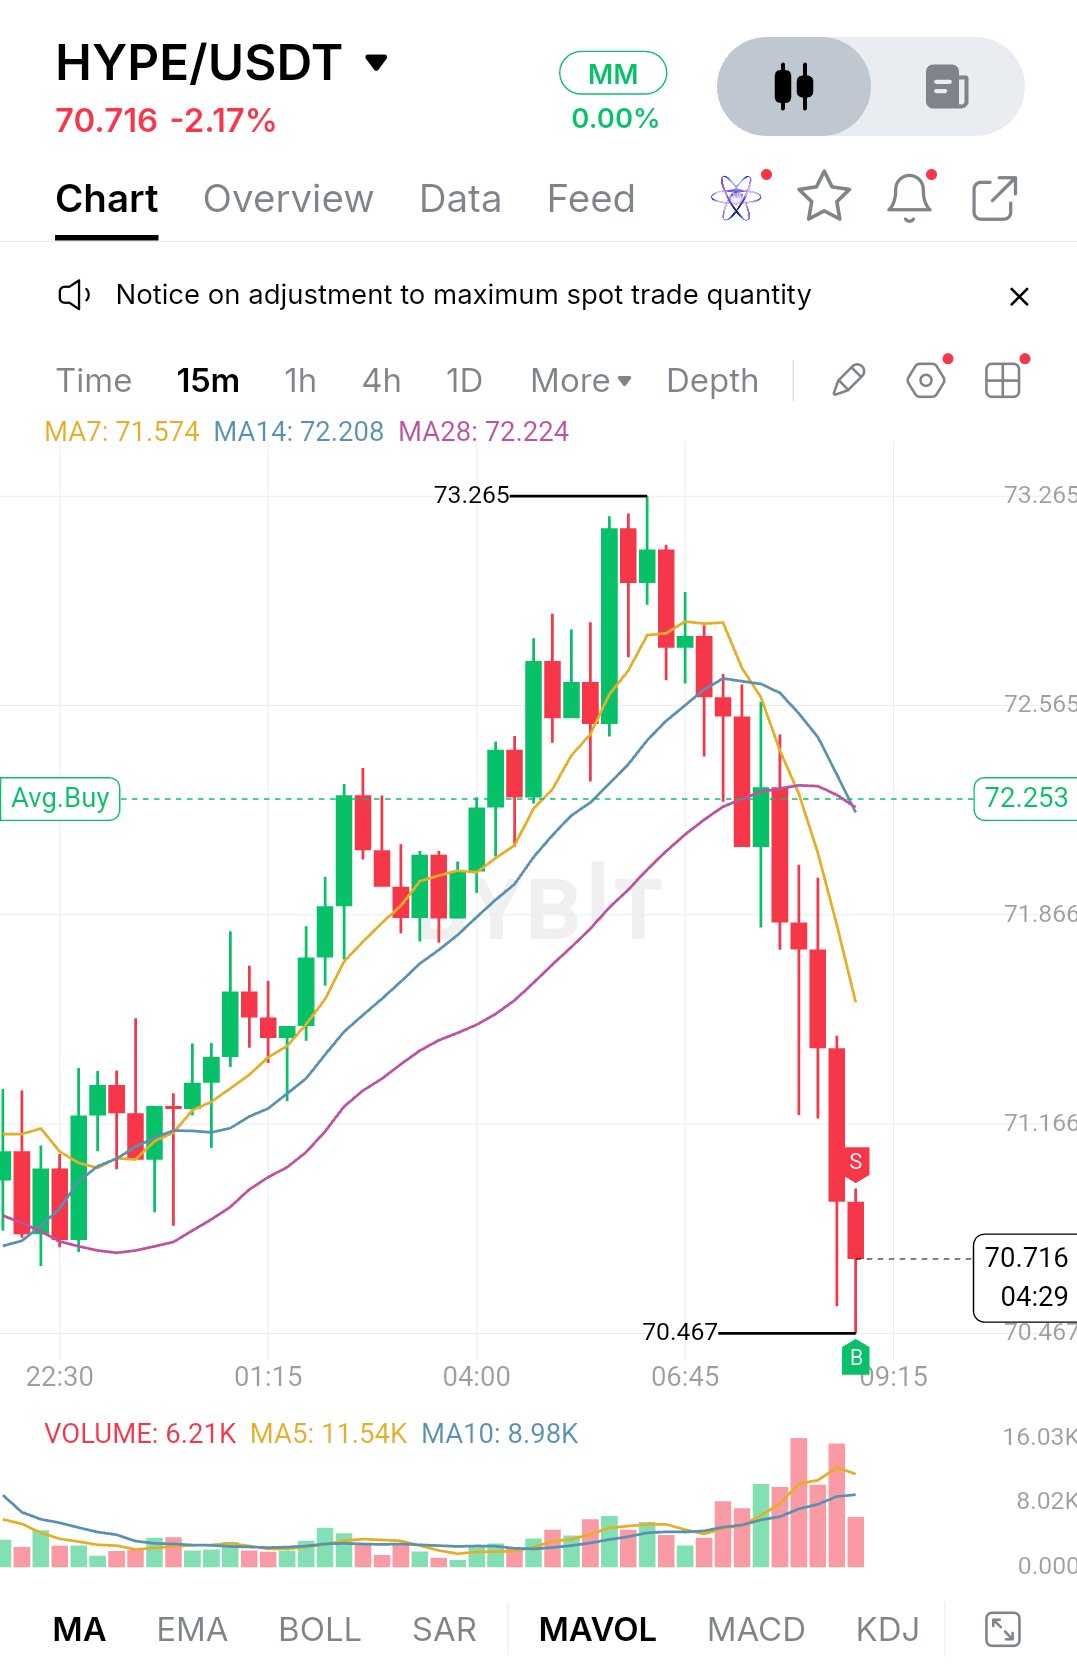
$HYPEUSDTは70.716で推移しており、本セッションでは2.17%下落しています。しかし重要なのは、この数値に至った過程です。買い手は22:30のエリアから着実に価格を押し上げ、73.265にタッチするまで、安値を切り上げるきれいな階段を形成しました。しかし、その高値は維持できませんでした。トップで売り手が参入し、方向感のないローソク足がいくつか形成された後、市場は数時間で上昇分のほぼ全てを吐き出しました。 構造はトレンド相場から調整局面へと転換しました。73.265での拒絶の後、価格は3つの移動平均線すべてを割り込み、その後、大きな陰線の連続と意味のある反発がほとんどない状態で、さらに下落が加速しました。これは緩やかな下落ではありません。まるでリクイデーション(強制清算)を誘発するような急落であり、出来高がそれを裏付けています。ボリュームパネル上の最大のバーは、平均出来高を大きく上回る最も激しい売りと一致しています。直近のローソク足は、MA5の11.54Kに対して6.21Kしか示しておらず、売り圧力は落ち着きつつありますが、このローソク足はまだ形成中であり、深読みすべきではありません。 インジケーターを見ると、移動平均線(MA)が明確に状況を示しています。MA7は71.574、MA14は72.208、MA28は72.224に位置しています。短期線が長期の2本を大きく下回り、価格はすべての上にある状態です。14と28は密集して転換し始めており、72.2エリアは単一のラインというよりも、積み重なったレジスタンスゾーンとなっています。72.253のAvg.Buyラインはその真ん中に位置しており、早い段階で押し目買いをした人々にとって有用な基準となります。 最初のサポートは70.467の安値で、ここで長い下ヒゲが形成されました。このヒゲは買い手が確かに存在したことを示していますが、一度の拒絶だけでは底とは言えません。70.467が再テストで維持され、ローソク足がレンジ内に戻り、出来高が抑えられたまま推移すれば、そこが反発のフロアとなる可能性があります。もし明確に割り込めば、このチャート上にそれ以下の目立った構造がないため、価格は未知の領域に入ることになります。70.00のキリの良い数字は、反応が起こりそうな明白な心理的節目ですが、これは一般的なレベルであり、チャート上にマークされているものではありません。 上値では、最も近いレジスタンスは71.166、続いて71.866です。これらは下落中に以前の保ち合いが発生した水準であるため、売り手がここを防衛することが予想されます。より重要な障壁は、MA14、MA28、Avg.Buyラインがすべて収束する72.2から72.565のゾーンです。それを超えると、73.265がスイングハイとなり、この調整局面全体を無効にするために突破しなければならないレベルとなります。 ブル派にとっての仕事は、一歩ずつ再構築することです。まず、70.467を維持し、実質的な出来高を伴って71.166を押し返す必要があります。71.866を奪還できれば、価格はMA7の近くに戻り、72.2のクラスターに向かう道が開けます。そのクラスターを上回る終値を付けて初めて、この下落がトレンド転換ではなく一時的なフラッシュ(急落)であった可能性が示唆され、72.565、そして73.265が再び視野に入ってきます。 ベア派にとって、最もクリーンなセットアップは、71.166または71.866で停滞し、下降するMA7の下で反転するような弱い反発です。そうなれば、今回の急落は単なる一服であったことが示されます。70.467を下回る終値は下落トレンドの継続を裏付け、70.00エリアを露呈させることになるでしょう。それ以下のチャートレベルがないため、さらなるターゲットは推測の域を出ず、価格の動きに任せるのが賢明です。 主要な価格水準: - 73.265: スイングハイ、調整局面の完全な無効化水準 - 72.565: 上値レジスタンス - 72.253: Avg.Buyライン(MA14/MA28クラスター内、約72.2) - 71.866: レジスタンス - 71.574: MA7(ダイナミックレジスタンスとして機能) - 71.166: 反発時の最初のレジスタンス - 70.716: 現在価格 - 70.467: 主要サポート、直近安値 - 70.00: 心理的なキリの良い数字、チャート上には未記載 全体として、HYPEは明確な拡大局面から、出来高を伴う急激な調整局面へと移行しました。次の動きは、70.467周辺でどのような挙動を見せるかにかかっています。静かな維持から71.166を奪還できれば、買い手が主導権を取り戻しつつある最初の兆候となります。下方にブレイクすれば、市場の調整はまだ終わっていないことを意味します。いずれにせよ、ローソク足のサイズよりも、それらのレベルでの反応と、その背後にある出来高に注目してください。これは投資助言ではなく、ポジションを取る前に確認を待つ価値があります。 $BTCUSDT#BybitAI進化中