MAYA_
7305いいね1シェア443ファン398フォロー
I am MAYA_ 👉 Spot, Futures And Alpha Trading Market Analyst 💫🫰
I am MAYA_ 👉 Spot, Futures And Alpha Trading Market Analyst 💫🫰
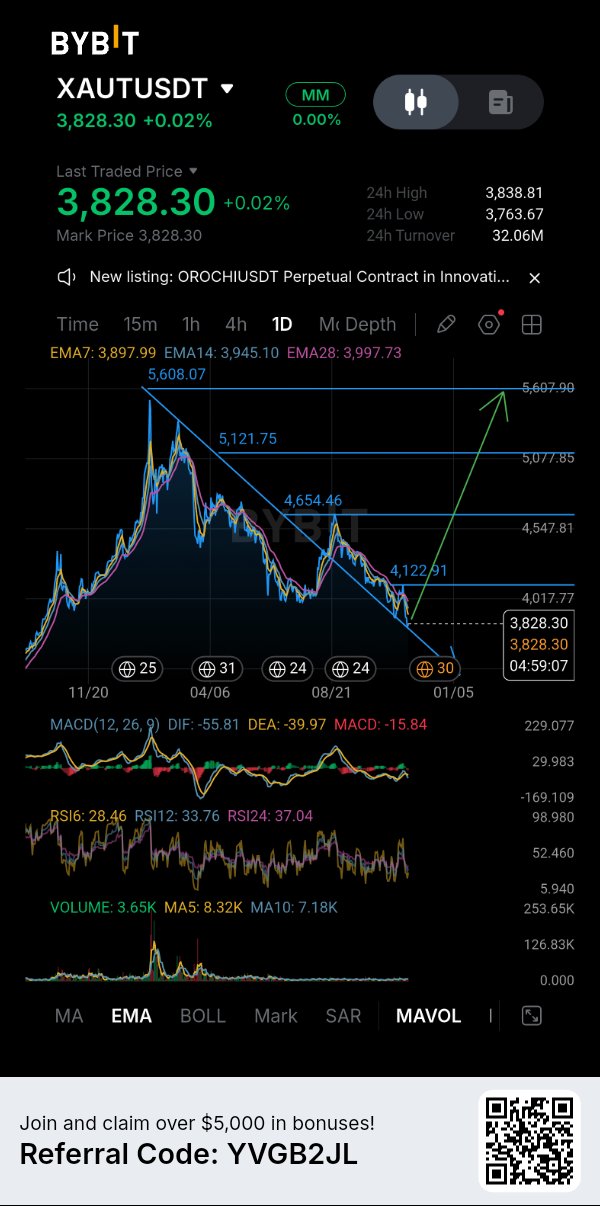
XAUT /GOLD 👉 押し目買いのチャンス 🚀
$XAUT 最新情報 : 金(ゴールド)の勢いは低下していますが、回復の余地はまだ残されているかもしれません。 $XAUTUSDT は現在3,828ドル付近で取引されており、日足チャートには明らかな弱気の兆候が見られます。全体の構造は下落基調にあり、直近の高値である5,608ドル付近から、安値を切り下げ高値を切り下げる動きが続いています。しかし、現時点で回復の可能性を完全に否定すべきではないと考えています。価格は短期的に重要なエリアに近づいており、強い方向性の仮定を立てる前に、買い手がどう反応するかを見極めたいところです。 日足の市場構造📊 最も顕著な問題は、XAUTが依然として3つの主要なEMA(指数平滑移動平均線)の下で推移していることです。 EMA7は3,897.99ドル、EMA14は3,945.10ドル、EMA28は3,997.73ドルとなっています。この並びは、少なくとも日足の時間軸において、売り手が依然として優勢であることを示しています。下降トレンドラインも引き続き重要な障害となっています。価格がこのラインを明確に上抜けし、より強固な構造を確立するまでは、回復が確定したとは考えにくいでしょう。 RSIと出来高: RSIの数値には注目する価値があります。RSI6は28.46、RSI12は33.76、RSI24は37.04です。短期RSIはすでに売られすぎの領域にあり、これが自律反発の余地を生む可能性があります。ただし、売られすぎという条件だけでは、反転を保証するものではありません。 MACDも依然としてマイナス圏にあり、DIFは-55.81、DEAは-39.97です。ヒストグラムはゼロラインの下に留まっており、弱気なモメンタムが完全には消えていないことを示唆しています。 出来高は現在3.65Kで、MA5(8.32K)およびMA10(7.18K)を下回っています。持続的な回復を信頼する前に、より力強い買いの参加を確認したいと考えています。 強気のシナリオ🟢 まず確認したいのは、買い手が直近の安値である3,763.67ドル付近を守りきれるかどうかです。もしこのエリアがサポートされ、価格がEMA7(3,898ドル付近)を奪還し始めれば、次の重要な回復ターゲットは3,945ドルおよび3,998ドルとなります。EMAのクラスターを明確に上回り、その後に下降トレンドラインをブレイクできれば、日足の見通しは改善するでしょう。それを超えれば、4,122.91ドルが重要なレジスタンスラインとして浮上します。 弱気のシナリオ🔴 もし買い手が3,763.67ドルを守れなければ、さらなる下落が可能となります。その状況では、単にRSIが売られすぎだからといって飛びつくことはしません。価格が安定し、実際に勢いの変化が見られるまで待つべきでしょう。 XAUTを保有しているトレーダーの方へ🎯 個人的には、3,898ドルから3,998ドルの回復ゾーンに細心の注意を払うべきだと考えています。もし価格がこのエリアに到達した場合、エントリー価格やポジションサイズに応じて、一部利益確定を検討する価値があるかもしれません。5,608ドルへの大規模な回復が保証されているとは考えない方が良いでしょう。それはチャート上に示された可能性の一つであり、確定したターゲットではありません。 リスク管理⚠️ 直近の安値である3,763.67ドルは、私が注視している当面のラインです。これを下回れば、短期的な回復シナリオは弱まります。確認なしの反発は信頼できるエントリーとは言えません。エントリー、損切り、リスクリワード比はエントリー前に設定し、ポジションサイズはリスクに見合ったものにすべきです。 全体的な見解: XAUTは弱さを見せていますが、売られすぎのモメンタムが、買い手が最終的に参入してくれば機会を生む可能性があります。私は正確な底を当てようとするよりも、確認が取れることに重きを置いています。 あなたは3,898ドルを超えた時点での回復狙いの買いを検討しますか?それとも下降トレンドラインの確定的なブレイクを待ちますか? #ByXIMPACT #WSOT2026 #WSOTあなたのAI取引を見せて10USDTを獲得 #ジェンスン・ファン、NvidiaのAIリーダーシップを試す出口戦略 #米PPIが「高金利長期化」取引を試す

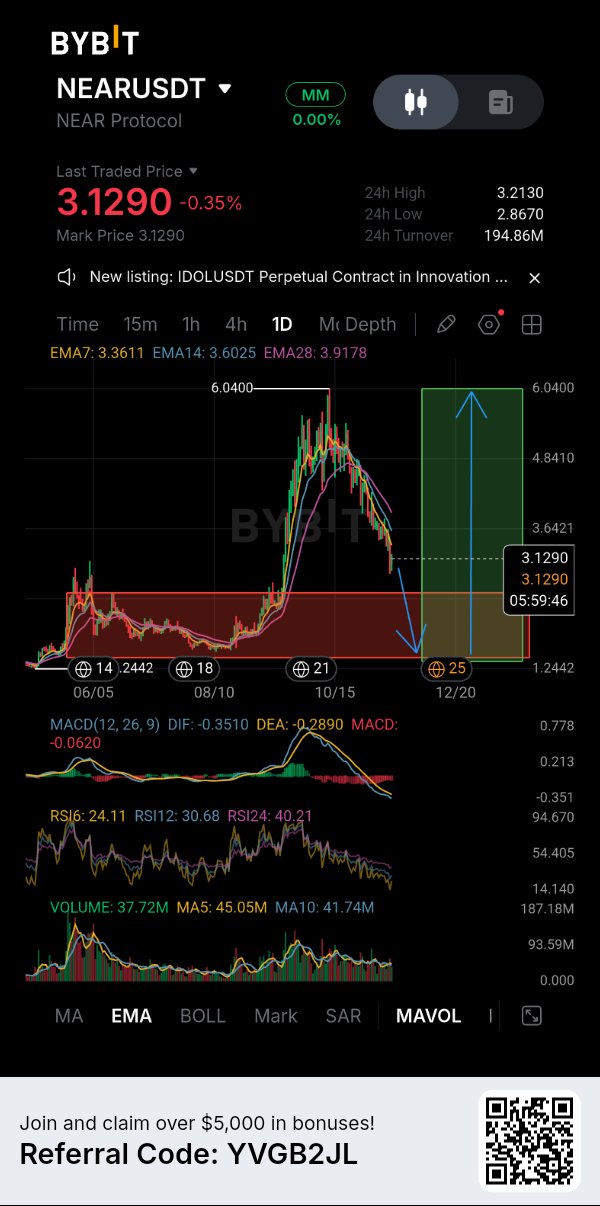
NEAR現物買い 🟢 絶好のチャンス
$NEAR 緊急アップデート:ダウントレンドが深まっていますが、より大きなチャンスを注視しています💯 $NEARUSDTは現在3.129ドル付近で取引されており、日足チャートは明確な弱さのサインを示しています。6.04ドルに向けた力強いラリーの後、価格は徐々に勢いを失い、売り手が主導権を握っています。最も懸念しているのは、$NEARが現在、表示されている3本のEMA(指数平滑移動平均線)をすべて下回っていることです。EMA 7は3.3611ドル、EMA 14は3.6025ドル、EMA 28は3.9178ドルです。この弱気な並びは、回復が確実なものになるまで、買い手がまだやるべきことが残っていることを示唆しています。 MY BYBIT 👉 日足チャートが示していること📊 RSIも重要なポイントです。RSI 6は24.11、RSI 12は30.68、RSI 24は40.21です。短期的なモメンタムは明らかに売られすぎの領域に達しています。 一方、MACDは依然としてマイナス圏にあり、DIFは-0.3510、DEAは-0.2890です。ヒストグラムもゼロを下回っています。 そのため、リリーフバウンス(自律反発)の可能性はあるものの、売られすぎの状態をトレンド反転の確証と混同しないようにしたいところです。 注目している2つのシナリオ🟢🔴 強気シナリオ🟢 まず、$NEARが現在の安値圏を守り、買いの強さを確立するのを確認したいです。最初に注目している回復エリアは3.36ドル付近で、その次はEMAが位置する3.60ドルおよび3.92ドルです。これらのレベルを奪還できれば、日足構造は徐々に改善していくでしょう。より強力な回復が実現すれば、以前のスイングハイである6.04ドルが再び視野に入る可能性がありますが、それは直近のターゲットではなく、あくまで大きな可能性としての話です。 弱気シナリオ🔴 売り手が価格を押し下げ続けた場合、直近24時間の安値である2.867ドル付近が重要な参考ラインとなります。これを維持できずに下抜けた場合、1.24ドル付近に見られるより広範な歴史的サポート領域が試される可能性があります。チャートの注釈にも、より大きな回復の前にさらなる深い調整が起こる可能性が示されています。ただし、その予測を現実的なトレード戦略として扱う前に、実際の価格の確認が必要です。 $NEARを既に保有しているトレーダーへ🎯 RSIだけで判断するのは避けた方が良いでしょう。価格がEMAのレジスタンス帯に向かって回復し始めた場合、個々のエントリー価格に応じて一部利益確定を検討する余地があります。ポジションを拡大しようとしている人は、弱気相場が続く中で盲目的にナンピン(平均コストを下げていく買い増し)するよりも、回復が確認されるのを待つことをお勧めします。 リスク管理⚠️ 2.867ドルのエリアは、直近の日足安値として注目に値します。ここを割り込むと、下落圧力が強まる可能性があります。確認なしの反発は信頼できるエントリーではありません。流動性ゾーンだからといって、自動的に買いの機会になるわけでもありません。エントリー、ストップロス、ポジションサイズ、リスクリワードをすべて考慮した上でトレードを行うべきです。 私の最終的な考え🤔 私は依然として$NEARの大きな回復の可能性を感じていますが、現在の日足構造はまだ強気とは言えません。下落している相場に急いで飛び込むよりも、買い手が力を証明するのを待つ方が賢明だと考えます。弱い相場において資産を守ることは、時に最良のトレードとなります。 皆さんは現在の価格で$NEARを積み増していますか?それとも、さらなる調整を待ってからエントリーを検討していますか? #IMPACTbyTrade #WSOT2026 #WSOTあなたのAI取引を見せて10USDTを獲得 #ジェンスン・ファン、NvidiaのAIリーダーシップを試す出口戦略 #米PPIが「高金利長期化」取引を試す

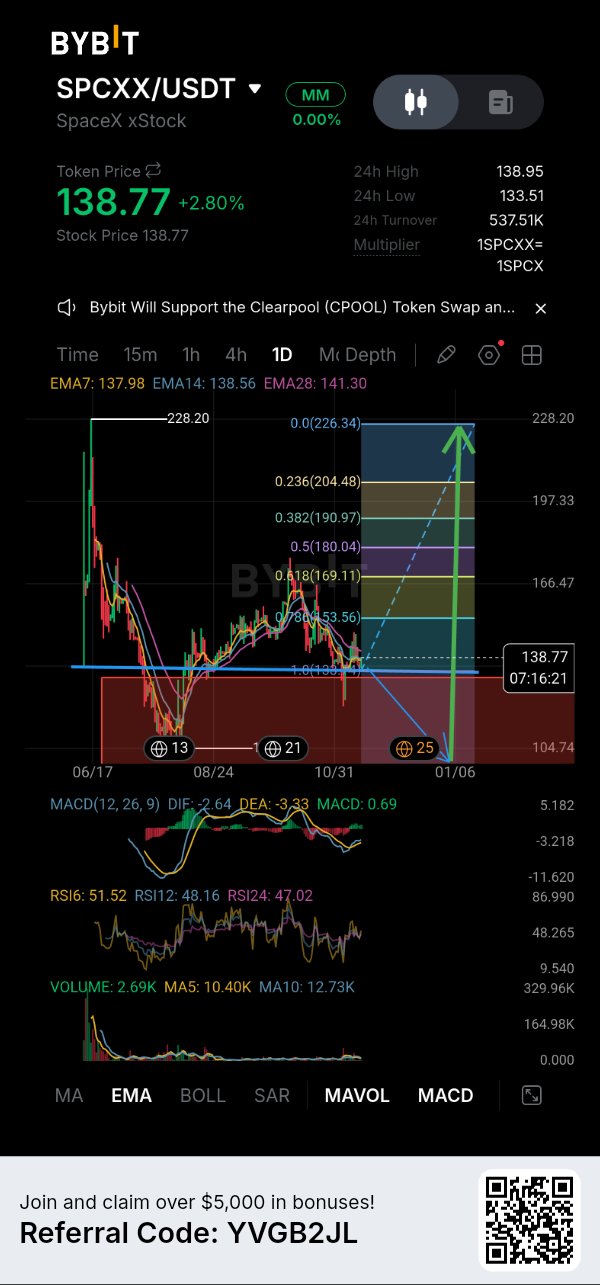
$SPCXX UPDATE 🚀
PRICE IS DEFENDING A CRITICAL SUPPORT ZONE, BUT THE BIGGER RECOVERY IS NOT CONFIRMED YET $SPCXXUSDT is currently trading around $138.77, up approximately 2.80%, and I'm paying close attention to how price behaves around this area. After the massive move toward $228.20, the chart went through a significant correction. We then saw a recovery, followed by another rejection and a gradual move back toward the lower support region. Now price is trying to stabilize around the $133–$139 area. This is an important region because it sits near the visible Fibonacci baseline and the recent price structure. Here's what I'm watching 👀 1. DAILY TECHNICAL STRUCTURE The chart is currently showing a mixed picture. Price is trading above EMA7 ($137.98) and EMA14 ($138.56), which suggests some short-term recovery. However, EMA28 remains higher at $141.30. That means buyers have made some progres but they still need to reclaim the longer EMA before I become more confident about a sustained recovery. RSI readings are also relatively neutral RSI6: 51.52 RSI12: 48.16 RSI24: 47.02 Momentum is improving slightly, but this is not an overbought breakout signal. MACD is showing a positive histogram reading of 0.69, while DIF (-2.64) and DEA (-3.33) remain below zero. This suggests early momentum improvement rather than a fully established bullish trend. One thing I don't want to ignore is volume. Current volume is 2.69K, below both MA5 (10.40K) and MA10 (12.73K). So far, the recovery does not have convincing volume confirmation. 2. BULLISH AND BEARISH SCENARIOS🟢🔴 BULLISH SCENARIO If buyers continue defending the $133–$139 region and price reclaims $141.30, I would start watching for a stronger recovery. visible Fibonacci levels provide the next upside reference points: $153.56 – 0.786 Fib $169.11 – 0.618 Fib $180.04 – 0.5 Fib $190.97 – 0.382 Fib A sustained move above these levels could gradually improve the broader structure. The larger chart also shows $204.48 and $226.34 as higher Fibonacci reference levels. However, these are potential recovery targets, not confirmed price destinations. BEARISH SCENARIO if price loses the $133 area and fails to reclaim it, the current recovery attempt could weaken. The chart highlights a broader lower region around $104.74. A deeper move toward that area cannot be ruled out if selling pressure increases. I would rather wait for price confirmation than assume every dip is an opportunity. 3. FOR TRADERS ALREADY HOLDING SPCXX I wouldn't approach this as an all-or-nothing decision. If price starts recovering toward $153.56, taking partial profits could be worth considering, depending on individual entry prices and risk exposure. For anyone targeting a larger recovery, I would want to see stronger volume and acceptance above the EMA28 before becoming more comfortable with that idea. RISK MANAGEMENT⚠️ $133 area is the immediate level I would monitor. A sustained breakdown below this region would weaken the short-term recovery thesis..A bounce without confirmation is not a reliable entry. Liquidity zones are not automatically buying opportunities either. Entry, stop-loss, and risk-to-reward should be established before entering. Position sizing also needs to reflect the risk involved. MY FINAL THOUGHTS💯 I can see some early signs of stabilization, but I don't think the chart has earned a strong bullish confirmation yet. The bigger recovery idea remains posible, but the difference between a temporary bounce and an actual trend reversal matters. I'd rather protect capital and wait for buyers to prove their strength than chase an early move. What do you think about here? Would you consider the $133–$139 region a potential accumulation area, or wait for a confirmed breakout above $141.30? Let's see..... ✅ #ByXIMPACT

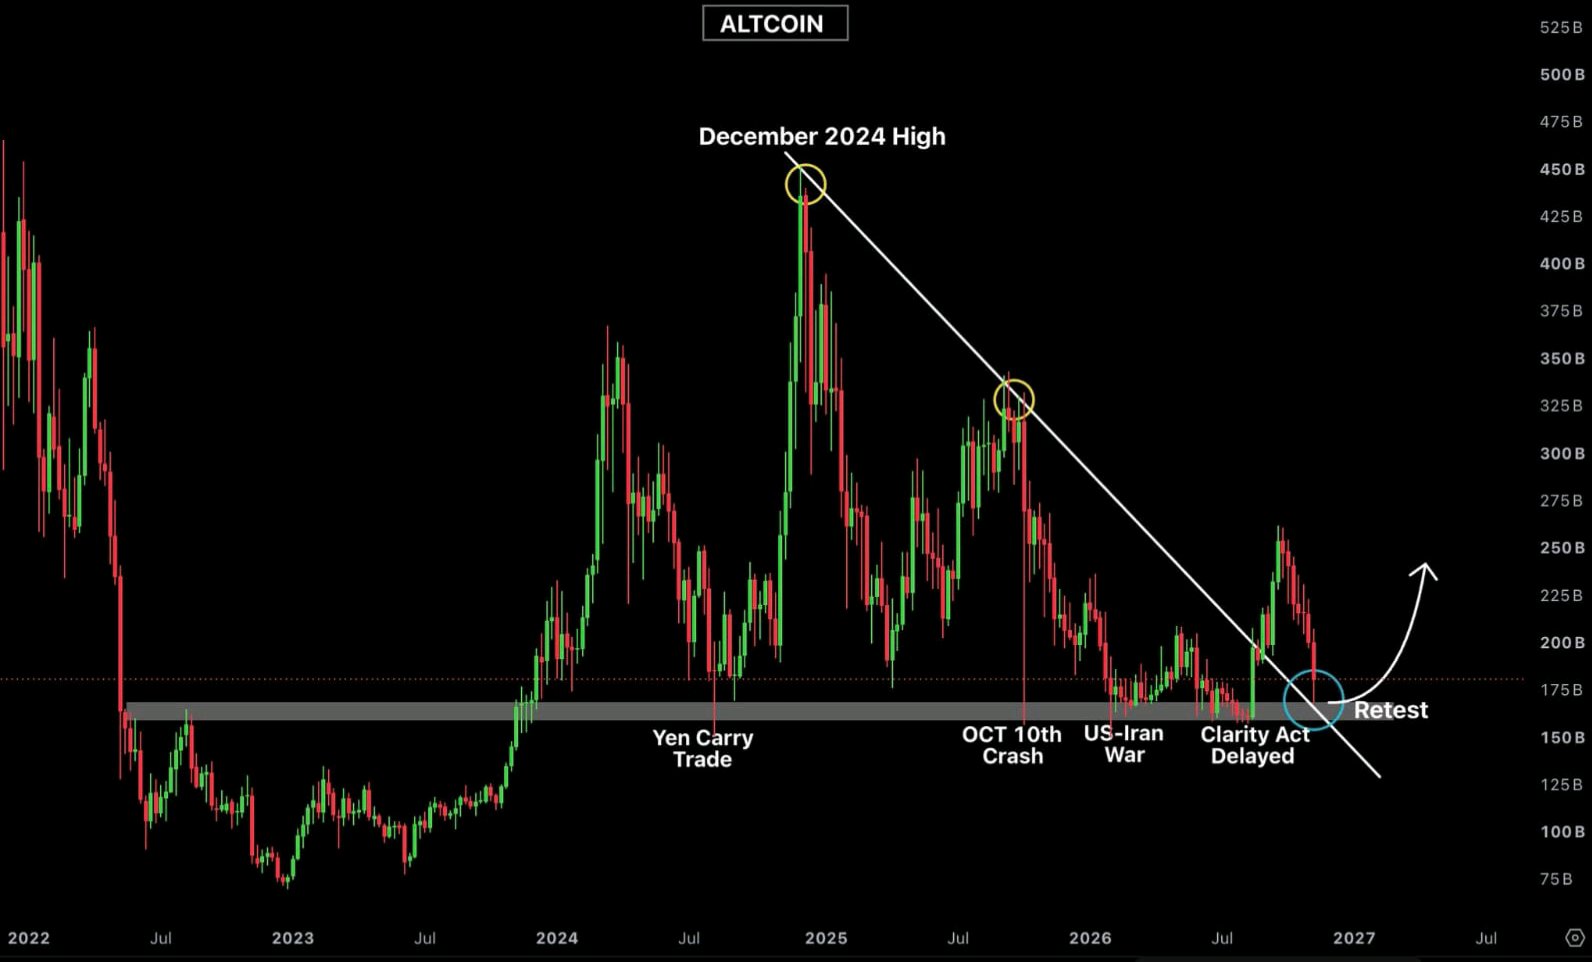
Are ALTs really coming soon?🤔
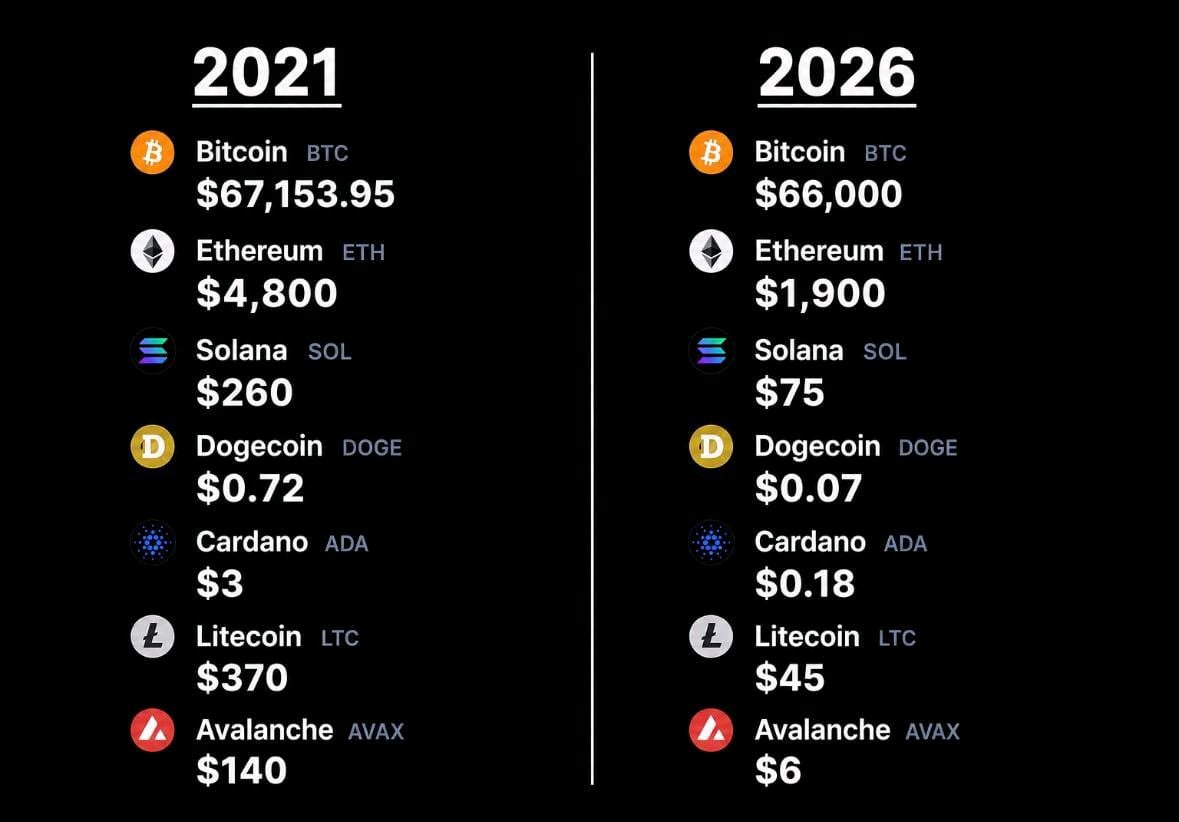
CRYPTO MARKET IS BEING TESTED AGAIN BUT HOW MUCH MORE PRESSURE CAN ALTCOINS TAKE ? REALLY, I keep wondering how many times a market can test the same support level before something finally changes. Altcoins are now testing an important support zone for the fifth time, and honestly, that makes this situation worth watching very closely. What makes this level interesting is not just the price action itself. It is everything that has hapened around it. This support has survived several major events, including the Yen carry trade unwind, the October 10 market crash, the US-Iran war, and the delay surrounding the CLARITY Act. Each of these events brought uncertainty into the crypto market, yet this particular level managed to hold. That tells us something about the importance of this zone. Buyers have repeatedly stepped in whenever prices approached it. But there is another side to consider. Every time support gets tested, traders naturally start questioning how much buying pressure remains. Holding five times is impressive, but it doesn't automatically guarantee a sixth bounce. Hmm, And this is where I think the bigger market picture becomes important. Since Trump took office, more than $1.4 trillion has reportedly disappeared from the total crypto market capitalization. The damage across major cryptocurrencies has been significant. $BTCUSDT is down 40%, $ETHUSDT has declined 46%, SOL has lost 73%, and XRP is down 71%. LINK has dropped 65%, while AVAX is down 82%. DOGE has fallen 85%, and ADA has suffered an even larger decline of 86%. These numbers are difficult to ignore. Even established cryptocurrencies have struggled to maintain their previous valuations. For altcoin investors, the situation has been particularly painful because many assets have experienced much deeper declines than Bitcoin. MEANWHILE, contrast with traditional markets is interesting. Gold has gained 48%, silver is up 64%, and global stock markets are trading near their all-time highs. Think about that difference for a moment. Capital hasn't necessarily disappeared from every market. Instead, different asset classes have experienced very different levels of demand and investor confidence. Crypto has clearly struggled to attract the same enthusiasm during this period. There is also an uncomfortable irony in calling someone the first pro-crypto President while looking at the performance of the crypto market during his time in office. Political support and actual market performance are two completely different things. A supportive political narrative cannot automatically protect investors from macroeconomic pressure, liquidity problems, or changing market sentiment. Still, I don't think the current situation should be viewed through pure negativity either. That fifth support test could become an interesting turning point if buyers manage to defend the level again. A successful bounce might help restore some confidence across altcoins. However, if the level finally breaks, the market could face another difficult period. PERSOALLY, I would rather wait for confirmation than asume the support will hold simply because it survived the previous four tests. The crypto market has already experienced enough uncertainty. Now the real question is whether buyers still have enough strength to defend this level. Another bounce is possible, but nothing is guaranteed. For now, patience and risk management matter more than optimism. next move from this support could tell us quite a lot about the market's underlying strength. market is volatile, so you have to manage your own risk.....👍⚠️ #ByXIMPACT #WSOT2026 #WSOTShowYourAITradeToEarn10USDT #JensenHuangExitTestsNvidiasAILeadership #USPPITestsTheHigherForLongerTrade

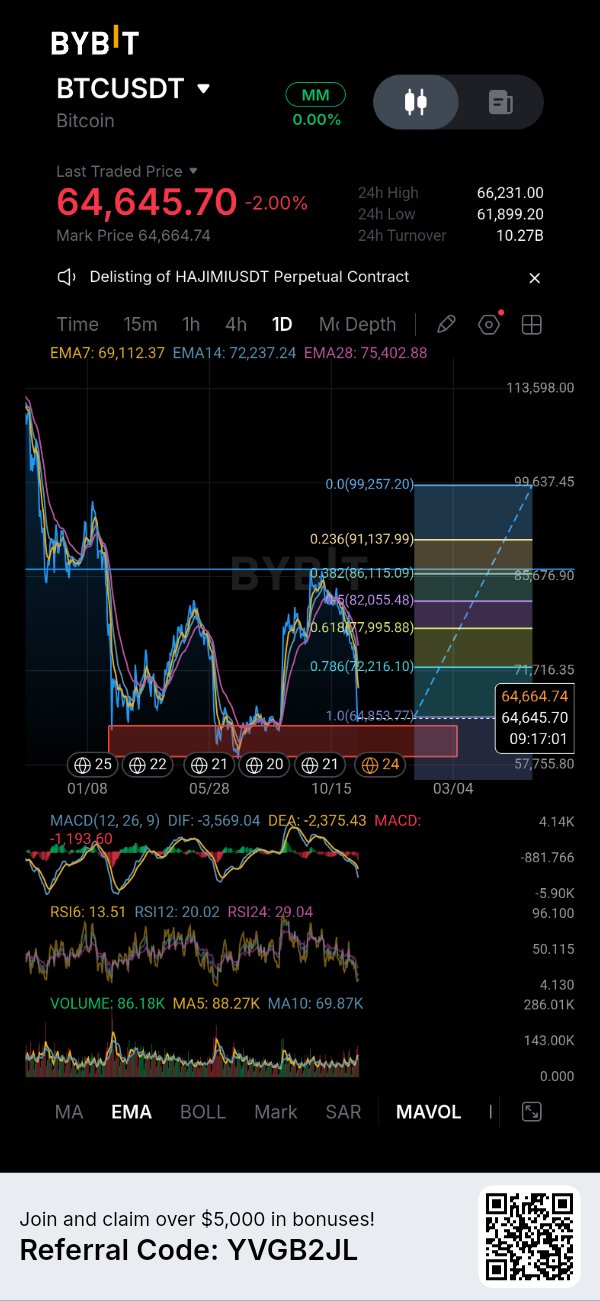
$BTC EMERGENCY UPDATE BTC Breaks Below $65K – oversold conditions are building, but Is the bottom In?🤔 $BTCUSDT is showing serious weakness on the daily timeframe, and I don't think this is the moment to blindly chase a bounce. BTC is currently trading around $64,645, down approximately 2% on the day. More importantly, price has slipped below the visible Fibonacci 1.0 level near $64,853, putting aditional pressure on an already weak market structure. Here's what concerns me: BTC is trading below all three visible EMAs. EMA 7: $69,112 EMA 14: $72,237 EMA 28: $75,402 This alignment tells me sellers still have control of the daily trend. Any recovery will need more than a few green candles to convince me that momentum is actually changing. Daily Technical Structure📊 RSI readings are particularly interesting right now. RSI 6 is at 13.51, RSI 12 at 20.02, and RSI 24 at 29.04. These readings show deeply oversold conditions across the displayed RSI periods. However, I want to make one thing clear: oversold doesn't automatically mean a bottom is confirmed. MACD also remains negative, with DIF at -3,569.04 and DEA at -2,375.43. The negative histogram reinforces the current bearish momentum. For now, the visible red demand zone around the upper-$50K to low-$60K region is an important area to monitor. If buyers manage to defend this region, a technical recovery could develop. Bullish vs Bearish Scenarios🟢🔴 Bullish Scenario i want to see BTC reclaim the $64,853 area first, followed by a stronger recovery above $66,231, the visible 24-hour high. If momentum improves, the first major recovery reference is the EMA 7 near $69,112. Beyond that, $72,216 becomes important because it aligns with the EMA 14 and the 0.786 Fibonacci level. A sustained recovery above these levels would make the bullish case more interesting. Bearish Scenario if BTC continues trading below $64,853 and selling pressure increases, the marked demand zone could become the next major test. A decisive breakdown through that region would weaken the possibility of an immediate recovery and could expose BTC to another leg lower. I would rather wait for a reaction from buyers than assume every dip is an opportunity. For Traders Already Holding BTC Personally, I would focus on protecting capital and managing exposure rather than making emotional decisions. Traders sitting on profitable positions may consider partial profit-taking during confirmed recovery attempts toward nearby resistance. Those holding for a larger move should reassess their exposure if the daily structure continues deteriorating. I would become more interested in rebuilding a larger position after BTC demonstrates support defense and a confirmed market structure shift. Risk Management⚠️ $64,853 Fibonacci level is an important immediate reference, while the marked demand zone is the bigger area to watch. A bounce without confirmation is not a reliable entry. Liquidity zones are not automatically buying zones either. Entry, stop-loss, and risk-to-reward should be established before entering, with position sizing adjusted to the risk involved. Final Thoughts BTC is deeply oversold, but the daily trend hasn't given buyers a convincing reason to celebrate yet. I still see the posibility of a relief bounce, but I don't want to confuse a temporary recovery with a confirmed reversal. Sometimes the best trade is simply waiting until the market shows its hand. Protecting capital matters more than catching the exact bottom. What's your approach here? Would you consider buying a confirmed bounce around the demand zone, or wait for BTC to reclaim $69K first? market is volatile, so you have to manage your own risk.....👍 #IMPACTbyTrade #BitcoinHitsTwoMonthLowAfterUSMidterms

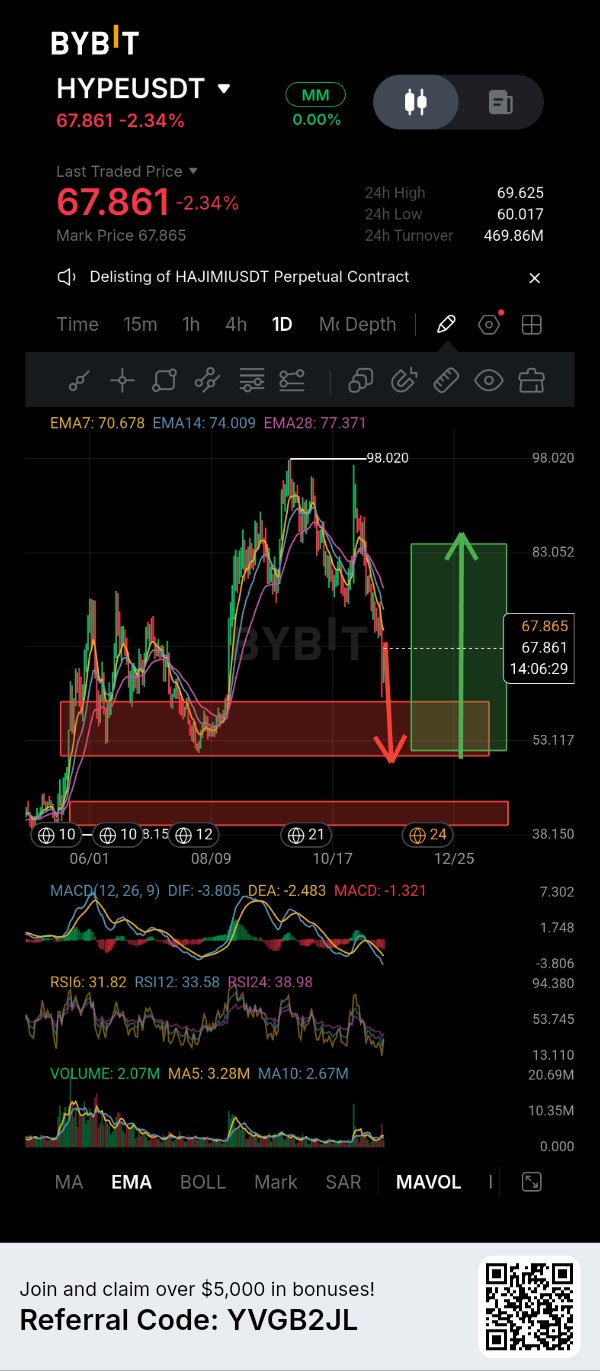
$HYPEUSDT EMERGENCY UPDATE a deeper correction could come before the next major recovery I'm watching $HYPEUSDT closely because the daily chart is showing increasing weakness, and I don't think this is the right moment to rush into a long position. HYPE is currently trading around $67.861, down 2.34%, after failing to maintain its previous bullish momentum. What concerns me most is the EMA structure. EMA 7 is at $70.678, EMA 14 at $74.009, and EMA 28 at $77.371. Price is trading below all three averages, which suggests sellers currently have control of the short-term trend. Daily Market Structure📊 rejection from the $98.020 swing high has gradually developed into a deeper correction. The recent price action also shows that buyers haven't managed to establish a convincing recovery. Momentum indicators aren't particularly encouraging either. RSI 6 is at 31.82, RSI 12 at 33.58, and RSI 24 at 38.98. These readings indicate considerable selling pressure, although they also suggest that the market is approaching oversold territory. MACD remains negative, with DIF at -3.805 and DEA at -2.483. The histogram is also negative at -1.321. Meanwhile, volume is 2.07M, below both MA5 and MA10. I would like to see stronger buying participation before trusting a meaningful recovery. Bearish Scenario 🟢 my main concern is the possibility of another downward move toward the $53–$58 demand zone marked on the chart. if the current recovery attempts fail and sellers continue pushing price lower, this region could become the next important area to watch. However, I wouldn't automatically consider it a buying opportunity. I want to see selling pressure slow down and buyers demonstrate that they can defend the zone. If that area fails, the lower marked support around $39–$43 becomes relevant. Bullish Scenario🔴 The bullish outlook isn't completely off the table, but HYPE needs to reclaim its EMA levels first. A recovery above $70.67 would be an initial improvement. Reclaiming $74 and subsequently $77.37 would provide stronger evidence that buyers are returning. If the broader daily structure improves, the $83 area becomes an important upside recovery target. For Traders Already Holding HYPE I wouldn't make decisions based on panic. Personally, I would reassess exposure if the daily weakness continues rather than blindly averaging down. If price eventually reaches the $53–$58 region and produces a convincing reversal, that could create a more interesting opportunity to rebuild exposure gradually. Risk Management⚠️ A bounce without confirmation isn't a reliable entry. The marked demand zones are areas to monitor, not guaranteed reversal points. Entry, stop-loss, and risk-to-reward should be established before entering, with position sizing reflecting the risk involved. My current approach is patience over prediction. HYPE may eventually recover, but protecting capital during a correction is just as important as capturing the next rally. Would you wait for HYPE to reach the $53–$58 demand zone, or do you think buyers can defend the current price and start a recovery? Let's see..... 🚀 #IMPACTbyTrade

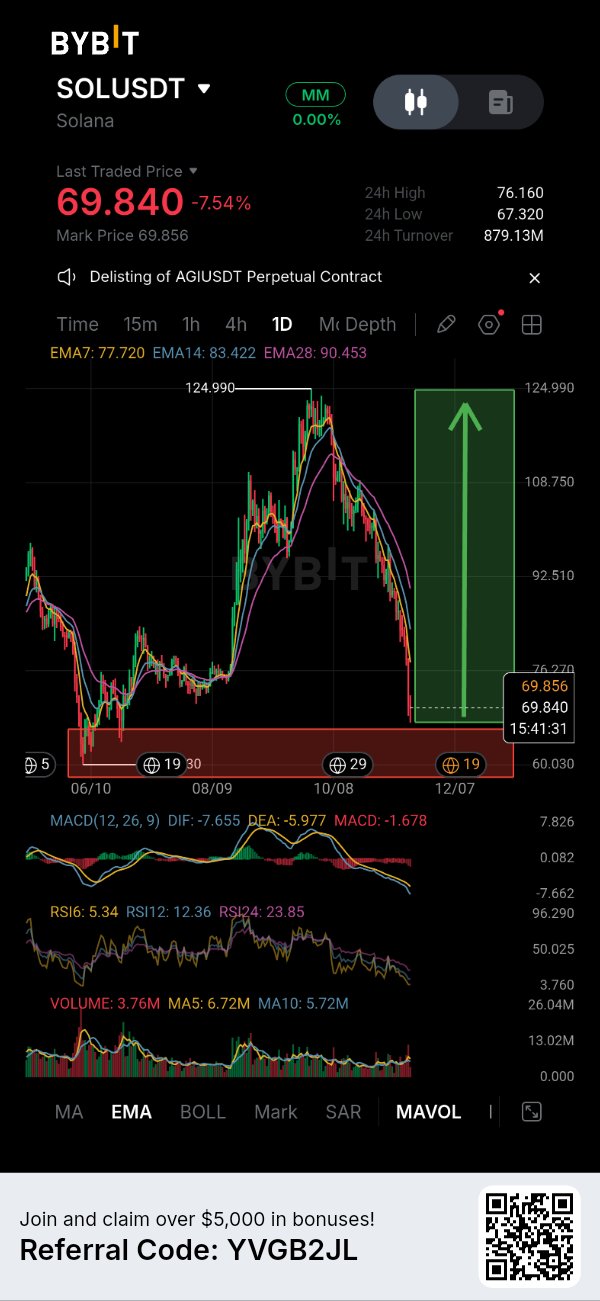
$SOLUSDT 更新 市場構造は大きな圧力にさらされていますが、私が注目しているポイントは以下の通りです。 Bybitの1日足チャートを見ると、SOLは現在69.84ドル付近で取引されており、過去24時間で-7.54%と顕著な下落を見せています。価格は124.990ドル付近のローカル・トップから急激に拒絶され、EMAライン(EMA7: 77.720、EMA14: 83.422、EMA28: 90.453)を大きく割り込んで下落しました。チャート全体では124.990ドルのレジスタンスに向けた上昇を示す緑色のゾーンが強調されていますが、目先の現実は売り手が短期的な勢いを支配しており、60.030ドル付近の赤いサポート帯をテストしている状況です。 テクニカル分析と市場環境📊 日足タイムフレームでは、指標が深刻な下降モメンタムを反映しています。MACDはヒストグラムのバーを拡大させながら深くマイナス圏に沈んでおり(DIF: -7.655, DEA: -5.977, MACD: -1.678)、弱気の圧力が依然として強いことを裏付けています。一方、相対力指数(RSI)は極端な売られすぎ領域に突入しており、RSI6は5.34、RSI12は12.36、RSI24は23.85となっています。価格が下限の需要境界線に近づくにつれて、出来高も急増しており、積極的な清算が行われていることを示しています。 2つの市場シナリオ🟢🔴 強気シナリオ:買い手が主導権を取り戻すには、SOLが現在のサポートゾーンを維持し、より短い時間軸で確実な反転パターンを形成する必要があります。このエリアをうまく守り切ることができれば、下降するEMAクラスターや以前の構造的崩壊レベルに向けたリリーフ・バウンス(戻り)の道が開かれ、そこからより大きな回復を試みることができます。 弱気シナリオ:現在のサポートゾーンが売り圧力を吸収できなければ、60.030ドル付近の可視範囲の下限に向けたさらなる調整の可能性が開かれます。ここを割り込んだ場合は忍耐が必要で、新しいロングポジションを検討する前に、明確な強気の市場構造の確認が必要です。 SOLを保有しているトレーダーへ 高いレベルからポジションを保有している場合、今はリスク管理が極めて重要です。落ちるナイフを掴んだり、計画なしに盲目的に保有し続けたりすると、損失が拡大する可能性があります。平均取得単価に応じて、主要なサポートレベルが崩れた場合に備えてエクスポージャーを再評価する必要があるかもしれません。私は反発を確信して動くよりも、確認された底打ち構造を待つ派です。 リスク管理⚠️ 確認なしの反発は、信頼できるエントリーではありません。流動性ゾーンや売られすぎのRSIを自動的に買いゾーンとして扱うべきではありません。エントリー、ストップロス、リスクリワードのパラメータは、トレードを開始する前に厳密に定義しておく必要があります。 ポジションサイズは、現在市場に存在する高いボラティリティを反映させるべきです。 時には、早まってエントリーするよりも、確認を待つ方がより良い機会を生むことがあります。すべての動きを追うことよりも、資本を守ることの方が重要です。 あなたならこの押し目で買いますか?それとも市場構造の確実な転換を待ちますか? 見ていきましょう......🚀 #IMPACTbyTrade

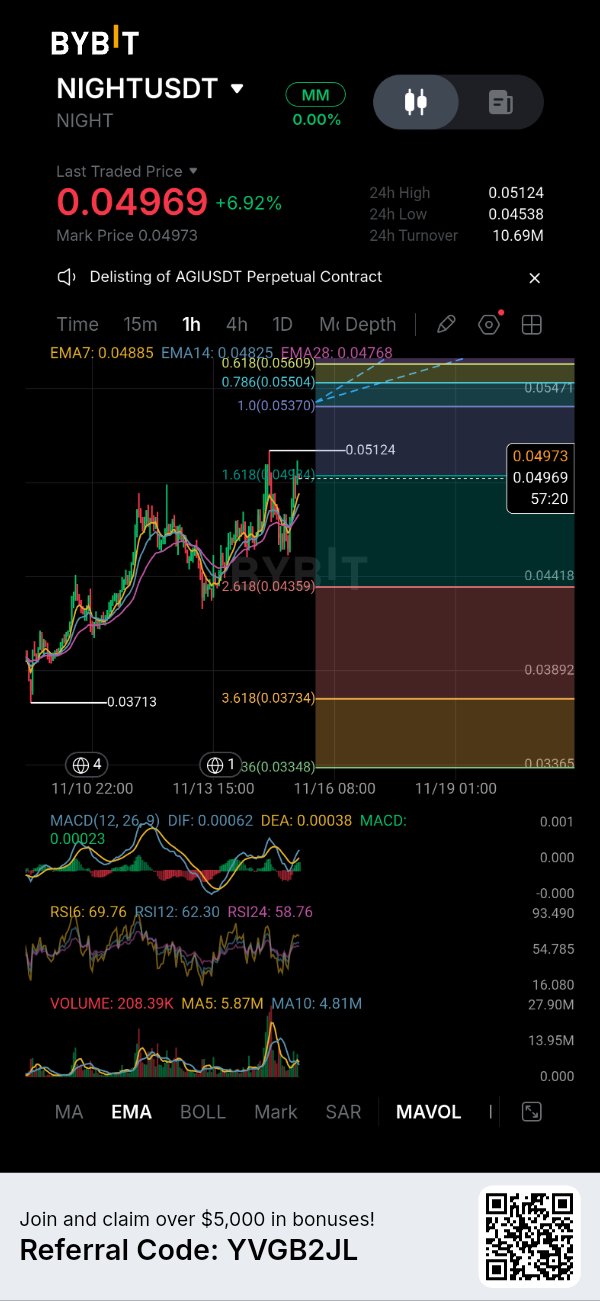
$NIGHTUSDT 市場アップデート:急激な衝動的な上昇の後、フィボナッチ・エクステンション・レベルをテスト中 現在、$NIGHTについて注目しているポイントです。0.03713の安値からの力強い衝動的な回復の後、価格は0.04969のレベルまで押し上げられ、1時間足チャートで過去24時間で+6.92%の上昇を見せています。全体的な上昇モメンタムは依然としてアクティブですが、価格アクションは現在、上昇が続くか、あるいは一時的な調整に入るかを決定づける重要なリトレースメントおよびエクステンション・レベルと交差しています。 現時点で焦って新規ポジションを取るつもりはありません。モメンタムが高まっている時に無理に追いかけるよりも、今は資金を守ることを優先したいと考えています。 テクニカル分析 チャート上の1時間足を見ると、価格アクションは現在、0.04973付近の0.04944にある1.618フィボナッチ・エクステンション・レベル周辺で推移しています。 移動平均線とモメンタム:EMA7(0.04885)とEMA14(0.04825)は現在の価格のすぐ下に位置し、動的なサポートとして機能しています。一方で、EMA28は少し離れた0.04768にあります。MACD指標を見ると、ヒストグラムは縮小しており、DIF(0.00062)とDEA(0.00038)は、この急激な上昇の後、直近のモメンタムがわずかに減速していることを示しています。一方、RSIのサブ指標は上昇しており、RSI6が69.76、RSI12が62.30、RSI24が58.76となっており、市場は局所的な買われすぎの状態に近づいていますが、明確な反転シグナルはまだ出ていません。 サポート&レジスタンスゾーン:直近のサポートは0.04880〜0.04900の領域(短期EMAおよび直近の局所的な保ち合いと合致)に構築されています。上値のレジスタンスは0.05124(24時間高値)付近にあり、さらに上には0.05471および0.05609の領域に向けてフィボナッチ・エクステンション・バンドが控えています。 考えられる2つの市場シナリオ 強気シナリオ:買い手が主導権を取り戻し、0.05124の高値およびその後のフィボナッチ・レジスタンス層に向けて押し上げるためには、0.04944のレベルを維持し続け、その後に0.05124の閾値を突破する際に出来高の増加を伴う必要があります。直近のレジスタンスを上回る力強い1時間足の終値が確認されれば、より高いターゲットをテストする道が開かれます。 弱気シナリオ:買い手が0.04880の直近のサポート群を守れず、1.618エクステンション・レベルがサポートとして機能しなかった場合、0.04418のサポートゾーンやそれ以下の不均衡な領域への深い調整の可能性が出てきます。短期EMAを割り込めば、短期的には消耗のサインとなります。その場合は焦らず、マーケット構造の明確な転換が確認されるまで待つ必要があります。 既に$NIGHTを保有しているトレーダーへ もし既に低いレベルから$NIGHTを保有している場合、この1.618フィボナッチ・エクステンション周辺でのリスク管理が重要です。急激な上昇の後なので、現在のレベル(0.04969〜0.04973付近)で一部利益を確定させ、利益を確保するのは理にかなっています。その一方で、残りのポジションで0.05124の24時間高値やそれ以上のエクステンション・レベルをターゲットにすることも可能です。ただし、価格が短期EMAバンドを下回った場合は、ポジションを見直し、ストップロスをタイトに設定することで蓄積した利益を守るようにしてください。 リスク管理⚠️ 短期的な強気シナリオが崩れる無効化レベルは、上昇しているEMAサポート構造と局所的なスイングベースを下回った地点にあります。出来高の確認がない反発は、信頼できるエントリーポイントではありません。 エントリー、ストップロス、リスクリワード比は、新規のエクスポージャーを取る前に確立しておく必要があります。ポジションサイズは、より高いエクステンション・レベルをテストしている時価総額の小さい資産に固有のボラティリティを厳密に反映させるべきです。ターゲットが遅れたり、局所的な保ち合いが続いたりしても、必ずしもトレンドが失敗したことを意味するわけではありません。しかし、すべての緑のローソク足を追いかけるよりも、資金を守ることの方が重要です。 あなたなら、このエクステンション・レベルで一部利確しますか?それとも24時間高値の明確なブレイクアウトを待ちますか? どうなるか見てみましょう..... 🤔 #IMPACTbyTrade

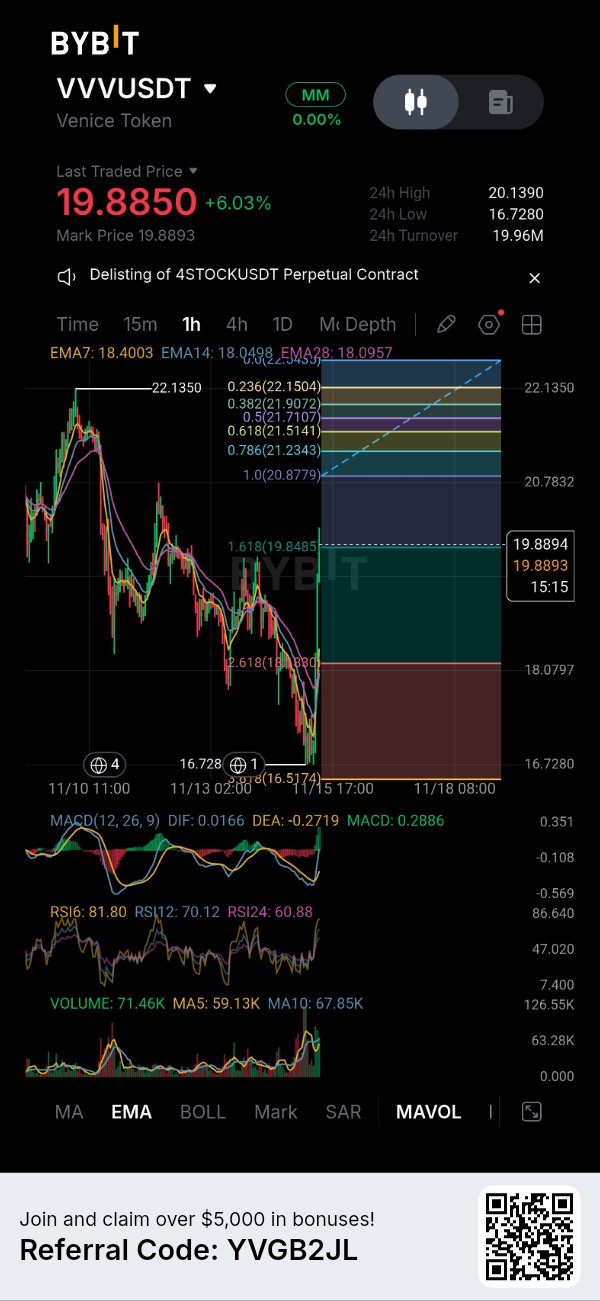
$VVV 短期的な弱気とサポート防衛が進行中 私のBYBITの1時間足チャートが示していること....👇 今、私が$VVVUSDTで注目しているのは以下の通りです。このトークンは現在19.8850付近で取引されており、24時間比で+6.03%の上昇、24時間高値は20.1390、安値は16.7280となっています。11月13日の安値16.7280からの急反発という広範な価格動向は見られますが、私はまだポジションを取ることを急いでいません。戦略としては、確証が得られるまで待機することです。 テクニカル分析と市場環境 チャートの1時間足を見ると、EMAライン(EMA7: 18.4003、EMA14: 18.0498、EMA28: 18.0957)が、価格がサポートエリアの16.7280から急反発したことで、最近ゴールデンクロスしました。買い手はこの下限を積極的に防衛し、19.88ゾーンへの回復を後押ししました。 同時に、チャート上にマッピングされたフィボナッチ・エクステンションとリトレースメントのレベルは、上値抵抗線を示しています。価格は現在、19.8485付近の1.618レベルで推移しています。MACDはポジティブなクロスオーバーが形成されつつあり(MACD 0.2886)、RSIのサブ指標(RSI6: 81.80、RSI12: 70.12、RSI24: 60.88)は短期的なモメンタムがかなり過熱していることを示しており、クールダウン期間や調整が必要であることを示唆しています。 考えられる2つの市場シナリオ 強気シナリオ:買い手が完全に主導権を取り戻し、上昇を継続させるためには、$VVVが19.84~19.88のエリアで固めを作り、直近のローカル抵抗線を明確に突破する必要があります。さらに上昇が続けば、チャート上で見える21.00から22.13付近の上位フィボナッチ抵抗ゾーンを試す展開が開かれます。 弱気シナリオ:もし買い手がこれらのレベルでモメンタムを維持できなければ、EMAクラスター(おおよそ18.04~18.40)までの調整は十分にあり得ます。これらの移動平均線を割り込み、中間サポートゾーンを守れなければ、16.7280のベースライン付近の需要構造を再テストする可能性が出てきます。 すでに$VVVを保有しているトレーダーへ もしすでに低いレベルから$VVVを保有しているなら、16.7280からの急激な反発を考慮し、リスク管理が極めて重要です。現在の1.618フィボナッチ・エクステンション・ゾーン(19.84付近)で利益を一部確定させるのは非常に理にかなっています。ただし、残りのポジション(ランナー)を保有しつつ、ブレークイーブンのストップロスで資本を守ることで、構造がより高いターゲットに挑戦できるかどうかを見極めることも可能です。 リスク管理 もし調整なしで現在の抵抗ゾーンから急激に拒絶された場合、目先の強気論は弱まります。 確認なしで数パーセントの急激な反発を追うことは、信頼できるエントリー戦略ではありません。 エントリーレベル、無効化ポイント、リスク・リワード比は、資金を投じる前に明確に定義しなければなりません。 最終的な結論 すべての陽線を追いかけることよりも資本を守ることの方が重要です。時には、健全な押し目や構造的な確認を待つ方が、上昇途中で飛び乗るよりもはるかにクリーンなチャンスを生み出します。 あなたは現在の抵抗線で部分利確しますか?それとも確認された調整を待ってからエントリーしますか? #IMPACTbyTrade

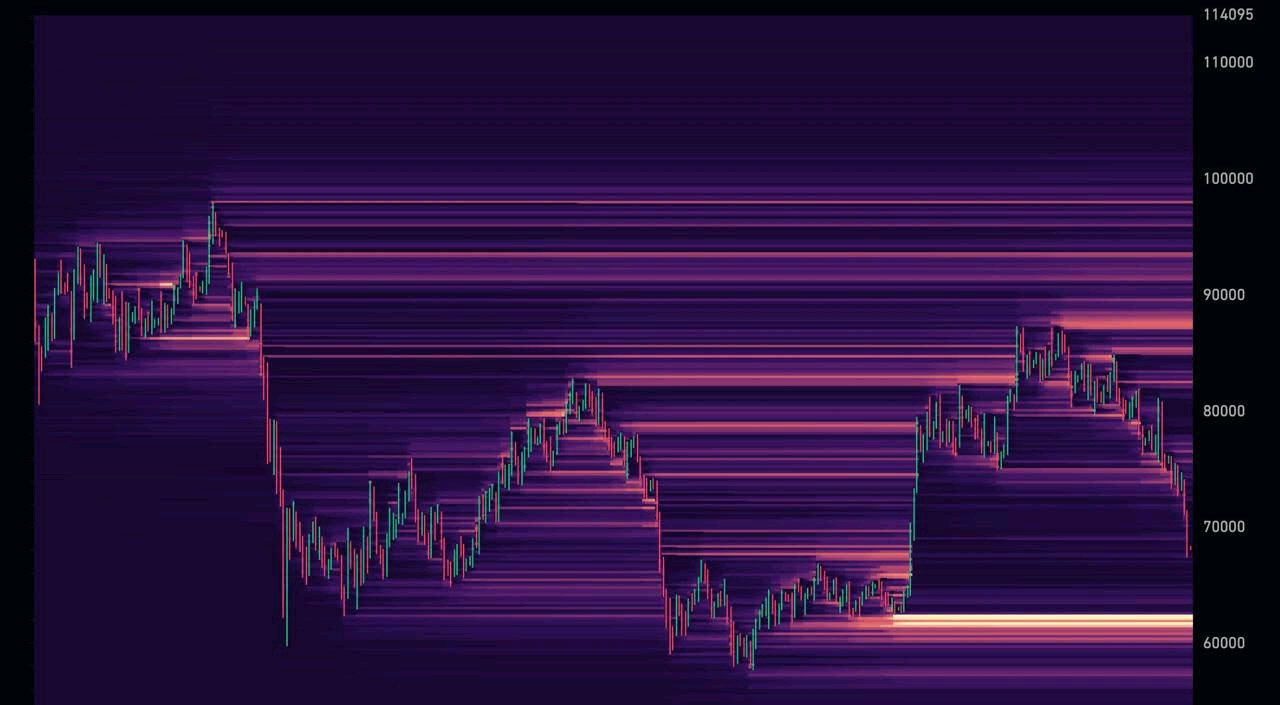
ビットコインに下落圧力:次の流動性ターゲットは6万ドルか? うーん、今のビットコインの下落は単なる調整なのか、それとも市場のさらなるリセットにつながるものなのか、気になるところです。最近の$BTCUSDT の動きを見ていると、特に6万ドルの流動性ゾーンが注目を集めているだけに、さらなる下落の可能性を無視するのは難しいですね。ビットコインは最近6万5000ドルを割り込み、3ヶ月ぶりの安値を更新しました。全体像を見ると、この下落はさらに際立っています。BTCはわずか1週間で約13.5%下落し、10月下旬の水準から20%以上も値を下げています。これはもう小さな調整とは言えず、市場参加者が慎重になるのも当然です。 では、実際に何が市場に圧力をかけているのでしょうか? 大きな懸念の一つは機関投資家の需要です。現物ビットコインETFは7営業日連続で資金流出を記録したと報じられています。ETFの需要はビットコインの市場構造において重要な部分を占めているため、これは無視できません。流出が数日続くと、ただでさえ弱い市場にさらなる圧力が加わることになります。次に、マクロ経済の状況です。CPI(消費者物価指数)の数値が高止まりしたことで、12月のFRBによる利上げの懸念が高まっています。同時に、10年物米国債利回りは5.15%に達し、米ドルは7ヶ月ぶりの高値圏で取引されています。こうした状況下ではリスク資産の魅力が低下し、ビットコインもその圧力から無縁ではいられません。 興味深いことに、オンチェーンアナリストのJames Check氏は、これをビットコインの史上最高値更新以来4回目の降伏イベント(キャピチュレーション)だと指摘しています。彼はまた、BTCは2月や6月に見られたようなディープバリューゾーン(割安圏)に入ったと示唆しています。この視点は考慮に値しますが、売られすぎの状態だからといって、自動的に「底打ちした」と判断するのは危険でしょう。現在のRSIは約22、Fear and Greed Index(恐怖と強欲指数)は13で、どちらも市場の深刻な弱さを示しています。しかし、特に流動性が薄くマクロ経済の不確実性が高い状況では、市場が予想以上に長く売られすぎの状態を維持することもあります。 テクニカルな面では、以下の3つの重要な領域に注目しています🤔 まず、8月の安値である6万2750ドル。売り圧力が続けば、ここが次に注目すべき重要な領域になる可能性があります。その下では、6万ドルが主要な流動性ゾーンとして際立っています。そこまで下落すれば、さらなる清算を引き起こし、ボラティリティが増大する可能性があります。 上値については、市場分析でも言及されていた200週平均線付近の6万7900ドルを回復することが、安定化に向けた最初の重要な兆候となるでしょう。 今のところ、弱いアルトコインをショートすることも選択肢の一つかと思いますが、下落するたびに飛びつくのは危険です。週末の流動性は双方の動きを増幅させる可能性があり、突然の反転は常に起こり得ます。 個人的には、6万ドルが確実だとは決めつけたくありませんが、自信を持って「ここが底だ」と言い切れるほどの確信も持てません。 時には、市場が次の動きを見せるのを待つのが最善の判断ということもあります。 皆さんはこの水準で買い始めますか?それともビットコインが6万ドルを試すケースに備えて資金を残しておきますか? 市場は変動が激しいため、ご自身でリスクを管理する必要があります。 これらは個人的な市場観察であり、投資助言や売買の推奨ではありません。必ずご自身でリサーチを行ってください。 #IMPACTbyTrade #WSOT2026 #WSOTあなたのAI取引を見せて10USDTを獲得 #米中間選挙後、ビットコインが2か月ぶりの安値を記録


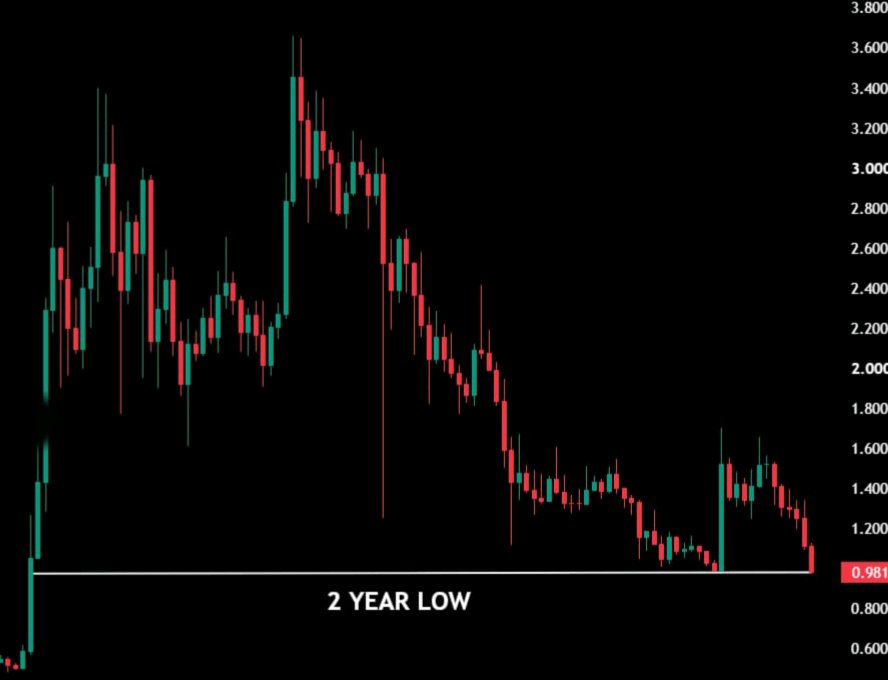
2 YEAR LOW FOR $XRP TODAY ON 1W CHART 🔴
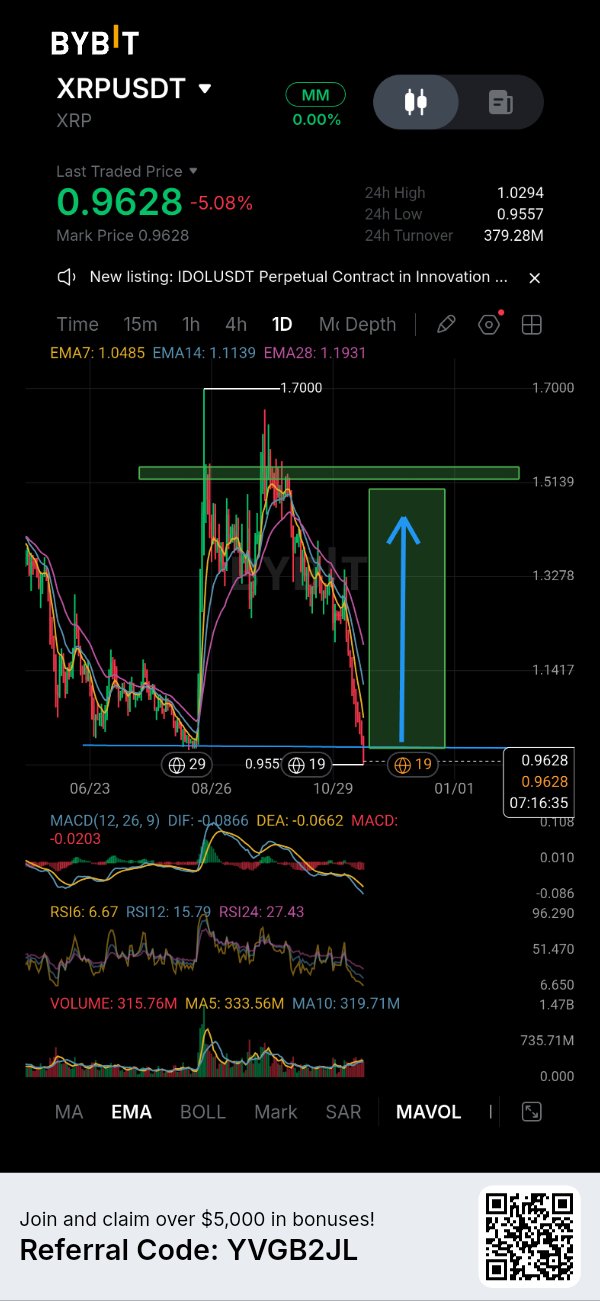
BUY THE DIP $XRPUSDT 💯 🟢 MY BYBIT 1D CHART IS SAYing....👇 $XRP MARKET UPDATE Shortterm weakness is testing key levels, but patience matters🤔 LOOKING AT THE CURRENT daily chart on XRPUSDT price is trading at 0.9628, down -5.08% on the session, after a sharp corrective pullback from higher levels. The market is showing clear short-term weakness, driven by active downward momentum as price trades below the key moving averages (EMA7 at 1.0485, EMA14 at 1.1139, and EMA28 at 1.1931). While the broader structure still reflects a significant past expansion toward the 1.7000 resistance region, the immediate price action is testing critical structural boundaries. I'm not rushing into a position here, as catching a falling knife without confirmation rarely yields a clean risk-to-reward setup. TECHNICAL ANALYSIS 📊 on the lower and daily timeframes visible in the chart, price is hovering just above structural support near the 0.9557 swing low, which aligns with the 24-hour low of 0.9557. Sellers have dominated recent candles, pushing momentum indicators into extreme territory. Specifically, RSI6 is sitting deeply oversold at 6.67, while RSI12 (15.79) and RSI24 (27.43) confirm widespread downward pressure. Furthermore, the MACD indicator shows ongoing bearish expansion with DIF at -0.0866 and DEA at -0.0662. However, extreme RSI readings like these often hint at potential exhaustion, making this a crucial area where buyers need to step in and defend the support zone to prevent a deeper breakdown. Two Possible Market Scenarios BULLISH SCENARIO for buyers to regain control, price needs to stabilize above the 0.9557 support floor and form a clear structural base or higher low. A successful defense here must be followed by a reclaim of the psychological 1.0000 handle and a push back toward mid-range resistance and the moving average clusters to validate a recovery toward higher targets. BEARISH SCENARIO if the 0.9557 support fails to hold under continued selling pressure, the door opens to a deeper retracement toward lower historical demand zones visible on the daily timeframe. A clean breakdown would invalidate the immediate stabilization thesis, requiring patience for a confirmed market structure shift before considering any long exposure. For Traders Already Holding XRP🎯 Managing an existing holding in this environment requires evaluating whether your original thesis accounts for this volatility. If you are already positioned, chasing more risk here is rarely wise. Instead, monitor how price reacts around the 0.9557 structural support. Partial profit-taking or risk reduction may have made sense during higher expansions, but at these current levels, forcing a decision without seeing how buyers handle this test could lead to reactive mistakes. Reassessing the position is only justified once a clear recovery or breakdown confirmation occurs. RISK MANAGEMENT remains paramount. A bounce without confirmation is not a reliable entry, and support levels should never be treated as guaranteed buy zones. Entry parameters, stop-loss placement based on invalidation below key structural lows, and strict position sizing must be established before committing capital. Protecting capital matters more than chasing every move. Would you buy the retracement here or wait for a confirmed market structure shift? LET'S See......👍 #IMPACTbyTrade

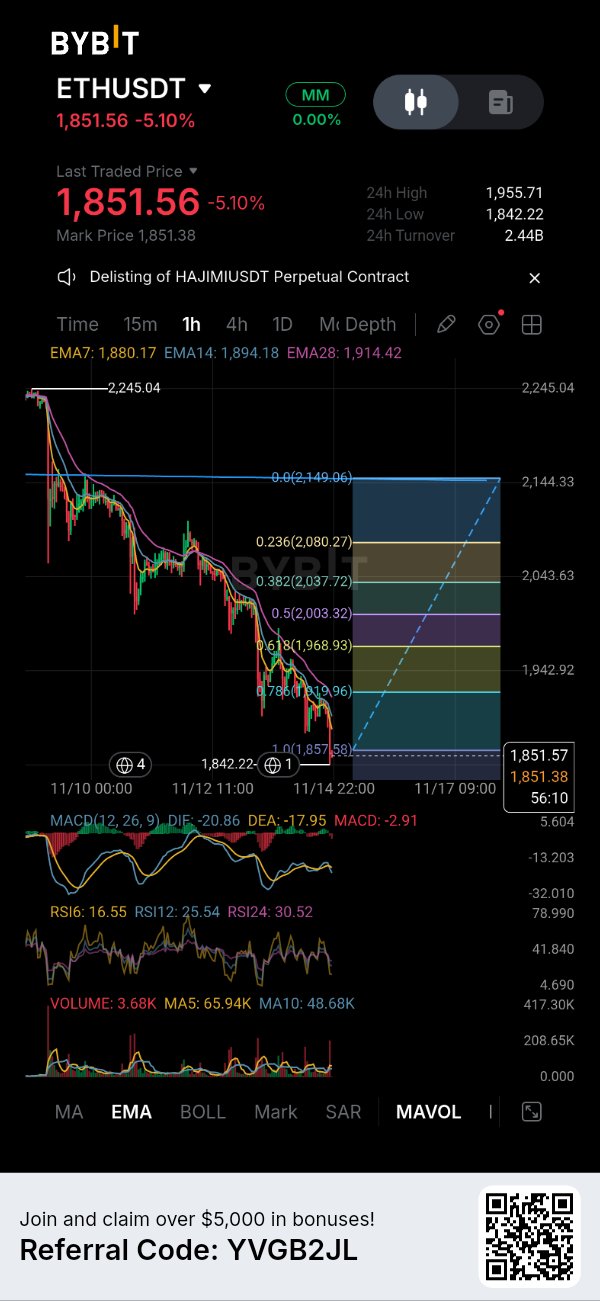
え、マジで……🤔 機関投資家たちが$ETHUSDTに全力で突っ込んでるけど、水面下でもっと興味深いことが起きてる気がする。技術自体がまだ進化の途上なのに、なんでETHを買うことだけに集中するの? Ethlabsが耐量子計算技術の導入を2027年に前倒しすることを提案した件、注目してる。Hegotáアップグレードから高速ブロック生成の要素を外して、ポスト量子暗号と長期的なセキュリティに焦点を移すっていうのは、特にAI由来のリスクが高まる中で重要だよね。正直、トランザクションの速さも大事だけど、ネットワークの未来を守ることも同じくらい大事。イーサリアムは目先の需要の先を見据えているようだ。本当の問題は、そのビジョンをいかにして現実のものにできるかだね。 僕のBYBITの1時間足チャートが言ってること……👇 $ETHUSDCは激しい下落調整を続けて1,851.56まで急落し、ここ数セッションで強い売り圧力とともに価値を削り取られてる。1時間足を見ると、EMA7(1,880.17)やEMA28(1,914.42)といった主要な移動平均線を大きく下回って推移していて、目先は売り手が完全に主導権を握ってることを示してるね。 そう、今は無理に落ちてくるナイフを掴むようなマネはしない。ただ、価格は1.0フィボナッチ・エクステンション付近の1,857.58に達していて(日足の安値は1,842.22)、RSI6のようなモメンタム指標も16.55という深い売られすぎ水準にある。ここからが僕のプランの面白いところだけど、すぐエントリーするわけじゃなくて、あくまで条件付きのセットアップだ。 1,842から1,857ドル付近のこの強固な構造的なフロアを、買い手が防衛できるかどうかを見極めたい。もし明確な強気の反応や、流動性のスイープ、あるいは下位足での高値切り上げが確認できれば、最初のレジスタンスゾーンや、以前のフィボナッチ・リトレースメントレベル(例えば0.786付近の1,919.96)までのリリーフ・バウンス(自律反発)が実現する可能性がある……。 リスク管理は厳格にいくよ。直近安値の1,842.22を明確に割り込んだら、この防衛的なシナリオは完全に無効。それはマクロ的な下降トレンドが意味のある底を打たずに継続することを意味するからね。資金を投入する前に、この水準で価格がどう反応するかをじっくり見守るつもり💯 #IMPACTbyTrade #WSOT2026 #WSOTあなたのAI取引を見せて10USDTを獲得 #ドイチェ銀行、デジタル資産カストディを開始 #米PPIが「高金利長期化」取引を試す

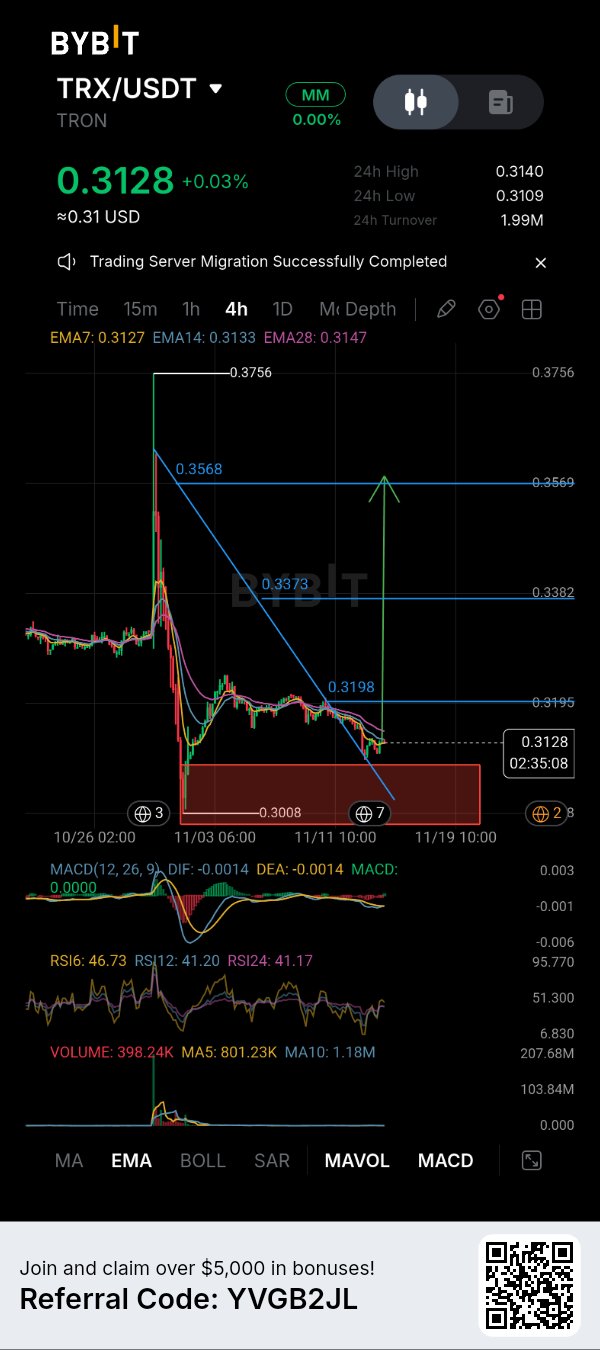
$TRX、俺のBYBITの4時間足チャートが言ってることには……👇
$TRXの買い手はサポートラインを死守していますが、力強い回復にはまだ確証が必要です。 $TRXUSDT は現在4時間足チャートで0.3128ドル付近で推移しており、市場が重要な分岐点に差し掛かっているため、このエリアを注視しています。0.3756ドルへの急騰後、価格は大幅な調整局面を迎え、徐々に勢いを失いました。回復の試みは依然として比較的弱く、短期的な構造全体としては依然として下落圧力が続いています。 しかし、注目すべきは0.3008ドルの需要エリア周辺の反応です。買い手は今のところ価格をこのゾーンの上に維持できており、直近のローソク足は安定の兆しを見せています。これを反転の確証と呼ぶにはまだ早いですが、売り圧力は当初の下落時ほど強烈ではないようです。 4時間足テクニカル分析 📊 👉 EMA(指数平滑移動平均線)の構造には引き続き注意が必要です。EMA7は約0.3127ドル、EMA14は0.3133ドル、EMA28は0.3147ドル付近です。価格は短期EMA付近に位置していますが、他の2本よりは下にあります。これは買い手が短期的な主導権を奪い返そうとしていることを示唆していますが、4時間足全体のモメンタムは完全には強気へと転換していません。 👉 RSIの数値も比較的弱い位置を示しています。RSI6は46.73、RSI12は41.20、RSI24は41.17です。回復の余地はありますが、モメンタムはまだ説得力のある強気レベルには達していません。 👉 MACDは中立圏を彷徨っており、DIFとDEAはいずれも-0.0014付近です。ヒストグラムはゼロに近く、弱気のモメンタムが鈍化している可能性を示唆していますが、より確実な回復には、より力強い強気のゴールデンクロスとその後の追随が必要です。 2つのシナリオ 🟢強気シナリオ:私の最初の焦点は0.3198ドルのレジスタンスです。4時間足での確実なブレイクアウトと、このレベルのリテストが成功すれば、0.3373ドルへの回復の余地が生まれる可能性があります。もし買い手がそのエリアを奪還できれば、次に目に見えるレジスタンスは0.3568ドル付近となります。私はブレイクアウトを予測するよりも、確証を待つことを好みます。 🔴 弱気シナリオ:もしTRXが0.3198ドルを奪還できずに売り圧力が戻ってきた場合、0.3008ドルの需要ゾーンを再テストする可能性があります。このエリアを決定的に割り込めば、現在の回復シナリオは大幅に弱まるでしょう。 TRXを既に保有しているトレーダーへ 私個人としては、強気になる前に0.3198ドルのレベルを注視します。安値から保有しているトレーダーは、より高いターゲットへの継続を想定するよりも、レジスタンス付近での部分的な利確を検討しても良いでしょう。より強固なポジションを築くには、レジスタンスの奪還とモメンタムの改善による確証が必要です。 リスク管理 ⚠️ 0.3008ドルのエリアは重要な下値の目安です。確証のない反発は信頼できるエントリーとは言えません。需要ゾーンは反転が保証されているポイントではないため、エントリー、ストップロス、ポジションサイズ、リスクリワードはトレード前に計画しておくべきです。私の見解では、TRXは安定の初期兆候を見せていますが、4時間足の構造にはまだ改善の余地があります。小さな反発を追いかけて、再び拒絶されるような事態は避けたいところです。時には、資本を守り、市場が方向性を示すのを待つことが最良のトレードとなることもあります。 皆さんはどう考えますか?0.3198ドルを明確に上抜けた場合に買いを検討しますか、それとも0.3008ドルの再テストを待ちますか? #IMPACTbyTrade #ドイチェ銀行、デジタル資産カストディを開始 #WSOTあなたのAI取引を見せて10USDTを獲得 #WSOT2026
MY BYBIT 1H CHART IS SAYing....👇
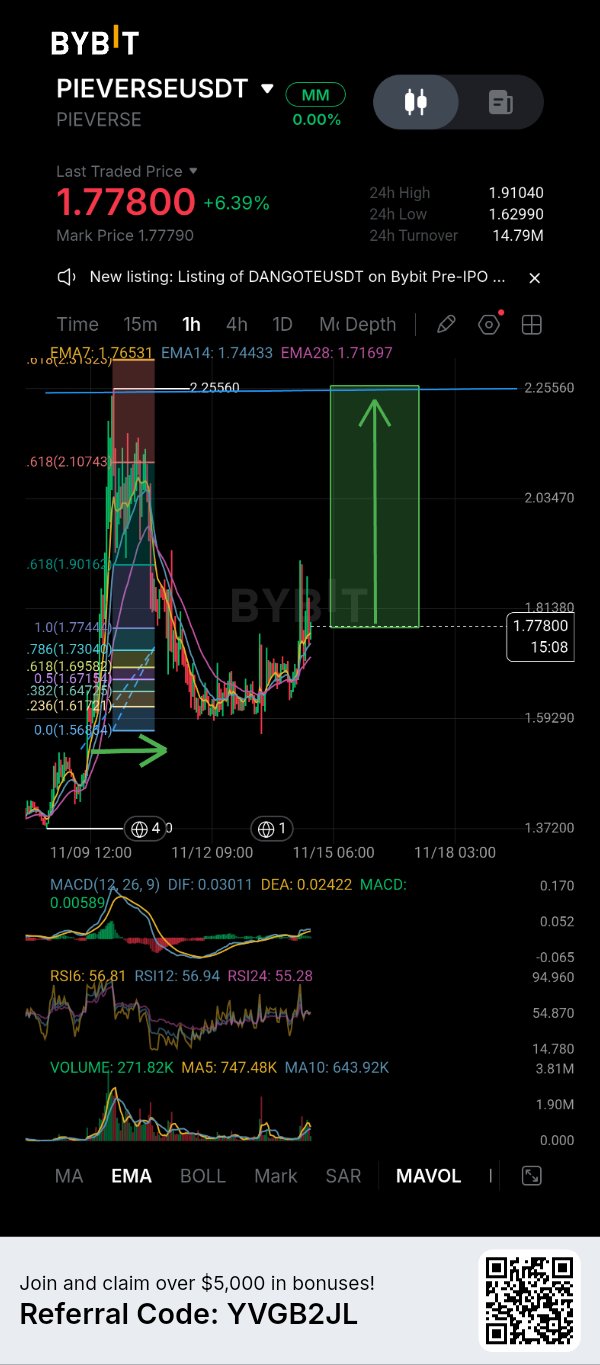
My previous analysis has successfully followed its projected path, just as I showed on the chart💥 $PIEVERSEUSDT buyers are regaining control but next resistance will be important✅ $PIEVERSEUSDT is showing an interesting recovery on the 1H chart. After the previous rejection from the $2.25 area, price went through a noticeable correction and eventually found support around the $1.56–$1.60 region. Since then, buyers have gradually stepped back in, and the latest move has pushed price toward $1.778, currently showing a 6.39% gain. What I find interesting here is that the recovery is not just about one green candle. Price has started moving back above the shortterm EMA structure, which suggests that momntum is improving. However, I don't want to confuse a strong recovery with a confirmed breakout just yet. 1H TECHNICAL STRUCTURE shortterm EMA levels are looking constructive EMA7: $1.76531 EMA14: $1.74433 EMA28: $1.71697 PRICE is currently trading above all three EMAs, which gives buyers a better short-term position. The $1.7744 Fibonacci level is also an important area to watch around the current price. RSI readings are sitting around 55–57, showing improving momentum without entering an extremely overbought condition. MACD is also positive, with DIF at 0.03011 and DEA at 0.02422. This supports the recovery, although I would still like to see stronger volume behind the move. BULLISH SCENARIO if buyers can maintain price above the $1.765–$1.774 region and reclaim the nearby $1.8138 resistance, the next important area becomes $1.9016–$1.9104. A convincing breakout above that zone could open the door toward higher Fibonacci levels around $2.0347 and $2.1074. chart also shows a larger upside projection toward $2.2556. I see that as a potential extended target rather than something the market is guaranteed to reach. BEARISH SCENARIO on the other hand, if price fails to hold the current recovery, I will be watching $1.7443 and $1.7304 first. Losing those areas could expose the $1.7169 EMA28 region. A deeper correction could bring price back toward $1.6958 and potentially the previous demand area around $1.56–$1.60. That would weaken the immediate bullish structure and require buyers to prove themselves again. FOR Traders Already Holding PIEVERSE I would avoid getting too aggressive after a 6% recovery. If price approaches $1.90–$1.91, taking partial profits could be worth considering, especially if momentum starts slowing down. For anyone looking toward the larger $2.25 projection, I would prefer to see a confirmed breakout and sustained buying pressure first. RISK MANAGEMENT ⚠️ a bounce without confirmation is not a reliable entry. I would rather watch how price behaves around the EMA support cluster than chase an extended candle. Entry, stop-loss, position sizing, and risk-to-reward should all be planned before entering. The market is volatile, so you have to manage your own risk. My Overall View💯 PIEVERSE is showing encouraging short-term strength, and the recovery structure currently favors buyers. But the real test is whether they can push through $1.8138 and eventually challenge the $1.90 resistance zone. I don't think chasing price is necesary here. Sometimes waiting for confirmation gives a much better opportunity than entering simply because the candles look bullish. What would you prefer here: buying a pullback around the EMA support zone or waiting for a confirmed breakout above $1.8138? Follow for more chart updates......👍 #ByXIMPACT #DeutscheBankLaunchesDigitalAssetCustody #WSOT2026 #WSOTShowYourAITradeToEarn10USDT

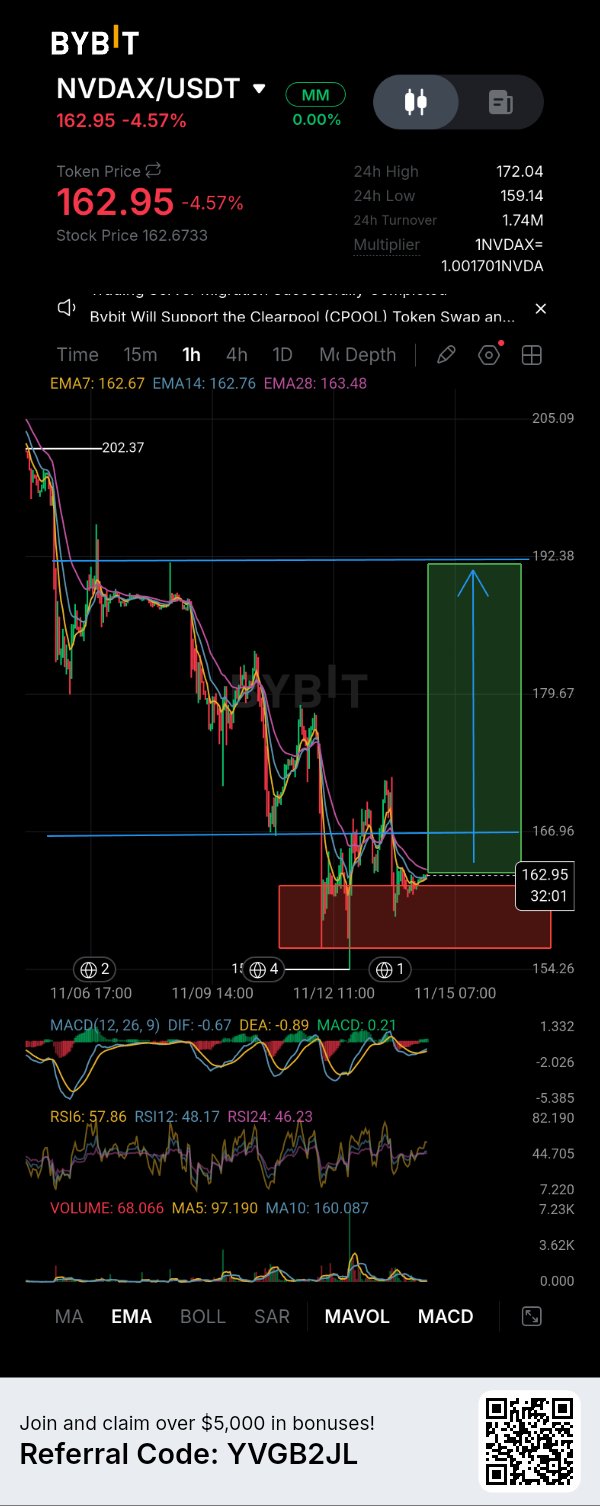
NVDAX UPDATE price is trying to stabilize, but bulls still have one major resistance to break MY BYBIT 1H CHART IS SAYing....👇 $NVDAXUSDT is trading around 162.95, down 4.57%, and I'm watching this area closely because the chart is starting to show some signs of stabilization after a significant correction..The bigger picture on the 1H chart is still not completely bullish. Price has fallen from the 202 area toward the 154–155 region before attempting a recovery. However, buyers are now trying to defend the lower support zone, and the recent price action suggests that selling pressure may be slowing down. I'm interested in this setup, but I don't want to confuse a short-term recovery with a confirmed trend reversal. 1H TECHNICAL ANALYSIS Here's what I'm watching👁️ EMA VALUES are curently EMA7 at 162.67, EMA14 at 162.76, and EMA28 at 163.48. Price is slightly above the shorter EMAs but remains below EMA28. This is an interesting situation because short-term momentum is improving, although buyers haven't fully regained control. The first important resistance is around 166.96. A convincing break above this level could give buyers room to challenge the 179.67 area. Beyond that, 192.38 is the next major upside level visible on my chart. That's an ambitious recovery target, not something I would assume will happen without confirmation. ON THE MOMENTUM SIDE MACD shows DIF at -0.67 and DEA at -0.89, with a positive histogram reading of 0.21. RSI6 is 57.86, while RSI12 and RSI24 remain around 48 and 46 respectively. This suggests some short-term recovery, but the broader momentum picture is still mixed. BULLISH SCENARIO If buyers continue defending the current consolidation area and reclaim 166.96, I would start paying more attention to a potential recovery toward 179.67. A sustained move above that resistance could strengthen the bullish case for another attempt toward 192.38. BEARISH SCENARIO If price fails to reclaim 166.96 and selling pressure returns, the current recovery could turn into another rejection. The marked support region around 156–162 is important. Losing that area would weaken the recovery structure and expose the previous low near 154.26. I would rather wait for buyers to demonstrate strength than enter simply because price has already fallen significantly. For Traders Already Holding NVDAX I wouldn't approach this chart with an all-or-nothing mindset. Traders considering profit-taking could watch the 166.96 resistance first, followed by 179.67 if recovery continues..For anyone holding through the correction, protecting capital and reassessing the structure after each major resistance test makes more sense than blindly waiting for 192.38. RISK Management 154.26 area is the important visible downside reference. A breakdown below the marked support region would significantly weaken the immediate bullish thesis. A bounce without confirmation is not a reliable entry. Liquidity zones are not automatically buying opportunities. Entry, stop-loss, and risk-to-reward should be established beforehand, with position sizing adjusted to the risk involved. My Final View 👍 I can see why this setup is attracting attention, especially with short-term momentum showing some improvement. But the market hasn't confirmed a complete reversal yet. For now, 166.96 is the level I want buyers to reclaim. I'd rather miss the first part of a recovery than chase a move that hasn't established its strength. What would you prefer here: buying near the current support zone or waiting for a confirmed breakout above 166.96? market is volatile, so you have to manage your own risk......✅ #ByXIMPACT #SanDiskAnnounces8For1StockSplit #AITechSelloffErases2Point5TrillionFromNasdaq100 #DeutscheBankLaunchesDigitalAssetCustody

絶好のチャンス! $BTC 👉押し目買いのタイミング
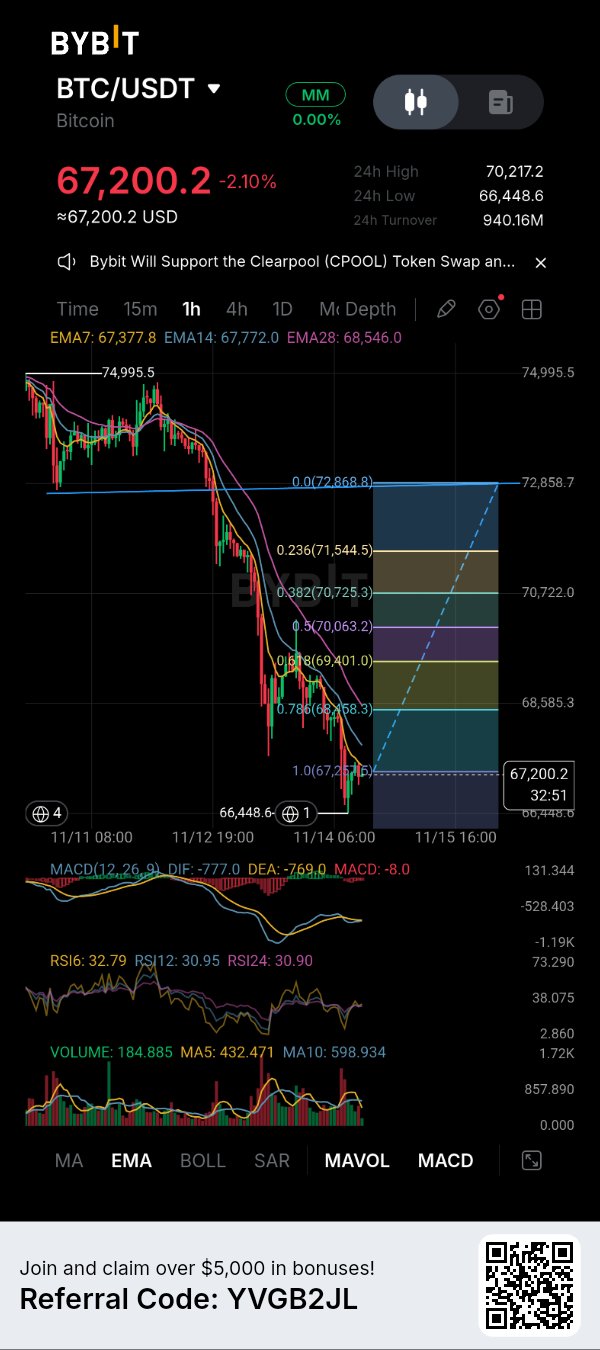
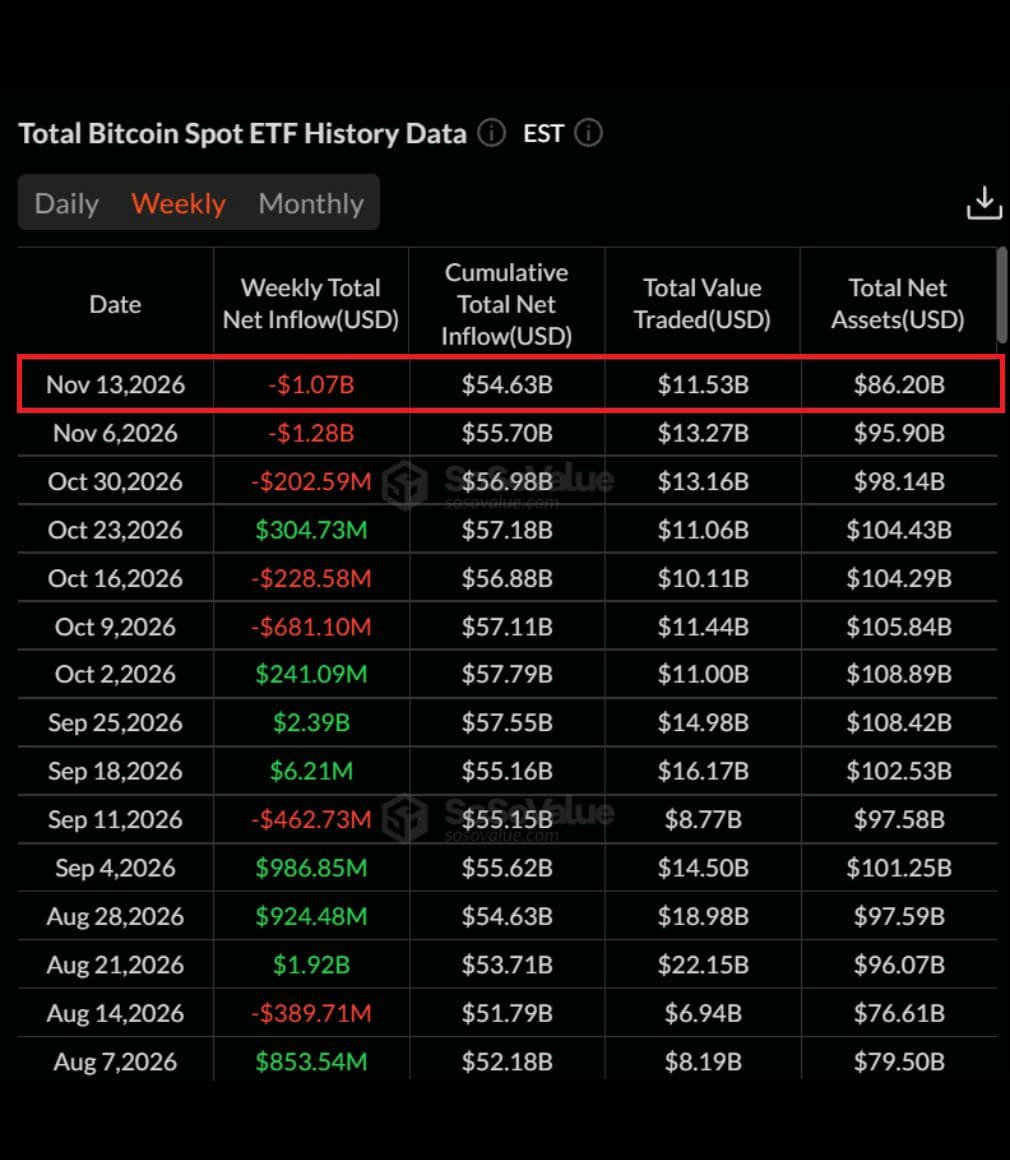
ビットコインETFからの資金流出が無視できない状況になりつつあります。BlackRockをはじめとする現物ビットコインETFから、今週だけで10.7億ドル相当のBTCが売却されたと報じられており、今月のETFからの総流出額は23.5億ドルを超えました。正直なところ、この動きは注視しています。機関投資家の需要は市場心理において重要な役割を果たすため、売り圧力が続けばビットコインの回復はさらに難しくなる可能性があります。とはいえ、性急な結論は避けるべきでしょう。買い手がこの圧力を吸収できるか、見極める必要があります。 Bybitの1時間足チャートが示しているのは....👇 【BTC緊急アップデート】67,000ドルをテスト中:いよいよ回復か、それともさらなる下落か?🤔 $BTCUSDT は短期的な弱さを明確に示しており、今は底を拾おうとするよりも、忍耐が重要な局面だと考えています。BTCは現在約67,200ドルで取引されており、7万ドル近辺から下落し、約2.10%安となっています。1時間足チャートは下降トレンドが続いており、安値を切り下げ、3本のEMAすべてが現在価格の上に位置しています。 注目しているポイントはこちら👁️🗨️ 1. 短期的な市場構造 まず重要なのはEMAの構造です。 EMA 7は約67,377ドル、EMA 14は約67,772ドル、そしてEMA 28はさらに高い68,546ドル付近にあります。ビットコインはこれら3本すべてを下回って推移しており、短期的には依然として売り手が主導権を握っていることを示しています。直近の安値である66,448.6ドル近辺が、私が注視している当面のラインです。価格はこのエリアで反応を見せましたが、反転が確定したとは言い難い状況です。 RSIは30~33付近で推移しており、かなりの下落モメンタムと、売られすぎの可能性を示唆しています。MACDも依然としてマイナス圏にあり、DIFは約-777、DEAは約-769となっています。自律反発の可能性はありますが、RSIが売られすぎているという理由だけでロングポジションを取るべきではありません。 2. 重要なフィボナッチ・レベル 目に見えるフィボナッチ・レベルは、回復に向けた有用なロードマップを示してくれます: 67,201ドル:当面の基準値。 68,458ドル:最初の意味のある回復抵抗線。 69,401ドル:次の上昇チェックポイント。 70,063ドル:重要な抵抗線。 70,702ドル:さらなる回復目標。 71,544ドル:高値側の抵抗線。 72,858ドル:視覚的に重要なフィボナッチ基準値。 BTCがこれらすべてのレベルを即座に奪還するとは考えていません。買い手はまずEMA群を回復し、その上で価格を維持できることを証明する必要があります。 3. 2つのシナリオ 強気シナリオ: ビットコインが66,448ドルの安値を守り切り、高値を切り上げ始めた場合、67,772ドル、そして最終的には68,458ドルへの回復を注視します。 68,546ドルをしっかりと奪還できれば、短期的な見通しはより面白くなります。その先には、69,401ドルが次の重要な上値目標となります。 弱気シナリオ: もしBTCが66,448ドルを明確な売り圧力で割り込んだ場合、現在の回復の試みは失敗に終わり、さらなる下落局面へ発展する可能性があります。 スクリーンショットからは信頼できる深い下落ターゲットを割り出すための確定的な情報は得られないため、適当な予測を立てるよりも様子見を優先します。 4. BTCを保有しているトレーダーへ このチャートをすべての保有者が即座に手仕舞うべき理由とは思いません。しかし、短期トレーダーは、エントリー位置やリスク許容度に応じて、抵抗線までの回復局面で一部利益確定を検討してもよいでしょう。 買い増しを考えている方については、RSIが売られすぎているという理由だけで平均取得単価を下げる(ナンピンする)のではなく、抵抗線の奪還が確定するのを確認することをお勧めします。 リスク管理: 66,448ドル付近は当面の下値基準です。これを明確に割り込めば、短期回復の可能性は低下します。 確定的なシグナルがない状態での反発は、信頼できるエントリーポイントではありません。流動性エリアだからといって、自動的に買い場になるとは限りません。エントリー、ストップロス、ポジションサイジング、リスクリワードは、取引を開始する前にすべて設定しておくべきです。 最後に ビットコインは興味深いエリアに近づいていますが、1時間足の構造はまだ強気には転じていません。自信を持ってトレードするには、買い手が重要なレベルを奪還するのを見届ける必要があります。 時には、資本を守り、確証が得られるまで待つことが最善のトレードとなります。 皆さんのアプローチはどうですか? 66.4K~67Kドル付近でBTCの購入を検討しますか?それとも68.5Kドル超えの回復を確認するまで待ちますか? 市場は不安定ですので、各自でリスク管理を行ってください。 チャート更新情報を見逃さないようフォローしてください。 投資助言ではありません。ご自身で調査を行ってください。 #ByXIMPACT #米中間選挙後、ビットコインが2か月ぶりの安値を記録

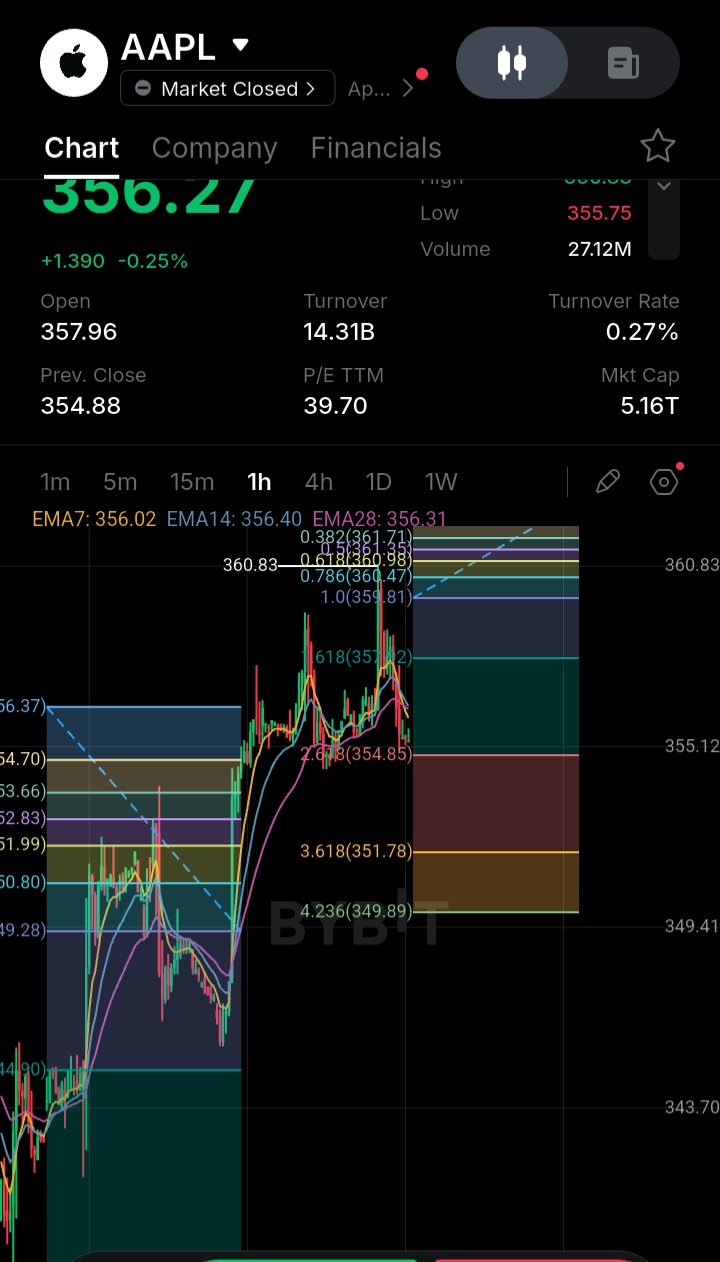
$AAPL 360.83のレジスタンスゾーンに到達後、調整局面入り。 私のBYBIT 1時間足チャート AAPLXUSDT は、最近の強気な上昇の後、短期的な過熱感の兆候を示しています。価格は340ドル台前半から押し上げられ、強力な回復構造を形成し、最終的に360.83ドルのエリアに到達しました。しかし、買い手はその勢いを維持するのに苦戦しており、直近のローソク足は高値からの調整を示しています。株価は現在約356.27ドルで取引されており、セッション安値は355.75ドルです。ここで重要なのは、拒否された後に価格が短期EMAクラスターに戻っているという点です。ここが、買い手が回復を維持する意志があるかどうかを見極めたいポイントです。 インジケーターが示唆していること📊 EMA構造が特に興味深い動きを見せています。 EMA7: 356.02ドル EMA14: 356.40ドル EMA28: 356.31ドル 価格は現在EMA7をわずかに上回っていますが、EMA14とEMA28の下にあります。これらの平均線は密集しており、短期的なモメンタムが決断力を欠いていることを示唆しています。私にとって、356.00ドル~356.40ドルのエリアは重要です。このクラスターを維持して上回れば直近の回復構造は改善しますが、繰り返し拒否されれば売り手が主導権を握ったままになる可能性があります。フィボナッチ構造にも注目が必要です。目に見える上値のリトレースメントエリアは約359.81ドルから361.71ドルに広がっており、直近高値は360.83ドル付近です。現在の価格の下では、チャート上に354.85ドル、351.78ドル、349.89ドルという重要なエクステンションレベルが表示されています。 部分的に確認できるMACDの数値は、DIFが-0.00付近、DEAが0.32前後、MACDが-0.33前後を示しています。これは短期的な負のモメンタムを示唆していますが、強気への転換を確認する前に、ヒストグラムのより明確な回復を見たいところです。 出来高は27.12Mと表示されていますが、平均出来高との明確な比較がないため、参加状況について強い結論を出すのは控えます。 主要価格レベル🎯 サポート🟢 355.75ドル – 直近で確認できるセッションサポート。 354.85ドル – 重要なフィボナッチ・エクステンションレベル。 351.78ドル – 次の下値エクステンション。 349.89ドル – より深い構造的なエクステンション。 レジスタンス🔴 356.31ドル~356.40ドル – 短期EMAのレジスタンスクラスター。 359.81ドル – 重要なフィボナッチ・リトレースメントレベル。 360.83ドル – 最近の目立ったスイングハイ。 361.71ドル – 上値フィボナッチ・レジスタンス。 次はどうなる? 弱気シナリオ:もしAAPLが355.75ドルを割り込み、奪還できなければ、354.85ドルを注視します。そのレベルを明確に下回れば、351.78ドル、そして349.89ドルまで下落する可能性があります。 強気シナリオ:もし買い手が現在のサポートを守り、EMAクラスターを奪還できれば、359.81ドルへの回復が可能になります。360.83ドルを上抜けて維持できれば、強気のモメンタムが戻ってきたというより強いシグナルになります。 私の市場の見通し 今は慌ててエントリーすべきではありません。前回の強気な動きは力強かったですが、直近の拒否は、買い手が自分たちの強さを再び証明する必要があることを示しています。私の主な焦点は355.75ドル~354.85ドル付近での反応です。このエリアが維持され、価格が短期EMAを奪還し始めれば、回復シナリオの魅力は増します。 しかし、サポートが崩れた場合、以前の構造が強気だったというだけの理由でロングを狙い続けるつもりはありません。 今のところ、どちらの方向に賭けるよりも、忍耐強く待つ方が賢明です。この調整がすでに終わったと決めつけるのではなく、確認を待ちたいと思います。 市場は常に予想外の方向に動く可能性があるため、リスク管理は依然として不可欠です....✅ ByXIMPACT

💥 Get your Bybit Card now💥
#NewFinancialPlatform I MEAN actually..... have you ever thought about how much value gets lost in everyday spending? We make small purchases almost every day, whether it's shopping, subscriptions, food, or other regular expenses. But what if some of that spending could also bring something back? I'M REALLY SURPRISED that's an interesting idea behind the Bybit Card 💥 Instead of treating everyday purchases as money going out with nothing in return, Bybit introduces a cashback system that rewards eligible crypto spending. Depending on your tier, you can enjoy between 2% and 10% cashback. OF COURSE, the actual benefit depends on your tier and how much you spend. I wouldn't look at cashback as a reason to spend more than necessary. That would defeat the purpose, honestly. What interests me more is how crypto platforms are gradually connecting digital asets with real-world payment habits. People don't necessarily want to keep crypto limited to trading anymore. They also want practical ways to use it. MAYBE that's where products like the Bybit Card become more relevant over time. Let's see how this approach develops. Get your Bybit Card: https://i.bybit.com/1EabGihJ #WSOT2026 #WSOTShowYourAITradeToEarn10USDT #AnthropicIPOTestsTheAIBoom #JensenHuangExitTestsNvidiasAILeadership $AAPLXUSDT $METAXUSDT

CRYPTO MARKET IS BLEEDing AGAIN 🔴
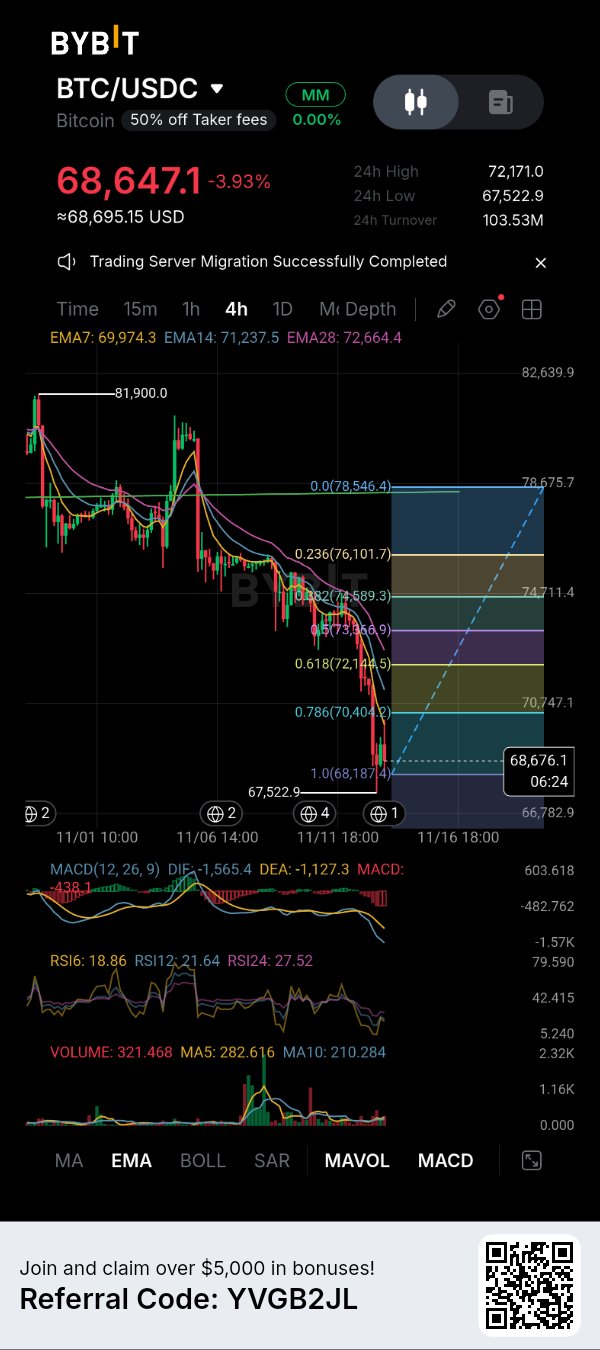
$BTC below $70K, $ETH below $2K and $BNB around $642. Fear & Greed Index: 21 (Extreme Fear) My Portfolio is also deep in red, but I'm still holding strong! How's your portfolio doing? Are you buying the dip, holding, or selling? BITCOIN'S TREASURY narrative is getting more interesting. Texas Democrat Ron Reynolds has introduced a bill allowing cities and counties to buy up to $10 million in Bitcoin. With over 1,450 local governments in Texas, that's worth watching. Still, a proposed bill doesn't mean actual buying pressure. I'm more interested in whether this idea develops into real adoption. For now, I won't chase headlines. Bitcoin still needs to prove its strength through price action🤔 MY BYBIT 4h CHART $BTCUSDT is showing signs of short-term exhaustion, but I'm not ready to call this a confirmed bottom yet. BTC is trading around $68,647 on the 4H chart after an aggressive decline from the $81,900 swing high. The important thing here is that sellers have maintained control throughout the move, and price is still trading below all three visible EMAs : EMA7 at $69,974, EMA14 at $71,237, and EMA28 at $72,664. That alignment tells me the broader short-term structure remains bearish. However, there is something worth watching. RSI6 has dropped to 18.86, RSI12 to 21.64, and RSI24 to 27.52. All three are in deeply oversold territory. MACD is also negative, confirming that bearish momentum remains significant. Price recently reached $67,522.9 before recovering toward the $68,600 area. I'm watching this low very carefully because another rejection followed by a fresh breakdown could expose Bitcoin to further downside. FOR A POTENTIAL LONG i would rather see buyers defend the $67,522–$68,187 area and establish a higher low. A recovery above $69,974 would be my first indication that short-term momentum is improving. If buyers manage to reclaim the higher resistance levels, my upside areas would be $70,404, followed by $72,144 and $73,566. The $76,101 region would become relevant only if the recovery develops into a stronger structural reversal. ON THE OTHERHAND losing $67,522 with sustained selling pressure would invalidate my immediate recovery idea. I wouldn't blindly buy just because RSI is oversold. My preference right now is patience. The risk-to-reward on a confirmed recovery could become interesting, but entering before buyers demonstrate strength is a different story BITCOIN needs to prove that selers are losing control before I consider a serious long position....👍 market is volatile, so you have to manage your own risk. Follow for more chart updates. Not financial advice. Do your own research💯 #ByXIMPACT #BitcoinHitsTwoMonthLowAfterUSMidterms #DeutscheBankLaunchesDigitalAssetCustody #AnthropicIPOTestsTheAIBoom

ふーん、なるほどね……。投資家って、今の出来事に集中しすぎて、これから1年先に何が起こるかを見落としがちだなと感じることがあります。 今のハイテク市場を見てみましょう。大手テック株は売り圧力に直面していて、AIインフラへの支出が懸念材料になっています。投資家たちは、これらの企業が莫大な投資を将来の利益に変えられるのか疑問視しています。ですが、ゴールドマン・サックスは違う見方をしています。ブルームバーグの11月13日のレポートによると、ピーター・オッペンハイマー率いるストラテジストたちは、S&P 500が今後12ヶ月で約14%上昇し、8,700に達すると予想しています。また、同チームは2027年に向けて米国株と日本株を選好し、欧州株についてはアンダーウェイトを維持しています。 私が注目したのは、この楽観論の背景にある理由です。一時的な不確実性の時期に、強固なビジネスを買うことを考えてみてください。株価は下落していますが、その企業の財務基盤が崩壊したわけではありません。それによってビジネスの価値が下がったと言えるでしょうか、それともチャンスが生まれたのでしょうか? これこそが、ゴールドマン・サックスが大手テクノロジー企業、特にハイパースケーラーに対して目を向けているポイントです。 これらのクラウド巨人は、AIインフラに巨額の投資を行っています。支出は莫大で、キャッシュフローはマイナスに転じています。これは正当な懸念であり、投資家が単純に無視していいものではありません。 しかし、ゴールドマンは、純負債資本倍率(ネット・デベ・トゥ・エクイティ)など、彼らのバランスシートは健全なままだと指摘しています。簡単に言えば、多額の支出=企業の財務が弱い、というわけではないのです。巨大な工場を建てるようなものです。初期費用は高くつきますが、重要なのはその工場が将来的に十分な収益を生み出せるかどうかです。最近の下落によりバリュエーションも変化しました。ナスダック100は10月初旬の高値から約9%下落しています。ゴールドマンは、一部の大手クラウドプロバイダーは現在、歴史的なバリュエーション水準を下回って取引されていると考えています。 個人的には、ここが投資家が慎重になるべきところだと思います。安い価格が必ずしも「より良い投資」を意味するわけではありません。将来の収益、インフラコスト、そして実質的なリターンは依然として重要です。 もう一つの興味深い点は金利です。ゴールドマンは、債券利回りの低下、インフレの緩和、原油価格の下落から恩恵を受ける可能性のある企業を選好しています。しかし、現在の状況がそれを完全に裏付けているわけではありません。米10年債利回りは5%を超えており、市場は12月のFRBの利上げの可能性を織り込み始めています。つまり、ゴールドマンが期待するチャンスと、私たちが今日目にしている状況との間には、まだギャップがあるのです。欧州もこの議論における興味深いパートです。ストックス欧州600指数は最近史上最高値を更新しましたが、ゴールドマンはバリュエーションへの懸念、政府債務問題、政治的不確実性を理由に、依然として欧州株をアンダーウェイトすることを推奨しています。 興味深いことに、シティは異なる意見を持っています。最近、米国株をニュートラルに格下げし、英国を除く欧州株をオーバーウェイトに格上げしました。 2つの主要機関が、2つの異なる見解を示している。 正直なところ、経験豊富なストラテジストでさえ、市場がどこに向かうのかの保証された地図は持っていないということを思い知らされますね。私の結論は単純です。次の12ヶ月を最近のハイテク株売りの状況だけで判断はしません。企業のバランスシート、将来の収益、AI支出の回収、そして債券利回りを総合的に見ていきます。 S&P 500は今年すでに11%上昇しているので、盲目的に市場を追いかけるのはあまり意味がないと思います。真のチャンスは、今日の大規模な投資を明日の持続的な成長に変えられる企業を理解するところから生まれるのかもしれません。 市場はボラティリティが高いので、自分でリスク管理をしないとね……👍 フォローして市場の最新情報をチェック #ByXIMPACT #WSOTあなたのAI取引を見せて10USDTを獲得 #米PPIが「高金利長期化」取引を試す #サンディスクが8対1の株式分割を発表 #AITechSelloffErases2Point5TrillionFromNasdaq100 $NVDAXUSDT $AAPLXUSDT