Smangoge
4126いいね0シェア149ファン355フォロー
Suleiman Mohammed
Suleiman Mohammed
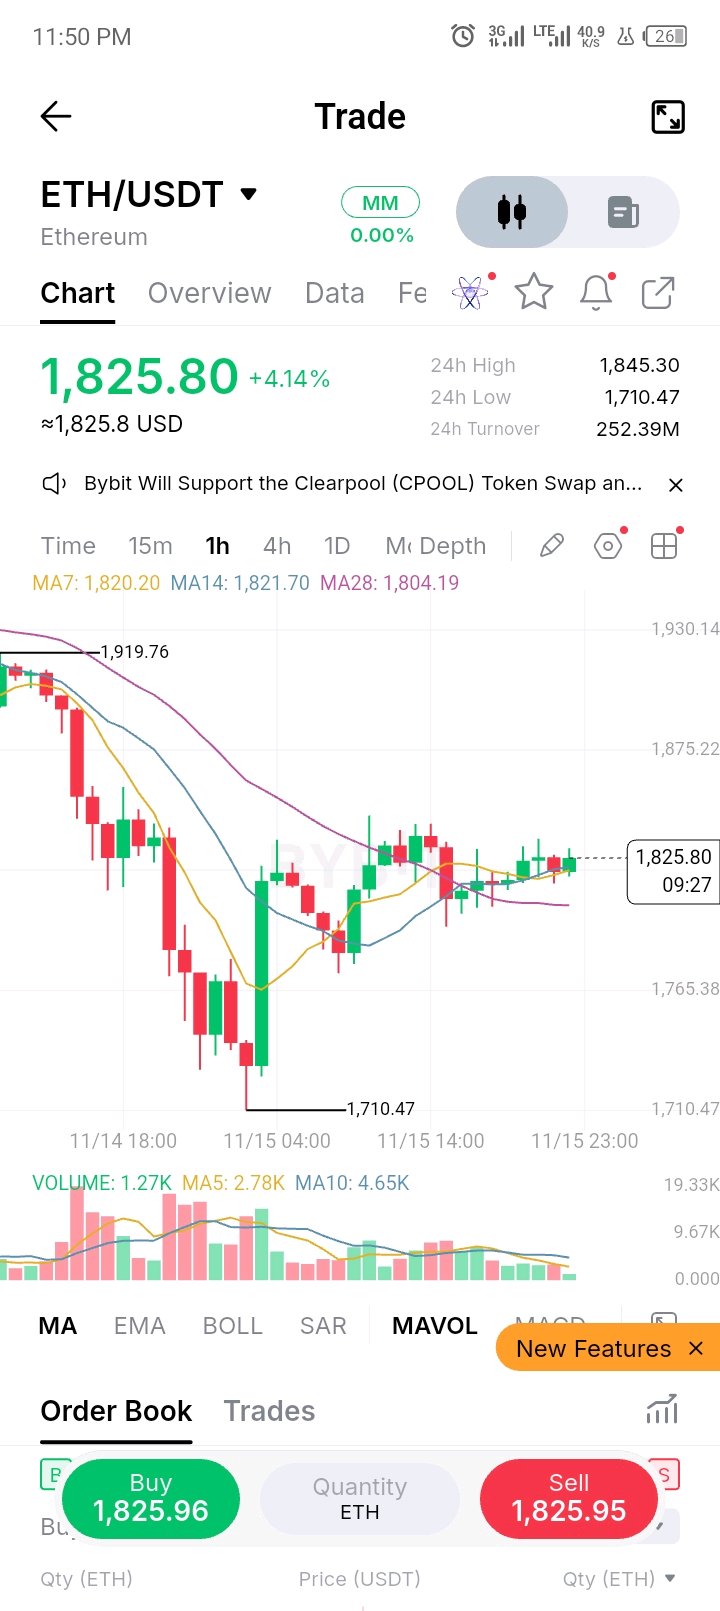
$ETHUSDTはすべての移動平均線(MA)を回復し、1,710.47から6.7%反発しました。これが大底なのか、それとも1,845.30が罠なのか? 状況 ETHはこのチャートの最高値2,271.33から約20%下落しており、1,710.47からの上昇分のほとんどを吐き出しています。現在の価格は1,825.80(+4.14%)で、1,710.47の安値を付けた後、7日移動平均線(MA7: 1,820.20)を0.31%上回る位置にあります。MA14(1,821.70)とMA28(1,804.19)はその下にあり、すべて強気の順序で並んでいます。日曜の深夜で、1時間足は始まって約30分です。 売買高と出来高 24時間の売買高は約2.52億USDT、ETH換算で約13.8万ETHです。この1時間足だけで、5日平均(2.78K)の約0.46倍、10日平均(4.65K)の約0.27倍にあたります。5日平均は10日平均を下回って推移しており、反発局面で出来高は減少傾向にあります。今日のローソク足はすでに1.27Kの取引がありました。フラッシュクラッシュ(急落)はしっかりとした出来高を伴って発生しており、これはウォッシュアウト(投げ売り)によく見られるパターンですが、それで底打ちしたとは限りません。 モメンタム 価格は3本のMAすべての上にあり、MAは上向き始めています。前回の反発は1,919.76で売り込まれ、その後1,710.47まで安値を切り下げ、そこから1,820.20を回復しました。モメンタムは転換しつつあるので、動く前に市場の反応を見極めたいところです。回復してそのまま維持できれば反発の形になりますが、壁を上抜けて引けない反発は、単なる反発に過ぎません。 サポートとレジスタンス サポート:1,804.19(MA28)、約1,820.20(MA7)、その下に1,710.47(24時間安値)。これより下には明確なレベルはありません。 レジスタンス:1,845.30(24時間高値、現状の壁)、約1,875.22(次のレベル)、1,919.76(前回の高値)、その先に2,271.33。 注目すべきレベル 1,804.19〜1,820.20がフロアで、MAが防衛ラインです。1時間足が1,804.19を下回って引ければ、1,765以下が開けてきます。上値については、1,845.30が壁で、ここが24時間高値とラウンドナンバーが重なるポイントです。 トレードプラン 反発狙い:1,804〜1,820で、市場の反応(拒絶のヒゲ、または1,820.20以上での1時間足確定)を確認した上で買い。損切りは1,795の下に。ターゲットは1,845.30と1,875.22で、1,812からのエントリーならリスクリワード比(R)は約1.5Rおよび2.5Rです。 続落狙い(ショート、あるいはロングを見送る):1,845.30への再テストが拒絶されるのを待ち、損切りは1,855の上。ターゲットは1,820.20と1,804.19で、1,845からのエントリーなら約1.5Rおよび2.2Rです。 +4.14%のローソク足の真ん中で1,825.80を買うつもりはありません。損切りは1,804.19の下に置くべきで、最初のレジスタンスである1,845.30まではわずか19ドルしかなく、リスクリワードが1R未満になります。 リスクに関する注意 ETHは過去24時間で約7.9%(1,710.47〜1,845.30)変動しました。週末は流動性が薄く、ヒゲはあらゆるレベルを突き抜ける可能性があるため、エントリーよりもポジションサイズが重要です。売られすぎの指標が出ていても、そのまま売られ続けることはあります。MAのレベルは厳密な線ではなくゾーンとして捉えてください。レベルは私自身のチャートに基づいています。投資助言ではありません。 大底なのか、それとも1,845.30が罠なのか?1,845.30での反応が答えを教えてくれるでしょう。 教育目的のみであり、投資助言ではありません。 $ETHUSDT#ByXIMPACT
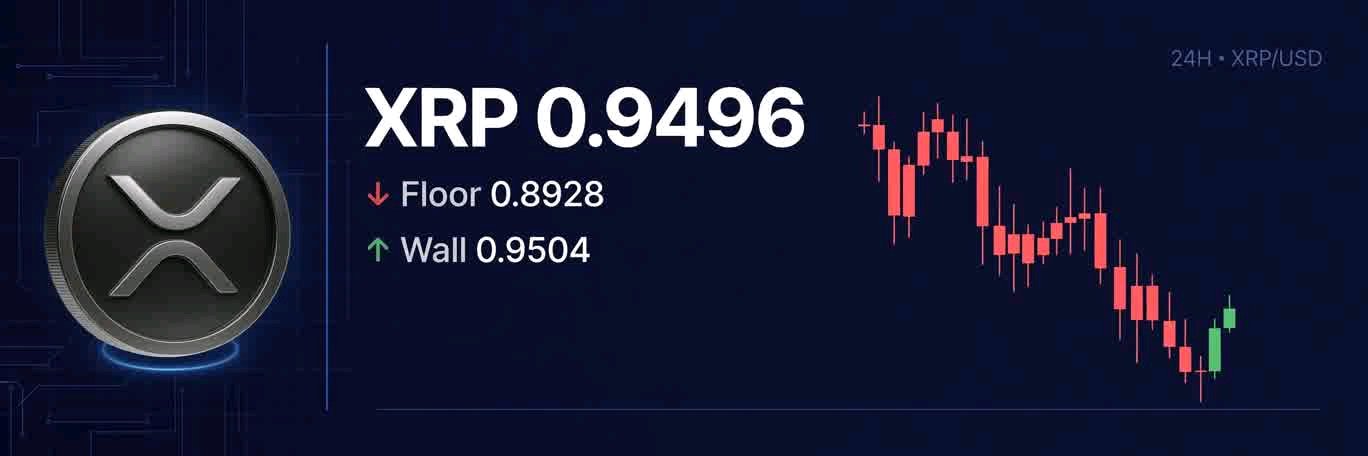
$XRPUSDT is sitting right on its MA7 at 0.9496. Is this the hold, or is 0.8928 next? Context XRP is about 15% off the 1.1168 high on this chart and has given back most of its run from 0.8928. Price is 0.9496 (+0.22%) after a low of 0.8928, sitting 0.08% below the 7-day average: MA7 (0.9504), with MA14 (0.9751) and MA28 (1.0086) above, all stacked in bearish order. It's a Sunday, and the 4h candle is about 2 hours old. Turnover and volume 24h turnover is about 47.09M USDT, roughly 49.5M XRP, about 0.30x the 5-day average of 6.04M and 0.24x the 10-day (7.55M) on this 4h candle alone. The 5-day average is running below the 10-day, so volume has been shrinking into the decline, and today's candle has already traded 1.84M in its first hours. The flush came on real volume, which is how washouts tend to look, though it doesn't prove it's over. Momentum Price is just under MA7 and below MA14 and MA28, and the MAs are fanned out pointing down. The last bounce was sold into 0.9794, then price made a lower low at 0.8928. Momentum is still falling, so I want a reaction before I act. Oversold plus a volume flush sets up a bounce, but a bounce without a close above the wall is just a bounce. Support and resistance Support: 0.8928 (24h low), about 0.89 (round number), then 0.85, not a proven level. Resistance: 0.9504 (MA7, now flipped), about 0.9751 (MA14), 0.9794 (24h high), 1.0086 (MA28), then 1.1168 (earlier high). Level to watch 0.8928 - 0.91 is the floor, with today's low as the line. A 4h close under 0.8928 would open 0.85 and below. On the upside, 0.9504 - 0.9751 is the wall, where the flipped MA7, the MA14 and the 24h high meet. Trade plan Bounce: buy 0.8928 - 0.91 only on a reaction (a rejection wick or a 4h close back above 0.9504), stop under 0.885. Targets are 0.9751 and 0.9794, roughly 1.5R and 1.6R from 0.90. Continuation (short, or simply no longs): wait for a retest of 0.9504 - 0.9751 that gets rejected, stop above 0.985. Targets are 0.91 and 0.8928, roughly 1.8R and 2.5R from 0.962. I'm not buying 0.9496 in the middle of a +0.22% candle. The stop belongs under 0.8928, and the first resistance at 0.9504 is only about 0.0008 above, so it pays under 1R. Risk note XRP ranged about 9.7% in the last 24 hours (0.8928 to 0.9794), weekend liquidity is thinner, and wicks can run through any level, so size matters more than entry. Oversold readings can stay oversold. MA levels are zones, not exact lines. Levels come from my own chart. Not financial advice. Is the washout done, or is 0.85 next? The reaction at 0.9504 will say. For education only, not financial advice.$XRPUSDT#ByXIMPACT
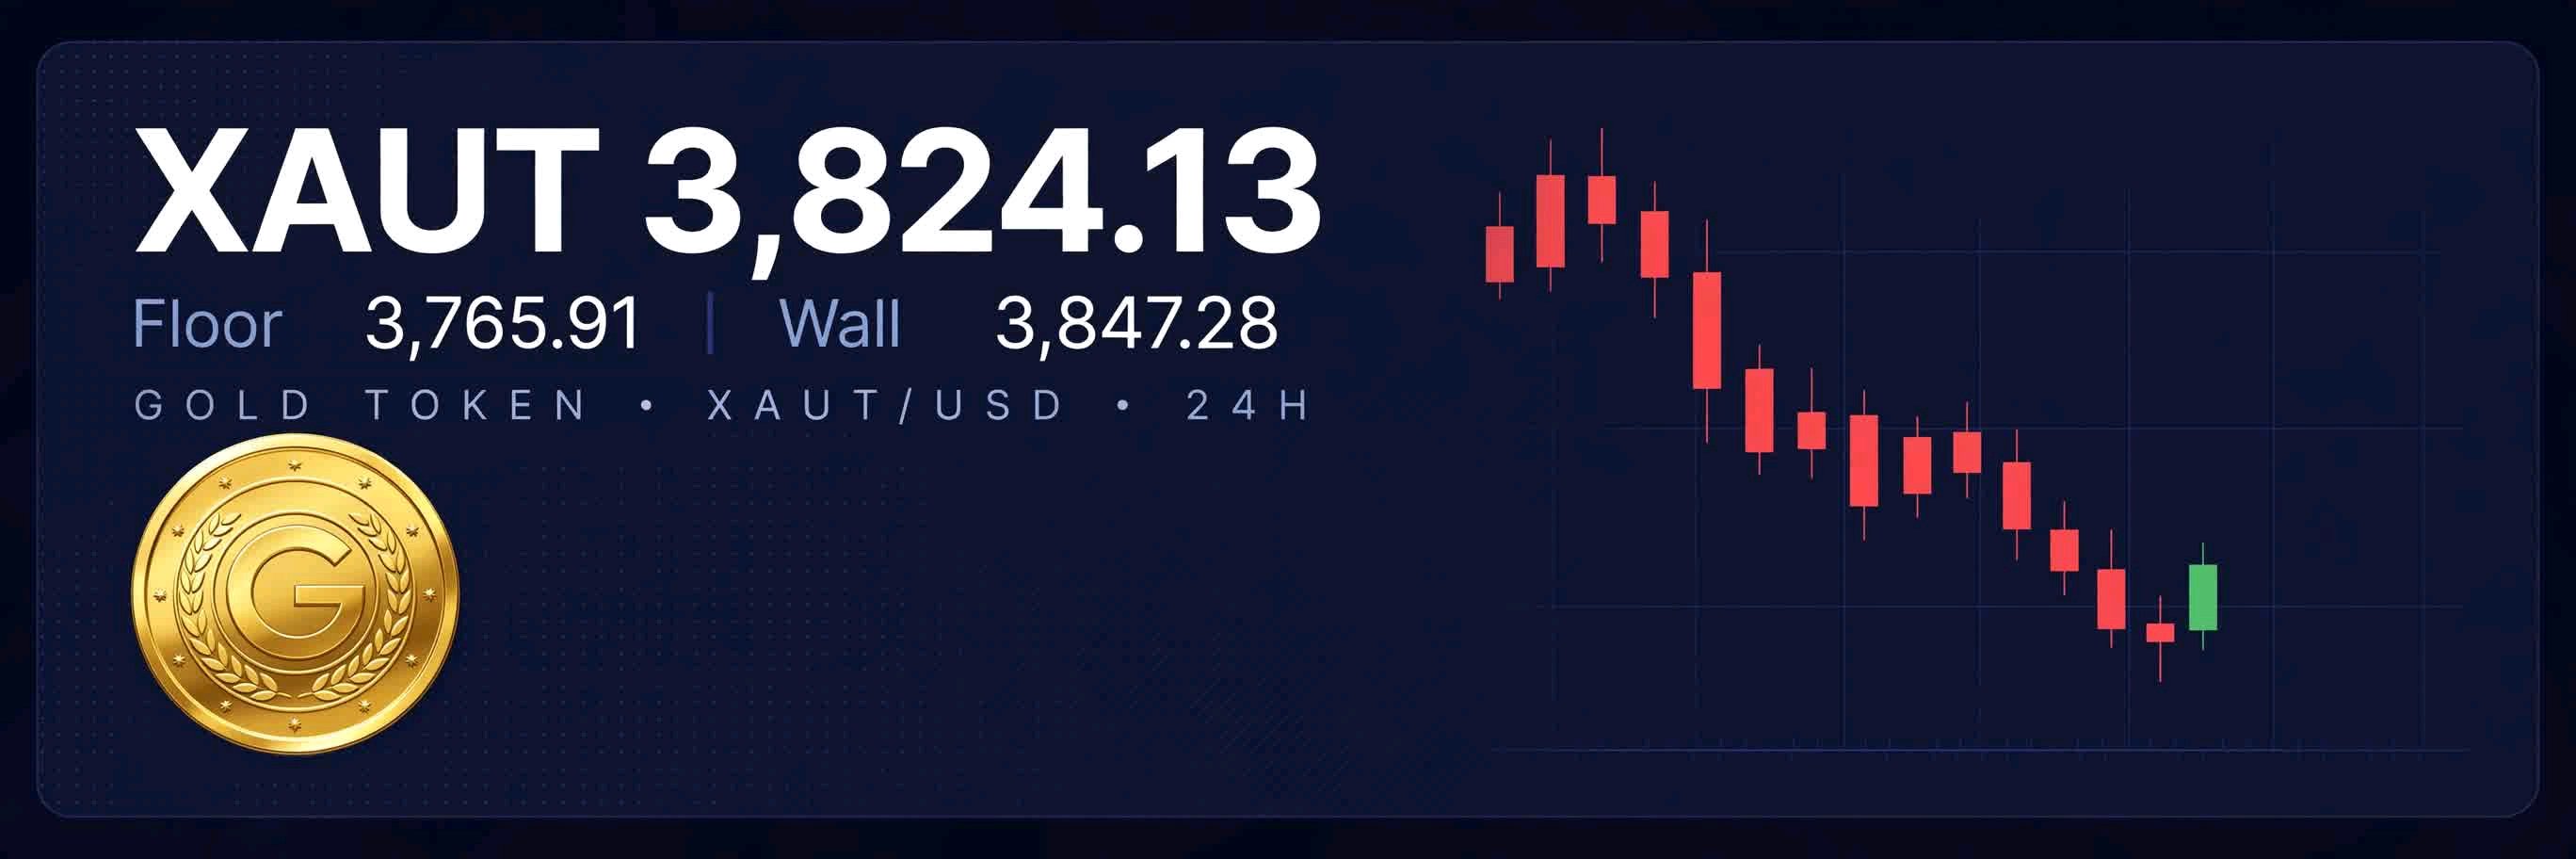
$XAUTUSDTはMA7の3,824.13にちょうど位置しています。ここは耐えるべきか、それとも次は3,765.91が来るのでしょうか? コンテキスト XAUTはこのチャートの最高値4,130.11から約7.4%下落しており、3,765.91からの上昇分をほぼ帳消しにしています。価格は3,765.91という安値を付けた後、3,824.13(-1.05%)となっており、7日移動平均線(MA7: 3,823.68)の0.01%上を推移しています。その上にはMA14(3,847.28)とMA28(3,901.76)があり、すべて弱気な並び(ベアリッシュ・オーダー)になっています。今日は日曜日で、4時間足は始まってから約2時間が経過したところです。 売買代金と出来高 24時間の売買代金は約1,304万USDT(XAUT換算で約3,410)で、これは5日平均の472.865の約0.11倍、10日平均の411.342の約0.12倍に相当します(この4時間足単体で)。5日平均が10日平均を上回っているため、下落局面で出来高が拡大しており、今日のローソク足は最初の数時間ですでに50.568を取引しています。このフラッシュ(急落)は本物の出来高を伴っており、これはウォッシュアウトによく見られる動きですが、これで終わりとは限りません。 モメンタム 価格はMA7の上にありますが、MA14とMA28の下にあり、移動平均線はファン状に下を向いています。最後の反発は3,866.49で売られ、その後、価格は3,765.91という安値を更新しました。モメンタムは依然として低下しているため、行動を起こす前に反応を見極めたいところです。売られすぎの状態と出来高を伴うフラッシュは反発のセットアップとなりますが、壁を上回って引けない反発は、単なる反発に過ぎません。 サポートとレジスタンス サポート:3,765.91(24時間安値)、約3,750(キリ番)、その次は3,700(未確認レベル)。 レジスタンス:3,847.28(MA14、現在は反転)、約3,866.49(24時間高値)、3,901.76(MA28)、そして4,130.11(以前の最高値)。 注視すべき水準 3,765.91~3,790がフロアであり、今日の安値がラインとなります。4時間足が3,765.91の下で引ければ、3,750やそれ以下が見えてくるでしょう。上値については、3,847.28~3,866.49が壁となり、反転したMA14と24時間高値が交差する場所です。 トレードプラン 反発狙い:3,765~3,790で、反応(拒絶のヒゲや4時間足が3,847.28を上回って引けるなど)があった場合のみ買い。損切りは3,750の下。ターゲットは3,866.49と3,901.76で、3,780からのエントリーでリスクリワード比は約1.5Rおよび2.5R。 継続(ショート、またはロングなし):3,847.28~3,866.49への再テストで拒絶されるのを待ち、損切りは3,870の上。ターゲットは3,790と3,765.91で、3,855からのエントリーでリスクリワード比は約1.8Rおよび2.5R。 -1.05%のローソク足の途中で3,824.13を買うつもりはありません。損切りは3,765.91の下に置くべきですし、最初のレジスタンスである3,847.28まではわずか23程度しかなく、リスクリワード比は1Rに満たないからです。 リスクに関する注意点 XAUTは過去24時間で約2.7%(3,765.91~3,866.49)変動しました。週末は流動性が薄く、ヒゲはどのレベルも貫通する可能性があるため、エントリーよりもサイズ(ポジション量)の方が重要です。売られすぎのシグナルが出ていても、さらに売られ続けることもあります。MAのレベルは正確な線ではなく、ゾーンとして捉えるべきです。レベルは私自身のチャートに基づいています。投資助言ではありません。 ウォッシュアウトは完了したのか、それとも次は3,750なのか?3,847.28での反応が答えとなるでしょう。 教育目的のみであり、投資助言ではありません。#ByXIMPACT
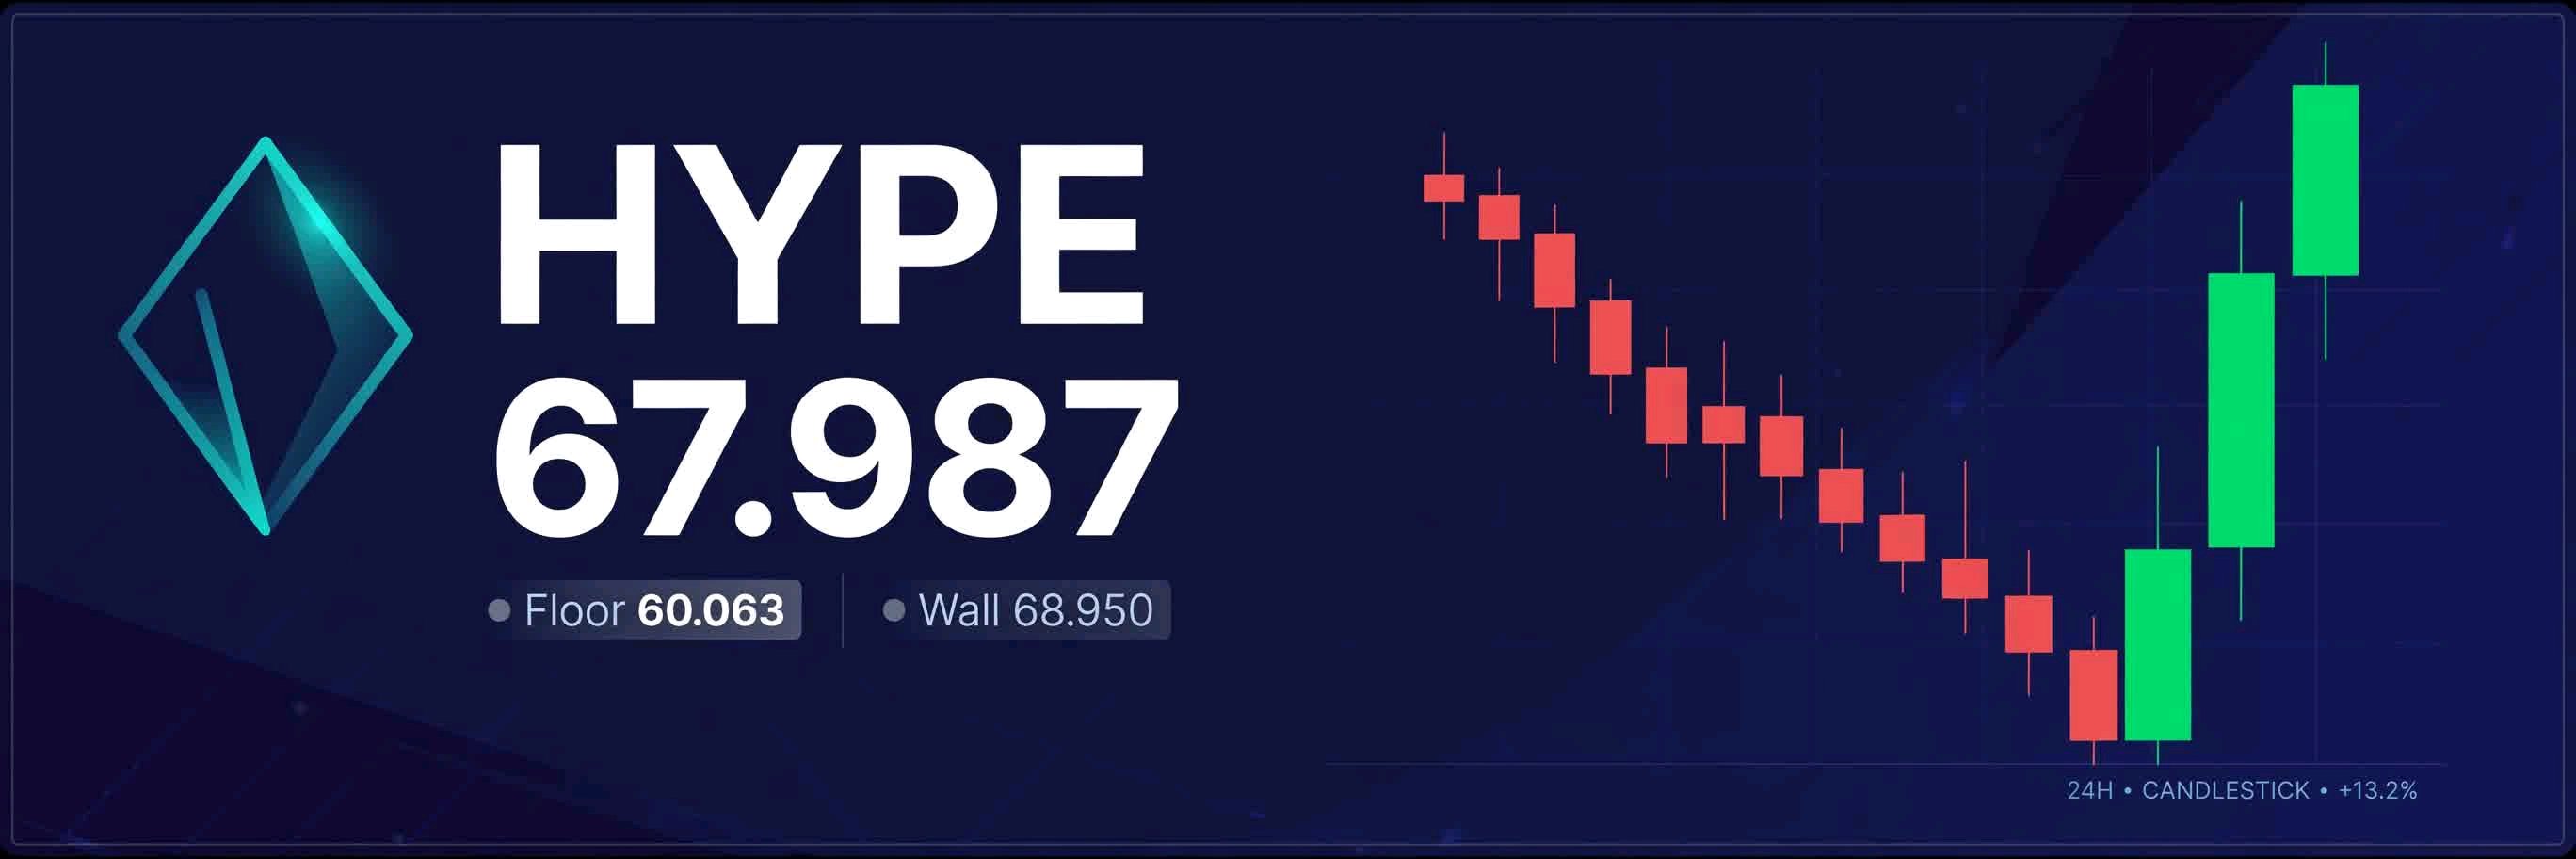
$HYPEUSDTは66.478を奪還し、60.063から13.2%反発しました。底を打ったのでしょうか、それとも68.950が罠なのでしょうか? 背景 HYPEはこのチャートの76.763の高値から11.4%下落しています。価格は60.063の安値を付けた後、67.987(-1.66%)で推移しており、MA7(66.478)を2.3%上回っていますが、依然としてMA14(68.950)とMA28(70.502)の下にあります。つまり、反発は最初の平均線の上にありますが、上値の壁は依然として残っています。私はこの陽線を追うつもりはありません。私の手法は単純、「ブレイクなし=トレードなし」です。リテストと4時間足の終値確定を待ちます。 売買代金と出来高 24時間の売買代金は約8,921万USDTです。本日の4時間足はすでに133.52K取引されており、対してMA5は225.22K、MA10は167.33Kです。フラッシュ(急落)時に出来高が拡大しており、これはウォッシュアウトの兆候ですが、反発のローソク足はまだ出来高を伴って壁を上抜けて確定していません。終値確定なしならトレードなしです。 モメンタム 価格はMA7より上ですが、MA14/MA28より下です。前回の反発は69.193で売り叩かれ、その後価格は60.063で安値を更新しました。68.950を上回る4時間足が確定するまで、モメンタムは依然として下向きです。終値確定を伴わない反発は、単なる反発に過ぎません。 サポートとレジスタンス サポート:60.063(24時間安値)、約60.00(キリ番)、次に58.00(未検証)。 レジスタンス:68.950(MA14、現在の壁)、約69.193(24時間高値)、70.502(MA28)、そして76.763。 注視すべきレベル 60.063 - 62.00がフロアです。60.063を下回る4時間足が確定すれば、58.00への扉が開きます。上値では、68.950 - 69.193が壁です。そこが私が待っているリテストゾーンです。 トレードプラン — RoYoKメソッド 私は67.987の中途半端な位置では買いません。 プランA — 確認後のロング:価格が66.478 - 67.987をリテストし、出来高が平均以上で68.950を上回る4時間足が確定するのを待つ。エントリーは約69.10。ストップは66.478の下。ターゲット:70.502と76.763。 プランB — トレードなし:もし価格が68.950 - 69.193をリテストし、68.950を下回る4時間足が確定して拒絶された場合、私は見送ります。ブレイクなし=トレードなし。次の下値レベルは60.063です。 プランC — 拒絶確認後のショート:68.950を下回る4時間足の確定後のみ。ストップは69.50の上、ターゲットは66.478と60.063。 リスクノート HYPEは24時間で15.2%レンジ変動(60.063から69.193)しており、週末は流動性が薄く、ヒゲがどのレベルも突き抜ける可能性があるため、エントリーよりもポジションサイズが重要です。MAレベルはゾーンであり、正確な線ではありません。レベルは私自身のチャートに基づいています。投資助言ではありません。 あなたは陽線を追いかけていますか?それとも私のようにリテストと4時間足の確定を待っていますか? 教育目的であり、投資助言ではありません。 $HYPEUSDT#ByXIMPACT
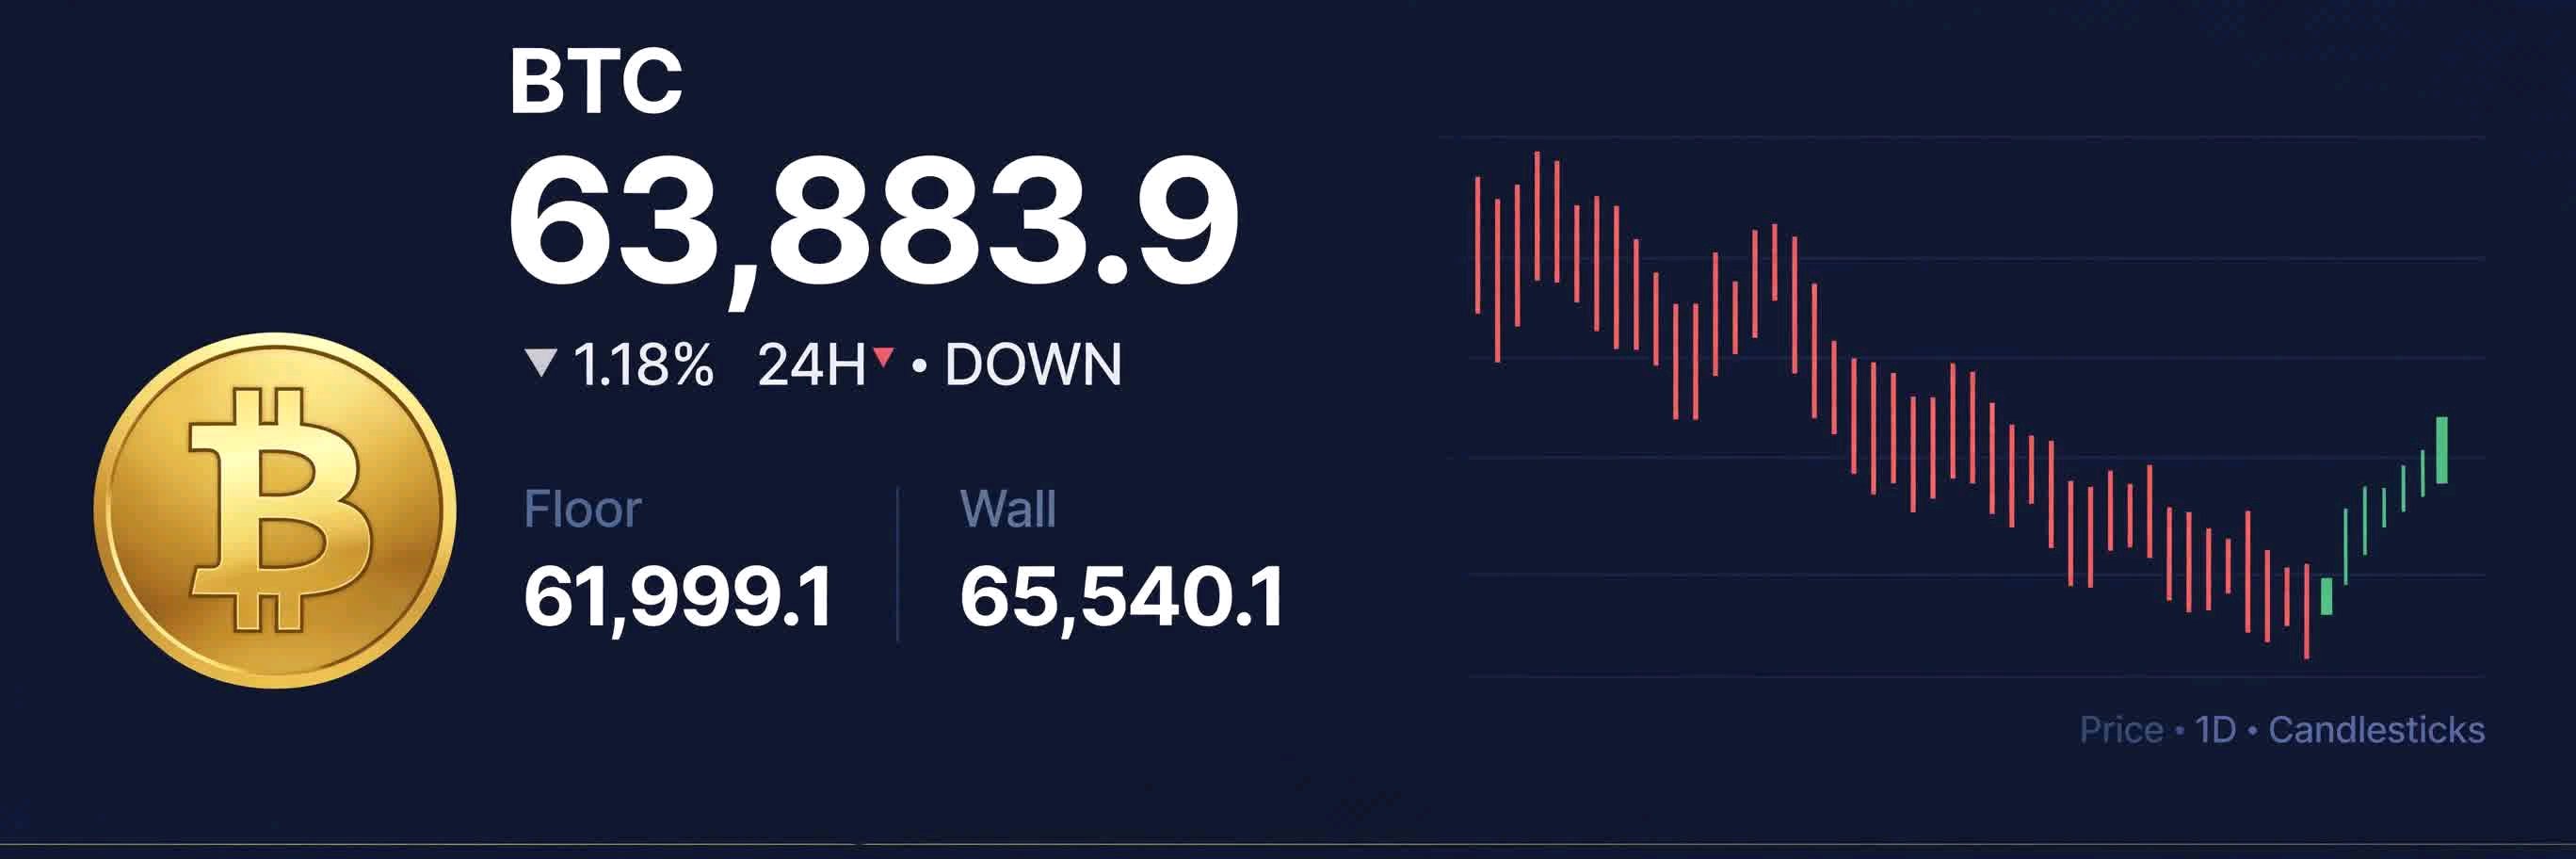
$BTCUSDTは65,540のレベル、7日移動平均線、そして防衛していたすべてを割り込み、61,999.1で3.0%反発しました。この反発は本物ですが、問題は現在の壁となっている65,540.1を奪還できるかどうかです。 コンテキスト BTCはこのチャートの高値75,603.4から約15.5%下落し、61,999.1からの上昇分のほとんどを吐き出しました。価格は63,883.9(-4.71%)で、安値61,999.1をつけた後、7日移動平均線(MA7: 65,540.1)を2.5%下回っています。MA14(67,048.0)とMA28(70,197.6)が上にあり、すべて弱気な順序で並んでいます。日曜であり、4時間足はまだ始まってから1時間ほどです。 売買高と出来高 24時間の売買高は約11.5億USDT、約18,000 BTCで、この4時間足だけで5日平均(3,290 BTC)の約0.61倍、10日平均(2,650 BTC)の約0.76倍に達しています。5日平均が10日平均を上回っているため、下落局面で出来高が増加しており、今日のローソク足は最初の1時間ですでに2,020 BTCが取引されました。今回の急落は実需を伴うものであり、これは典型的なウォッシュアウト(投げ売り)の様相ですが、これで終わりとは限りません。 モメンタム 価格は3本の移動平均線すべての下にあり、MAは下向きに広がっています。前回の反発は67,527.1で売り叩かれ、その後61,999.1で安値を更新しました。モメンタムは依然として低下しているため、動く前に反応を確認したいところです。売られすぎの状態と出来高を伴う急落は反発のセットアップにはなりますが、壁の上で引けなければ、単なる反発に過ぎません。 サポートとレジスタンス サポート:61,999.1(24時間安値)、約62,000(キリ番)、その次は60,000(未検証レベル)。 レジスタンス:65,540.1(MA7、現在は反転)、約67,048.0(MA14)、67,527.1(24時間高値)、70,197.6(MA28)、そして75,603.4(前回の高値)。 注視すべきレベル 61,999.1~62,500がフロアであり、本日の安値がデッドラインです。4時間足が61,999.1を下回れば、60,000以下への道が開かれます。上値は65,540.1~67,048.0が壁で、反転したMA7、MA14、24時間高値が集中しています。 トレードプラン 反発狙い:62,000~62,500で、反応(拒絶のヒゲ、または65,540.1を上回っての4時間足確定)があった場合のみ買い。損切りは61,800の下。ターゲットは67,048.0と67,527.1で、62,250から約2.5Rおよび2.7R。 続落狙い(ショート、またはロング見送り):65,540.1~67,048.0への戻りを待ち、そこで拒絶された場合。損切りは67,600の上。ターゲットは62,500と61,999.1で、66,200から約1.9Rおよび2.1R。 -4.71%のローソク足の真ん中で63,883.9を買うつもりはありません。損切りは61,999.1の下に置くべきで、最初のレジスタンスである65,540.1まではわずか1,656しかなく、リスクリワード(R)は1以下です。 リスクメモ BTCは過去24時間で約8.9%のレンジ(61,999.1~67,527.1)で推移しました。週末は流動性が薄く、ヒゲはあらゆるレベルを突き抜ける可能性があるため、エントリーよりもポジションサイズが重要です。「売られすぎ」の指標は、売られすぎの状態のまま推移することもあります。MAレベルはゾーンであり、正確な線ではありません。レベルは私自身のチャートに基づいています。投資助言ではありません。 ウォッシュアウトは終わったのか、それとも次は60,000か?65,540.1での反応次第です。 教育目的であり、投資助言ではありません。 $BTCUSDT#ByXIMPACT
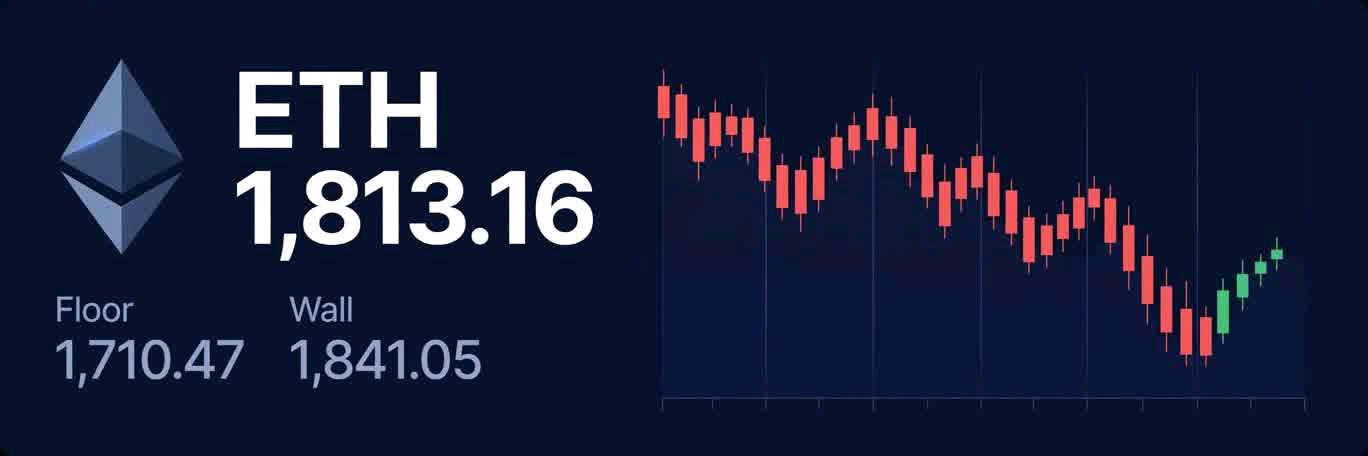
$ETHUSDTは1,841のラインを割り込み、7日移動平均線や防衛していたあらゆる水準を失い、その後1,710.47から6.0%反発しました。この反発は本物ですが、問題は現在の壁となっている1,841.05を奪還できるかどうかです。 コンテキスト ETHはチャート上の高値2,271.33から約20%下落し、1,710.47からの上昇分のほとんどを吐き出しました。価格は1,813.16(-4.64%)で、安値1,710.47を記録後、7日移動平均線(MA7:1,841.05)を1.5%下回る水準に位置しています。その上にはMA14(1,887.08)とMA28(1,967.64)があり、すべて弱気な並び順(ベアリッシュ・オーダー)となっています。日曜ということもあり、4時間足はまだ始まって1時間ほどです。 売買代金と出来高 24時間の売買代金は約3億6,806万USDT(約203,000 ETH)で、この4時間足だけで5日平均の35,500に対し約0.1倍、10日平均(26,100)に対しては0.14倍です。5日移動平均線が10日移動平均線を上回っており、下落局面で出来高が拡大していることを示しています。本日のローソク足は最初の1時間ですでに3,560の出来高を記録しました。この投げ売りは実際の出来高を伴うもので、典型的なウォッシュアウト(一掃)の様相を呈していますが、これが底打ちの証明にはなりません。 モメンタム 価格は3本の移動平均線すべてを下回っており、移動平均線は下向きに拡散しています。前回の反発は1,919.76で売り叩かれ、その後1,710.47まで安値を切り下げました。モメンタムは依然として下落中なので、行動を起こす前に反応を見極めたいところです。売られすぎの状態に出来高を伴う投げ売りが重なれば反発の準備は整いますが、壁を超えて引けない反発は単なるリバウンドに過ぎません。 サポートとレジスタンス サポート:1,710.47(24時間安値)、約1,700(キリ番)、次に1,650(未確定水準)。 レジスタンス:1,841.05(MA7、現在は反転)、約1,887.08(MA14)、1,919.76(24時間高値)、1,967.64(MA28)、そして2,160.42(以前のフロア)。 注視すべき水準 1,710.47~1,750がフロアであり、本日の安値が防衛ラインです。4時間足の終値が1,710.47を下回れば、1,700やそれ以下への道が開けます。上値については、反転したMA7、MA14、24時間高値が集中する1,841.05~1,887.08が壁となります。 トレードプラン 反発狙い:1,710~1,750で、反応(拒絶のヒゲ、または1,841.05を回復する4時間足の終値)があった場合のみ買い。損切りは1,700割れ。ターゲットは1,887.08と1,919.76で、1,730からエントリーした場合の期待値はそれぞれ約2.5Rと3.0R。 下落継続(ショート、あるいはロングを見送る):1,841.05~1,887.08への再テストで拒絶されるのを待ち、1,920超えで損切り。ターゲットは1,750と1,710.47で、1,865からエントリーした場合の期待値はそれぞれ約1.8Rと2.5R。 -4.64%の下落中のローソク足の真ん中で1,813.16を買うつもりはありません。損切りは1,710.47の下に置くべきであり、最初のレジスタンスである1,841.05までわずか28ドルしかなく、リスクリワード(R)は1を下回ってしまいます。 リスクに関する注意点 ETHは過去24時間で約12%変動しました(1,710.47〜1,919.76)。週末は流動性が低下し、ヒゲはあらゆるレベルを突き抜ける可能性があるため、エントリーよりもポジションサイズの方が重要です。売られすぎのシグナルが出ていても、さらに売られ続けることはあります。移動平均線の水準はゾーンであり、正確な線ではありません。これら水準は私自身のチャートに基づいています。投資助言ではありません。 ウォッシュアウトは完了したのか、それとも次は1,700か?1,841.05での反応が答えとなるでしょう。 教育目的であり、投資助言ではありません。 $ETHUSDT#ByXIMPACT
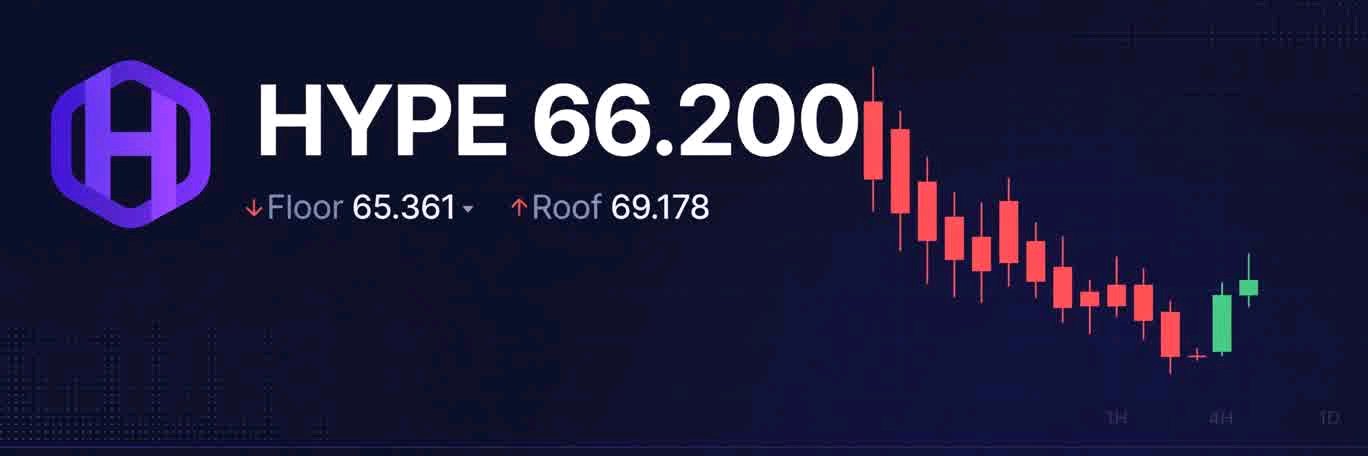
🚀 HYPEは69.526をアンダーカットしたものの、すぐに反発した。今こそそれが本物であることを証明する必要がある。 $HYPEUSDT、4時間足、66.200(-8.68%)。バイアス:ニュートラル、65.361を維持している間のみ強気。 69.526のレベルが再び試され、アンダーカットされた。24時間の安値は65.361だ。しかし価格はその上に戻り、66.200で推移している。注目されているレベルを下回った後にすぐに買い戻される動きは「だまし(failed breakdown)」であり、トレードのチャンスになり得る。もちろん、そのまま下落することもあるため、トレードの前に裏付けが必要だ。 構造:高値は切り下がっており、このチャートでは78.133、反発時は約73.109、72.637、そして現在は66.200となっている。安値は同じフロアに戻ってきているため、HYPEは65.361から78.133のレンジの下半分に閉じ込められている。トレンド転換には、直近の戻り高値である73.109、そして78.133を突破する必要がある。 移動平均線は価格のすぐ上の2.3ポイントの幅に密集している:MA7 69.178、MA14 70.627、MA28 71.525。価格はMA7を4.3%下回っている。 レジスタンス:69.178 (MA7)、次に70.627 (MA14)、71.525 (MA28)、そして約73.109 (24時間高値)。 サポート:65.361 (奪還した安値)。その下は、65がキリの良い数字だが、検証済みのレベルではないため、次は64となる。 出来高:MA5 (687.43K) は MA10 (630.21K) を上回っている。本日の出来高は481.93Kで、ローソク足の約60%が経過しており、5日平均の約117%に達するペースだ。アンダーカット時に実際の動きがあったことがわかる。 プラン:推測ではなく、この維持を確定させたい。価格が65.361~66.200に向けて押し目を形成し、その後、下ヒゲを伴い、出来高が4時間足平均以上で66.200を上回って引けること。終値が届かなければ、トレードはしない。エントリーは約66.30。ストップはアンダーカットした安値の下、65.10。リスク1.20に対して: TP1 69.178 = 2.39R TP2 70.627 = 3.60R TP3 71.525 = 4.35R 4時間足が65.361を下回って引けたら撤退する。日足がそれを下回って引ければ、フロアは完全に崩れたと判断し、次は64を目指す展開になる。 HYPEはBTCの動きやマクロ経済のヘッドラインに反応し、夜間は板が薄くなる可能性があるため、指値注文を使い、ストップまでの距離を考慮したポジションサイズにしたい。投資助言ではない。 教育目的であり、金融アドバイスではない。 $HYPEUSDT#ByXIMPACT
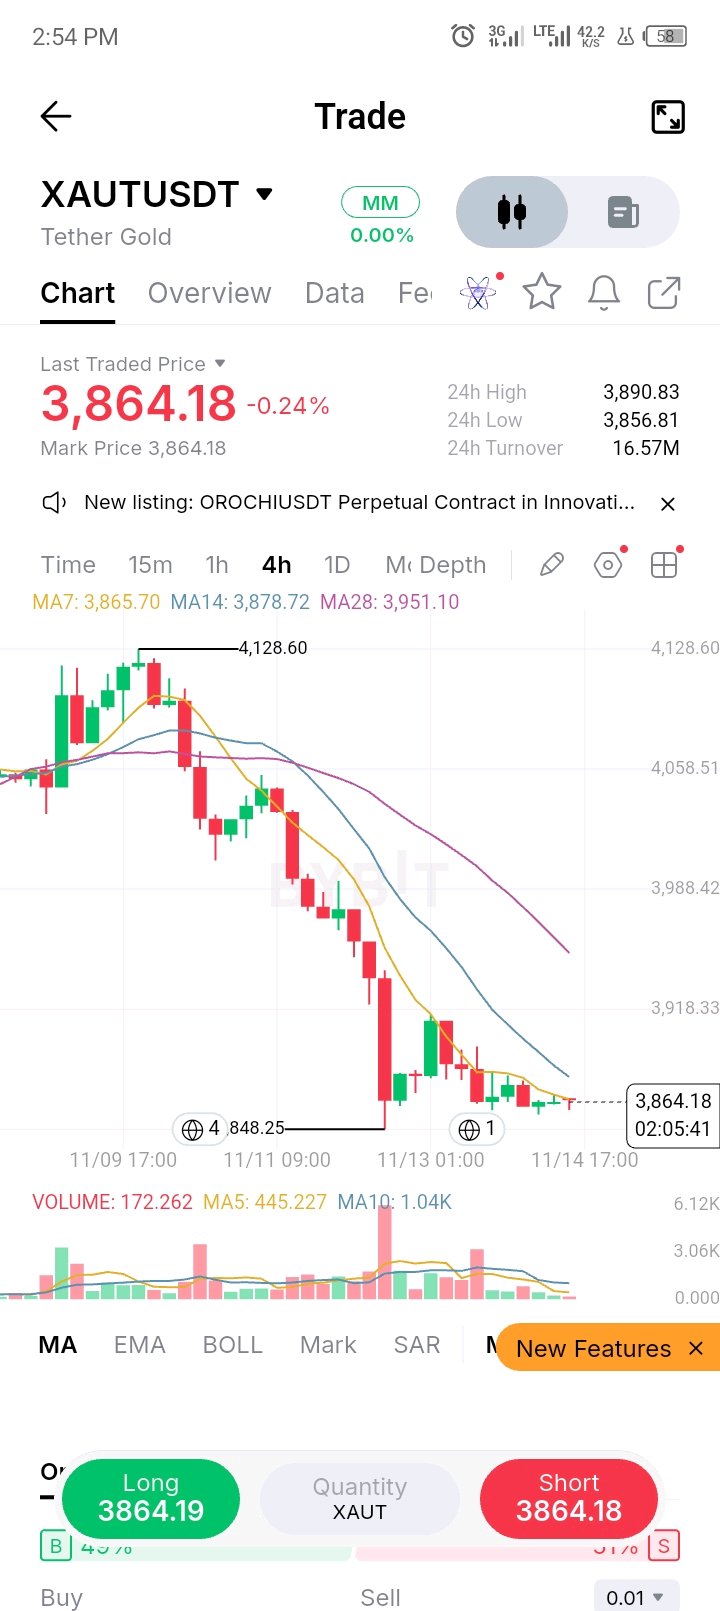
🚀 XAUTが3,848を一時下回ったが、即座に反発。ここから真価が問われる。 $XAUTUSDT、4時間足、3,864.18(-0.24%)。バイアス:ニュートラル。3,856.81を維持している間のみ強気。 3,848のレベルが再び試され、一時的に割り込んだ。24時間の安値は3,856.81。しかし、価格はそれを回復し、現在3,864.18で推移している。注目されているレベルを一時的に割り込み、すぐに買い戻される動きは「ブレイクダウン失敗(だまし)」であり、トレードのチャンスになり得る。もちろん失敗することもあるため、トレードの前に裏付けが必要だ。 構造:高値は切り下がっており、このチャートでは4,128.60、反発局面では約3,918.33、3,890.83、そして現在は3,864.18となっている。安値は同じフロアに戻ってきており、XAUTは3,856.81から4,128.60のレンジの下半分に閉じ込められている。トレンド転換には、直近の戻り高値である3,890.83、そして3,918.33を突破する必要がある。 移動平均線は価格の上方85ポイントのバンド内に密集している:MA7 3,865.70、MA14 3,878.72、MA28 3,951.10。価格はMA7を0.04%下回っている。 レジスタンス:3,865.70(MA7)、次いで3,878.72(MA14)、3,951.10(MA28)、そして約3,890.83(24時間高値)。 サポート:3,856.81(回復した安値)。それを割り込むと、チャート上の安値である3,848.25、次は未検証レベルだが3,800がターゲットとなる。 出来高:MA5(445.227)はMA10(1.04K)を下回っている。本日の出来高は172.262で、ローソク足形成の約60%が経過した時点で、5日平均の約64%のペース。反発は今のところ静かだ。一時的に下回った際には実際の活発な動きがあったが、反発自体はまだそれを裏付けていない。 プラン:予測ではなく、維持されることを確認したい。価格が3,856.81〜3,864.18付近まで押し目を形成し、その後、4時間足が3,864.18を上回って引け、下ヒゲを伴い、出来高が4時間平均と同等以上になること。クローズが確認できなければ、トレードはしない。エントリーは約3,866。ストップは下抜けした安値の下、3,845。リスクを21とした場合: TP1 3,865.70 = -0.02R TP2 3,878.72 = 0.60R TP3 3,951.10 = 4.14R 4時間足が3,856.81を下回って引ければ撤退。日足がそれを下回って引ければフロアは完全に崩れたと判断し、次は3,800へ。 XAUTは金スポット、ドル、マクロ経済のニュースに反応し、夜間は板が薄くなる可能性があるため、指値注文を使用し、ストップに合わせてポジションサイズを調整するつもりだ。投資助言ではない。 教育目的のみであり、財務アドバイスではない。 $XAUTUSDT#ByXIMPACT

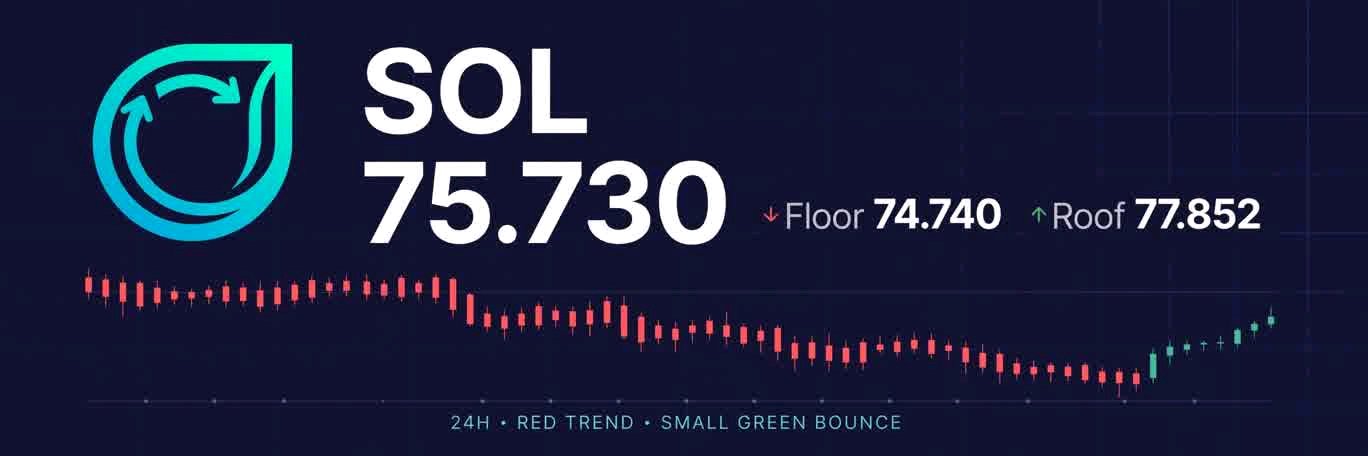
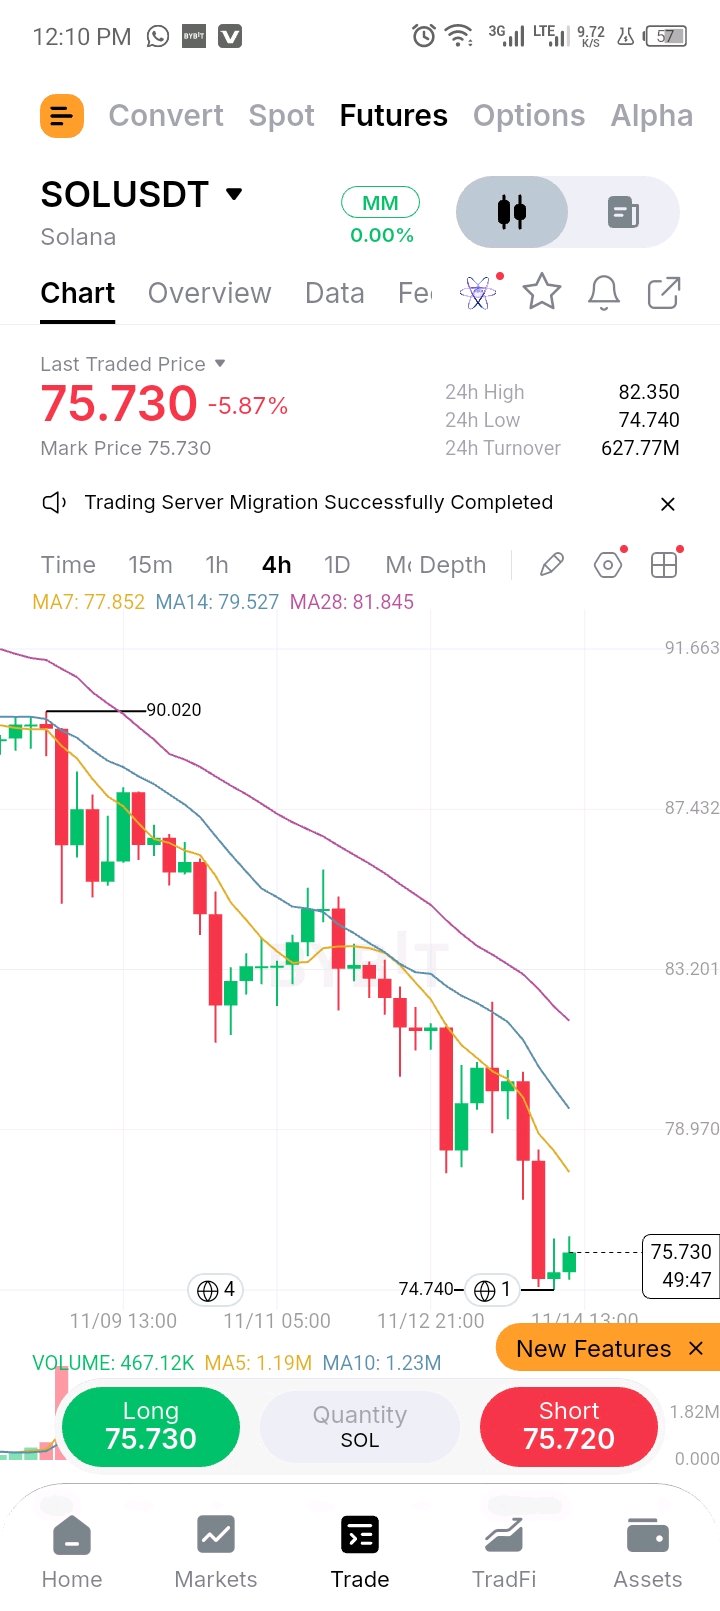
🚀 SOL UNDERCUT 77.92 AND SNAPPED BACK. NOW IT HAS TO PROVE IT. $SOLUSDT, 4h, 75.730 (-5.87%). Bias: neutral, constructive only while 74.740 holds. The 77.92 level got tested again and undercut: the 24h low is 74.740. But price is back above it, trading at 75.730. A dip under a well-watched level that gets bought straight back is a failed breakdown, and those can be worth trading. They also fail, which is why the proof comes before the trade. Structure: the highs keep stepping down, 90.020 on this chart, about 85.82 on the bounce, 82.350, and now 75.730. The lows have come back to the same floor, so SOL is stuck in the lower half of a range between 74.740 and 90.020. A trend change needs a push through that last lower high at 82.350, and then 85.82. The averages are bunched in a 4-point band above price: MA7 77.852, MA14 79.527, MA28 81.845. Price is 2.7% under the MA7. Resistance: 77.852 (MA7), then 79.527 (MA14), then 81.845 (MA28), then about 82.350 (the 24h high). Support: 74.740 (the reclaimed low). Below that, 74 is a round number, 73 is next, not a proven level. Volume: MA5 at 1.19M is below MA10 at 1.23M, but today's 467.12K with about 50% of the candle done is on pace for roughly 78% of the 5-day average. The bounce is quiet so far. There was real activity on the undercut, but the bounce has not confirmed it yet. Plan: I want the hold confirmed, not guessed. Price dips back toward 74.740 - 75.730, then a 4h candle closes above 75.730 with a lower wick and volume at or above the 4h average. No close, no trade. Entry ∼75.90. Stop 74.50, under the undercut low. On 1.40 of risk: TP1 77.852 = 1.39R TP2 79.527 = 2.59R TP3 81.845 = 4.36R A 4h close under 74.740 and I'm out. A daily close under it says the floor is gone for good, with 73 next. SOL reacts to BTC and macro headlines and order books can thin out overnight, so I'd use limit orders and size for the stop. Not advice. For education only, not financial advice. $SOLUSDT#ByXIMPACT
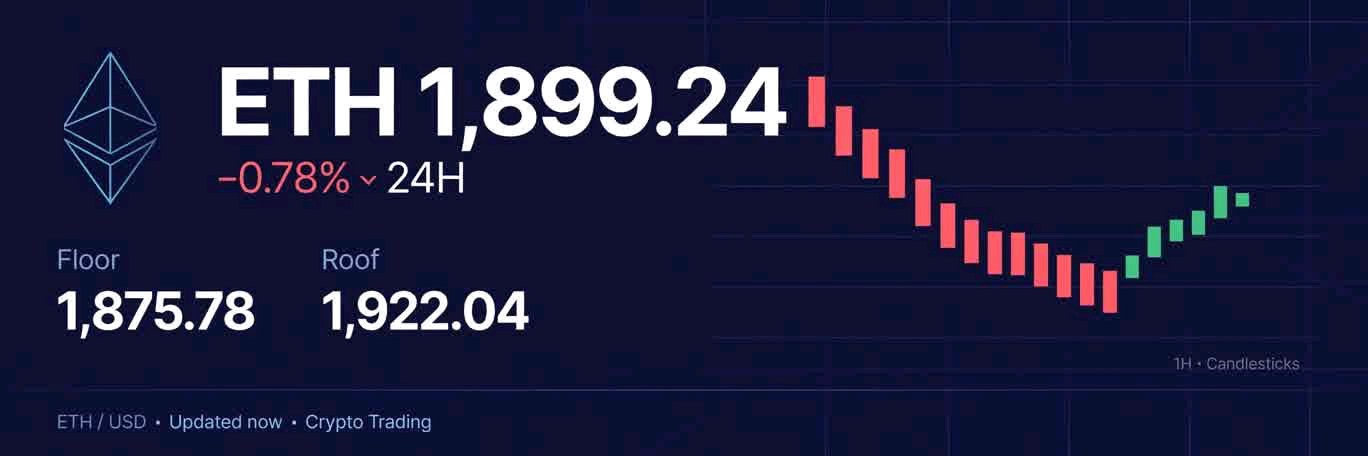
🚀 ETH UNDERCUT 1,895 AND SNAPPED BACK. NOW IT HAS TO PROVE IT. $ETHUSDT, 4h, 1,899.24 (-1.73%). Bias: neutral, constructive only while 1,875.78 holds. The 1,895 level got tested again and undercut: the 24h low is 1,875.78. But price is back above it, trading at 1,899.24. A dip under a well-watched level that gets bought straight back is a failed breakdown, and those can be worth trading. They also fail, which is why the proof comes before the trade. Structure: the highs keep stepping down, 2,245.04 on this chart, about 2,030.58 on the bounce, 1,988.67, and now 1,899.24. The lows have come back to the same floor, so ETH is stuck in the lower half of a range between 1,875.78 and 2,245.04. A trend change needs a push through that last lower high at 1,988.67, and then 2,030.58. The averages are bunched in a 94-point band above price: MA7 1,922.04, MA14 1,959.80, MA28 2,016.43. Price is 1.2% under the MA7. Resistance: 1,922.04 (MA7), then 1,959.80 (MA14), then 2,016.43 (MA28), then about 1,988.67 (the 24h high). Support: 1,875.78 (the reclaimed low). Below that, 1,875 is a round number, 1,850 is next, not a proven level. Volume: MA5 at 144.38K is below MA10 at 201.91K, but today's 518.16K is already 3.5x the 5-day average. There was real activity on the undercut. The bounce is starting to get volume. Plan: I want the hold confirmed, not guessed. Price dips back toward 1,875.78 - 1,899.24, then a 4h candle closes above 1,899.24 with a lower wick and volume at or above the 4h average. No close, no trade. Entry ∼1,905. Stop 1,865, under the undercut low. On 40 of risk: TP1 1,922 = 0.42R TP2 1,959 = 1.35R TP3 2,016 = 2.77R A 4h close under 1,875.78 and I'm out. A daily close under it says the floor is gone for good, with 1,850 next. ETH reacts to BTC and macro headlines and order books can thin out overnight, so I'd use limit orders and size for the stop. Not advice. For education only, not financial advice. $ETHUSDT#ByXIMPACT
🚀 BTC UNDERCUT 67,563 AND SNAPPED BACK. NOW IT HAS TO PROVE IT. $BTCUSDT, 4h, 67,075.1 (-2.41%). Bias: neutral, constructive only while 66,448.6 holds. The 67,563 level got tested again and undercut: the 24h low is 66,448.6. But price is back above it, trading at 67,075.1. A dip under a well-watched level that gets bought straight back is a failed breakdown, and those can be worth trading. They also fail, which is why the proof comes before the trade. Structure: the highs keep stepping down, 76,241.5 on this chart, about 73,630.1 on the bounce, 70,217.2, and now 67,075.1. The lows have come back to the same floor, so BTC is stuck in the lower half of a range between 66,448.6 and 76,241.5. A trend change needs a push through that last lower high at 70,217.2, and then 73,630.1. The averages are bunched in a 3,897-point band above price: MA7 68,284.2, MA14 70,160.5, MA28 72,181.8. Price is 1.8% under the MA7. Resistance: 68,284.2 (MA7), then 70,160.5 (MA14), then 72,181.8 (MA28), then about 70,217.2 (the 24h high). Support: 66,448.6 (the reclaimed low). Below that, 66,000 is a round number, not a proven level. Volume: MA5 at 2.11K is below MA10 at 2.20K, but today's 583.025 with about 55% of the candle done is on pace for roughly 50% of the 5-day average. The bounce is quiet so far. There was real activity on the undercut, but the bounce has not confirmed it yet. Plan: I want the hold confirmed, not guessed. Price dips back toward 66,448.6 - 67,075.1, then a 4h candle closes above 67,075.1 with a lower wick and volume at or above the 4h average. No close, no trade. Entry ∼67,150. Stop 66,300, under the undercut low. On 850 of risk: TP1 68,284 = 1.33R TP2 70,160 = 3.54R TP3 72,181 = 5.92R A 4h close under 66,448.6 and I'm out. A daily close under it says the floor is gone for good, with 66,000 next. BTC reacts to macro headlines and order books can thin out overnight, so I'd use limit orders and size for the stop. Not advice. For education only, not financial advice.$BTCUSDT#ByXIMPACT
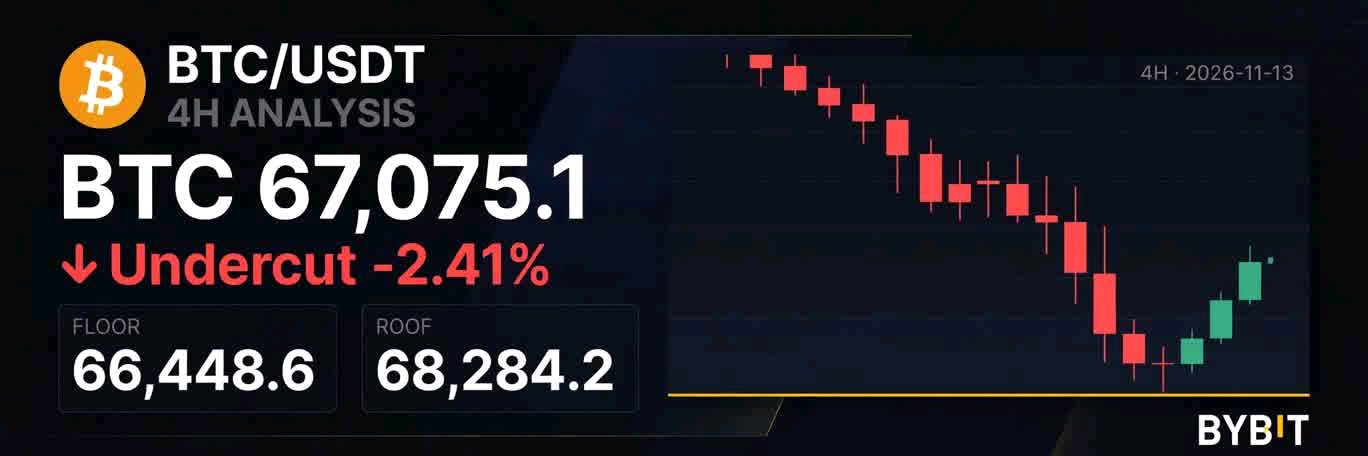
🚀 XAUT UNDERCUT 3,861 AND SNAPPED BACK. NOW IT HAS TO PROVE IT. $XAUTUSDT, 4h, 3,883.39 (+0.29%). Bias: neutral, constructive only while 3,851.40 holds. The 3,861 level got tested again and undercut: the 24h low is 3,861.78. But price is back above it, trading at 3,883.39. A dip under a well-watched level that gets bought straight back is a failed breakdown, and those can be worth trading. They also fail, which is why the proof comes before the trade. Structure: the highs keep stepping down, 4,130.11 on this chart, about 3,916.18 on the bounce, 3,990.75, and now 3,883.39. The lows have come back to the same floor, so XAUT is stuck in the lower half of a range between 3,851.40 and 4,130.11. A trend change needs a push through that last lower high at 3,916.18, and then 3,990.75. The averages are bunched in a 110-point band above price: MA7 3,885.70, MA14 3,921.22, MA28 3,995.83. Price is 0.06% under the MA7. Resistance: 3,885.70 (MA7), then 3,921.22 (MA14), then 3,995.83 (MA28), then about 3,916.18 (the 24h high). Support: 3,851.40 (the reclaimed low). Below that, 3,850 is a round number, 3,800 is next, not a proven level. Volume: MA5 at 348.928 is below MA10 at 391.592, but today's 62.883 with about 60% of the candle done is on pace for roughly 30% of the 5-day average. The bounce is quiet so far. There was real activity on the undercut, but the bounce has not confirmed it yet. Plan: I want the hold confirmed, not guessed. Price dips back toward 3,851.40 - 3,883.39, then a 4h candle closes above 3,883.39 with a lower wick and volume at or above the 4h average. No close, no trade. Entry ∼3,885. Stop 3,845, under the undercut low. On 40 of risk: TP1 3,885.70 = 0.02R TP2 3,921.22 = 0.90R TP3 3,995.83 = 2.77R A 4h close under 3,851.40 and I'm out. A daily close under it says the floor is gone for good, with 3,800 next. XAUT reacts to gold spot, dollar and macro headlines and order books can thin out overnight, so I'd use limit orders and size for the stop. Not advice. For education only, not financial advice. $XAUTUSDT#ByXIMPACT
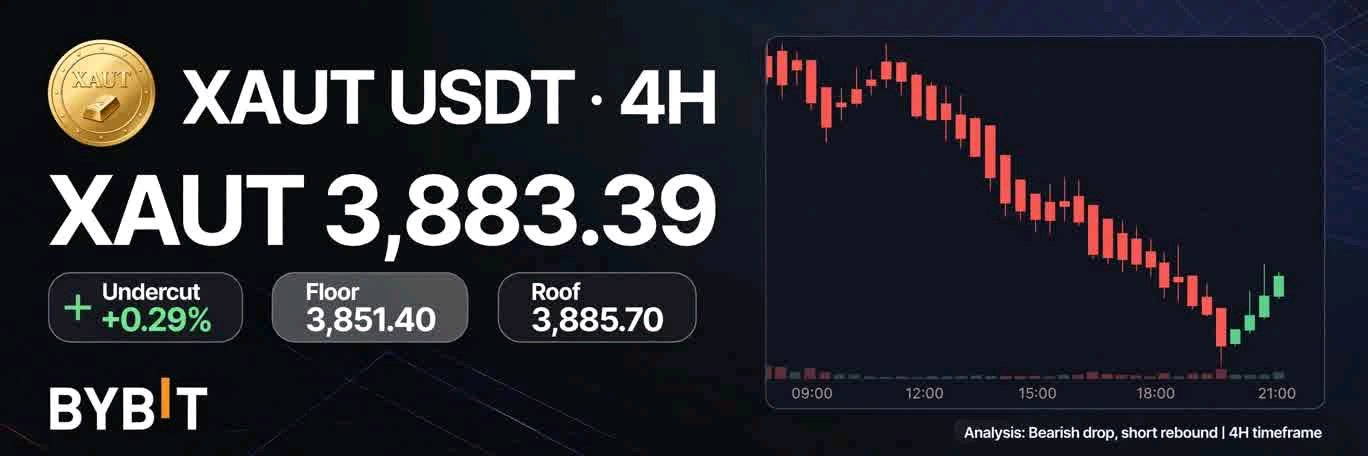
🚀 HYPEが70をアンダーカットしたものの、即座に反発。ここからが正念場。 $HYPEUSDT, 4時間足, 72.930 (+1.58%)。バイアス:中立、69.526を維持する限りは強気継続。 70のラインが再度試され、アンダーカットが発生(24時間の安値は69.921)。しかし、価格は72.930まで戻している。注目されているラインを下回った後に即座に買い戻される動きは「だまし(failed breakdown)」であり、トレードのチャンスになり得る。もちろん、そのまま下落することもあるため、トレードには根拠が必要だ。 構造:高値は切り下がっており、このチャートでは78.217、反発時の75.308、73.838、そして現在は72.930となっている。安値は同じフロアに戻ってきているため、HYPEは69.526から78.217のレンジの下半分に停滞している。トレンド転換には、直近の戻り高値である75.308、そして78.217を上抜ける必要がある。 移動平均線は価格周辺の0.6ポイント幅に密集している:MA7 72.334、MA14 72.199、MA28 72.806。価格はMA7の0.8%上にある。 レジスタンス:72.806(MA28)、続いて75.308(24時間高値)、そして78.217(チャート上の高値)。 サポート:69.526(再奪還した安値)。その下はキリの良い数字の70、次は69だが、これは根拠のあるレベルではない。 出来高:MA5(116.81K)はMA10(87.31K)を上回っているが、今日の出来高は12.20Kで、ローソク足形成の約60%が経過した時点で5日平均の約17%というペース。反発は今のところ静かだ。アンダーカット時には実際の動きがあったが、反発はまだそれを裏付けていない。 プラン:推測ではなく、ホールドが確認されてから動きたい。価格が69.526~72.930付近へ押し目を形成し、その後4時間足が下ヒゲを伴って72.930以上で確定し、出来高が4時間平均と同等以上になること。終値が確定しなければトレードはしない。エントリーは約73.00。ストップはアンダーカット安値の下、69.30。リスク3.70に対して: TP1 72.806 = -0.05R TP2 75.308 = 0.62R TP3 78.217 = 1.43R 4時間足が69.526を下回って確定したら撤退。日足がそれを下回って確定すればフロアは完全に崩壊し、次は69へ向かうだろう。 HYPEはBTCの動きやマクロニュースに反応し、夜間は板が薄くなる可能性があるため、指値注文を使い、ストップに合わせてポジションサイズを調整する。投資助言ではない。 教育目的であり、金融アドバイスではありません。 $HYPEUSDT#ByXIMPACT
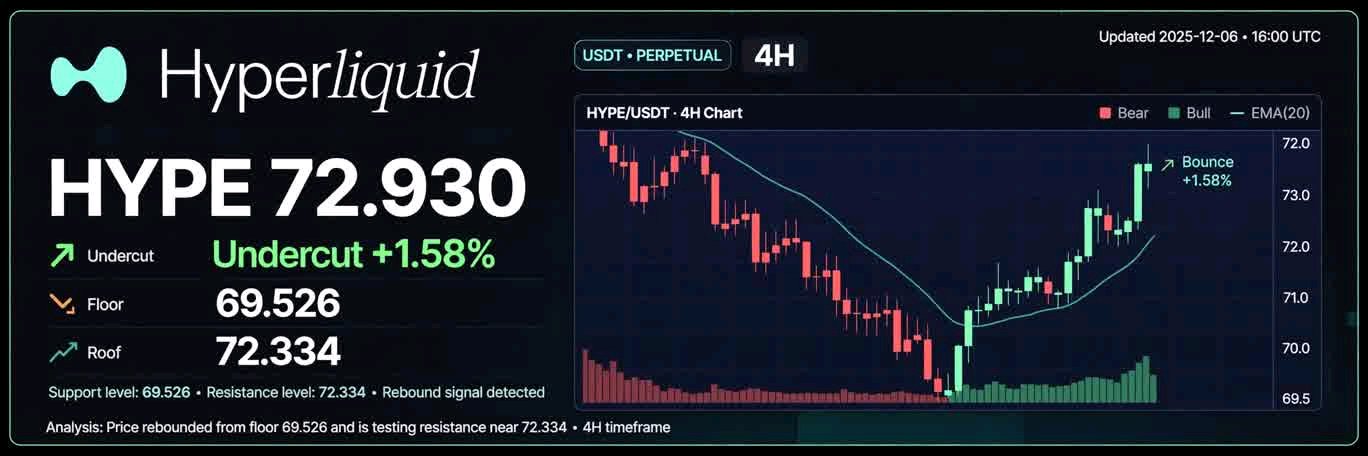
🚀 SOL UNDERCUT 78 AND SNAPPED BACK. NOW IT HAS TO PROVE IT. $SOLUSDT, 4h, 80.07 (-0.95%). Bias: neutral, constructive only while 77.92 holds. The 78 level got tested again and undercut: the 24h low is 77.92. But price is back above it, trading at 80.07. A dip under a well-watched level that gets bought straight back is a failed breakdown, and those can be worth trading. They also fail, which is why the proof comes before the trade. Structure: the highs keep stepping down, 90.39 on this chart, about 85.82 on the bounce, 82.38, and now 80.07. The lows have come back to the same floor, so SOL is stuck in the lower half of a range between 77.92 and 90.39. A trend change needs a push through that last lower high at 82.38, and then 85.82. The averages are bunched in a 3-point band above price: MA7 80.55, MA14 82.11, MA28 83.63. Price is 0.6% under the MA7. Resistance: 80.55 (MA7), then 82.11 (MA14), then 83.63 (MA28), then about 82.38 (the 24h high). Support: 77.92 (the reclaimed low). Below that, 78 is a round number, 77 is next, not a proven level. Volume: MA5 at 140.54K is above MA10 at 116.24K, but today's 123.66K with about 55% of the candle done is on pace for roughly 140% of the 5-day average. There was real activity on the undercut. Plan: I want the hold confirmed, not guessed. Price dips back toward 77.92 - 80.07, then a 4h candle closes above 80.07 with a lower wick and volume at or above the 4h average. No close, no trade. Entry ∼80.20. Stop 77.70, under the undercut low. On 2.50 of risk: TP1 80.55 = 0.14R TP2 82.11 = 0.76R TP3 83.63 = 1.41R A 4h close under 77.92 and I'm out. A daily close under it says the floor is gone for good, with 77 next. SOL reacts to BTC and macro headlines and order books can thin out overnight, so I'd use limit orders and size for the stop. Not advice. For education only, not financial advice. $SOLUSDT#ByXIMPACT
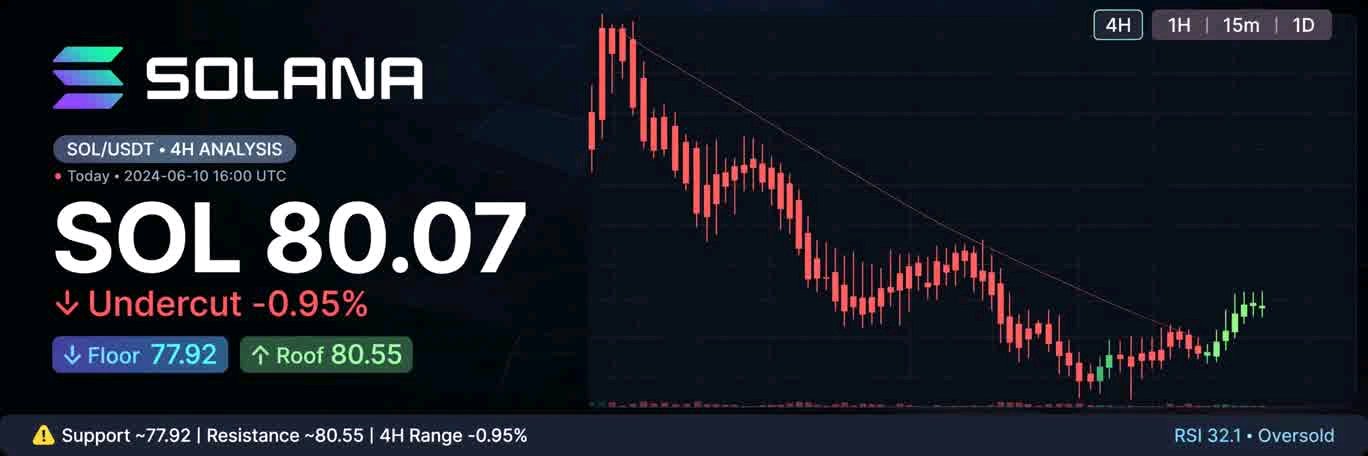
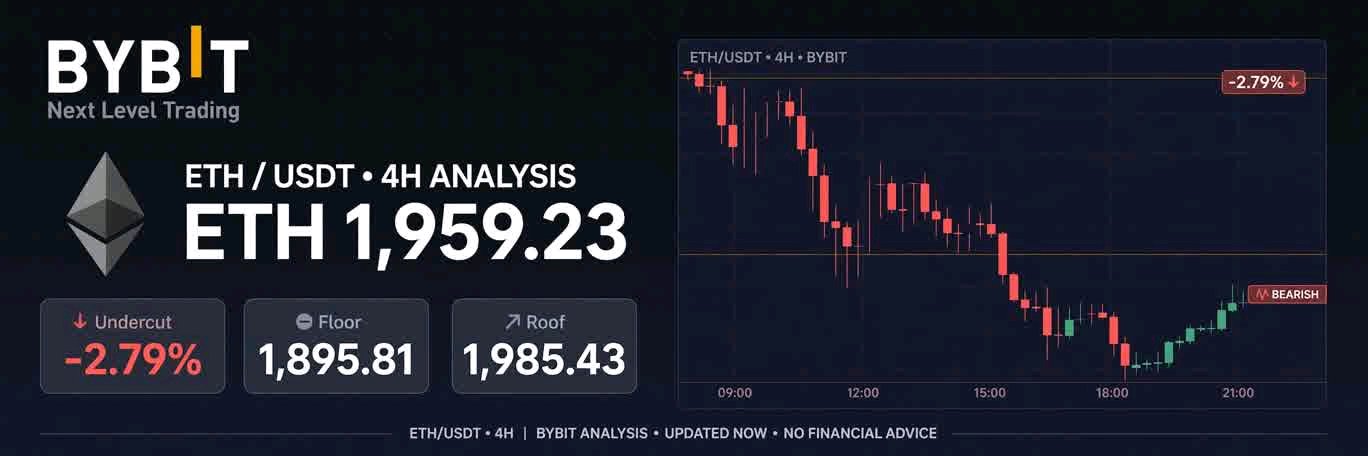
🚀 ETH UNDERCUT 1,900 AND SNAPPED BACK. NOW IT HAS TO PROVE IT. $ETHUSDT, 4h, 1,959.23 (-2.79%). Bias: neutral, constructive only while 1,895.81 holds. The 1,900 level got tested again and undercut: the 24h low is 1,895.81. But price is back above it, trading at 1,959.23. A dip under a well-watched level that gets bought straight back is a failed breakdown, and those can be worth trading. They also fail, which is why the proof comes before the trade. Structure: the highs keep stepping down, 2,251.50 on this chart, about 2,103.98 on the bounce, 2,030.58, and now 1,959.23. The lows have come back to the same floor, so ETH is stuck in the lower half of a range between 1,895.81 and 2,251.50. A trend change needs a push through that last lower high at 2,030.58, and then 2,103.98. The averages are bunched in a 76-point band above price: MA7 1,985.43, MA14 2,024.46, MA28 2,062.11. Price is 1.3% under the MA7. Resistance: 1,985.43 (MA7), then 2,024.46 (MA14), then 2,062.11 (MA28), then about 2,030.58 (the 24h high). Support: 1,895.81 (the reclaimed low). Below that, 1,900 is a round number, 1,850 is next, not a proven level. Volume: MA5 at 18.45K is above MA10 at 16.01K, but today's 15.67K with about 60% of the candle done is on pace for roughly 140% of the 5-day average. There was real activity on the undercut. Plan: I want the hold confirmed, not guessed. Price dips back toward 1,895.81 - 1,959.23, then a 4h candle closes above 1,959.23 with a lower wick and volume at or above the 4h average. No close, no trade. Entry ∼1,965. Stop 1,885, under the undercut low. On 80 of risk: TP1 1,985 = 0.25R TP2 2,024 = 0.74R TP3 2,062 = 1.21R A 4h close under 1,895.81 and I'm out. A daily close under it says the floor is gone for good, with 1,850 next. ETH reacts to BTC and macro headlines and order books can thin out overnight, so I'd use limit orders and size for the stop. Not advice. For education only, not financial advice.$ETHUSDT #ByXIMPACT
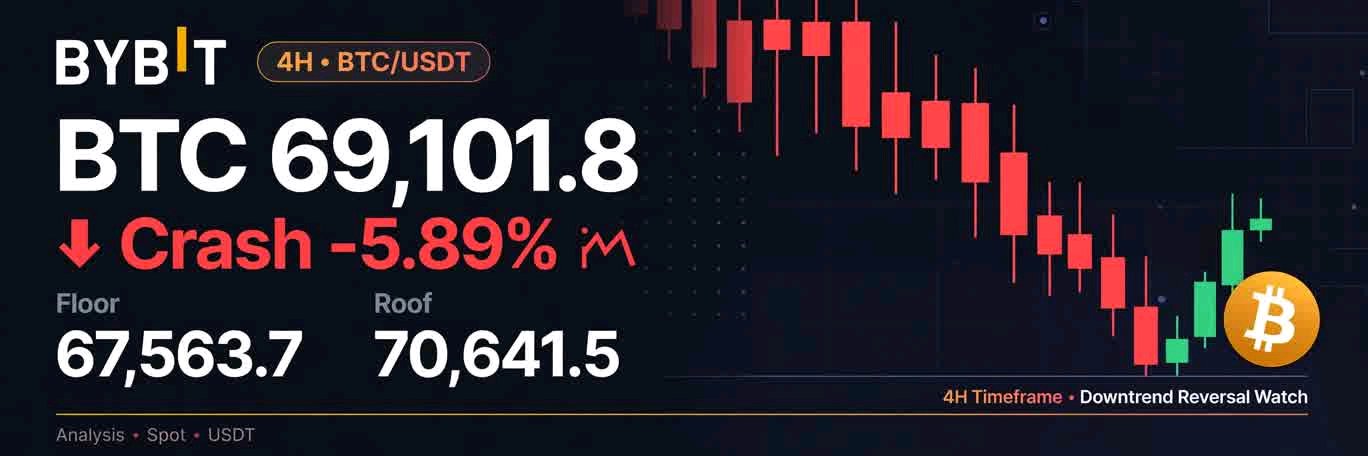
🚀 BTC UNDERCUT 68,000 AND SNAPPED BACK. NOW IT HAS TO PROVE IT. $BTCUSDT, 4h, 69,101.8 (-5.89%). Bias: neutral, constructive only while 67,563.7 holds. The 68,000 level got tested again and undercut: the 24h low is 67,563.7. But price is back above it, trading at 69,101.8. A dip under a well-watched level that gets bought straight back is a failed breakdown, and those can be worth trading. They also fail, which is why the proof comes before the trade. Structure: the highs keep stepping down, 76,241.5 on this chart, about 74,822.9 on the bounce, 73,630.1, and now 69,101.8. The lows have come back to the same floor, so BTC is stuck in the lower half of a range between 67,563.7 and 76,241.5. A trend change needs a push through that last lower high at 73,630.1, and then 74,822.9. The averages are bunched in a 2,725-point band above price: MA7 70,641.5, MA14 72,319.3, MA28 73,366.9. Price is 2.2% under the MA7. Resistance: 70,641.5 (MA7), then 72,319.3 (MA14), then 73,366.9 (MA28), then about 73,630.1 (the 24h high). Support: 67,563.7 (the reclaimed low). Below that, 67,000 is a round number, not a proven level. Volume: MA5 at 2.10K is above MA10 at 1.75K, but today's 953.403 with about 55% of the candle done is on pace for roughly 85% of the 5-day average. There was real activity on the undercut. The bounce is quiet so far. Plan: I want the hold confirmed, not guessed. Price dips back toward 67,563.7 - 69,101.8, then a 4h candle closes above 69,101.8 with a lower wick and volume at or above the 4h average. No close, no trade. Entry ∼69,200. Stop 67,400, under the undercut low. On 1,800 of risk: TP1 70,641 = 0.8R TP2 72,319 = 1.7R TP3 73,366 = 2.3R A 4h close under 67,563.7 and I'm out. A daily close under it says the floor is gone for good, with 67,000 next. BTC reacts to macro headlines and order books can thin out overnight, so I'd use limit orders and size for the stop. Not advice. For education only, not financial advice. $BTCUSDT #ByXIMPACT
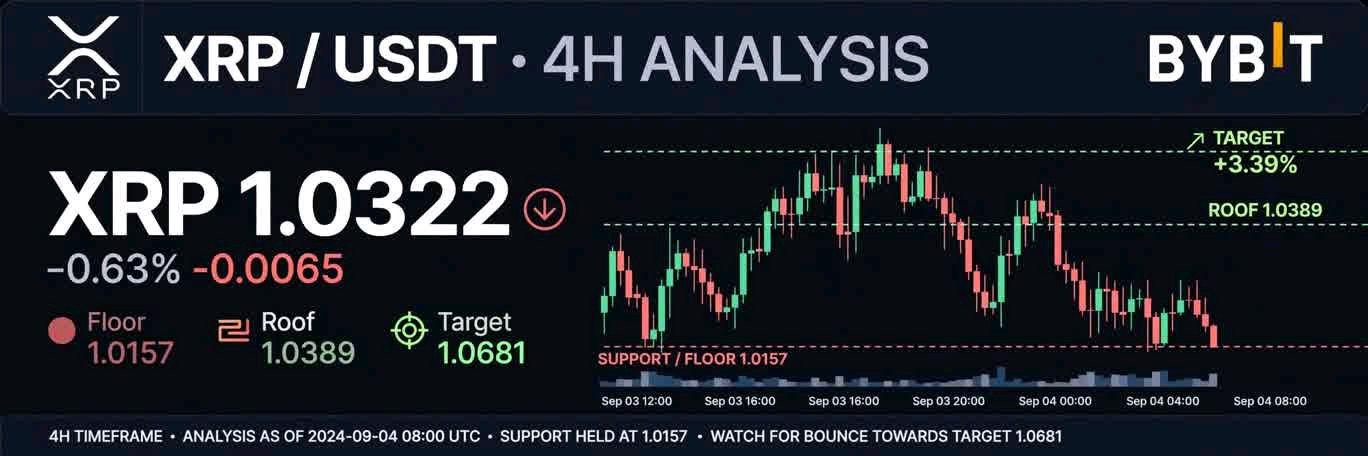
🚀 XRP 1.0322 — 目覚める巨人か、それとも死んだコインか。1.0157が答えを握る XRPは1.0322、4時間足で-2.57%。 スクイーズも、ナイフも、ボックスも、戦いも忘れろ。今は静寂だ。 XRPは1.1988から1.0157まで一直線に落ち、そこで止まった。大きな反発もなければ、大きな暴落もない。ただ小さなローソク足が並び、出来高は低く、底に張り付いている。これがコインが目覚めるか死ぬか、その直前の姿だ。 フロア:1.0157 XRPは1.0157にタッチし、現在は1.0322 — 1.6%上にある。これは反発ではない。ただ呼吸をしているだけだ。 強気派がこの巨人を起こしたいなら、4時間足の終値で1.0157を維持しなければならない。もしここを割り込めば、下には何もない。1.00まで真空地帯だ。 ルーフ:1.0389 MA7は1.0389、MA14は1.0500、MA28は1.0776。3本すべてが価格の上にあり、重い屋根のように積み重なっている。 価格は1.0322で、MA7のすぐ下。ここが最初のドアだ。1.0389で引ければ、1.0500へのドアが開く。1.0157を下回って引ければ、巨人は眠り続けるか、死ぬかだ。 出来高:このチャートではMA5/MA10は見えないが、売買代金は2億8299万 — 今日のSOLの5倍、HYPEの10倍だ。市場には出来高があるが、反発には乗っていない。つまり、誰もまだこの底値で買おうと急いでいないということだ。彼らは待っている。 BTCとの連動:BTCは73,512.4で-0.23%。XRPは-2.57%だが、BTCは-0.23%しか下げていない。XRPはBTCより11倍弱い。もしBTCが72,727.2を維持できれば、XRPは1.0389の奪還を試みることができる。BTCが崩れれば、XRPは真っ先に1.0157を割るだろう。 4時間足確定:残り3時間55分。俺はヒゲではトレードしない。終値でトレードする。 1.0389より上で引けたら = 1.0681まで強気 1.0157〜1.0389の間で引けたら = 様子見、まだ眠っている、トレードなし 1.0157より下で引けたら = 撤退、死んだコイン、トレードなし 24時間高値:1.0681 24時間安値:1.0157 24時間売買代金:2億8299万 俺のプラン — 俺のメソッド: 俺は眠っているコインは買わない。俺のメソッドはまさにこの瞬間のために設計されている。 ステップ1:XRPが1.0157を維持し、その上で引けることを証明させる ステップ2:1.0389をブレイクし、それを維持させる ステップ3:両方維持された場合のみ、1.0681までのロングを狙う 1.0157で維持できなければ = トレードなし。待つ。無理はしない。 俺のストップは1.0157のすぐ下。俺のエントリーはここには書かない。正確なエントリーとストップは下のXRPUSDTウィジェットにある。タップして、この「目覚める巨人」の読みが間違っているか教えてくれ。 コメントで教えてくれ:XRPは1.0389を超えて目覚める巨人か、それとも1.0157を失って死ぬコインか? $XRPUSDT#IMPACTbyTrade
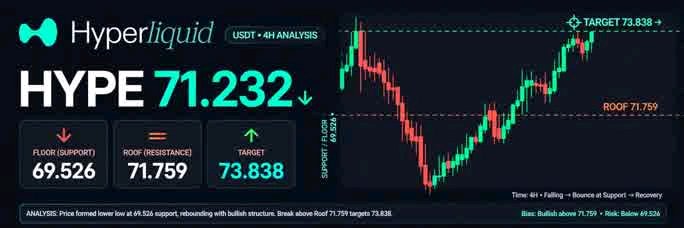
🚀 HYPE 71.232 — BULLS VS BEARS AT THE EDGE, ONE SIDE HAS TO WIN HYPE is at 71.232, -3.48% on the 4H. Forget squeeze. Forget knife. Forget box. This is a fight. Bulls and bears are standing at the edge, face to face. Bears pushed HYPE from 79.651 straight down to 69.526. Bulls caught it there, pushed it back to 71.232. Now nobody is moving. The next candle decides who wins. The Bulls Floor: 69.526 HYPE crashed to 69.526, bounced, and is now at 71.232. That 69.526 low is the bulls' last stand. If bulls hold it, the fight is still alive. If bears break it, bulls lose, next is 69.00, then open air. The Bears Roof: 71.759 MA7 is 71.759, MA14 is 72.047, MA28 is 73.625. All three are sitting ABOVE price, stacked like a wall built by bears. Price is at 71.232, just 0.52 below MA7. That is the edge. One green candle and bulls break the wall. One red candle and bears push it back to 69.526. Close a 4H candle ABOVE 71.759 = bulls win round one, next is 73.838 Close a 4H candle BELOW 69.526 = bears win, next is 69.00 Volume: 38.96K vs MA5 53.70K vs MA10 60.06K Volume is BELOW average. The fight is getting quiet. Neither side is throwing big punches right now. That means the next big volume candle will decide it. I don't trade in quiet. I wait for the loud candle. BTC Link: BTC is at 73,512.4, -0.23%. HYPE is down -3.48% while BTC is down -0.23%. HYPE is 15x weaker than BTC. If BTC holds 72,727.2, bulls can try to break 71.759. If BTC breaks, bears will win and HYPE will break 69.526 first. 4H Close: 1 hour 40 minutes left on this candle. I don't trade the wick. I trade the close. Close above 71.759 = I am bullish to 73.838 Close between 69.526 - 71.759 = I wait, still fighting, no trade Close below 69.526 = I am out, bears won, no trade 24H High: 73.838 24H Low: 69.526 24H Turnover: 24.38M My Plan — My Method: I don't pick a side in a fight. I designed my method for this exact moment. Step 1: Let one side win — bulls break 71.759, or bears break 69.526 Step 2: Wait for the retest of whichever side breaks — it must hold Step 3: Only then I follow the winner No winner = No trade. I wait. I don't force it. My stop is just under 69.526, my entry is NOT in this caption. My exact entry and stop are on my HYPEUSDT widget below — tap it and tell me if my fight read is wrong. Tell me in the comments: Do bulls win and break 71.759, or do bears win and break 69.526? $HYPEUSDT#IMPACTbyTrade
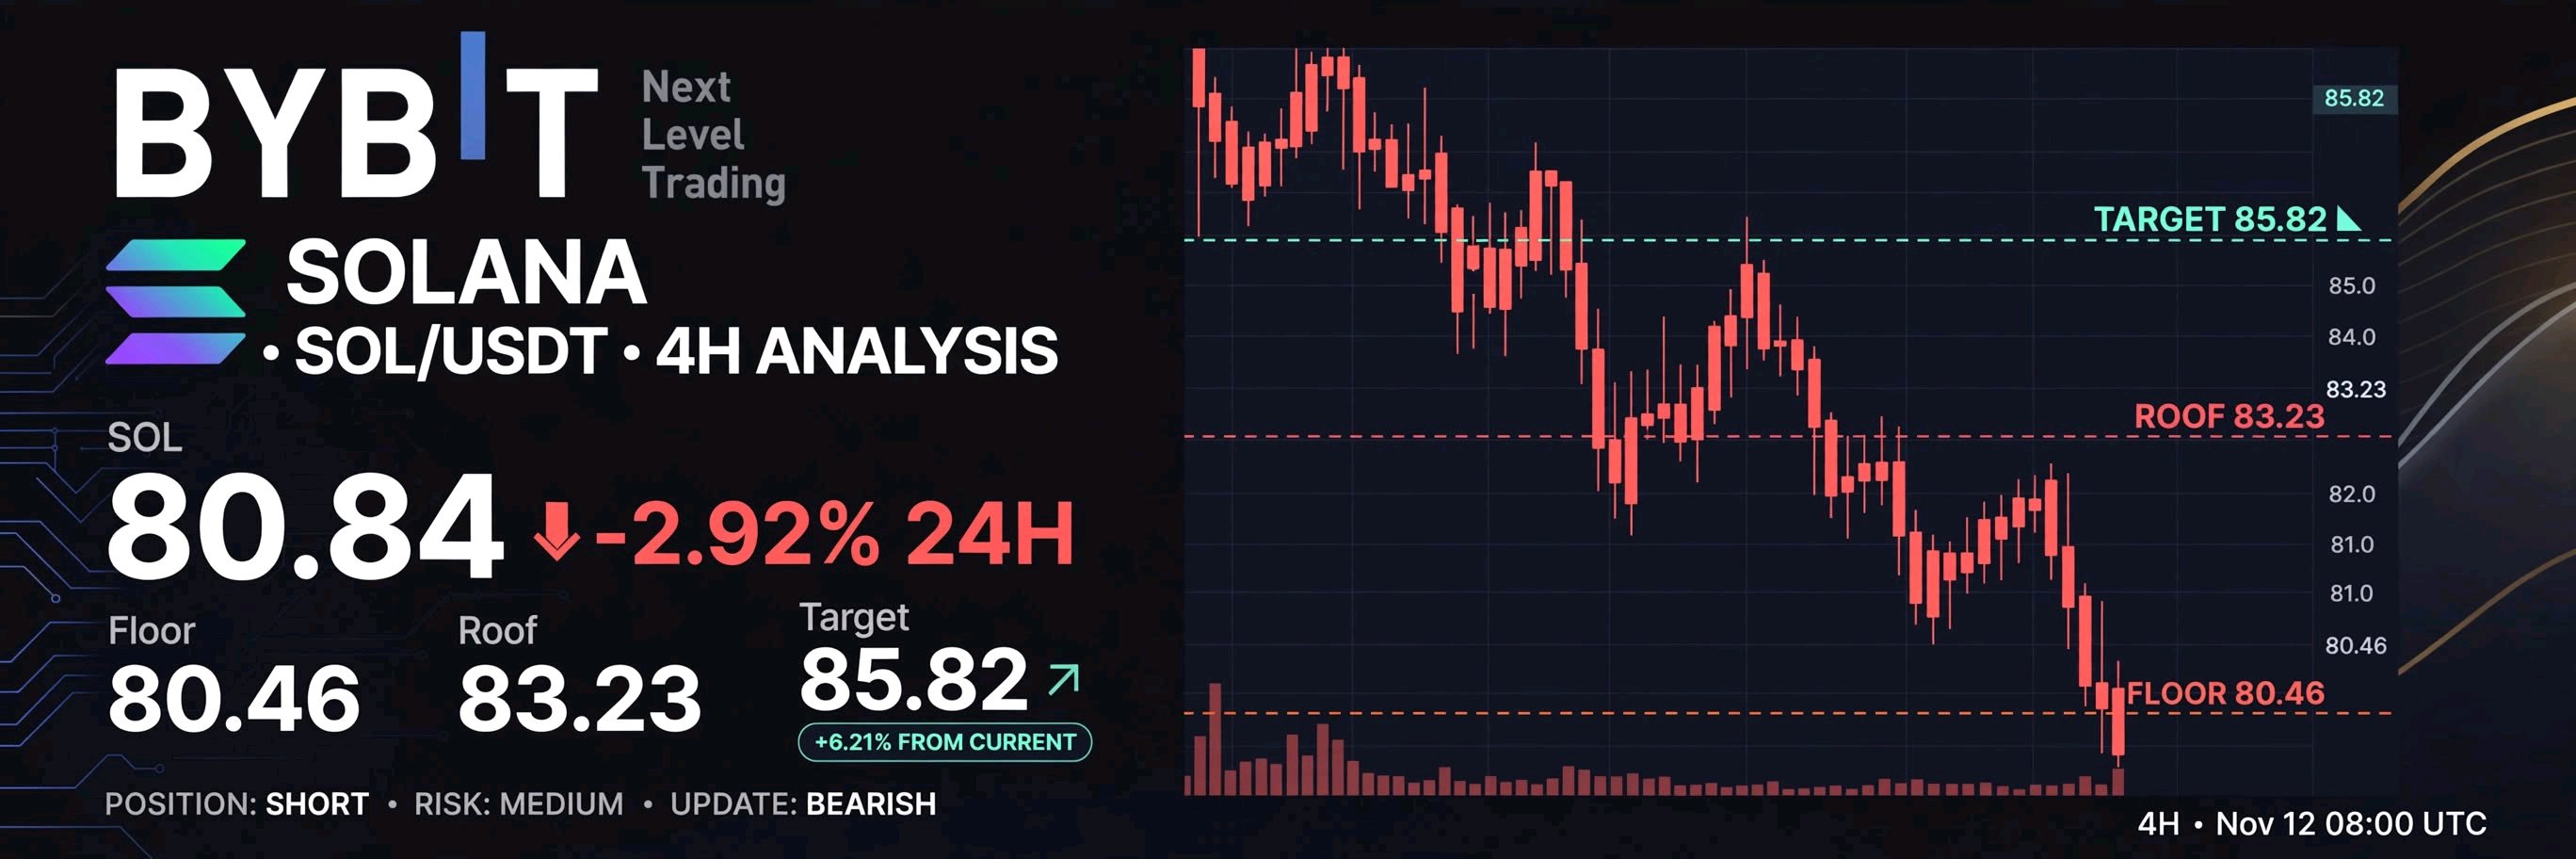
🚀 SOL 80.84 — ボックス圏に閉じ込められた、どちらかへ抜ける必要がある SOLは80.84、4時間足で-3.66%です。 スクイーズだとか、落ちてくるナイフだとかは忘れてください。これはボックス相場です。 SOLは91.59から80.46まで一直線に下落し、そこで止まりました。反発もしていないし、これ以上投げ売りもされていません。ただボックスの底でじっとしており、身動きが取れません。 ボックスの底:80.46 SOLは80.46にタッチし、わずかに80.84まで反発して、現在はそこに張り付いています。これが底です。耐えればSOLは息を吹き返せますが、割れば次は80.00、その先は空白です。下には何もない状態です。 ボックスの天井:83.23 MA7は83.23、MA14は83.33、MA28は85.46です。3本とも価格より「上」に位置しており、重なっています。 もう一度言います。価格はすべてのMAより下にあります。これは単なる天井ではなく、3層の壁です。SOLはまず83.23、次に83.33、そして85.46を突破しなければなりません。3つの扉があるのと同じです。 4時間足が83.23「上」で確定=ボックス上抜け、次は85.82 4時間足が80.46「下」で確定=ボックス下抜け、次は80.00 出来高:187.77K vs MA5 81.72K vs MA10 81.63K 出来高は平均より大幅に多い。通常時の2.3倍です。これは静かなボックスではありません。戦いです。売り手が激しく投げ売りし、買い手が80.46を死守しようとしています。どちらかが敗北します。 BTCとの相関:BTCは73,512.4、-0.23%。SOLは-3.66%なので、SOLはBTCより15倍弱い状態です。もしBTCが72,727.2を維持できれば、SOLは83.23の突破を試みることができます。BTCが崩れれば、SOLはまず80.46を割り込むでしょう。 4時間足の確定まで:あと1時間52分。私はヒゲではトレードしません。終値でトレードします。 83.23より上で確定=85.82まで強気 80.46〜83.23の間で確定=様子見、依然として膠着状態、トレードなし 80.46より下で確定=撤退、トレードなし、ボックス下抜け 24時間高値:85.82 24時間安値:80.46 24時間売買高:49.38M 私の計画 — 私の手法: 私はボックス内ではトレードしません。私の手法はまさにこの瞬間のために設計されています。 ステップ1:SOLに方向を選ばせる — 83.23を上抜けるか、80.46を下抜けるか ステップ2:どちらかに抜けた後のリテストを待つ — そこで維持される必要がある ステップ3:抜けた方向にのみ追随する ブレイクなし=トレードなし。待ちます。無理はしません。 私のストップは80.46のすぐ下。私のエントリー価格はこのキャプションには載せていません。正確なエントリーとストップは下のSOLUSDTウィジェットにあります。タップして、私のボックス相場の読みが間違っているか教えてください。 コメントで教えてください:SOLはボックスを上抜けて83.23を目指しますか?それとも80.46を割って下落しますか? $SOLUSDT#IMPACTbyTrade
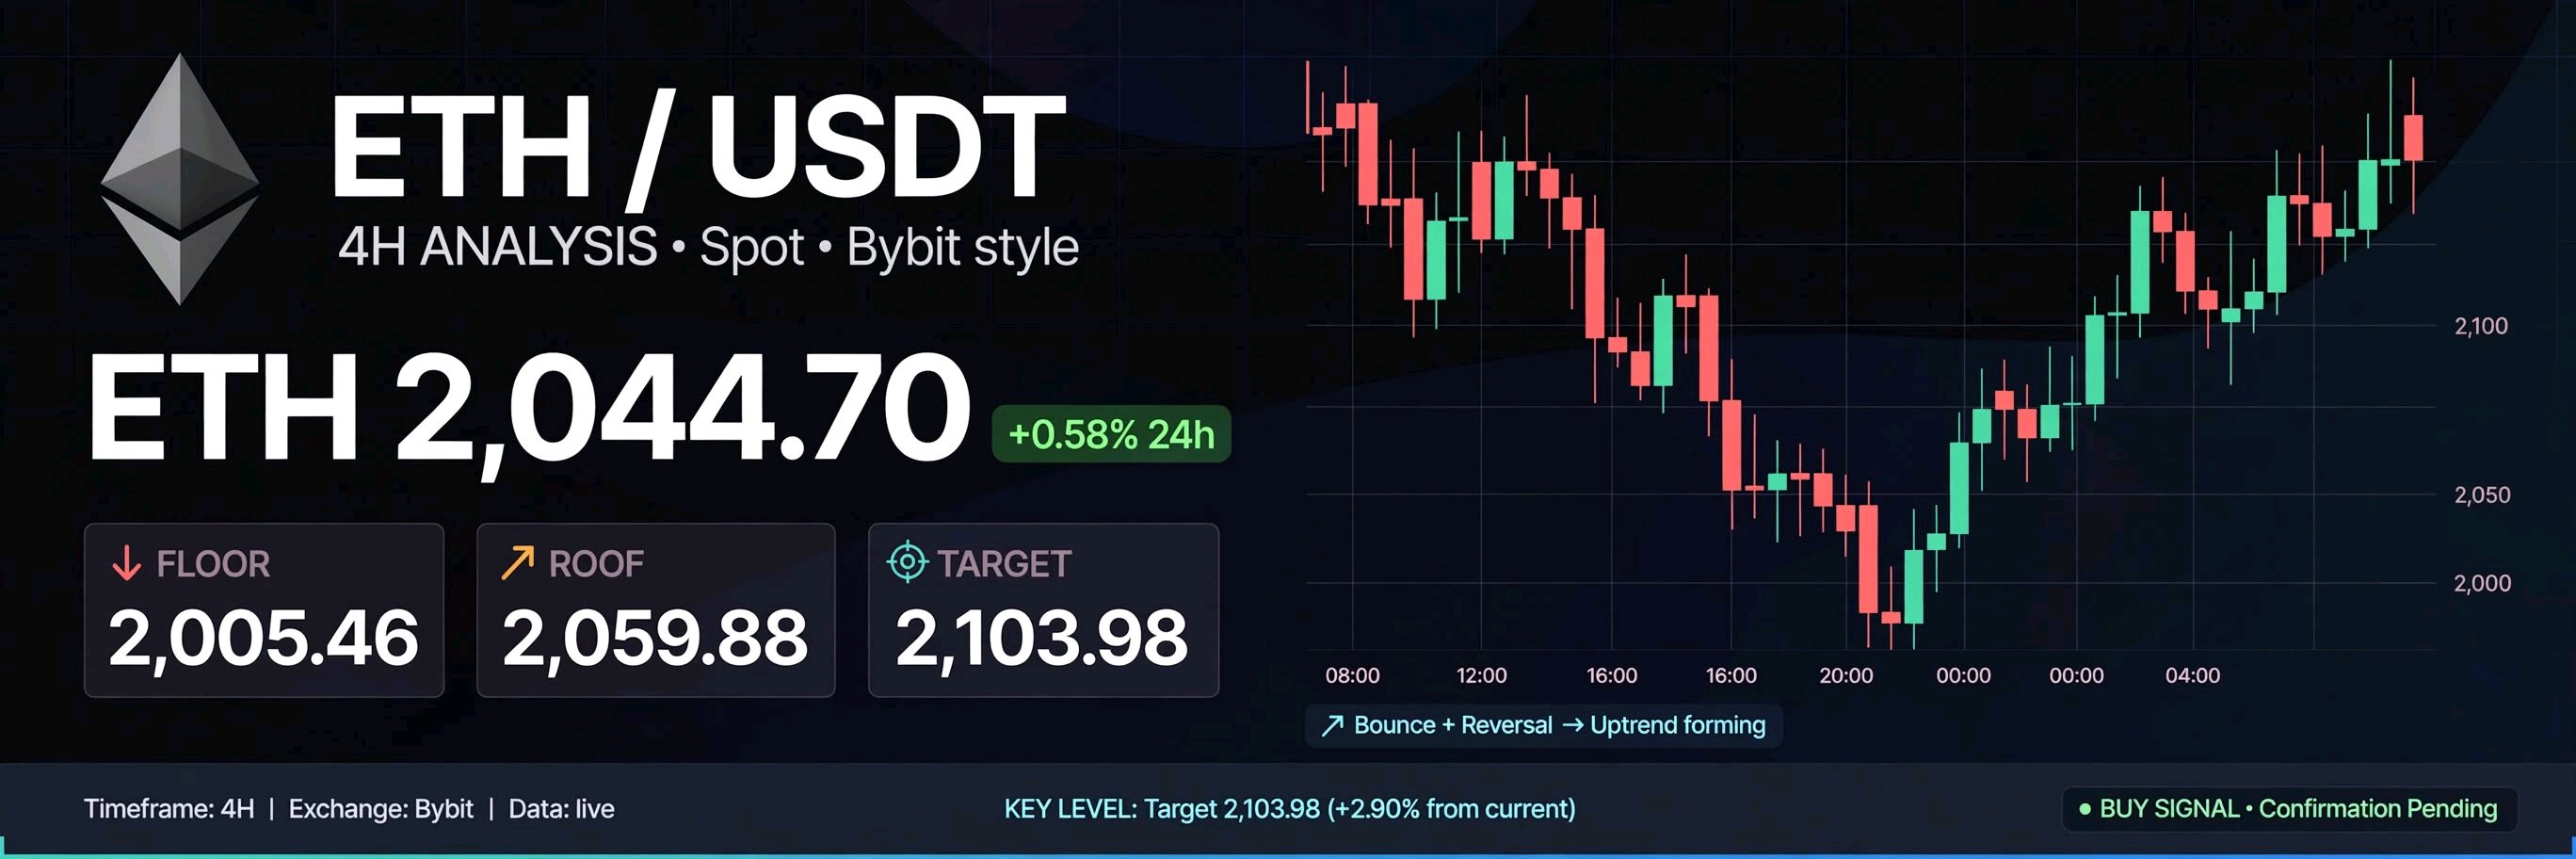
🚀 ETH 2,044.70 — FALLING KNIFE CAUGHT AT 2,005, NOW IT MUST PROVE IT ETH is at 2,044.70, -0.69% on the 4H. Forget the BTC squeeze. This is a different story. ETH fell like a knife from 2,254.49 straight down to 2,005.46. No bounce. No mercy. Then buyers finally caught it at 2,005.46 and pushed it back to 2,044.70. Now the question is not "will it squeeze?" The question is "was that catch real, or just a dead bounce before the next drop?" The Catch: 2,005.46 That is where the knife stopped. Three touches around 2,005.46, then a bounce. As long as price stays above 2,005.46, the catch is still valid. Below 2,005.46, the knife is falling again. The Test: 2,059.88 MA7 is 2,059.88. Price is sitting BELOW it — 2,044.70 vs 2,059.88. This is the test. ETH must get back above 2,059.88 to prove buyers are serious. Until then, sellers are still on top. The Wall: 2,118.60 MA14 is 2,063.14, MA28 is 2,118.60. Both are sitting ABOVE price. That is a wall. ETH has to climb through 2,063.14 first, then 2,103.98, then 2,118.60. One by one. Volume: 3.28K vs MA5 9.53K vs MA10 12.68K Volume is DOWN 65%. The catch at 2,005.46 had no power behind it. Buyers caught the knife, but they are not pushing yet. They are waiting to see if 2,005.46 holds on the close. BTC Link: BTC is at 73,512.4, -0.23%. ETH is down -0.69% while BTC is down -0.23%. ETH is weaker than BTC. If BTC holds 72,727.2, ETH can test 2,059.88. If BTC breaks, ETH will drop straight back to 2,005.46. 4H Close: 1 hour 00 minutes left. I don't trade the wick. I trade the close. Close above 2,059.88 = Catch is real, I look for long to 2,103.98 Close between 2,005.46 - 2,059.88 = Still proving, I wait Close below 2,005.46 = Catch failed, no trade 24H High: 2,103.98 24H Low: 2,035.94 24H Turnover: 162.00M My Plan — My Method: I don't catch falling knives. I designed my method for this exact moment. Step 1: Let ETH hold 2,005.46 on the 4H close Step 2: Let it break 2,059.88 and hold it Step 3: Only then I look for long to 2,103.98, then 2,118.60 No hold = No trade. I wait. I don't force it. My stop is just under 2,005.46, my entry is NOT in this caption. My exact entry and stop are on my ETHUSDT widget below — tap it and tell me if my catch read is wrong. Tell me in the comments: Was 2,005.46 a real catch, or just a bounce before another drop?$ETHUSDT#IMPACTbyTrade