Jack09
16775いいね0シェア282ファン24フォロー
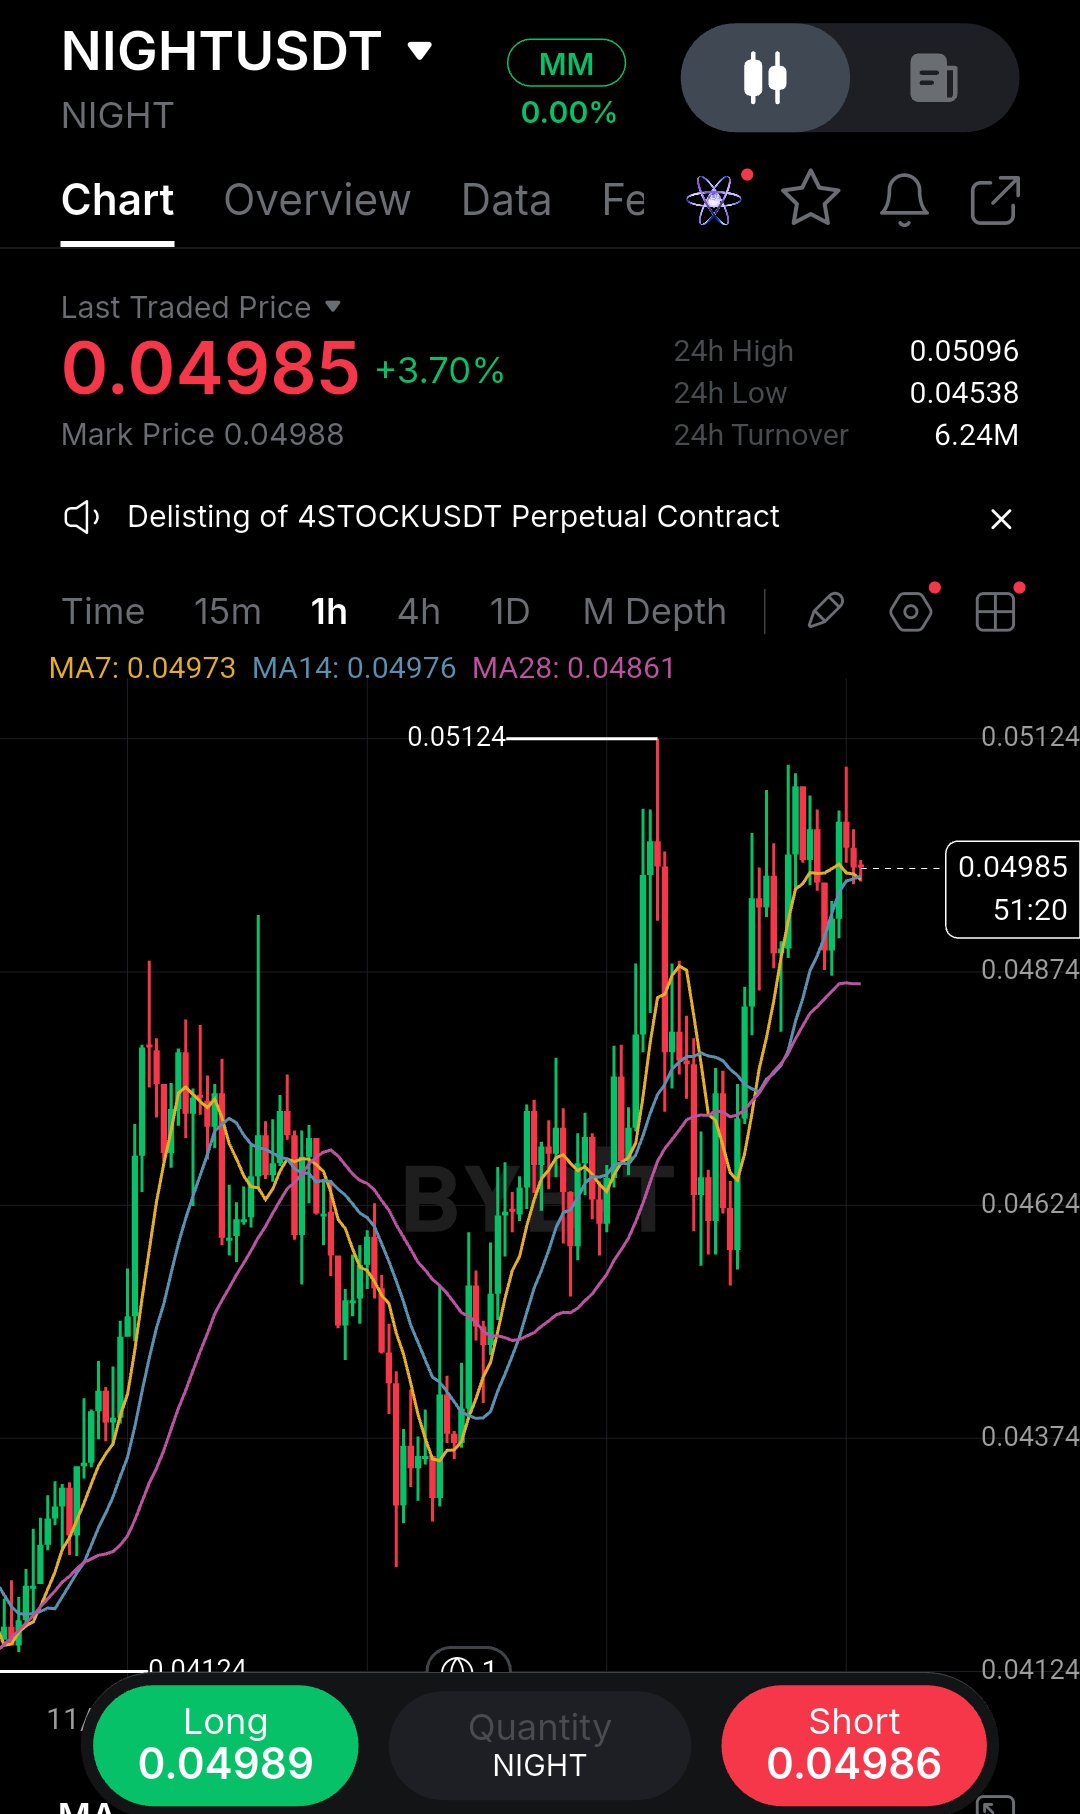
レジスタンス帯でそのまま飛び込むと、結局は陰線に睨まれる羽目になることを痛いほど学んだので、今回のNIGHTの1時間足チャートには細心の注意を払っています。価格は0.04985に迫っていますが、0.05124のスイングハイ(直近高値)に真っ向からぶつかっており、7日線と14日線はフラットになっています。真の問題は、はるか下の0.04861にある28日線です。モメンタムは鈍化しており、買い手の初期の勢いも失われつつあります。この垂直な上昇を追うつもりはありません。 私が何を見ているか、具体的に解説します。0.04124の安値からの回復は急激でクリーンでしたが、ラリーは今、以前のスイングハイである0.05124のすぐ下で停滞しています。これは偶然ではありません。その水準は以前の反落ポイントであり、再び供給ゾーンとして機能する可能性が高いです。一方、0.04973の7日線と0.04976の14日線は上向きから横ばいに転じており、短期的なモメンタムがピークに達したことを示しています。0.04861の28日線こそが真のトレンドのアンカーであり、まだ上昇しているため、より大きな上昇トレンド自体は崩れておらず、単に過熱しているだけです。これは典型的なプルバック(押し目)待ちのセットアップであり、ブレイクアウトでエントリーすべき場面ではありません。 強気ケースを裏付ける根拠は何でしょうか?高値を切り上げる構造は維持されており、28日線は上向きで、24時間安値の0.04538では買い手が押し目買いを積極的に防衛しました。もし価格が28日線までプルバックしてそこで支えられれば、トレンドに沿った教科書通りの継続セットアップとなります。 弱気ケースを裏付ける根拠は何でしょうか?0.05124という水準は明確な反落ポイントであり、短期移動平均線はフラット化しており、現在のローソク足はレジスタンス付近で失速気味です。もしここで買い手が力尽きれば、価格は切り下がり、サポートとしての28日線を試すか、あるいはそのまま突き抜ける可能性があります。 私の見立てでは、最も勝率が高いトレードは、現在の価格を追うことではなく、プルバックでのロングです。私は価格が自分の方へ来るのを待ちたい。つまり、28日線が構造的なサポートとして機能する0.04870〜0.04900のゾーンまで待つということです。そこで明確な強気の反転ローソク足が出れば、ロングエントリーします。 エントリー: 0.04880(確認ローソク足が出たら) 損切り(SL): 0.04820(28日線の下) 利確1(TP1): 0.05050 利確2(TP2): 0.05120 無効化条件: 0.04820を明確に下回って引けた場合、トレンドが崩れたと判断し、手を出さないようにします。以前は下落後の最初の陽線で飛びついていましたが、価格に実力を証明させることの大切さを学びました。自分を置いてけぼりにして価格が急騰したなら、それは諦めます。皆さんはどこでリテストを監視していますか? #ByXIMPACT #WSOT2026 $NIGHTUSDT $SPCXXUSDT
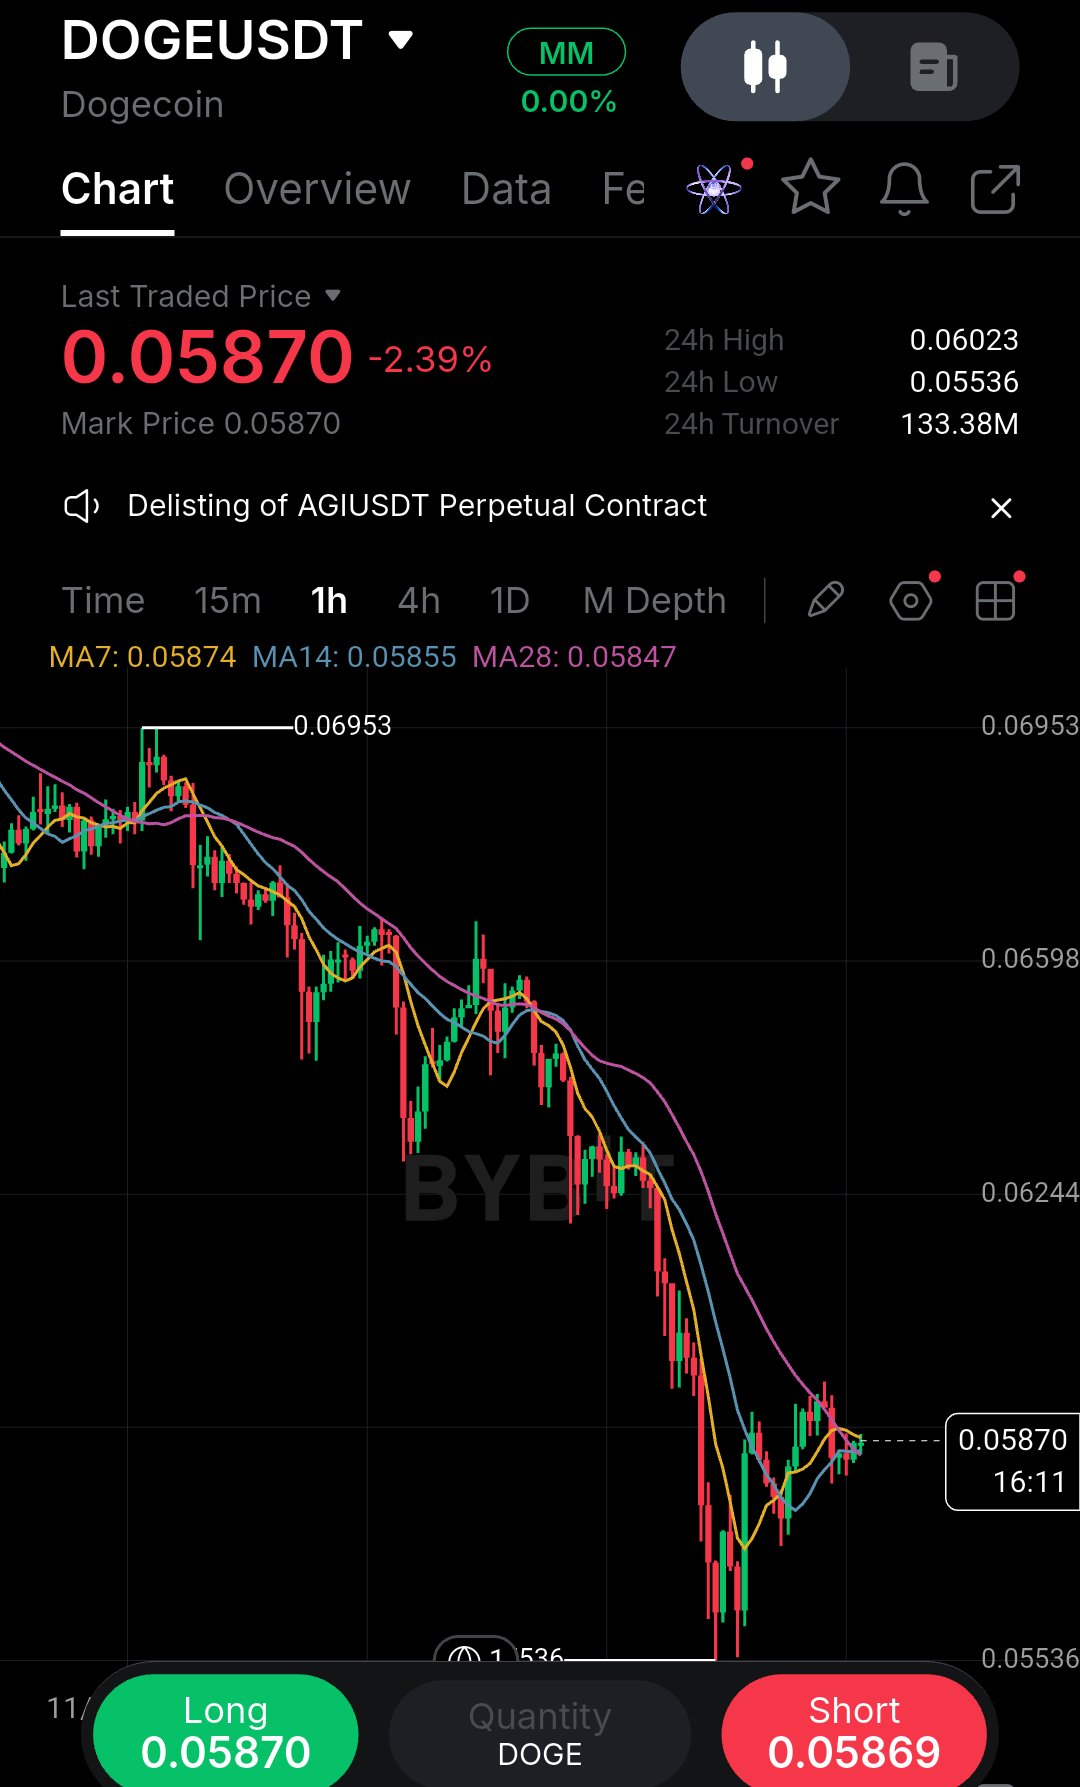
I’ve learned to distrust perfectly clean bounces after a hard dump, so I’m watching this DOGE 1h chart with patience rather than excitement. Price is clinging to 0.0587 after a brutal slide, but the structure is still a series of lower highs. The 7 and 14 MAs are flat, yet the 28 MA at 0.0584 is the real battleground.it’s acting as immediate overhead pressure. I can see the trapped buyers from the 0.062 breakdown, and I have no intention of adding myself to that crowd. Here is the honest read: this is not a reversal yet. It is a bounce inside a downtrend. The drop from 0.06953 to the 0.05536 low was fast and heavy, and fast drops usually leave a trail of unfinished business above. Those buyers who entered near 0.062 are now underwater, and every small rally gives them a chance to exit at break-even or with a smaller loss. That creates a wall of selling pressure right where the 28 MA sits. Until price reclaims that level and holds it, the path of least resistance remains down. What supports the bullish case? The wick at 0.05536 shows buyers defended that zone aggressively, and the short-term MAs are flattening, which means selling momentum is cooling. If price can reclaim 0.0590 with a strong close, the trapped sellers above may start covering, and that fuel could push us toward 0.0620. What supports the bearish case? Everything else. The trend is down, the structure is lower highs, and the bounce is weak relative to the drop. A failure at the 28 MA would likely send price back to test 0.05536, and a break there opens the door to deeper levels. My execution plan is simple. I want a decisive reclaim and close above 0.0590 to confirm buyers are actually stepping in. If that fails, a lower high is the signal to stay out and wait. Entry: 0.0591 (confirmation) SL: 0.0575 (below recent wick) TP1: 0.0620 TP2: 0.0650 Risk/Reward is roughly 1:1.6 to TP1, which is acceptable for a counter-trend bounce but not a trade I would oversize. Invalidation is a clean break below 0.0575.If that happens, the bounce thesis is dead and I step aside. I used to jump on these early reversals and get stopped out by the retest. Now I let the candle close first. Discipline beats FOMO every time. Where’s your line in the sand? #ByXIMPACT #WSOT2026 $DOGEUSDT $SPCXXUSDT
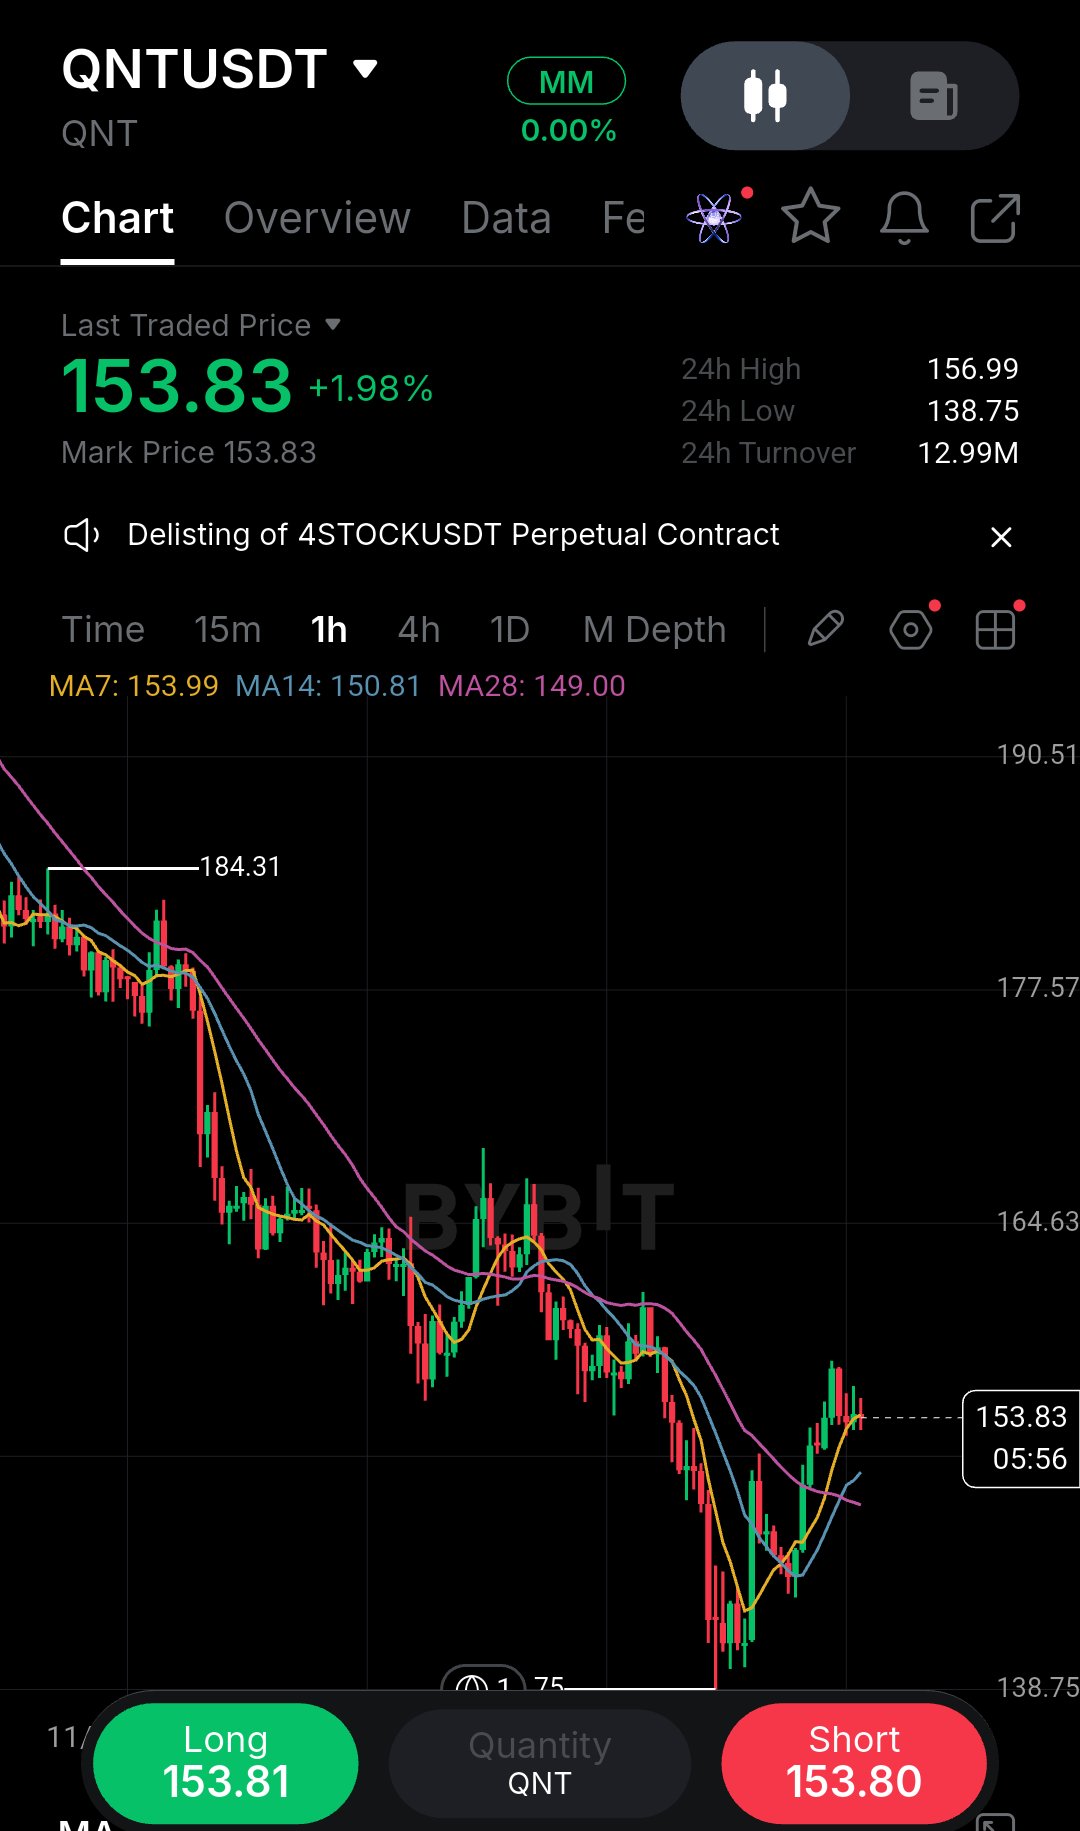
I’ve seen too many traders get chopped up trying to catch falling knives, so I’m approaching this QNT bounce with a lot of caution. Yes, we got a sharp liquidity sweep down to 138.75 and a decent reaction, but look where we are now 153.83, right underneath the MA7 at 153.99. The one thing that matters here is whether this is a genuine reclaim or just a lower high forming in a brutal downtrend. Sellers still control the broader structure, and this little bounce is testing its first real dynamic resistance. The MA14 sits at 150.81 and the MA28 is way down at 149.00, meaning price has already pushed above the slower averages but is struggling to clear the fastest one. That tells me momentum is shifting, but it hasn't fully flipped yet. I’m not stepping in just because it’s green. If price can print a strong 1H close above 154.5, I’ll consider a long for the continuation. Otherwise, I’m just watching. The bearish case is straightforward.This is a classic relief rally after a liquidity grab, and the trend remains down. The bullish case is that the sweep at 138.75 trapped sellers, and the higher low forming now could be the start of a reversal. But "could be" isn't confirmation. I need to see buyers absorb the supply at the MA7 before I risk capital. Entry: Confirmed 1H close above 154.5. SL: 149.0 (below the MA28). TP1: 164.6 (previous breakdown zone). TP2: 177.5 (major structural resistance). The lesson I keep in mind: a bounce isn't a reversal until it proves it can break structure. Don't move your stop if it wiggles. If 154 rejects, I stay flat. How are you playing this retest? #ByXIMPACT #WSOT2026 $QNTUSDT $SPCXXUSDT
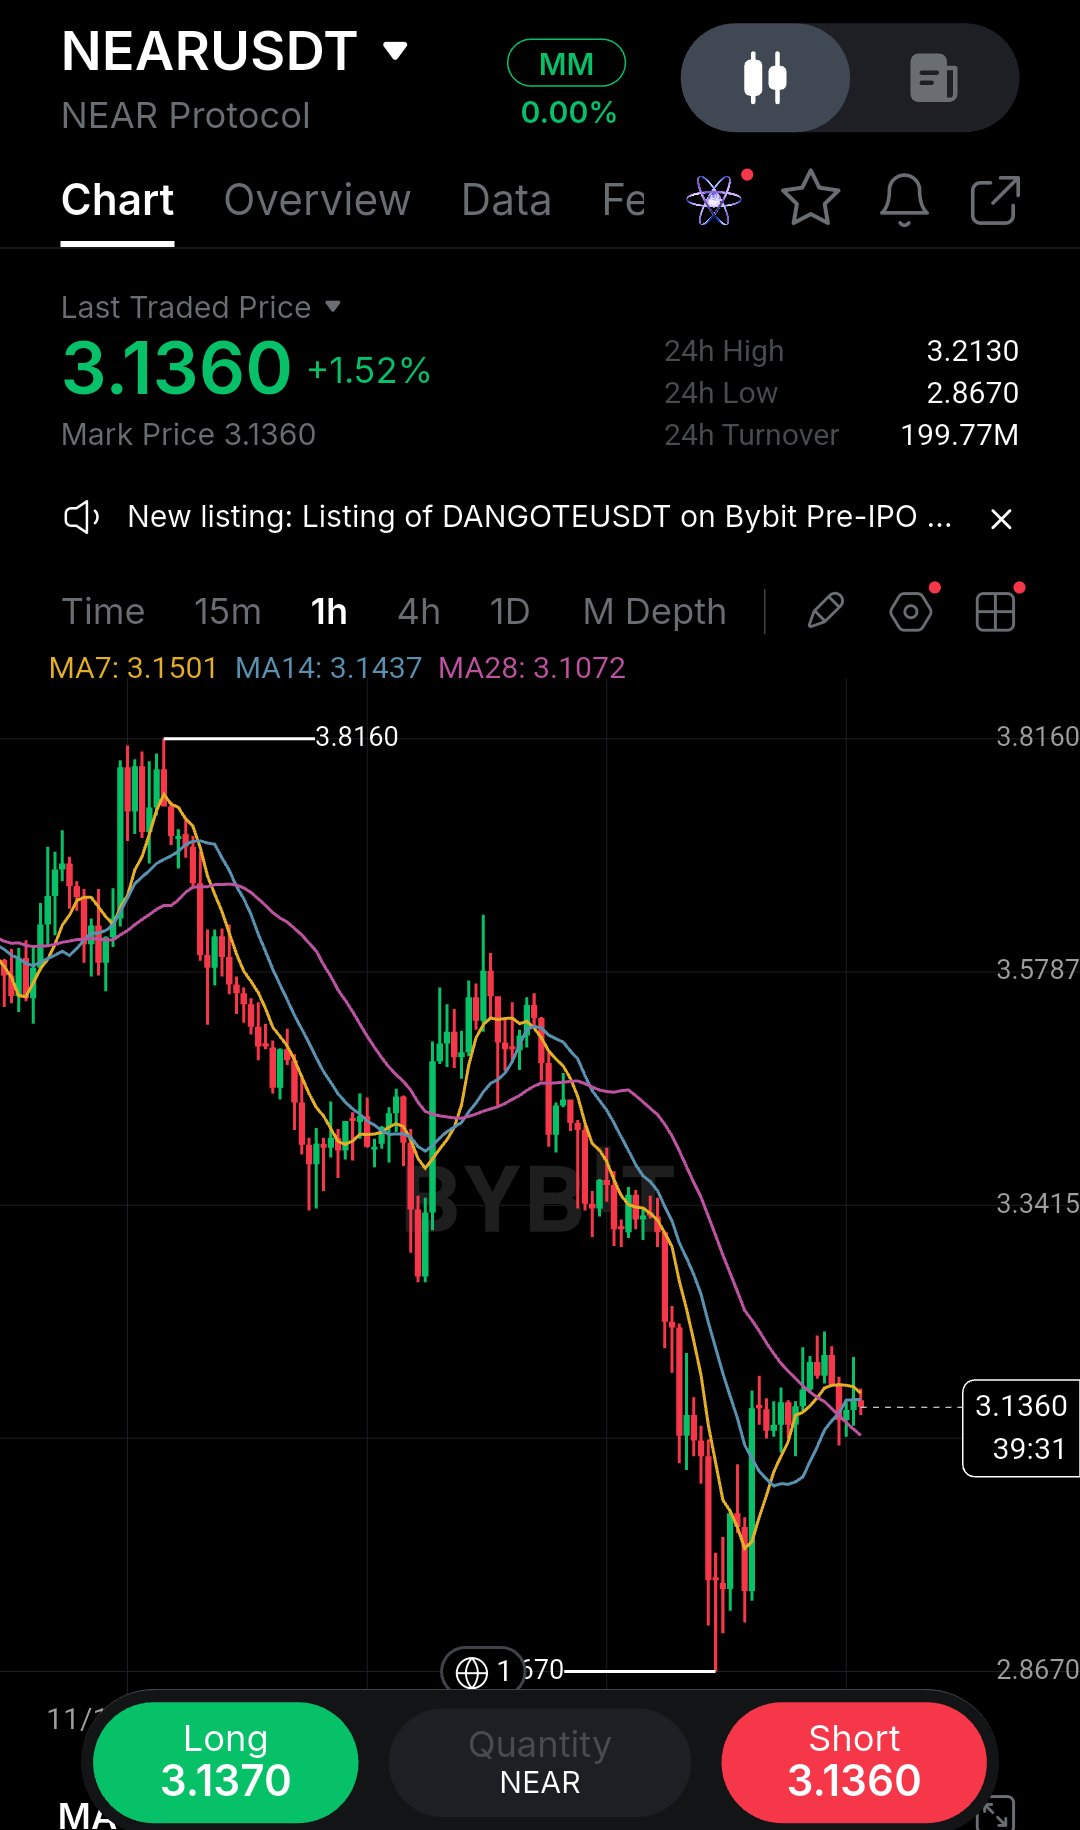
I’ve caught myself forcing longs on charts like this before, so I’m being deliberately patient here. NEAR is printing a clear bounce off the 2.8670 low, but it’s still trapped below the 3.15–3.20 cluster where the shorter MAs sit. Look at the structure carefully. Price sold off hard from the 3.8160 high, printing a series of lower highs and lower lows before finally finding a bid near 2.8670. That low was a sharp wick.A classic liquidity sweep where sellers pushed price below the prior consolidation and then got trapped as buyers absorbed the selling. The bounce we’re seeing now is real, but it’s happening into a very specific supply zone. The 1H chart shows the MA7 at 3.1501, MA14 at 3.1437, and MA28 at 3.1072. Notice how price is currently grinding right into the MA7 and MA14.That’s your first real test. If buyers can’t push through that cluster with conviction, the bounce is just a retest of prior support-turned-resistance. The bearish case is simple: the trend is still down, the moving averages are still sloping lower, and this bounce hasn’t broken any meaningful structure. The bullish case is that the 2.8670 wick shows sellers exhausted, and the higher low forming on the 1H is a potential early reversal signal. But potential isn’t a trade. I need confirmation. That’s why my plan is strict. I’m not entering until I see a clean 1H close above 3.16, which would clear the MA cluster and reclaim the prior support zone. If that happens, the entry is valid. Entry: Only on a confirmed 1H close above 3.16. SL: 3.07 (below the recent swing low and the MA28). TP1: 3.34 (next structural resistance). TP2: 3.58 (previous breakdown zone). Invalidation: A rejection wick at 3.16 followed by a break under 3.10. The lesson I keep learning: a bounce isn’t a reversal until structure confirms it. I’ve chased too many green candles that looked like the bottom, only to watch them fade into the next leg down. Don’t move your stop just because price wiggles. If 3.16 rejects, I’m flat and waiting. What’s your trigger here? #ByXIMPACT #WSOT2026 $NEARUSDT $SPCXXUSDT
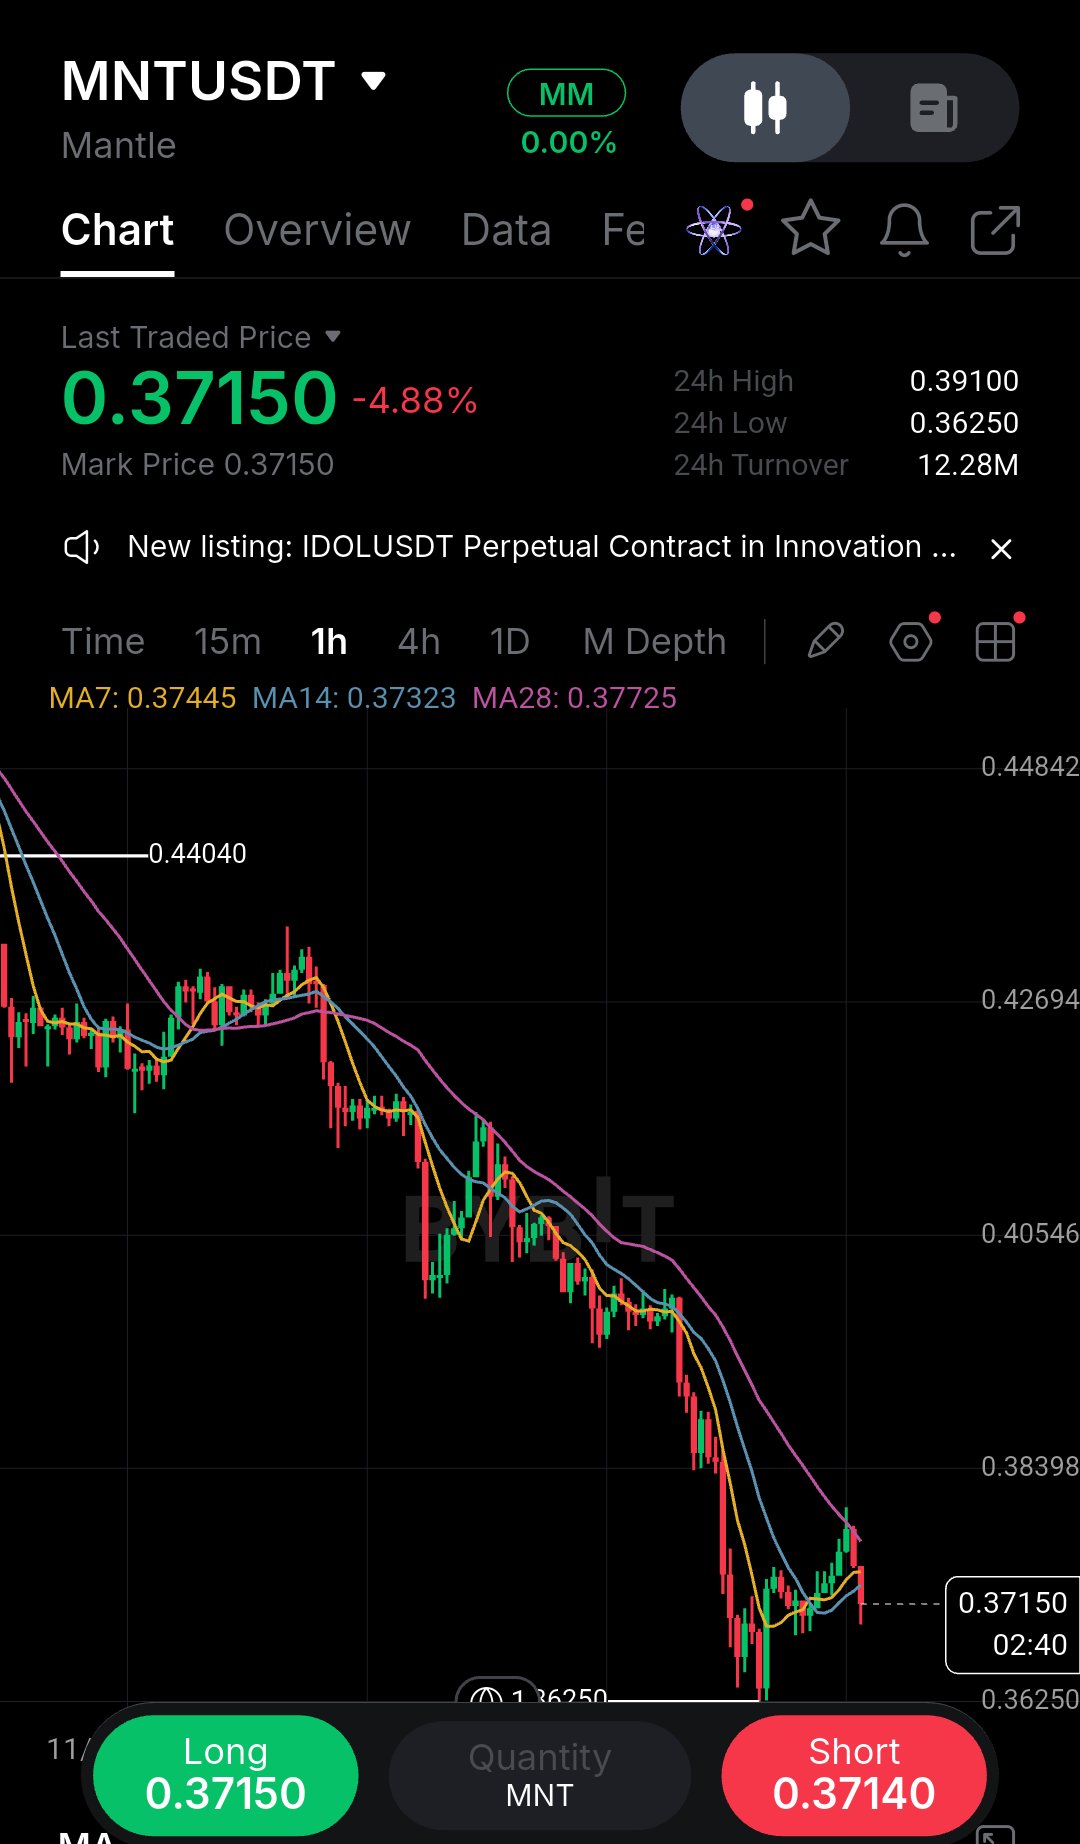
I've learned to be patient with charts that look ready to bounce before they actually confirm. Looking at MNT on the 1h, price is down nearly 5% and bleeding below all key moving averages (MA7, MA14, MA28). The structure is clearly bearish, but the last few candles show a potential liquidity sweep near the 0.3625 low, with buyers stepping in. That wick is interesting, but it is not a reversal yet. I'm not chasing this bounce. The real test is whether price can reclaim the 0.3770 area, where MA28 sits and where prior support turned into resistance. Until that happens, the trend remains heavy, and every green candle is just a bounce inside a downtrend. The 24h high of 0.3910 shows where sellers previously took control, while the 24h low of 0.3625 is the level that matters right now. Entry: Wait for a 1h close above 0.3730. SL: 0.3620, below the recent wick low. TP1: 0.3830, nearest resistance. TP2: 0.3950, structural high. TP3: 0.4050 only if momentum expands. Invalidation: A clean break below 0.3625 without a reclaim cancels the idea. One lesson I've paid for: never treat a green candle as confirmation. I used to enter on the first sign of buying, only to get stopped out as the downtrend resumed. Let the structure prove itself. A bounce becomes a reversal only when price breaks structure and holds above it. Risk management here is simple: if price rejects 0.3730 and rolls over, I stay out. If it closes above and retests, I take the trade with a tight stop. TP1 is where I take partials, not proof the whole trade works. Move the stop only after structure confirms, never because price moves against you. Would you take this bounce, or is the trend too strong to fight? #ByXIMPACT #WSOT2026 $MNTUSDT $NVDAXUSDT
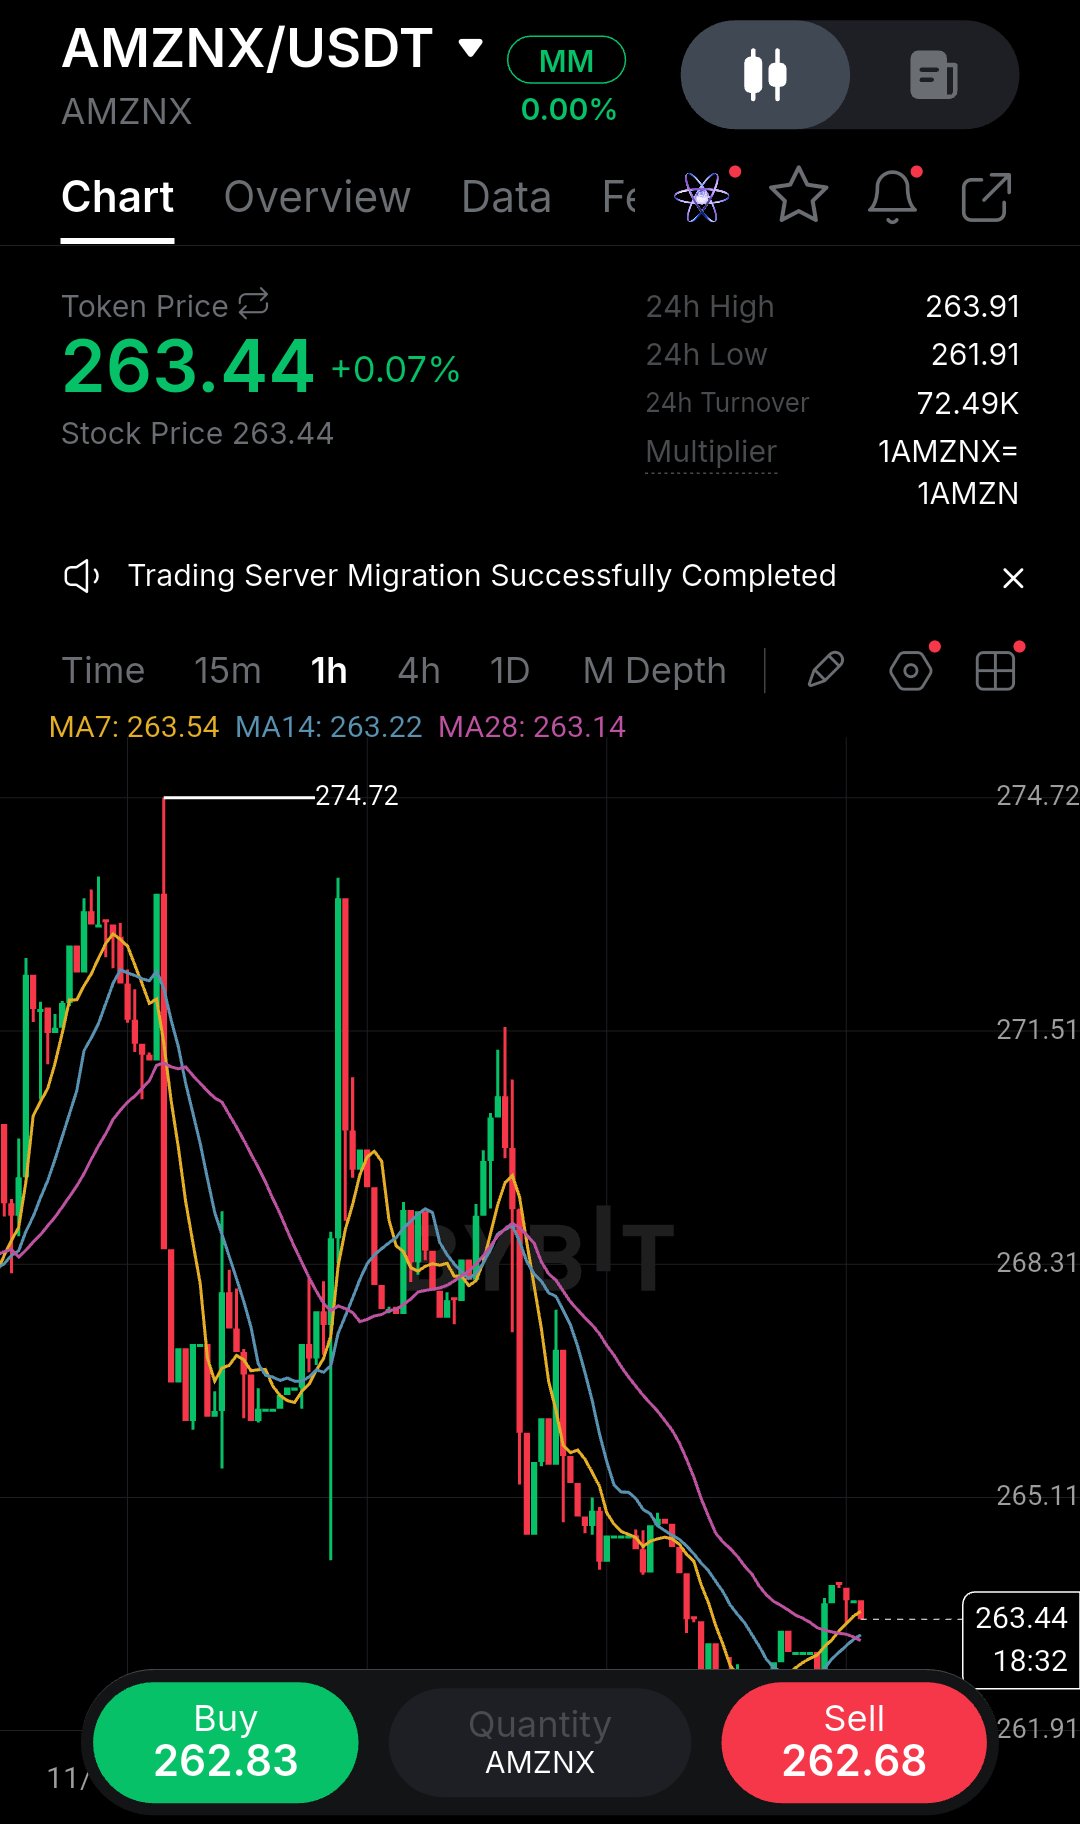
以前にも全く同じ状況を経験したことがある。ひどいダウントレンドがようやく一息つき、まさに底値を予測しようとしている局面だ。AMZNXは274.72からこの263のフロアまで大きく下げ続けてきたが、1時間足の構造にはそろそろ疲弊の兆しが見え始めている。価格は263.44の水準で推移しており、注目すべきは移動平均線が平坦化し収束し始めていることだ。これは売り手の勢いが弱まっていることを示唆している。しかし、ここで反転を予測するのは危険だ。資本をリスクにさらす前に、買い手が実際に押し返す力があることを証明してくれるのを見届けたい。 このようなチャートの時、早めに飛び込んで絶対的な安値で拾いたいという誘惑に駆られるが、それは初心者のミスだ。市場は執拗なダウントレンドの中にあり、今見ている反発もまだ証明されていない。MA7、MA14、MA28の周辺で価格が停滞していることに注目してほしい。これらの平均線が収束していることは、大きな動きの前の揉み合いを示唆することが多い。問題は、目先のモメンタムは依然として弱気であり、直近のローソク足は力強い強気反転ではなく迷いを示していることだ。もしここで買ってサポートが割れたら、すぐに含み損を抱え、負けポジションの管理を強いられることになる。市場が手の内を見せるのを待つ方がずっといい。 バイアス:ロング(確認後) エントリー:264.00 – 264.50(MAクラスター上での1時間足確定後のみ) 確認:264.20を奪還する力強い1時間足の確定。これが構造変化のシグナルとなる。 損切り(SL):261.90(24時間安値のすぐ下) 利益確定1(TP1):266.00 利益確定2(TP2):268.50 無効化:261.90を下回る1時間足の確定。 もし逆に下落したとしても、無理にトレードしてはいけない。鍵となるのは、市場にその実力を証明させることだ。もし確認の取れた奪還が見られれば、損切りを直近のスイング安値のすぐ下にタイトに置けるため、リスクリワードははるかに有利になる。だが、それがなければダウントレンドは継続しているということであり、単にトレードを見送るだけだ。ここが忍耐が報われるところだ。セットアップが確認できないまま動きを逃したとしても、恥じることはない。ローソク足が確定するのを待ち、損切りレベルを尊重し、FOMO(取り残される恐怖)でリスク管理を台無しにしないことだ。君なら、目先の底で買うか、それともトレンド転換を待つか? #ByXIMPACT #WSOT2026 $AMZNXUSDT $SPCXXUSDT
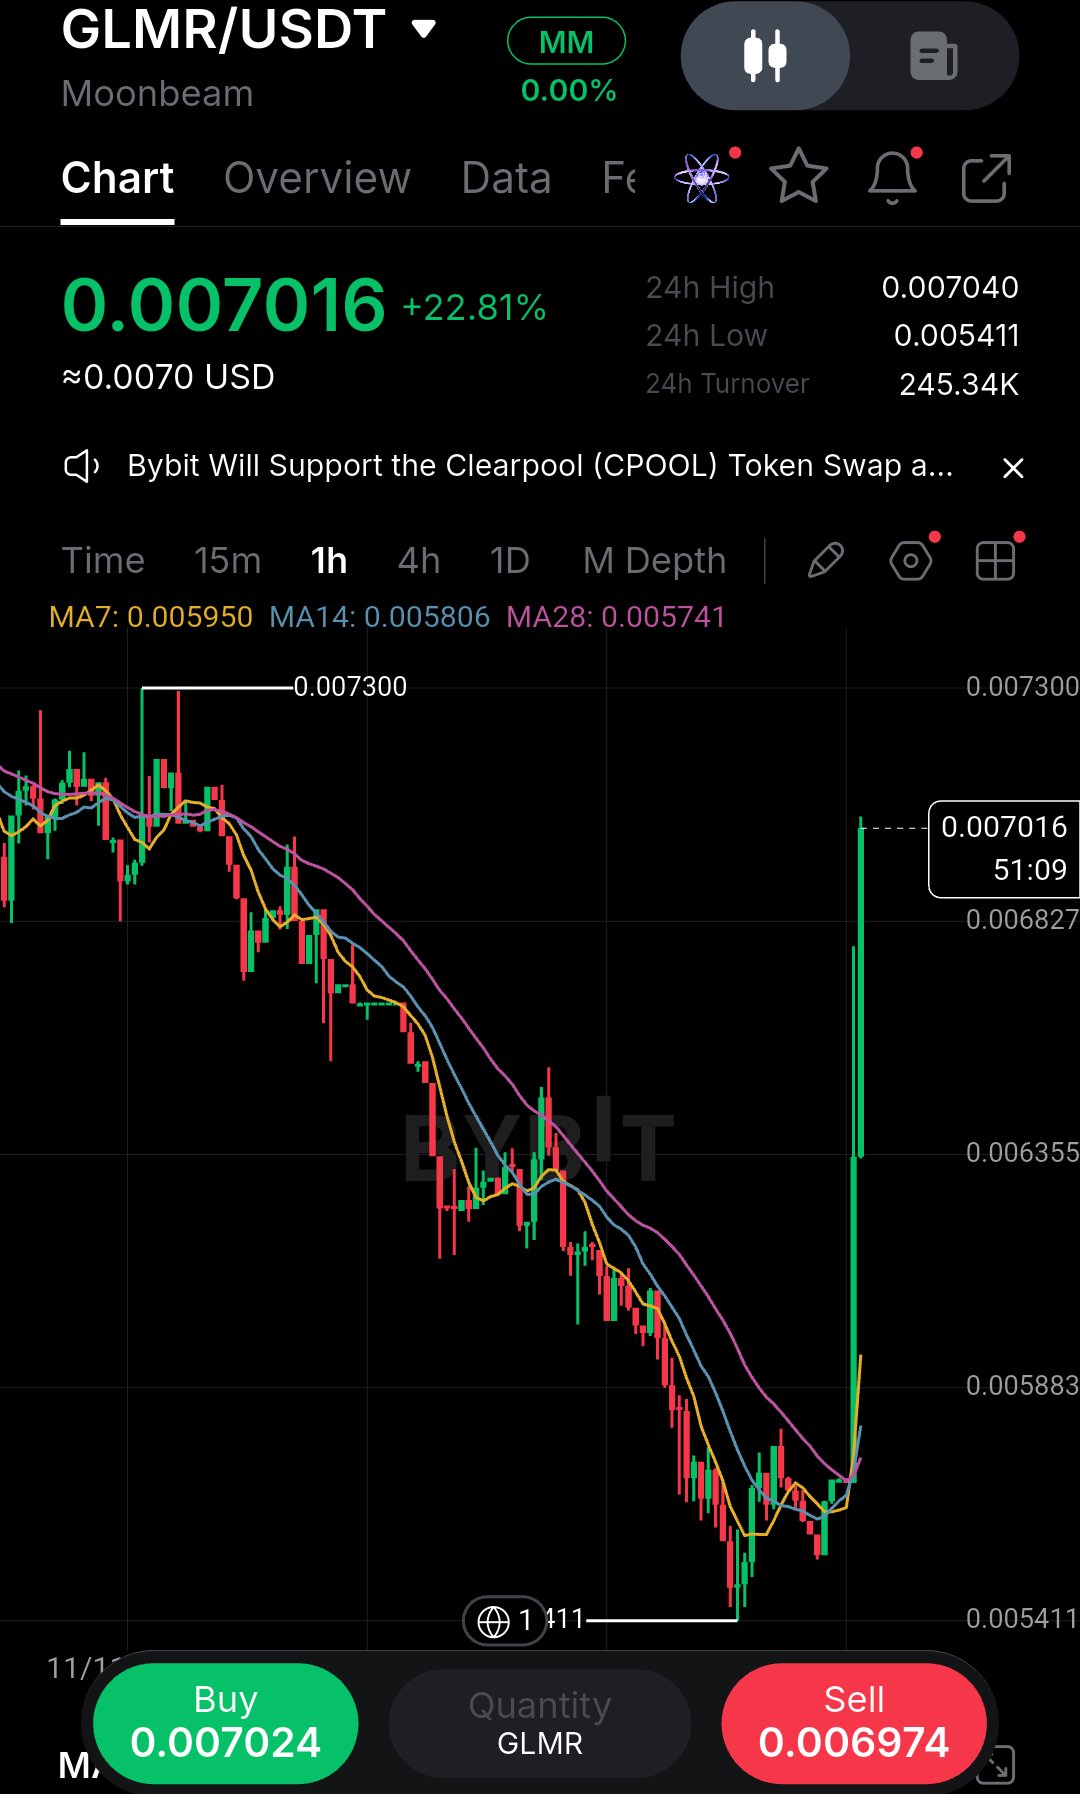
I’ve been burned buying vertical green candles like this before, so my instinct is to wait for the chart to breathe rather than chase the top. GLMR just ripped from the 0.005411 lows straight to 0.007016 on the 1h timeframe, completely clearing the moving averages. The structure shows a massive liquidity sweep, but the problem is the lack of a retest. Shorting this momentum is dangerous, and buying right here is just gambling on a pullback that hasn't happened. When a move is this aggressive, the market rarely gives you a clean entry at the current price. The candles are expanding, volatility is high, and the risk to reward from this exact level is poor because your stop loss has to be incredibly wide to survive normal noise. I’d rather let the initial FOMO cool off. If price pulls back and holds the 0.00650–0.00680 zone (near the moving average cluster), that’s the real confirmation I need. That area represents the origin of the breakout, and a successful retest there proves buyers are still defending the move rather than just chasing a green candle. Entry: 0.00660–0.00680 (on a confirmed hold) SL: 0.00620 (below the local structure) TP1: 0.00730 (prior swing high) TP2: 0.00780 Invalidation: A 1h close below 0.00635. My early mistake was always entering before confirmation. If we lose 0.00635, the pump was likely a trap, and trapped buyers will provide the liquidity for the next leg down. Do you wait for the retest or trade the breakout? #ByXIMPACT #WSOT2026 $GLMRUSDT $SPCXXUSDT
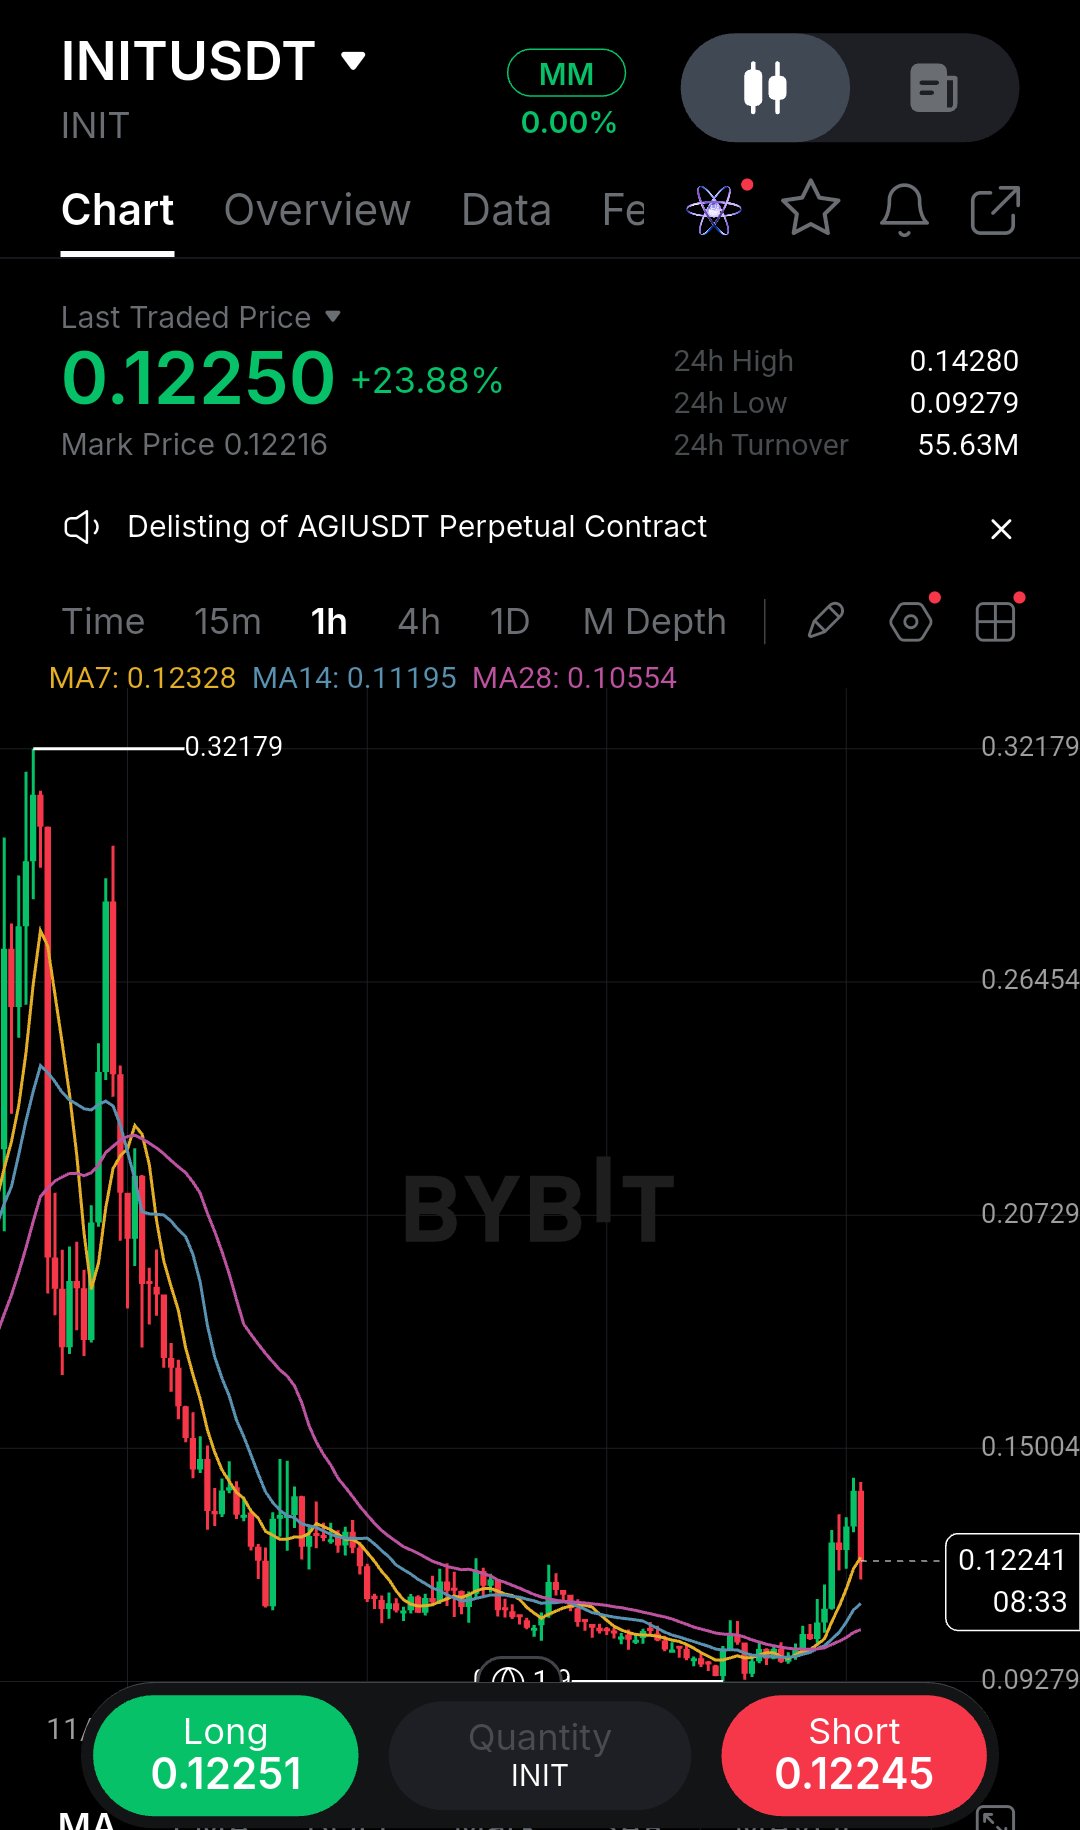
厳しいダウントレンドの後に力強い陽線が出ると、いつもエントリーする前に上位足の状況を確認するようにしている。このINITの1時間足チャートを見ると、安値$0.09279から24%近く上昇しているが、上値の重さには注意が必要だ。まだ$0.32179の高値からは程遠く、現在の反発もMA14($0.11195)というレジスタンスに直接ぶつかっている。陽線が出るとつい飛びつきたくなるが、このゲームでは大局的な視点がすべてだ。 個人的に注目しているのは、このV字回復の勢いの強さだ。かなりアグレッシブだが、MAクラスターに突っ込むような買い方は大抵罠にハマる。大きな暴落後の最初の陽線で買って、その後リジェクトされて反落していく様子を何度も見てきた。構造的には依然として弱気相場なので、証明されるまでは単なるリリーフラリー(自律反発)と見なしている。市場は次の下落の前にせっかちな買い手を誘い込むものだし、自分はそんなカモにはなりたくない。 それよりも、綺麗なリテストを待ちたい。もし価格が$0.1050〜$0.1100のゾーンまで押し目を形成し、MA28($0.10554)の上で耐えるなら、トレードの根拠となる明確な高値切り上げが確認できる。このアプローチの良いところは、嫌でも忍耐強くなれることだ。もしこの反発が本物なら、構造的なエントリーチャンスが来るはずだし、もしフェイクなら、ドローダウンを完全に回避できる。 トレードプラン バイアス: 待機(押し目買い狙い) エントリー: $0.1070 – $0.1100 確認事項: 1時間足でMA28/MA14クラスターをサポートにした強気の反発ローソク足 損切り (SL): $0.10100(MA28の下) 利確 (TP1): $0.12328 (MA7) 利確 (TP2): $0.13500 最大の懸念は、MA14で完全にリジェクトされて安値圏まで突き落とされることだ。もし$0.105を勢いよく割り込んだら強気シナリオは終了、即座に撤退する。現在のローソク足を追うな。構造が確定するのを待て。お前らはリテストを待つ派か、それともこの反発を逆張りでショートする派か? #ByXIMPACT #WSOT2026 $INITUSDT $HYPEUSDT
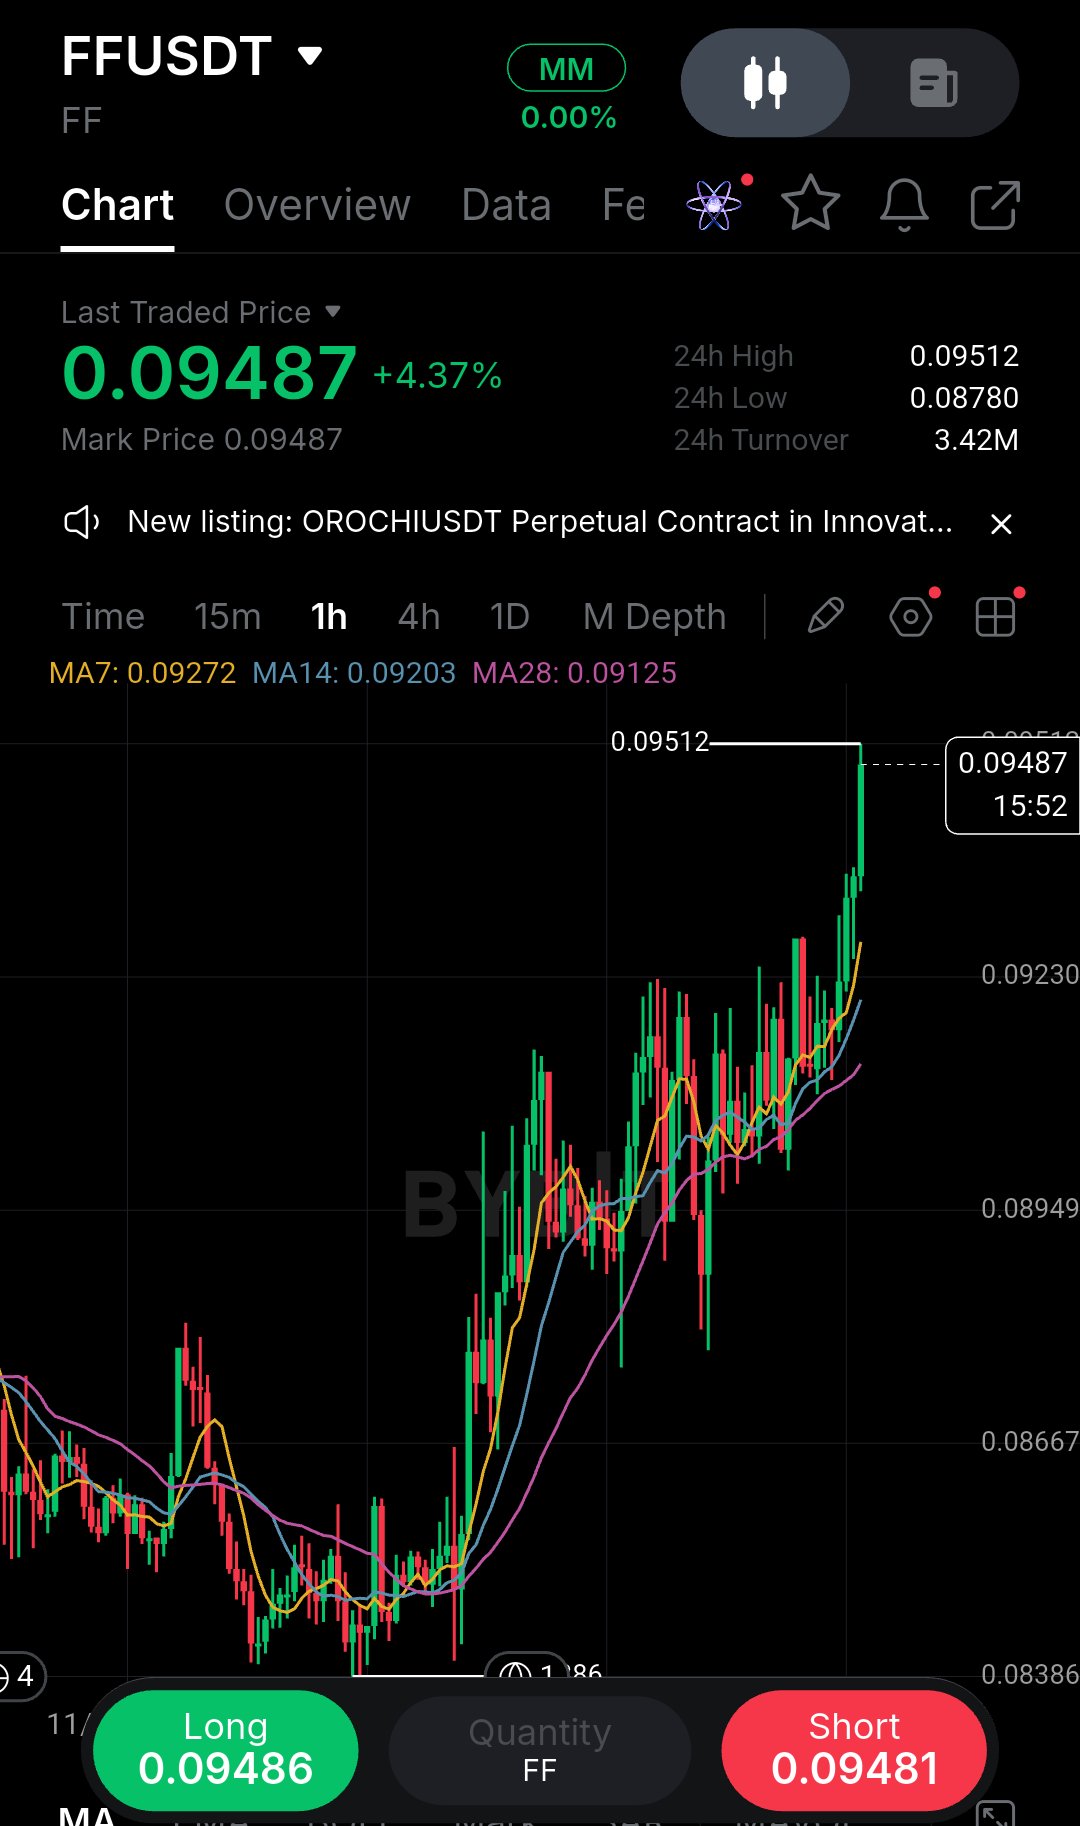
確定する前に準備が整ったように見える垂直な陽線には注意が必要だと学びました。1時間足でFFを見るとトレンドは紛れもなく強気ですが、価格は0.09512ドルの高値に真っ直ぐ向かっており、ここ数本のローソク足は攻撃的になっています。私が注目したのは、緑の勢いだけではありません。現在の価格と移動平均線の間に大きな乖離があることです。MA7は0.09272ドルにありますが、MA14は0.09203ドルとかなり下に位置し、MA28はさらに低い0.09125ドルにあります。これは大きなギャップです。 今ロングエントリーすれば、大きく伸びきった動きを追うことになり、損切り位置は遠くなります。以前そのようなことをして、価格が一息ついた瞬間にタイトな損切りに引っかかるという経験をしました。市場は遅れて飛び乗った人を懲らしめる癖があります。チャートが動的なサポートからこれほど乖離している場合、新規エントリーのリスクリワードは悪いです。あなたは本質的に、調整なしでローソク足が上昇し続けることを望んでいますが、それは戦略ではなくギャンブルです。 私の読みでは、リテストを待ちます。これが本物のブレイクアウトなら、価格は0.0920〜0.0930ドルのゾーンに戻り、MAサポートをテストし、遅れて入ったロング勢を振るい落とし、きれいなエントリーポイントを与えてくれるはずです。このセットアップで私が気に入っているのは、移動平均線が完璧な強気の順序(MA7 > MA14 > MA28)で並んでおり、トレンドを確認できている点です。しかし、だからといって天井で買うべきだという意味ではありません。 トレードプラン バイアス:様子見(プルバックでロング) エントリーゾーン:0.0920ドル〜0.0930ドル 確認事項:MAクラスターでの1時間足の強気リジェクション・ローソク足 損切り / 無効化ライン:0.09050ドル(MA28と直近の保ち合いの下) 利確1(TP1):0.09510ドル(現在の高値) 利確2(TP2):0.09800ドル 無効化:1時間足が0.09125ドルを割り込んで確定すれば構造は崩れる。 最大のリスクはFOMO(取り残される恐怖)です。このローソク足を追いかけないでください。プルバックなしで0.098ドルまで上昇したなら、見送りましょう。トレードを逃したことを受け入れ、次に進むのです。あなたはリテストを待っていますか、それともここでショートを入れますか? #ByXIMPACT #WSOT2026 $FFUSDT $TSLAXUSDT
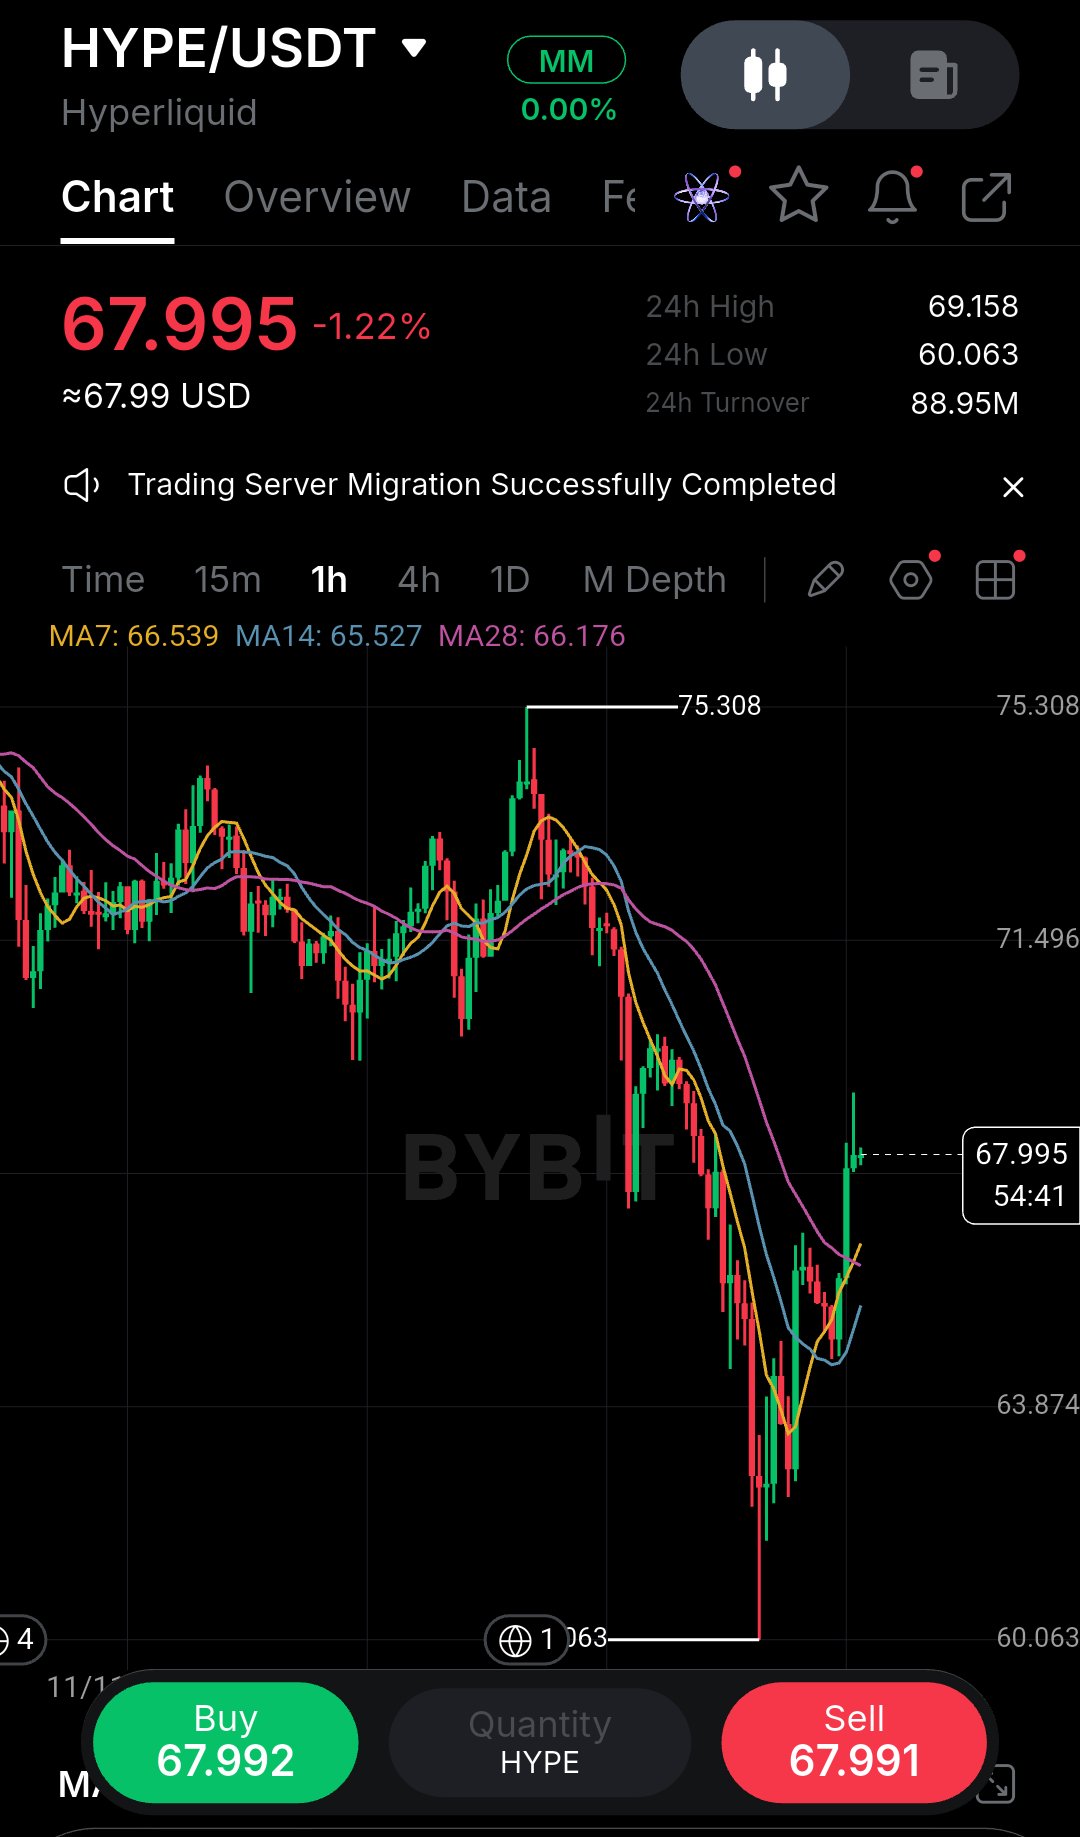
以前、大きな陽線が出たというだけで落ちてくるナイフを掴もうとして痛い目を見たことがある。HYPEの1時間足チャートを見ると、60.063ドルの安値からの激しい反発はあるものの、市場構造は依然として根本的に弱気だ。注目しているのは、価格が現在68〜69ドルの領域に叩きつけられている点だが、これは66.17ドルのMA28や以前のブレイクダウンエリアと完璧に一致している。今のところ、市場は底値で流動性を狩った後、厚い上値抵抗に向かって自律反発(レリーフラリー)しているように見える。 75.308ドルのスイングハイがこの下降トレンドのアンカーとして依然として機能している。現状、これは確定したトレンド転換ではなく、短期的な自律反発に見える。ここではロングを追わないつもりだ。代わりに、このレジスタンスでの拒否反応や、安値が維持されるかを確認するためのプルバックを注視している。もし価格がこの69ドルのゾーンで拒絶され、MA14(65.52ドル)を再び割り込んだら、ショートを狙う。 トレードプラン バイアス:ショート(確認後) エントリーゾーン:67.50ドル〜68.50ドル(明確な拒絶反応を確認後) 確認条件:1時間足での弱気な拒絶足(シューティングスターなど)または66.50ドルを下回っての確定 ストップ / 無効化ライン:69.50ドル(直近高値の上) 利確目標1 (TP1):64.00ドル 利確目標2 (TP2):60.50ドル(安値の再テスト) リスクリワード:68.00ドル付近でエントリーできた場合、TP2まで約1:2 最も懸念しているリスクは、69ドルを明確に上抜けて早まったショート勢を罠にはめる構造的なブレイクだ。もしそのレベルを上回る強い1時間足確定が見られたら、このアイデアは無効として撤退する。また、明確な拒絶反応なしに価格が横ばいで推移する場合もトレードは見送る。忍耐が鍵だ。 個人的には、売り圧力が戻ってくるのを確認するまでエントリーするつもりはない。皆は70ドルの奪還を待っているのか、それともこの反発を売りで狙うのか? #ByXIMPACT #WSOT2026 $HYPEUSDT $SPCXXUSDT
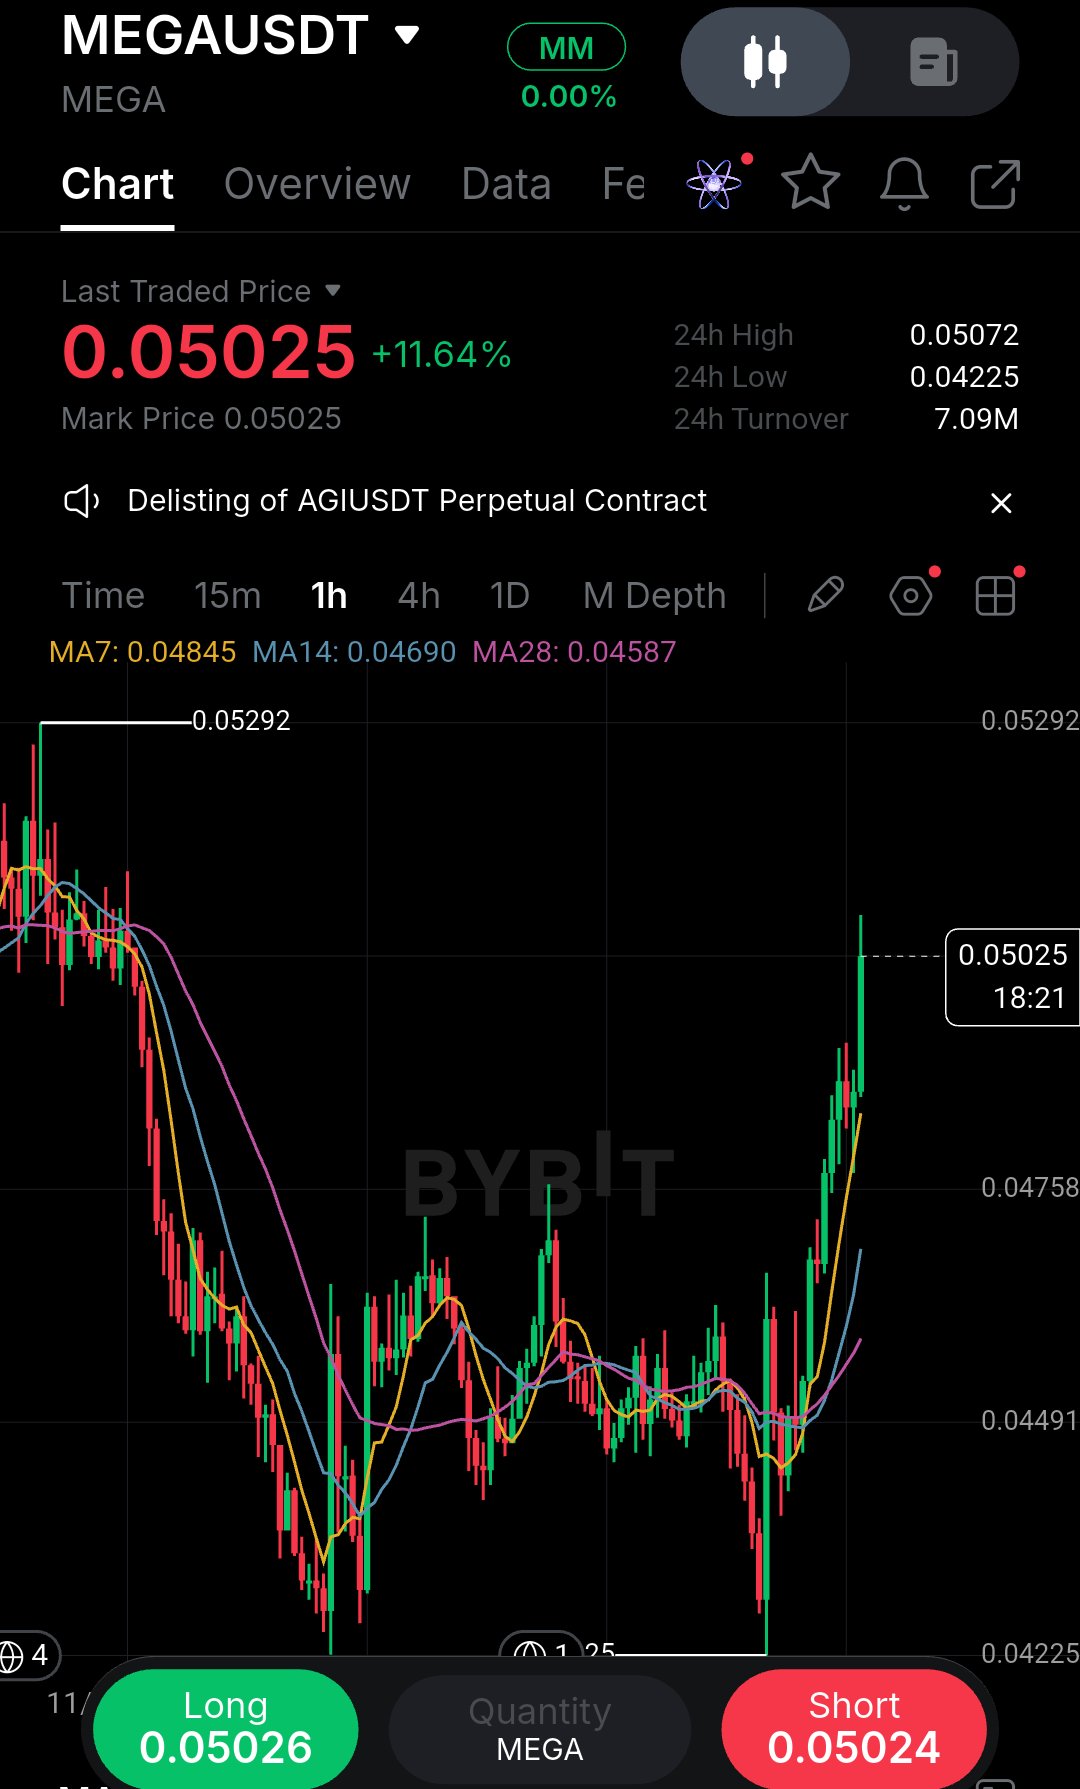
I’ve been burned chasing green candles exactly like this before, so when I see a chart this vertically extended, my instinct is to wait for the pullback rather than enter at the absolute highs. MEGA just ripped from a low of $0.042 to $0.050 in a near-vertical, parabolic move on the 1H timeframe. This kind of aggressive expansion is exciting, but it leaves a massive structural gap behind it, and late buyers are extremely vulnerable to a sudden mean-reversion snap back. While the momentum is clearly bullish right now, this is a textbook FOMO trap. The price is far detached from the 7, 14, and 28 moving averages, which are all trailing way down near $0.045–$0.048. When price gets this stretched from its dynamic support, gravity usually wins in the short term. Buying here is a poor risk-reward setup because you are risking a deep retracement just to catch the last few cents of a pump. The chart has clearly established a new 24h high at $0.05072, but there is no base, no higher low, and no tested support beneath the current price. I want to see a healthy retracement to let the moving averages catch up and allow the market to digest this move. If buyers step in and defend the $0.048 area ideally printing a higher low.That is where I would look for a calculated long. If it just keeps running without a test, I’ll simply miss it. Missing a trade costs nothing; chasing a bad entry costs capital. Trade Plan (WAIT) · Bias: Neutral / Wait · Long Entry: $0.0475 – $0.0485 (retest of the 7/14 MA cluster) · Confirmation: 1H rejection wick or bullish engulfing candle on the retest · Stop / Invalidation: $0.0465 (break of the local structural support) · TP1: $0.0505 (recent local high) · TP2: $0.0529 (major swing high) · R:R: Approx 1:2.5 based on the retest entry The main risk here is a total failure of the rally. If price loses $0.046 without showing any signs of demand, the trend is likely reversing, and the quick momentum money has already left the building. Patience is key; wait for the structure to reset and give you a proper entry. Are you waiting for the pullback, or are you buying the breakout? #ByXIMPACT #WSOT2026 $MEGAUSDT $SPCXXUSDT
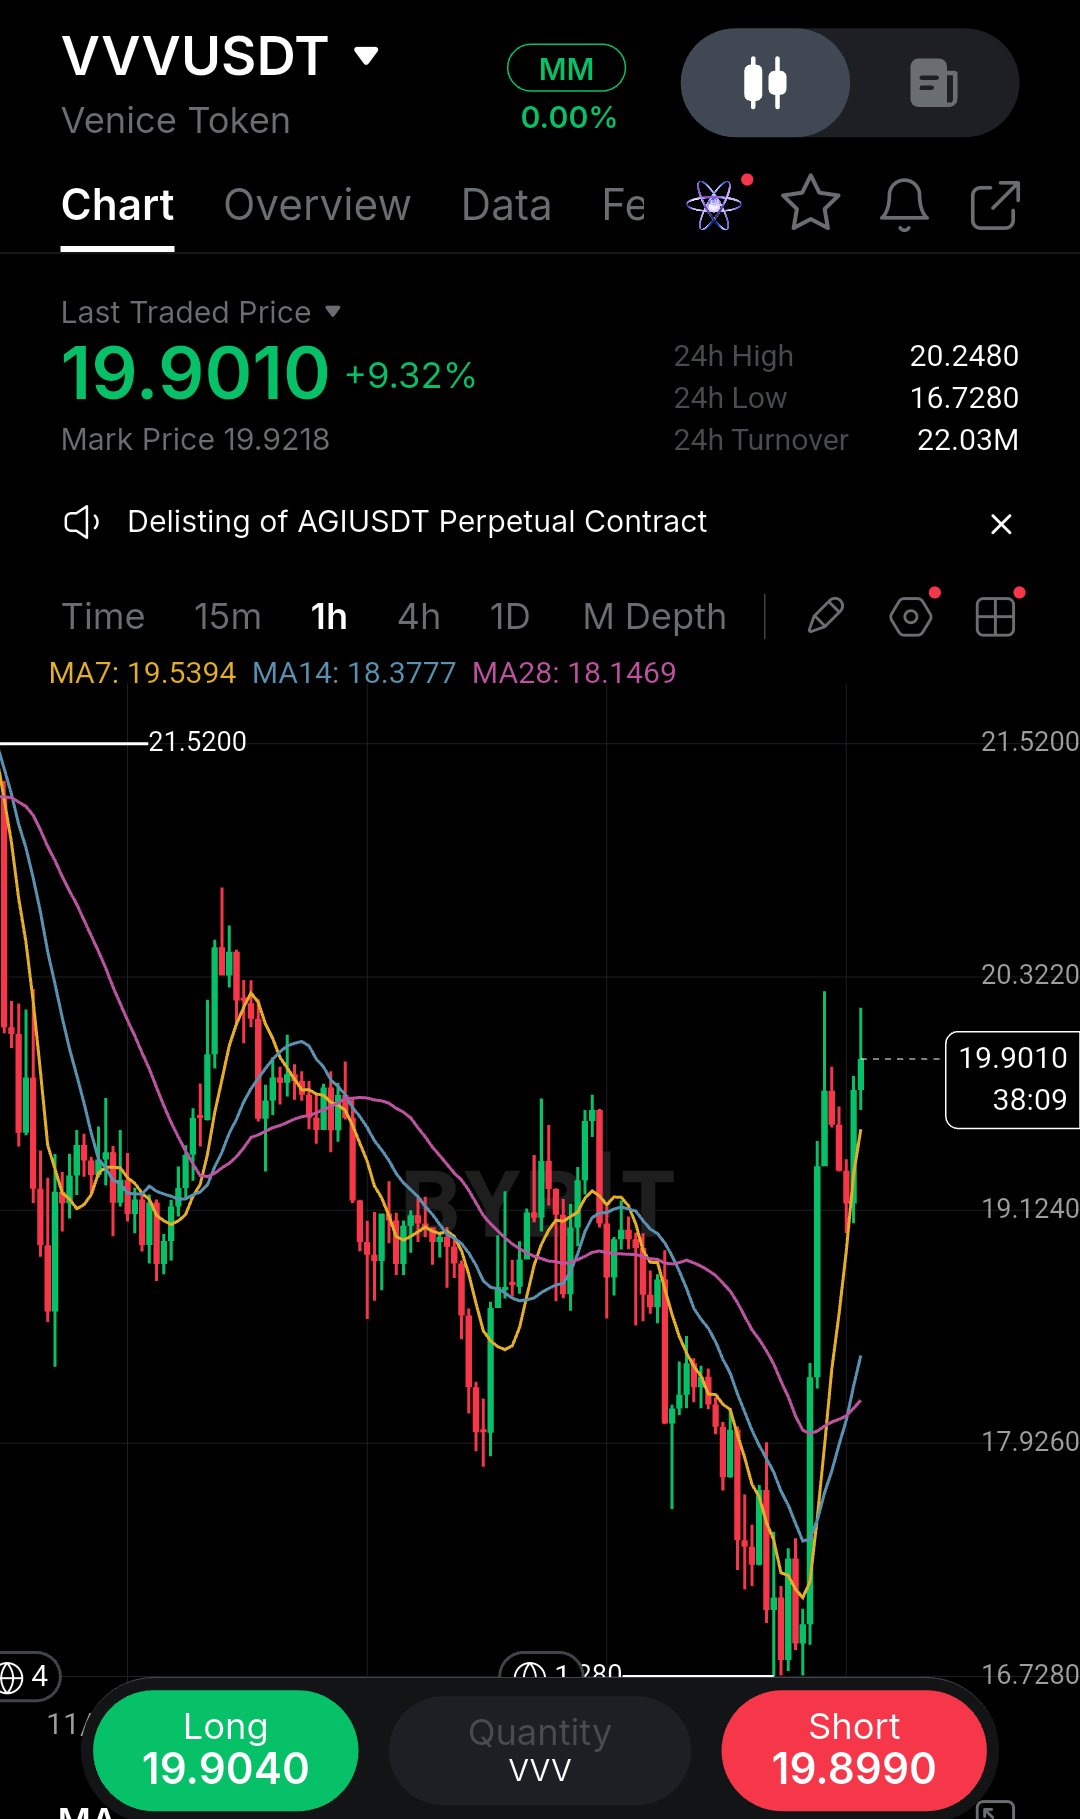
What caught my attention on this VVVUSDT 1H chart is the sheer violence of that recent bounce. After bleeding down to a local low of $16.72, price printed a massive V-shaped recovery, ripping straight back up to test the $20.20 region. It is the kind of aggressive, impulsive move that forces traders to make emotional decisions—either chasing the green candles out of FOMO or trying to short the top without confirmation. Right now, the market structure is in a heavy retracement phase following that impulse. Price is cooling off at $19.90, holding just above the 7-period moving average ($19.53) while the 14 and 28 MAs trail below at $18.37 and $18.14 respectively. The moving averages are fanning out, which is generally a bullish sign, but the price action is currently compressing. My read is that we are at a critical decision point. Chasing a long here is risky because you are buying right into the overhead resistance from the previous breakdown. The market clearly rejected the $20.20–$20.30 area on that first spike, leaving a cluster of wicks that tell me sellers are defending that zone. Conversely, shorting a market with this much raw bullish momentum is dangerous unless we see a clear structural break down. I have seen too many traders fade strong recoveries and get stopped out on the next leg up. Personally, I’d rather wait for the market to show its hand rather than guess the next move. If the bulls want to take control, they need to absorb this selling pressure and print a clean higher low. If the bears want to trap the late longs, they will defend $20.20 and drive price back down toward the $18.30 support. That is the battleground. Trade Plan (WAIT / Conditional Setup) · Bias: Neutral / Wait · Long Entry: $19.60 – $19.80 (Only on a successful retest holding above the 7-MA) · Confirmation: 1H candle close above $20.25 (clearing local resistance) · Stop / Invalidation: $19.10 (loss of short-term moving average support) · TP1: $20.50 · TP2: $21.50 (previous major swing high) · TP3: $22.50 (extension) · R:R: Approx 1:2 on the initial TP1 The biggest risk right now is a failed breakout leading to a lower high. This often happens after a massive impulse—retail buyers get trapped at the top, and the market maker sweeps the lows. If price loses the $19.10 level, the immediate momentum shifts bearish, and I would expect a retest of the $18.30 support zone. I’d stay patient until we see a decisive close out of this current consolidation. Are you guys anticipating a break of $20, or are you expecting this bounce to get sold back down? #ByXIMPACT #WSOT2026 $VVVUSDT $SPCXXUSDT
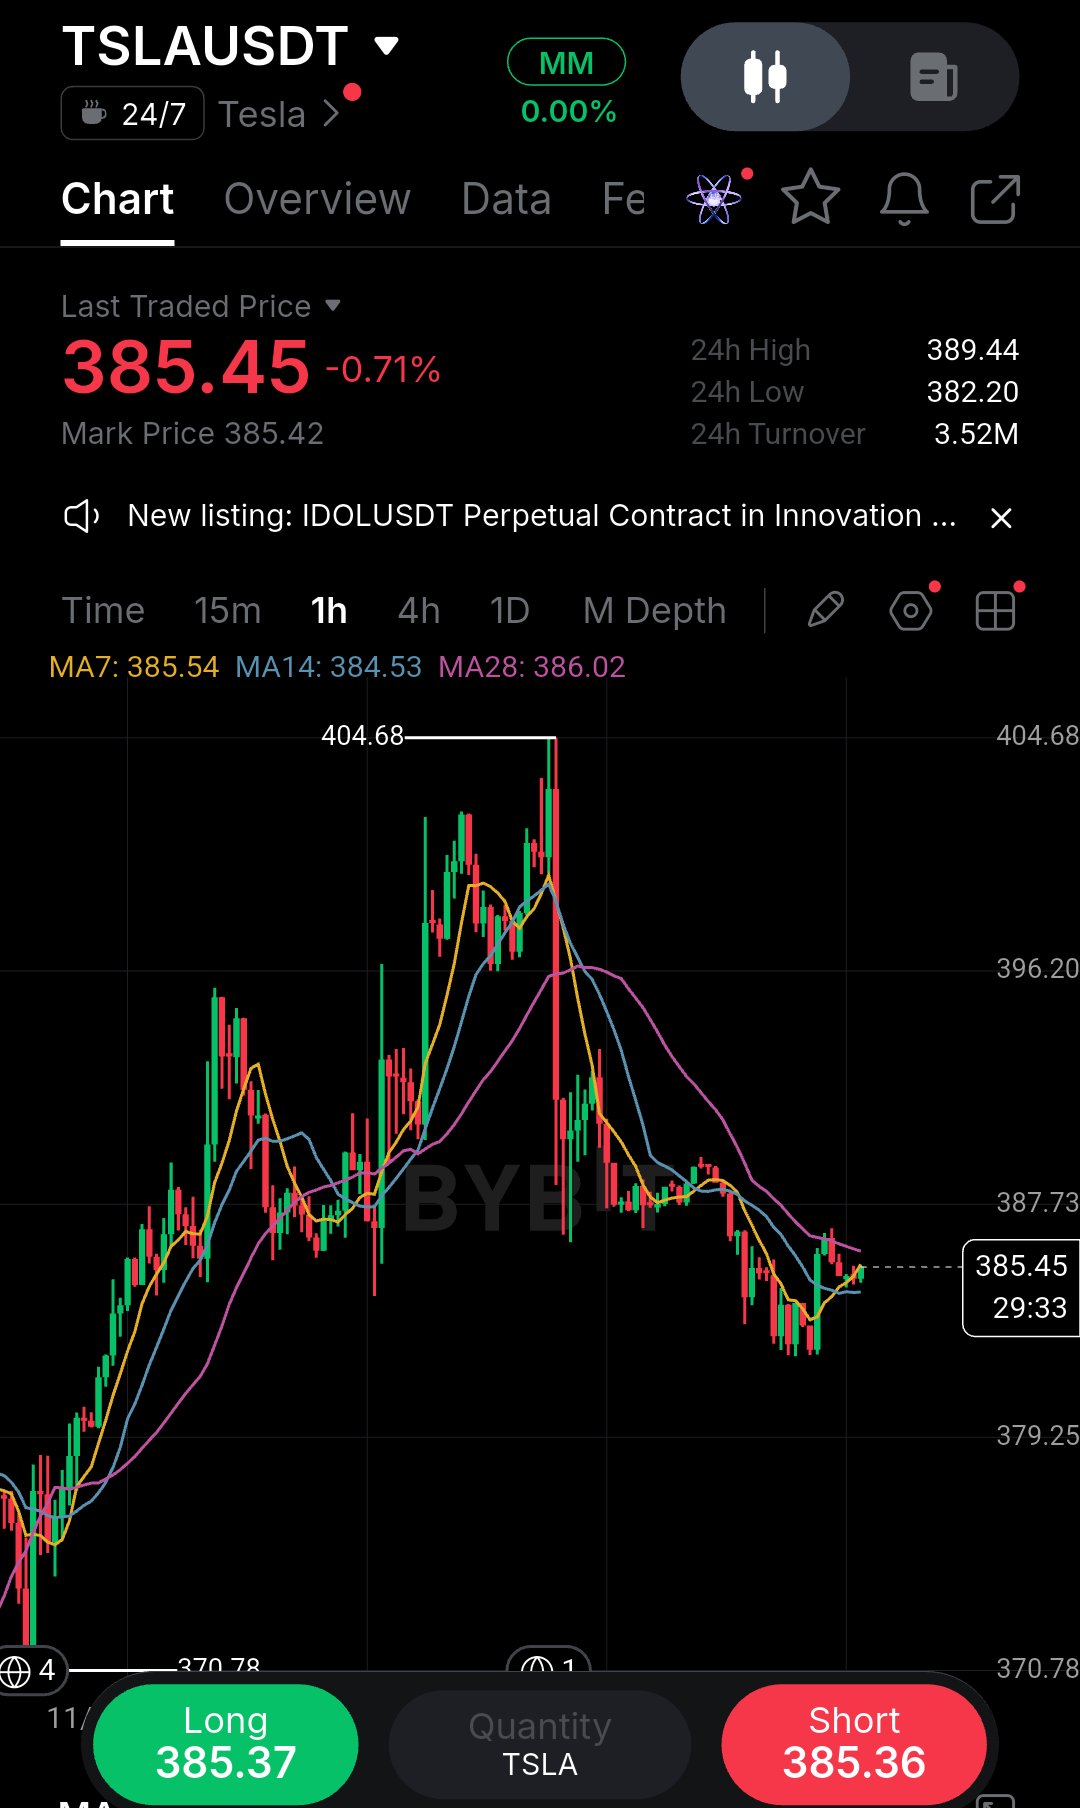
トレンドの本格的な転換が確認される前に安定しているように見えるチャートには、注意深くなることを学びました。このTSLAUSDTの1時間足チャートで私が立ち止まった理由は、404.68のピークからの急落後、価格が移動平均線とどのように相互作用しているかという点です。現在、ローカル安値からの小幅な反発が見られますが、MA7とMA14は依然としてMA28の下に位置しており、より広い市場構造は依然として弱気です。最初の売り抜けによる勢いは強く、移動平均線が抵抗となっている場合、このような反発は追随する動きを見せるのに苦労することがよくあります。 無視したくないのは、現在の385.45付近の水準です。左側を見ると、この領域は大きな崩壊の前に小さなピボットとして機能していたため、現在は動的なレジスタンスとして機能している可能性が高いです。私はまだこれを反転と呼ぶには時期尚早だと思います。ここでの最大のリスクは、頭上の供給(売り圧力)に向けてデッドキャット・バウンス(死猫反発)を買ってしまうことです。私は以前、まさにその間違いを犯しました。緑のローソク足に飛びついて早まった結果、すぐに移動平均線で価格が拒絶されるのを見ることになりました。その経験から、私はロングポジションを取る前に、モメンタムの明確な変化と構造的なブレイクの確認を待つことを好みます。 さらに、24時間の売買代金は3.52Mであり、このトレンドを反転させるために積極的に買い向かう大口の買い手がまだ参入していないことを示しています。真の反転には通常、出来高と主要水準の決定的な奪還が必要です。 私の計画は、価格が386.50を確信を持って奪還するか、ここからきれいに拒絶されるまで辛抱強く待つことです。 ロングエントリー: 386.60 – 386.80(1時間足の終値が上回った場合) 損切り (SL): 384.80 利確 1 (TP1): 389.44 利確 2 (TP2): 396.20 無効条件: 直近のローカル安値384.50を割り込んだ場合。 ここから拒絶された場合は、ノーポジションを維持し、不安定な相場で無理にトレードすることは避けます。皆さんはリクレイム(奪還)を待っていますか、それともこの反発を売っていますか? #ByXIMPACT #WSOT2026 $TSLAXUSDT $SPCXXUSDT
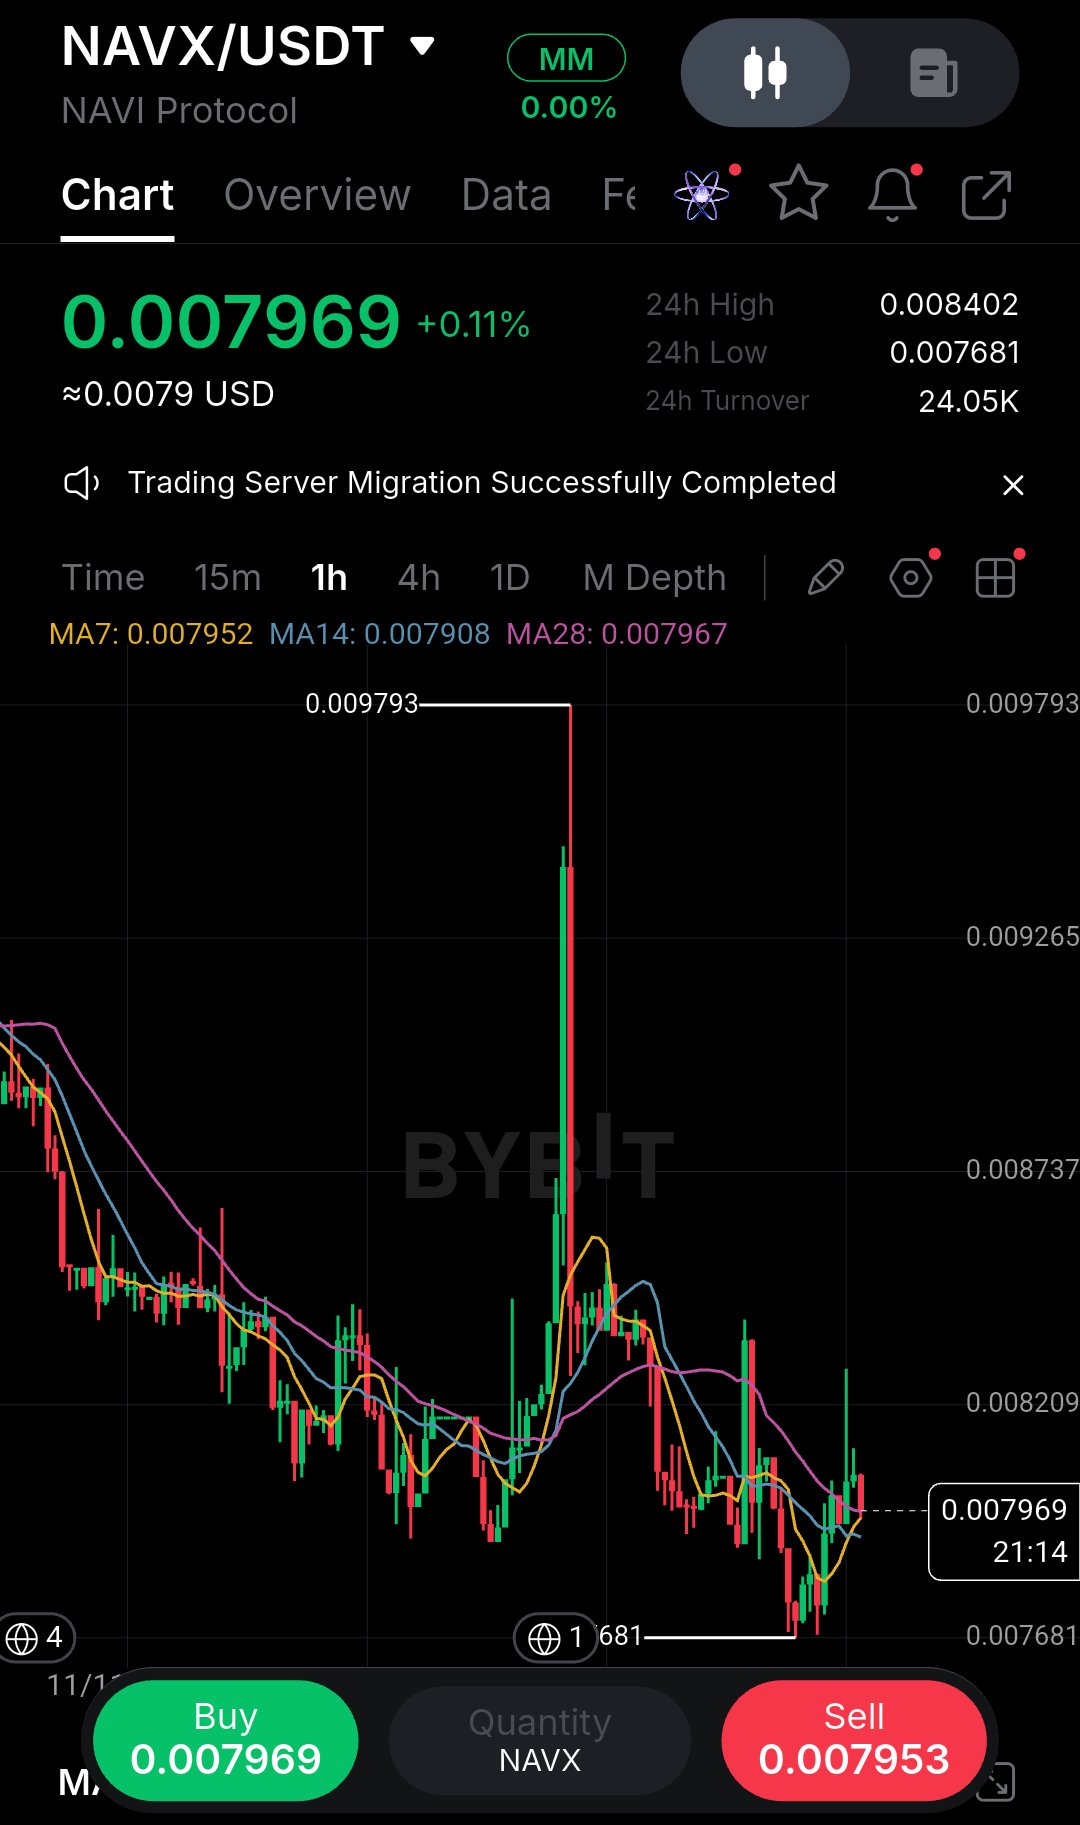
チャートが底を打ったように見えて、実はまだ確定していないという状況には、痛い目を見て慎重になりました。早い段階でエントリーしてしまい、反発を狙って買った直後に即座に拒否されるという罠には何度もハマっています。今回、NAVXの1時間足チャートで立ち止まってよく見てみようと思ったのは、0.009793まで伸びたあの巨大な赤いヒゲです。あれは純粋な現物買いによる本物のパンプではありません。ショートの溜まりを狩るための、急激な流動性確保の動きで、その後すぐに価格が激しく拒絶されて戻されたように見えます。 あの鋭いフラッシュ以降、0.007681の安値までじりじりと値を下げてきました。しかし、現在のプライスアクションが面白くなってきています。現在、7日と14日の移動平均線を回復し、高値の切り上げが始まっています。局所的な構造は確実に変化しようとしていますが、コンテキストを認識しなければなりません。出来高はわずか24Kと非常に薄いです。これだけ取引高が少ないと、わずかな資金でもどちらの方向にも価格を動かしやすく、フェイクアウトが起きやすい環境と言えます。 流動性が低いため、現在の陽線を追うことはしません。リスクを適切に管理するために、明確な構造の再テストを待つ方が賢明だと考えます。 方向:ロング(確認後) エントリー:0.00785 – 0.00795 確認:1時間足で0.00805を上回って引けること、または0.00785の再テストが成功し、しっかりとサポートとして機能すること。 損切り (SL):0.00765(直近の安値をわずかに下回る水準) 利確 (TP1):0.00820 利確 (TP2):0.00840 利確 (TP3):0.00875 無効化:0.00768を下回った場合。 最大のリスクは、またしてもフェイクアウトに巻き込まれることです。もし0.00785のレベルを維持できず、移動平均線を再び割り込んでしまったら、私のシナリオは終了であり、撤退します。無理にポジションを持つくらいなら、機会を逃す方がマシです。皆さんは確実なブレイクアウトを待っていますか、それともより低いエントリーポイントを探していますか? #ByXIMPACT #WSOT2026 $NAVXUSDT $AAPLXUSDT
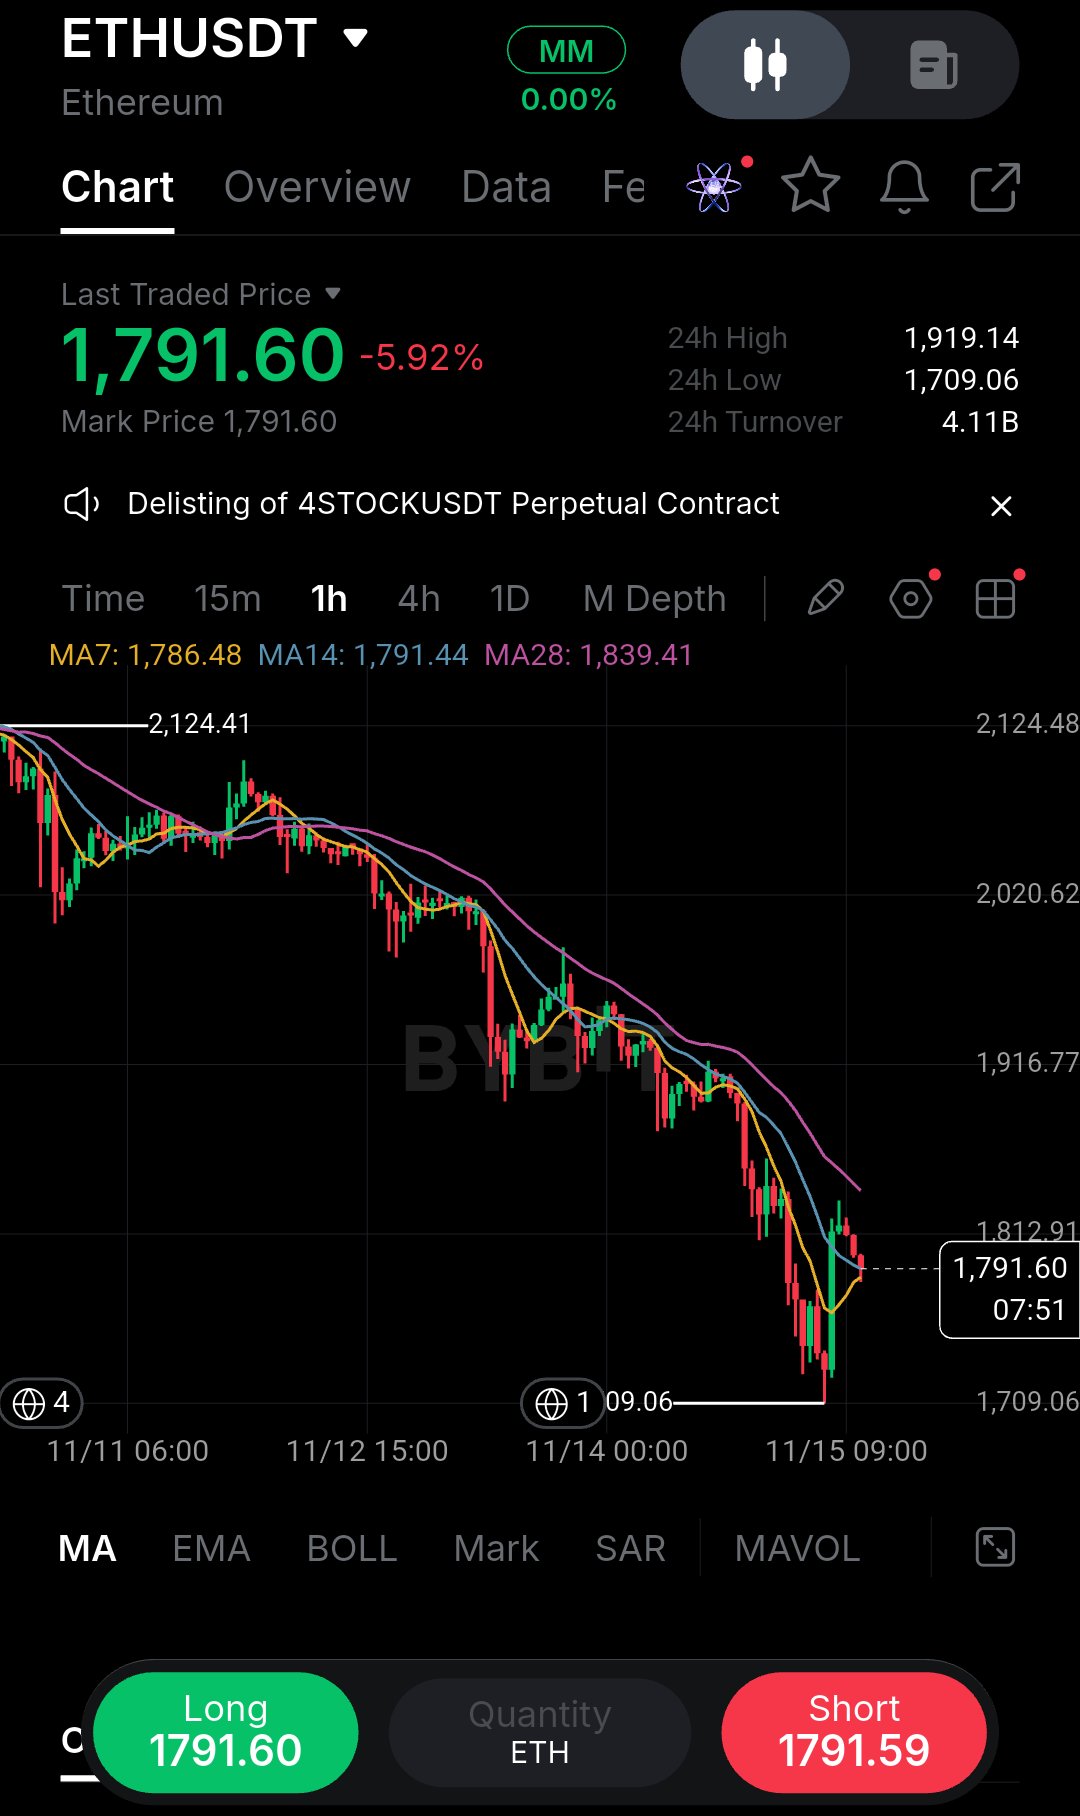
I’ve learned to be skeptical of sharp bounces inside a heavy downtrend, so this ETH chart has my full attention. After bleeding down to a low of $1,709, price printed a strong relief rally and is now pressing $1,791.60. What stands out is that we are hitting dynamic resistance.The MA14 sits right at $1,791.44. That’s not a coincidence; it’s the first real test for the bulls. The trend is still heavily bearish, given the massive drop from $2,124, but the short-term momentum has shifted. Bulls are trying to reclaim ground, but right here, the market is at a decision point. I wouldn’t rush to long this immediate bounce, nor would I blindly short into this localized strength. The candles are green, the volume is picking up, and that’s exactly when FOMO kicks in. But a bounce is not a reversal until the structure proves it. I’m waiting for a clean 1H close above $1,800 to confirm a structural shift, or a clear rejection here to short the next leg down. The $1,800 level is psychological, and it’s just above the MA14 and MA7. If price closes above it, the short-term trend flips, and we can target the MA28 at $1,839. If it rejects, the downtrend resumes, and we look for a lower high to short. If we get a strong close above the MA cluster: Long Entry: $1,805 SL: $1,750 (below the local support) TP1: $1,840 (MA28 resistance) TP2: $1,880 The risk: getting caught buying a dead-cat bounce. I’ve been burned chasing green candles in a downtrend before, and it taught me to wait for confirmation. A close above $1,800 is the signal; until then, this is just noise. Don’t enter until the level proves itself, and don’t move your stop if price wicks against you. If the setup invalidates, accept it and move on. Are you buying this dip or waiting for a lower high to short? #ByXIMPACT #WSOT2026 $ETHUSDT $BTCUSDT
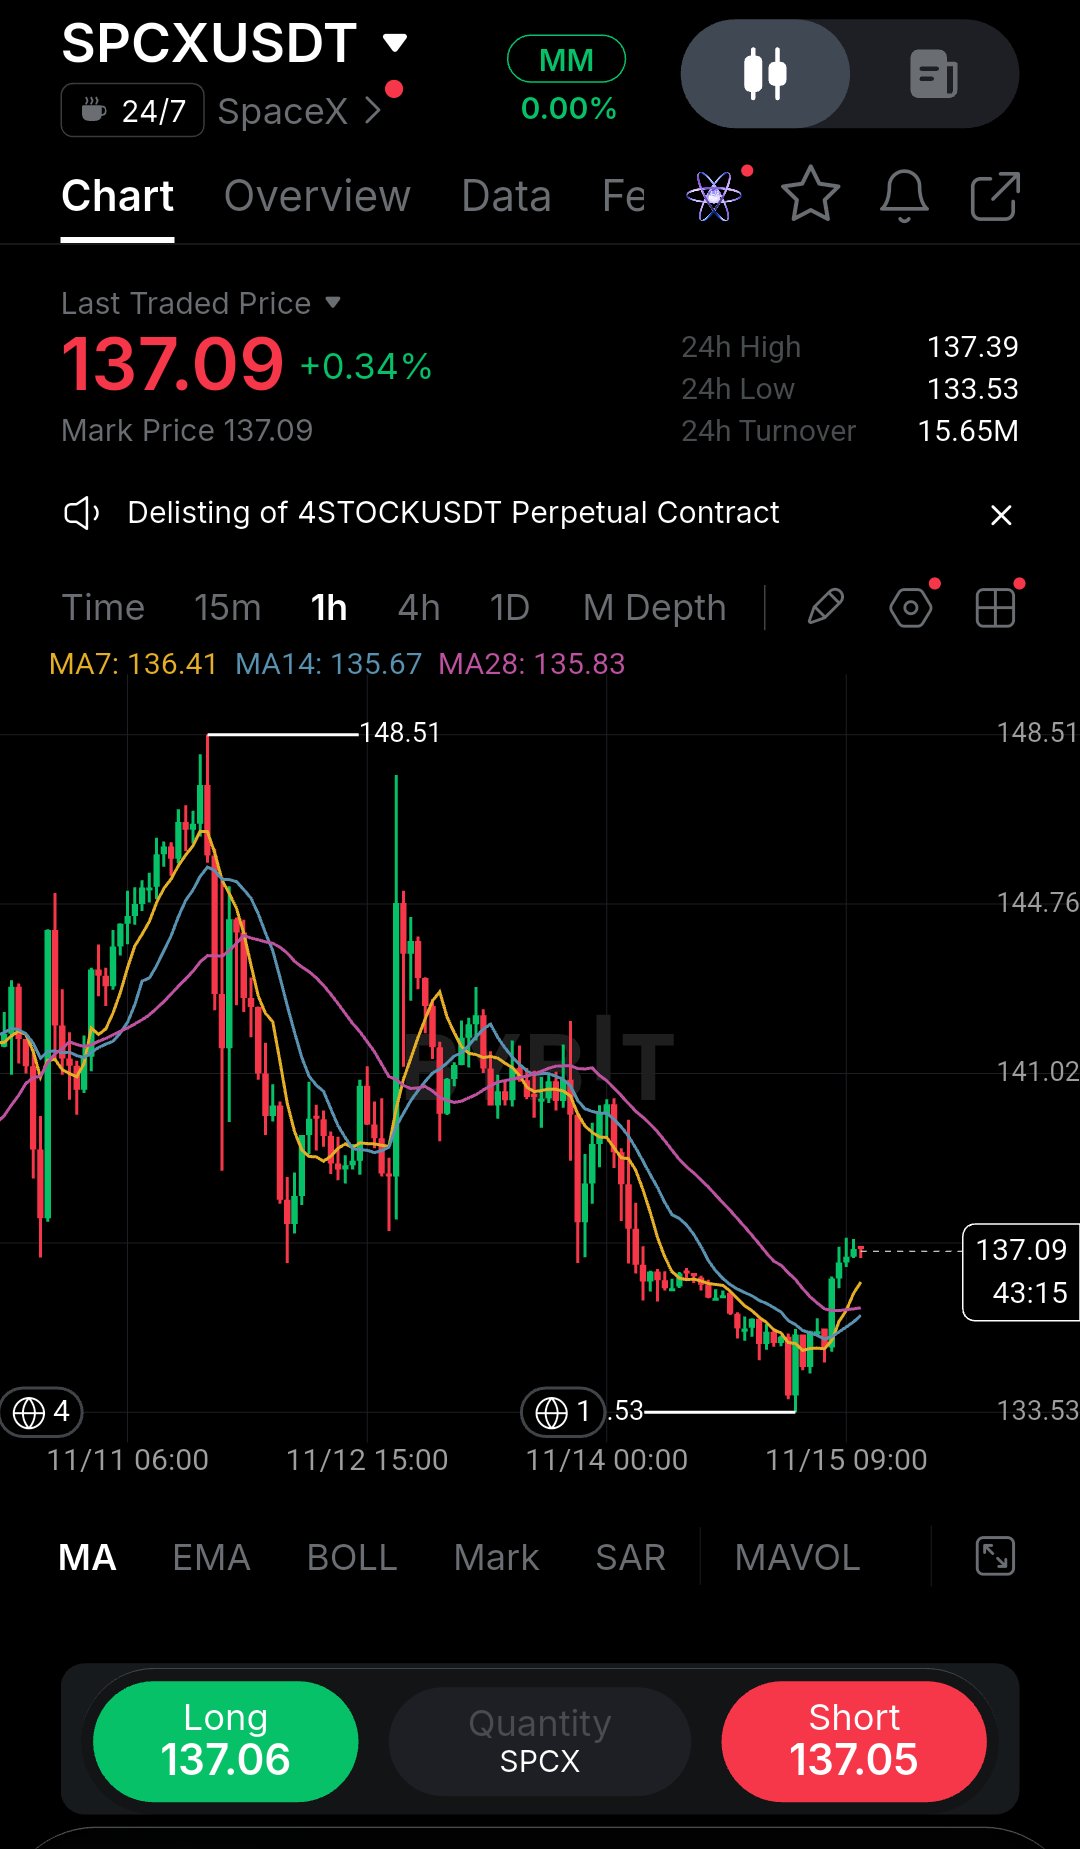
いつも反発の初動に飛びついて痛い目を見ていたので、今回は少し慎重にSpaceXのチャートを観察している。価格は133.53まで急落したが、そのまま続落することなく急激なリクレイム(価格回復)を見せた。現在は短期移動平均線であるMA7(136.41)、MA14(135.67)、MA28(135.83)を上回って推移し、137.09を試す展開だ。この安値での強気な防衛こそが、ここでの重要なポイントだ。市場構造は、売り圧力から急激な買い圧力へとシフトした。これは、衝動的なトレーダーを両サイドで罠にかける典型的な転換点でもある。チャートが実際に何を物語っているのか、細かく見ていこう。 この構造は、短期的なエグザースチョン(消耗)による反発に見える。売り手は133.53の底値を完全に突き抜けることができず、その後の動きで後乗りのショート勢を巻き込むリクイディティ・スイープが発生した可能性がある。価格が単に安定しただけでなく、一気のインパルス的な足で3本の移動平均線をすべて上抜けたことに注目してほしい。これは、直近の下落モメンタムが停滞したサインだ。ただし、依然として148.51のスウィングハイを大きく下回っており、1時間足のトレンド全体はダメージを受けた状態だ。141.02の水準が重要なテストとなる。これは下落時にはサポートとして機能し、現在は上値の最初の主要な供給ゾーンとなっている。買い手がこの回復したゾーンを維持できれば、次の論理的なテストは141.02エリア、その次は144.76となるだろう。しかし、これが証明されるまでは、あくまでカウンタートレンド(逆張り)の動きであることを忘れてはいけない。 私の戦略は以下の通り: エントリー:1時間足で137.10を超えて確定するのを待ち、リクレイムを確認してヒゲでの騙しを避ける。 損切り(SL):135.50(MA群と直近のコンソリデーションベースの下) 利確1(TP1):141.02 利確2(TP2):144.76 無効化条件:1時間足が135.50を下回って確定した時点で反発シナリオは終了とし、売り手が主導権を奪い返したと判断する。 ここでの教訓:激しいリリーフラリー(戻り相場)を完全なトレンド転換と混同しないこと。以前は急落後の最初の陽線で飛びついて、移動平均線で価格がロールオーバーするのを見て何度も火傷をしてきた。だからこそ、最初の急騰を買うのではなく、137.10での確定を待っているんだ。安値が133.53と明確に定義されているため、反発が実現すればリスク・リワード比は有利になる。だが、もし維持できなければすぐに撤退だ。ストップを動かしたり、祈ったりはしない。 ここでのトレーディング心理は非常に重要だ。あのような下落の後では、陽線が続くとFOMO(乗り遅れる恐怖)が頭をもたげる。だが、プロのやり方は、まず市場に証明させることだ。137.10を超える確定は、買い手が単なるショートカバーだけでなく、高値でも買う意思があることを示している。この確認が取れればトレードは有効だ。取れなければ、何もしない。その規律こそが、良いセットアップと無理なトレードを分けるんだ。 皆はブレイクアウトの確認を待つのか、それとも141でのレジスタンスでフェード(逆張り)を狙うのか?皆がこの構造をどう読んでいるのか、ぜひ聞かせてほしい。 #ByXIMPACT #WSOT2026 $SPCXXUSDT $AAPLXUSDT
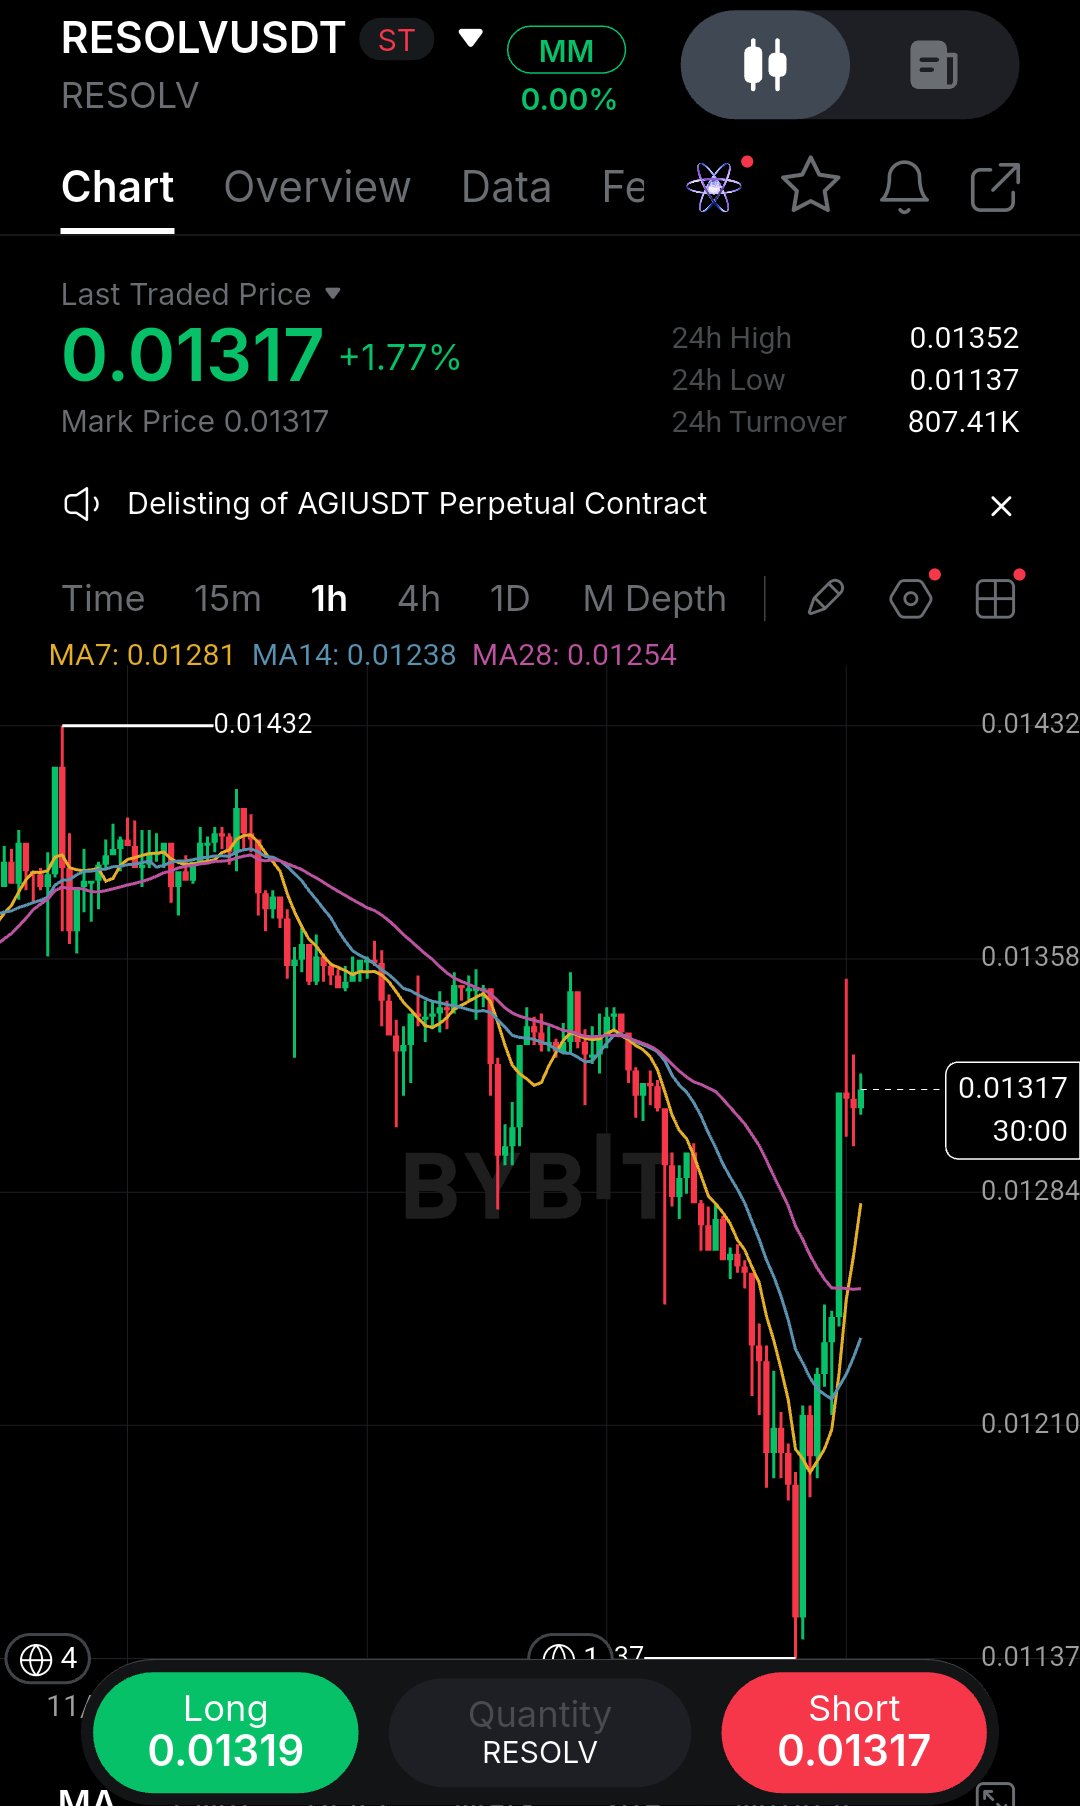
I’ve seen too many traders get chopped up trying to catch a falling knife, which is why I always wait for a clear structural break before acting. What stands out on this RESOLVUSDT 1h chart is the brutal sell-off down to $0.01137, followed by a sudden, aggressive V-shaped bounce. It looks tempting, but recovering from that kind of vertical drop is rarely a straight line. My read is that the market structure is still primarily bearish, and this bounce is likely just a relief rally. Price is currently hovering around $0.01317, pushing directly into the cluster of moving averages (MA7, MA14, MA28) which are acting as dynamic resistance. I’m treating this $0.01330–$0.01350 zone as a potential lower high. Rather than buying this green momentum, I’d prefer to wait for exhaustion and rejection here to target the downside. Execution Plan: Bias: SHORT Entry: $0.01320 – $0.01350 Confirmation: Bearish rejection wick or 15m close back below $0.01300 Stop / Invalidation: $0.01370 TP1: $0.01250 TP2: $0.01210 R:R: Approx 1:2 The biggest risk is a sudden breakout above the moving averages, which would trap shorters and force a squeeze. If price closes above $0.01370, I’m out and reassessing. Don't fade the bounce until it actually stalls and prints a clear lower high. Patience here is crucial because the volatility is extreme. Are you waiting for the rejection, or trying to catch this falling knife? #ByXIMPACT #WSOT2026 $RESOLVUSDT $AAPLXUSDT
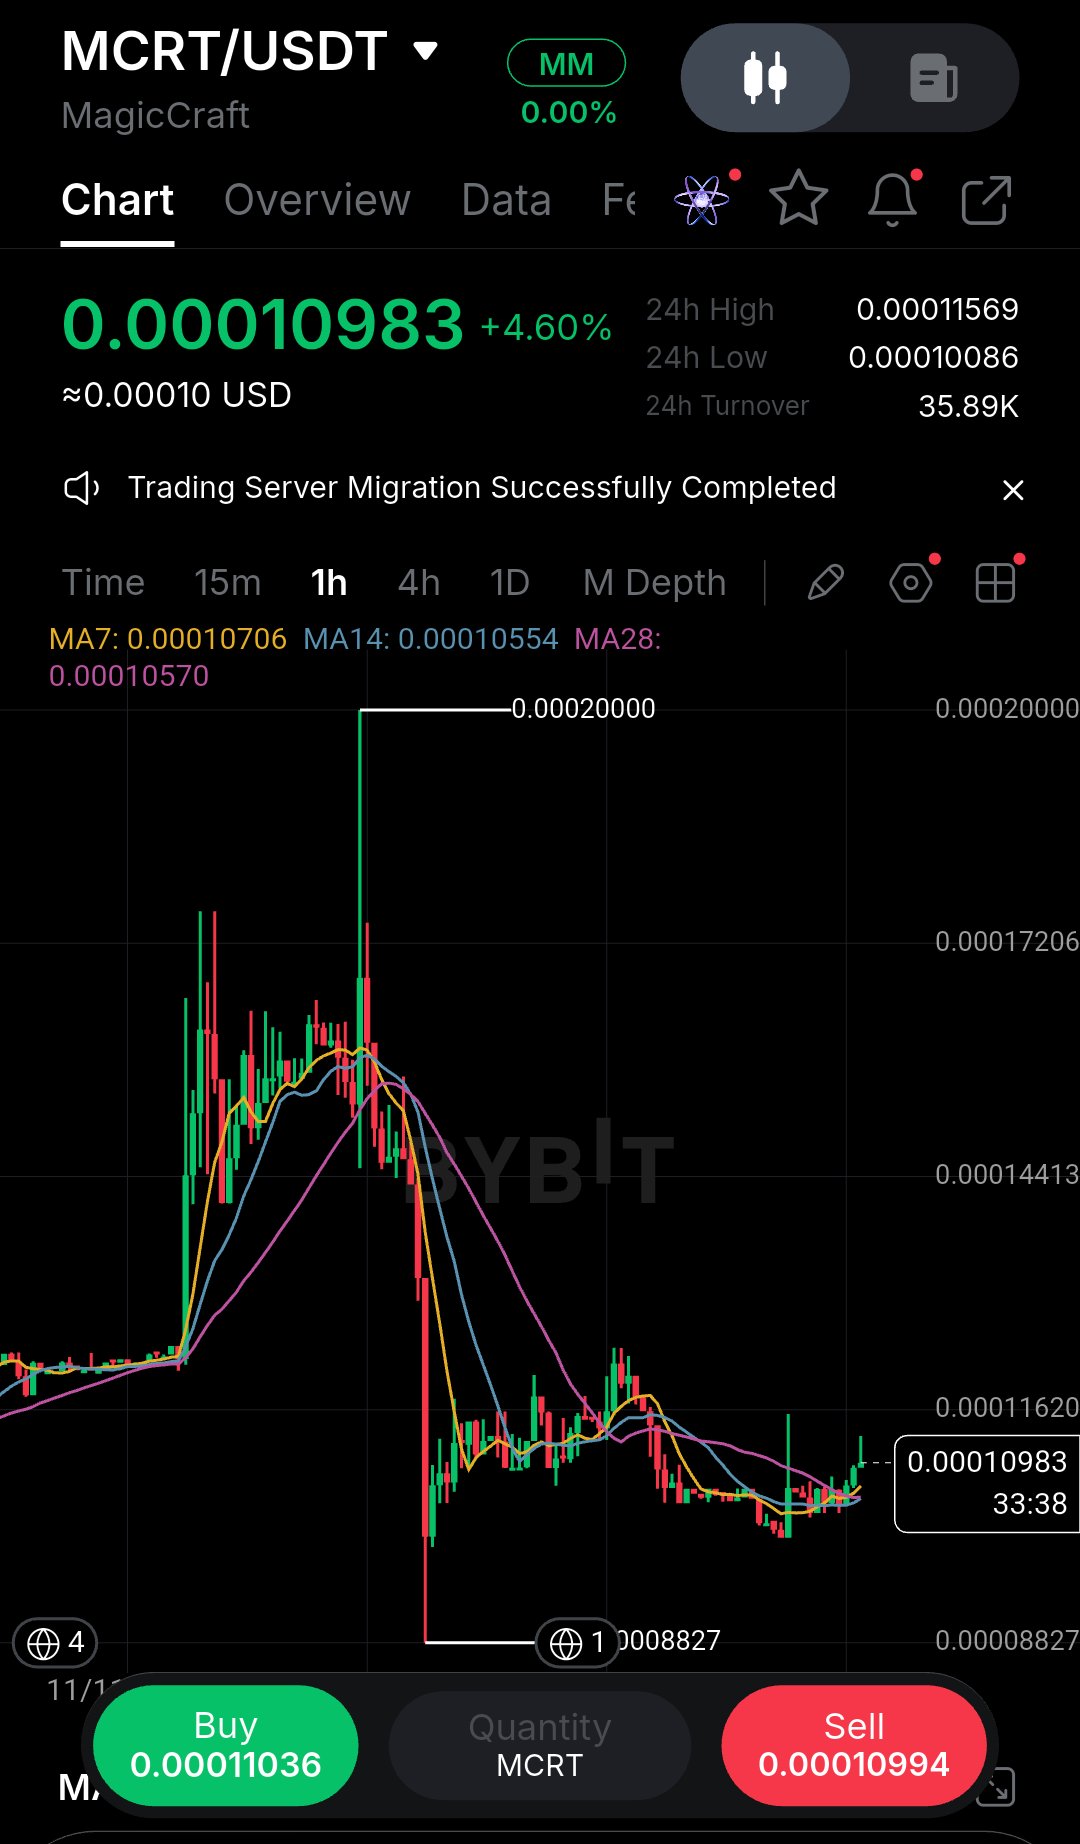
過去に「落ちてくるナイフ」を掴もうとして大火傷をした経験があるので、チャートが安値を更新しなくなったときは注意深く観察するようにしています。今回のMCRTの1時間足チャートで目に留まったのは、0.00008827まで急落した激しい下げの後に見られる、不安定で緩やかな停滞です。あの巨大な陰線で多くの後追い買い勢が一掃されましたが、現在は0.00010983で底を固めようとしています。 市場構造は大きく傷ついていますが、価格は現在、底値を探っている状況です。0.00010554付近で移動平均線が横ばいになっており、強い売り圧力がようやく落ち着いてきたことを示唆しています。私はこれをトレンド継続ではなく、短期的な反転の可能性があると見ています。サポートラインでショートを狙うのではなく、買い手が参入してくるようなら、自律反発を狙いたいところです。鍵となるのは0.00011620付近のローカルレジスタンスです。ここを明確にブレイクして上を維持できれば、市場構造の転換が確認され、強気派に少し余裕が生まれるでしょう。 実行プラン: バイアス: ロング(スキャルピング) エントリー: 0.00010800 – 0.00010980 確認: 1時間足でMA14の上での強気引け 損切り (SL): 0.00010086(ローカルサポートの下) 利益確定1 (TP1): 0.00011620 利益確定2 (TP2): 0.00014413 無効条件: 直近の安値スウィープである0.00008827を下回った場合。 最大のリスクは、これが単なるデッドキャットバウンスに過ぎず、売り手がここを利用してショートを積み増すことです。陽線に飛びつかず、明確な構造の回復を待ちましょう。価格がMA14を上抜けるのに苦戦し、再び高値を切り下げ始めたら撤退します。ボラティリティが高く流動性も薄いため、ポジションサイジングは慎重に行うべきです。 皆さんは、確実な安値切り上げを待っていますか?それとも現在の勢いに逆らってエントリーしますか? #ByXIMPACT #WSOT2026 $MCRTUSDT $AAPLXUSDT
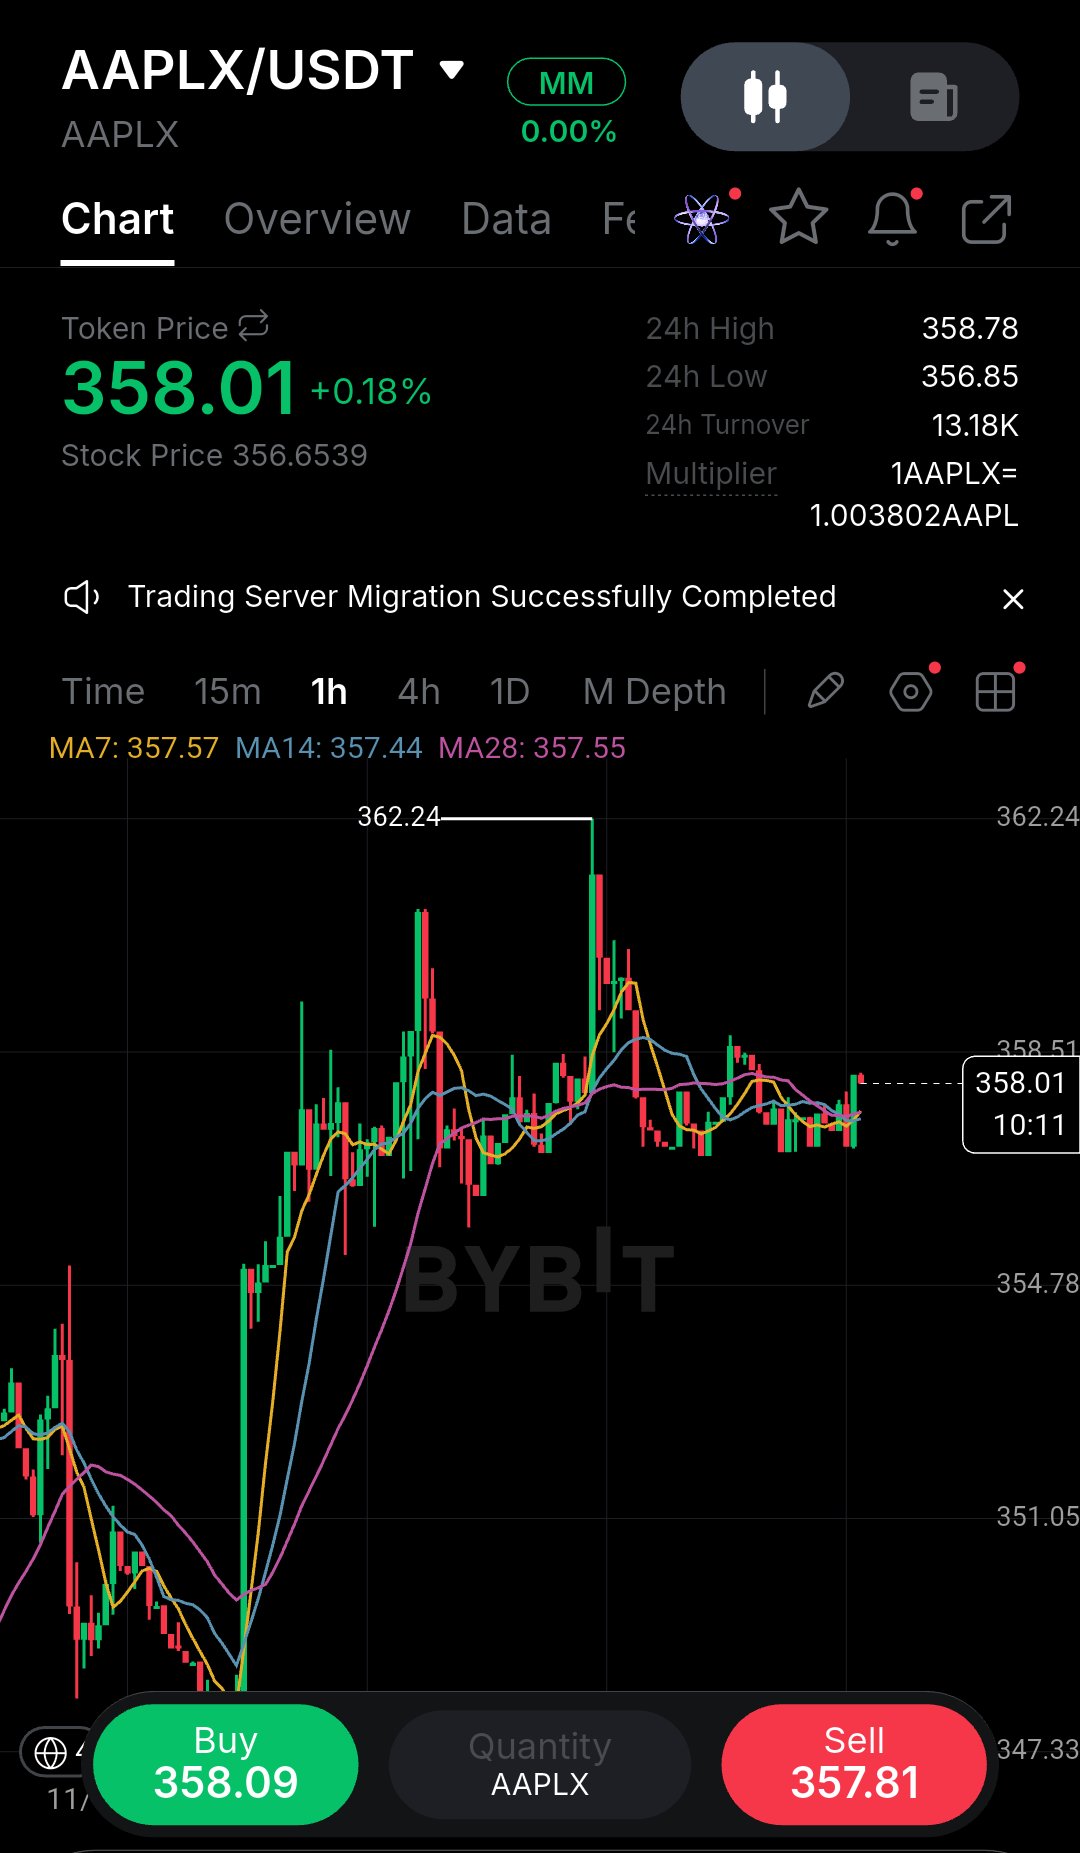
価格が狭い範囲で停滞しているときは慎重になることを学びました。なぜなら、せっかちなトレーダーがそこで翻弄されやすいからです。このAAPLX 1時間足チャートで目を引くのは、362.24ドルの高値から強く拒絶された後、357ドル~358ドルのゾーンまでじりじりと下げている動きです。 市場構造は重いですね。価格は現在、357.50ドル付近で絡み合っている移動平均線(MA7、MA14、MA28)に完全に抑え込まれています。このタイトな収束はボラティリティの拡大が近いことを示唆していますが、モメンタムは下落優勢です。362ドルでの拒絶によって、多くの買い手が含み損を抱えてトラップされています。直近の戻り高値である358.50ドルが目先のレジスタンスとして機能するか注視しています。 現時点で飛び乗るよりも、ブレイクダウン後のリテストを待つ方が賢明でしょう。356.80ドルを割り込み、その水準がレジスタンスとして機能するなら、ショートでのスキャルピングを狙います。 トレードプラン: バイアス: ショート エントリー: 357.40ドル~358.00ドル(戻りの失敗を確認後) 確認条件: 15分足の終値が356.80ドルを割り込み、その後の反発が弱いこと 損切り (SL): 358.80ドル 利確 1 (TP1): 355.50ドル 利確 2 (TP2): 354.00ドル 無効条件: 1時間足の終値が358.80ドルを超えて確定 ここでのリスクは、出来高が停滞して価格がレンジに留まることで翻弄されることです。ブレイクダウンを追わず、売り手の支配が続いていることを証明するリテストを待ちましょう。 皆さんはレンジブレイクを待っていますか?それとも、この収束を逆張りしますか? #ByXIMPACT #WSOT2026 $AAPLXUSDT $SOLUSDT
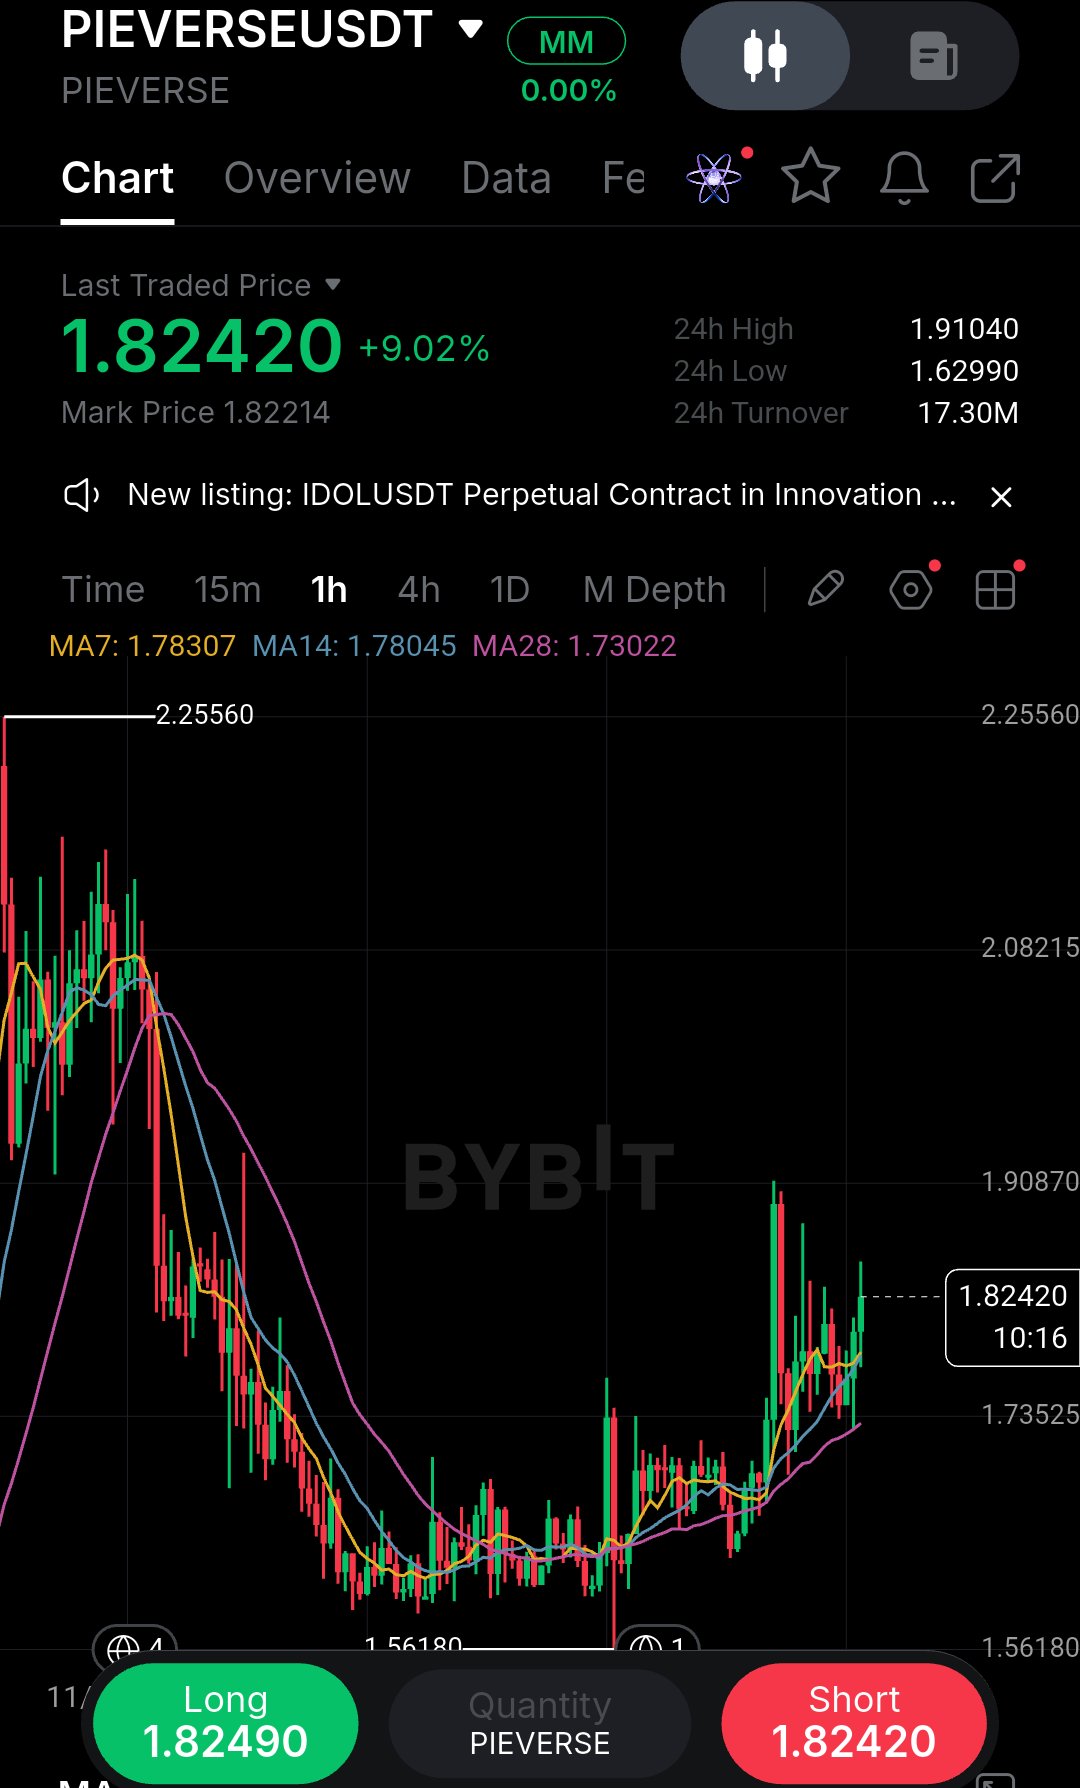
I've chased enough of these post-reversal bounces to know that entering right after a massive green candle usually ends in a quick drawdown. It is easy to get caught up in the excitement of a 9% move, but what stands out on this PIEVERSEUSDT 1h chart isn't just the size of the bounce, but the aggressive defense of the $1.56 low. The market completely rejected lower prices and has since reclaimed all major moving averages, which is a very encouraging sign for the bulls. The broader structure has shifted to the upside, but I have to be realistic about the immediate price action. Price is currently stalling right below the $1.91 local resistance level. My read is that chasing here at $1.82 is risky because buyers are likely to face a natural pullback after such a sharp run-up. Retail traders often get trapped buying the top of these initial impulses. I’d much rather wait for the market to prove the new support holds before risking my capital. The $1.78 zone, where the MA7 and MA14 sit, is the key battleground. This area is perfect for a "break and retest" setup. If price pulls back to this zone and prints a clear bullish rejection candle like a hammer or a strong green engulfing candle.That’s the confirmation I need to enter. It gives us a much tighter stop loss and a better risk-to-reward ratio. · Entry: $1.78 – $1.80 · SL: $1.73 (Below the MA28) · TP1: $1.86 · TP2: $1.91 · Invalidation: A 1h close below $1.73. The main risk is a fake breakout where price wicks up to $1.85 before dumping hard. Wait for the retest rather than FOMOing into the current candle. Are you waiting for that $1.78 pullback, or looking for a direct breakout above $1.91? #ByXIMPACT #WSOT2026 $PIEVERSEUSDT $BRUSDT