Ayzal Noor
1533いいね0シェア21ファン2フォロー
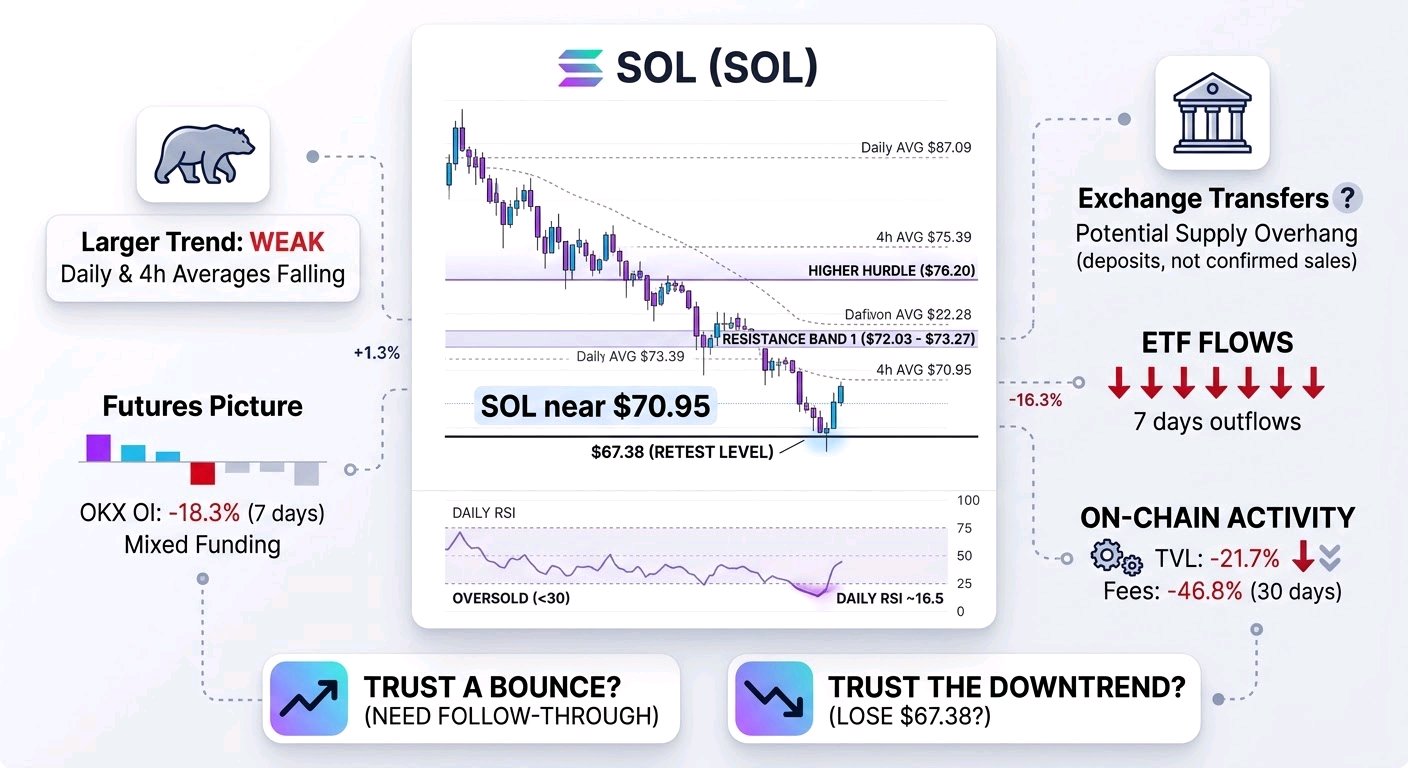
$SOLUSDT は7日間で20.3%下落した後、70.95ドル付近で推移しています。6月下旬以来の安値となる67.38ドルにタッチした後、反発しました。この安値は、目先における最も明確な試金石です。ここを維持できれば短期的な底固めが可能ですが、割り込めば、反発は一連の安値更新を止めるには不十分だったことになります。現時点では、どちらの結果も確定していません。 全体的なトレンドは依然として明らかに弱含みです。SOLは4時間足の下降トレンドラインにあたる75.39ドルと80.85ドル、および日足の移動平均線である87.09ドルと95.48ドルを下回っています。日足のRSIは約16.5で、通常では考えられないほど売られすぎの水準です。これは自律反発の可能性を示唆しますが、売りの勢いが収まったと判断する材料にはなりません。1時間足チャートを見ると、SOLは直近の高値によって形成された最初のレジスタンスゾーンである72.03ドル~73.27ドルを維持するのに苦戦しています。このゾーンを突破し、その後のリテストで底堅さを示すことの方が、単なる一時的な急騰よりも説得力があります。76.20ドルはより高いハードルであり、ここを奪還できれば短期的な構造は改善しますが、広範な下降トレンドを打ち消すには至りません。 私が反発を信頼するための条件は何でしょうか?それは「売られすぎ」という指標だけでなく、その後の追随する動きです。直近のローソク足は67.38ドルからの反発を示していますが、価格は直近のレジスタンスを上回る形を確立できていません。ここで利用可能なデータには、信頼できる15分足チャート、MACD、ローソク足ごとの出来高、板情報(オーダーブック)、あるいは清算ヒートマップが含まれていません。そのため、反発の背景に強力な現物買いがあったのか、正確な清算クラスターはどこか、あるいは特定のレベルが強制的な買いや売りを誘発するかどうかを検証することはできません。 先物市場の状況はまちまちです。主要取引所全体で資金調達率(ファンディングレート)はわずかにマイナスであり、ショート勢がロング勢に支払っている状況です。OKXの建玉(OI)は7日間で18.3%減少しています。これは市場からレバレッジがある程度解消されたことを示唆しており、価格が上昇すればショートカバーの余地があることを意味します。しかし、ポジションの偏りは一方的ではありません。OKXの口座はロング寄りですが、トップトレーダーのポジションはショート寄りです。建玉の減少は、必ずしも蓄積や差し迫ったスクイーズ(踏み上げ)を意味するわけではなく、レバレッジ解消を反映している可能性があります。現物取引は活発で、63の取引所で24時間に約54.5億ドルが取引されていますが、合計額だけでは、買い手が供給を吸収したのか、売り手が取引を支配したのかを判断することはできません。 報告された取引所への送金には注意が必要ですが、劇的な結論を下すべきではありません。ニュース報道ではForward Industriesに関連する動きを含め、SOLの大量入金が報じられていますが、同社は報告された送金の一つについて所有権の帰属を否定しています。オンチェーン上の動きは事実かもしれませんが、入金が必ずしも売却を証明するわけではありません。そのため、これは「確認された売り」ではなく、「潜在的な供給過剰」と見るべきです。より広範な市場もプレッシャーにさらされており、暗号資産市場の時価総額は24時間で5.2%減少し、恐怖指数は「10」と極端な水準にあります。SOLの弱さは主に独自の供給や活動によるものなのか、それとも市場全体の「リスクオフ」の動きによって増幅されているのか?その両方が当てはまる可能性があります。 長期的なポジティブ材料は存在しますが、それらは短期的な取引の結論を出すには至りません。DTCCのトークン化計画にはSolanaが含まれており、ネットワークでは「Breakpoint」カンファレンスが開催されています。これらの進展は長期的には重要かもしれませんが、今のところ価格の反転にはつながっていません。一方で、より直近の数値は軟調です。ETFのフローは7営業日連続の流出となっており、5日間で3,200万ドル、20日間で1億2,000万ドルの流出です。30日間で見ると、預かり資産(TVL)は21.7%減、ステーブルコインの供給量は7.1%減、手数料収入は46.8%減となっています。これらはフローや活動が弱まっていることを示す確実な兆候ですが、次の数セッションを予測できると決めつけることはできません。 私の見解は意図的に条件付きです。67.38ドルを上回っている限り、特に72.03ドル~73.27ドルの水準を参加者の支持を得て奪還できれば、自律反発は依然として考えられます。このスイング安値を割り込めば、弱気な見方が重みを増すでしょう。状況を好転させるものは何でしょうか?現物需要がリテストで底堅さを維持すること、価格上昇に伴って建玉が積み上がること、そしてETFの流出が緩和されることです。レジスタンスで再び跳ね返される、あるいは引き続き流出が続く、またはテクニカルな崩壊が起きれば、売られすぎの状態でも下降トレンドを止めることはできなかったという議論が強まるでしょう。現時点では、どちらの側も必要とされる確証を得ていません。#IMPACTbyTrade
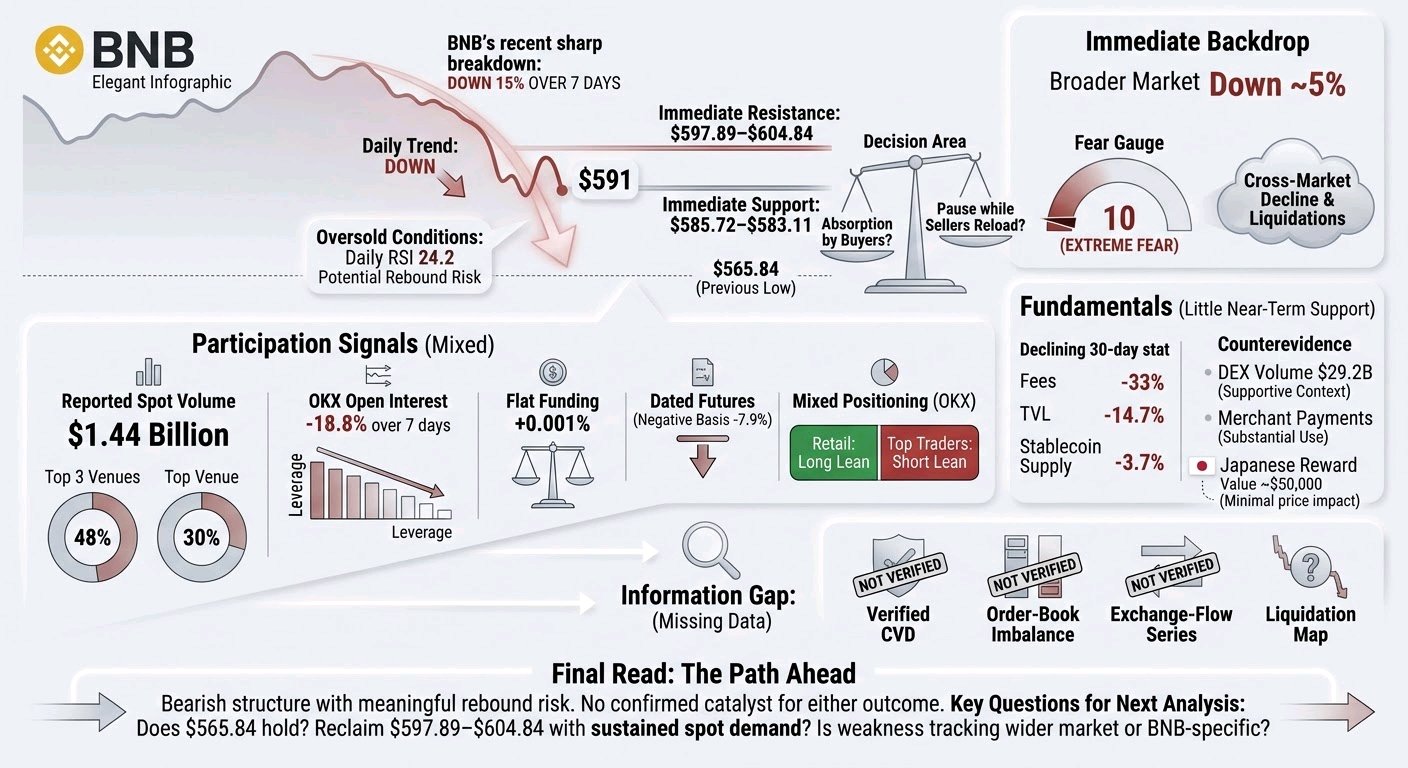
$BNBUSDT is trying to stabilize after a sharp breakdown, but I don’t yet see evidence that the market has changed character. The key distinction is whether buyers are absorbing supply—or merely taking a pause while sellers reload. Verified: BNB is near $591, down 15% over 7 days. It fell to $565.84 and rebounded as high as $599.63, but recent hourly closes failed to hold above $597.89. The 1-hour, 4-hour and daily trends remain down. Daily RSI is 24.2, which signals oversold conditions, not a confirmed bottom. Price remains below the 1-hour EMA50 at $604.84, the 4-hour EMA20 at $615.86, and the daily EMA20 at $674.78. That leaves a nearby decision area. $585.72–$583.11 is short-term support; below it, the market would be testing $565.84 again. If that low breaks and price cannot quickly reclaim it, sellers retain control. On the other hand, a sustained move above $597.89–$604.84, followed by a successful retest, would be more meaningful than a brief intraday spike. The next substantial resistance is around $620.60–$620.85. Could BNB reclaim those levels while the broader market remains weak? That would be stronger evidence of demand than oversold readings alone. Participation signals are mixed. Reported spot volume is $1.44 billion across 62 venues, but the top 3 account for 48%, with one venue representing 30%. That makes the headline volume less persuasive as proof of broad-based buying. Perpetual open interest is $563 million across 4 tracked venues; OKX open interest is down 18.8% over 7 days. That suggests leverage has been coming out there, but it does not establish the direction of aggregate market-wide positioning. Funding is nearly flat at +0.001% per 8 hours, while dated futures trade at a negative 7.9% annualized basis. On OKX, retail accounts lean long, while top traders’ positioning leans short. Those crosscurrents do not point to an obvious, crowded short that must be squeezed. The important gap is what we cannot establish from these figures: there is no verified CVD, order-book imbalance, exchange-flow series, or liquidation map here. So we cannot confidently say whether spot buyers absorbed the selloff, where forced liquidations clustered, or whether the rebound was driven mainly by short covering. A liquidation level, if identified, would be a possible volatility point—not a guaranteed turning point. The immediate backdrop also matters. The broader crypto market is down about 5% in the latest snapshot, with fear at 10, down from 28 a week ago. News on Nov. 13 described a sharp cross-market decline and forced liquidations as Bitcoin and other major assets fell. That supports the interpretation that BNB’s slide was amplified by general risk aversion, rather than being solely a BNB-specific event. But it raises a useful question: if the broader market stabilizes, does BNB recover with it—or continue to lag? Fundamentals give little near-term support for a bullish reversal. Over 30 days, BNB Chain fees fell 33%, TVL fell 14.7%, and stablecoin supply fell 3.7%; these figures reinforce a weaker activity backdrop, though they do not prove what caused this week’s price move. There is counterevidence: reported 30-day DEX volume is $29.2 billion, and a recent merchant-payments report described substantial use of BNB Chain. Those are supportive context, not evidence of new buying pressure. A Japanese company’s announced BNB shareholder reward is worth watching, but its reported value is only about $50,000 and the reference date is Dec. 31. It does not look large enough to explain this selloff or reverse it by itself. My read: bearish structure, meaningful rebound risk, and no confirmed catalyst for either outcome. The next analysis should answer three questions: does $565.84 hold on a retest; can BNB reclaim $597.89–$604.84 with sustained spot demand; and is the weakness still tracking the wider market, or becoming BNB-specific?#IMPACTbyTrade
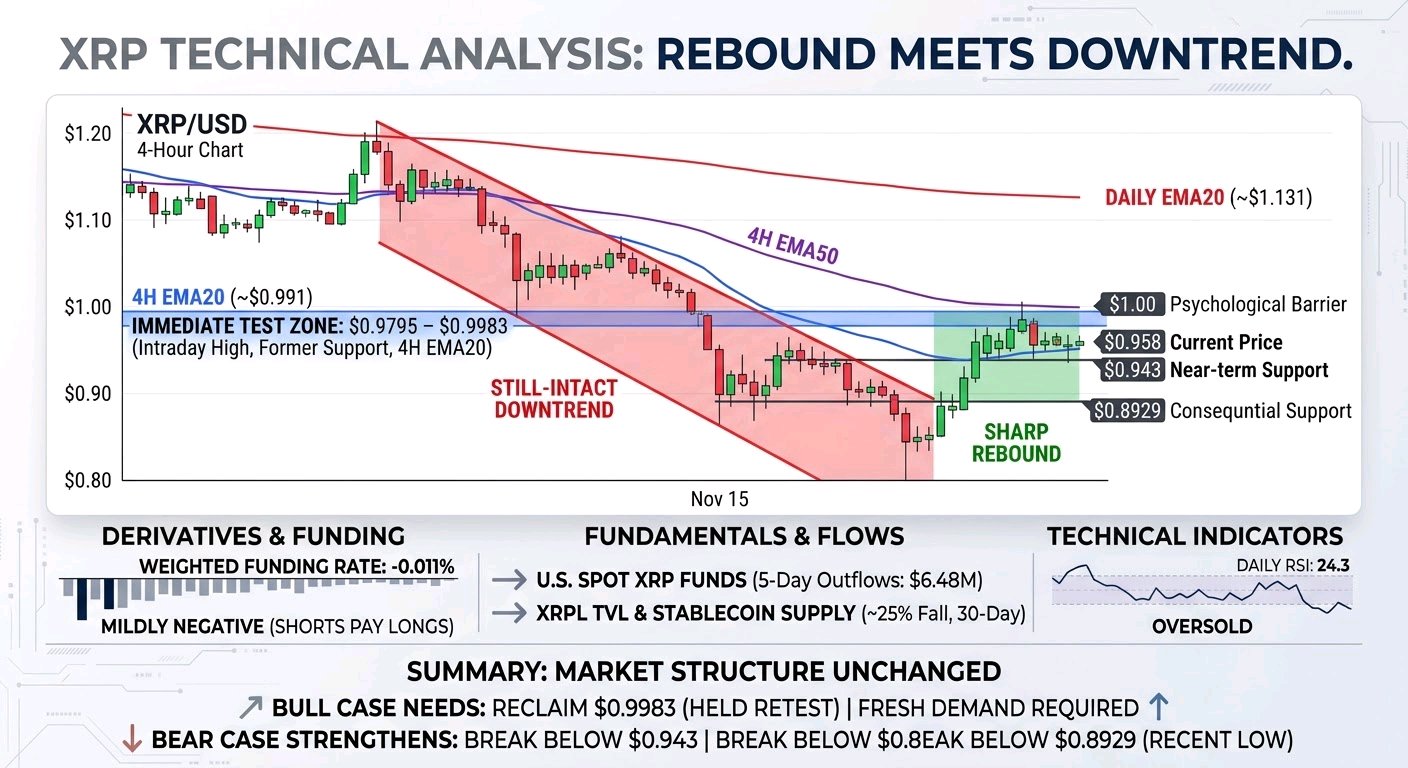
$XRPUSDT is caught between a sharp rebound from a two-year low and a still-intact downtrend. At about $0.958 on November 15, it is up 4.78% from the prior daily close, after trading as low as $0.8993. That bounce matters, but it has not yet changed the market structure: XRP remains below $1, below its 4-hour EMA20 near $0.991, and well below its daily EMA20 near $1.131. The market is asking whether buyers have found real demand—or whether they are simply responding to an oversold flush. The immediate test is $0.9795–$0.9983. That zone combines the recent intraday high, the former $1 support area, and the 4-hour EMA20. A brief move above it would not be enough by itself. I would want to see XRP hold above the zone on a retest, with meaningful spot buying and open interest rebuilding. Otherwise, a rally could be short covering or position adjustment rather than fresh demand. A break below $0.943 would weaken the near-term bounce; $0.8929, the recent low, is the more consequential support. If that level gives way, the market has not yet shown a strong nearby base. The broader technical picture is unambiguous, though not a timing signal. XRP is down 17.2% over 7 days and 28.0% over 30 days. The daily RSI is 24.3, an oversold reading, but oversold markets can remain weak. On the 1-hour chart, price is near the EMA20 and below the EMA50 around $0.976; on the 4-hour chart it remains below both the EMA20 and EMA50. These facts favor caution on the bounce, but a successful reclaim of $0.9983 would make the bearish interpretation less secure. The derivatives picture is mixed. Funding is mildly negative across the tracked venues, with the weighted rate at -0.011% per 8 hours; shorts pay longs, which can make short positions costly and leave room for a squeeze. Yet this is not evidence that a squeeze is underway. OKX open interest is down 9.4% over 7 days, but that is one venue, and dollar-denominated open interest can fall simply because the token price falls. Long/short data also conflicts: accounts are net long, while top traders’ positions lean short. Reported recent liquidations hit longs hardest, but the available figures do not establish precise liquidation clusters or prove broad market-wide deleveraging. We still need to ask: if price rises, does open interest grow with it, or do shorts merely close into thin demand? There are real fundamental headwinds, but their timing is less clear. U.S. spot XRP funds saw $6.48M in net outflows over 5 days and $1.18M over 20 days, though the latest reported session was positive. XRPL stablecoin supply and value locked each fell about 25% over 30 days. Those are signs of weaker marginal demand and network capital, not proof that they caused this week’s selloff. A reported 240M XRP transfer did not reach an exchange, and exchange-balance readings are disputed because newly tracked wallets changed the totals. Neither establishes a wave of sell-side deposits. No verified new announcement or token unlock in the retrieved recent news clearly explains the move; 36.5% of maximum supply remains outside circulation, a longer-term supply consideration, not evidence of an immediate release. My read is that broad crypto weakness, extreme fear, ETF outflows, and long liquidations explain the pressure better than any single XRP-specific event. But we lack spot CVD, order-book imbalance, and reliable whale-flow evidence, so claims of accumulation or distribution would be premature. The bull case needs a held reclaim of $0.9983, supported by spot demand; the bear case strengthens if $0.943 fails and especially if $0.8929 breaks. Which side is actually taking initiative—spot buyers or leveraged traders—and will the next move in open interest confirm it?#IMPACTbyTrade
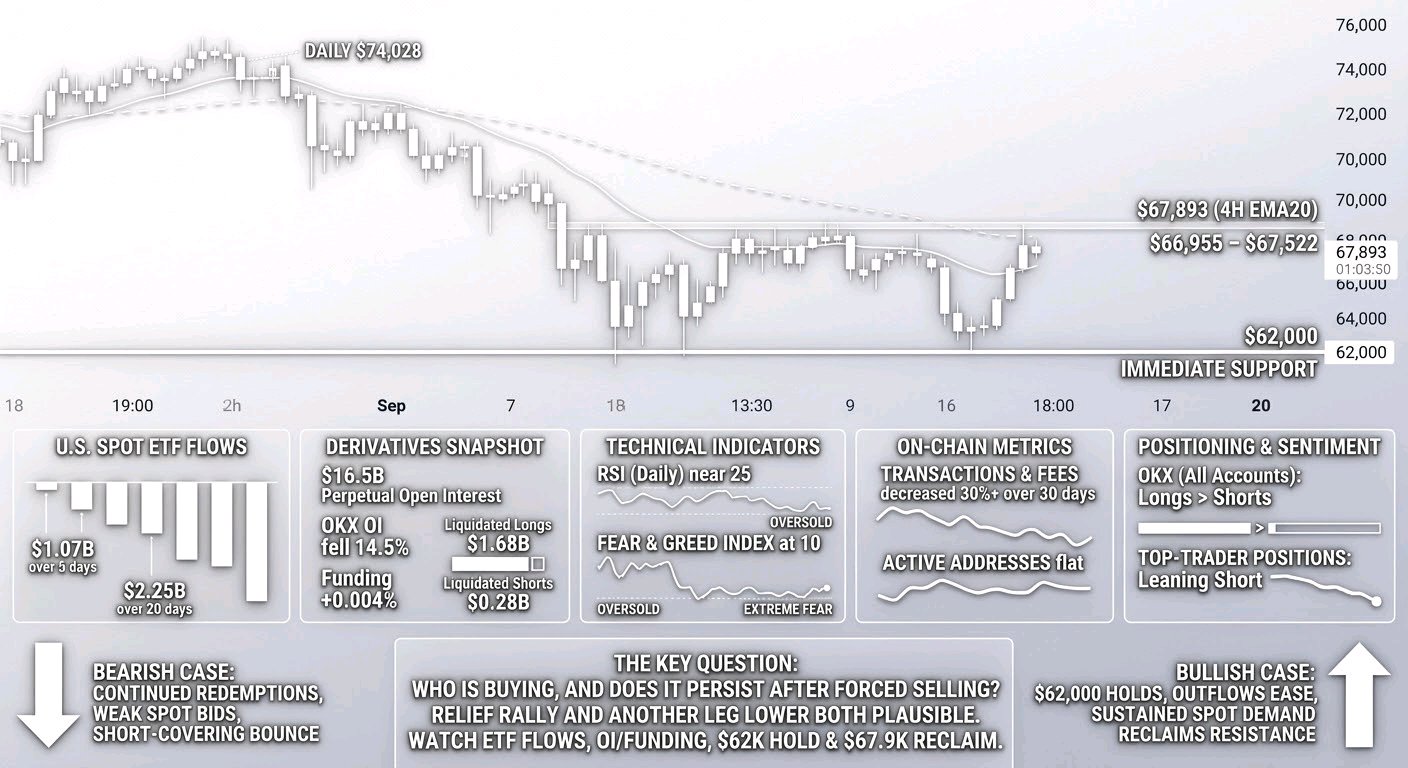
$BTCUSDT 62,000ドルから65,600ドル付近への反発は注目に値しますが、現時点でトレンド転換と呼ぶには時期尚早でしょう。今回の売りは、明確な需要の向かい風を伴うものでした。米国のビットコイン現物ETFは7営業日連続の流出を記録しており、5日間で10.7億ドル、20日間で22.5億ドルの流出となっています。これは無視できない規模の資金流出ですが、これだけで広範な現物買い手が安値圏で参入したかどうかを判断することはできません。 デリバティブ市場の状況はまちまちです。追跡対象の無期限先物市場におけるオープンインタレスト(建玉)は165億ドルで、OKXの建玉は週間で14.5%減少しました。これは下落局面でポジションが解消されたことを示しており、レバレッジ解消(デレバレッジ)の動きと整合的です。ニュース報道によると、仮想通貨の清算額は24時間で約19.6億ドルに達し、そのうち約16.8億ドルがロングポジションによるものでした。62,000ドルでの急激な反発とそれに続く上昇は、清算主導のフラッシュクラッシュの可能性を示唆していますが、強制的な売りが完了したという証拠にはなりません。ファンディングレート(資金調達率)は全体として8時間ごとに+0.004%と依然としてわずかにプラスであり、取引所によって状況は異なります。したがって、一部のポジションは整理されたものの、依然としてロングポジションが残っている可能性があります。 ポジショニングデータも食い違っています。OKXではショートよりもロング口座の方が多い一方、トップトレーダーのポジションはショートに傾いています。これらの比率は特定の口座群のデータであり、市場全体を反映しているわけではないため、信頼できる予測指標として扱うべきではありません。次に重要なのは、オープンインタレストが持続的な現物需要と共に回復するか、それともファンディングレートがプラスの状態で上昇し、再びロングスクイーズ(踏み上げ)のリスクに晒されるかです。CVD(累積出来高デルタ)やオーダーブックの不均衡データがあれば判断の助けになりますが、ここではそのデータを利用できません。 チャート上では、62,000ドルが直近で最も重要なラインです。これは直近の安値であり、現在の反発の下限でもあります。ここを割り込めば、キャピチュレーション(狼狽売り)後の回復というシナリオは弱まり、以前の安値である57,809ドルが再び意識されるでしょう。上値については、66,955ドルから67,522ドルのエリアが最初の抵抗帯です。日中の短い上昇ではなく、明確なブレイクアウトとそれに続くリテストの成功が確認できれば、より確信が持てるでしょう。67,893ドル付近の4時間足EMA20ももう一つの障壁です。BTCがこのレベルを奪還するまでは、より大きなトレンドは下落基調にあります。価格は74,028ドル付近の日足EMA20を大きく下回っており、週足トレンドも下降トレンドです。 強気な議論も存在しますが、それには確認が必要です。日足RSIは25付近で極めて低水準にあり、Fear & Greed Indexが10という極度の恐怖を示す状況は、強制的な売りと急激な反発を伴うことがよくあります。ビットコインの供給量制限と機関投資家のアクセス環境は、長期的な支えとなります。しかし、売られすぎのモメンタムも希少性も、短期的には下値を保証するものではありません。取引件数と手数料は30日間で30%以上減少しており、アクティブアドレス数は横ばいです。これは決済活動が弱まっていることを示唆していますが、保有者が広範に離脱しているとまでは断定できません。同様に、ETFからの流出も限界的な需要の弱まりを示す証拠であり、機関投資家が永続的に撤退しているという証明ではありません。 弱気なシナリオは、償還が続き、現物買いが供給を吸収しきれず、今回の反発が清算波後のショートカバーに過ぎないというものです。一方、強気なシナリオは、62,000ドルが維持され、資金流出が緩和し、持続的な現物市場の参加を得てBTCが抵抗線を奪還するというものです。重要な問いは、単に価格が反発できるかどうかではなく、「誰が買っているのか」、そして「強制的な売り手が退場した後もその需要が持続するか」です。ETFのフロー、現物対先物の参加状況、オープンインタレストとファンディングレートを総合的に注視し、62,000ドルが維持され67,900ドルが奪還されるかを確認する必要があります。それまでは、リリーフラリー(一時的な反発)とさらなる下落の両方の可能性が残されています。#IMPACTbyTrade
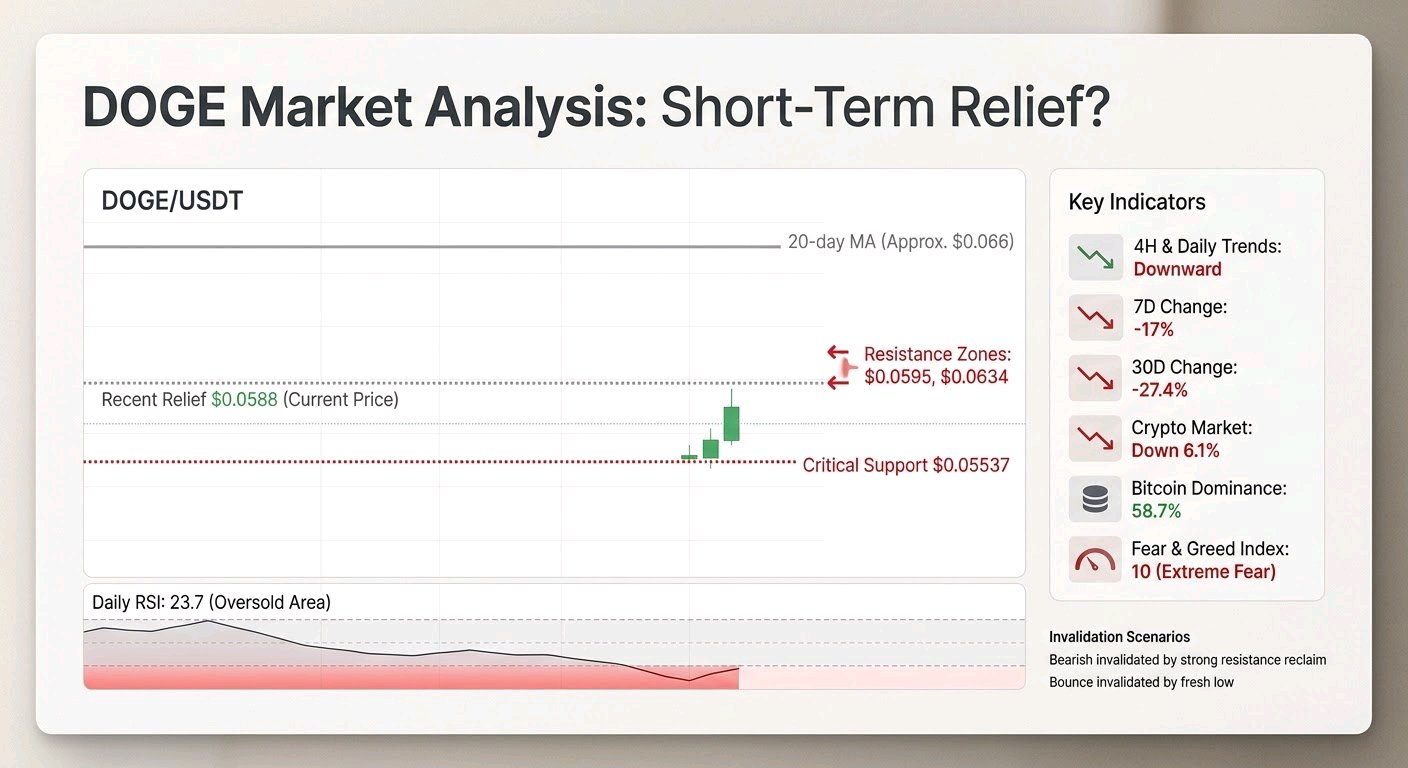
$DOGEUSDT は急激な下落の後に反発を試みていますが、現時点ではトレンドの転換というよりは、短期的な一時回復の兆しが強いようです。価格は0.0588ドルで、最安値0.05537ドルから前日の終値比で2.54%上昇しています。この安値は重要です。直近で最も明確なサポートラインであり、先週の売り圧力による底値だからです。この水準で踏みとどまっていることは、買い手が参入しつつある証拠でしょうか、それとも単に急落後の小休止に過ぎないのでしょうか。 全体的な構造は依然として弱含みです。DOGEは過去7日間で17%、過去30日間で27.4%下落しています。4時間足および日足のトレンドは下降傾向にあり、価格は20期間移動平均線を大きく下回っています。日足RSIは23.7と売られすぎの数値を示しており、反発の前兆となり得ますが、それ自体がトレンドの反転を示唆するものではありません。1時間足チャートでは、価格は0.0595ドル付近の20期間移動平均線および0.0620ドル付近の50期間移動平均線を下回ったままです。この反発では、どちらのラインもまだ明確に回復できていません。 まずは0.0595ドル、次に0.0634ドルに注目しています。後者は直近のレジスタンスエリアであり、売り手が主導権を失いつつあるかを見極めるより重要なテストとなります。単に一瞬そのラインを上回るだけでは不十分です。リテスト時にその価格を維持できるか、そして現物取引での強い買い参加があるかが重要です。現時点では、15分足でのブレイクアウト、累積ボリュームデルタ(積極的な買いと売りの残高)、あるいはオーダーブックの不均衡を確認できるデータはありません。信頼できる清算マップもないため、チャートだけで正確な流動性クラスターや清算レベルを判断すべきではありません。 デリバティブ市場のデータは、決定的とは言えず、まちまちな状況です。無期限先物のオープンインタレスト(OI)は4つの取引所で合計3億2400万ドルと報告されていますが、OKXのOIは過去7日間で17.1%減少しました。これはレバレッジポジションが解消されていることを示唆していますが、あくまで1つの取引所のデータに過ぎず、この動きが現物売り主導なのか、それとも先物トレーダーによるものなのかは判断できません。ファンディングレートは全体的にわずかにマイナス、つまりショート勢がロング勢に支払う形となっていますが、Binanceのファンディングレートはプラスです。トップトレーダーのポジション状況も、ロングに偏ったアカウント比率とは異なります。価格が上昇した場合、これがショートスクイーズの燃料となる可能性はあるでしょうか?可能性はありますが、年率30.4%というマイナスの期先先物ベーシスは、信頼できる反転シグナルではなく、本質的な弱気相場を示しています。スクイーズは根本的なトレンドを変えることなく価格を押し上げる可能性があります。 背景も重要です。仮想通貨市場全体が過去24時間で6.1%下落しており、ビットコインのドミナンスは58.7%、Fear & Greed指数は10です。ニュースでは、ミームコイン全般の暴落や、DOGE ETFへの資金流入が1ヶ月間ゼロであると報じられています。こうした事実はリスク選好度の低さと合致しますが、DOGEの売り圧力を実際に引き起こした要因まではヘッドラインからは特定できません。クジラが18億DOGEを購入したという主張も出回っていますが、そのレポートにはウォレットや取引の詳細が欠けています。検証なしにこれを蓄積の証拠として扱うべきではないでしょう。同様に、コインが取引所に移動しているのか、長期保有に回っているのかを確認できるような、DOGE固有のオンチェーンデータや取引所フローデータもここにはありません。 ファンダメンタルズ面では、DOGEの循環供給量は1570億と報告されており、総供給量と一致していますが、これは発行が停止することを意味しません。DOGEは継続的に発行されているためです。レビューしたデータの中に、直近で検証可能なプロジェクトのカタリストは見当たりません。プロトコル手数料や収益は市場価値に対して小さいため、価格はネットワーク経済の突然の変化よりも、センチメントや市場フローに反応する可能性が高いでしょう。 私の見立ては、確実なものではなく慎重なものです。強気シナリオは、0.05537ドルの安値が防衛された後、0.0595ドル、続いて0.0634ドルを継続的に回復し、理想的には現物需要とオープンインタレストが安定または再構築される展開です。弱気シナリオは、レジスタンスのテストに失敗し、特に市場全体が弱いまま0.05537ドルを決定的に割り込む展開です。弱気の見方を無効化するものは何でしょうか?信頼できる現物買いを伴い、レジスタンスを回復・維持することです。反発を無効化するものは何でしょうか?新たな安値の更新です。これらの疑問が解決されるまで、この反発は可能性に過ぎず、主導権が入れ替わったという証明ではありません。#IMPACTbyTrade
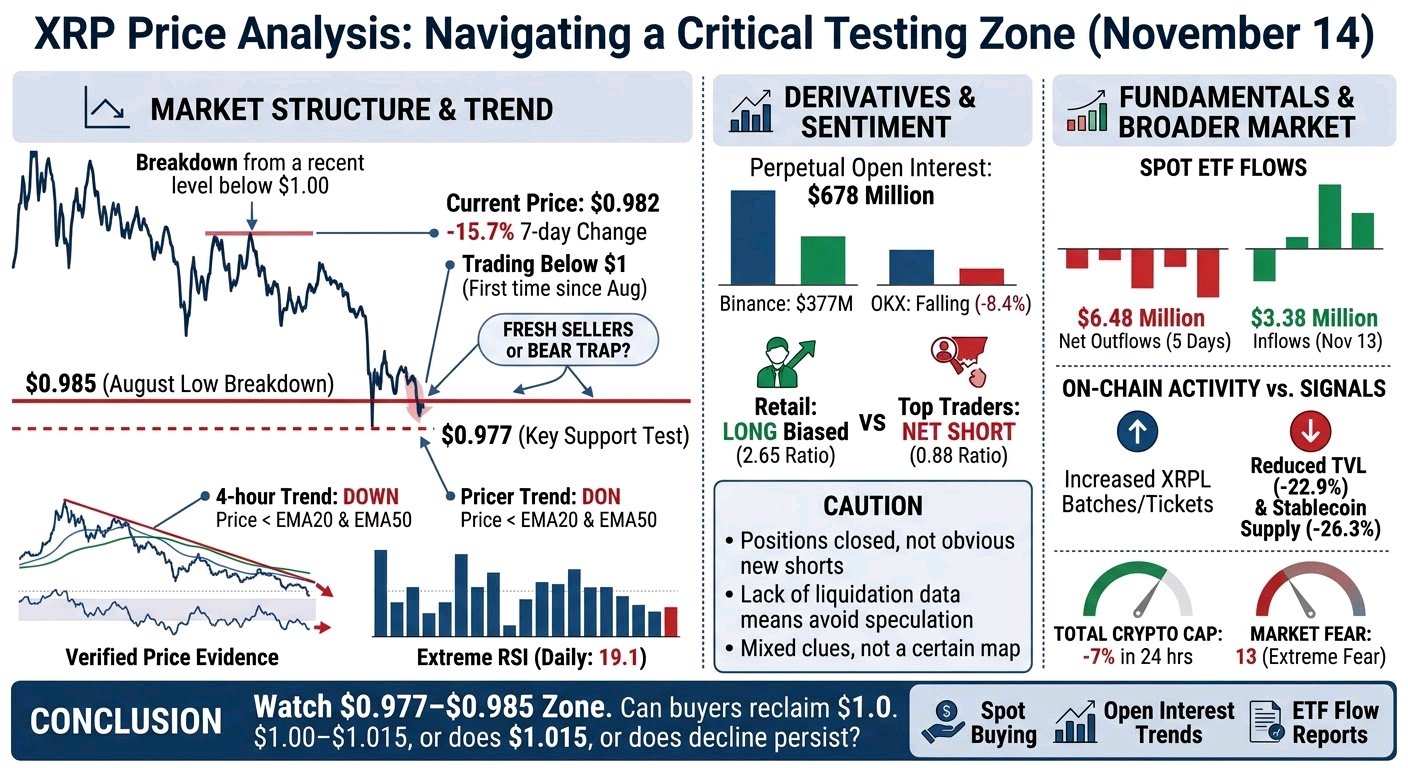
$XRPUSDT is caught between a clear downtrend and a price area where selling could become exhausted. At $0.982 on November 14, it had lost 15.7% in 7 days and was trading below $1 for the first time since August, after breaking the reported August low near $0.985. That is a meaningful loss of structure, but the market is now testing the same zone it just broke. Does a move below $0.977 attract fresh sellers, or do buyers reclaim it quickly and turn the breakdown into a bear trap? The answer matters more than the fact that XRP is oversold. Verified price evidence: The 1-hour, 4-hour, daily and weekly trends are down. Price is below the 1-hour EMA20 and EMA50 near $0.999 and $1.015, and the 4-hour averages near $1.026 and $1.083. Daily RSI is 19.1, an extreme reading, while 4-hour RSI is 30.6. Recent 4-hour candles show lower closes and a failed push toward $1.044 before selling resumed. To me, that says sellers still control the broader structure; it does not rule out a sharp bounce. A sustained reclaim of $1.00, then $1.015, would be the first evidence that buyers are changing the near-term balance. A close below $0.977 followed by a weak retest would make the breakdown more convincing. Neither outcome is confirmed yet. The derivatives picture is more mixed than the chart. Perpetual open interest is $678 million, with $377 million on Binance; OKX open interest fell 8.4% over 7 days. That decline alongside falling price is consistent with positions being closed or liquidated, rather than an obvious wave of new leveraged shorts. Funding is almost flat to slightly negative at -0.001% weighted. Retail accounts are long-biased at 2.65, while top traders’ positions are net short at 0.88. These are clues, not a map of who will be forced out. We do not have verified liquidation totals, liquidation-price clusters, CVD, or order-book imbalance. So claims that a particular level is “packed” with liquidations—or that a squeeze is imminent—would be speculation. There are signs of weak demand, but they need careful handling. Verified US spot ETF data show $6.48 million of net outflows over 5 days and $1.18 million over 20 days, despite $3.38 million of inflows on November 13. A separate report claims $19.13 million of weekly outflows; that conflicts with the 5-day figure and should not be treated as settled. News also reports exchange balances rose by 335.76 million XRP over 3 months. If accurate, that may mean more readily available supply, but it does not show that holders are selling now. We lack direct whale-flow and exchange-flow confirmation. The bullish counterpoint is increased XRPL batch and ticket activity. That shows activity, not necessarily XRP purchases: on-chain evidence does not establish that these transactions generated scaled token demand. Meanwhile, reported value locked is down 22.9% over 30 days and stablecoin supply on XRPL down 26.3%. Those figures make the activity headline less persuasive as a near-term demand signal. The broader market is also under pressure: total crypto capitalization fell 7% in 24 hours and fear is at 13. XRP’s weakness may therefore reflect both market-wide risk aversion and coin-specific supply concerns. My read is cautious, not certain. The key zone is $0.977–$0.985; above it, $1.00–$1.015 is the first reclaim test. Watch whether spot buying accompanies a recovery, whether open interest rises or keeps shrinking, and whether ETF-flow reports reconcile. Those answers would tell us whether this is capitulation, temporary exhaustion, or simply another pause in a persistent decline.#IMPACTbyTrade
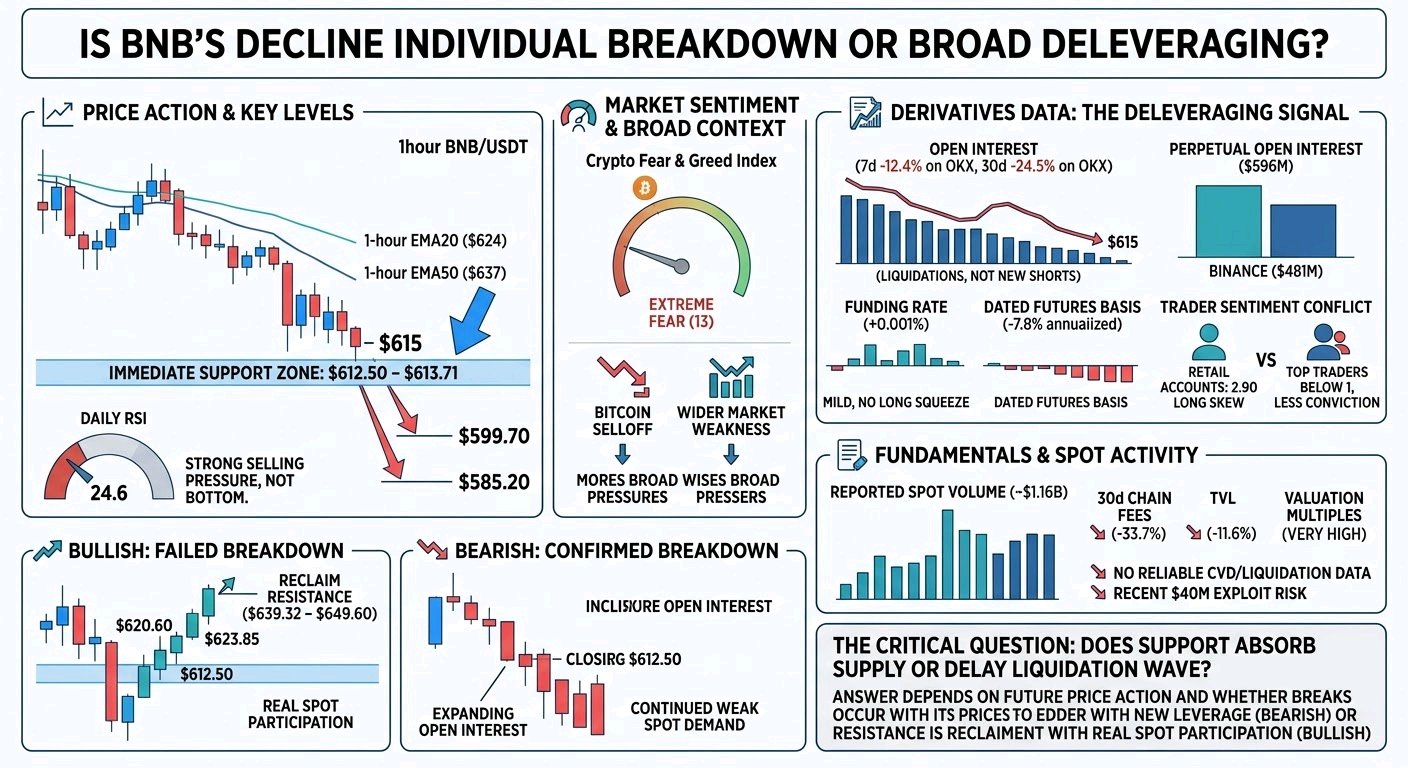
$BNBUSDTは非常に不安定な状況にあります。ここ7日間の下落は急激ですが、重要な疑問は、これがBNB固有の崩壊なのか、それとも暗号資産市場全体におけるレバレッジ解消(デレバレッジ)のイベントなのかという点です。 検証済みの事実は明らかです。BNBは7日間で約11.5%下落し、615ドル付近まで値を下げています。ビットコインおよびより広範な市場も大きく売られており、「恐怖指数(Fear & Greed Index)」は13という極度の恐怖状態を示しています。BNBは1時間足のEMA20(約624ドル)とEMA50(約637ドル)を下回っており、4時間足の平均線(約643ドルおよび667ドル)も大きく割り込んでいます。日足RSIは24.6です。これは強い売り圧力を裏付けてはいますが、底打ちを示唆するものではありません。 当面の攻防ラインは612.50ドルから613.71ドルのあたりです。この水準は何度か試されていますが、反発は弱いものにとどまっています。なぜこれが重要なのか?サポートレベルは、買い手が防衛後に強力な回復を見せた時こそ信頼性が高まるからです。今のところ市場は防衛を見せているだけで、明確な蓄積(買い増し)の動きは見られません。 1時間足が612.50ドルを下回って確定すれば、大きな意味を持つでしょう。次に意識される下値の目安は599.70ドル、その次は585.20ドルです。ただし、単にこのラインを割り込んだからといって、新規のショート勢が主導権を握っているとは限りません。建玉(オープンインタレスト)は減少しており、特にOKXでは7日間で12.4%、30日間で24.5%減少しました。建玉が減少する中で価格が下落している場合、それは新規のショートポジションが積み上がっているというよりは、レバレッジ解消や清算が起きていることを反映している場合が多いです。 したがって、デリバティブ市場は警告を発してはいますが、すべての説明にはなりません。無期限先物の建玉は約5億9600万ドルで、Binanceに4億8100万ドルが集中しています。資金調達率(ファンディングレート)は8時間ごとに+0.001%とわずかにプラスですが、これだけで極端なロングスクイーズ(踏み上げ)が起きると判断するには弱すぎます。限月先物のベーシスは年率約-7.8%とよりネガティブな傾向にあります。個人投資家のロング・ショート比率は2.90とロングに傾いていますが、大口トレーダーの比率は1を下回っています。この乖離は重要です。力のない個人投資家はロングに傾いている可能性がありますが、強気な大口トレーダーは同じ確信を持っていないからです。 現物取引は活発で、報告された出来高は約11億6000万ドルに達していますが、いくつかの取引所に偏っています。信頼できるCVD(累積出来高デルタ)、板情報の不均衡、清算総額、検証済みの清算ヒートマップが存在しないため、この下落が純粋な現物の売りによるものか、強制決済によるものかを断定する自信は持てません。 ファンダメンタルズの面では、状況は芳しくありません。30日間のチェーン手数料は33.7%減、TVL(預かり資産)は11.6%減となっており、プロトコル収益に対する年率換算の評価倍率は依然として非常に高いままです。これらの数値はBNBが脆弱である理由を説明していますが、今週の下落がファンダメンタルズによって引き起こされたことを証明するものではありません。最近発生した4000万ドル規模のアプリケーションの脆弱性を突く攻撃はリスクですが、価格への直接的な影響はまだ不透明です。 強気シナリオは、ブレイクダウンの失敗です。つまり、サポートが維持され、価格が620.60ドルを奪還し、623.85ドル以上で引けるケースです。639.32ドルから649.60ドルを突破すれば、売り手が主導権を失いつつあるというより強力な証拠となります。弱気シナリオは、612.50ドルを下回って引け、さらに建玉が増加し、現物需要の弱さが続くケースです。 私が最も不透明だと考えているのは、次なる動きの性質です。現在のサポートは売り圧力を吸収しているのか、それとも次の清算の波を単に遅らせているだけなのか。最終的な答えは、価格が新たなレバレッジを伴ってサポートを割り込むのか、それとも実際の現物需要を伴ってレジスタンスを奪還するのかにかかっています。#IMPACTbyTrade
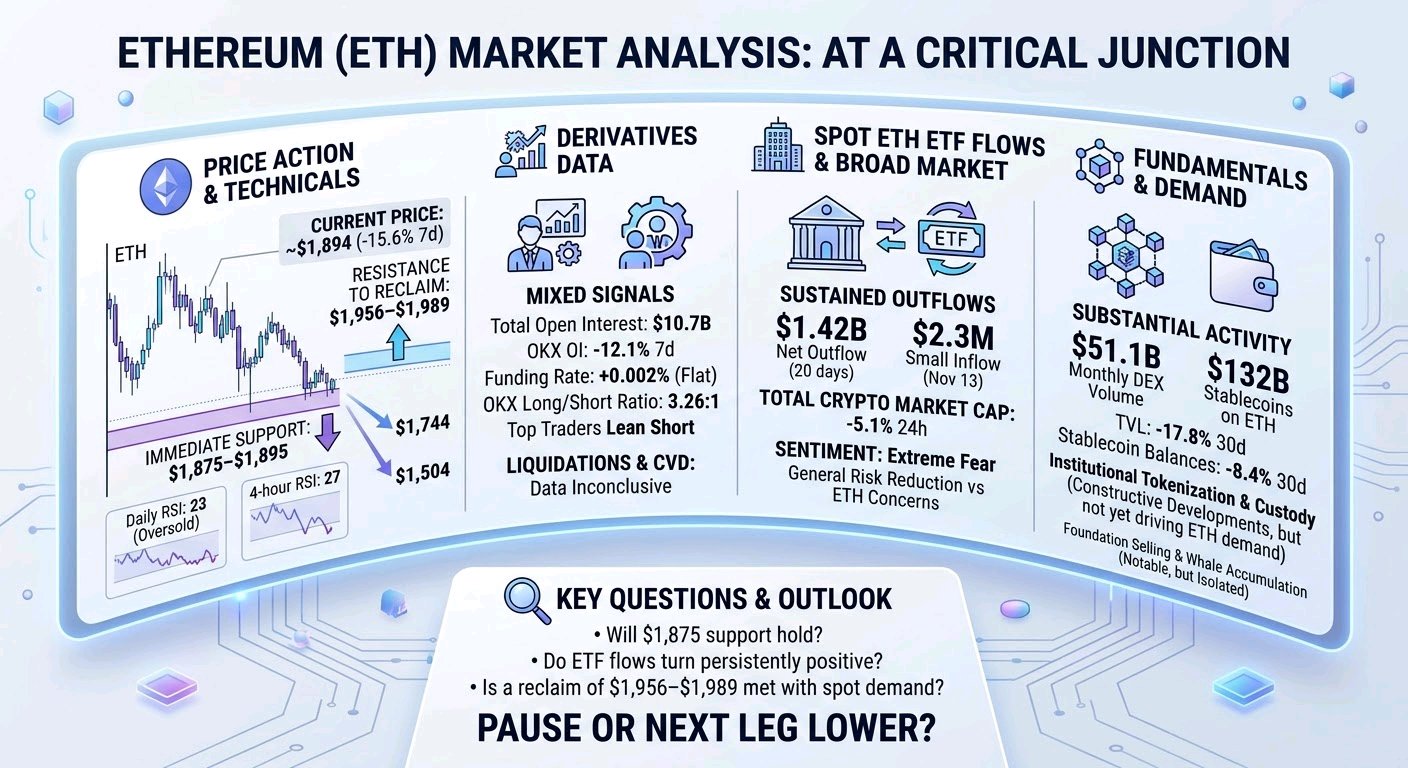
$ETHUSDC Ethereum is sitting in an uncomfortable place: the short-term chart is stretched to the downside, but the evidence so far does not show that sellers have been exhausted. Verified: ETH is around $1,894, down 15.6% over 7 days. It has closed 6 consecutive weekly candles lower and remains beneath its daily EMA20 and EMA50, near $2,170 and $2,302. On the 4-hour chart, price is also below both trend averages, around $1,989 and $2,084. The immediate test is $1,875–$1,895, a recent low area. A decisive close below it would make the next weekly supports, $1,744 and $1,504, more relevant. But a level is not a prediction: what matters is whether price breaks and holds below it, or quickly reclaims it. The bearish structure is clear; the quality of the selling is less clear. Daily RSI is near 23 and 4-hour RSI near 27, readings consistent with an oversold market, not a reliable reversal signal. A bounce that stalls below $1,956–$1,989 would still leave the short-term downtrend intact. Reclaiming that zone and holding a retest would be a better first sign of buyers regaining control. Even then, price would remain below the 4-hour trend averages. What would turn a bounce into a genuine structural change? A higher low, follow-through, and stronger spot participation—not simply one green candle. Derivatives evidence is mixed. Open interest across the tracked perpetual venues is $10.7B; OKX open interest is down 12.1% over 7 days. Funding is close to flat, at a weighted +0.002% per 8 hours. That combination is more consistent with leverage being reduced than with a fresh, crowded short trade. Yet OKX long accounts outnumber shorts 3.26 to 1, while top-trader positions lean short. These are different measures of positioning, not proof of an imminent squeeze. We do not have verified liquidation totals or heatmaps, nor CVD, order-book imbalance, or a reliable futures-volume breakdown. So claims about exact liquidation clusters—or who is driving the next move—would be speculation. The broader demand picture is harder to dismiss. Verified: US spot ETH ETFs saw net outflows of $399M over 5 days and $1.42B over 20 days, though November 13 showed a small $2.3M inflow. One day does not establish a turn. Recent reporting also describes a Foundation-linked wallet selling ETH, alongside several large buyers accumulating during the decline. Those are notable, but isolated wallet transactions do not prove broad buying or explain the full price move. The wider market is weak too: total crypto market value fell 5.1% in 24 hours, and sentiment is at extreme fear. That makes it plausible ETH’s decline reflects general risk reduction as well as Ethereum-specific concerns. The fundamentals offer a real tension. Ethereum still records substantial activity: $51.1B of monthly DEX volume and $132B in stablecoins. Yet stablecoin balances are down 8.4% over 30 days and TVL is down 17.8%. Annual protocol revenue is $47.4M against a $231B market cap. Meanwhile, institutional tokenization and custody developments are constructive, but public evidence does not show that they have yet created material ETH buying or revenue. My read is cautious, not certain: the trend favors sellers, while oversold price action and selective whale buying leave room for a sharp rebound. The key questions are whether $1,875 holds, whether ETF flows turn persistently positive, and whether a reclaim of $1,956–$1,989 comes with genuine spot demand. If not, is this merely a pause before another leg lower? #IMPACTbyTrade
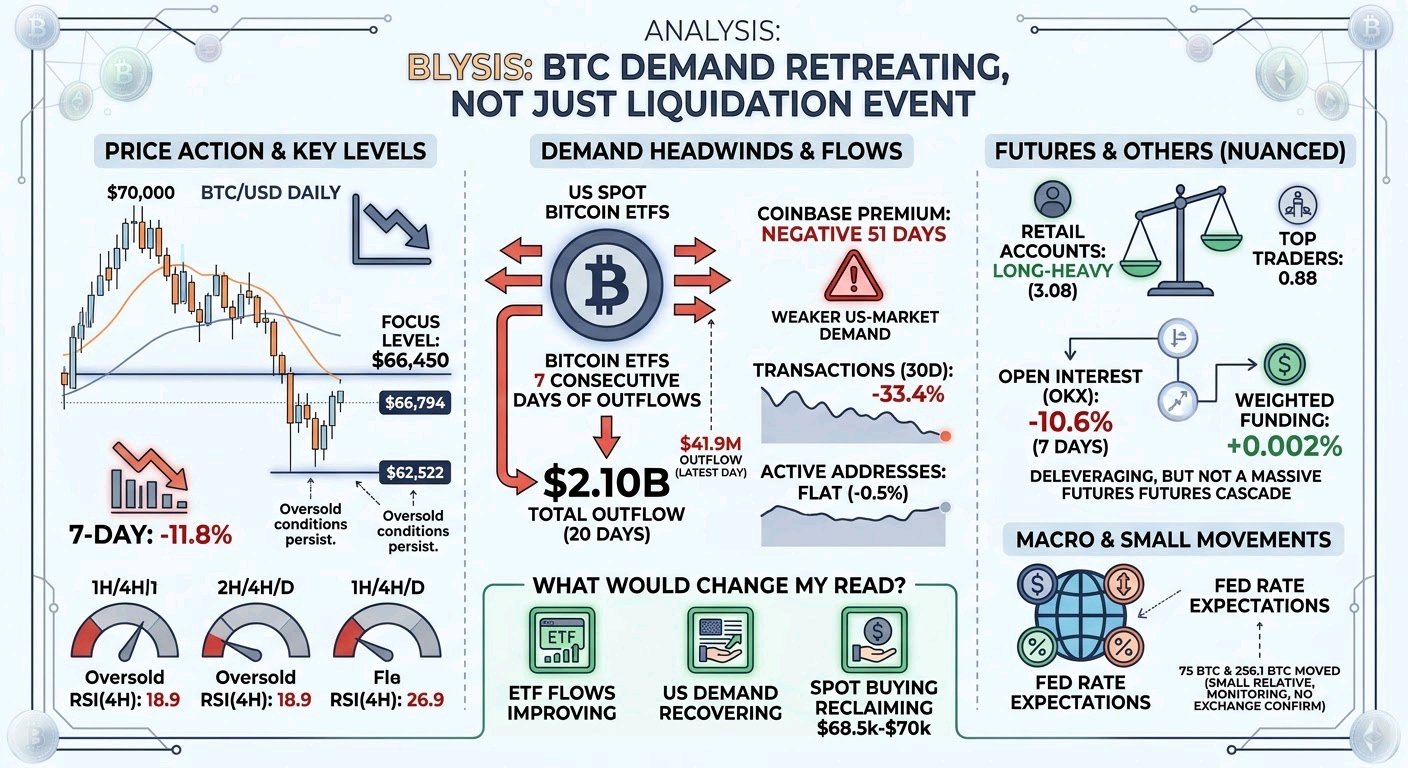
BTCUSDT この弱さは、単一の清算イベントというよりは、トレーダーがリスクを軽減する中で需要が後退しているように見えます。この区別は重要です。新規のショートの波がなくても、スポットでの買い手が不在であれば、市場はズルズルと下落し続ける可能性があるからです。 証拠が示すこと:BTCは70,000ドルを割り込み、7日間で11.8%下落して66,794ドル付近となっています。1時間足、4時間足、日足のトレンドは下向きで、価格は関連する短期移動平均線を下回っています。RSIは4時間足で18.9、日足で22.5と深い売られすぎの状態にありますが、下降トレンドにおいては売られすぎの状態が続くこともあります。現在の66,450ドルのテストは、直近のローカル安値であるため重要です。タッチはしましたが、入手可能なスナップショット時点では、これを下回る確実な1時間足の終値は確定していません。 チャート以外にも、実際の売り圧力の兆候があります。米国のスポットビットコインETFは7日連続の流出を記録し、20日間で合計21億ドルの流出となりました。直近の報告日には4,190万ドルの流出がありました。コインベース・プレミアムは51日間マイナスと報告されており、他市場と比較して米国市場の需要が弱いことを示しています。これらがETFのフローが価格下落の各局面を引き起こしたと証明するわけではありませんが、全体として、需要が持続的な逆風にさらされていることを示唆しています。市場はまだ、買い手がこれらを吸収しているという明確な証拠を示していません。 先物市場はより微妙な状況を示しています。追跡対象の取引所全体での永久先物建玉(オープンインタレスト)は169億ドルで、OKXの建玉は7日間で10.6%減少しました。これはOKXでのレバレッジ解消の証拠であり、レバレッジがどこでも同じ割合で減少したという証明ではありません。加重ファンディングレートは8時間ごとに+0.002%に過ぎず、ロングがショートに支払っているものの、明らかに極端な水準ではありません。リテール口座は引き続きロングが優勢(3.08倍)ですが、トップトレーダーのポジション比率は0.88です。この乖離は、一つのポジショニング統計だけで市場全体を判断することへの警告です。信頼できるCVD(累積出来高デルタ)、板情報の不均衡、あるいは清算レベルのデータは利用できないため、特定の清算クラスターや先物主導の連鎖的下落についての主張は、証拠の域を出ないでしょう。 マクロ的な背景は、個別の暗号資産ニュースよりも重要かもしれません。あるレポートでは、今回の下落はバイナンスのハッキングではなく、FRBの利下げ期待の変化に起因するものだとされていますが、これは推測に基づく説明であり、因果関係の証明ではありません。一方、報告されている長期休眠ウォレットからの75 BTCの移動や、Bitdeerによる256.1 BTCの売却は、BTC市場全体から見れば小規模であり、どちらの送金も取引所に到達した、あるいは売却されたというデータはありません。これらは監視すべき対象ではあっても、下落の要因として扱うべきではありません。 オンチェーンのデータはまちまちです。トランザクション数は30日間で33.4%減少し、マイナー収益は30.7%減少していますが、アクティブアドレス数は0.5%減とほぼ横ばいです。これは活動の鈍化を示唆していますが、それだけでネットワークに対する信頼が突然失われたと断定することはできません。供給量の95.8%が発行済みで、予定されているトークンのアンロックはありません。次回の難易度調整は下方修正が見込まれており、これは供給上限ではなく、マイナーの経済性に影響を与えます。 次のステージに向けての重要な問いは、66,450ドルが1時間足の終値として維持されるかどうかです。ブレイク後にリテストに失敗すれば、日足のより広いサポートである62,522ドル付近への下落シナリオが強まります。サポートが維持されれば、リバウンドの可能性はありますが、単なる売られすぎからの反発よりも、68,500ドル〜70,025ドル付近を奪還し、それを維持することの方が説得力があります。私の見方を大きく変える要素は、ETFフローの改善、米国需要の回復、そして奪還に伴うスポットでの買いの出現です。それまでは、下落の継続と急激なカウンター(逆張り)トレンドのリバウンドの両方が現実的なリスクとして残ります。 IMPACTbyTrade
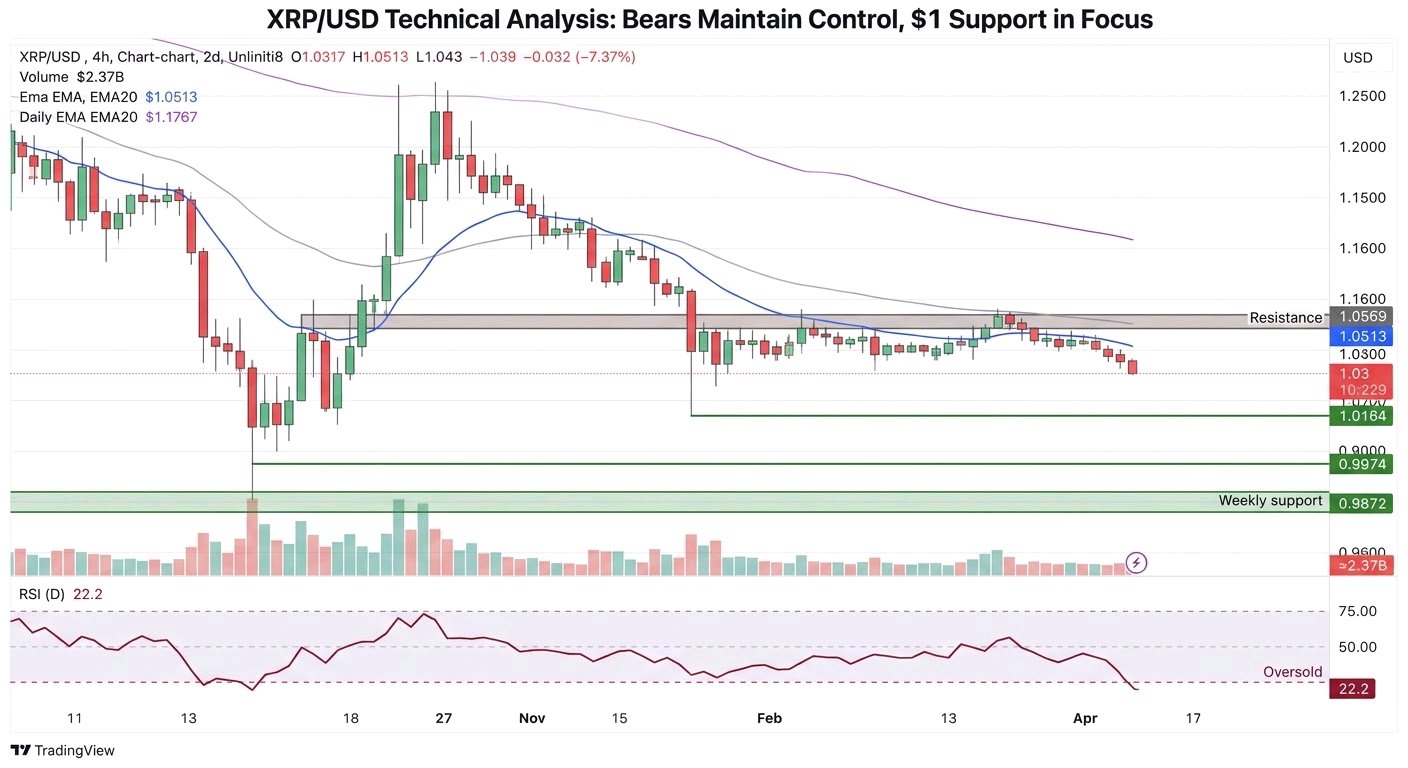
$XRPUSDT is trading near $1.03 after a sharp seven-day decline of about 13%. The important question is not simply whether it is “oversold.” It is whether buyers are absorbing supply or merely pausing the sell-off. The verified structure remains weak. Price is below the 4-hour EMA20 at $1.0513 and far below the daily EMA20 at $1.1767. The daily RSI is 22.2, which shows heavy selling pressure, but it does not prove that a durable bottom is forming. On the 4-hour chart, XRP has repeatedly struggled around $1.04–$1.0569. A sustained close above that zone, followed by a successful retest, would be the first credible sign that sellers are losing control. Without that, the recent bounce looks more like short covering or bargain hunting inside a larger downtrend. The main downside zones are $1.0164, $0.9974, and then the broader weekly support near $0.9872. The $1 area matters psychologically and technically. It has already attracted buyers, but one defense is not enough evidence of accumulation. If price breaks below $0.9974 and cannot quickly reclaim it, stops and leveraged long positions could add pressure. Conversely, a quick reclaim after a brief breakdown would suggest a liquidity sweep rather than genuine structural damage. Derivatives provide a useful warning, although not a complete liquidation map. Perpetual open interest is about $707M across the tracked venues. Funding is positive at roughly 0.009% per 8 hours, meaning longs are paying shorts. Retail accounts are long-heavy, with an OKX long/short account ratio of 2.72, while top-trader positions lean short at 0.87. This combination suggests that late longs remain vulnerable, but it does not tell us exactly where liquidation orders sit. Open interest has fallen 8.7% over seven days on OKX, so some leverage has already left the market. The recent 24-hour increase may represent new longs, new shorts, or both. Price behavior after that increase is the key clue. Spot turnover is large, around $2.37B over 24 hours, but high volume alone does not reveal net buying. The available data does not confirm CVD, order-book imbalance, whale exchange flows, or reliable liquidation clusters. That is an important limitation. Traders should not assume that a visible support level or liquidation pocket must produce a reversal. The broader backdrop is also unfriendly. ETF flows were negative by $10.6M over five days and $8.28M over 20 days. XRPL stablecoin supply fell 25.3% and TVL declined 22.5% over 30 days. These are signs of weakening marginal liquidity, although ETF outflows could partly reflect fund rotation rather than outright institutional rejection. RLUSD growth is a constructive ecosystem development, but there is no verified evidence yet that it is creating immediate XRP demand. My current interpretation remains cautious and bearish below $1.0569, but the daily RSI leaves room for a violent relief rally. The decisive questions are: can XRP reclaim $1.044 with expanding spot participation, or does rising open interest meet another failure? Does $0.9974 hold on a retest? And if it breaks, is the move forced liquidation—or the beginning of a deeper repricing? #IMPACTbyTrade
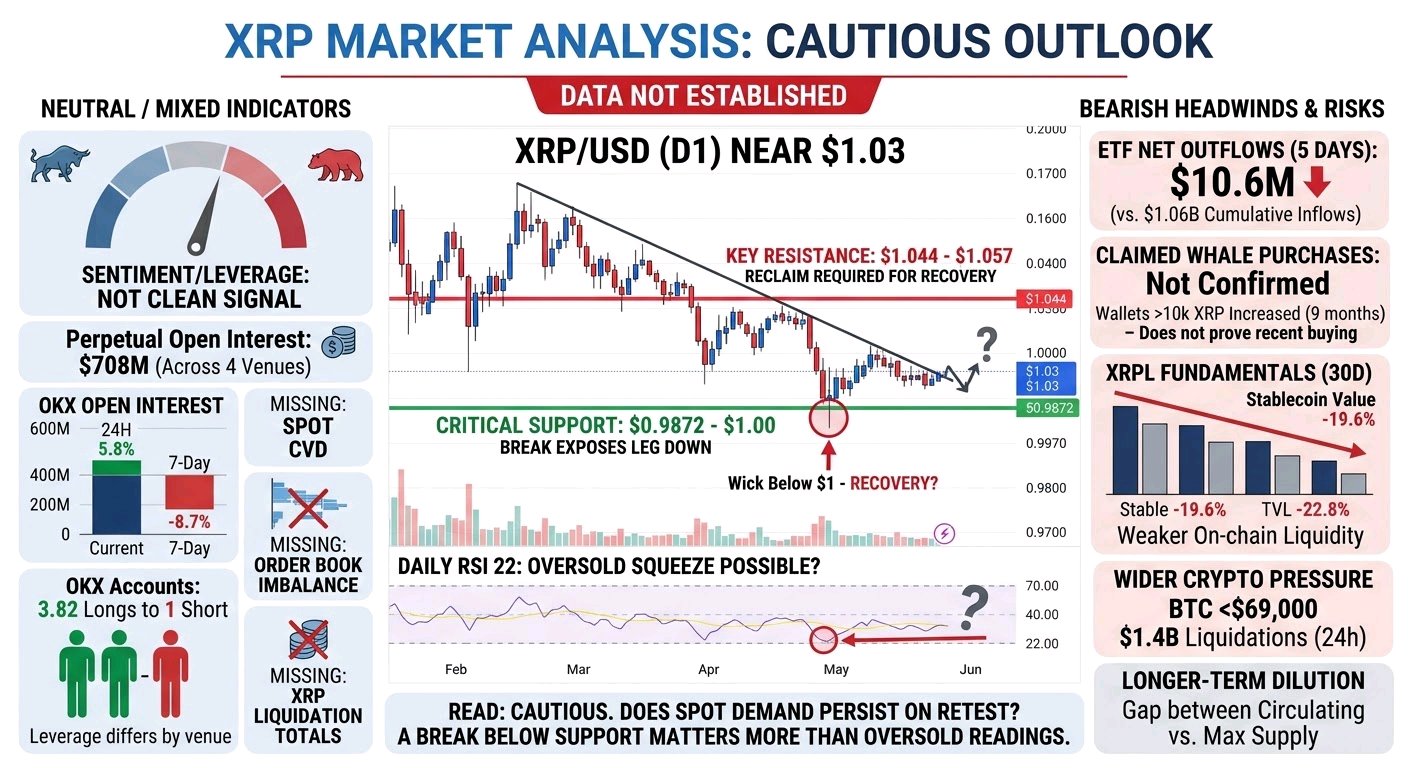
$XRPUSDT is caught between a possible oversold bounce and a market still behaving like a downtrend. It trades near $1.03, down 13.7% over 7 days. The wider crypto market is under pressure too: Bitcoin fell below $69,000, and reported liquidations reached $1.4 billion in 24 hours. XRP briefly dipped below $1 before recovering. That matters, but does the rebound show buyers stepping in—or only a pause after forced selling? The available data does not establish which. The facts are mixed. Perpetual open interest is about $708 million across 4 venues. OKX open interest is up 5.8% in 24 hours, but down 8.7% over 7 days. Funding is close to neutral overall, while OKX accounts show 3.82 longs for every short; top traders’ positions, however, are net short. That is not a clean market-wide positioning signal. It suggests leverage and sentiment differ by venue and trader group. We also lack verified XRP-specific liquidation totals, spot CVD—a running measure of aggressive buying versus selling—or order-book imbalance. High spot volume alone cannot tell us whether buyers are absorbing supply. ETF flows offer another headwind: about $10.6 million of net outflows over 5 days, despite roughly $1.06 billion in cumulative inflows since tracking began. Wallets holding at least 10,000 XRP have reportedly increased over 9 months, but that does not prove recent net buying or show whether large holders are moving coins to exchanges. The claimed whale purchases therefore remain a possibility, not confirmed evidence that they offset ETF selling. The price levels matter because they distinguish a bounce from an actual change in behavior. $0.9872–$1.00 is the key support area; a decisive break would weaken the case that buyers are defending the lows and could expose the market to another liquidation-driven leg down. Above, $1.044–$1.057 is the first meaningful resistance zone. A sustained reclaim, rather than a quick wick through it, would make an oversold recovery more credible. It could open room toward $1.11–$1.18, but that would still be a countertrend move, not proof the broader trend has reversed. The technical backdrop remains heavy: daily RSI is around 22, which raises the chance of a squeeze, while daily and weekly trends remain down. On the fundamentals side, XRPL stablecoin value fell 19.6% over 30 days and TVL fell 22.8%. Those figures suggest weaker on-chain liquidity, though they do not establish the cause of XRP’s price decline. A December 3 ledger fix is announced, but there is no evidence yet of a direct market impact. No near-term token unlock was identified; the large gap between circulating supply and maximum supply is a longer-term dilution consideration, not an immediate catalyst. My read is cautious, not decisively bearish: support has held so far, but the stronger proof would be spot demand lifting price through resistance. Does buying persist on a retest, and do ETF flows improve? If not, a break below $0.9872 would matter more than oversold readings.#IMPACTbyTrade
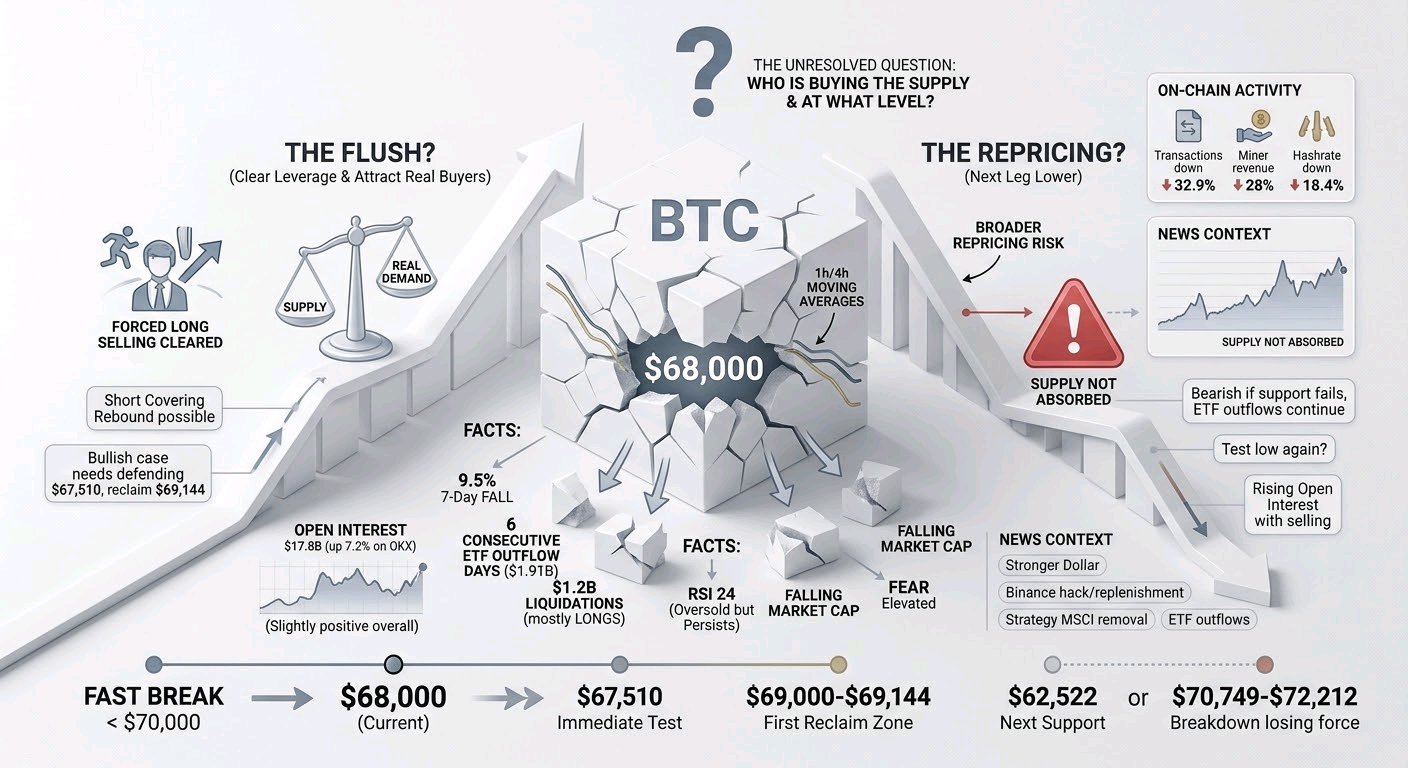
$BTCUSDT は、$70,000を割り込む急落を経て$68,000近辺で推移しています。ここでの重要な問いは、これがレバレッジを解消し、真の買い手を呼び込む「フラッシュ(投げ売りによる清算)」なのか、それともより広範な価格再評価の次の段階なのかということです。どちらの可能性も根拠はありますが、トレンドの転換が確定したという兆候はまだ見られません。 確認された事実:BTCは過去7日間で約9.5%下落しました。直近の1時間足では、$71,000付近からの急落、$69,144を下回った弱気な反発、そして$67,510付近での安値更新が見られます。価格は依然として下降傾向にある1時間および4時間移動平均線を大きく下回っています。日足のRSIは約24で売られすぎの水準にありますが、強い下降トレンド中には売られすぎの状態が長引くこともあります。スポットETFの資金フローは5日間で10.6億ドル、20日間で19.1億ドルの流出となり、6日連続の流出を記録しました。報告によると、24時間の清算額は12億ドルを超えており、その大半はレバレッジをかけたロングポジションによるものです。恐怖感は高まっており、暗号資産市場全体の時価総額も急落しました。 私の解釈:強制的なロングの投げ売りが下落を加速させた可能性が高いですが、清算はあくまで増幅要因であり、下落の完全な説明にはなりません。ETFからの継続的な資金流出は、より重大な需要の警告です。もしその供給が吸収されていないのであれば、反発は難しいかもしれません。しかし、フローの全体像は不明確です。スポット取引高自体は大きいですが、信頼できるCVD(累積売買高)、取引所レベルの買い手/売り手データ、板情報の深さが不足しています。したがって、小口トレーダーが買い、大口保有者が売っているという主張はあくまで報告レベルであり、誰が限界価格を決定しているのかを独自に裏付ける証拠ではありません。 デリバティブ市場は、「完全に洗い流された(ウォッシュアウト)」という単純なシグナルを出していません。追跡対象の取引所全体のオープンインタレストは約178億ドルで、OKXの7日間のオープンインタレストは7.2%増加しています。ファンディングレートは全体的にわずかにプラスですが、一部の取引所ではゼロまたはわずかにマイナス付近です。これは、市場が一様にショートポジションに傾いているわけではないことを示唆しており、価格が弱いままレバレッジが再び積み上がっている可能性も考えられます。これらの数字は取引所固有のものであり、清算マップの全貌を明らかにしているわけではありません。ストップロスの注文が重なることで動きが加速することはありますが、そのレベルでの反転を保証するものではありません。 直近のテストポイントは、直近安値の$67,510です。もし価格がここを割り込み、再奪還できなければ、売り手が依然として市場を支配している可能性が高いでしょう。その場合、次の主要な日足サポートは$62,522となります。しかし、これほど急激な下落の後では、より大きなトレンドを変えることなく、ショートカバーによる急反発が起こる可能性があります。上値については、$69,000〜$69,144が最初の奪還ゾーンです。これを上回って維持できれば短期的な状況は改善するでしょう。$70,749〜$72,212付近の下降する時間足移動平均線を再び上抜ければ、下落トレンドが勢いを失っているというより強力な証拠となります。抵抗線を一時的に上回るヒゲ(プライスアクション)だけでは不十分です。 ニュースは文脈を提供するだけであり、確実な単一の引き金ではありません。報道では、ドル高、ETFからの資金流出、レバレッジの清算が要因として挙げられています。バイナンスはハッキング報告後に顧客資産を補充したと発表しましたが、独立した検証は依然として疑問が残ります。発表そのものが即座にBTCへの売り圧力を確立するわけではありません。MSCI指数からの除外発表は株式や関連フローに影響を与える可能性がありますが、BTCへの直接的な影響は不透明です。オンチェーン活動は鈍化しており、30日間でトランザクション数は32.9%減少、マイナー収益は28%減少、ハッシュレートは18.4%低下しました。これらは活動とマイニング経済の弱まりを示す関連サインですが、差し迫ったマイナーによる売りを証明するものではありません。 私の見解:日足および4時間足の構造は依然として弱気ですが、売られすぎのモメンタムにより、この下落を追いかけることはリスクを伴います。強気のシナリオには、$67,510の防衛、$69,144の奪還、そして持続的なスポット需要の裏付けが必要です。弱気のシナリオは、サポートが機能せず、ETFの資金流出が続き、オープンインタレストの増加に伴って売りが再開された場合に強まります。未解決の問題は「吸収」です。供給を誰が買っているのか、そして価格が再び安値を試した場合、彼らは買い支えを続けられるのか、ということです。#IMPACTbyTrade
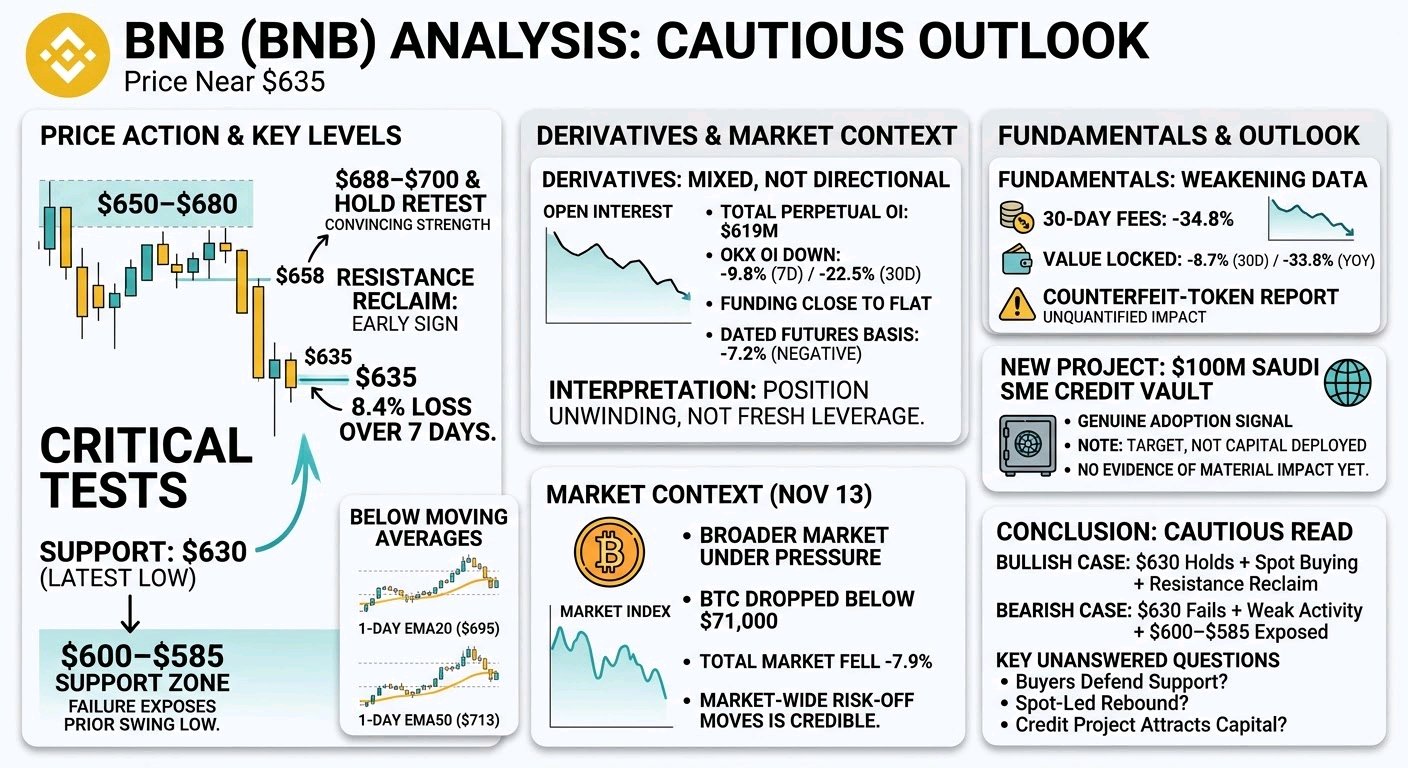
BNBUSDT BNBは7日間で8.4%下落し、635ドル付近まで値を下げています。重要なのは単なる価格の下落ではなく、市場全体が圧力を受ける中、売り圧力によって最近の650ドル〜680ドルのレンジを割り込んだという点です。11月13日には市場全体が7.9%下落し、ビットコインは7万1000ドルを割り込みました。このタイミングを見ると、市場全体でのリスクオフの動きが背景にあることは確かです。しかし、それだけではBNBの弱さをすべて説明できません。BNBは30日間で14.8%下落しており、利用可能なデータからは市場全体のベータ要因と、コイン固有の売り要因を切り分けることができません。 目先の試金石となるのは、直近安値の630ドルです。ここを割り込めば、次の重要なサポートゾーンは過去のスイング安値を含む600ドル〜585ドル付近となります。630ドルで持ちこたえればリリーフバウンス(自律反発)が起こる可能性がありますが、それだけで構造的な転換と呼ぶには時期尚早でしょう。価格は依然として1日EMA20(約695ドル)やEMA50(約713ドル)を大きく下回っており、週足の平均線も693ドル〜694ドル付近に位置しています。658ドルを奪還できれば、安定化への初期の兆候となります。より確実な変化には、688ドル〜700ドルのエリアを回復し、リテストで維持する必要があります。どのような動きが説得力を持つでしょうか?単なる薄い反発や短命なスクイーズではなく、現物買いと継続的な取引活況が伴う動きです。 デリバティブ市場の状況はまちまちで、強い方向性は出ていません。無期限先物の建玉(OI)は6億1900万ドルで、OKXの建玉は7日間で9.8%、30日間で22.5%減少しています。資金調達率(ファンディングレート)はフラットに近く、期限付き先物のベーシスは年率-7.2%とマイナスです。価格下落とともに建玉が減少していることは、新たなレバレッジが下落を主導しているのではなく、ポジションの巻き戻しが進んでいることを示唆しています。一方で、OKXのアカウントは依然としてロング優勢で、トップトレーダー比率は1を下回っています。これらはあくまで特定の取引所の指標であり、市場全体の結論ではありません。清算レベルやCVD、オーダーブックの不均衡、クジラや取引所の資金フローに関する信頼できるデータがないため、ロングの強制ロスカットや大口買い手の参入といった主張は推測の域を出ません。 ファンダメンタルズ面でも、明確な対抗材料はまだ見当たりません。BNBチェーンの30日間の手数料は34.8%減少しており、ロックされた価値(TVL)は30日間で8.7%、前年比で33.8%減少しました。サウジアラビアのSMEクレジット保管庫(1億ドル規模)の発表は真の導入シグナルではありますが、目標額と実際の投入資本は別物であり、現時点でBNB需要を根本的に変えたという証拠はありません。偽トークンの報告は信頼性とユーザーの安全性に関する別の懸念を引き起こしており、市場への影響は計り知れません。 私の見通しは、確信を持ってではなく、慎重なものです。強気シナリオは、630ドルがサポートされ、市場のストレスが和らぎ、BNBが実質的な現物買いを伴ってレジスタンスを奪還することです。弱気シナリオは、630ドルを割り込んだ後に回復に失敗し、取引が低迷する中で600ドル〜585ドルが試されることです。未回答の重要な問いは、買い手がサポートを守れるか、リバウンドが現物主導か、そして新しいクレジットプロジェクトが実際に資本と持続的な利用を呼び込めるかという点です。#IMPACTbyTrade
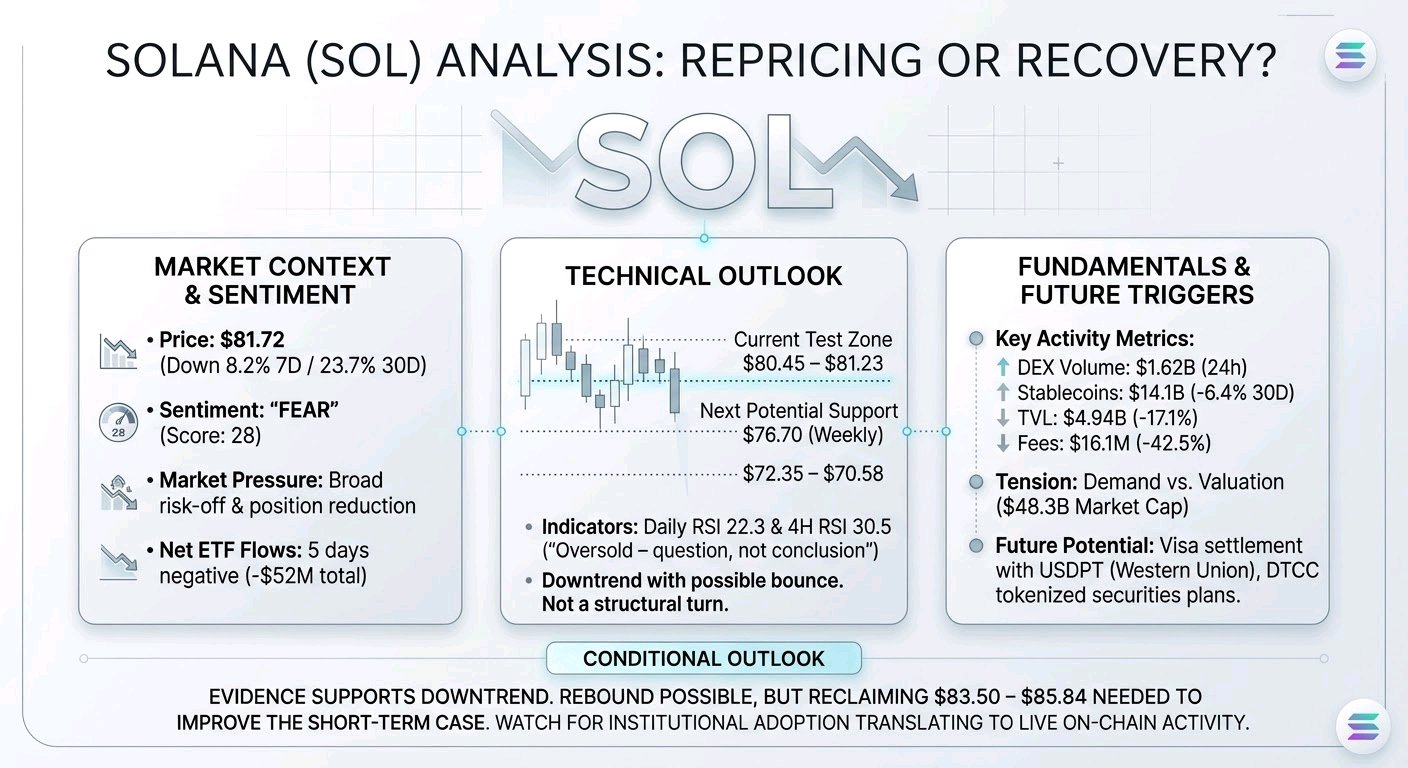
$SOLUSDT at $81.72 looks less like a market that has found its footing than one still trying to absorb a sustained repricing. It is down 8.2% over 7 days and 23.7% over 30 days. That weakness is not happening in isolation: the wider market is under pressure, fear has risen to 28 from 50 a week ago, and ETF flows have been negative for 5 straight days, totaling $52 million. The question is whether this is mainly broad risk-off and position reduction—or whether investors are also reassessing Solana’s own growth and value capture. The immediate price test is $80.45–$81.23. SOL has repeatedly traded around this area, but the available candles do not yet show a sustained reclaim or a confirmed breakdown. A clean close below $80.45 would put weekly support near $76.70 in view, then $72.35–$70.58. Those are reference zones, not guaranteed bounce points. On the other side, $83.50–$85.84 is the first meaningful resistance band; a break above it that holds on a retest would be more persuasive than a quick wick through. Weekly resistance near $83.98 also matters. Above that, the larger trend remains weak: price is well below the weekly EMA20 at about $95.57 and EMA50 near $104.08. The oversold readings invite a question, not a conclusion. Daily RSI is 22.3 and 4-hour RSI is 30.5, while price sits below the key moving averages on both timeframes. That can precede a sharp relief rally, but it does not by itself prove sellers are exhausted. Recent candles show lower prices and repeated tests of the $80.45 area, with only small rebounds. The evidence supports “downtrend with a possible oversold bounce,” not a confirmed structural turn. For that interpretation to change, I would want to see price reclaim resistance, hold it on a retest, and attract sustained spot participation. Derivatives offer a mixed, but useful, clue. Open interest is $1.86 billion across the reported venues, while OKX open interest is down 3.4% over 7 days and 5.3% over 30 days. Weighted funding is slightly negative at −0.004% per 8 hours. That combination is consistent with some leverage coming out rather than an expanding crowded long. Yet it does not tell us who drove the decline. Long/short account ratios are not the same as position size: accounts lean long, but top-trader positions skew short. Crucially, we do not have verified CVD, order-book imbalance, liquidation prints, or exchange wallet flows here. So claims about a liquidation cascade, whale distribution, or a decisive spot-seller takeover would go beyond the evidence. Broad spot turnover and tight quoted spreads show the market is trading; they do not reveal aggressor direction. The fundamental tension is harder to dismiss. Solana has real activity: $1.62 billion in 24-hour DEX volume and $14.1 billion in stablecoins. But stablecoin balances are down 6.4% over 30 days, fees fell 42.5% to $16.1 million, and locked value fell 17.1% to $4.94 billion. At roughly $48.3 billion market capitalization, valuation remains demanding against current fees and protocol revenue. High transaction activity is not automatically durable value for SOL holders. Is usage broadening into sticky payments and financial activity, or is it mostly episodic trading that fades with market appetite? There are genuine adoption positives, but timing matters. Visa’s reported settlement use of Western Union’s Solana-based USDPT and DTCC’s plan for eligible tokenized securities in the second half of 2027 could support future usage. Neither announcement yet demonstrates material on-chain fees, SOL demand, or an immediate change in flows. Meanwhile, ETF outflows are a measurable near-term headwind. The key test is whether these institutional plans become live activity—and whether activity translates into stronger economics. My view is deliberately conditional: the oversold market can rebound, but the evidence available does not justify calling a bottom. A sustained hold above $80.45, followed by a volume-supported reclaim of $83.50–$85.84, would improve the short-term case; a decisive break lower would keep $76.70 and then $72.35–$70.58 relevant. What would change the broader picture? Persistent ETF inflows, improving fees and locked value, and spot-led advances rather than leverage-led squeezes. The unanswered questions are whether buyers will defend support, whether selling is mostly deleveraging or fresh distribution, and whether Solana’s institutional pipeline can produce measurable value capture before the market loses patience.#IMPACTbyTrade
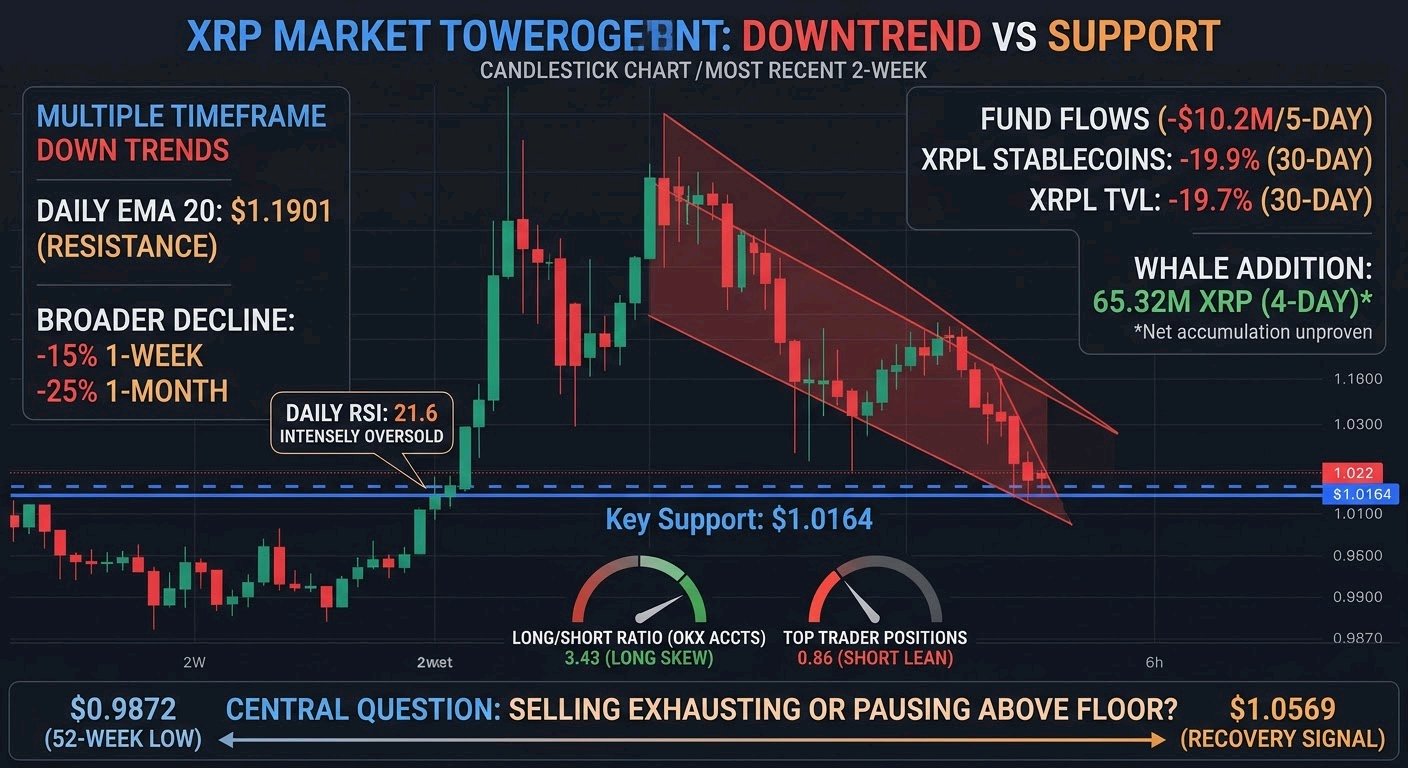
$XRPUSDT XRP is caught between a clear downtrend and a support level that has not yet broken. That distinction matters: the bearish case is stronger on the broader evidence, but a breakdown is not confirmed. At the latest snapshot, XRP was around $1.02, down 2.78% from the prior daily close. The question for the next few days to 2 weeks is whether selling can push it through $1.0164, or whether oversold conditions and buying near the lows produce a relief bounce. Verified market facts: The hourly, 4-hour, daily and weekly trends are down. XRP is below its shorter-term moving averages; the daily EMA20 is $1.1901, far above the current price. The last 6 closed hourly candles all finished above $1.0164. Price did wick to that level, then closed at $1.0274 before slipping to $1.0245. That is weak price action, but not a confirmed close below support. If $1.0164 fails, the next notable level is $0.9872, the 52-week low. The broader decline is substantial: XRP is down about 15% over 1 week and 25% over 1 month in the market snapshot. Daily RSI is 21.6; hourly RSI is about 29. These readings show intense selling and raise the chance of a reflex bounce. They do not tell us the decline is over. What would change the picture? A sustained recovery through $1.0569–$1.0654 would be a more meaningful sign than a single intraday bounce. A daily trend reversal would require much more. What may be driving the pressure: The reported US spot-fund flows were -$10.2M over 5 days, although the latest session recorded a modest $370K inflow. XRPL stablecoin supply fell 19.9% over 30 days, and value locked declined 19.7%. These are real headwinds to the near-term demand story, but they are not proof that ETF redemptions or XRPL activity directly caused each sell-off. Fees rose 23%, yet from only $42.3K over 30 days—too small, in my view, to offset the contraction in stablecoins and value locked. Whale activity is the main conflicting claim: a news report said large holders added 65.32M XRP over 4 days. But that figure does not establish net buying from outside wallets or withdrawals from exchanges. XRP fell sharply during the same period. Are these holders accumulating, moving tokens between wallets, or simply failing to absorb the available selling? The evidence provided cannot settle that. Futures and liquidity: Perpetual open interest is reported at $717M across 4 venues. The available venue-specific history is mixed: OKX open interest fell 8.7% over 7 days, then rose 5.8% in 24 hours. Funding is slightly positive overall at 0.003% per 8 hours, meaning longs pay shorts, but the rate is modest and Bybit funding is negative. OKX accounts skew long at 3.43, while top traders’ positions ratio is 0.86, a short lean. That split suggests vulnerability on both sides, not a clean crowded trade. We do not have reliable CVD, order-book imbalance, aggregate futures-volume changes or liquidation totals. So we cannot say whether spot sellers led, whether falling open interest reflects forced liquidations, or where a squeeze might occur. Reported spot turnover is $1.71B across many venues, but turnover alone does not reveal who was the aggressive buyer or seller. My read is bearish but conditional, not certain. Broad weakness, negative recent fund flows and declining XRPL liquidity argue against assuming the low is in. Yet support has held on hourly closes, and oversold momentum makes chasing the decline hazardous. I would watch for an hourly close below $1.0164, then whether price follows through toward $0.9872. If support holds and price reclaims $1.0569, the breakdown thesis weakens. The evidence still leaves one central question open: is selling pressure exhausting, or merely pausing above the floor?#IMPACTbyTrade
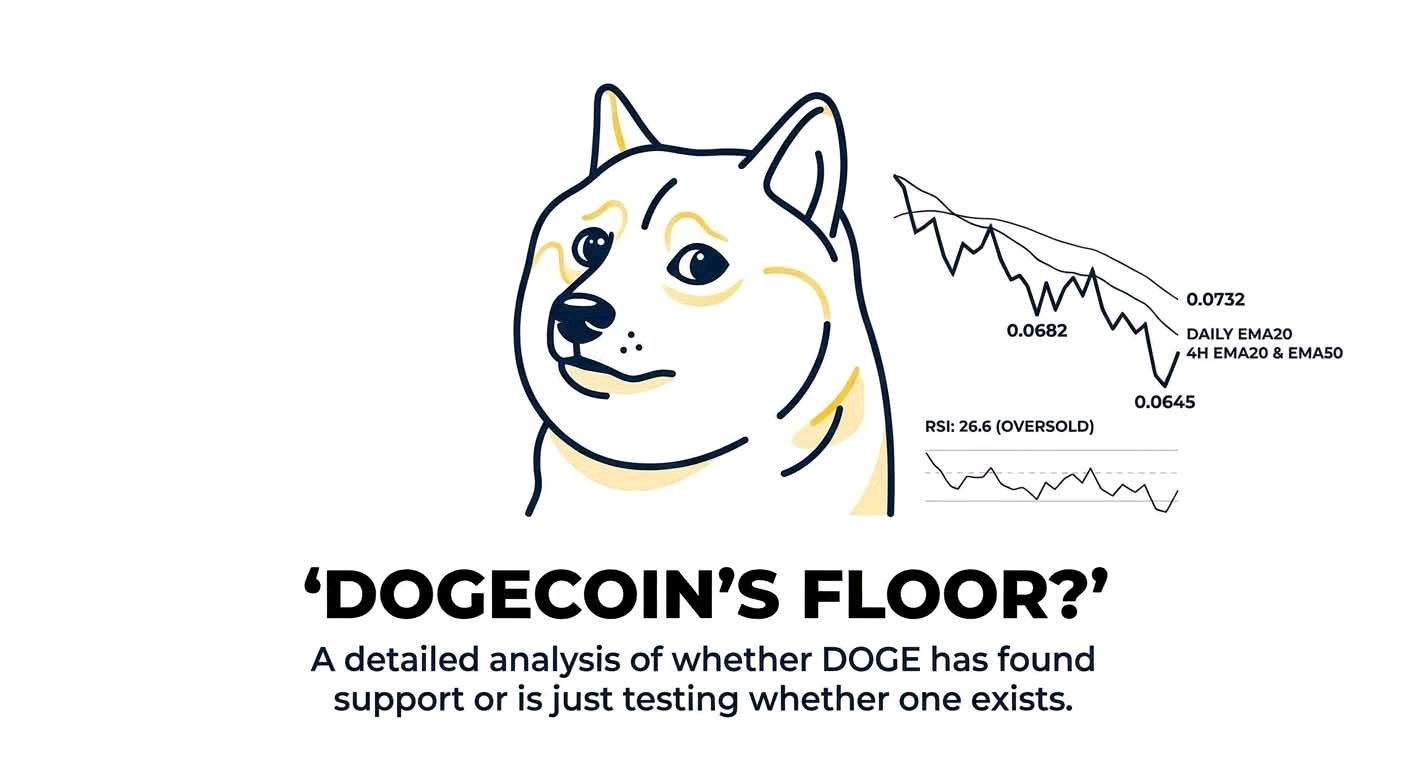
$DOGEUSDT looks less like a market that has found a floor than one testing whether a floor exists at all. The distinction matters. Price is near $0.0647 after falling 12.8% in 7 days and 23.5% in 30 days. That decline has happened alongside broad risk aversion—the total crypto market is down 5.2% over 24 hours and the fear-and-greed reading has dropped to 28 from 50 a week ago. But DOGE has been weaker than the market, so macro pressure alone may not explain the move. What is verified: The latest intraday low is about $0.0645, also the bottom of the recent 1H and daily ranges. DOGE is below declining moving averages on the 1H, 4H and daily charts. The daily EMA20 is around $0.0732; on the 4H chart, the EMA20 and EMA50 sit near $0.0682 and $0.0704. RSI is oversold—26.6 daily and 21.2 on the 1H—but that measures recent momentum, not whether buyers have returned. The latest candles show a sharp move down and only a small bounce. No confirmed reversal or successful support retest is visible. That makes $0.0645 the immediate test, not a proven support zone. If DOGE holds above it and starts making higher lows, the market may be absorbing selling. If it breaks and closes below, the current “potential base” interpretation weakens; the available data do not establish a reliable next support. Above price, $0.0675–$0.0689 is the first resistance area, followed by roughly $0.0696–$0.0717. Reclaiming those levels would matter more than a brief oversold bounce. A sustained move above $0.0732 would be a stronger sign that the daily trend is changing. The derivatives data are mixed. Tracked perpetual open interest is $376M across 4 venues, while broader venue coverage reports $929M across 83; these are different coverage sets, so they should not be combined. On OKX, open interest fell 9.2% over 7 days. That fits a possible reduction in leveraged exposure during the selloff, rather than fresh conviction building behind it. Funding is mildly negative, and dated futures basis is deeply negative at about -20.9% annualised. Those readings indicate weak futures demand, but they do not tell us whether shorts are initiating positions or longs are exiting. Nor do we have verified liquidation levels or a liquidation heatmap. It would be a mistake to assume a crowded short position means a squeeze is imminent. Positioning adds another wrinkle: OKX long/short accounts are near 5:1, yet top traders’ position ratio is 0.74. Account counts suggest many more long than short accounts, but the position ratio says larger traders may be tilted the other way. Which signal matters more? Without actual liquidation and order-flow data, neither gives a clean answer. Spot turnover is substantial at $867M across 63 venues, but 30% is concentrated on one venue. Turnover is not net buying; we lack spot CVD, order-book imbalance and reliable evidence of whale accumulation or exchange outflows. There is a possible catalyst, but it is still a claim to verify against delivery. DogeOS has been described as “very, very close” to launch, with more than 100 builders reportedly involved, but no date was given. That could create new utility; it has not yet demonstrated sustained DOGE demand. Reports also put spot ETF flows at zero from Oct. 14 to Nov. 10. DOGE’s entire 157B supply is already circulating, but issuance continues at roughly 5B coins a year. Long-term buyers still need to absorb that supply, and trading volume alone does not prove durable demand. Recent headlines also linked market weakness to inflation concerns; they establish a possible backdrop, not DOGE-specific causation. My read is cautious, not a call that DOGE must fall. The bullish case needs $0.0645 to hold, then a reclaim of resistance supported by spot buying and improving price structure. The bearish case is a decisive break below the low, especially if DOGE continues to underperform the broader market. The key questions are whether buyers actually defend support, whether futures positioning stabilises alongside spot demand, and whether DogeOS delivers measurable use rather than just anticipation.#IMPACTbyTrade
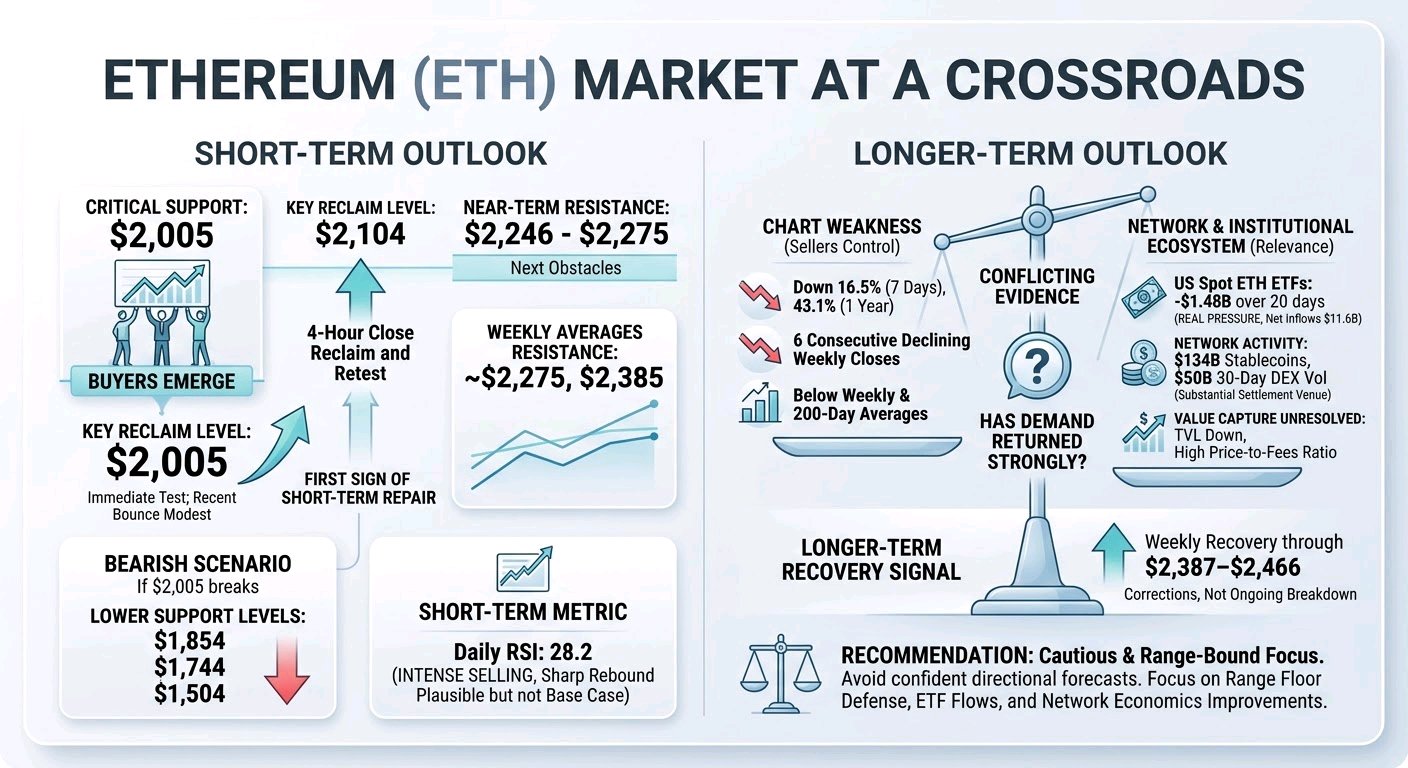
$ETHUSDT around $2,022 is a market caught between two different kinds of evidence: the chart says sellers still have control, while the network and institutional ecosystem say Ethereum remains relevant. Neither side has settled the question. For the next 6–12 months, I would focus less on whether ETH is “cheap” after its fall and more on whether demand returns strongly enough to defend the range floor. The immediate test is $2,005. ETH touched that area and bounced only modestly; the latest daily low was $2,013. That makes $2,005 more than a round number: it is the point where recent buyers have so far appeared. If price holds and then reclaims $2,104 on a 4-hour close, with a successful retest, the first sign of short-term repair would be in place. It would not prove a new uptrend. The next obstacles are around $2,246–$2,275, then the weekly averages at approximately $2,275 and $2,385. The broader chart remains weak. ETH is down 16.5% in 7 days and 43.1% over 1 year, with 6 consecutive declining weekly closes. Price is below both weekly averages and the 200-day average. Daily RSI is 28.2, which tells us selling has been intense; it does not tell us sellers are finished. My observation is that this creates room for a sharp rebound, but not yet a reason to treat one as the base case. If $2,005 breaks decisively, the next substantial support is near $1,854. Further down, weekly levels sit around $1,744 and $1,504. A move toward those levels would not be surprising in a weak market, but the available evidence does not establish that they must be reached. On the other hand, a weekly recovery through $2,387–$2,466 would matter because it would take ETH back above key resistance and make the recent decline look more like a correction than an ongoing breakdown. Positioning does not give a simple answer. Perpetual open interest is about $11.5B across the tracked venues, while OKX open interest fell 12.7% in 7 days. That decline suggests some leverage has been reduced during the selloff. Funding is still slightly positive at 0.004% per 8 hours, so longs continue to pay shorts. That is a modest headwind, not evidence of an extreme long crowded trade. OKX accounts lean long, while top traders’ positions lean short. These are partial snapshots, and there is no verified liquidation map or order-flow evidence here to show exactly where forced selling might be concentrated. I would avoid reading the open-interest decline as proof that selling pressure is exhausted. Spot participation is similarly hard to interpret from volume alone. Reported 24-hour spot volume is about $9.1B, but that does not reveal whether buyers are absorbing supply or simply trading into it. ETF flows offer a clearer near-term demand signal: US spot ETH funds lost $524M over 5 days and $1.48B over 20 days, including $145M on November 11. That is real pressure. Cumulative inflows remain about $11.6B, so institutional access and an existing investor base are established; what remains uncertain is whether those investors are still adding or now reducing exposure. Ethereum’s usage is meaningful, but value capture is the unresolved part. The chain has $134B in stablecoins and $50B of DEX volume over 30 days. Those figures support the case that Ethereum remains a substantial settlement venue. Yet TVL is down 13.6% in 30 days and 43.2% over 1 year; stablecoin balances also fell 7.6% in 30 days. Annual fees are $175M against a $247B market capitalization, implying a 1,037× price-to-fees ratio. Fees did rise 8.8% against the previous 30 days, but that small improvement has not overturned the larger picture. Does high activity eventually translate into stronger ETH demand and fee burning, or can usage grow without comparable value accruing to the token? The current figures do not answer that. There are constructive institutional developments: Deutsche Bank has launched custody for institutional clients, and Sygnum has opened an ETH-denominated fund targeting 8%–10% annual returns. These expand access, but they do not show how much new capital will arrive. BlackRock’s transfer of ETH to Coinbase Prime is also not, by itself, evidence of a sale. Near term, ETF flow direction and price response matter more than headlines. My view is balanced but cautious: a recovery is plausible, not confirmed. A hold above $2,005 followed by a reclaim of $2,104 would improve the short-term picture; sustained weekly strength above $2,387–$2,466, alongside improving ETF flows and network economics, would make the longer-term case more convincing. A decisive loss of $2,005 would put lower supports back in focus. Until one of those paths is confirmed, the range—not a confident directional forecast—is the most honest way to frame ETH.#IMPACTbyTrade
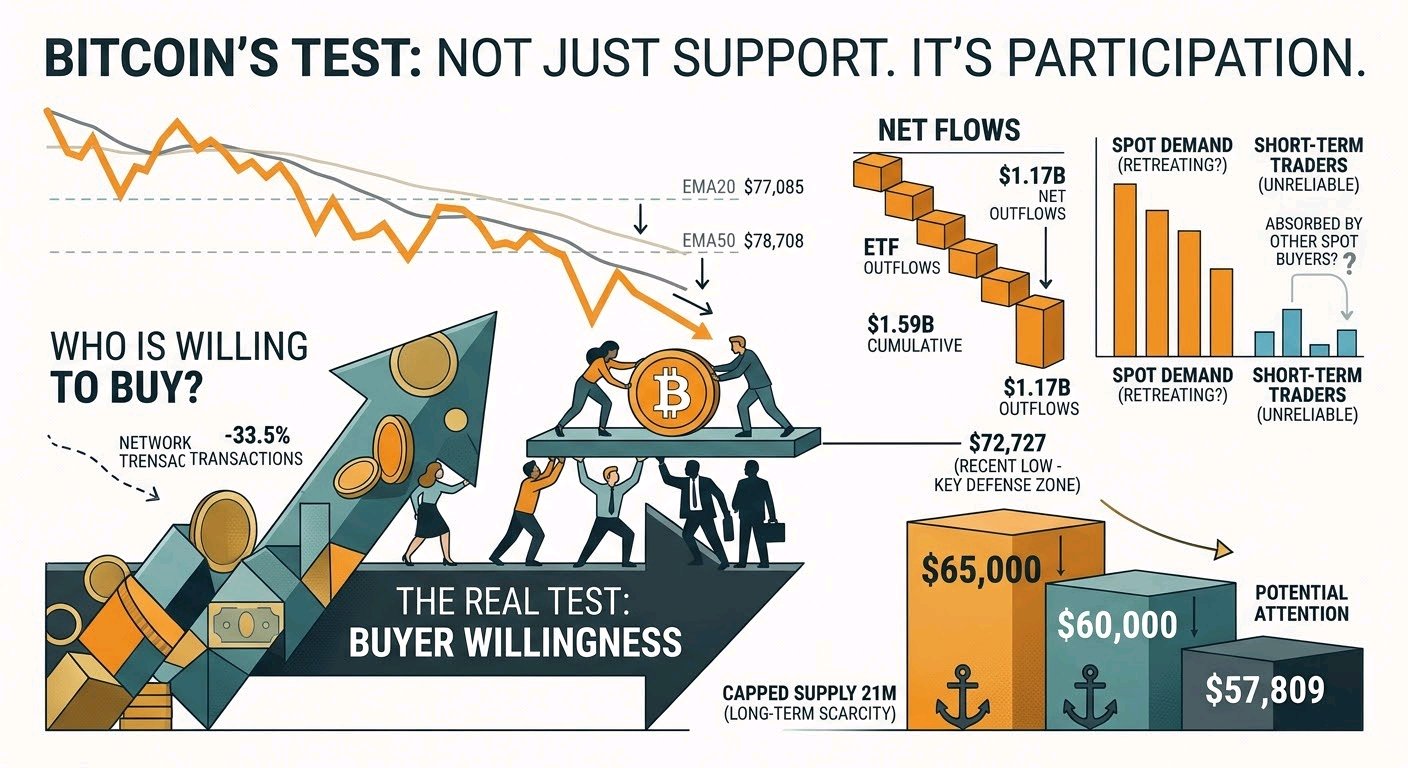
Bitcoin’s Test Is Not Just Support. It’s Who Is Willing to Buy. At about $73,800, Bitcoin is no longer asking whether it can produce a bounce. It is asking a more useful question: who is buying, and are they willing to keep buying when sellers press? That distinction matters. A price can rebound because short-term traders cover positions, yet still remain vulnerable if longer-term spot demand is retreating. The observable evidence is uncomfortable for the bulls. BTC is down 8.4% in 7 days, has closed lower for 6 consecutive weeks, and sits below its daily EMA20 near $77,085 and EMA50 near $78,708. On the weekly chart, it is below both key averages as well. Those levels do not predict the future, but they show that buyers have not yet repaired the trend. The question is not whether BTC can touch resistance; it is whether buyers can hold above it after the first wave of selling returns. The ETF figures make that test more demanding. US spot Bitcoin ETFs recorded $1.17B in net outflows over 5 days and $1.59B over 20 days, with outflows on 5 consecutive days. The cumulative $55.4B of inflows since 2024 tells us that the products once drew substantial demand. It does not tell us that investors are returning now. Are ETF redemptions being absorbed by other spot buyers? The available data do not establish that. Without clear evidence of stronger spot demand, a bounce alone cannot answer the question. That is why $72,727, the recent low, matters. It is the nearest visible test of buyers’ willingness to defend price—not a magic floor. BTC has traded near it and recovered, but that response has not carried price back above the key moving averages. A firm break below the low would shift attention to the longer-term support areas at $65,000, $60,000 and $57,809. A quick dip and recovery would tell a different story: sellers pushed through, but buyers absorbed the supply. The quality of the response matters as much as the level itself. For the recovery case, the first challenge is $76,000–$76,400, where weekly resistance and the weekly EMA20 converge. Next comes $82,842. Reclaiming either area would be more meaningful if accompanied by improving ETF flows and genuine spot buying. Why? Because rising prices without fresh spot demand can leave the market dependent on leveraged traders, who may leave quickly when momentum turns. Futures offer neither a clear alarm nor reassurance. Perpetual open interest was $18.9B across 4 venues, while OKX open interest was almost unchanged over 7 days, up 0.3%. Funding was mildly positive at +0.008% per 8 hours, so longs were paying shorts, but the rate was not extreme. Account positioning leaned long while top-trader positioning leaned short. That conflict makes it hard to call the market one-sided. And without verified liquidation totals, claims that a selloff is being driven by a cascade—or that a large liquidation wave is imminent—would go beyond the evidence. There are counterpoints to the demand weakness. A report described some whale accumulation through Nov. 9. But reported accumulation is not enough to call a broad shift: its scale, persistence and destination are unclear. Network transactions also fell 33.5% over 30 days. That signals lower activity, not proof of why BTC fell. Bitcoin’s capped supply of 21M remains a long-term feature, but scarcity does not guarantee short-term buying. So I would frame the market as a test of participation, not a contest between bullish and bearish slogans. The bearish case strengthens if BTC loses $72,727 and spot outflows continue. The recovery case gains credibility if buyers defend that low, flows improve, and price reclaims $76,000–$76,400 with follow-through. Until then, I see a market where sellers have the stronger evidence, but buyers have not yet given up the key nearby test. $BTCUSDT #IMPACTbyTrade
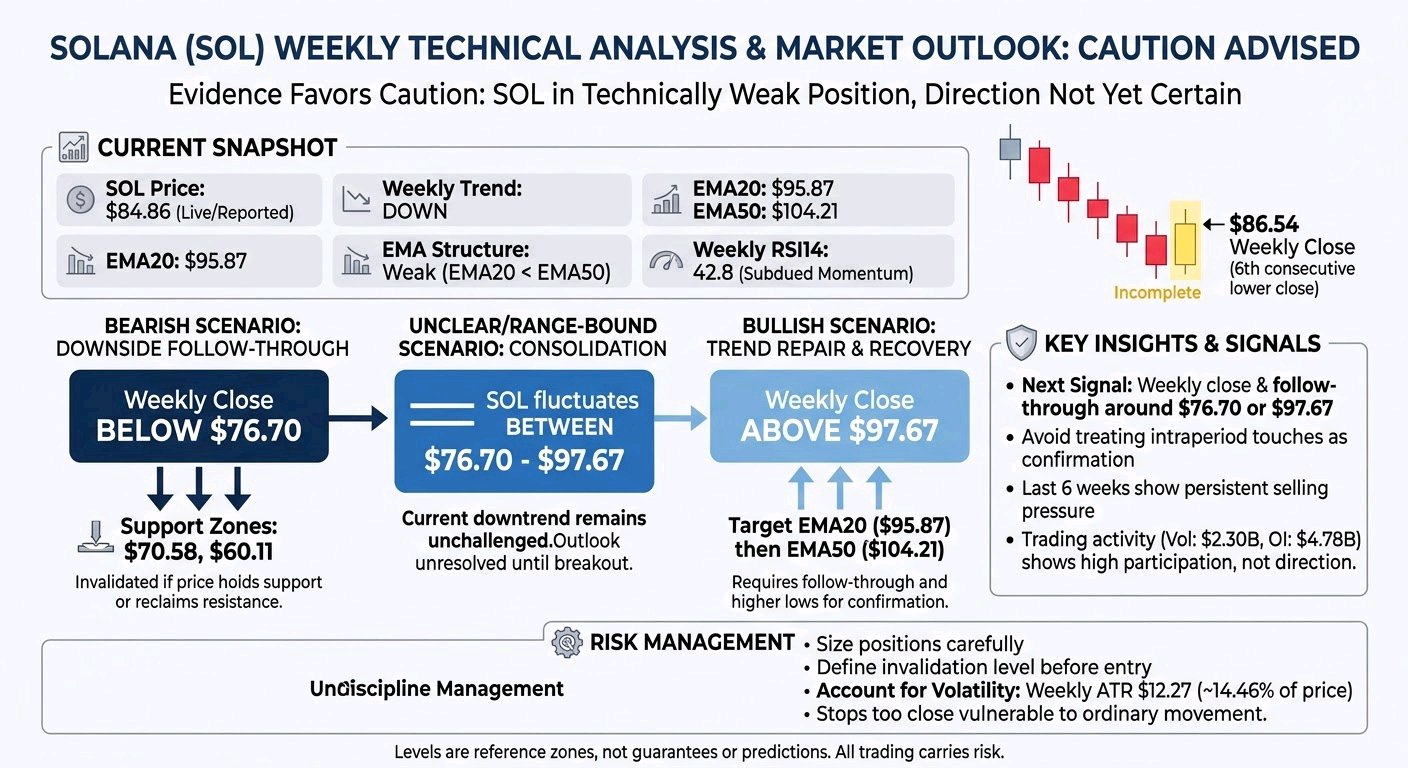
$SOLUSDT The weekly evidence still favors caution: SOL is in a technically weak position, but neither continued decline nor recovery is certain. The key distinction is between a price touching a level and closing above or below it—and then showing follow-through. A single move, especially while the weekly candle is still forming, is not enough to establish a breakout or a trend change. is around $84.86. The last 6 completed weekly candles closed progressively lower, from $121.60 to $86.54, and their highs also generally declined. The latest completed candle closed at $86.54, after reaching $98.16 and falling to $84.98. This sequence supports persistent selling pressure. It does not prove that selling will continue: a short run of candles cannot establish the next move, and the current weekly candle is incomplete. So far it has opened at $86.53, reached $88.46, and fallen as low as $81.23; its final close is not yet known. The broader weekly trend is classified as down. Price is below the weekly EMA20 ($95.87) and EMA50 ($104.21), with the shorter average below the longer one. The monthly trend classification is mixed, a reminder that weekly weakness does not settle the longer-term picture. Weekly RSI14 is 42.8, consistent with subdued momentum, but it is not by itself a reliable signal of either a reversal or further declines. The day’s reported range, $82.30–$85.42, is too short a window to change the weekly assessment. Bearish scenario: Further weakness would gain support if SOL closes a week below $76.70 and cannot reclaim that area. The next reference supports are $70.58 and $60.11. A sustained break below support would be evidence of downside follow-through, not proof that the next support must be reached. This scenario would be weakened if price holds above support and starts reclaiming resistance. A brief dip below a level followed by a close back above it would not, on its own, confirm a breakdown. Bullish scenario: The first meaningful test is a weekly close above $97.67, followed by a hold above that level. That would challenge the sequence of lower closes and place price back above the weekly EMA20, which is nearby. A subsequent reclaim of the EMA50 at $104.21 would provide stronger evidence of trend repair. This scenario would fail to gain confirmation if price is rejected near resistance or closes back below $97.67. Even a confirmed reclaim would not establish a long-term uptrend by itself; follow-through and higher weekly lows would matter. Unclear or range-bound scenario: SOL may hold between support near $76.70 and resistance near $97.67 without resolving direction. In that case, price could fluctuate while the current downtrend remains unchallenged and no new breakdown is confirmed. Repeated closes inside that range would leave the outlook unresolved. A move outside it would matter more if a weekly close and subsequent price action supported the break rather than quickly reversing it. Trading activity gives context, not direction. Reported 24-hour spot volume is $2.30B across 65 venues, while perpetual open interest is $4.78B. These figures show substantial activity and leverage exposure; without comparable historical volume or evidence of positioning shifts, they do not establish accumulation, selling pressure, or the likely direction of a move. Nor do they explain why the price has moved. The next important signal is therefore a weekly close and follow-through around $76.70 on the downside or $97.67 on the upside. Until that evidence arrives, avoid treating an intraperiod touch as confirmation. For risk management, size any position so that a stop-out is tolerable, define the invalidation level before entry, and account for volatility: weekly ATR is $12.27, about 14.46% of the current price. A stop placed too close may be vulnerable to ordinary price movement; a wider stop requires a smaller position. These levels are reference zones, not guaranteed floors, ceilings, or predictions.#IMPACTbyTrade
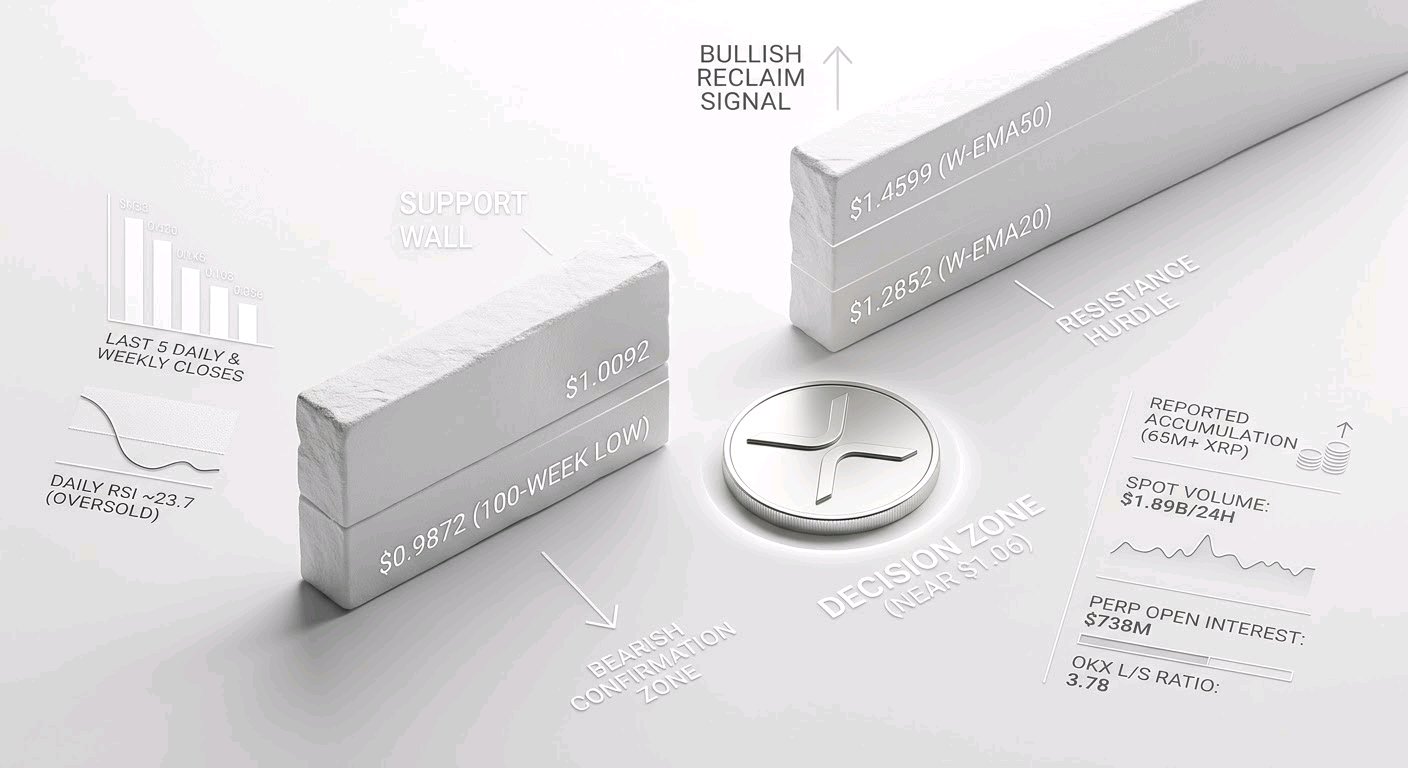
$XRPUSDT is not a clean “buy the dip” story, but neither is it a confirmed breakdown. The useful way to frame it is as a decision zone: the price is near important support, while the trend and several measures of market demand remain weak. A trader does not need to guess which side wins; the job is to define what evidence would change the view and size risk so being wrong is survivable. As of November 11, 2026, XRP is around $1.06. The last 6 completed daily candles closed progressively lower, from $1.2071 to $1.0565; the last 6 completed weekly candles also declined, from $1.5206 to $1.1132. Price sits below weekly EMA20 at $1.2852 and EMA50 at $1.4599. This is evidence of an established downtrend, not proof that it will continue indefinitely. Daily RSI is 23.7, showing weak momentum and a potentially stretched short-term move. It can accompany a bounce, but it cannot identify a bottom on its own. The immediate area to watch is weekly support at $1.0092, followed by the previous 100-week low at $0.9872. These levels are reference points, not guaranteed floors. A completed weekly close below $0.9872 would make the breakdown case more credible; a brief intraday dip would be less conclusive. On the upside, a weekly reclaim of $1.2852 would be the first meaningful challenge to the bearish structure. The next moving-average hurdle is $1.4599. Neither a single green candle nor a touch of resistance is enough to establish a trend change. The bearish case is the clearest current chart reading: lower closes, price below both weekly averages, and a market environment showing reduced risk appetite. It strengthens if XRP closes a week below $0.9872, particularly if spot selling volume rises and the price cannot quickly recover. It weakens if support holds through a retest and price begins making higher daily lows, then reclaims $1.2852. Volume matters because a price move with no evidence of increased participation is less persuasive; however, the supplied volume snapshot is only $1.89 billion across 72 venues in 24 hours. It does not give candle-by-candle buyer-versus-seller activity, so it cannot confirm either a breakdown or a reversal. The bullish case is conditional rather than imaginary. XRP is close to its recent low, the daily RSI is deeply depressed, and reports say large holders accumulated 65.32 million XRP over 4 days. Those facts leave room for a countertrend recovery. A stronger bullish signal would be support holding, improving daily structure, and a weekly close above $1.2852 with sustained spot volume. The bull case fails if $0.9872 gives way and price remains below it, or if an apparent bounce repeatedly stalls beneath the weekly EMA20. Oversold conditions and reported accumulation are not substitutes for price confirmation. The unclear case is also plausible: XRP may stay near support, swing sharply in both directions and offer no reliable trend signal. That would fit the tension between weak weekly momentum and a low RSI, as well as the mixed monthly trend. In that situation, waiting is a valid decision. A trader who must act could reduce position size, avoid adding simply because the price looks cheap, and set an invalidation point before entering. Futures positioning adds a caution, not a forecast. Perpetual open interest is $738 million across 4 venues; the supplied decline is for OKX only, where open interest fell 19.7% over 7 days. Funding is positive at a weighted 0.009% per 8 hours, meaning longs pay shorts. That suggests long exposure remains present and could be vulnerable if price falls, but it does not prove a squeeze is coming. OKX’s long/short account ratio is 3.78, while top traders’ position ratio is 0.86—a reminder that account counts and larger positions can tell different stories. Reliable liquidation levels and market-wide weekly open-interest change are not available, so claims about forced selling would go beyond the evidence. Fundamentals offer both catalysts and unresolved questions. XRP’s reported market capitalization is $66.9 billion, against $284,000 in annual fees and protocol revenue; the data therefore does not demonstrate that network activity currently captures meaningful value for token holders. Circulating supply is 63.5 billion of 100 billion, leaving 36.5 billion unissued. The available figures do not show how much new supply will enter circulation during the next year, so the supply risk is real but its near-term effect cannot be quantified. The latest news is mixed. XRPL lending and single-asset-vault amendments were reported as approaching the validator voting threshold, but approval, launch and real usage are not confirmed. Payments volume reportedly rose 207.4% to 1.16 billion XRP on November 9; one day of activity does not establish lasting demand for XRP. ETF flows reached about $1.06 billion cumulatively, but#IMPACTbyTrade