Michael Leo
2623いいね0シェア785ファン1218フォロー
on-chain analyst crypto lover
on-chain analyst crypto lover
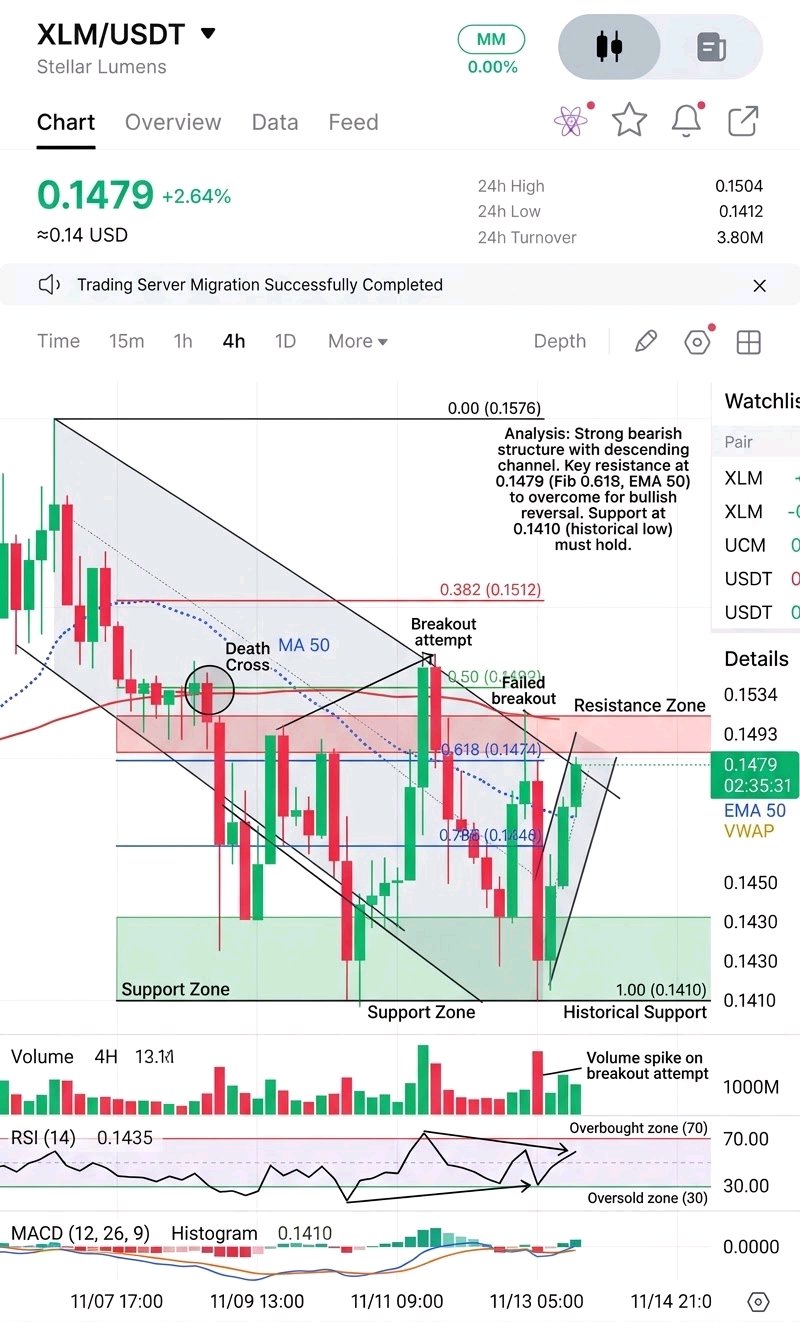
$XLMUSDT Stellar (XLM) は短期的市場構造において著しい改善を見せており、$0.1412付近で買い手が防衛したことで再び買いが優勢となっています。 1時間足チャートでは、価格は直近の下落から回復し、$0.1484のレジスタンスエリアを奪還しました。さらに重要な点として、XLMは移動平均リボンの上に戻っており、短期的なモメンタムが買い手優位にシフトしていることを示唆しています。 テクニカル分析 強気モメンタム: MACDがプラス圏に転じており、回復シナリオを裏付けています。パラボリックSARは$0.1413付近で価格の下に位置しており、短期的な全体セットアップは建設的です。 買われすぎの警告: RSIは73.31付近で推移しており、価格は$0.1506付近のボリンジャーバンド上限に接近しています。これは買い手の勢いが強いことを示していますが、一時的な調整の可能性も排除できません。 重要なサポート: $0.1463付近のEMAクラスターは、現在注目すべき重要なエリアです。このゾーンを維持できれば、さらなる上昇に向けた強固な基盤を構築するのに役立つでしょう。 私のトレーディング戦略 私は急騰を追いかけるつもりはありません。優先順位は、既存の利益を守り、価格が次の方向性を確定させるのを見守ることです。 既存のポジションについては、XLMが奪還した構造を維持し、直近のブレイクアウトエリアの上で価格が定着できるか注視しています。 注視すべき重要レベル - レジスタンス: $0.1504–$0.1506 - 上方目標: $0.1506を超える確実なブレイクアウト - サポート: $0.1463 - 下方への主要な無効ライン: $0.1380 リスク管理 $0.1380を下回る動きが続けば、現在の強気構造の見通しは無効となります。それまでは、サポートでの反応を監視し、さらなるエクスポージャーを検討する前に確証を待ちます。 セットアップは依然として建設的ですが、次の動きは買い手が奪還したレジスタンスを永続的なサポートに変えられるかどうかにかかっています。 興奮ではなく、確証に基づいてトレードしましょう。 #WSOTあなたのAI取引を見せて10USDTを獲得
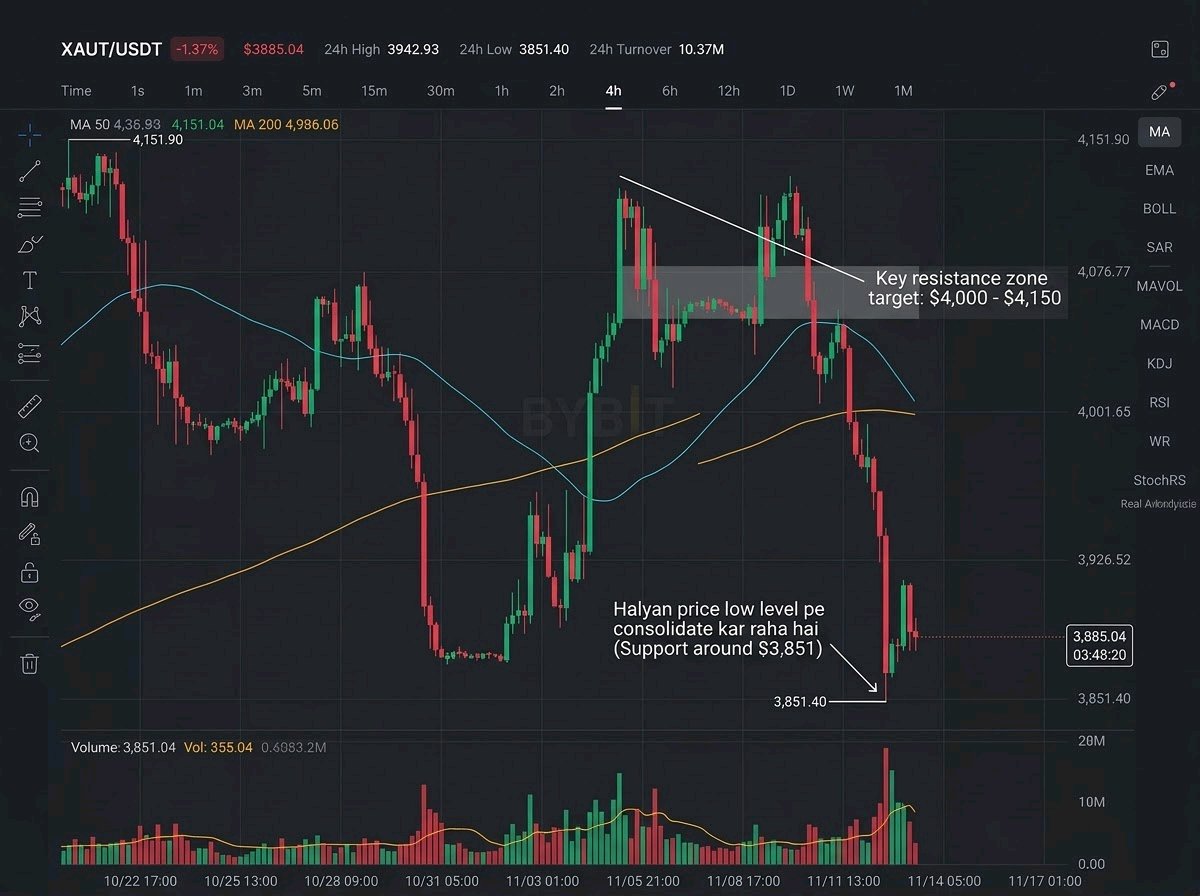
$XAUTUSDT USDT can sustain this v-shaped relief bounce to reverse the aggressive intraday sell-off, asset has moved beyond its simple safe haven identity, introducing intense volatility and complex trading dynamics however, token is still trading well below its recent local highs, creating a clear gap between macro adoption and immediate chart performance XAUT recently traded near $3,894.11, with a 24-hour turnover volume around 10.00M. Its latest reported 24-hour range is $3,851.40-$3,950.90. The $3,884 area, aligning with the 0.0 Fibonacci level, is the immediate support zone, while the $3,925 to $3,949 area is first major recovery resistance sustained reclaim of $3,950 would provide stronger evidence that buyers are returning. The broader structure remains weak after a steep decline of nearly 6% from $4,130.11 peak technical development worth watching is the underlying momentum shift on the hourly chart MACD is printing a bullish crossover with the histogram flipping green above zero. Meanwhile, the RSI has bounced sharply from oversold territory and is now hovering near the neutral 50 level these figures demonstrate localized capitulation and a potential trend reversal, but a technical bounce does not automatically translate into a full macro recovery important question is how much real spot demand actually requires XAUT at these discounted levels Market structure provides another important angle, especially regarding the projected path chart outlines a clear trajectory targeting the upper Fibonacci extensions, specifically the 4.236 level at $4,055 owever, price action is still suppressed below the EMA50 at $3,935 and the EMA200 at $4,001. Supply dynamics and physical backing also deserve attention, though short-term price action is currently dictated by derivative traders rather than physical accumulation liquidity is another concern, recent volume spikes confirm that market makers are highly active, making XAUT vulnerable to sharp whipsaws when buying or selling activity changes would focus on actual spot participation above the moving averages rather than assuming that a simple technical indicator crossover alone can create a sustained rally Key figures: $3,894.11 current price area $3,950.90 24h high $3,851.40 24h low $3,884.80 immediate support $3,925.07 first resistance $3,949.96 secondary resistance $4,055.41 macro target EMA50 at $3,935.65 EMA200 at $4,001.20 10.00M 24h turnover volume Bullish confirmation, reclaim $3,925.07 and hold above the EMA50 at $3,935.65 with stronger spot volume that would put the $3,949.96 and $3,990.24 levels in focus, with further recovery possible toward the $4,055.41 target Bearish confirmation, lose $3,884.80 and fail to recover it, would expose the recent low of $3,851.40, followed by lower price discovery if selling accelerates and liquidity remains weak Tether Gold has experienced a violent technical breakdown followed by a sharp relief bounce, but the market still needs evidence that this momentum is sustainable decisive signal is whether real ecosystem activity translates into stronger spot buying and whether buyers can establish acceptance above the EMA50 until then, projected move toward $4,055 remains a #WSOTShowYourAITradeToEarn10USDT #USPPITestsTheHigherForLongerTrade
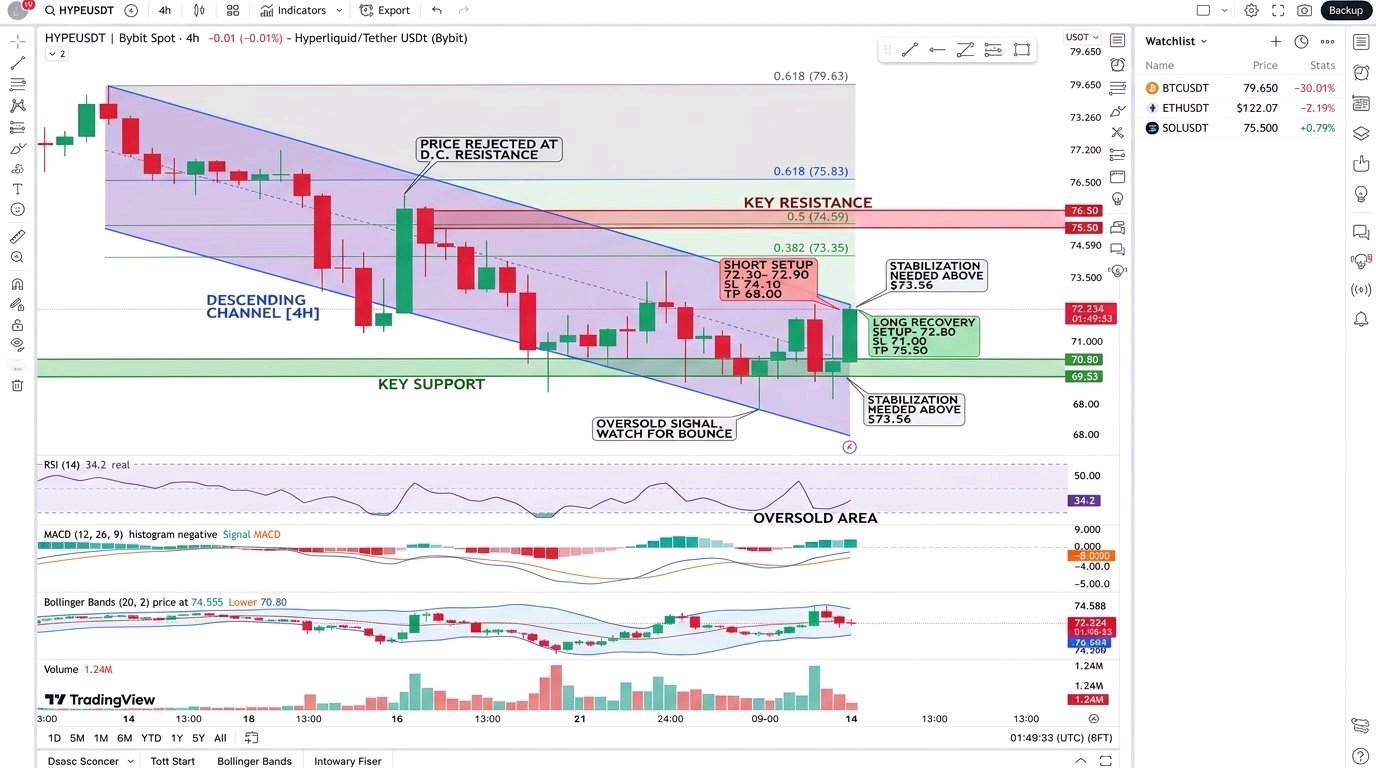
HYPEの週足構造が大規模な回復の可能性を示唆 $HYPEUSDTは重要なゾーンに近づいており、次の週足の動きが広範な市場トレンドの方向性を決定づける可能性があります。 短期的チャートには依然として弱さが見られますが、上位足の構造は、引き続き慎重ながらも強気でいる根拠を与えてくれています。 【全体像】 HYPEは以前、約20ドルから75ドル近辺まで上昇した後、調整に入りました。52ドル付近で買いが入り、その後の回復で価格は98ドル付近の新たな高値まで押し上げられました。 現在、市場は再び調整局面を迎えており、直近の週足安値は69.45ドルに達しています。 重要なのは、この領域が新たな高値切り上げ(Higher Low)となるかどうかです。 買い手がこのエリアを守り切ることができれば、短期的なモメンタムが弱気であっても、HYPEは広範な強気構造を維持できる可能性があります。ただし、その確認は週足の終値次第となります。 【注目すべき主要なレジスタンスレベル】 - 78.31ドル – 最初のレジスタンスおよび回復のチェックポイント。 - 82ドル~87ドル – 主要な供給ゾーン。 - 95ドル~98ドル – 以前の高値であり、主要なブレイクアウトの壁。 98ドルを明確に上抜け、その後のリテストが成功すれば、次の拡大ゾーンへの扉が開かれる可能性があります。 【私の長期的な価格予測】 <escape>$115–$124</escape> 基準価格71.82ドルから見ると、これは約60~73%の上昇ポテンシャルを意味します。 これは上位足の予測であり、即座のトレードターゲットではありません。まずは買い手がレジスタンスを奪還し、ブレイクアウト構造を確定させる必要があります。 【トレード設定 – 短期的な視点】 前回の4時間足ロングセットアップ: EP(エントリー価格): 72.176ドル TP(利確価格): 88.798ドル SL(損切り価格): 68.420ドル リスクリワード比: 約4.43:1 この短期セットアップは、週足の強気テーゼとは切り離されたものです。長期的なターゲットがあるからといって、短期的な損切り(ストップロス)を無視する理由にはなりません。 【リスク管理と無効化条件】 - 65ドル~70ドル:重要な週足回復ゾーン。 - 65ドル割れ:回復構造の脆弱性が高まる。 - 52ドル付近:この以前の主要なスイング安値を割り込むと、高値切り上げのテーゼが大きく損なわれる。 【私のトレードの見解】 週足の構造が大幅な回復に向けた準備をしている可能性があるため、HYPEを注視しています。 しかし、期待ではなく確認が必要です。 まず、買い手がレジスタンスを奪還しなければなりません。そして市場が、ブレイクアウトが維持できることを証明する必要があります。 120ドルへの上昇の可能性は刺激的ですが、まずは資本を守り、現在のトレード構造を尊重することが先決です。 より大きなトレンドは大きなチャンスをもたらすかもしれませんが、エントリーの質を決めるのは忍耐強さです。 #HYPEUSDT #WSOT2026 #米国のインフレ率は高止まりし、利上げ観測が高まる
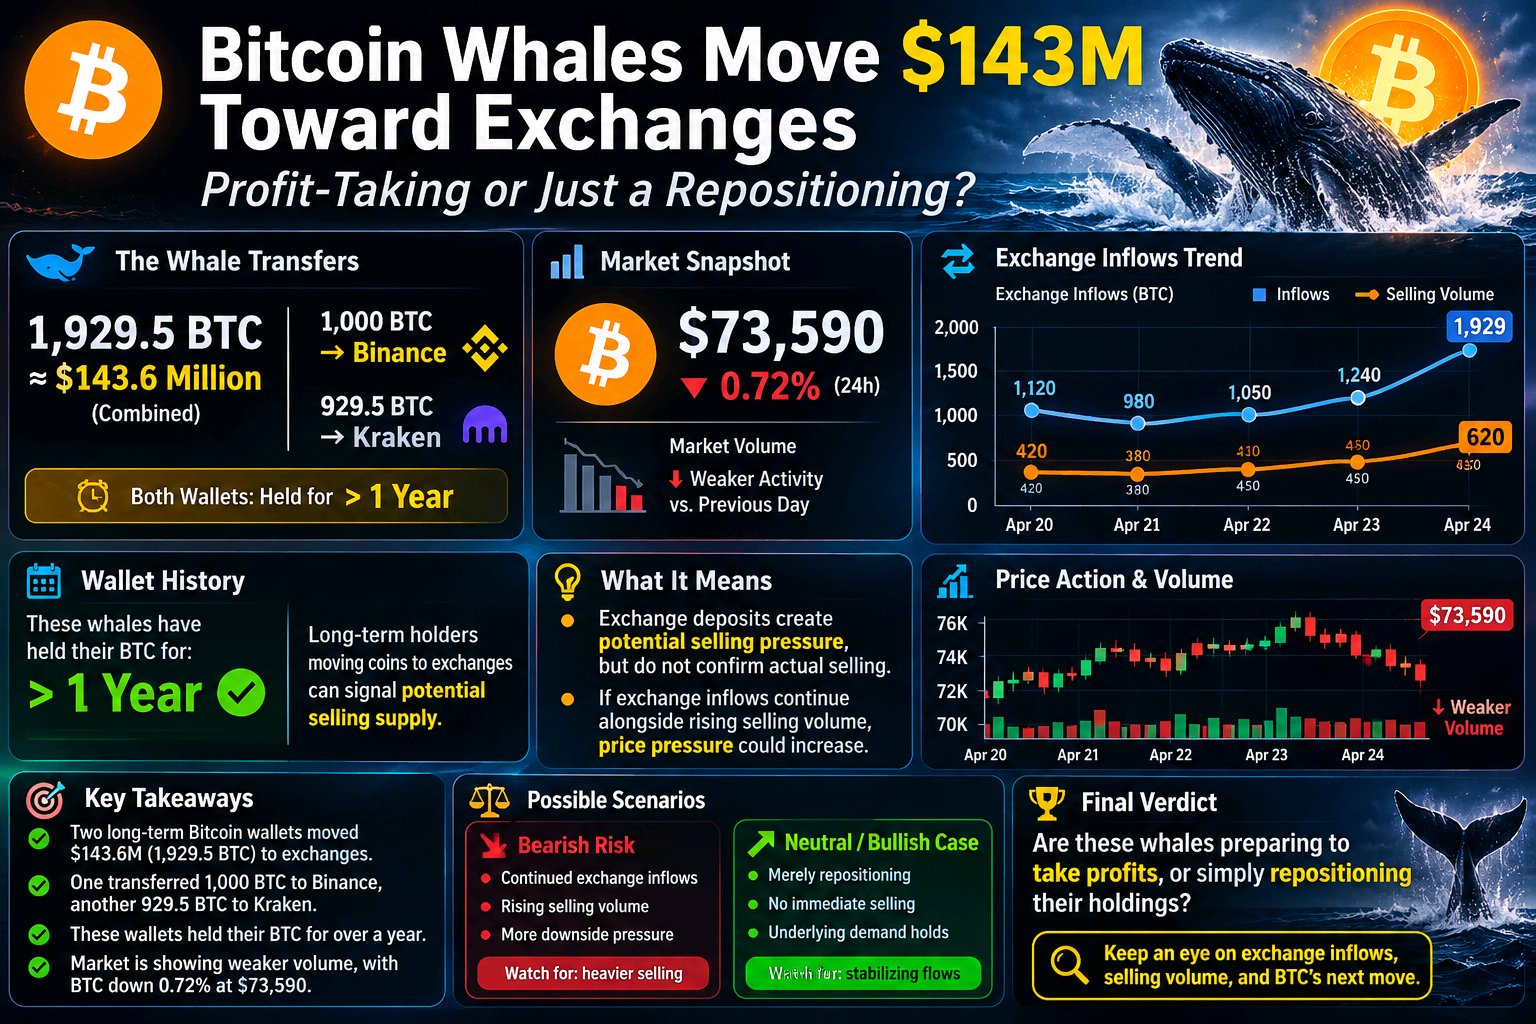
ビットコインのクジラ(大口投資家)、1億4300万ドルを取引所へ送金
$BTCUSDT クジラたちが注目すべき動きを見せています。 2つの長期保有ビットコインウォレットが、合計1,929.5 BTC(約1億4,360万ドル相当)を中央集権型取引所に送金しました。そのうち1つは1,000 BTCをBinanceへ、もう1つは929.5 BTCをKrakenへ送金しています。 一方、ビットコインは73,590ドル前後で取引されており、24時間比で約0.72%下落しました。市場の出来高も前日と比べて低調な動きを見せています。 見落とされがちなポイントですが、これらのウォレットは1年以上ビットコインを保有していました。取引所への入金は売り圧力を生む可能性がありますが、実際に売却されたかどうかは確定していません。 取引所への流入が続き、売り出来高が増加すれば、さらなる圧力が高まる可能性があります。 これらのクジラは利益確定の準備をしているのでしょうか、それとも単に保有資産を移動させているだけなのでしょうか? #WSOT2026 #サンディスクが8対1の株式分割を発表 #ドイチェ銀行、デジタル資産カストディを開始
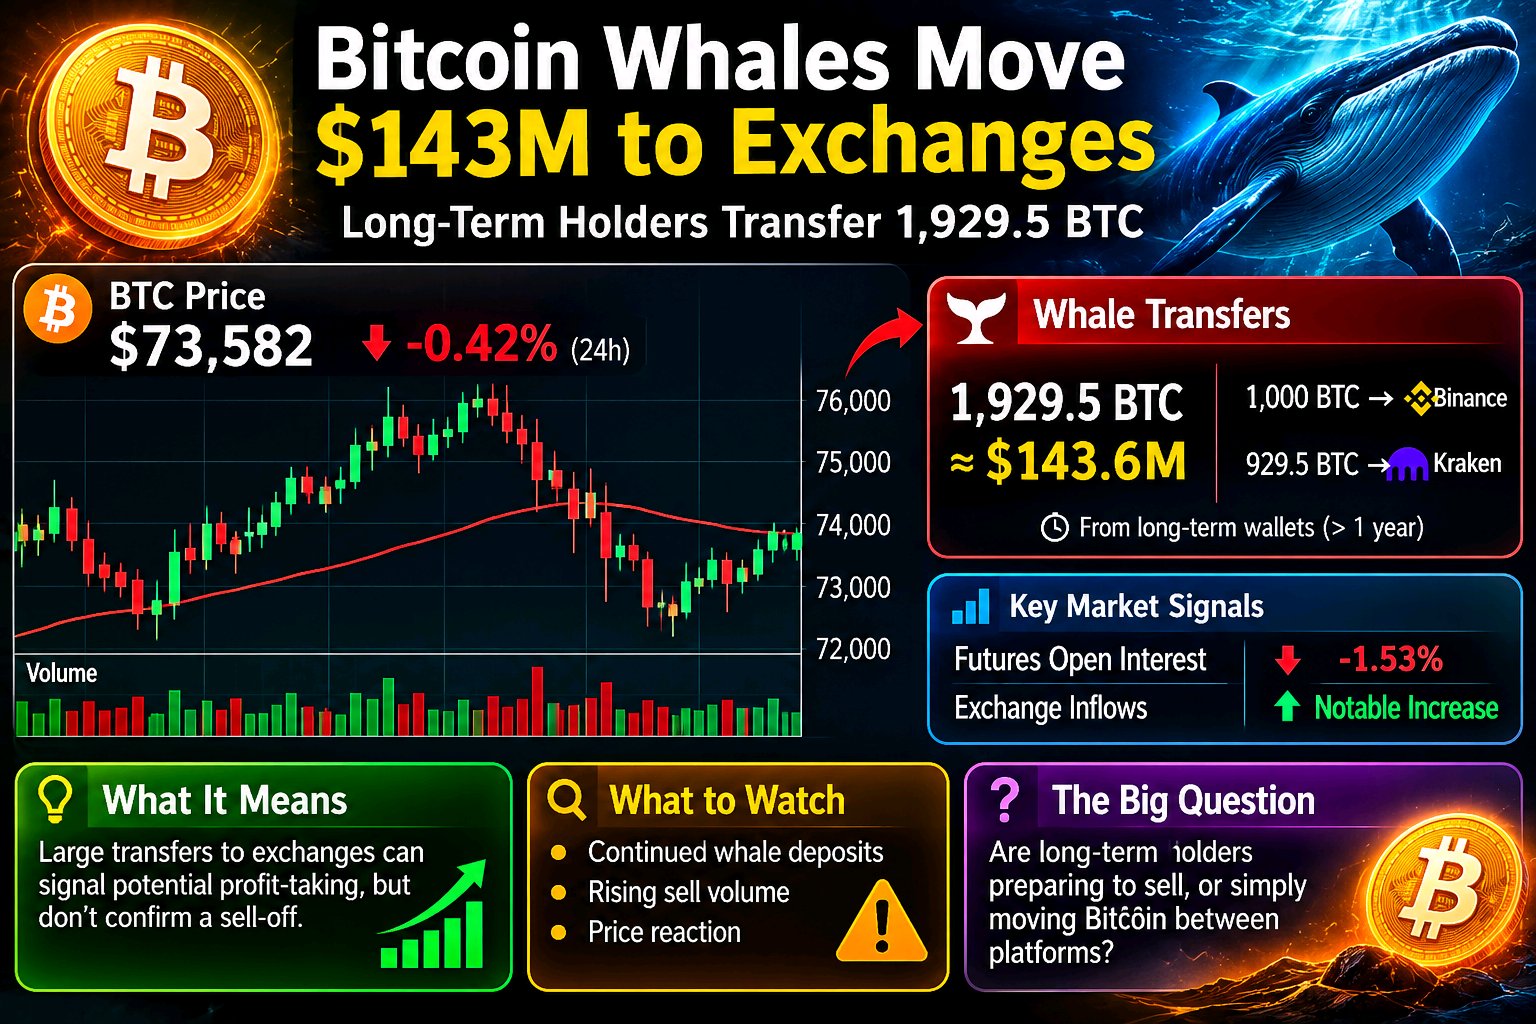
Bitcoin Whales Move $143M to Exchanges
$BTCUSDT Bitcoin whales are making moves, and the timing deserves attention. On November 12, two long-term wallets transferred a combined 1,929.5 BTC worth approximately $143.6 million to major exchanges. One wallet deposited 1,000 BTC, while another moved 929.5 BTC. The overlooked detail: Both wallets reportedly held their Bitcoin for more than a year. These transfers could indicate potential profit-taking, although exchange deposits do not automatically mean selling. Meanwhile, BTC traded near $73,582, down approximately 0.42% over 24 hours, while futures open interest declined around 1.53%. What to watch: Continued whale deposits alongside rising sell volume could strengthen bearish pressure. A slowdown in inflows may reduce that concern. Are long-term holders preparing to sell, or simply moving Bitcoin between platforms? #SanDiskAnnounces8For1StockSplit #USInflationRunsHotAndRateHikeBetsRise #WSOT2026 #BitcoinHitsTwoMonthLowAfterUSMidterms
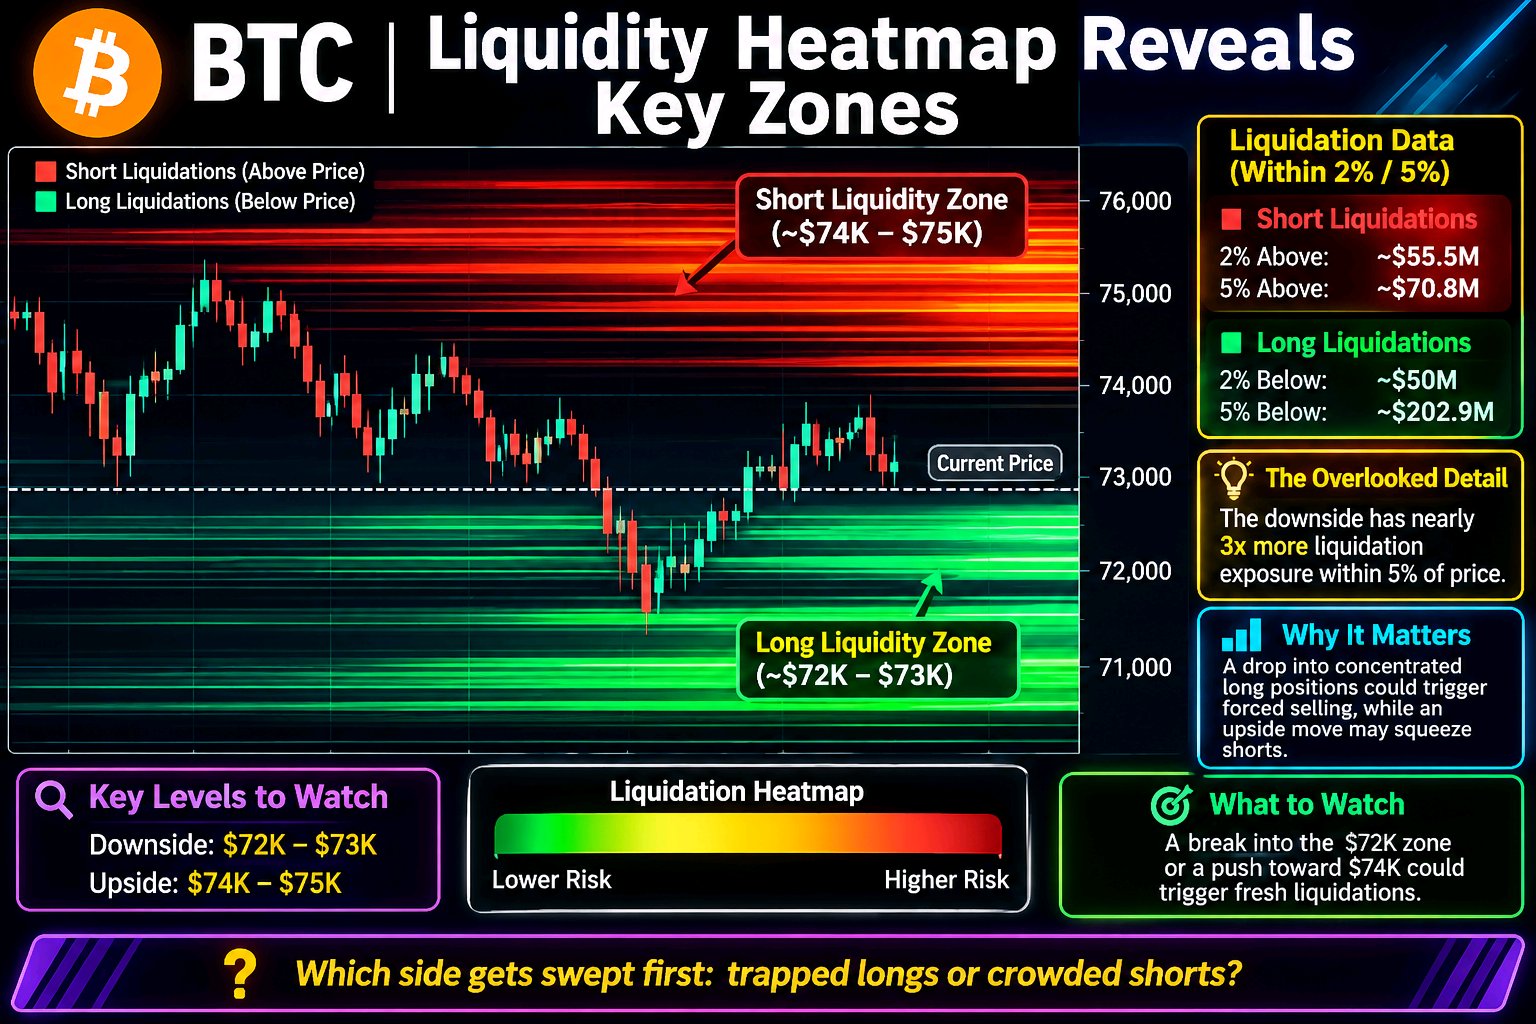
BTC Liquidity Clusters Reveal Two Key Zones
$BTCUSDT Bitcoin is approaching a liquidity battle on both sides, but the downside carries a much larger pool of potential liquidations. Market Observation — November 12 Around 05:26 UTC, BTC liquidation data showed: - Long liquidations within 2% below price: approximately $50M. - Short liquidations within 2% above price: approximately $55.5M. - Long liquidations within 5% below: approximately $202.9M. - Short liquidations within 5% above: approximately $70.8M. The Overlooked Detail The downside has nearly three times the estimated liquidation exposure within 5% of price. Why It Matters A drop into concentrated long positions could trigger forced selling and accelerate volatility. Meanwhile, an upside move could squeeze shorts near current levels. What to Watch Watch the $72K–$73K downside area and nearby $74K–$75K upside liquidity. These are estimated liquidation zones, not guaranteed price targets. Which side gets swept first: trapped longs or crowded shorts? #NovUSCPIWatch #AnthropicIPOTestsTheAIBoom #USPayrollsAndRateDecisionsDriveMacroWeek
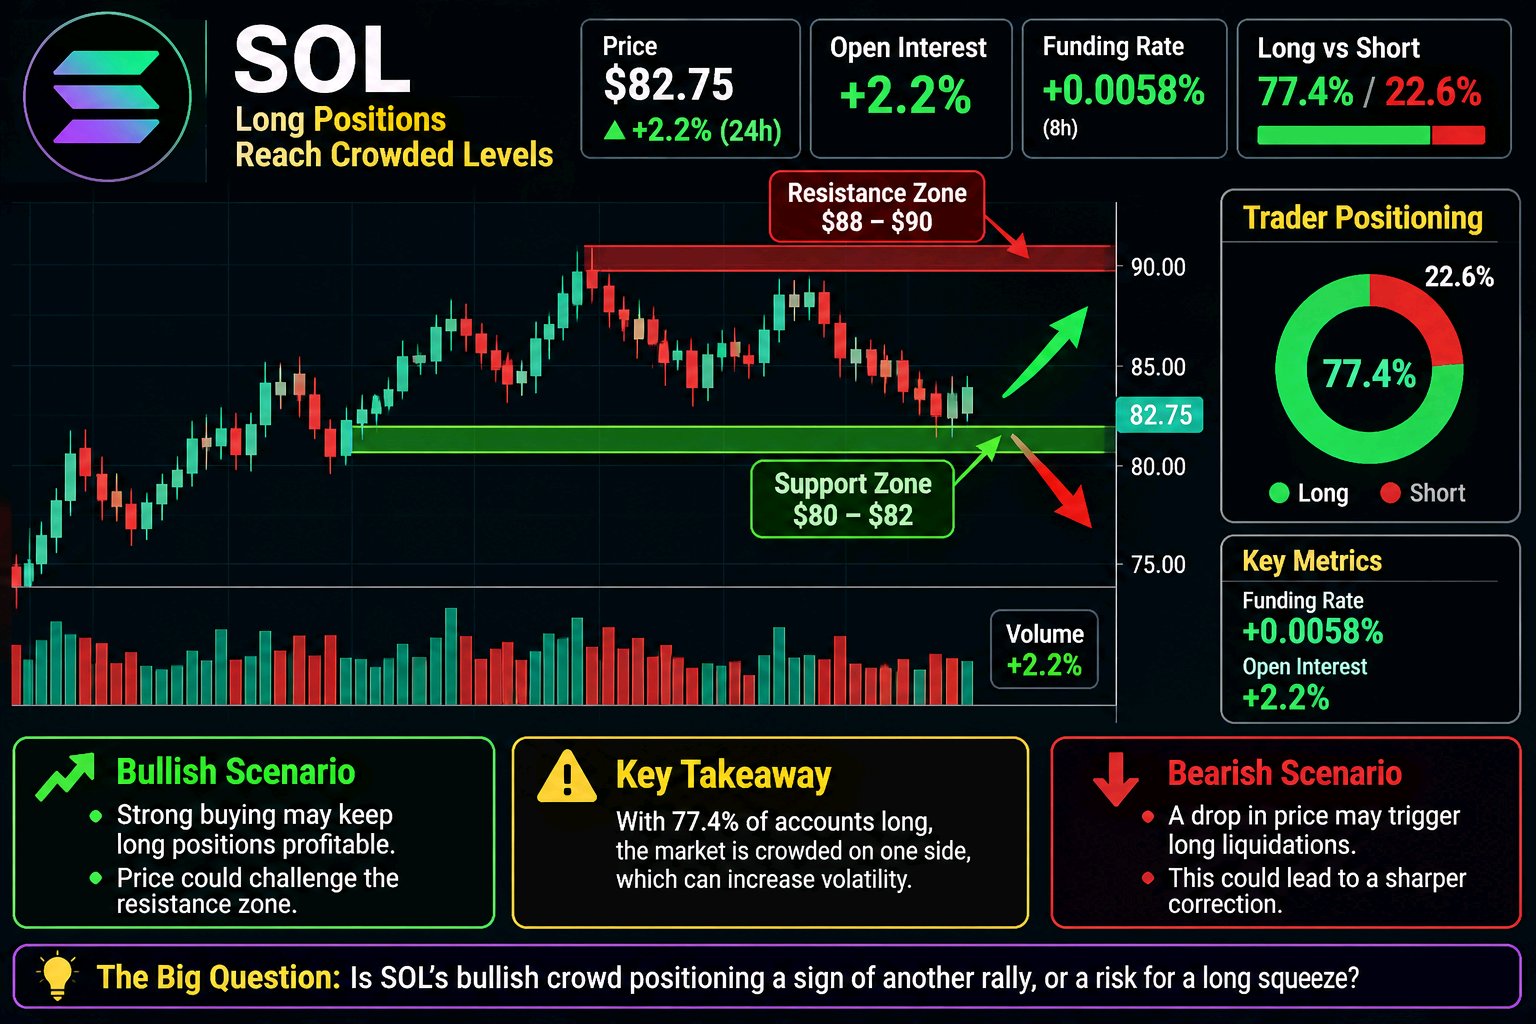
SOL Long Positions Reach Crowded Levels
$SOLUSDT Solana traders are heavily leaning toward the bullish side, but this positioning could become a risk if momentum reverses. On November 11, SOL traded near $82.75, while approximately 77.4% of tracked futures accounts held long positions and only 22.6% were short. Funding remained positive at +0.0058% per 8 hours, while Open Interest increased approximately 2.2% over 24 hours. The Overlooked Detail Nearly 4 out of 5 tracked accounts are positioned for upside. This imbalance suggests that bullish expectations are becoming crowded. Why It Matters If SOL loses momentum, overleveraged longs could face liquidations, potentially accelerating selling pressure. Key Signals to Watch - Long positioning: 77.4% - Short positioning: 22.6% - Funding Rate: +0.0058% - Open Interest: +2.2% - Reference Price: $82.75 Bullish Scenario: Sustained buying and rising price could reward existing long positions. Bearish Scenario: Weak price action combined with long liquidations could trigger a sharper correction. Is SOL's bullish crowd positioning for another rally, or becoming vulnerable to a long squeeze? Figures reflect the November 11 market observation, not independently verified live updates. #AnthropicIPOTestsTheAIBoom #NovUSCPIWatch
AGTのオープンインタレストが347%急騰!
#BybitAI進化中 $AGTは、レバレッジ取引の活発化に伴い、投機的な注目を大きく集めています。 AGTは24時間で約193%の上昇を記録し、建玉(OI)は347%近く急増して約6,700万ドルに達しました。 **重要なポイント:** 建玉(OI)が価格よりも大幅に速いペースで上昇しています。これは、積極的な新規レバレッジポジションが市場に参入していることを示唆しています。 一方で、約230万ドル規模のショートの強制決済が発生しており、弱気派のトレーダーが大きな圧力にさらされていることがわかります。 **なぜ重要なのか:** 価格とOIの上昇は、市場参加者の拡大を示唆しています。しかし、8時間ごとの資金調達率(ファンディングレート)が0.13%付近まで上昇していることは、ロングポジションが過熱している可能性を示しています。 **注目点:** 出来高を伴って価格が上昇し続ければ、強気モメンタムは維持される可能性があります。しかし、OIが減少する中で価格が反転すれば、ロングポジションの解消(巻き戻し)の合図となるかもしれません。 AGTは持続的なモメンタムを築いているのか、それとも過剰なレバレッジが次なるボラティリティショックの引き金となるのか。 #米国雇用統計と金利決定が主導するマクロ週 #11月米国CPIウォッチ

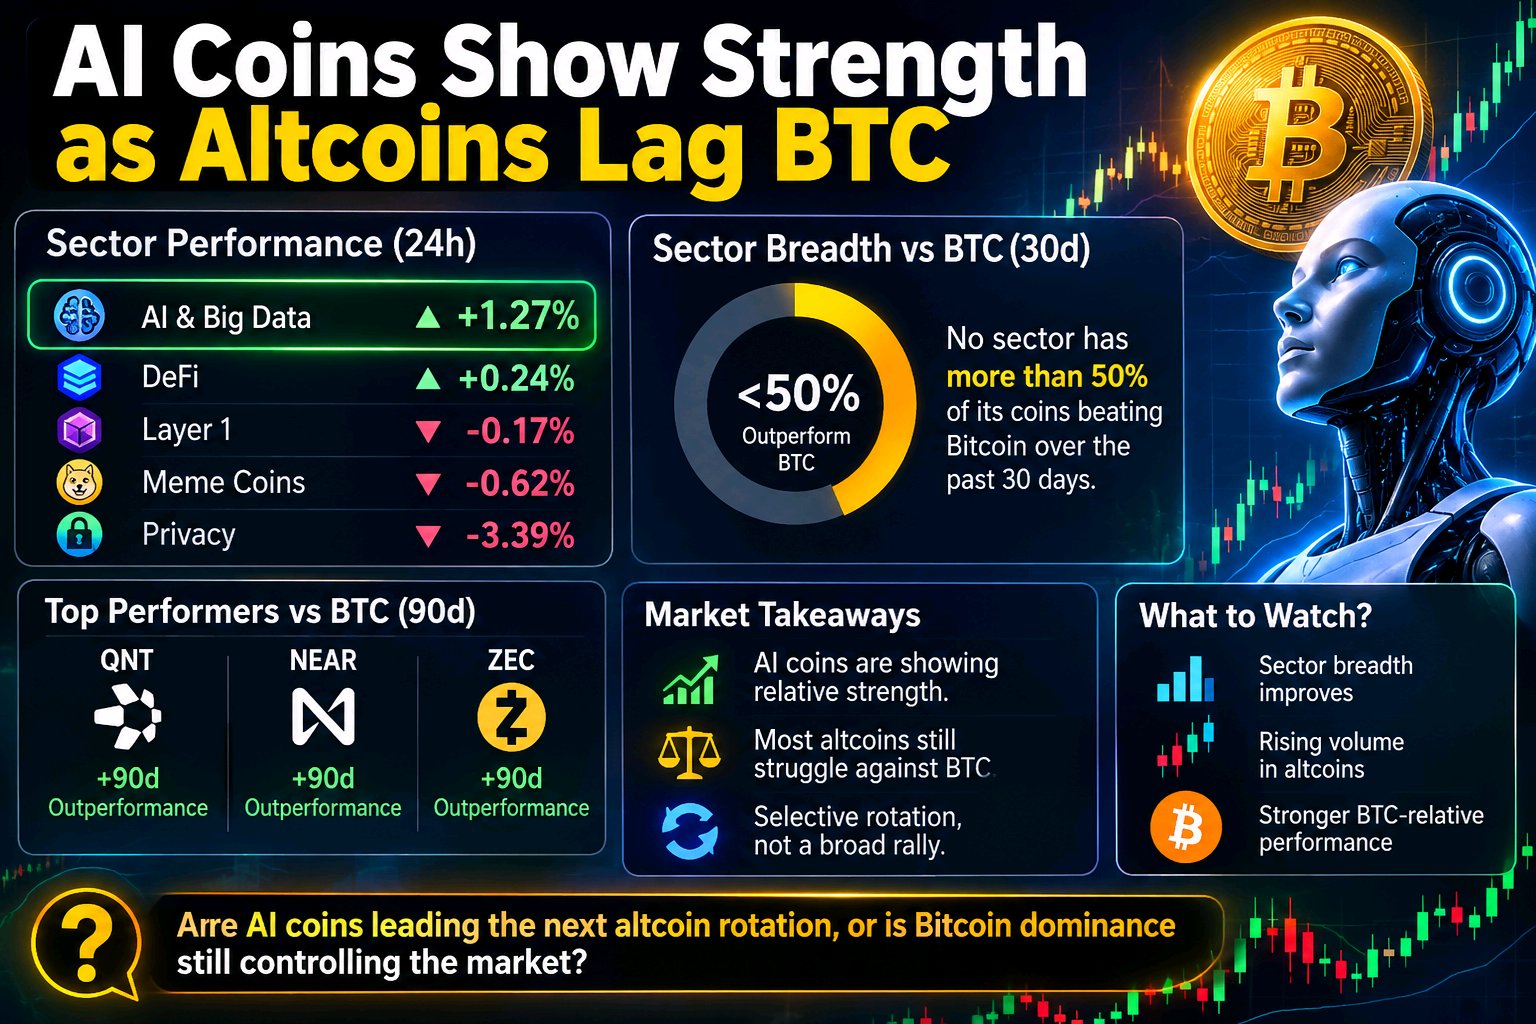
AI Coins Show Strength as Altcoins Lag BTC
$BTCUSDT The altcoin market is showing an interesting split, and smart traders should pay attention. As of November 11, AI & Big Data is showing relative strength, with approximately 1.27% gains over 24 hours. Meanwhile, Privacy coins are facing pressure, declining around 3.39%. **Top performers to watch:** QNT, NEAR and ZEC have demonstrated notable outperformance against Bitcoin over the past 90 days. **The overlooked detail:** Despite individual winners, no tracked altcoin sector currently has more than 50% of its coins outperforming BTC over the 30-day period. This suggests capital is rotating selectively rather than entering the entire altcoin market. If sector breadth improves alongside rising volume and stronger BTC-relative performance, the rotation could become more convincing. **Are AI coins leading the next altcoin rotation, or is Bitcoin dominance still controlling the market?** #BybitAIEvolving #USPayrollsAndRateDecisionsDriveMacroWeek
XMRのロングポジションが重いプレミアムを支払っている
#BybitAI進化中 #原油価格の変動がイランの和平交渉に連動 #AnthropicIPOValuationTest Monero(XMR)のデリバティブ市場で、トレーダーが見逃すべきではない異常な不均衡が見られます。 11月11日13:32(UTC)時点でのXMRの価格は580.40ドル付近で、資金調達率(ファンディングレート)は8時間ごとに+0.0090%とプラスでした。未決済建玉(OI)は約2億700万ドルで、24時間で2.4%減少しています。 別の複数取引所を対象としたスナップショットでは、24時間の先物取引高は約1億985万ドル、ファンディングレートは最大で+0.0404%を記録しました。 見落とされがちな詳細として、未決済建玉が縮小しているにもかかわらず、ファンディングレートはプラスのまま推移しています。これは、レバレッジをかけたポジションが市場の動きに合わせて拡大していないことを示唆しています。 もし今後、出来高を伴ってOIが上昇し始めたら、この動きにはより注意を払う必要があります。そうでなければ、強気のロングポジションが積み上がっている場合、売り圧力を受ける可能性があります。 XMRの強気派は確信を失いつつあるのでしょうか?
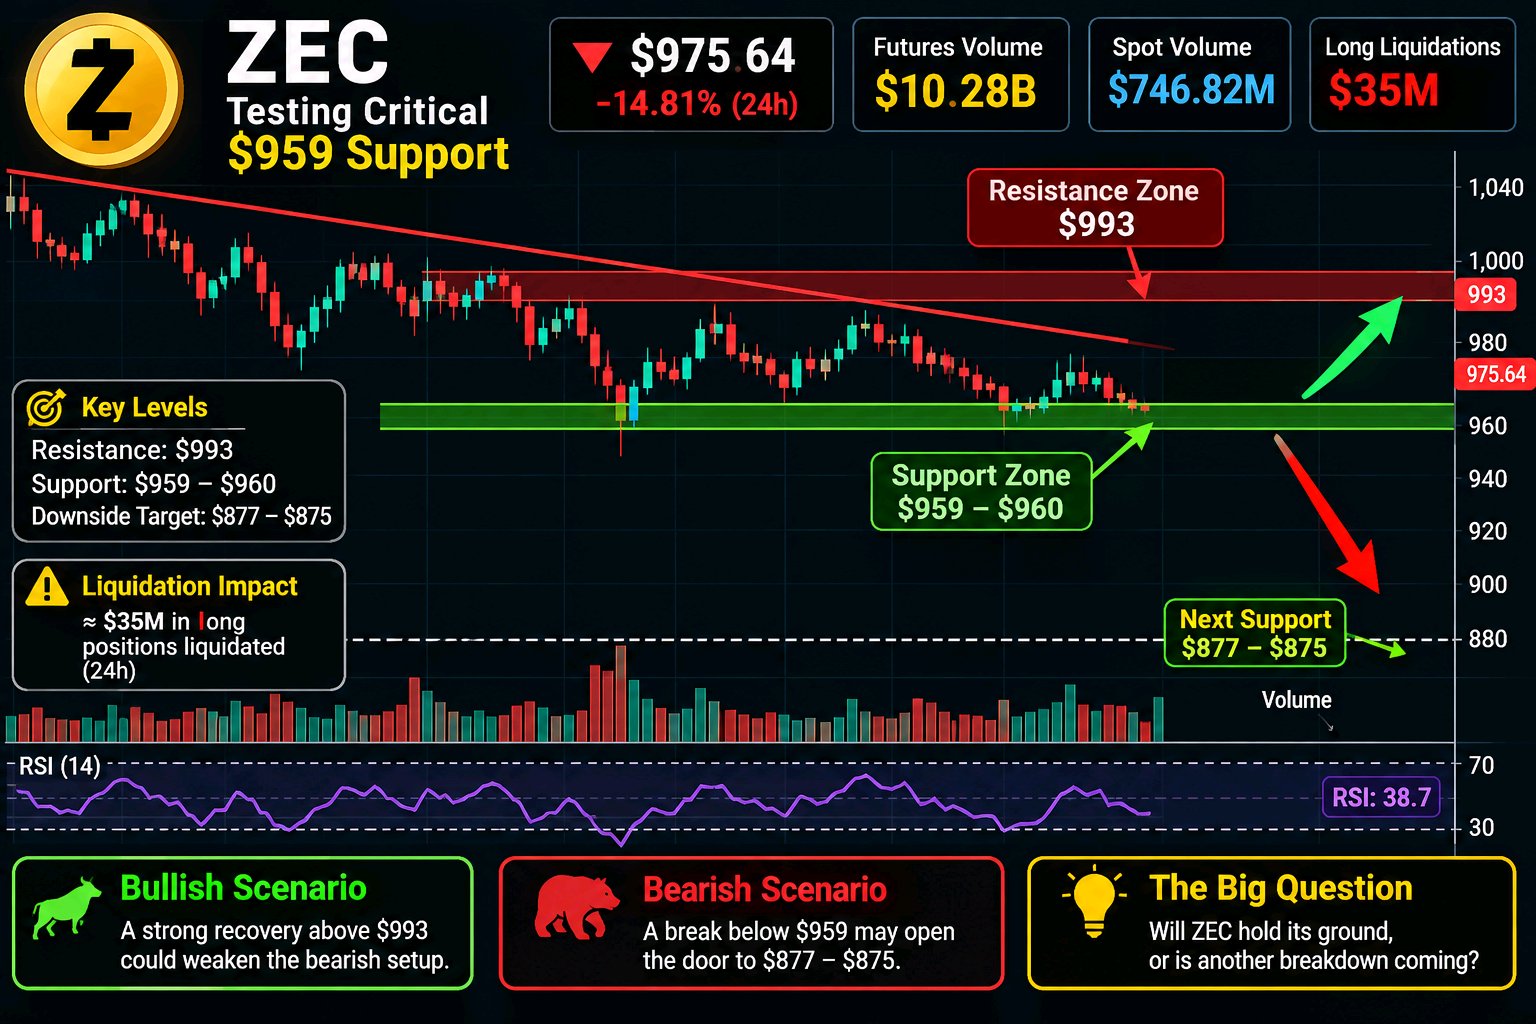
ZEC Faces Critical $959 Support Breakdown
Zcash is testing an important support zone as selling pressure continues to build. On November 11, ZEC traded near $975.64, declining approximately 14.81% over 24 hours. The immediate support zone stands around $959–$960, while the recent 24-hour low was approximately $965. **The Overlooked Detail** Futures trading volume reached approximately $10.28 billion, compared with $746.82 million in spot volume. Meanwhile, around $35 million in long positions were liquidated over 24 hours. **Why It Matters** Heavy derivatives activity and long liquidations suggest leveraged traders are under pressure. However, liquidation-driven selling can sometimes trigger a sharp recovery. **Key Levels to Watch** - Immediate Support: $959–$960 - Downside Target: $877–$875 - Recovery Level: $993 **Bearish Scenario:** A sustained breakdown below $959 could expose the lower support zone. **Bullish Scenario:** A strong recovery above $993 could weaken the immediate bearish structure. The next move depends on whether buyers can defend support or sellers maintain control. Will ZEC hold its ground, or is another breakdown approaching? *Market figures reflect the November 11 observation and are not verified live updates.* #WSOT2026 #USInflationRunsHotAndRateHikeBetsRise #NovUSCPIWatch #BybitAIEvolving
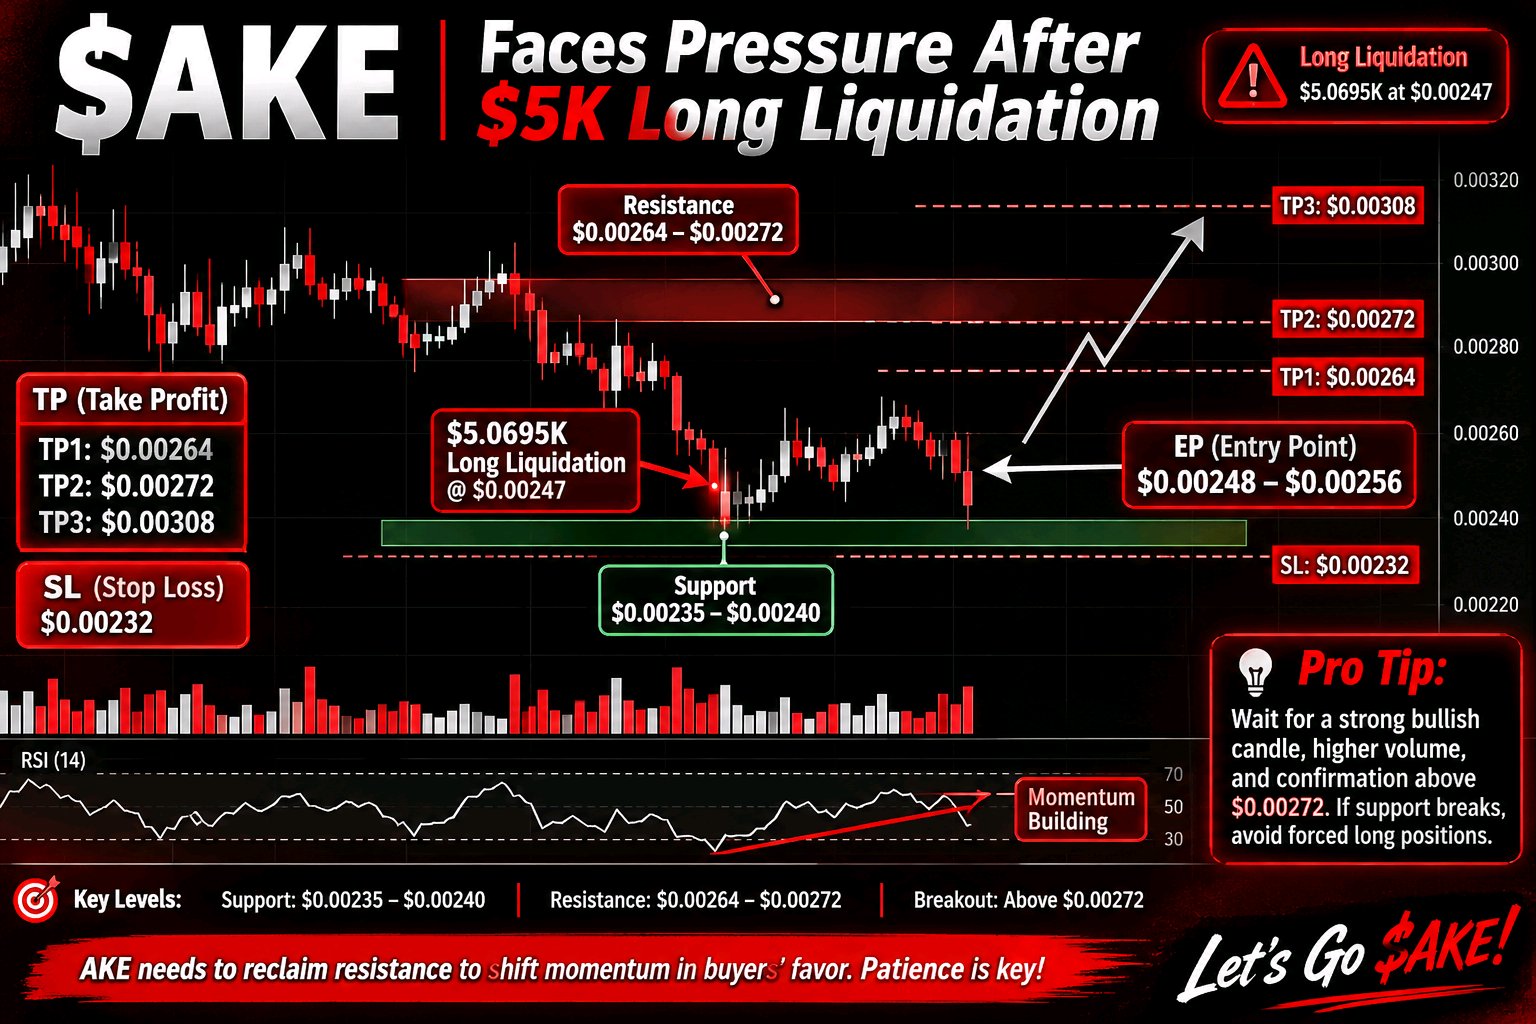
AKE Faces Pressure After $5K Long Liquidation
AKE recorded a $5.0695K long liquidation at $0.00247, highlighting pressure on leveraged buyers. This movement suggests that long positions are being forced out as sellers challenge the current market structure. The key focus is whether buyers can defend the nearby demand zone and restore bullish momentum. If AKE stabilizes and reclaims resistance, a short-term recovery could develop. However, continued selling pressure may push the price toward lower support levels. **EP (Entry Point)** $0.00248 – $0.00256 **TP (Take Profit)** TP1: $0.00264 TP2: $0.00272 TP3: $0.00308 **SL (Stop Loss)** $0.00232 **Key Levels** - Support: $0.00235 – $0.00240 - Resistance: $0.00264 – $0.00272 - Breakout confirmation: Above $0.00272 **Pro Tip:** Don't enter blindly after liquidation activity. Wait for a strong bullish candle, increasing volume, and confirmation above resistance. If support breaks, avoid forcing a long position. AKE needs to reclaim resistance to shift momentum in buyers' favor. Patience and proper risk management are essential. Let's go $AKE! #WSOT2026 #BitcoinHitsTwoMonthLowAfterUSMidterms #NovUSCPIWatch
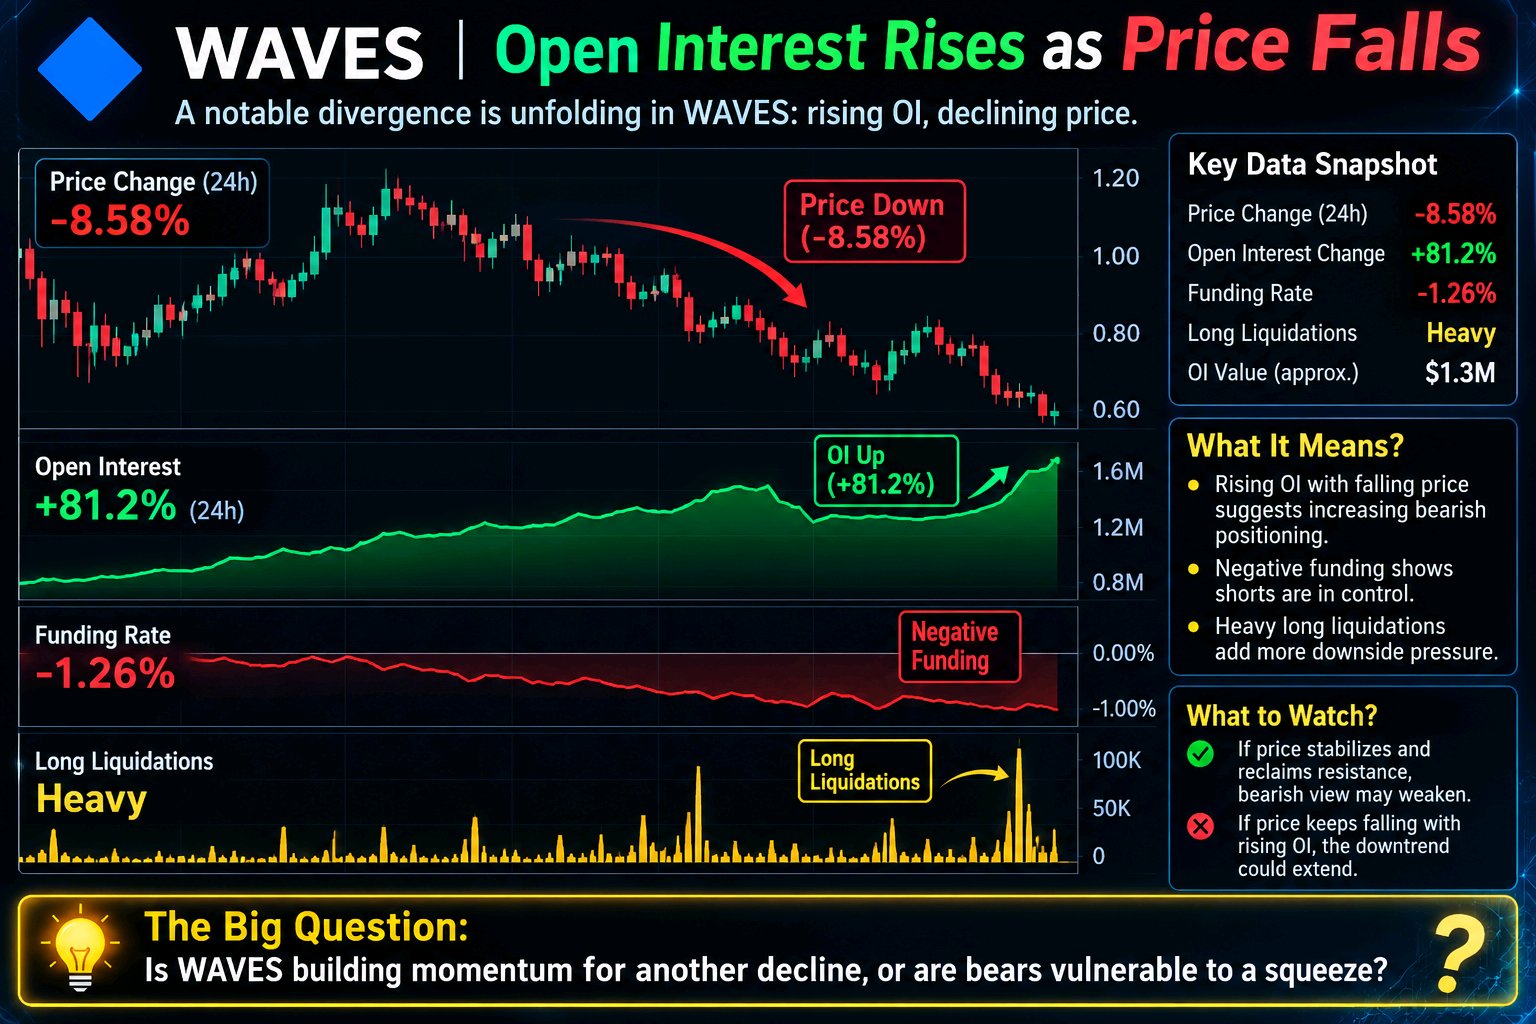
WAVES Open Interest Rises as Price Falls
$WAVESUSDT is showing an unusual shift in derivatives positioning, and traders should pay attention. Open interest reportedly increased by approximately 81.2% over 24 hours, while the token's price declined around 8.58%. This creates a notable divergence between futures positioning and spot price action. The overlooked detail is the combination of rising OI, negative funding and long liquidations. It suggests increasing bearish pressure and potentially crowded positioning, although rising OI alone does not confirm whether new positions are predominantly long or short. If price continues falling while OI expands, bearish positioning could strengthen. However, a recovery above nearby resistance could trigger short covering and a sharp reversal. The key question: Is WAVES building momentum for another decline, or are bears becoming vulnerable to a short squeeze? $MNTUSDT
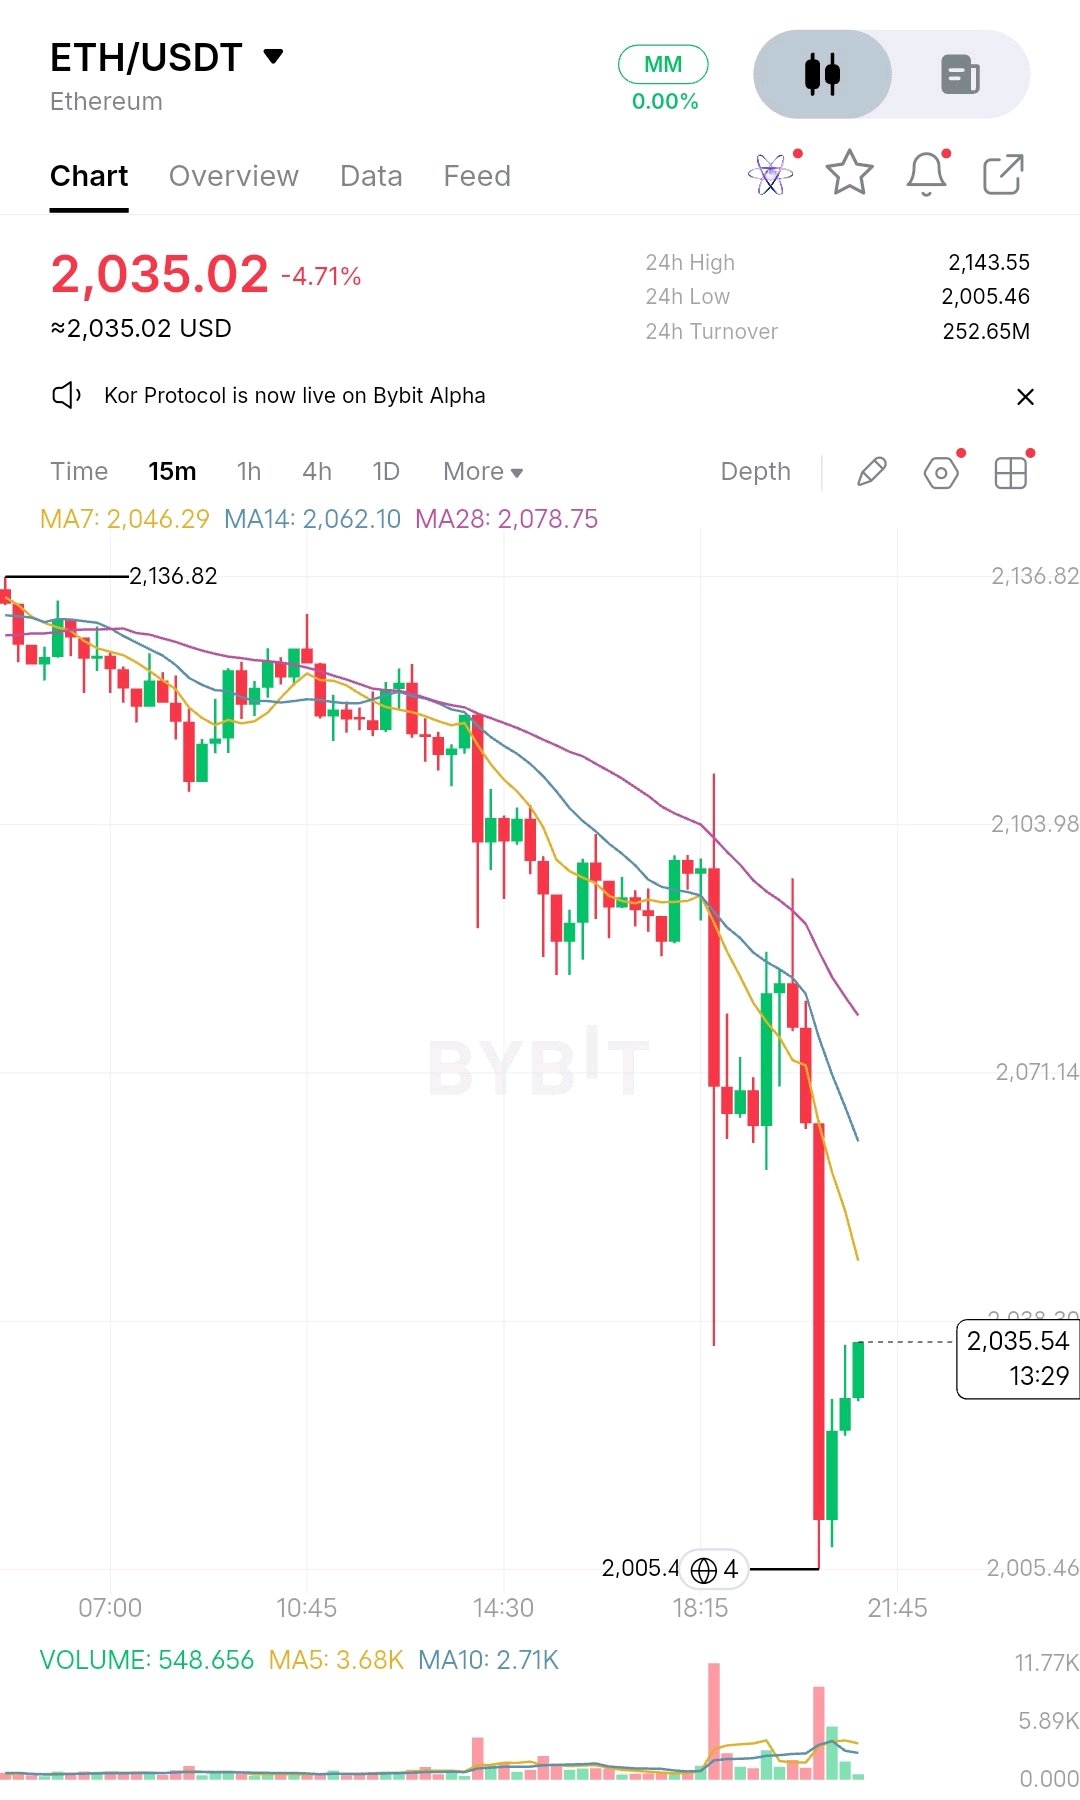
ETH Resistance Test
$ETHUSDT remains under pressure as sellers defend nearby resistance. The $2,046–$2,062 zone is the first major hurdle. EP $2,045–$2,060 Short TP $2,028 $2,015 $2,005 SL $2,072 Bearish momentum remains dominant unless ETH reclaims the resistance zone. Let’s go #WSOT2026 #WSOTPicktoEarn10U #USPayrollsAndRateDecisionsDriveMacroWeek #BybitAIEvolving
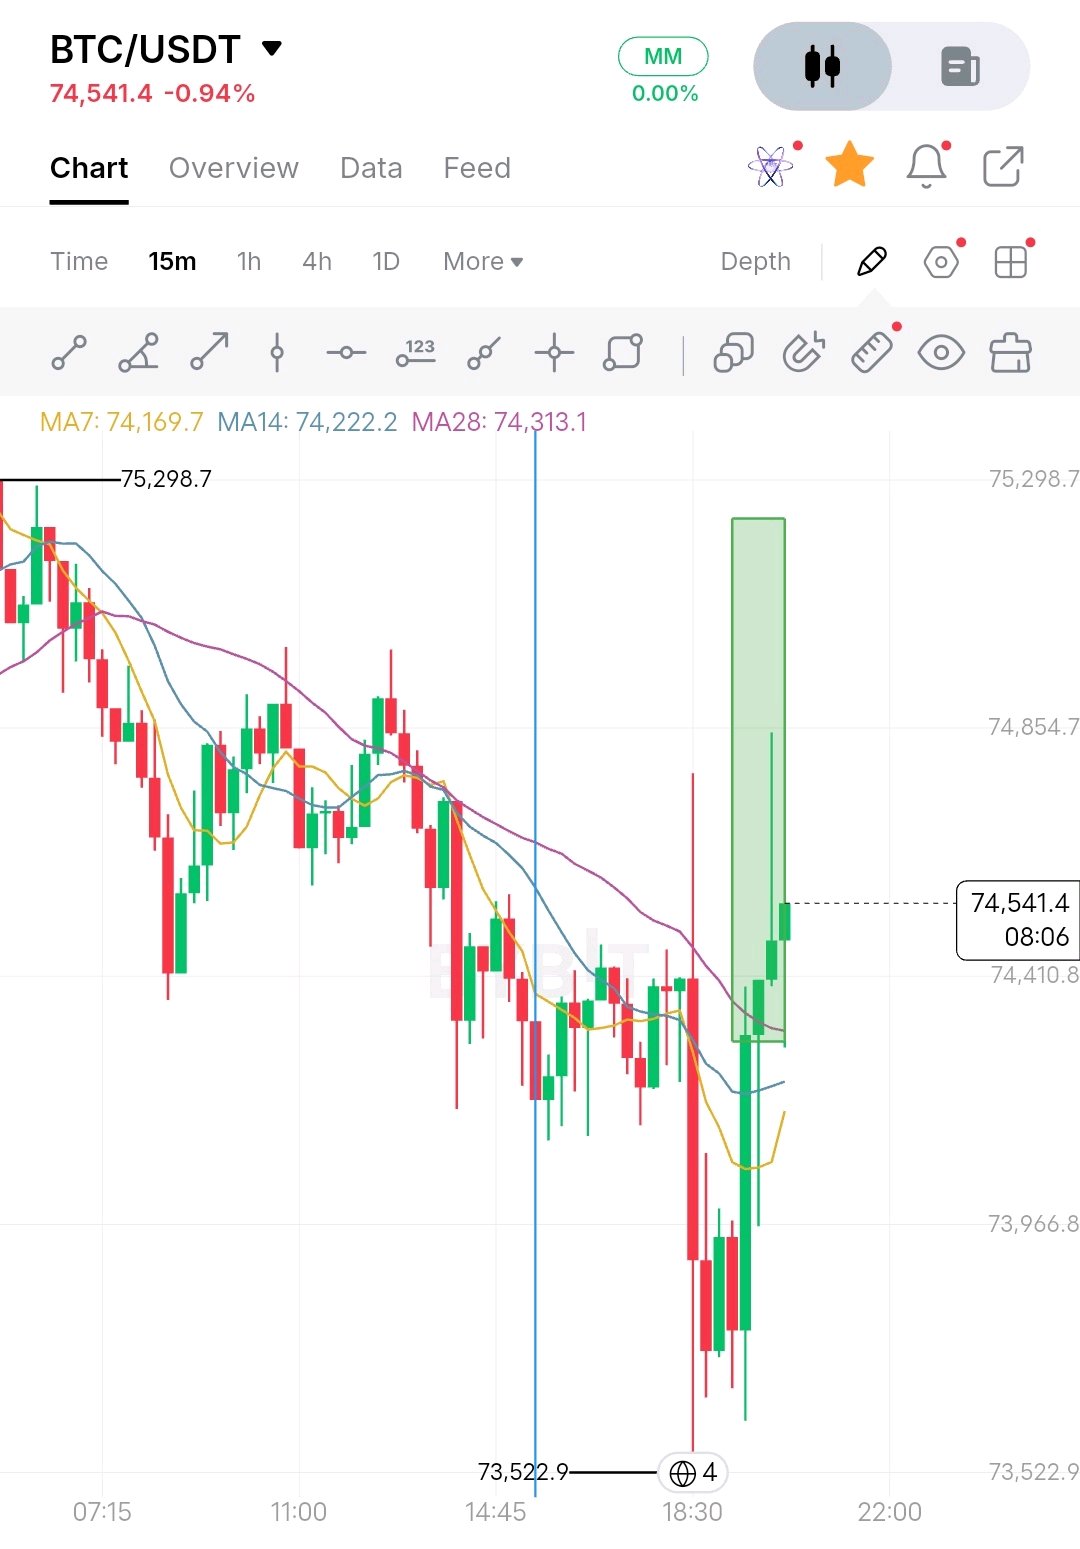
BTC Bulls Target $75,300 After Strong Recovery
$BTCUSDT /USDT is showing a promising recovery on the 15-minute chart after a sharp downside move. Buyers have stepped in strongly from the $73,520 demand zone, producing consecutive bullish candles and pushing price back above the short-term moving averages. **EP** 74,400 – 74,550 **TP** 74,850 75,000 75,300 **SL** 73,950 **Support:** 74,100 – 73,950 **Resistance:** 74,850 – 75,000 **Demand Zone:** 73,520 – 73,700 BTC is now approaching an important resistance area. A confirmed breakout above $74,850 could strengthen bullish momentum and open the door toward $75,000 and $75,300. However, rejection at resistance could bring another consolidation phase. The key is whether buyers can sustain momentum and reclaim higher levels. Let’s go $BTCUSDC #WSOT2026 #BybitAIEvolving #NovUSCPIWatch
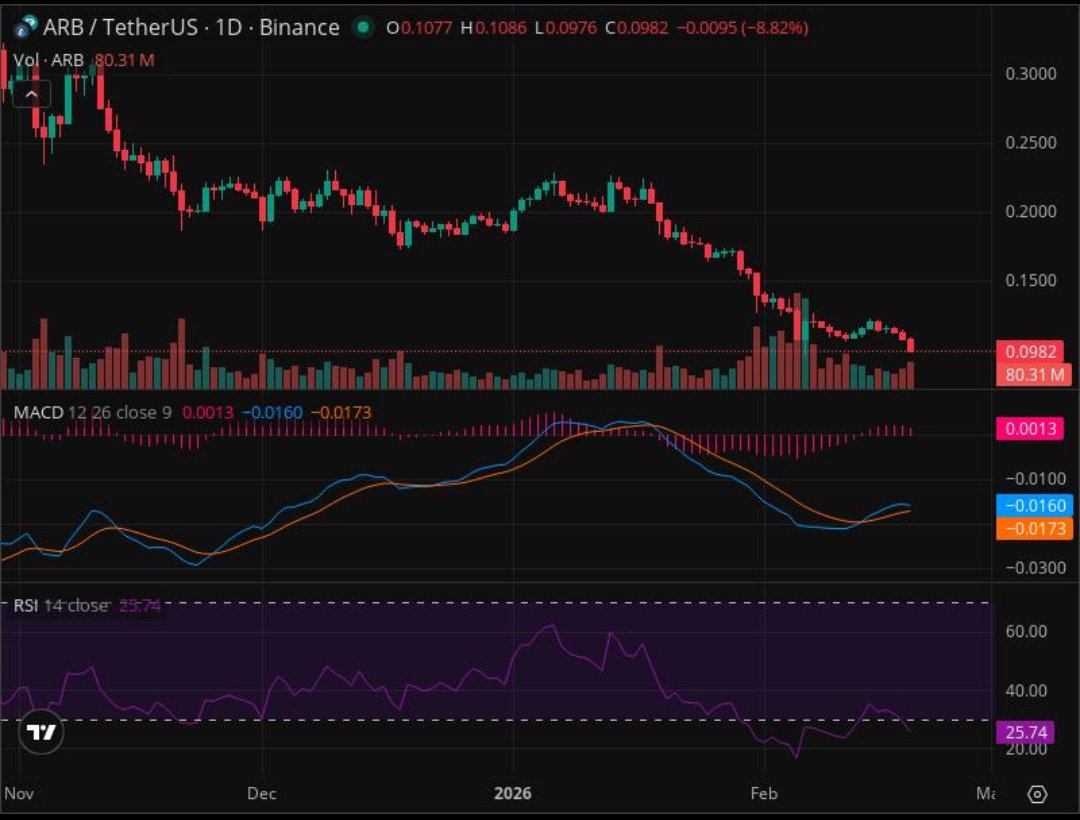
ARB Funding Signals Heavy Short Positioning
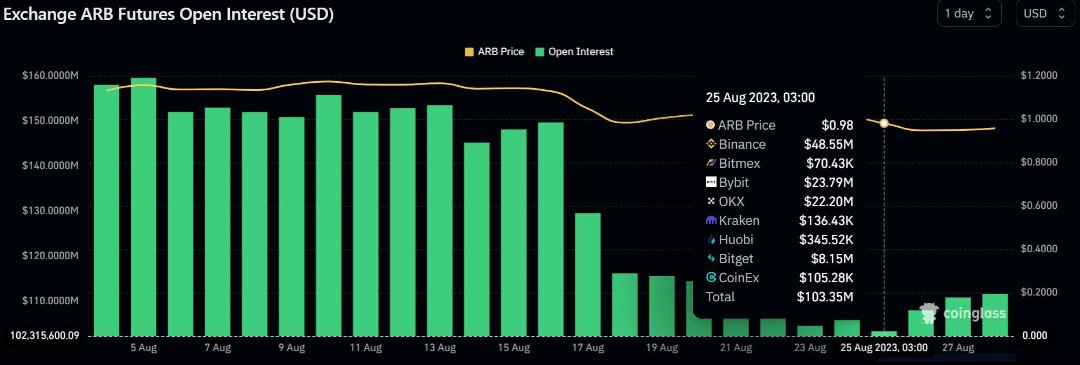
$ARBUSDT ARB is showing a bearish positioning signal in the perpetual futures market. Funding on Binance was approximately **−0.011% per 8 hours**, indicating that short-position holders were paying longs to maintain their positions. The interesting detail is that open interest also declined by 6.1% alongside a 9.7% drop in price over 24 hours. This suggests traders may be closing positions rather than aggressively opening new shorts. Negative funding can indicate crowded bearish positioning, but it does not automatically mean a reversal is coming. If open interest starts rising while funding remains negative, short pressure could intensify. A strong price recovery could put late short sellers under pressure. **Are traders becoming too bearish on ARB?*
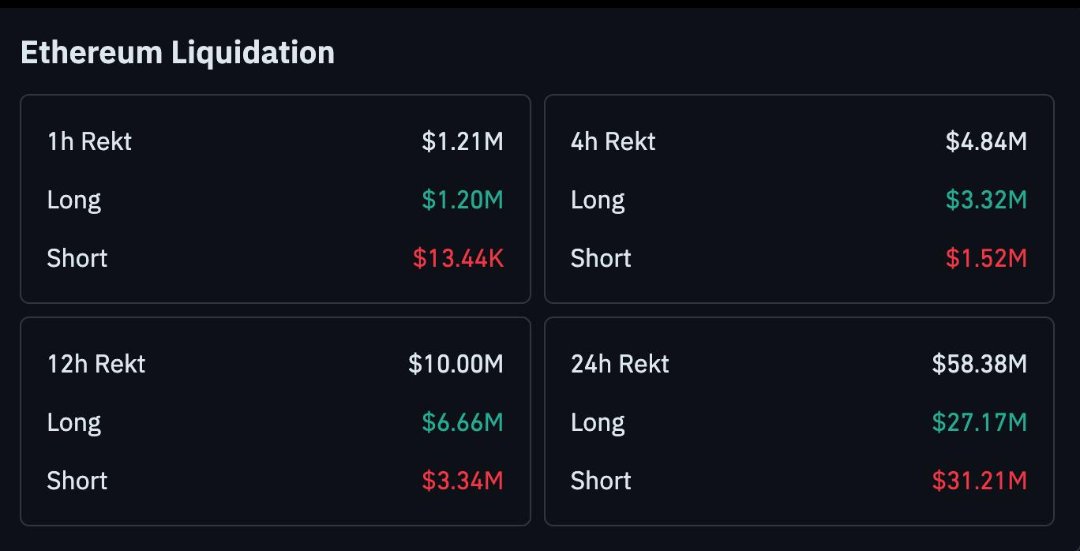
ETH Long Liquidations Hit $57 Million
$ETHUSDT Ethereum recorded the largest liquidation volume among major cryptocurrencies in the latest 24-hour market snapshot. Total ETH liquidations reached approximately **$75.7 million**, with $57.1 million coming from long positions and $18.6 million from shorts. The most notable event was a single ETH long liquidation worth approximately **$9.06 million** on November 9 at 07:13 UTC. The interesting detail is that nearly 75% of ETH liquidations came from bullish traders. This suggests leveraged buyers were caught on the wrong side of the move. ETH was down approximately 0.8% during the observed period, adding pressure to long positions. The next important signal is whether ETH can recover its lost ground or whether continued weakness triggers another wave of long liquidations. **Are ETH bulls ready to regain control, or is more leverage about to get wiped out?** #WSOT2026 #WSOTPicktoEarn10U #USPayrollsAndRateDecisionsDriveMacroWeek
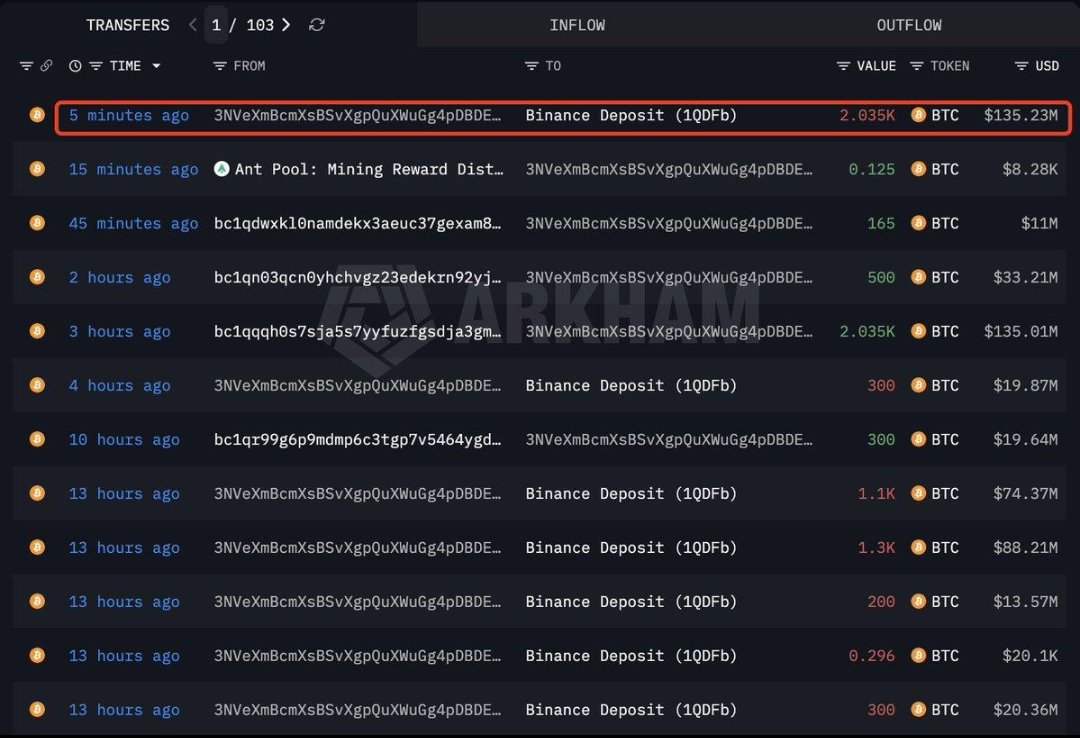
Bitcoin Whale Moves $129M Worth of BTC
A massive Bitcoin transfer has caught the market's attention. On November 9, approximately 1,745 BTC worth $129.8 million moved into a cryptocurrency exchange. This is a significant amount of Bitcoin entering a platform where it could potentially be sold. The timing makes this movement especially interesting. Bitcoin was trading around $75,248, up approximately 0.7%, meaning the large deposit arrived while price action remained positive. Another detail traders should watch is the reported 24-hour net exchange inflow of approximately 1,738 BTC. This suggests increased potential selling supply. However, an exchange deposit does not automatically mean a sale is coming. If selling pressure increases and BTC struggles to hold support, the market could face additional downside pressure. Strong buying absorption would weaken the bearish interpretation. Is this whale preparing to sell, or simply moving funds for another reason? #WSOT2026 #WSOTPicktoEarn10U #USPayrollsAndRateDecisionsDriveMacroWeek
ETH Long Liquidations Hit $411M
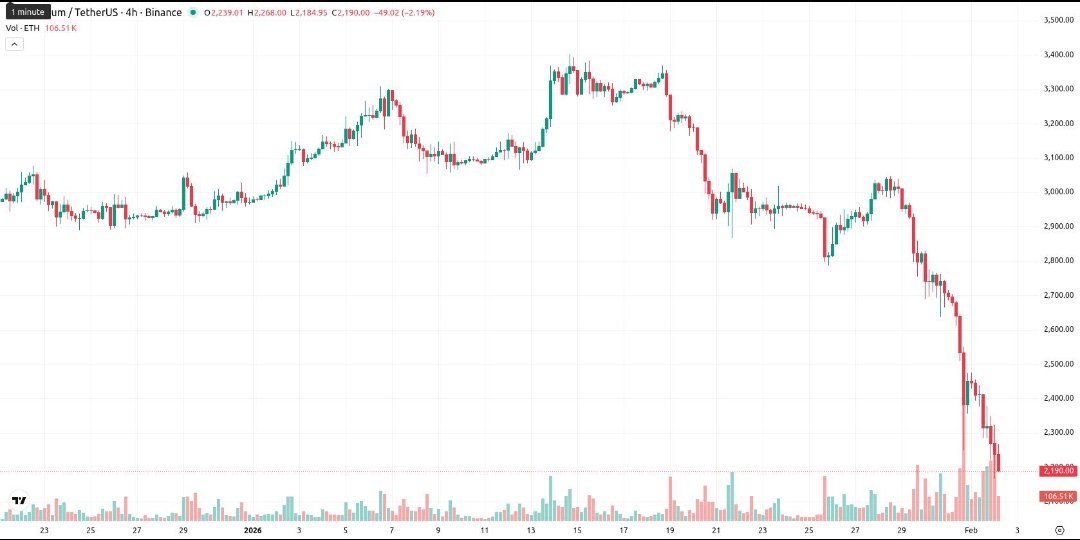
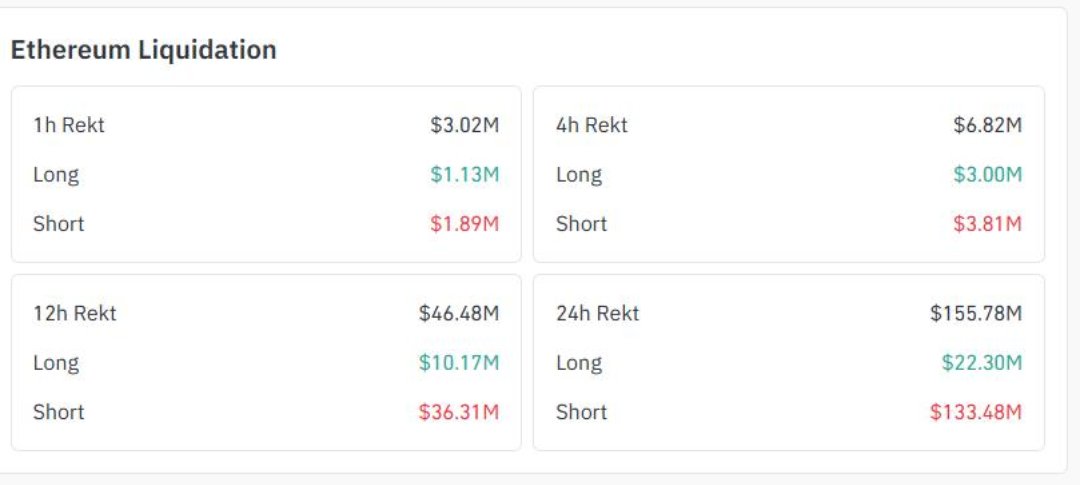
$ETHUSDT Ethereum has become the center of a major liquidation event, and leveraged buyers are taking the hardest hit. Over the 24-hour observation period on November 9, ETH recorded approximately **$445.4 million in total liquidations**, compared with $284.2 million for Bitcoin. The breakdown is even more interesting: - **Long liquidations:** $411.9 million - **Short liquidations:** $33.5 million - **Largest individual liquidation:** $48.2 million ETH long position - **Liquidation venue:** Binance The key detail is that long liquidations overwhelmingly dominated. This suggests excessive bullish leverage was forced out as ETH prices weakened around the $2,150–$2,100 region. Now traders should watch whether ETH can stabilize and reclaim nearby resistance. Continued weakness could expose more leveraged buyers to liquidation. **Is this a healthy leverage reset for Ethereum, or is another wave of selling still ahead?** Based on the previously retrieved market figures. No website names included. Figures are approximate. #WSOT2026 #NovUSCPIWatch
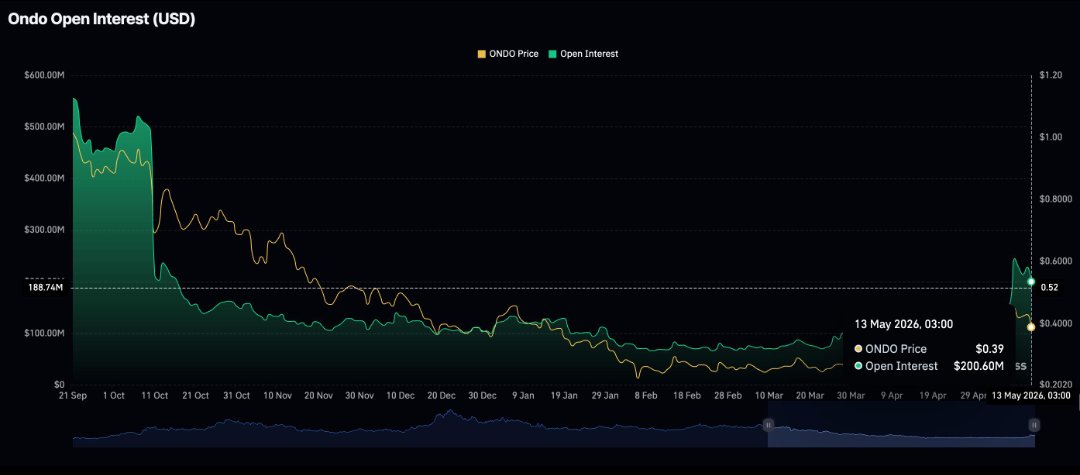
ON Open Interest Surges as Price Explodes
$ONDOUSDT ON is attracting serious attention as futures activity accelerates alongside a powerful price rally. As of November 9, ONUSDT recorded an approximately **35.2% increase in Open Interest over 24 hours**, while its price climbed around **83.86%**. The interesting detail is that both metrics are moving higher together. This suggests fresh leveraged positions are entering the market rather than the rally being driven solely by existing positions closing. However, positive funding of approximately **0.1052% per interval** indicates that long positioning may be getting crowded. If price maintains its strength while Open Interest remains elevated, bullish momentum could continue. But a sudden reversal with declining OI could trigger aggressive position unwinding. **Are traders building a stronger rally, or setting themselves up for a potential long squeeze?** #WSOT2026 #WSOTPicktoEarn10U #NovUSCPIWatch