Ali Explorer..
567いいね0シェア8ファン3フォロー
just Beginning of learning 🔺
just Beginning of learning 🔺
HYPE REVERSE FROM my levels!
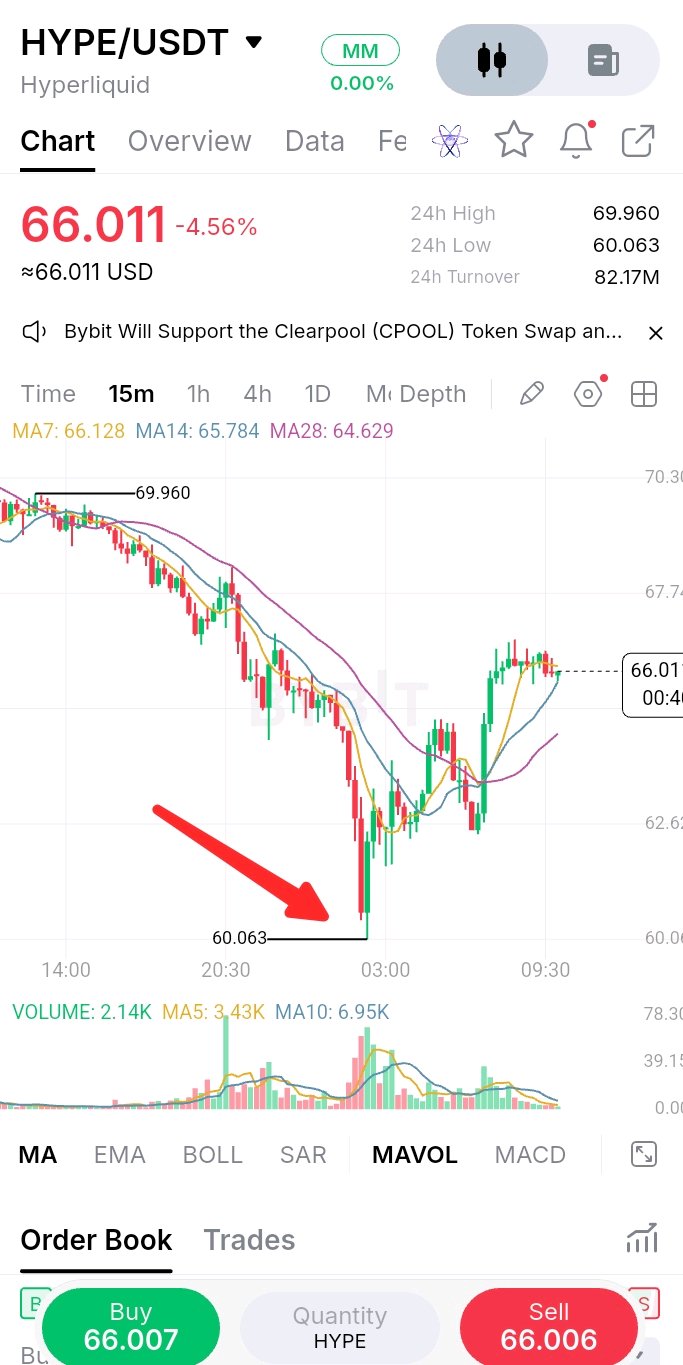
🚀 $HYPEUSDT THE BOUNCE WE WERE WATCHING! As discussed in my previous analysis, HYPE lost its $70–$71 support and moved toward the downside liquidity zone. Price swept liquidity near $60.06 and then staged a strong recovery toward $66. On the 15M chart, buyers are showing momentum, with price trading around the short-term moving averages. However, the broader downtrend is not confirmed broken yet. Key levels to watch 👀: $68–$70 resistance; $64–$65 immediate support. A sustained move above resistance could open the way toward $70–$73. For now, this looks like a recovery attempt, not a confirmed trend reversal. Watch volume and the next 4H closes before taking a position. Did HYPE finally find its bottom, or is this just a relieved... #IMPACTbyTrade
BTC bottom
I think $BTCUSDT Bottom is near 📉 #BitcoinHitsTwoMonthLowAfterUSMidterms
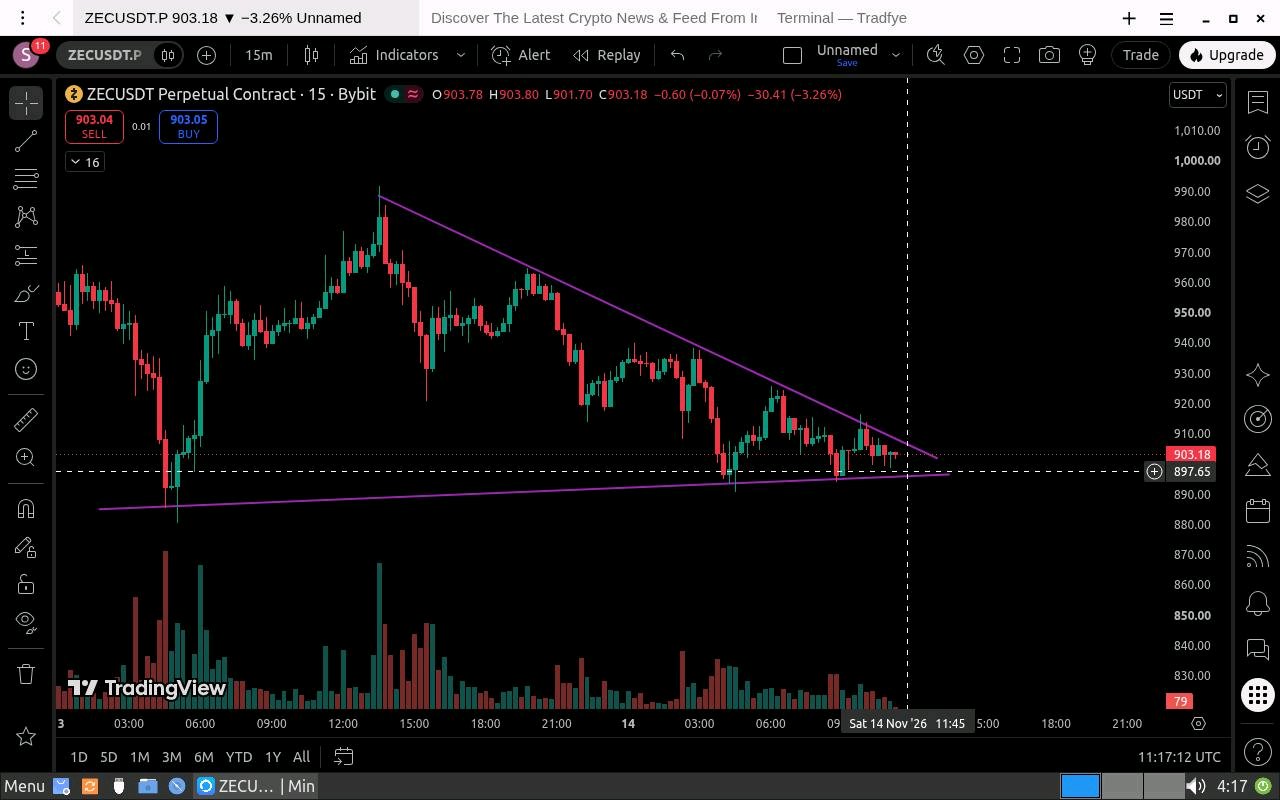
ZEC A BIG MOVE COULD BE COMING! 📊🔥
ZEC is trading around $903, squeezing inside a descending resistance structure on the 15-minute chart. Price is holding a critical support zone between $890 – $900. A breakout or breakdown could trigger the next major move. 📊 KEY LEVELS TO WATCH 👀 LONG 🎯 Target 1: $916 🎯 Target 2: $927 🚀 Final Target: $934 🛑 Stop loss: Below around $890. At $927, consider securing partial profits and moving SL to breakeven. If ZEC loses the $890–$900 support zone with a confirmed breakdown: 📉 Potential downside target: $860 🔥 THE BIG QUESTION Will ZEC break upward toward $934 or collapse toward $860? The market is approaching a critical decision zone. Don't chase the move wait for confirmation. 💡 Remember: Trade the confirmation, not the prediction. Manage your risk! What's your bias? 🐂 BULLISH or 🐻 BEARISH? #IMPACTbyTrade
Trying to Understand What Is Happening With BTC
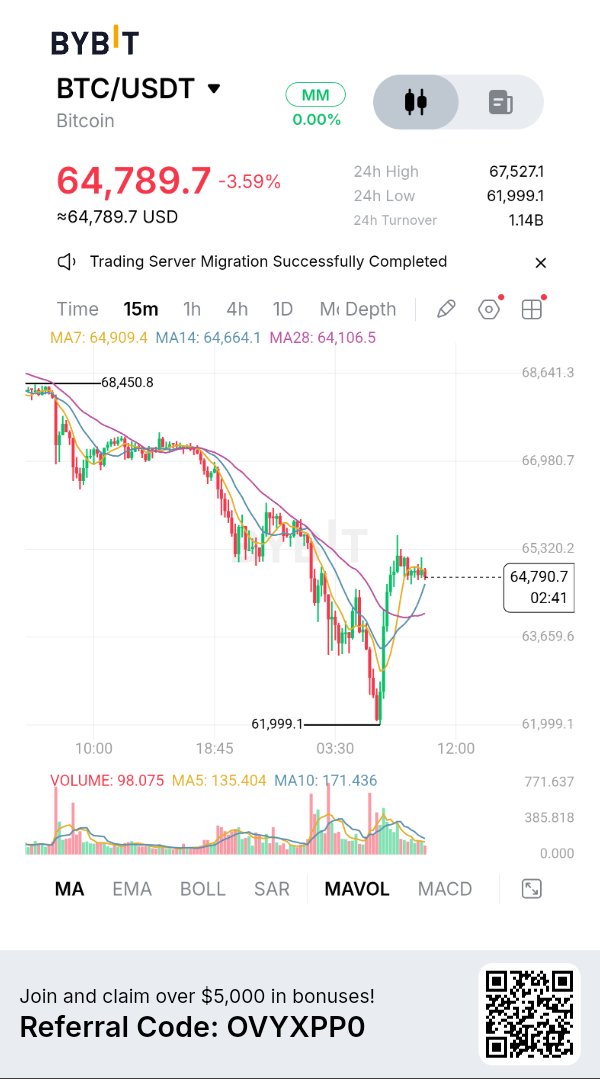
I have been closely observing Bitcoin on the 1H timeframe, and the current market structure is showing signs of weakness. $BTCUSDT continues to form lower highs and lower lows, suggesting that sellers are still dominating the short term trend. Looking at the chart, I have mapped a possible A B C D E corrective structure. Price has recently bounced from the D wave area, but I am not considering this a confirmed bullish reversal yet. Key Technical Levels☑️ • Resistance: $69,120 • Immediate Support: $66,400–$66,500 • Next Potential Support Zone: $61,000–$63,000 if selling pressure continues. A sustained move above $69,120 could improve the short-term structure, while a breakdown below $66,400 may expose the lower support zone. Understanding the Market with Bybit AI I also used Bybit AI to understand the possible reasons behind BTC's recent decline. The analysis helped me look at the broader market picture, including: • Weakening demand and changing market sentiment. • Reduced institutional buying interest. • Derivatives positioning and the possibility of leveraged long liquidations. • Overall market uncertainty and selling pressure. According to the analysis, the current decline appears to be more related to market-wide pressure and weakening demand, potentially amplified by leverage, rather than a confirmed problem with Bitcoin itself. My Overall Market View At the moment, I am keeping an eye on the $66,400 support area and whether BTC can recover above the $69,120 resistance. If support fails, the $61,000–$63,000 zone becomes important to watch. I don't consider every bounce a reversal. I prefer to observe price confirmation, market structure and risk before making any decision. The main thing I learned from this analysis is that looking at technical structure alongside broader market conditions gives a more complete picture of what is happening. #WSOTShowYourAITradeToEarn10USDT
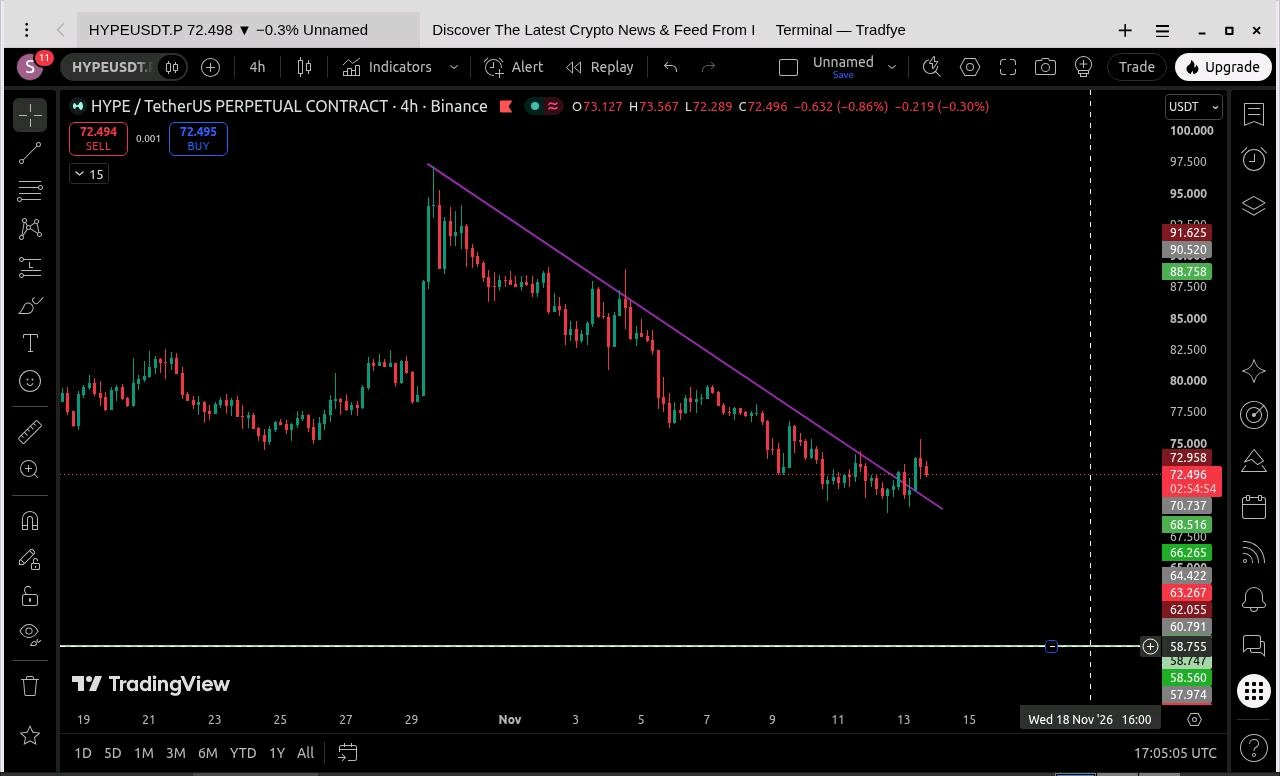
HYPE TREND LINE BREAK 😱
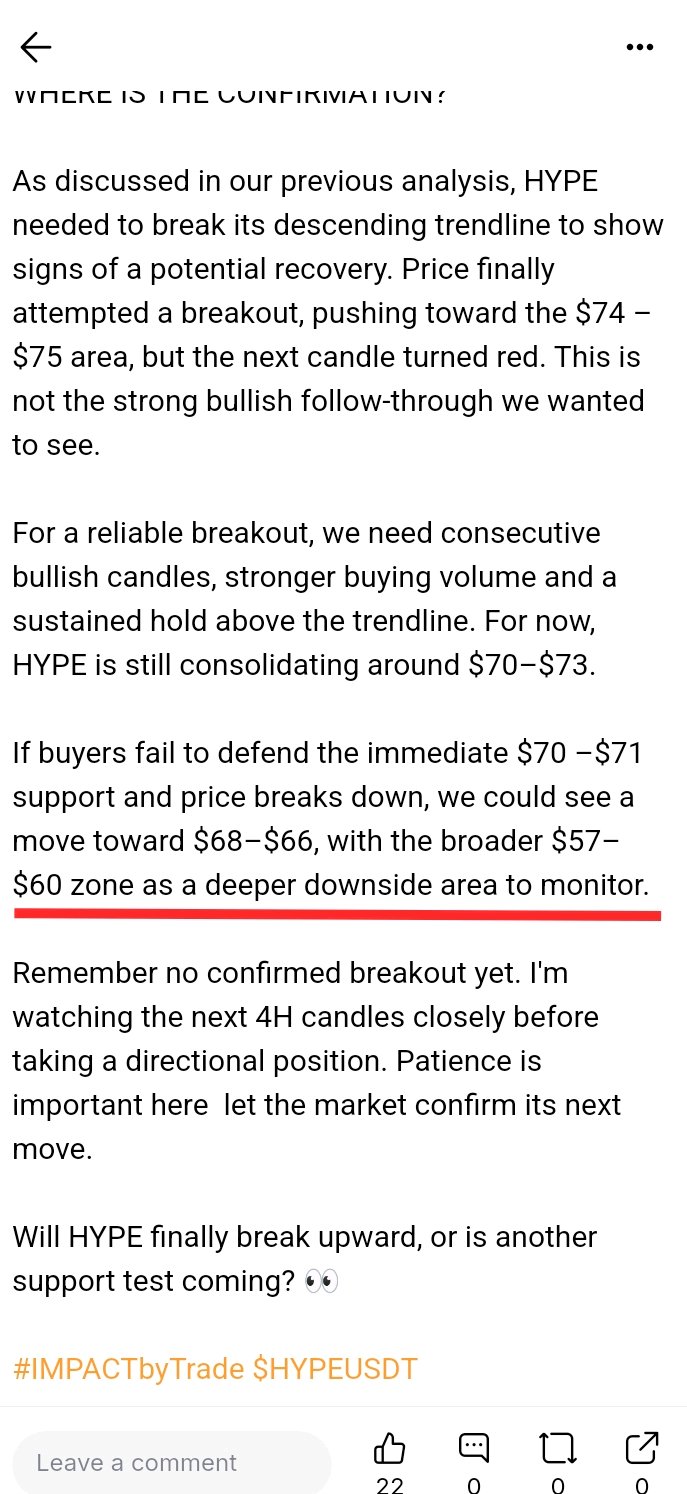
⚡ HYPE UPDATE TRENDLINE BREAKOUT BUT WHERE IS THE CONFIRMATION? As discussed in our previous analysis, HYPE needed to break its descending trendline to show signs of a potential recovery. Price finally attempted a breakout, pushing toward the $74 – $75 area, but the next candle turned red. This is not the strong bullish follow-through we wanted to see. For a reliable breakout, we need consecutive bullish candles, stronger buying volume and a sustained hold above the trendline. For now, HYPE is still consolidating around $70–$73. If buyers fail to defend the immediate $70 –$71 support and price breaks down, we could see a move toward $68–$66, with the broader $57– $60 zone as a deeper downside area to monitor. Remember no confirmed breakout yet. I'm watching the next 4H candles closely before taking a directional position. Patience is important here let the market confirm its next move. Will HYPE finally break upward, or is another support test coming? 👀 #IMPACTbyTrade $HYPEUSDT
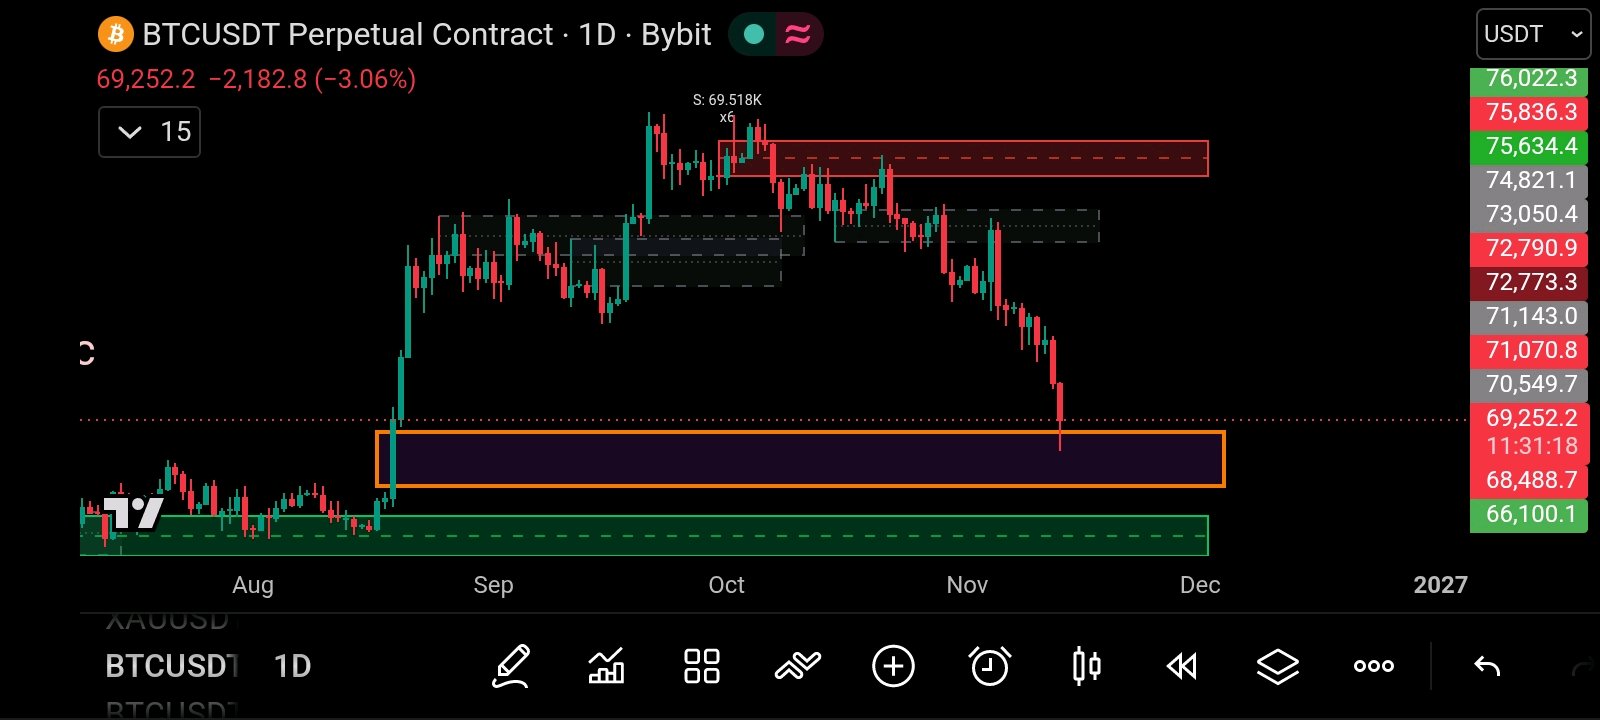
ビットコインが日足FVGをテストしました
ビットコインは正式に押し目を形成し、65,000ドル〜69,000ドル付近の主要な日足Fair Value Gap(FVG)需要ゾーンを試しました🌐。7億5,000万ドル以上のロングポジションが清算された激しいフラッシュクラッシュを経て、価格は現在、これらの安値圏で買い支えの初期兆候を見せています📉。 現在BTCは69,174ドル前後で安定しており、このゾーンは究極の転換点として機能しています。私たちがこのセットアップをどう扱うか、ここに記します🧠。 セットアップ:FVGの防衛ラインを根拠とした条件付きロングポジションを計画中🟢。 上昇ターゲット:72,000ドル以上(重要なオーバーヘッドの流動性と過去の構造が集中する水準)🎯 厳格なストップロス:直近のフラッシュクラッシュの安値を明確に下回る、約67,000ドルに設定🛡️ ⚡実行ルール:根拠なき希望的観測でトレードしてはいけません。エントリー前に、強力かつ検証された強気の反応と、1時間足/4時間足での明確な確認構造が必要です。もしこの需要ゾーンが維持できなければ、即座にリスク境界を尊重し、静観します📉。 リスク管理が常に最優先です。 オーダーフローを注意深く監視し、BTCがこの日足FVGを発射台として回復できるか見届けましょう!🚀 あなたの分析はどうですか!?72Kまで上昇するのか、それともさらに下値を試すのか?下にあなたの見解をコメントしてください!👇 $BTCUSDT #WSOTあなたのAI取引を見せて10USDTを獲得
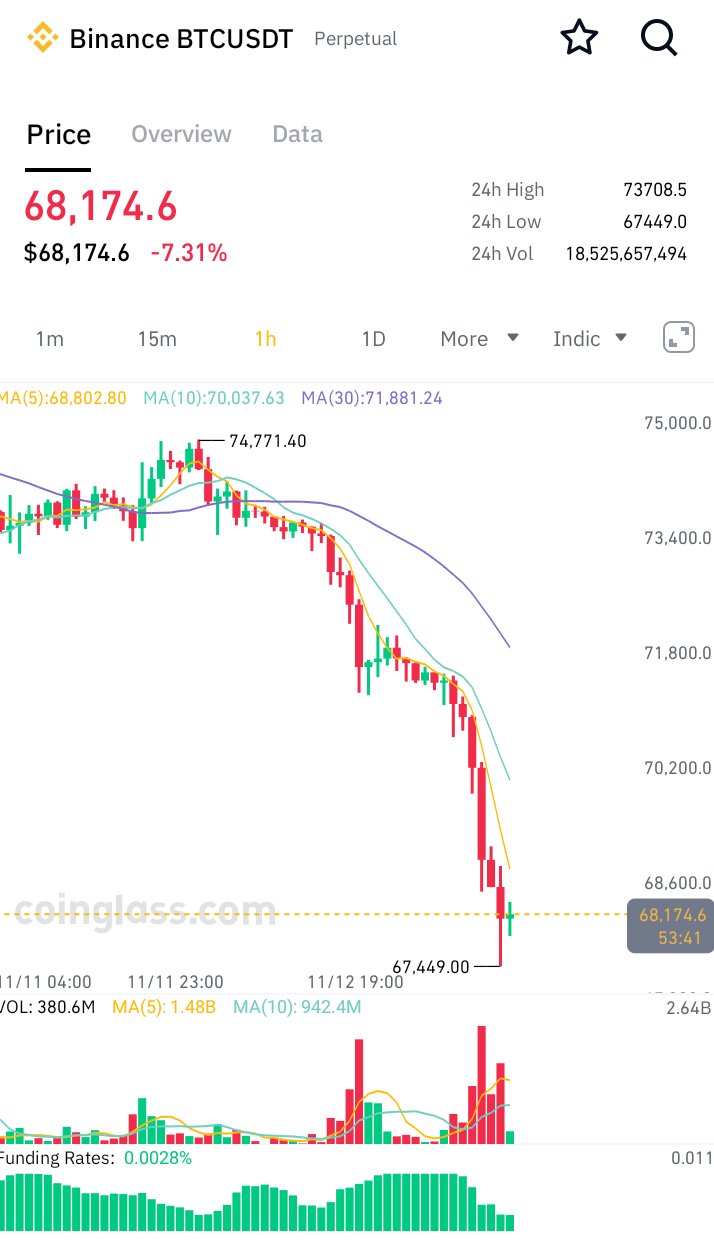
ビットコインが68,000ドル割れって、これでもう終わりか!?
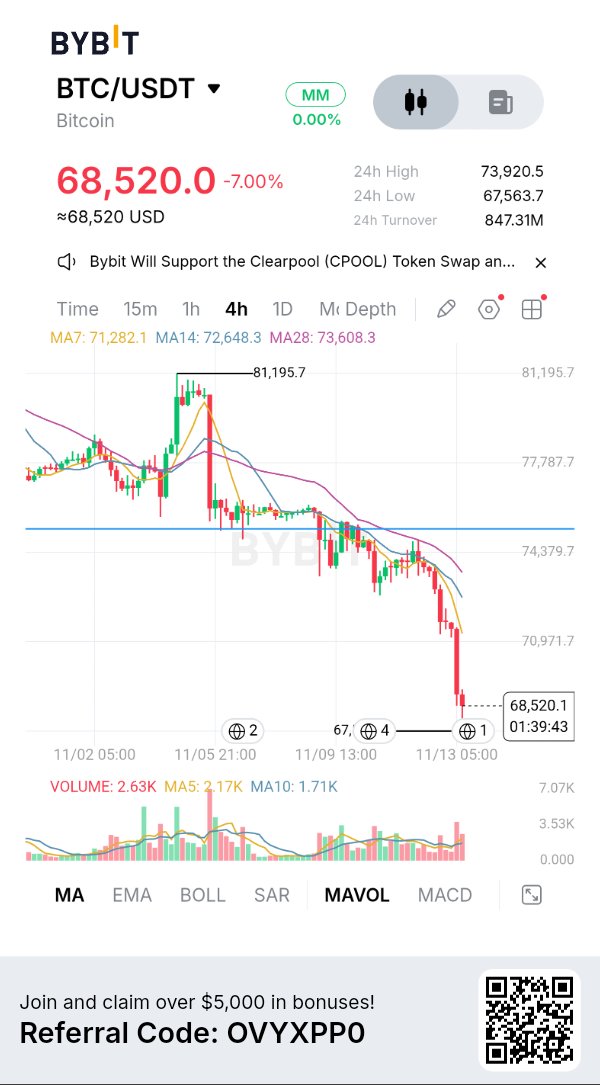
ビットコインが約2ヶ月ぶりに69,000ドルを割り込み、ここ数週間で最大級のレバレッジ解消を引き起こしました。 先週は81,000ドル付近で取引されていましたが、$BTCUSDTは11月13日に69,000ドルの水準を下回りました。この動きにより、仮想通貨デリバティブ市場全体で約14億ドルの強制清算が発生し、その大半はロングポジションによる損失でした。この連鎖的な動きで17万人以上のトレーダーが強制清算されました。 ビットコイン関連の清算だけでも約7億4,000万ドルに達し、イーサリアムは約2億5,000万ドルが消滅しました。仮想通貨市場全体もこれに追随して下落し、時価総額は5〜6%減少し、約2.3兆ドルとなりました。 アナリストは、今回の売り越しをファンダメンタルズの崩壊ではなく、主にレバレッジ解消イベントと見ています。70,000ドルのすぐ下にはレバレッジをかけたロングポジションが密集していました。その水準を割り込むと、自動清算が下落を加速させました。マクロ経済の要因も圧力を高めました。ビットコイン現物ETFからの資金流出、米ドルの上昇、ハイテク株の弱さ、そして金融引き締め観測を高めるインフレデータの過熱などが要因です。 アルトコインも同様の動きを見せました。イーサリアム $ETHUSDT は1,900〜1,925ドルのレンジまで下落し、XRPは1ドル付近で推移し、SOLやDOGEといった銘柄は5〜9%の下落を記録しました。 今後注目すべき重要なシグナルは、レバレッジ指標であるオープンインタレスト(未決済建玉)と資金調達率(ファンディングレート)、現物ETFの資金フロー、そしてビットコインが60,000ドル台後半で安定できるかどうかです。強制的な売りが鈍化し、資金流出が落ち着けば、市場はより秩序ある取引に戻る可能性があります。 しかし、再び過度なレバレッジが積み上がれば、さらなるボラティリティに対して脆弱なままとなるでしょう。 要するに、これはリスクオフの背景下で発生した急激なレバレッジ解消であり、過度なロングポジションにとっては痛手でしたが、ビットコインの広範なテーゼが構造的に崩れたという明確なサインではありません。 $ByXIMPACT

Bitcoin just lost the $69K level
$BTCUSDT dropped below $69,000 for the first time in nearly two months, falling from around $81K last week. The move triggered roughly $1.4 billion in liquidations, with the vast majority coming from long positions. Over 170,000 traders got wiped out in the cascade. This looks more like a leverage flush than a fundamental breakdown. Crowded longs below $70K got hit hard, while ETF outflows, a stronger dollar, and broader risk-off sentiment in tech added pressure. Altcoins followed $ETHUSDT slid toward $1,900 – 1,925, XRP hovered near $1. Key things to watch now: - Whether leverage continues to reset - Spot ETF flows - If BTC can hold the high $60Ks Classic leverage reset against a risk off backdrop. #WSOT2026 #BitcoinHitsTwoMonthLowAfterUSMidterms #USInflationRunsHotAndRateHikeBetsRise

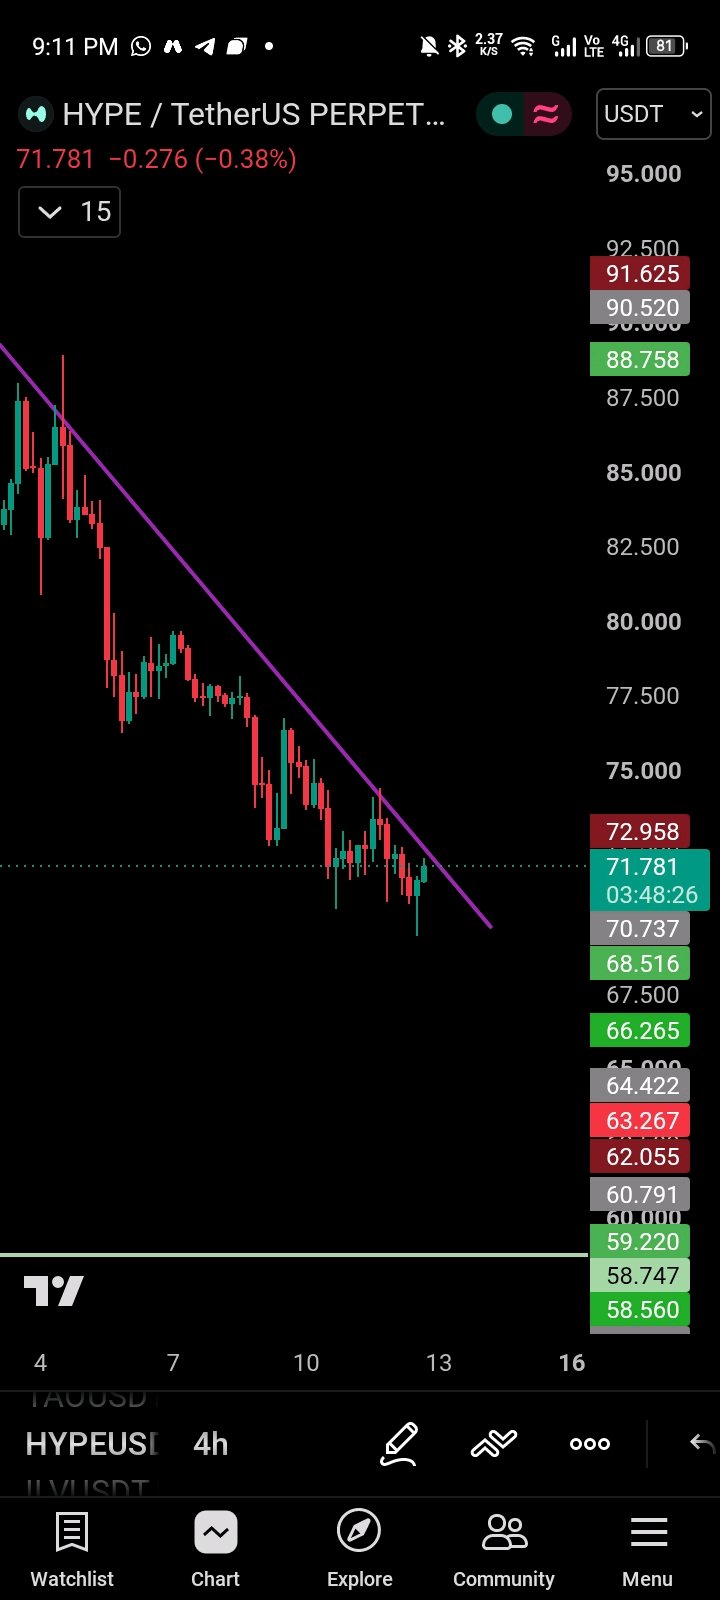
$HYPEUSDT BUYERS ARE SHOWING UP! As expected from our previous analysis, HYPE has swept liquidity below the $70 support zone, which is now showing signs of acting as a demand area. Buyers are attempting to push price upward, but the overall trend remains bearish, with sellers still in control. The key level to watch is the descending trendline a confirmed breakout with strong volume could trigger a recovery, while another rejection may bring further downside. This is a critical moment, so every micro move matters. Let's see: breakout or breakdown? 👀 #HYPEUSDT #IMPACTbyTrade
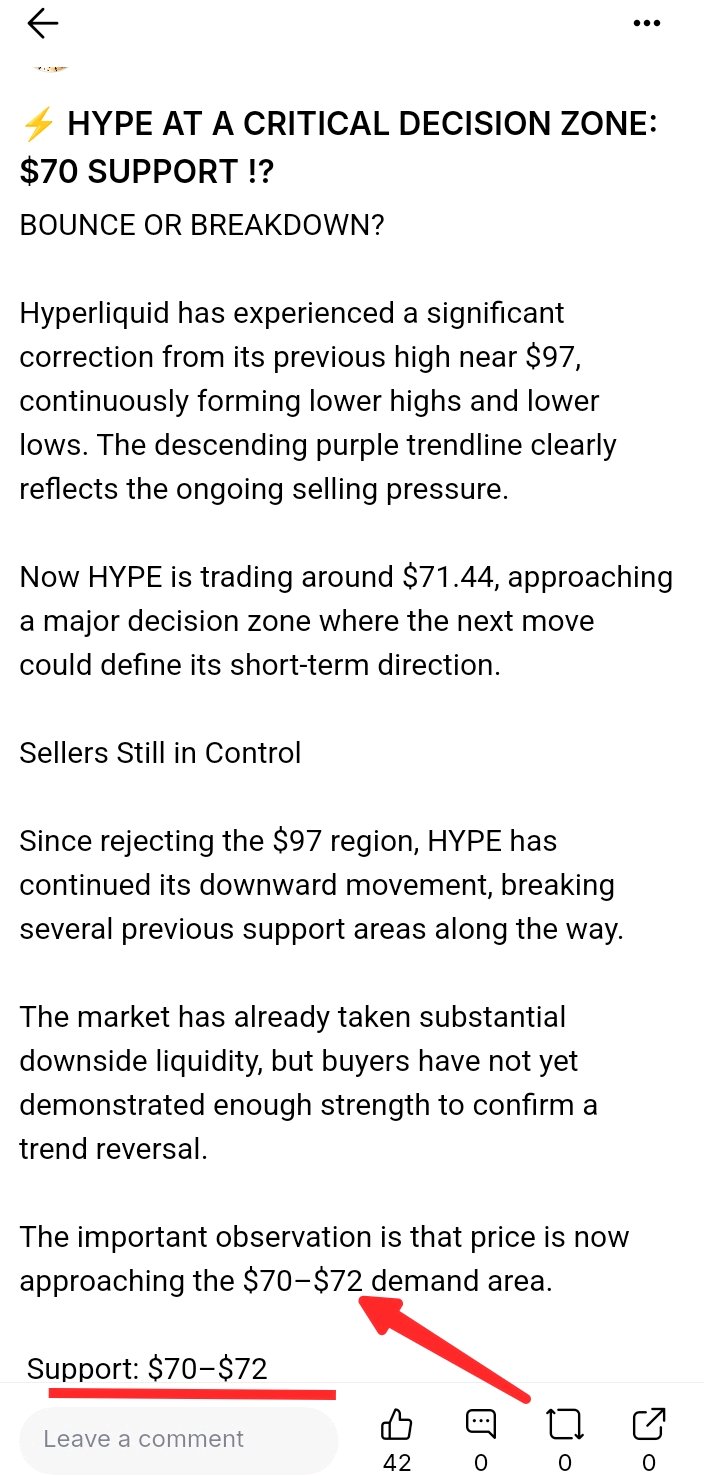
⚡ HYPE AT A CRITICAL DECISION ZONE: $70 SUPPORT !?
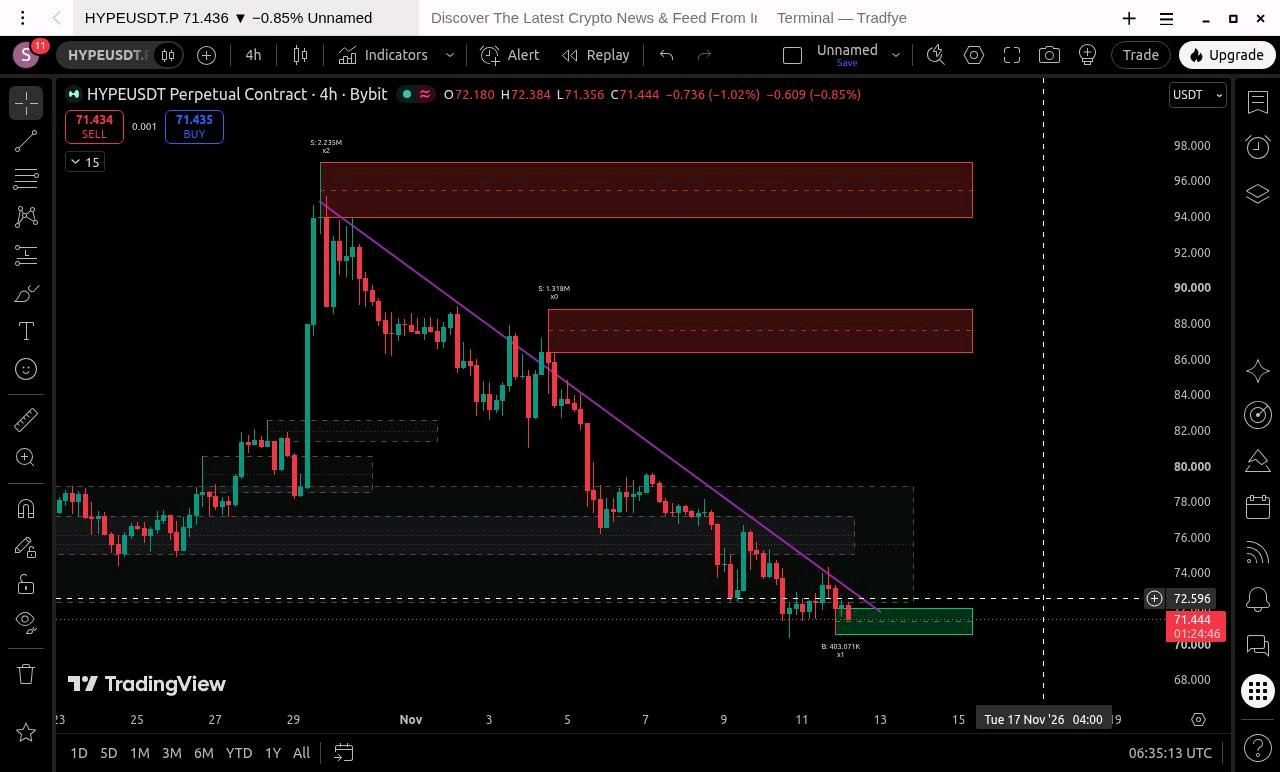
反発か、それとも暴落か? Hyperliquidは、過去最高値の97ドル付近から大幅な調整局面を迎えており、高値と安値を切り下げる展開が続いています。パープルの下降トレンドラインは、依然として続く売り圧力を明確に示しています。 現在、HYPEは71.44ドル付近で推移しており、短期的方向性を決定づける重要な分岐点に差し掛かっています。 売り手が依然として優勢 97ドルの水準で反落して以来、HYPEは下落基調を維持しており、途中でいくつかのサポートラインを割り込んできました。 市場はすでにかなりの下方向への流動性を吸収しましたが、買い手はトレンド転換を裏付ける十分な強さを示せていません。 注目すべき点は、価格が現在70ドル〜72ドルの需要ゾーンに近づいていることです。 サポート:70ドル〜72ドル これが私が注目している目先のゾーンです。 価格はこのサポートライン付近で揉み合っており、下降トレンドラインも同じエリアに接近しています。 考えられるシナリオは2つです: 強気シナリオ:もし買い手が70ドル〜72ドルの防衛に成功し、価格が力強い出来高を伴って下降トレンドラインを上抜ければ、75ドル〜76ドルへの回復、そして78ドルへの上昇が期待できるかもしれません。 弱気シナリオ:しかし、売り手が優勢を維持し、HYPEが70ドルを明確に割り込んだ場合、次の下値ターゲットは66ドル付近となる可能性があります。ここでは日足レベルのFVG(フェア・バリュー・ギャップ)を注視する必要があります。 現時点での直近の注目レベルは以下の通りです: - 70ドル〜72ドル:主要なサポートおよび需要ゾーン。 - 72.60ドル:短期的な回復の分水嶺。 - 75ドル〜76ドル:最初の戻り売り抵抗ライン。 - 78ドル〜79ドル:次の上方向の流動性/抵抗エリア。 - 86ドル〜89ドル:より高位の抵抗ゾーン。 - 94ドル〜97ドル:上値の主要な供給ゾーン。 4時間足の終値が下降トレンドラインを上回り、買いの出来高が増加すれば、回復シナリオが強まります。 その一方で、トレンドラインでの反落が繰り返され、70ドルを割り込むような動きになれば、さらなる下落が濃厚となります。 ファンダメンタルズの視点❓ ファンダメンタルズの側面でも興味深い動きがあります。Upbitが11月10日にHYPEのKRW、BTC、USDTペアの取り扱いを開始し、韓国市場でのアクセスが拡大しました。 これはアクセシビリティと流動性の観点からはポジティブなニュースですが、依然として弱気な価格構造を覆すには至っていません。上場単体では、必ずしも買い圧力を保証するものではないからです。 HYPEは97ドルの高値から大きく下落し、現在は70ドル〜72ドルの主要サポートゾーンに接近しています。 私の見解では、ここが市場にとって次なる重要な決断ポイントです。もし買い手が力強い出来高を伴って下降トレンドラインを突破できれば、78ドルへの回復が可能になるでしょう。 しかし、70ドルのサポートが崩れれば、66ドルの日足FVGエリアまでのさらなる下落拡大を見る可能性があります。 今のところ、私はこの2点を非常に注視しています👀:70ドルのサポートと、下降トレンドラインのブレイクアウトです。 どちらが主導権を握るのか、見守りましょう。 #ByXIMPACT $HYPEUSDT
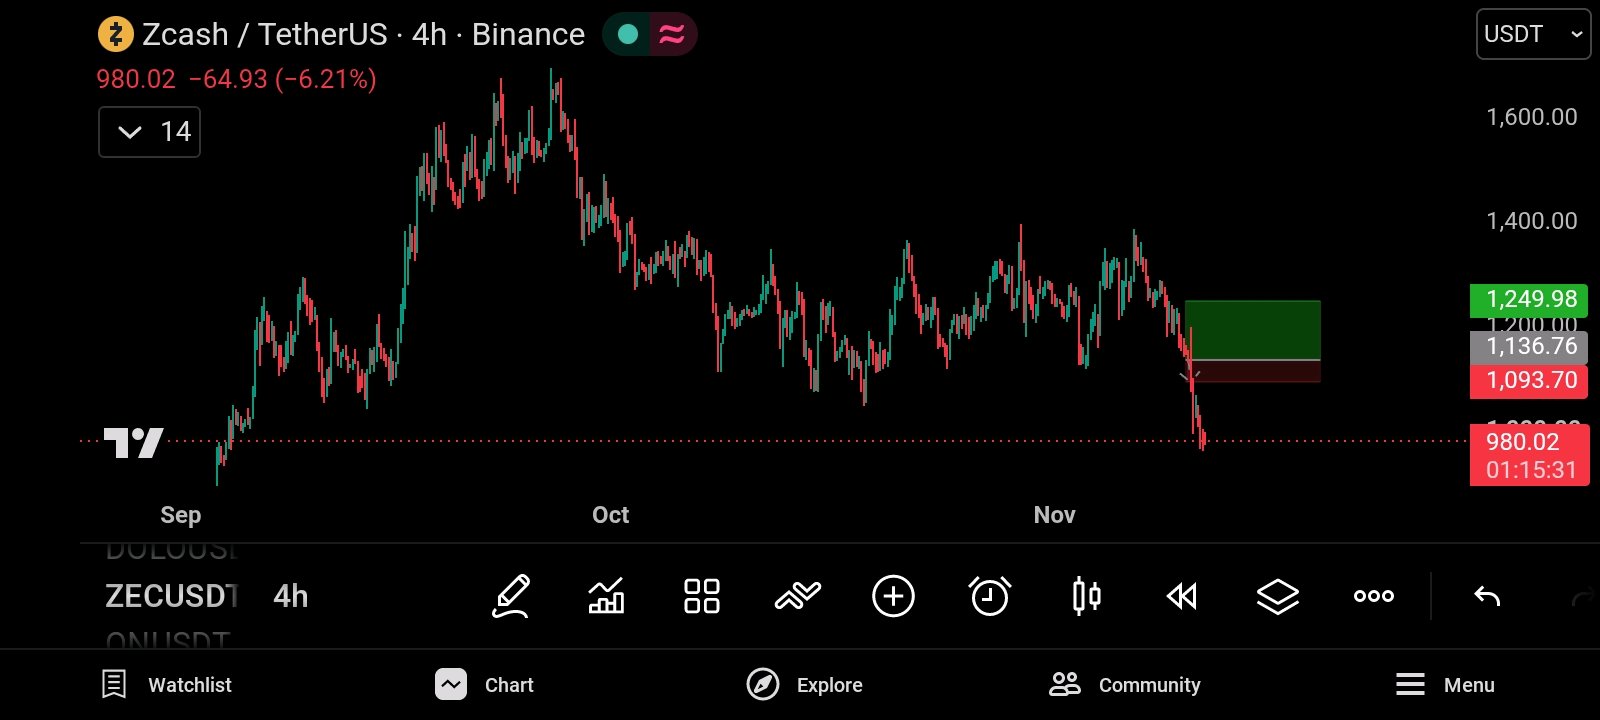
ZEC SUPPORT BREAK CONFIRMED 👌 BEARS TAKE CONTROL
Remember my previous analysis? I highlighted the possibility that ZEC could lose its important support after repeated tests. That scenario has now played out. ZEC briefly bounced from the $1,136 region toward $1,198, but buyers failed to maintain momentum. Sellers returned aggressively, broke the support structure and pushed price toward $980. So What Changed? The previous support zone failed to hold, and the recovery attempt was rejected. This suggests that buyers are losing control and that the market may be transitioning into another bearish phase. My current downside outlook is: - $980: Current chart reference area. - $910: First short target. - $800: Broader downside zone to watch. A sustained recovery above the broken support region would weaken this bearish scenario. Is Zcash Actually Weak? Interestingly, Zcash's fundamental developments are not entirely bearish. NU7 Network Upgrade: Zcash activated its major NU7 upgrade on November 6, reducing target block intervals from 75 seconds to 25 seconds. It also introduced a Network Sustainability Mechanism that directs 60% of transaction fees into a reserve. These are meaningful long-term infrastructure improvements. Privacy Ecosystem Growth: CoinDesk Research reported that Zcash's Ironwood shielded pool gained approximately 122,000 ZEC in October, while total shielded supply increased by around 27,000 ZEC to approximately 4.97 million ZEC. Institutional Interest: Grayscale's Zcash ETF share count reportedly grew by 54.2% between its August listing and October 30, indicating growing institutional exposure. However, there are also concerns. Around 12,224 ZEC remained in the retired Sprout pool following NU7 activation, and October shielded transaction activity averaged approximately 4,450 transactions per day, down around 36% from September. The interesting part is that Zcash has meaningful long term development progress, yet its price structure has weakened considerably 📉. This suggests that positive fundamentals are not currently providing enough immediate buying pressure to overcome selling activity. My short-term outlook remains cautious to bearish unless price reclaims the broken support region. My Trading Plan 🔸 Short target: $910 Broader downside area: $800 Stop loss: $1,120 I will monitor whether sellers maintain control and whether price continues forming lower highs. Risk management is essential. If entering around $980, the $1,120 stop represents approximately $140 of risk against a $70 move to the $910 target. That is only around 0.5:1 reward to risk, so the entry, target or position sizing deserves careful reassessment. #ByXIMPACT
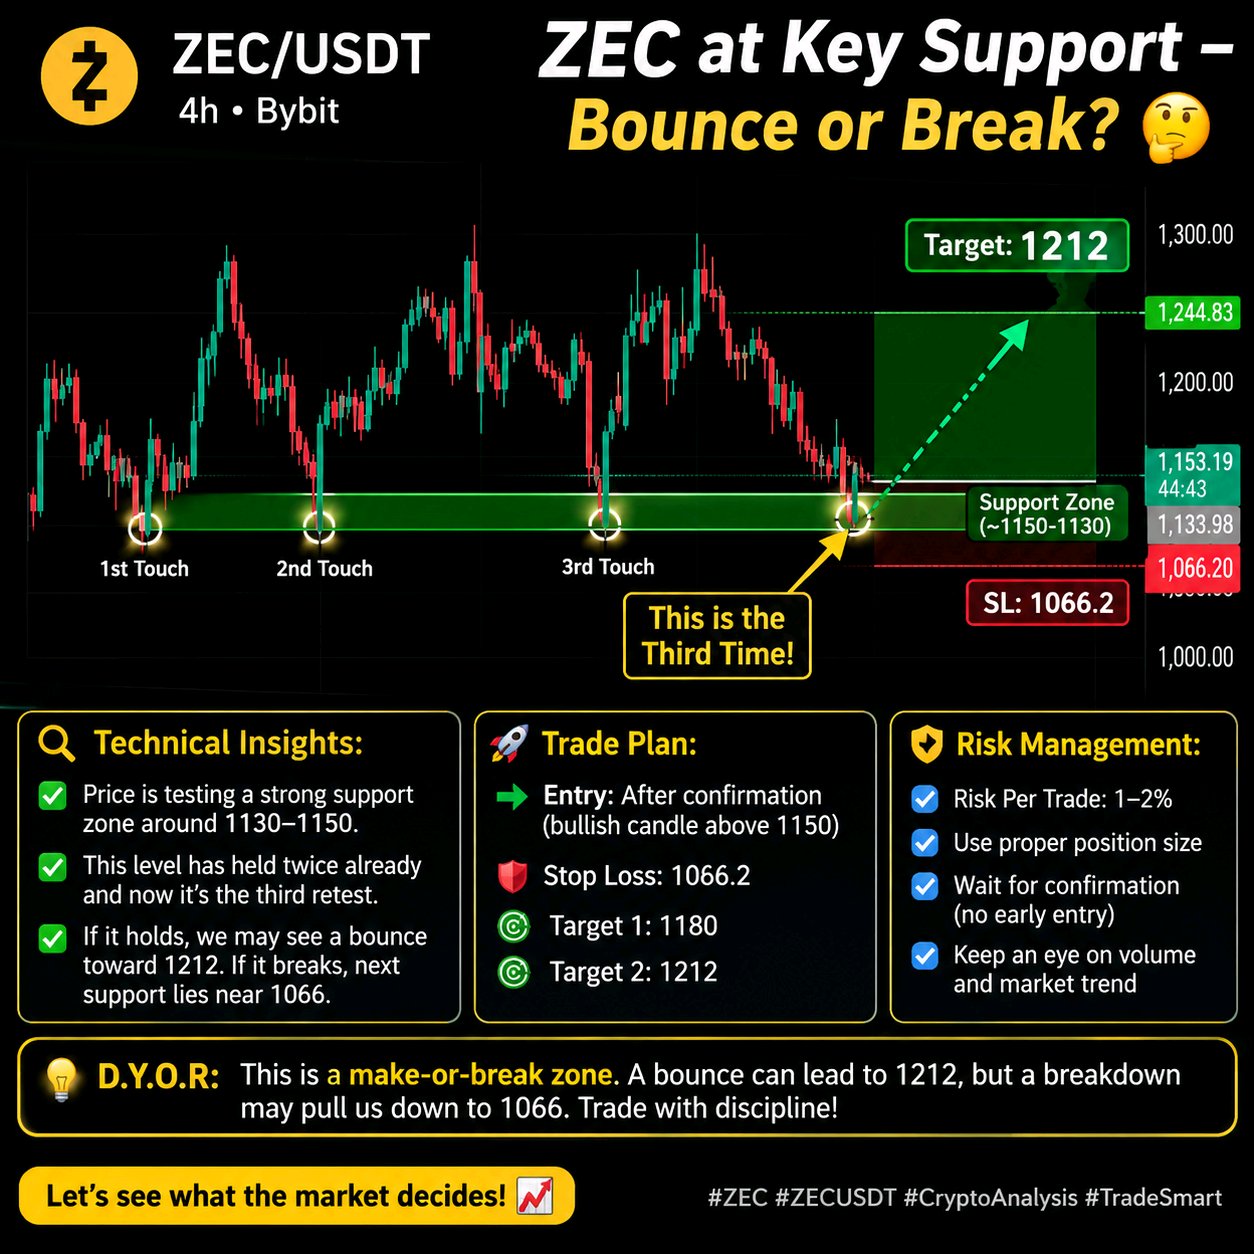
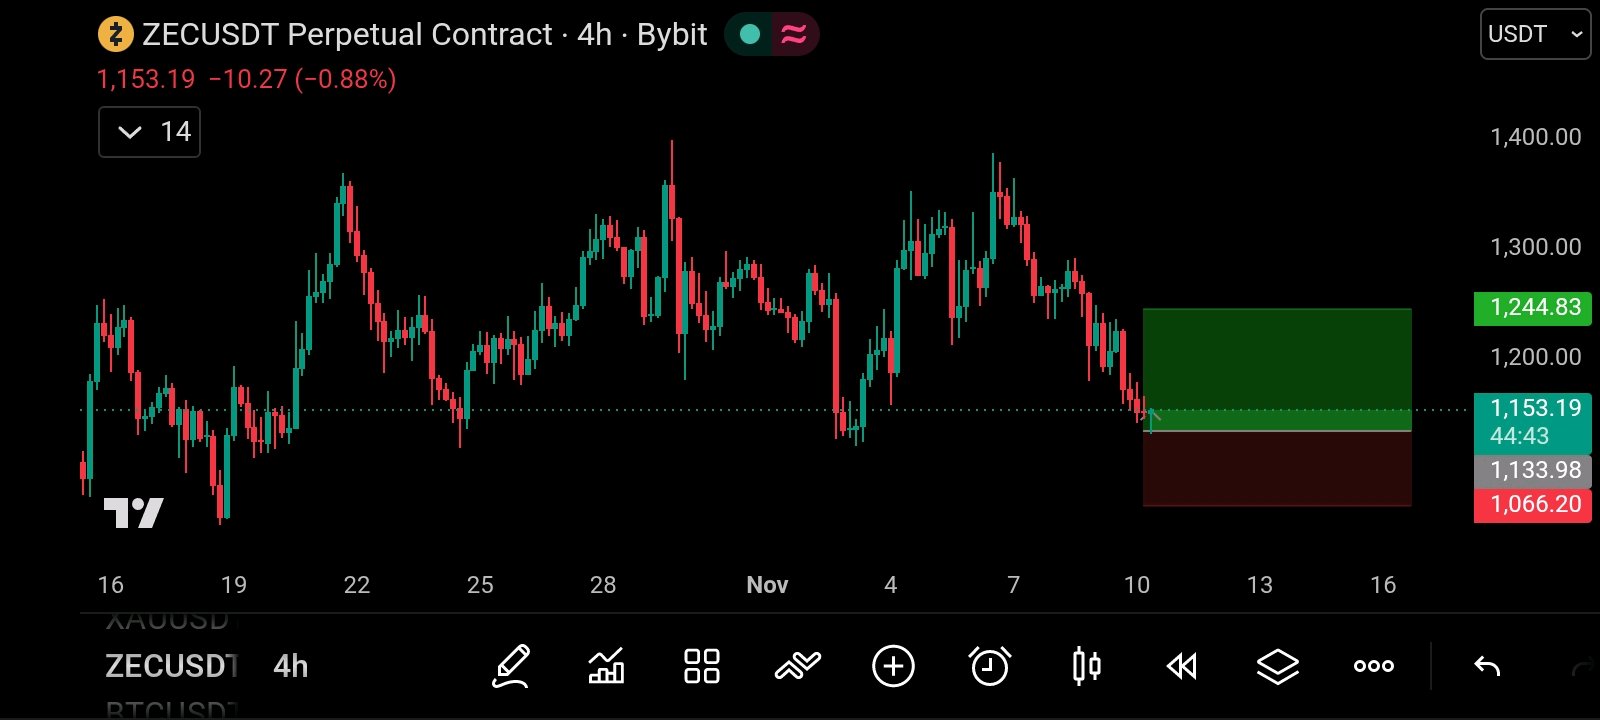
⚡ ZEC THIRD TEST OF SUPPORT BOUNCE OR BREAK?
ZEC is currently trading around $1,153, testing the important $1,134 – $1,153 support zone for the third time on the 4H chart. If buyers defend this area and we get a strong bullish confirmation, I'm interested in a potential LONG, targeting $1,212. My planned stop loss is $1,066.20. However, if support breaks decisively, the bullish setup is invalidated and further downside is possible. I'll wait for confirmation before entering no blind trades. Position sizing and risk management are essential, especially at a third support retest. Will ZEC bounce from here or finally break support? Let's see what the market decides! 👀 DYOR. Manage your risk and never trade blindly. #ByXIMPACT
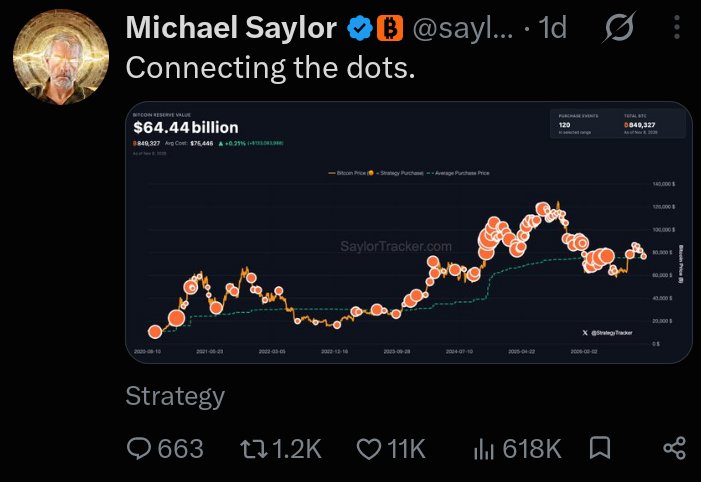
Michael Saylor dropped another Bitcoin tease!
"Connecting the dots" The Strategy chairman's latest X post has sparked speculation about another potential $BTCUSDT purchase. But there's a bigger story behind it. 🧵👇 🟠 Strategy reportedly holds 849,327 BTC, worth approximately $62.98 billion. 📉 Bitcoin falling below Strategy's average purchase price of $75,451 has pushed its holdings into roughly $1 billion in unrealized losses. Just a month ago, Strategy was reportedly sitting on nearly $10 billion in unrealized profits. A dramatic market reversal! 🐻 Bitcoin's Q4 2026 weakness is drawing comparisons with previous bearish cycles in 2014, 2018 and 2022. 📊 Analysts are also warning about weakening momentum, with BTC approaching its fifth consecutive weekly red candle. 💰 Despite the pressure, Strategy reportedly maintains $4.9 billion in USD reserves and recently acquired $208 million worth of STRC. 👀 Now everyone's watching Michael Saylor. Does "Connecting the dots" hint at another Bitcoin purchase? Or is it simply another message about his long term BTC conviction? One thing is clear that Strategy's Bitcoin strategy is facing another major market test. #IMPACTbyTrade #MidtermsMarketWatch
Bybit、Web Summitを通じて欧州でのプレゼンスを拡大
Bybitは、オーストリアでの主要な規制当局の承認に続き、リスボンで開催されるWeb Summit 2026とのパートナーシップを通じて、欧州のデジタル金融セクターにおける地位を強化しています。 🗝️ 11月9日から12日まで開催されるWeb Summit 2026は、Bybitにとって、欧州戦略、フィンテックイノベーション、そして人工知能への注目の高まりを紹介する機会となります。 同社の拡大における大きなマイルストーンは、欧州事業が達成した規制上の進展です。2025年5月、Bybit EU GmbHは欧州連合のMiCA枠組みの下で暗号資産サービスプロバイダー(CASP)としての承認を受けました。さらに最近では、2026年8月にBybit Payments GmbHがオーストリア金融市場局(FMA)から電子マネー機関(EMI)ライセンスを取得しました。 これらの承認は、Bybitが欧州経済領域(EEA)全域で規制された暗号資産、電子マネー、決済サービスを拡大するための基盤を確立するものです。 Web Summit期間中、Bybitの経営陣は、暗号資産規制、AIを活用した金融インフラ、デジタル金融の未来に関する議論に参加します。また、同社は自律型取引エージェントに焦点を当てたマスタークラスも開催する予定です。 Bybitは暗号資産取引にとどまらず、決済、米国株、ETF、投資サービスといった分野の機会も模索しています。 世界中で8,000万人以上のユーザーを抱えるBybitは、暗号資産サービス、従来の金融商品、そして新興のAI技術を組み合わせた、より包括的なデジタル金融プラットフォームとしての地位を築きつつあります。 Bybitの欧州展開は、取引所が総合的な金融サービスプロバイダーになるべく競争する中で、暗号資産$BTCUSDT 、従来の金融、そして人工知能の融合が進んでいることを浮き彫りにしています。 #BybitAI進化中
BNB Chain Dominates Daily Activity
🔥$BNBUSDT Chain just hit 4.86 million active addresses in the last 24 hours ranking #1 among all public blockchains. For comparison: • Solana → ~1.97M • Ethereum → ~535K • Base → ~312K That’s roughly 2.5x Solana and 9x Ethereum in daily active addresses.$SOLUSDT Strong on chain activity continues even as BNB price sits near $684. #NovUSCPIWatch #BybitAIEvolving #WSOT2026

BTC next year !?
Guys what is your analysis about $BTCUSDT for next year 🙃 ? Are we heading towards another massive bull run, or should we expect a major correction? 🤔📈 Would love to hear your thoughts and predictions! 🚀
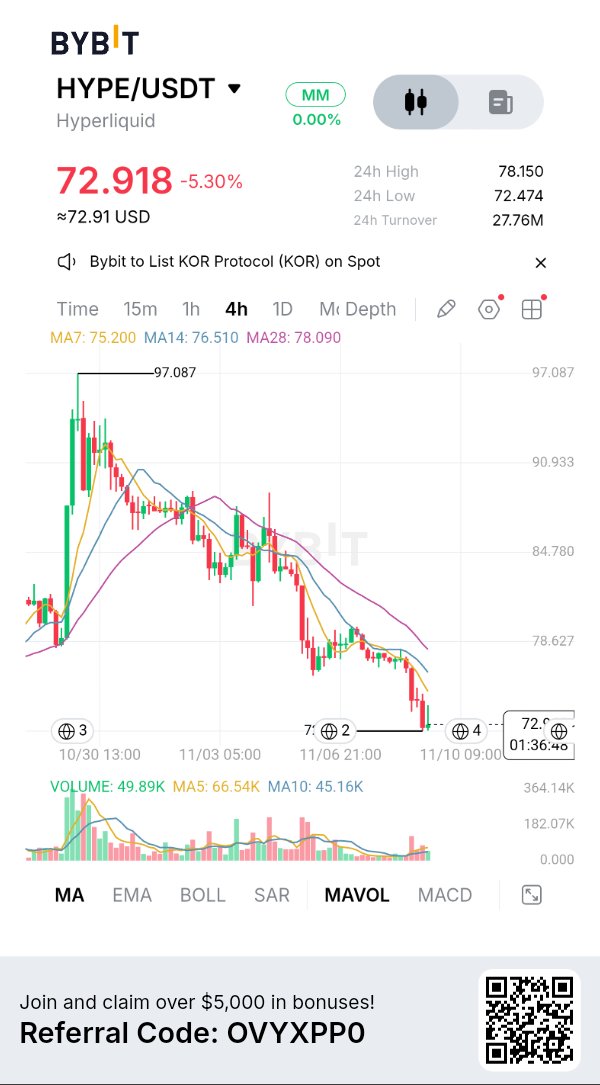
HYPE has pulled back significantly from its $97 peak and is working to build a base at $72.00 – $75.00 🌐⚡. While ecosystem fundamentals like the Elysium L2 launch are strong, price action demands patience 📊. The key level to watch is $75.20 — reclaiming it is the first true signal of recovery 💎📈. Keep your position sizing disciplined and let the market confirm the reversal! What’s your take? Are you buying the $72 support or waiting for a $75.20 reclaim? Drop your thoughts below! 👇$HYPEUSDT #IMPACTbyTrade
🚀 SOLANA:回復は近い?
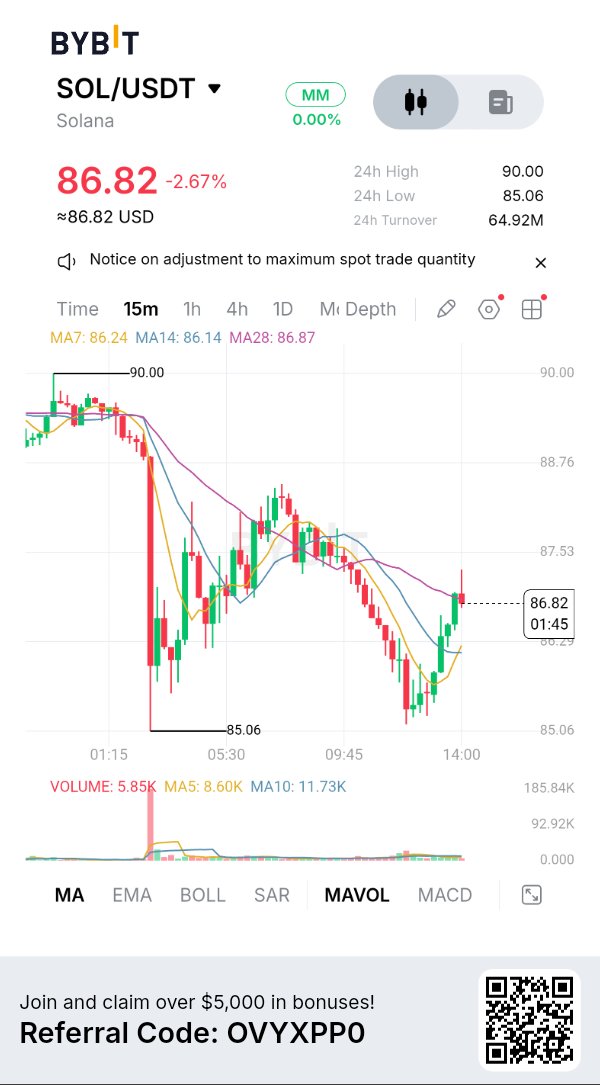
SOLUSDTは96ドルのレジスタンスゾーンから85ドル付近まで急落しましたが、15分足チャートでは買い圧力が強まってきているようです。もしSOLが88.25ドルを確実に取り戻せば、90ドル、さらには92ドルへの回復が見込めます。ロングのセットアップが形成される可能性はありますが、4時間足のトレンドは依然として弱気なので、焦らず適切なリスク管理を行うことが不可欠です。 SOLは反発できるか? 👀📈 #SOLUSDT #11月米国CPIウォッチ #WSOT2026
🚨 $344M IN BITCOIN MOVES
A massive Bitcoin transfer has put Trump Media under the market spotlight. Wallets labeled “2028 Convertible Notes Collateral” reportedly moved 4,259 BTC, worth approximately $344 million, to a Crypto.com address in two transactions. That's nearly 30% of Trump Media's reported Bitcoin holdings. But a transfer doesn't automatically mean a sell off. Similar movements in May and August reportedly did not lead to market liquidation, suggesting custody restructuring or collateral management could be behind the latest move.$BTCUSDT The bigger concern is November 30. According to the reported securities filings, noteholders may have the right to demand up to $1 billion in cash redemptions. With previously reported cash reserves of around $425 million, investors are watching closely for any signs of asset sales or further collateral arrangements. The key question: Is this simply institutional balance-sheet management, or could Bitcoin become a source of liquidity for upcoming corporate obligations? For now, the transfer is confirmed by the reported on-chain movement, but an actual Bitcoin sale has not been established. Don't confuse wallet activity with market selling pressure. 📊 #WSOT2026 #NovUSCPIWatch #USPayrollsAndRateDecisionsDriveMacroWeek

Bitcoin on Decision point
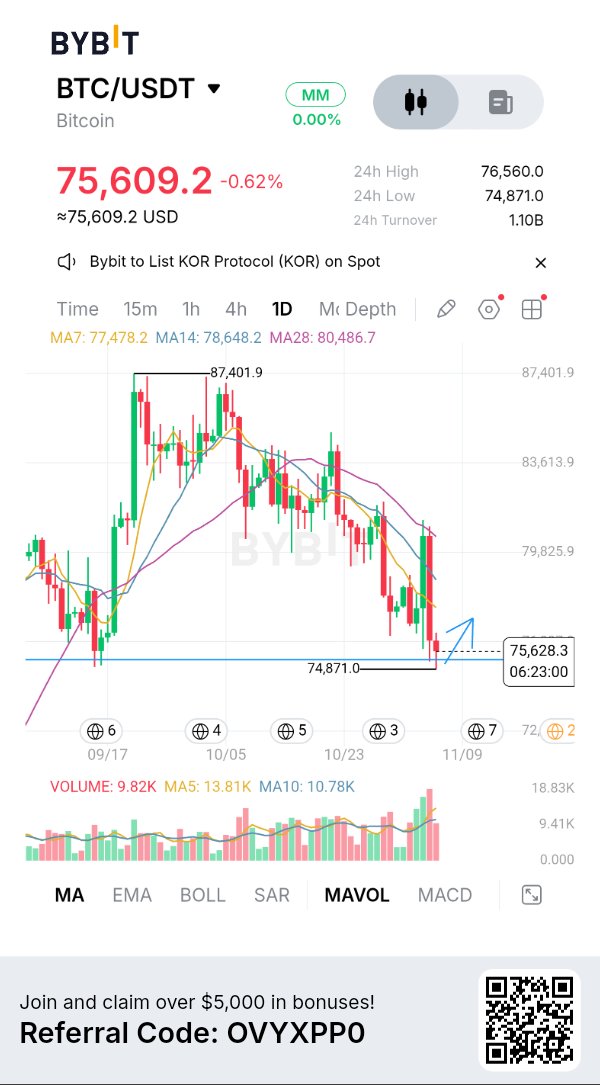
$75K SUPPORT — WILL BULLS DEFEND THE FLOOR? 🚀 Bitcoin is currently pressing into the critical $75,000 support region after a continuous pullback from local highs near $87,400 🌐. The Daily chart highlights a liquidity sweep down to $74,871, putting the market at a pivotal make or break juncture 📈. This is a major key level where buyers need to step in to prevent a deeper macro correction. Can $BTCUSDT stabilize here and launch a recovery toward $78,000–$80,000, or do we need further downside liquidity before a true bounce? Let’s break it down 🧠. 1. The $75K Support Test: Key Observations 🔍 Price action on the 1D timeframe shows clear selling pressure dragging BTC below its moving averages (MA7: $77,478, MA14: $78,648, MA28: $80,486) 📉. Liquidity Sweep: BTC swept lower to $74,871 before absorbing immediate selling pressure, leaving a small wick on the daily candle 🟢. Volume Profile: Daily volume shows persistent selling, but volume is beginning to contract near the support floor, indicating potential seller exhaustion 🛡️. 2. The Recovery Targets: What Bulls Need to Claim 🧱 If buyers defend this daily support floor, the primary objective will be reclaiming the overhead moving averages 📊. Immediate Resistance: $77,400 – $78,600 (Confluence of MA7 and MA14) 🛑 Major Breakout Target: $80,400 MA28 defense line 🚀 Extended Upside Target: $83,600 – $87,400 Macro swing high reclamation 🎯 The Bullish Scenario: A strong daily candle close back above $76,500 confirms aggressive buying interest, opening the doors for a rapid relief rally toward $78,000–$80,000 ⚡. The Cautionary Scenario: If BTC fails to hold the $74,800 low and loses daily support, the market risks extending its pullback toward lower demand zones before establishing a permanent bottom 📉. 🎯 Key Levels to Watch 👀 Current Resistance: $77,478 MA7 line 🛑 Major Breakout Zone: $78,600 – $80,486 (MA14 & MA28 confluence) 🟢 Critical Support Floor is $74,871 – $75,000 Local low & daily demand 🛡️ Macro Upside Target: $78,000 – $80,000 (Relief rally targets)$XRPUSDT 🎯 for now Bitcoin is putting buyers to the test at the $75,000 support zone 🌐⚡. While a bounce toward $78,000–$80,000 remains a solid high-probability scenario, we still need actual buying volume and a strong daily closing reaction to confirm the reversal 💎📈. Don't rush into unconfirmed trades wait for structural confirmation, respect your stop losses, and trade disciplined. What’s your plan,Are we holding $75K for a reversal to $80K, or breaking lower first? Drop your thoughts below! 👇 #IMPACTbyTrade #WSOT2026 #NovUSCPIWatch