
Ansarweb3
15606いいね0シェア701ファン603フォロー
Web3 / Crypto Trader | Graphic Designer | Open to work: CM / Mod / Ambassador | Bybit Creator
Web3 / Crypto Trader | Graphic Designer | Open to work: CM / Mod / Ambassador | Bybit Creator
CAP/USDT: 30%急騰後の押し目買い
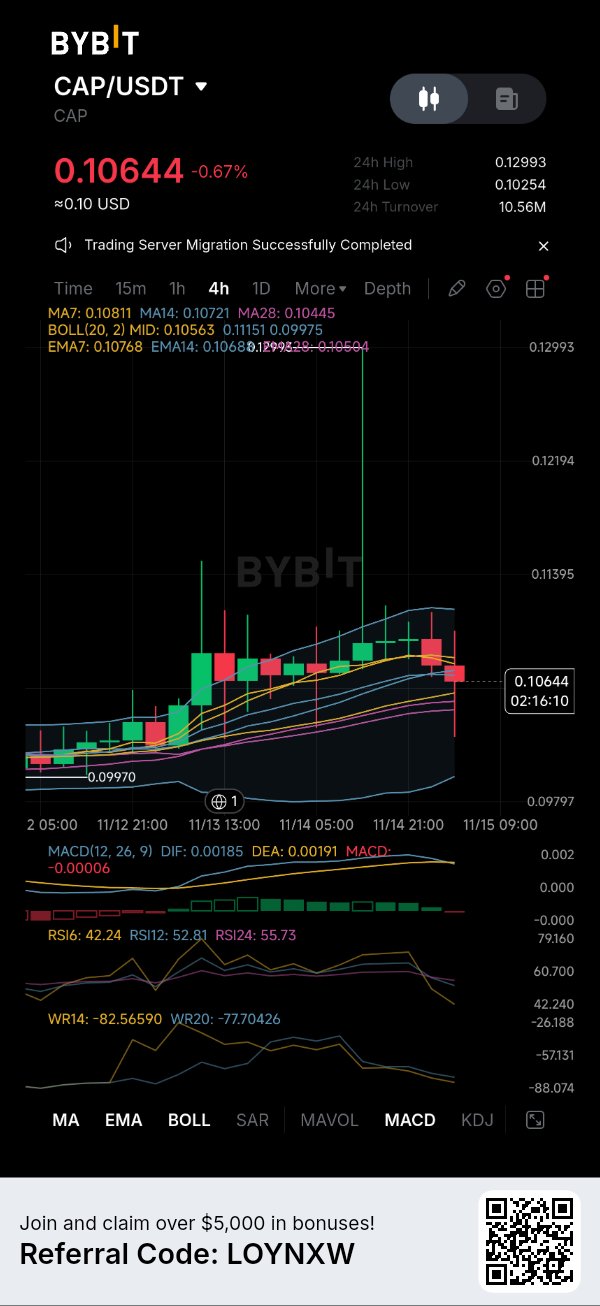
$CAPUSDT は、$0.09970 から回復し一時的に $0.12993 まで上昇したことで私の注目を集めました。 しかし、4時間足チャートでは勢いが落ち着きつつある兆候が見られます。前回のラリーを追いかけるのではなく、慎重なエントリーポイントを探ることに注力しています。 テクニカル分析 現在の価格は約 $0.10644 です。 MA7($0.10811)とMA14($0.10721)は現在価格の上にありますが、MA28($0.10445)はまだ下にあります。 MACDは弱気の兆しを見せており、DIF(0.00185)がDEA(0.00191)をわずかに下回っています。 RSI6は42.24まで低下しましたが、RSI12とRSI24は50以上を維持しています。 これは、広範な回復構造が完全に崩れたわけではないものの、短期的な売り圧力があることを示唆しています。 取引戦略 次の2つのチャンスを注視しています: 1. $0.1045〜$0.1056付近へのプルバック後の強気確認。 2. 4時間足での $0.1081 の回復と、その後のリテストの成功。 上昇目標は $0.1115 と $0.1140 です。 $0.1025 の領域は、私の重要な下値無効ライン(インバリデーション)です。 サポートが機能しなくなった場合、無理にトレードをするよりも強気のセットアップを諦めるつもりです。 リスク管理が最優先です。 陽線を追いかけることは避け、エントリー前に無効ラインを定義し、許容損失額に基づいてポジションサイズを検討します。 教訓は単純です。力強い上昇ラリーが、すべてのプルバックが絶好のチャンスであるという意味ではありません。確認が重要です。 投資助言ではありません。DYOR(自分で調べましょう)。 #WSOTあなたのAI取引を見せて10USDTを獲得
ZEC Below $1,000: Is $959 the Last Support?
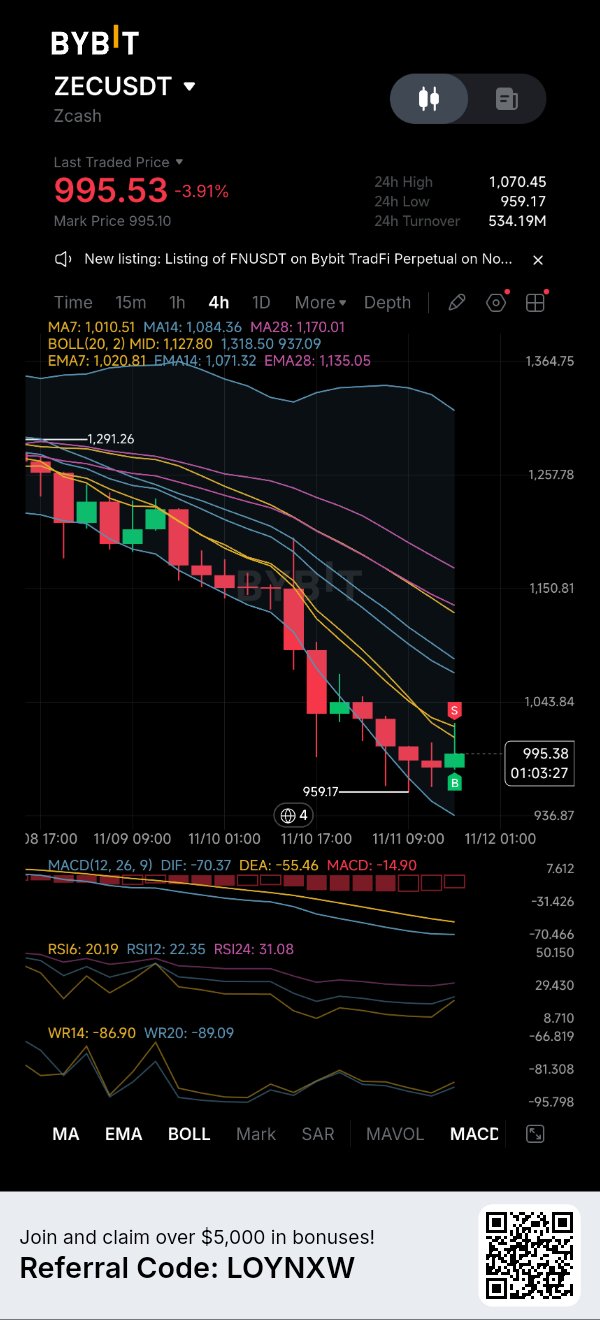
Zcash ($ZEC) is struggling to stabilise after an aggressive sell-off pushed price from above $1,290 toward the $959 region. Currently trading around $995.53, ZEC remains under pressure, with the 4H chart showing a clear bearish structure. What the indicators reveal: • Price is below MA7 ($1,010.51), MA14 ($1,084.36) and MA28 ($1,170.01). • MACD remains bearish, with DIF at -70.37 below DEA at -55.46. • The MACD histogram is negative at -14.90, confirming continued selling momentum. • RSI6 stands at 20.19, RSI12 at 22.35 and RSI24 at 31.08, indicating deeply oversold conditions. Key levels to watch: - Immediate support: $959.17 - Next support zone: $937–$936, around the lower Bollinger Band - First resistance: $1,010–$1,021 - Second resistance: $1,043–$1,071 - Major resistance: $1,084–$1,135 A sustained defence of $959.17 could create room for a relief bounce toward $1,010. However, a decisive breakdown below this support could expose the $937 region. For bulls, reclaiming $1,021 would be an early recovery signal. A stronger reversal would require overcoming the higher moving-average resistance zones. The key observation: ZEC is deeply oversold, but oversold conditions can persist during strong downtrends. Buying pressure needs to show up before the bearish structure can change. Watch the $959 support, avoid chasing speculative rebounds and define your invalidation before considering a trade. Can ZEC defend $959, or are sellers preparing another leg lower? #ZEC #Zcash #Bybit Not financial advice. DYOR. #WSOT2026 #USInflationRunsHotAndRateHikeBetsRise #BitcoinHitsTwoMonthLowAfterUSMidterms #AITechSelloffErases2Point5TrillionFromNasdaq100 #DeutscheBankLaunchesDigitalAssetCustody $BTCUSDT $ETHUSDT
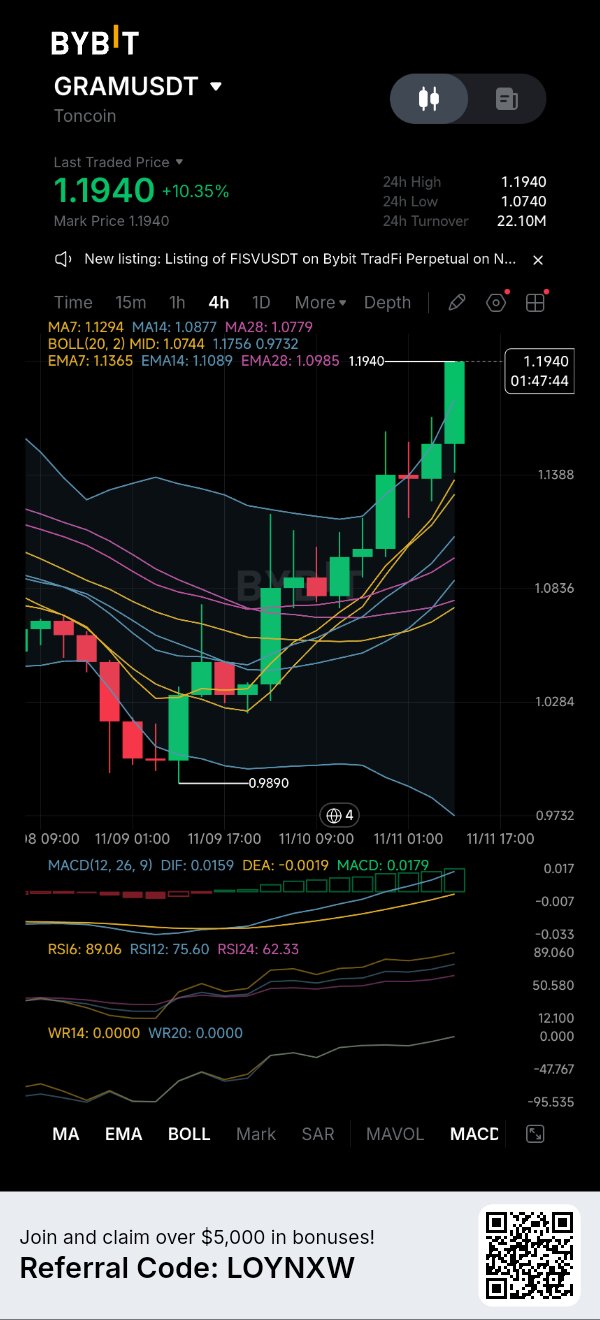
GRAMが10%上昇:強気派は1.20ドルの壁を突破できるか?
$GRAMUSDTは、$0.9890の直近安値から回復し、素晴らしい勢いを見せています。 価格は現在$1.1940付近で取引されており、10.35%上昇しています。連続する強気キャンドルが心理的抵抗線である$1.20に向けて押し上げています。 4時間足の構造は決定的に強気に転じました: • 価格はMA7($1.1294)、MA14($1.0877)、MA28($1.0779)を上回っています。 • MACDは強気で、DIF(0.0159)がDEA(-0.0019)を上回っています。 • MACDヒストグラムは0.0179まで拡大しており、勢いの強化を確認しています。 • RSI6は89.06、RSI12は75.60であり、市場が極めて買われすぎの状態であることを示しています。 強い買い圧力がありますが、価格と移動平均線の乖離は、このラリーには一服する期間が必要かもしれないことを示唆しています。 注目すべき重要な水準: - 即時のレジスタンス:$1.1940 - 心理的レジスタンス:$1.2000 - 第1サポート:$1.1756 - 第2サポート:$1.1365~$1.1294 - より強力なサポート:$1.1089~$1.0985 $1.1940を維持してブレイクアウトすれば、$1.20が焦点となる可能性があります。しかし、この水準付近で拒否されれば利益確定売りが誘発され、$1.1756が監視すべき最初の重要なサポートとなるでしょう。 強気の勢いは明らかですが、RSIが89を超えていることは、現在のローソク足を追うことへの警告です。 取引の焦点:値固め、制御されたプルバック、または確認されたブレイクアウト後のリテストに注目してください。流動性を確認し、無効化水準を定め、ポジションを検討する前にリスク・リワードを評価してください。 GRAMはこの勢いを維持して$1.20を超えられるでしょうか、それとも買い手が先に一息つくでしょうか? 投資助言ではありません。DYOR(ご自身で調査してください)。 #WSOT2026 #11月米国CPIウォッチ #WSOTPicktoEarn10U #米国雇用統計と金利決定が主導するマクロ週 #原油価格の変動がイランの和平交渉に連動 $GRAMUSDC

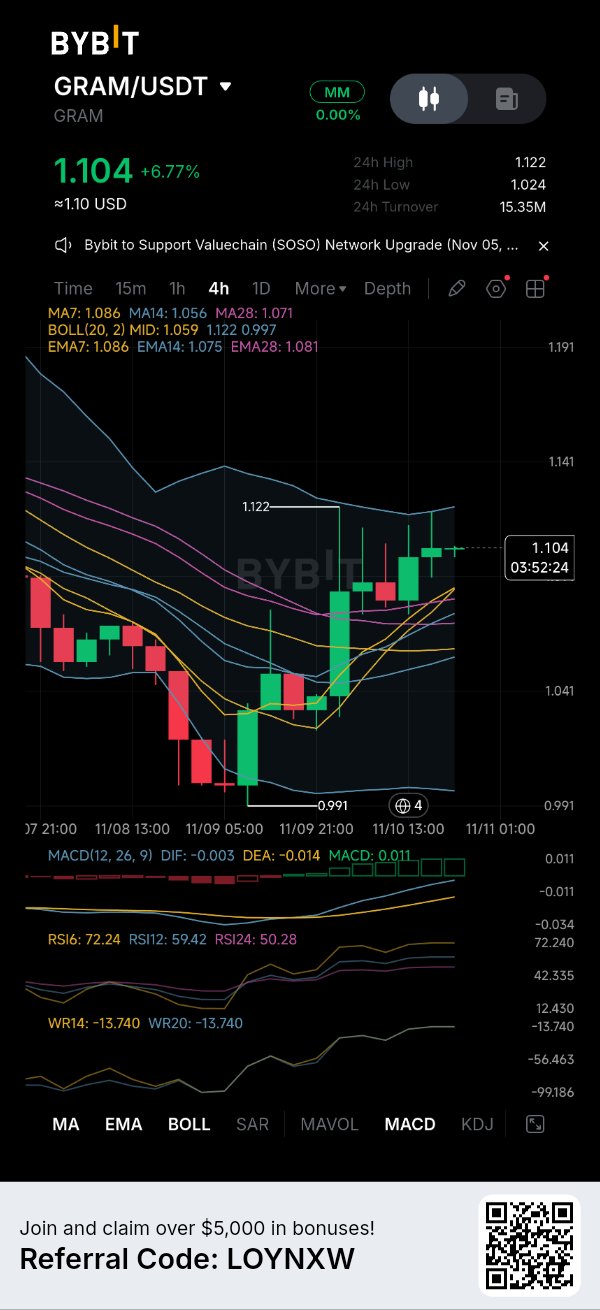
GRAMが1.122でアッパーバンドにタッチ
$GRAMUSDTは1.104です。24時間の高値は1.122、安値は1.024、このペアの出来高は15.35Mです。ウィンドウ上のマークされた高値は1.122、安値は0.991です。 価格は平均線より上にあります。MA7は1.086、MA14は1.056、MA28は1.071です。EMAも近くに位置しており、それぞれ1.086、1.075、1.081です。ボリンジャーバンドのミドルバンドは1.059、エッジは1.122 / 0.997です。スポット価格はクラスターを突き抜け、セッション高値でもある1.122の上部バンドの下にあります。0.991の安値が下のベースとなっています。これは上値抵抗への押し込みであり、その上でのクローズではありません。 MACDはヒストグラムが緑で、DIFは−0.003、DEAは−0.014、MACDは0.011です。DIFはDEAの上にあります。RSI6は72.24、RSI12は59.42、RSI24は50.28です。短期の指標は高水準ですが、長期の指標はまだブレイクしていません。 $GRAMは、以前はToncoinと呼ばれていたThe Open Network (TON) のネイティブトークンです。ネットワーク上のトランザクション手数料の支払いやステーキングに使用されます。循環供給量は約28.5億です。総供給量はそれより多く、主要なトラッカーにはハードキャップの記載はありません。これが構造です。4時間足のレベルを書き換えるものではありません。 $GRAMのレベル: - 1.122 — 上部バンドおよびセッション高値 - 1.086 — MA7およびEMA7 - 1.059 — ミドルバンド - 0.997 / 0.991 — 下部バンドおよびマークされた安値 強気シナリオ: 1.086が維持され、$GRAMが1.122を超えてクローズする。 弱気シナリオ: 1.122の下で4時間足が拒絶され、RSI6が72ある状態で、1.086を割ってミドルバンドに向かう。 1.122のバンドをクリアすべきラインとして扱いますか、それとも1.086を下回るクローズを待ってから上昇が終わったと判断しますか? 投資助言ではありません。DYOR(自分で調べて判断してください)。 #WSOT2026 #11月米国CPIウォッチ #WSOTPicktoEarn10U #米国雇用統計と金利決定が主導するマクロ週 #原油価格の変動がイランの和平交渉に連動 $BTCUSDT

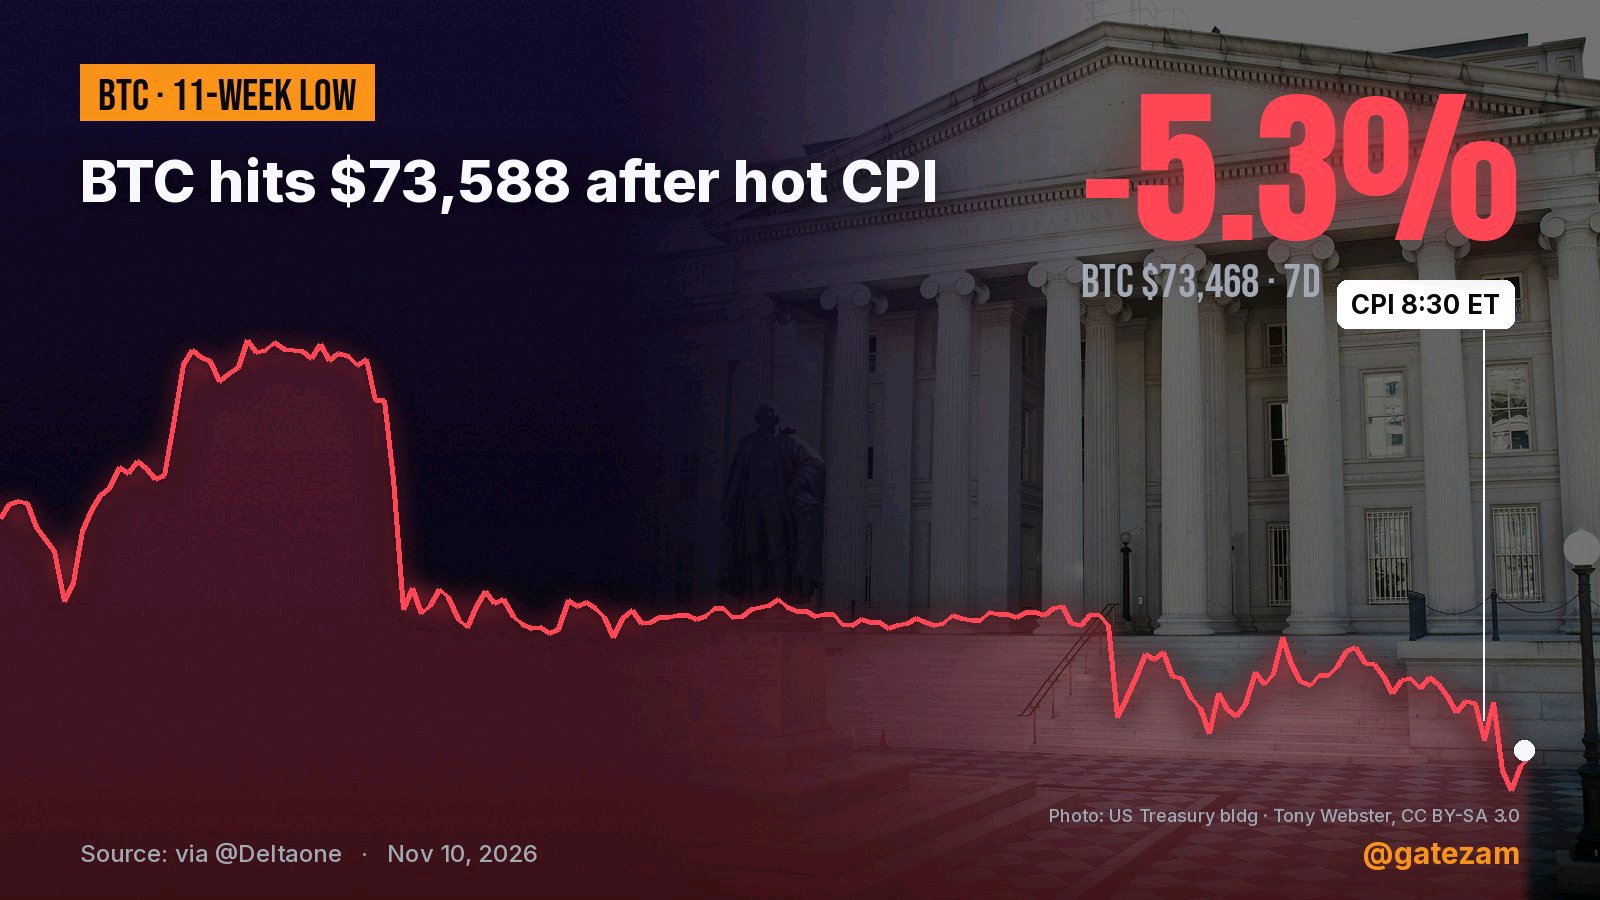
BTC Holds $73.4K: Hot CPI Triggers Band Defense
Bitcoin is testing lower Bollinger Band support following a hotter-than-expected US CPI release that pushed headline MoM inflation to 0.4% against 0.3% estimates. While intraminute volatility spiked across a $1,250 range, spot price is finding immediate absorption near its lower band boundary as $5.43B in 24-hour volume defends the $72.6K local floor. On Bybit, $BTC trades near $73,456.10 (-1.59%), holding just above its $72,686.60 intraday low after rejecting the $75,408.00 high on $5.43B turnover. What the 4H Bybit chart reveals: * Lower band extension: Price pierced toward the lower Bollinger Band ($73,321.66) to test the $72,686.60 support wick before stabilizing. * Moving average overhead: Overhead dynamic resistance is stacked at MA7 ($74,359.52), MA14 ($74,698.89), and MA28 ($75,285.03), anchored by the 20-period mid-band ($75,046.29). * Momentum compression: Daily RSI(6) dropped into oversold territory at 32.61 (RSI12 at 35.06) with WR14 at -77.94. The MACD histogram sits at -94.59 with DIF (-733.40) tracking beneath DEA (-638.81), signaling short-term momentum deceleration. Macro inflation & liquidity catalysts: The hotter inflation print (Headline MoM +0.4%, Core MoM +0.3%) driven by energy (+0.7%) and recreation (+0.8%) reinforces federal interest rate policy caution. However, liquidity absorption remains robust as Bybit announced auto-repayment functionality updates for UTA accounts, maintaining high derivatives turnover across major desks. Two execution setups on watch: * Support defense: Defending the $73,321 lower band floor and reclaiming MA7 ($74,359) opens a mean-reversion move targeting the $75,046 mid-band. * Breakdown continuation: A confirmed 4H close below $72,686 invalidates short-term support, opening a secondary drop toward the $70,500 macro demand shelf. Check live order book depth, liquidation clusters, and funding rates on the Bybit card below before entering positioning. #ByXIMPACT Not financial advice. DYOR. #WSOT2026 #NovUSCPIWatch #WSOTPicktoEarn10U #USPayrollsAndRateDecisionsDriveMacroWeek #OilVolatilityTracksIranPeaceTalks $BTCUSDT $BTCUSDC

CAP Holds Above the Mid Band Under 0.106
$CAPUSDT is 0.10281. 24h high 0.12862, low 0.09854, turnover 11.01M on this pair. The marked high on the window is 0.12862. The marked low is 0.09236. Price is above the averages. MA7 is 0.10070, MA14 0.10098, MA28 0.10122. EMAs sit nearby: 0.10132, 0.10091. Bollinger mid is 0.10086, edges 0.10608 / 0.09563. Spot is through the cluster and under the upper band at 0.10608, well below the 0.12862 high. The 0.09236 low is the base below. That is a hold above the mid-band, not a break of the lid. MACD is still soft: DIF 0.00155, DEA 0.00195. DIF is under DEA and the histogram is red. RSI6 is 64.22, RSI12 57.31, RSI24 56.89. Fast clock is rising but not extreme. $CAP is the governance and utility token of Cap, an Ethereum-based covered credit protocol. The protocol issues cUSD (a dollar stablecoin) and stcUSD (its yield-bearing version). Depositors supply stablecoins; underwriters post collateral to cover loans to institutional borrowers. Total supply is fixed at 10 billion. A large portion remains in a timelock. That is the structure. It does not rewrite the 4h levels on the chart. Levels on $CAP: - 0.10608 — upper band - 0.10132 / 0.10070 — EMA7 and MA7 - 0.10086 — mid-band - 0.09563 / 0.09236 — lower band and marked low - 0.12862 — session high Bullish case: 0.1007 holds and $CAP closes above 0.106. Bearish case: a 4h reject under 0.106, with MACD still red, sends it back through 0.1007 toward the lower band. Would you treat the 0.106 upper band as the line that has to clear, or wait for a close back under 0.1007 before calling the hold done? Not financial advice. DYOR. #WSOT2026 #NovUSCPIWatch #WSOTPicktoEarn10U #USPayrollsAndRateDecisionsDriveMacroWeek #OilVolatilityTracksIranPeaceTalks
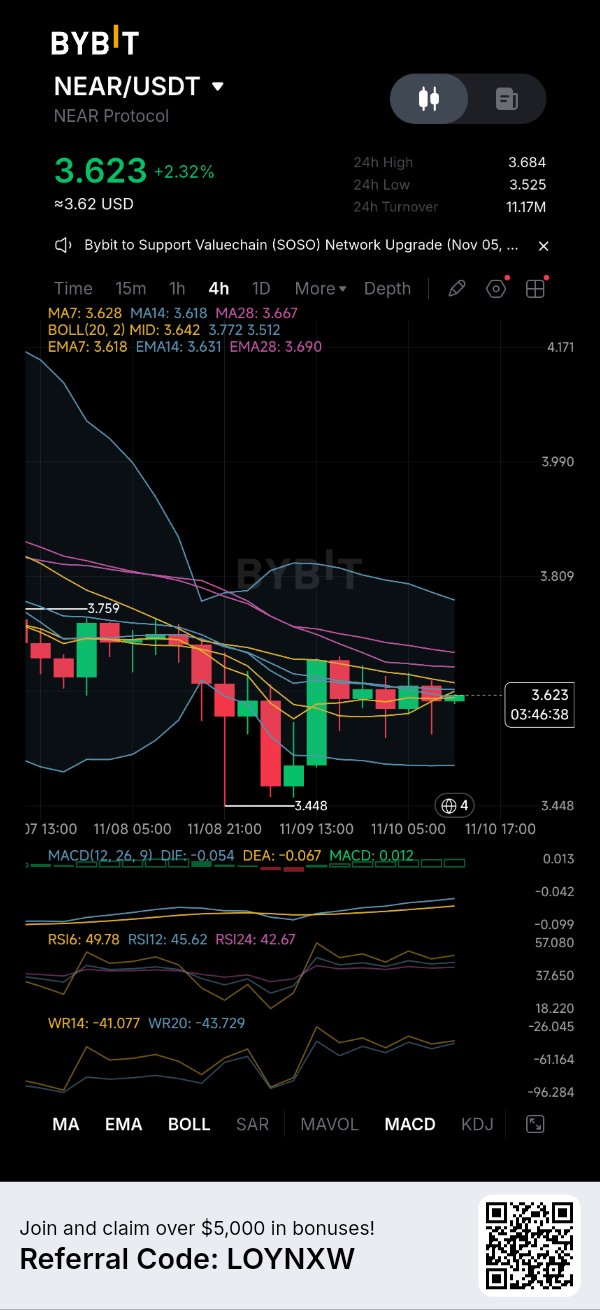
NEAR cut its issuance. Price didn't care.
$NEARUSDT just approved cutting its max issuance from 2.5% to 1.6% over 24 months. Price hasn't cared. Here's why. The cut is real but not live. It still needs Security Council review, a roughly 90-day grace period and validator adoption. It also lowers projected staking yield from about 5.3% to 3.4%, so it's a trade-off, not a free win. Meanwhile demand is soft: futures open interest fell to 230M NEAR from 318M on Oct 22, and NEAR is down about 39% from its October peak. 4H view: 3.623 is pinned on the MA7/MA14 (3.628 / 3.618), with MA28 and EMA28 overhead at 3.667-3.690. Bands are tightening and MACD is flat near zero. That's a squeeze. Bull: 4H close above 3.690, then 3.759 (last swing high). Bear: 4H close under 3.448 (swing low, near the 3.40 support analysts flag). Supply news matters over years. Price decides in days. Would you buy NEAR on a tokenomics change that isn't live yet? Not financial advice. DYOR. #WSOT2026 #NovUSCPIWatch #WSOTPicktoEarn10U #USPayrollsAndRateDecisionsDriveMacroWeek $NEARUSDC

SOL leverage is cleared. The buyers aren't back
$SOLUSDT is down about 30% from its late-September high near $124, and the leverage looks cleared. Futures open interest fell to $5.10B, the lowest since Aug 19. So why isn't it bouncing? Because the spot bid is missing. SOL ETFs have had five straight weeks of outflows (nearly $170M), with about $8.8M more provisionally out on Monday. 4H view: price 85.15 sits under MA7/14/28 (86.33 / 87.30 / 88.61), just above the lower band (84.52). RSI6 is 31 and WR is -95, so it's oversold. But the MAs all slope down and rebounds keep stalling under them. I don't see a base yet. Bull: 4H close above 88.61 (MA28/EMA28), then the broken trendline near 90-92 is the real test. Bear: 4H close under 84.89 puts 82 in play, then the 77.60 demand zone. Leverage gone, buyers missing. Do you wait for ETF flows to turn, or buy the oversold? Not financial advice. DYOR. #IMPACTbyTrade #WSOT2026 #NovUSCPIWatch #WSOTPicktoEarn10U #USPayrollsAndRateDecisionsDriveMacroWeek #OilVolatilityTracksIranPeaceTalks $BTCUSDT
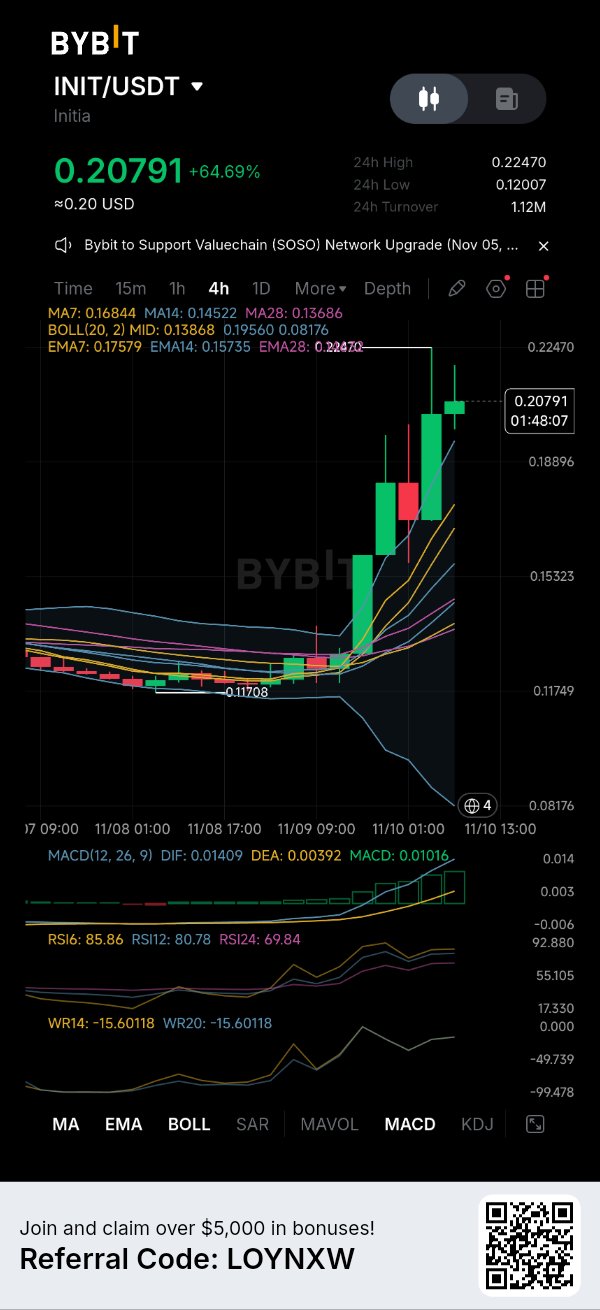
INIT +65% on a halted chain. Not a thesis.
$INITUSDT is up 65% while its own chain is paused after an exploit. Read that again before you chase. Reported facts: attackers used compromised rollup keys to forge IBC transfers and drain about $605K in USDC, and the L1 paused block production. That follows an Oct 23 exploit of about $2.7M. Yet price ripped, with spot volume around $33M against futures volume near $883M, and funding deeply negative (about -1.8%). Negative funding means shorts were paying longs. That reads like a squeeze, not adoption. 4H view: 0.20791 is above the upper band (0.1956), RSI6 is 85.9, and price sits 23% above the MA7 (0.1684). The 0.2247 spike got rejected. Bull: 4H close above 0.2247, squeeze continues. Bear: a close under 0.1756 (EMA7) opens the fade zone down toward 0.1387 (mid band), near where the move started. Paused chain, thin liquidity, possible exchange restrictions. Size like it can gap both ways. Is this a squeeze you'd trade, or a trap you'd skip? Not financial advice. DYOR. #IMPACTbyTrade #WSOT2026 #NovUSCPIWatch #WSOTPicktoEarn10U #USPayrollsAndRateDecisionsDriveMacroWeek #OilVolatilityTracksIranPeaceTalks $BTCUSDT
ETFはETHを売却しており、BitMineは購入しています。
$ETHUSDT スポットETFは6週連続で売り越し中。先週は3億6,500万ドルの流出、月曜にはさらに1億8,500万ドルの流出があった。その一方で、BitMineは新たに9,587 ETHを購入しており、クジラたちも買い増しているとの噂。どちらかが間違っている。 4時間足チャート:ETHは2,099.80ドルで、すべての移動平均線(MA7:2,122ドル、MA14:2,155ドル、MA28:2,197ドル)を下回っている。RSI(6)は28、ウィリアムズ%Rは-83。確かに売られすぎだ。しかし、下降トレンドにおける売られすぎは、単に「引き伸ばされている」だけであり、終了を意味しない。強気派が死守すべきラインは安値の2,070.26ドルだ。 2,100ドルは誰もが注目している数字。日足終値でこれを割り込めば、次は2,000ドル、その次は1,850ドルまで下落すると多くの人が言っている。 強気シナリオ:4時間足が2,155ドル(MA14)を超えて確定すれば、この反発が本物である最初の証拠となる。 弱気シナリオ:4時間足が2,070.26ドルを下回って確定すれば、2,000ドルが現実味を帯びてくる。 ナイジェリア時間午後2時30分に米CPI発表。指標が出る前はポジションを小さくしておくんだ、みんな。 ETFの売り手か、押し目買いの買い手か、どちらが正しいのか?どちらの立場を取るか決め、どこで損切りするかを決めておけ。 投資助言ではない。DYOR(自分で調査せよ)。 #IMPACTbyTrade #WSOT2026 #11月米国CPIウォッチ #WSOTPicktoEarn10U #米国雇用統計と金利決定が主導するマクロ週 #原油価格の変動がイランの和平交渉に連動 $ETHUSDC


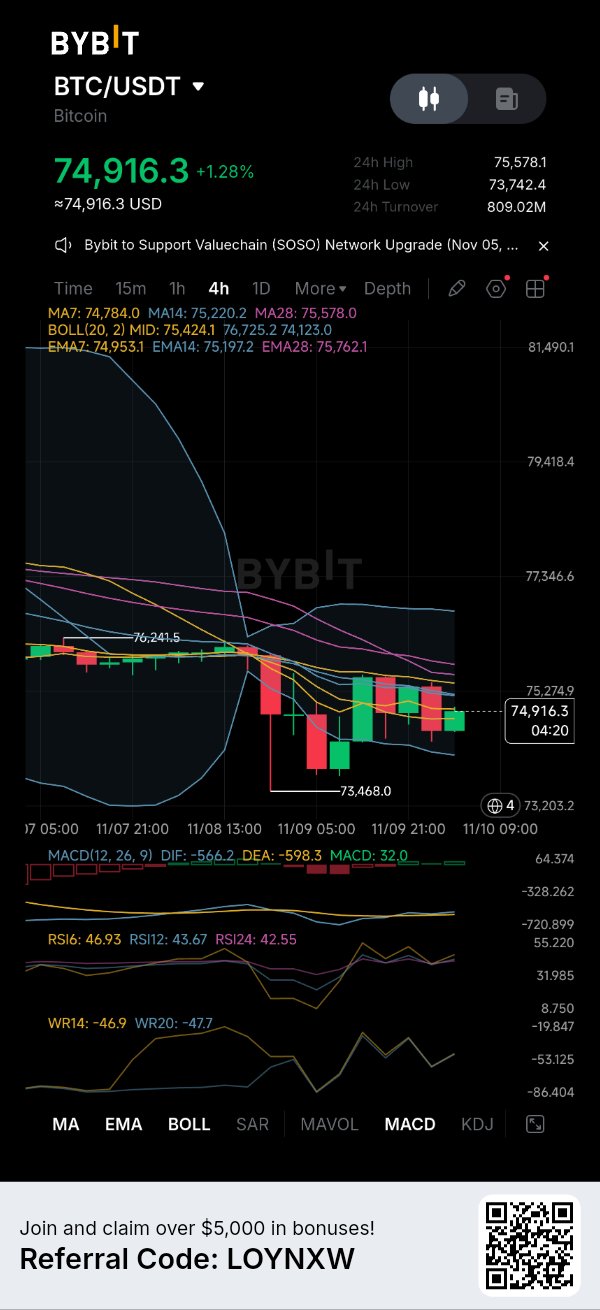
Stocks ripped. BTC didn't. That's the tell
US stocks had their best day since April yesterday (S&P +2.3%). $BTCUSDT ? Barely moved, still around 75K. When BTC can't follow a risk-on day, I pay attention. Part of it is flows. Spot BTC ETFs have bled about $1.48B in November so far, with another $201M out on the latest print. The marginal buyer isn't showing up. 4H view: BTC is 74,916, boxed between the 73,742 low and 75,578 high. Overhead is a stack of resistance (MA14, EMA14, mid band, MA28, EMA28 at 75,197-75,762), and MACD is still below zero. The bands are tightening, so a move is loading. Bull: 4H close above 75,762, then 76,241 is next. Bear: 4H close under 73,468 and the weekend low is gone. US CPI drops at 2:30 pm Nigeria time, after the Fed's September hike. Don't marry a level before that print, my people. Is BTC lagging stocks a warning, or a coiled spring? Not financial advice. DYOR. #WSOT2026 #NovUSCPIWatch #WSOTPicktoEarn10U #USPayrollsAndRateDecisionsDriveMacroWeek #OilVolatilityTracksIranPeaceTalks $BTCUSDC

$HYPEUSDT が72.47ドルから反発:強気派は77ドルを奪還できるか? Hyperliquid ($HYPE) は、価格が72.474ドルまで急落した後、安定化を試みています。 現在75.17ドル付近で取引されているHYPEは直近の安値から回復しましたが、4時間足チャートを見ると、依然として売り手が優勢である可能性が示唆されています。 指標が示すもの: • 価格はMA7(74.536ドル)を上回っていますが、依然としてMA14(75.965ドル)およびMA28(77.245ドル)を下回っています。 • MACDヒストグラムは0.082でプラスに転じており、弱気なモメンタムが弱まりつつあることを示唆しています。 • DIF(-1.675)がDEA(-1.758)を上回りましたが、いずれもゼロを下回ったままです。 • RSI6は45.89、RSI12およびRSI24は40付近にとどまっています。 注目すべき重要な水準: - 直近のサポート:74.536ドル - 主要なサポート:73.010ドル~72.474ドル - 最初のレジスタンス:75.965ドル~76.736ドル - 主要なレジスタンス:77.245ドル~77.582ドル - 上位レジスタンス:80.461ドル 76.736ドルを上回って推移できれば回復の動きが強まる可能性があり、その次は77.245ドル~77.582ドルが主要なハードルとなります。 しかし、76ドル付近で拒否されると、HYPEは再び74.536ドルに向けて下落する可能性があります。そのサポートを失えば、直近の安値である72.474ドルが再び意識されるでしょう。 MACDの改善には注目する価値がありますが、ゼロラインの下での強気クロスオーバーが自動的にトレンド転換を確定させるわけではありません。 トレードの焦点:HYPEが76.7ドル付近でどのような反応を示すか注視してください。この水準を明確に奪還できれば強気シナリオが改善しますが、再度拒否される場合は慎重な姿勢が望まれます。ポジションを検討する前に、無効となるポイント(損切りライン)を明確にし、リスク・リワードを評価してください。 HYPEは77ドルを奪還できるでしょうか、それとも売り手が回復ゾーンを防衛するでしょうか? #HYPE #Hyperliquid #Bybit 投資助言ではありません。DYOR(自分で調査してください)。 #WSOT2026 #11月米国CPIウォッチ #WSOTPicktoEarn10U #米国雇用統計と金利決定が主導するマクロ週 #原油価格の変動がイランの和平交渉に連動
BNB at 686: Pricing the Platform Risk
$BNBUSDT is sitting at 686.67, and the market is doing something more important than watching a support line. It is repricing platform risk in real time. The chart shows the damage clearly. On the 1D timeframe, every moving average is above price: MA7 at 695.81, MA14 at 706.59, MA28 at 720.34. Price is pinned below the lower Bollinger Band at 719.97. MACD is negative (DIF -13.91, DEA -11.40, histogram -2.50). RSI6 is 35.83, RSI12 is 38.25. WR14 is -84.90. The structure is bearish, but the oscillators are stretched to the downside. The catalyst is not a normal correction. On October 29, Binance suffered a $6.3 billion security breach. The FBI linked the attack to North Korea's TraderTraitor group, and CZ confirmed US law enforcement helped freeze a significant portion of the stolen assets. Binance reported $3.64 billion in net outflows during the crisis window before resuming withdrawals. That is the event the chart is digesting. But here is what matters for the next move. Tonight, November 9 at 20:00, Binance co-CEO Richard Teng, Yi He, and CSO Jimmy Su are holding a public dialogue. This is not a routine update. After an incident of this size, the market is waiting to hear how the platform prices the risk, how users are compensated, and what the security failure actually was. The executives' answers will be the next input for the chart. The tokenomics side is quieter but still relevant. BNB completed its 37th quarterly burn on October 19, removing 1,646,196 BNB from circulation. Total supply is now 131,512,085, still working toward the 100 million floor. There are no scheduled unlocks. But the burn did not move price, which tells you the market is focused on the hack, not supply. Levels: · 673.21 (24h low): the immediate floor. Price is fighting here now. · 670–640: the demand zone buyers are trying to hold. Losing this opens the door toward 617–600. · 695.81 (MA7) and 706.59 (MA14): the reclaim zone. A close above this would suggest the panic is exhausting. · 719.97 (BB lower) and 720.34 (MA28): the level that would change the short-term trend. Bullish case: The oversold readings, the frozen stolen funds, and a clear public explanation tonight could stabilize the platform-risk premium. Reclaiming 695 and then 706 would be the first sign that buyers are looking past the hack. Bearish case: A daily close below 673 keeps the bearish stack intact. If the executives fail to provide clear answers on compensation or security, the 640 demand zone becomes the real test. Not financial advice. DYOR. Would you treat tonight's executive dialogue as a buying catalyst if the answers are clear, or does the chart need to reclaim 706 first before you trust it? #WSOT2026 #NovUSCPIWatch #WSOTPicktoEarn10U #USPayrollsAndRateDecisionsDriveMacroWeek #OilVolatilityTracksIranPeaceTalks $BNBUSDC


PEPE Reclaims $0.0000052: Upper Band Test Active
$PEPEUSDT has staged a strong multi-day recovery off its $0.00000421 baseline, pressing into upper Bollinger Band resistance as 24-hour volume holds firm at $18.44M. But bidding market orders directly into a structural supply cap without waiting for a daily close confirmation is how aggressive buyers risk catching pullbacks. On Bybit, $PEPE trades near $0.000005201 (+2.99%), consolidating near its 24h high of $0.000005392 after defending the $0.000004777 floor on 18.44M daily turnover. What the 1D Bybit chart reveals: * Upper band penetration: Spot price pierced above the $0.000005251 upper Bollinger Band to print a local wick high of $0.000005392 before pulling slightly back. * Moving average stack: The fast dynamic trend stack turned bullish, with price holding cleanly above MA7 ($0.000004947), MA14 ($0.000004881), and MA28 ($0.000004571), anchored by the 20-day mid-band ($0.000004751). * Momentum expansion: Daily RSI(6) expanded to 68.25 (RSI12 at 62.81) with WR14 sitting at -33.80. The MACD histogram printed green at +0.00000016 as DIF (0.000000202) holds above DEA (0.000000185). Market catalysts & ecosystem updates: PEPE’s breakout momentum follows a technical exit from its long-term descending channel, with daily trading volume expanding across major exchanges. In parallel, overall platform connectivity remains steady as Bybit confirmed active support for ecosystem network upgrades, including the Valuechain (SOSO) infrastructure maintenance. Two execution setups on watch: * Trend continuation: A confirmed daily close clearing $0.00000539 opens an expansion runway targeting the $0.00000568–$0.00000600 overhead liquidity shelf. * Support retest: Rejection at $0.00000539 opens an orderly pullback toward the $0.00000494 (MA7) or $0.00000475 mid-band floor to reset 6-period RSI conditions. Check live order book depth, meme coin liquidity, and funding rates on the Bybit card below before entering positioning. Not financial advice. DYOR. #WSOT2026 #NovUSCPIWatch #WSOTPicktoEarn10U #USPayrollsAndRateDecisionsDriveMacroWeek #OilVolatilityTracksIranPeaceTalks $PEPEUSDC


PIEVERSE Surges Hard, Catch The Trend Early 📈
$PIEVERSEUSDT is delivering an aggressive rally, climbing 40.19% to $2.0930 after breaking out of a prolonged consolidation around $1.35–$1.50. The 4H chart shows a clear shift in momentum: • Price is trading above MA7 ($1.6945), MA14 ($1.5592) and MA28 ($1.4497). • MACD is strongly bullish, with DIF at 0.1575 above DEA at 0.0981. • The MACD histogram has expanded to 0.0593. • RSI6 stands at 93.99, while RSI12 is 88.76, indicating extreme overbought conditions. • Price is trading significantly above the upper Bollinger Band at $1.9150. The breakout is impressive, but the distance from the moving averages suggests that chasing the rally at current levels carries substantial pullback risk. Key levels to watch: - Immediate resistance: $2.1821 - Psychological resistance: $2.20 - First support: $1.9150 - Secondary support: $1.7770 - Stronger support: $1.6945–$1.6294 A sustained breakout above $2.1821 could extend the bullish momentum. However, rejection near $2.18 could trigger profit-taking, with $1.9150 becoming an important level to monitor. The bigger question is whether this breakout can develop into sustained price discovery or whether buyers will need a cooling-off period first. Trading focus: Avoid chasing an extended candle. Watch for consolidation, a controlled pullback or a confirmed breakout retest. Check liquidity and define invalidation before considering any position. Is $PIEVERSE preparing for another leg higher, or is a cooldown approaching? Not financial advice. DYOR. #IMPACTbyTrade #WSOT2026 #NovUSCPIWatch #WSOTPicktoEarn10U #USPayrollsAndRateDecisionsDriveMacroWeek


SOL Rebounds From $85: Reclaiming $90 📈
$SOLUSDT is attempting to recover after a sharp sell-off pushed price down to $85.06. SOL is currently trading around $87.75, but the recovery still needs confirmation before a bullish reversal can be considered. What the 4H indicators reveal: • Price has reclaimed MA7 at $87.53 but remains below MA14 at $88.57 and MA28 at $89.98. • MACD remains negative, with DIF at -1.43 below DEA at -1.29. • RSI6 has recovered to 47.69, while RSI12 and RSI24 remain around 41. • The Bollinger midline sits at $89.09, making it an important recovery hurdle. Key levels to watch: - Immediate support: $87.46–$86.11 - Major support: $85.06 - First resistance: $88.33–$88.57 - Next resistance: $89.09–$90.00 - Higher resistance: $91.39 A sustained move above $88.57 could strengthen the recovery attempt, with $89.09–$90 becoming the next major test. However, rejection around $88.33–$89.09 could send SOL back toward $86.11. A breakdown below $85.06 would invalidate the immediate recovery scenario. The interesting development is that RSI is recovering while MACD remains bearish. Buyers are showing up, but they haven't established full control yet. Trading focus: Watch the $88.57 reclaim and the $86.11 support. Wait for confirmation, define invalidation and assess risk-to-reward before considering a position. Can SOL reclaim $90, or will sellers force another support test? Not financial advice. DYOR. #WSOT2026 #NovUSCPIWatch #WSOTPicktoEarn10U #USPayrollsAndRateDecisionsDriveMacroWeek #OilVolatilityTracksIranPeaceTalks $SOLUSDC


ARBがブレイクアウト、0.188ドルのレジスタンスラインに接近中
Arbitrum ($ARBUSDT) は$0.15963から回復後、強い買い圧力を見せています。価格は$0.18405まで上昇し、直近高値の$0.18792に迫っています。 4時間足のテクニカル構造は建設的(強気)なものに転換しました。 • 価格はMA7($0.17254)、MA14($0.17050)、MA28($0.16705)を上回っています。 • MACDは強気で、DIF(0.00344)がDEA(0.00224)を上回っています。 • MACDヒストグラムは0.00120とプラス圏にあり、モメンタムの改善を裏付けています。 • RSI6は83.34、RSI12は74.20、RSI24は64.33となっています。 ただし、トレーダーが無視できない警告もあります。ARBはボリンジャーバンドの上限である$0.17820を超えて推移しています。これは積極的な買いが入っていることを示していますが、短期的には調整が入る可能性も高めています。 注目すべき重要な価格水準: - 当面のサポート:$0.17820 - 第2サポート:$0.17254~$0.17050 - 強固なサポート:$0.16930 - 第1レジスタンス:$0.18792 - 次の心理的レジスタンス:$0.19000 $0.18792を明確にブレイクできれば、$0.19000に向けた強気な動きが拡大する可能性があります。しかし、直近高値付近で拒絶されれば、利益確定売りが誘発され、$0.17820の再テストにつながるかもしれません。 モメンタムは目を見張るものがありますが、強い買いと、伸びきったローソク足を追うことは別物です。 トレードの焦点:確実なブレイクアウトか、サポートへの制御されたプルバック(押し目)を待ちましょう。ポジションを取る前に、無効化ラインを定義し、リスク・リワードを評価してください。 ARBは$0.188をクリアできるでしょうか、それとも先に調整が入るでしょうか? 投資助言ではありません。DYOR(自分で調べて判断してください)。 #WSOT2026 #11月米国CPIウォッチ #WSOTPicktoEarn10U #米国雇用統計と金利決定が主導するマクロ週 #原油価格の変動がイランの和平交渉に連動 $ARBUSDC


SUI Defends $0.80: Can Bulls Reclaim $0.85?
$SUIUSDT is attempting to stabilise after a sharp sell-off pushed price to $0.8011. Currently trading around $0.8294, SUI has recovered from its recent low, but the broader 4H structure remains under pressure. The technical picture is mixed: • Price remains below MA7 ($0.8313), MA14 ($0.8439) and MA28 ($0.8606). • MACD remains negative, with DIF at -0.0154 below DEA at -0.0131. • RSI6 has recovered to 42.49, while RSI12 and RSI24 remain below 42. • The Bollinger midline sits at $0.8518, leaving another resistance hurdle for buyers. Key levels to watch: - Immediate support: $0.8154 - Major support: $0.8011 - First resistance: $0.8313–$0.8439 - Next resistance: $0.8518–$0.8606 - Higher resistance: $0.8881 A sustained move above $0.844 could improve the recovery outlook, with $0.852–$0.861 becoming the next test. However, rejection around the moving averages could send SUI back toward $0.8154. A breakdown below $0.8011 would invalidate the immediate support-recovery scenario. The important distinction is between a temporary bounce and a genuine change in market structure. Trading focus: Watch whether buyers can reclaim $0.844 or whether sellers force another support test. Set alerts, define invalidation and assess risk-to-reward before considering a position. Can $SUIUSDC reclaim $0.85, or are sellers still in control? Not financial advice. DYOR. #WSOT2026 #NovUSCPIWatch #WSOTPicktoEarn10U #USPayrollsAndRateDecisionsDriveMacroWeek #OilVolatilityTracksIranPeaceTalks


ETH Retests $2,103: Support Compression In Play
$ETHUSDT is retesting the critical $2,103 demand floor as selling pressure compresses lower band volatility across intraday timeframes. Bidding market orders directly into dynamic overhead moving average resistance without waiting for structural defense confirmation risks catching secondary liquidity sweeps. On Bybit, $ETH trades near $2,103.44, testing its intraday baseline low after pulling back from local resistance. What the chart structure reveals: * Demand floor test: Spot price is battling to hold the $2,100–$2,105 zone, which serves as the primary line of defense against extended down-trending expansion. * Dynamic moving average resistance: Overhead trend resistance remains anchored by short-term moving averages, keeping pressure on the lower Bollinger Band boundary. * Momentum reset: Short-period RSI and MACD indicators are pressing into oversold territory, signaling an impending expansion or mean-reversion move off current price compression. Fundamental & institutional context: Ethereum network liquidity continues to adjust following exchange ecosystem developments, including Bybit's verified support for active L2 token migrations like Aerodrome (AERO) and ongoing Layer-2 settlement activity across Base and mainnet DeFi infrastructure. Two execution setups on watch: * Support defense: Holding the $2,100 support floor and reclaiming dynamic 4H MA resistance opens a mean-reversion move targeting the upper band ceiling. * Breakdown continuation: A confirmed close below $2,100 clears the path for a liquidity sweep toward key lower macro demand zones. Check live order book depth and funding rates on the Bybit card below before entering positioning. Not financial advice. DYOR. #WSOT2026 #NovUSCPIWatch #WSOTPicktoEarn10U #USPayrollsAndRateDecisionsDriveMacroWeek #OilVolatilityTracksIranPeaceTalks $ETHUSDC


$BTCUSDT Block Hits 11.2K Transactions: Historical Milestone Bitcoin's base layer just printed a rare milestone. AntPool successfully mined block 974961, packing a staggering 11,255 transactions into a single block—the second-highest transaction count in Bitcoin history. The block came within 984 transactions of breaking the all-time network record of 12,239 set over a decade ago on August 1, 2015. Operating at an efficient ~1.1 MB size (occupying 99.85% of block weight limits), it highlights an exceptionally dense throughput environment. What this on-chain milestone reveals: * Sustained base-layer demand: This event underscores a 2026 macro trend defined by consistently elevated daily transaction counts and high-density mempool activity. * Fee efficiency: Despite the massive payload of 11,255 transfers, total block fees remained remarkably light at roughly 0.0024 BTC, reflecting optimized transaction batching. * Network resilience: Miners continue to push maximum block-space efficiency without disrupting confirmation cadence or security parameters. Two execution perspectives on watch: * Throughput expansion: Sustained high-density block metrics point toward structural scaling adoption across secondary and batching protocols. * Fee market sensitivity: Persistent high transaction counts place increased focus on mempool congestion tracking during high-volatility market windows. Check live order book depth, network hashrate, and funding rates on the Bybit card below before managing your spot or derivatives positioning. Not financial advice. DYOR. #WSOT2026 #NovUSCPIWatch #WSOTPicktoEarn10U #USPayrollsAndRateDecisionsDriveMacroWeek #OilVolatilityTracksIranPeaceTalks $BTCUSDC

