BITPIA
3484いいね0シェア48ファン77フォロー
Full Time Trader
Full Time Trader
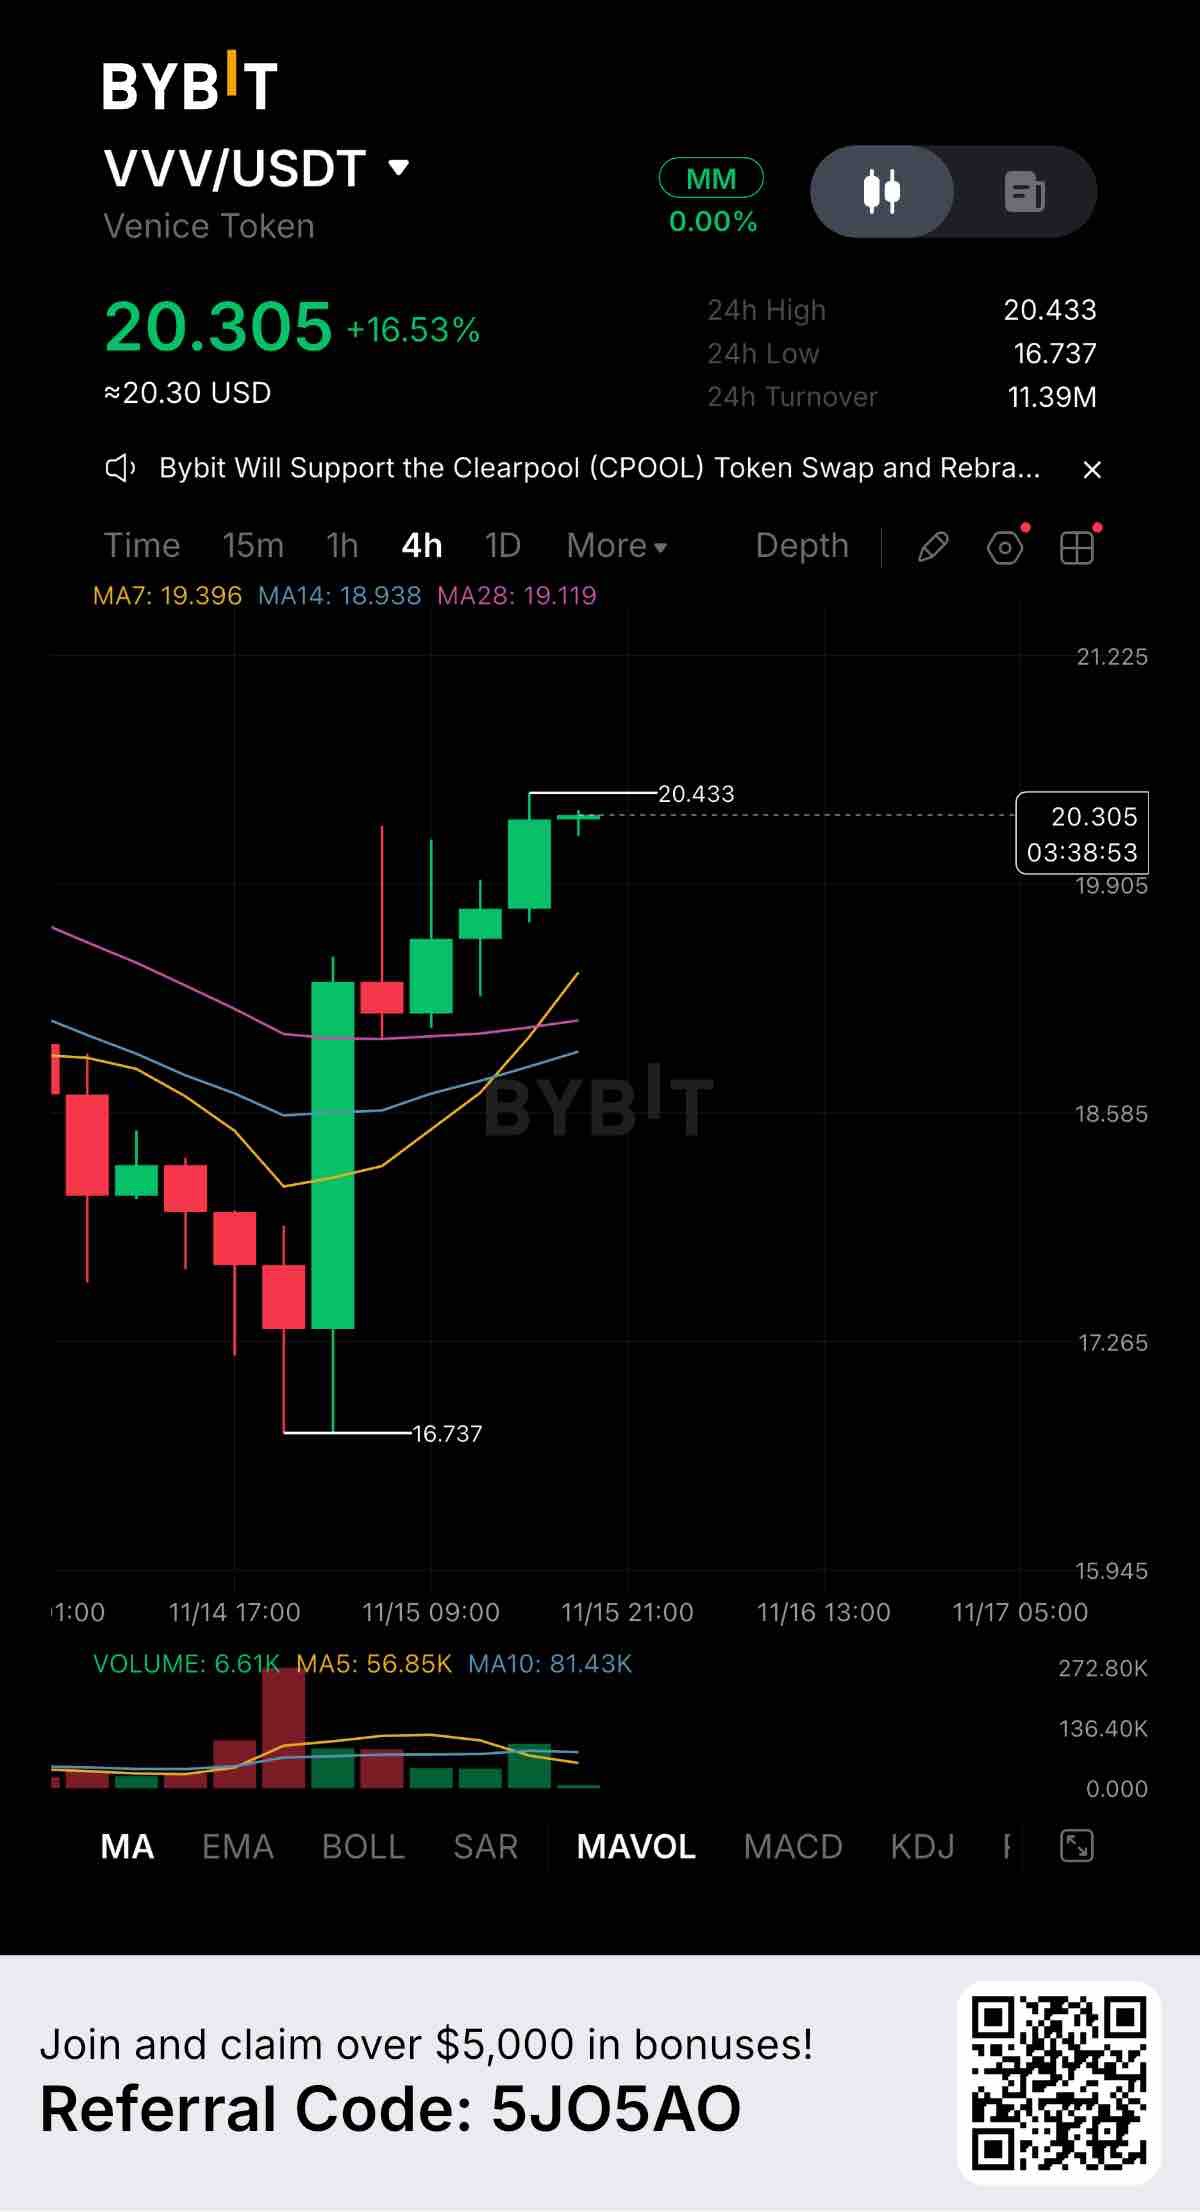
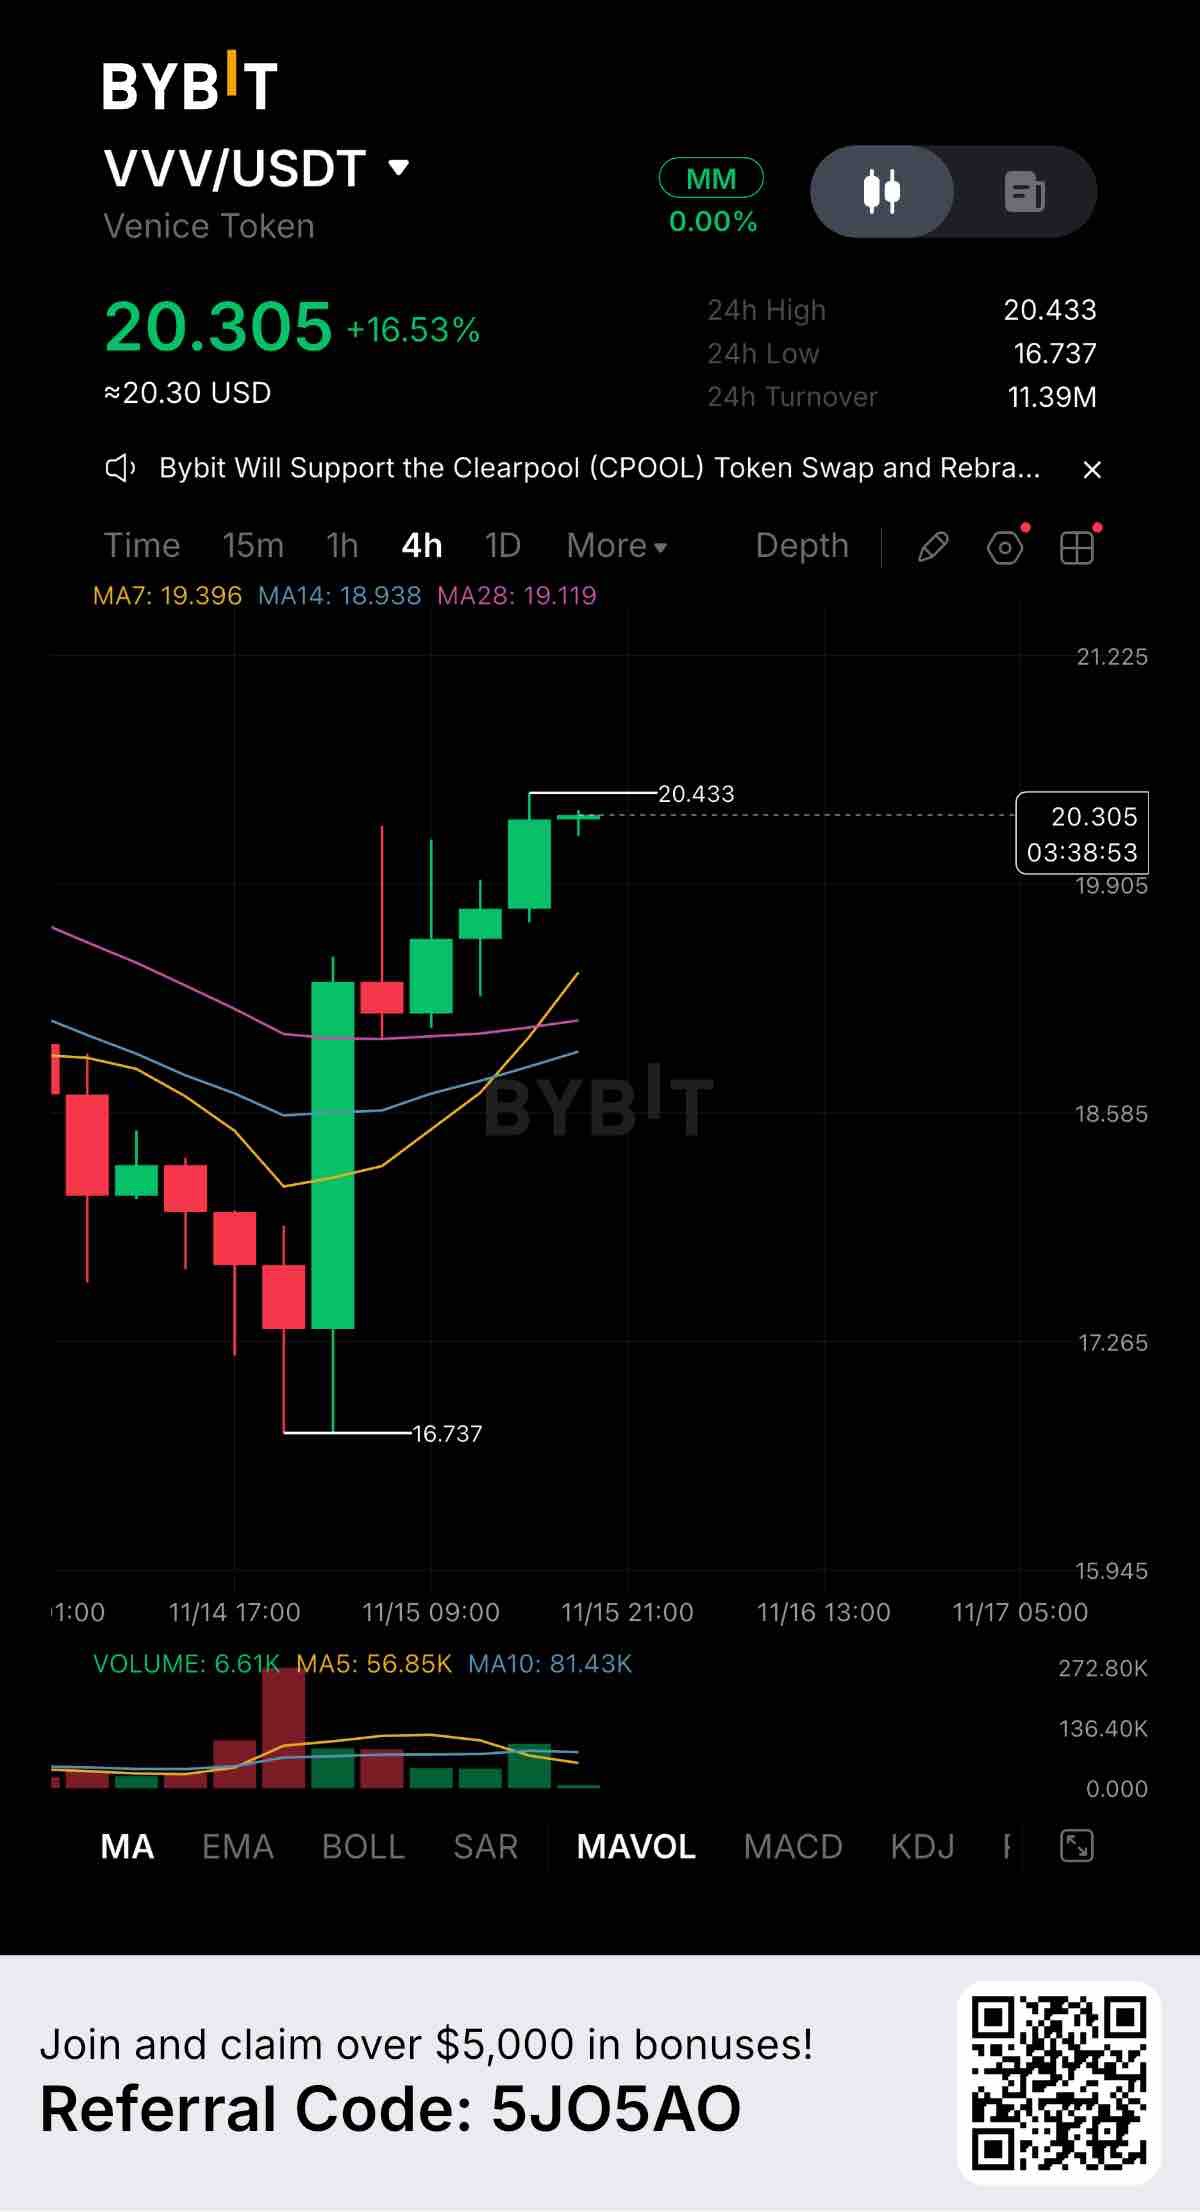
VVVUSDTは4時間足チャートで力強い回復を見せており、現在20.305で取引され、+16.53%という驚異的な上昇を記録しています。16.737までの急落後、買い手が積極的に参入し、巨大な陽線を形成してトレンドを完全に反転させ、価格を堅調かつ安定した上昇トレンドへと押し上げました。 注目すべき重要な価格帯: レジスタンス:20.433(24時間高値、目先の上値抵抗線) サポート1:19.396(7日移動平均線、最初の動的なサポートゾーン) サポート2:16.737(24時間安値、主要な構造的サポートライン) 移動平均線は完全に強気を示しています。価格はMA7、MA14、MA28を大きく上回って推移しています。チャートは高値切り上げ・安値切り上げの教科書的なパターンを描いており、小幅な調整があるたびに買い手が自信を持って支えを入れています。 出来高も重要な要因です。24時間取引高は1139万USDTに達しています。最初の反発時には爆発的な出来高を伴いましたが、それ以降の安定した上昇は、単なる踏み上げではなく、持続的な買い圧力があることを示しています。 ファンダメンタルズの観点からも、Venice Token (VVV) は現在明らかに高い需要があります。このようなV字回復は、押し目買いを積極的に狙う買い手の強い確信を示唆することが多いです。 もし買い手が20.433を突破し、その水準を維持できれば、未知の価格帯への突入が見込めるでしょう。ただし、価格が過熱気味であるため、19.396のサポートライン付近までわずかに調整するのを待つ方が、より安全なエントリーポイントとなるかもしれません。 皆さんはこのVVVの勢いに乗っていますか?それとも再テストを待っていますか?ぜひコメント欄で戦略を教えてください。 #ByXIMPACT #WSOT2026
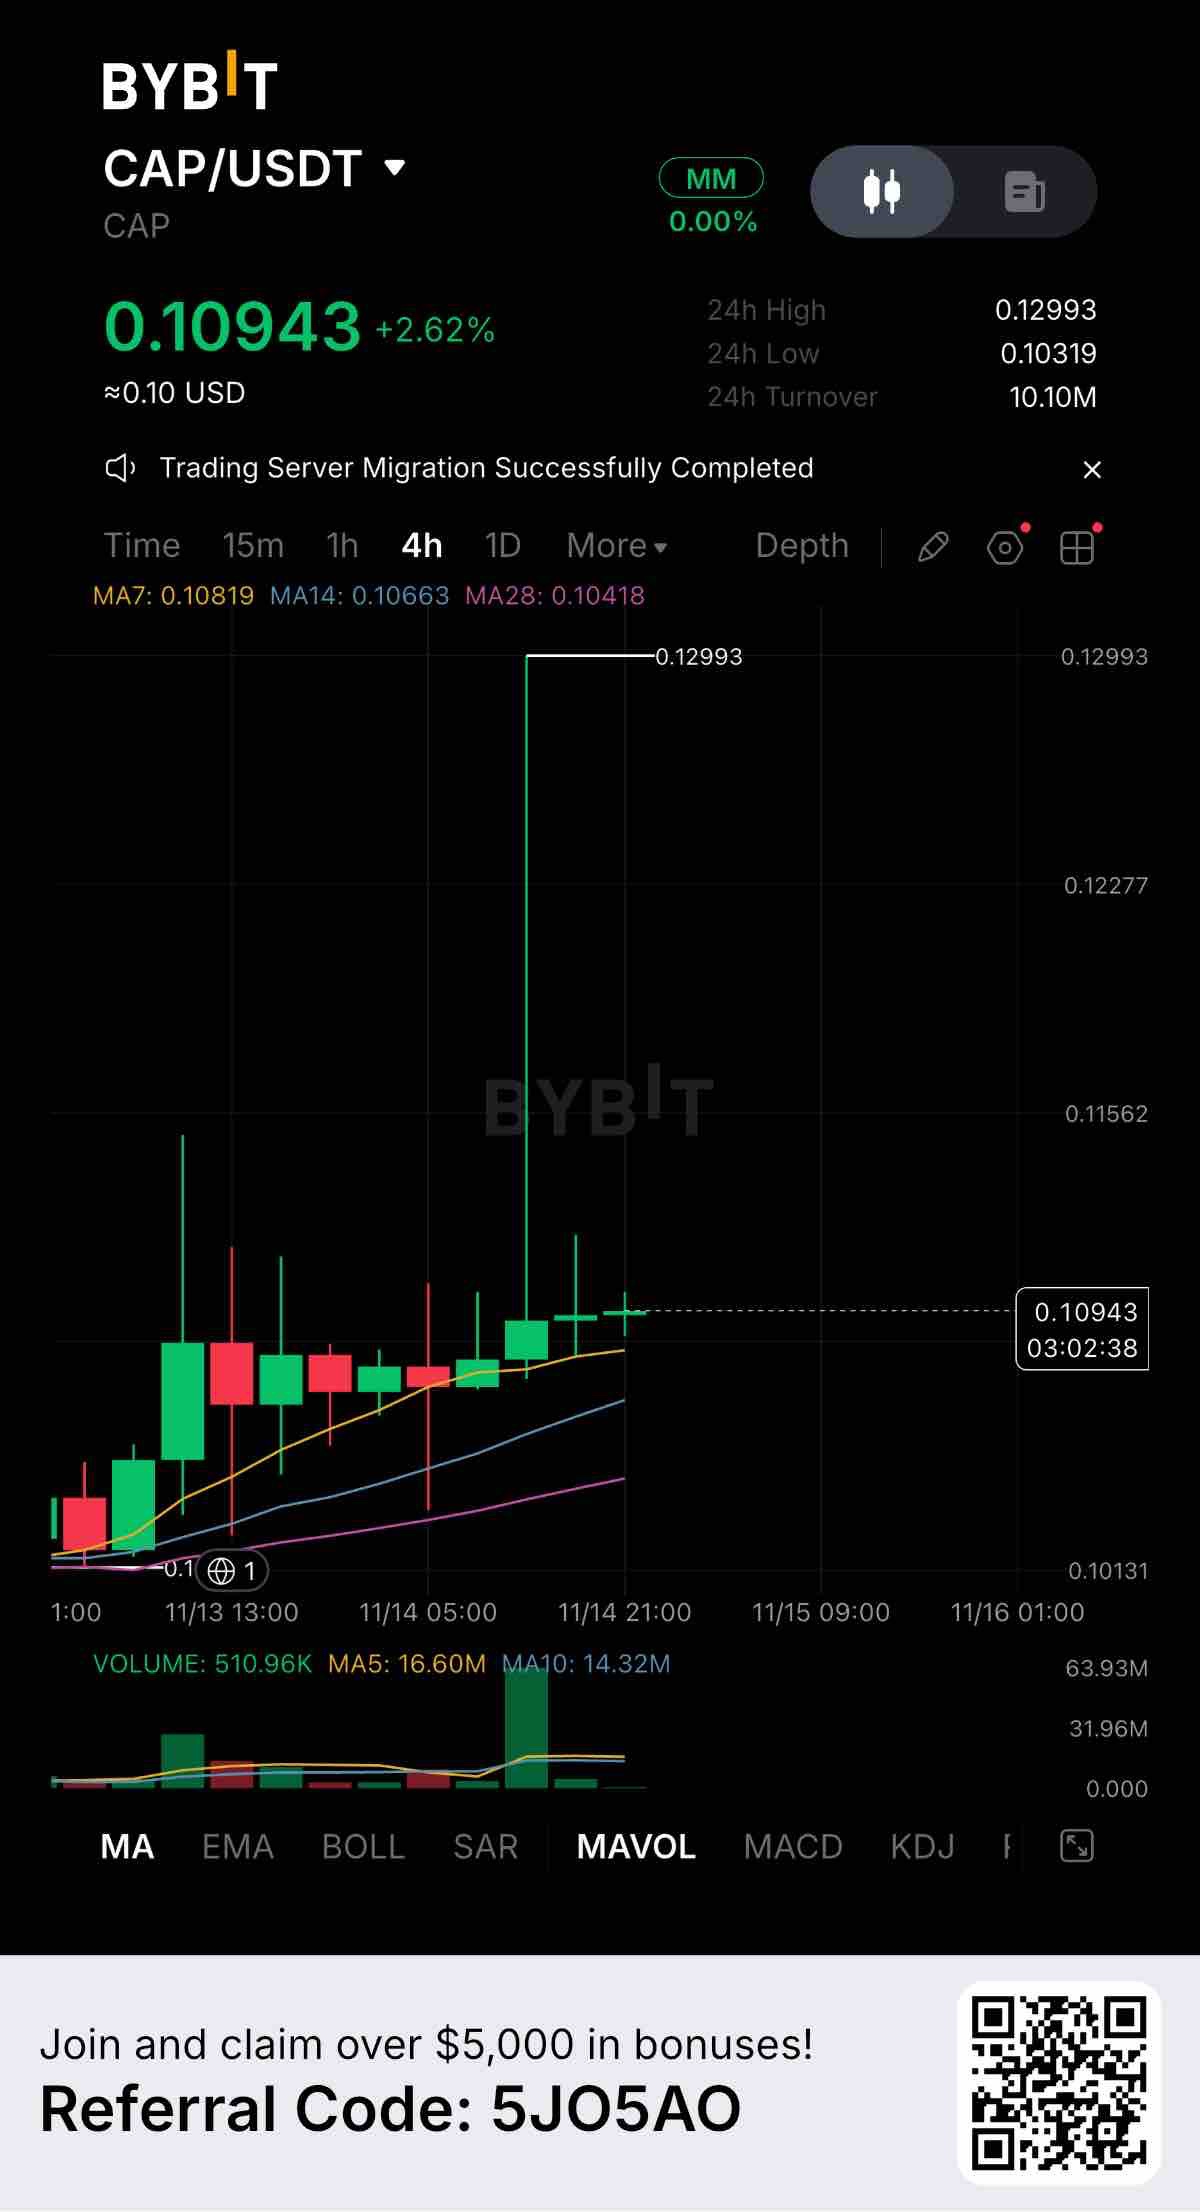
CAPUSDTは4時間足チャートで非常に激しい値動きを見せており、現在0.10943で取引され、+2.62%上昇しています。日次上昇率は控えめに見えますが、チャート自体は荒々しい展開を示しています。先ほど、巨大な陽線の出来高とともに大規模な流動性の急上昇が発生し、価格は一時0.12993まで急騰しましたが、即座に押し戻されました。 注目の主要レベル: レジスタンス: 0.12993(24時間高値であり、長い上ヒゲの先端) サポート1: 0.10819(7日移動平均線、現在直近のフロアとして機能) サポート2: 0.10319(24時間安値、構造的なベース) 移動平均線を見ると、全体的なトレンドは依然として上昇を示しています。価格はMA7、MA14、MA28を上回っています。しかし、あの大規模な上ヒゲは、売り手がより高い価格帯を厳しく防衛していることを示す明確な警告サインです。価格は現在調整局面に入り、7日移動平均線の上で安定しようとしています。 ここで最も重要な要素は出来高です。24時間の売買代金は1,010万USDTと膨大です。出来高の急増は大口プレイヤーがこの市場で活発に動いていることを裏付けていますが、価格が押し戻されたことは、その特定の戦いにおいて買い手が敗北したことを意味します。 買い手がこの0.10819のサポートレベルを維持し、ベースを固めることができれば、高値再挑戦の可能性があります。しかし、このサポートが割れると、0.10319の安値まで急落する展開も考えられます。 皆さんはこのCAPのセットアップをどう見ていますか?ブレイクアウトの確定を待っていますか、それともあの長い上ヒゲを警戒して手を出さないつもりですか?以下で議論しましょう。 #ByXIMPACT #WSOT2026
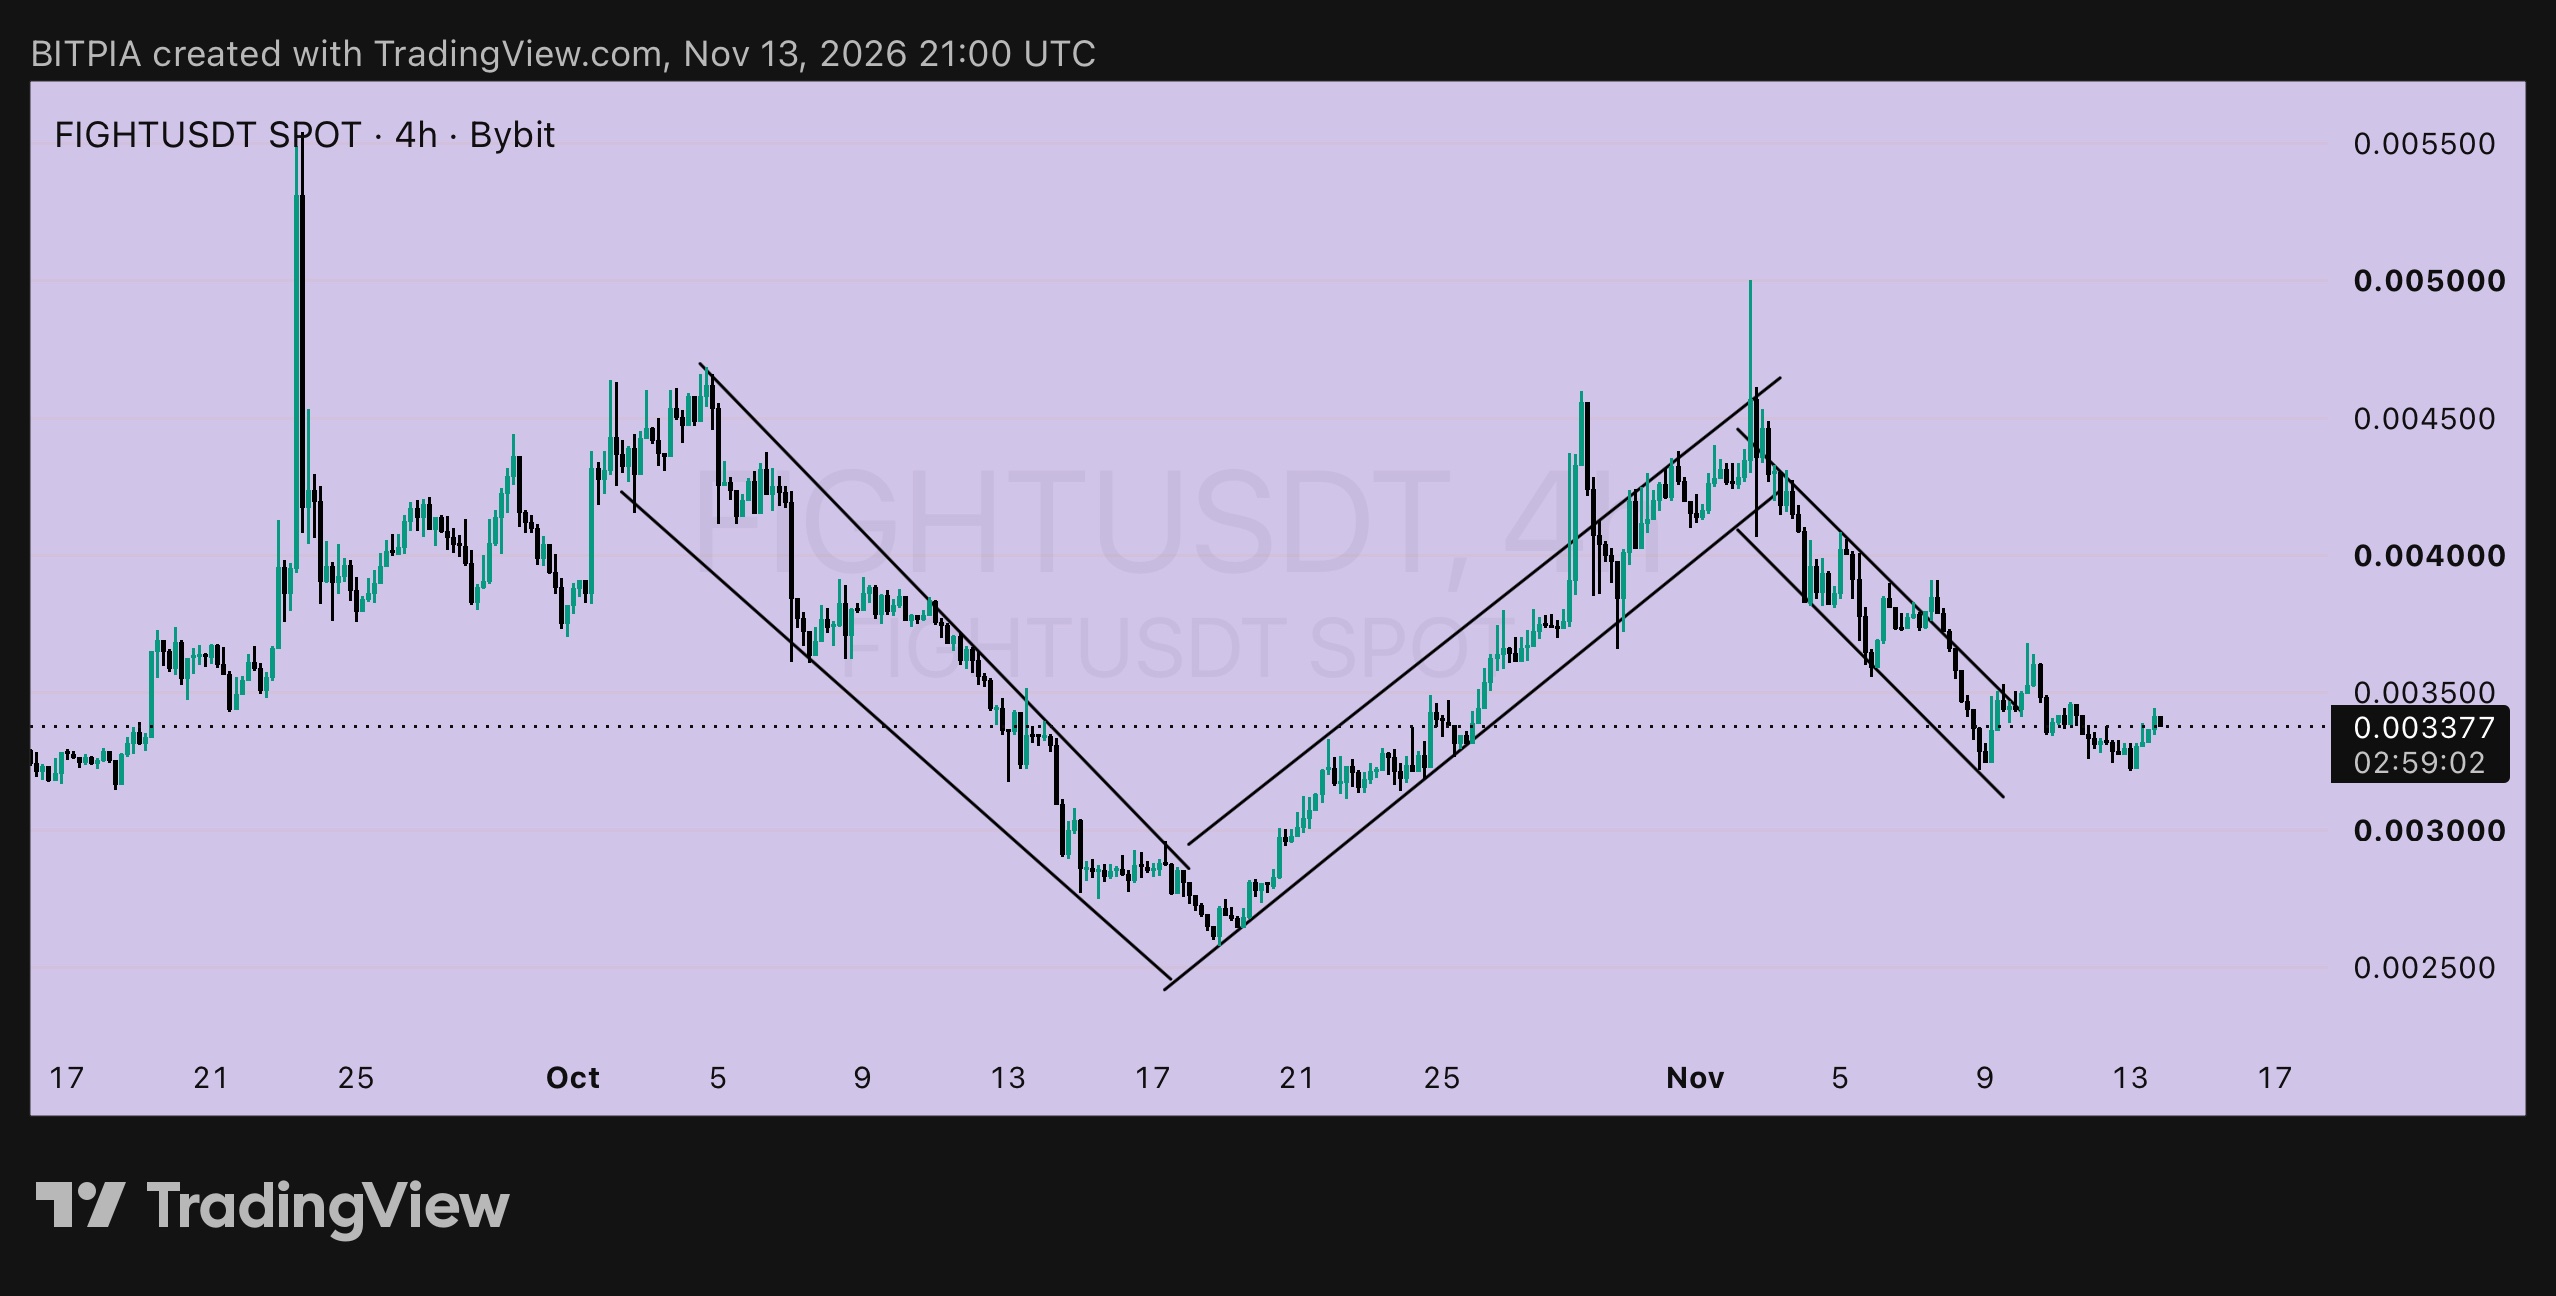
$FIGHTUSDT 4h:0.00322でダブルボトム?🔍 11月10日、下降チャネルを上抜けたタイミングで$FIGHTを0.003553で投稿しました。プランは2つで、0.00358超えでのエントリー(エントリー0.00360、損切り0.00330)か、0.00345付近でのリテスト(損切り0.00322)でした。何が起きて、今どう見ているかをまとめます。 ➤ 何が起きたか ▸ 11月11日に価格は約0.00367まで上昇しましたが、0.00358で長く維持できず、高値を切り下げる形となりました。 ▸ その後下落し、昨日0.00322付近で安値を付けました。これは実質的に11月9日と同じ安値です。 ▸ 0.00345付近でのリテストエントリーを行い、損切りを0.00322に設定していた場合、損切りにかかったか、ギリギリの状態(約-1R)だったはずです。4時間足の確定を待っていた場合、まだポジションは生きているかもしれません。いずれにせよ、上昇が失敗したという事実は隠せません。 ➤ 今の状況 ▸ 4日間隔で形成された0.00322付近のダブルボトム。 ▸ 現在価格は0.003377で反発していますが、4時間足チャート上ではまだ下降チャネル内にあります。 ▸ 10月のようなジグザグパターンは繰り返されず、市場は高値切り下げを選択しました。 ダブルボトムはベース形成の始まりになることもあれば、単なる下落中の一時停止に過ぎないこともあります。私は希望ではなく、証拠が欲しいのです。 ➤ プランA:フロアを狙う ▸ エントリー:0.00322が3度目のサポートとして機能する場合、0.00330付近 ▸ 損切り:0.00310割れ ▸ ユニットごとのリスク:0.00020 ▸ ターゲット1:0.00360(+0.00030、約1.5R) ▸ ターゲット2:0.00385(+0.00055、約2.75R) ▸ ターゲット3:0.00420(+0.00090、約4.5R) ➤ プランB:ブレイクを待つ ▸ トリガー:4時間足が0.00350超えで確定 ▸ エントリー:0.00355付近 ▸ 損切り:0.00330割れ ▸ ユニットごとのリスク:0.00025 ▸ ターゲット:0.00385(約1.2R)および0.00420(+0.00065、約2.6R) ➤ 無効となるシナリオ 4時間足が0.00310以下で確定した場合、ダブルボトムは失敗とみなします。その場合は0.0030、そして10月の水準である0.0026付近が次の監視ラインとなり、様子見します。 ポジションサイズは小さく、もしパーペチュアル(無期限先物)をやるならレバレッジは低めで。 投資助言ではありません。DYOR(自分で調べ)、失っても許容できる範囲のリスクで運用してください。 #ByXIMPACT #WSOT2026
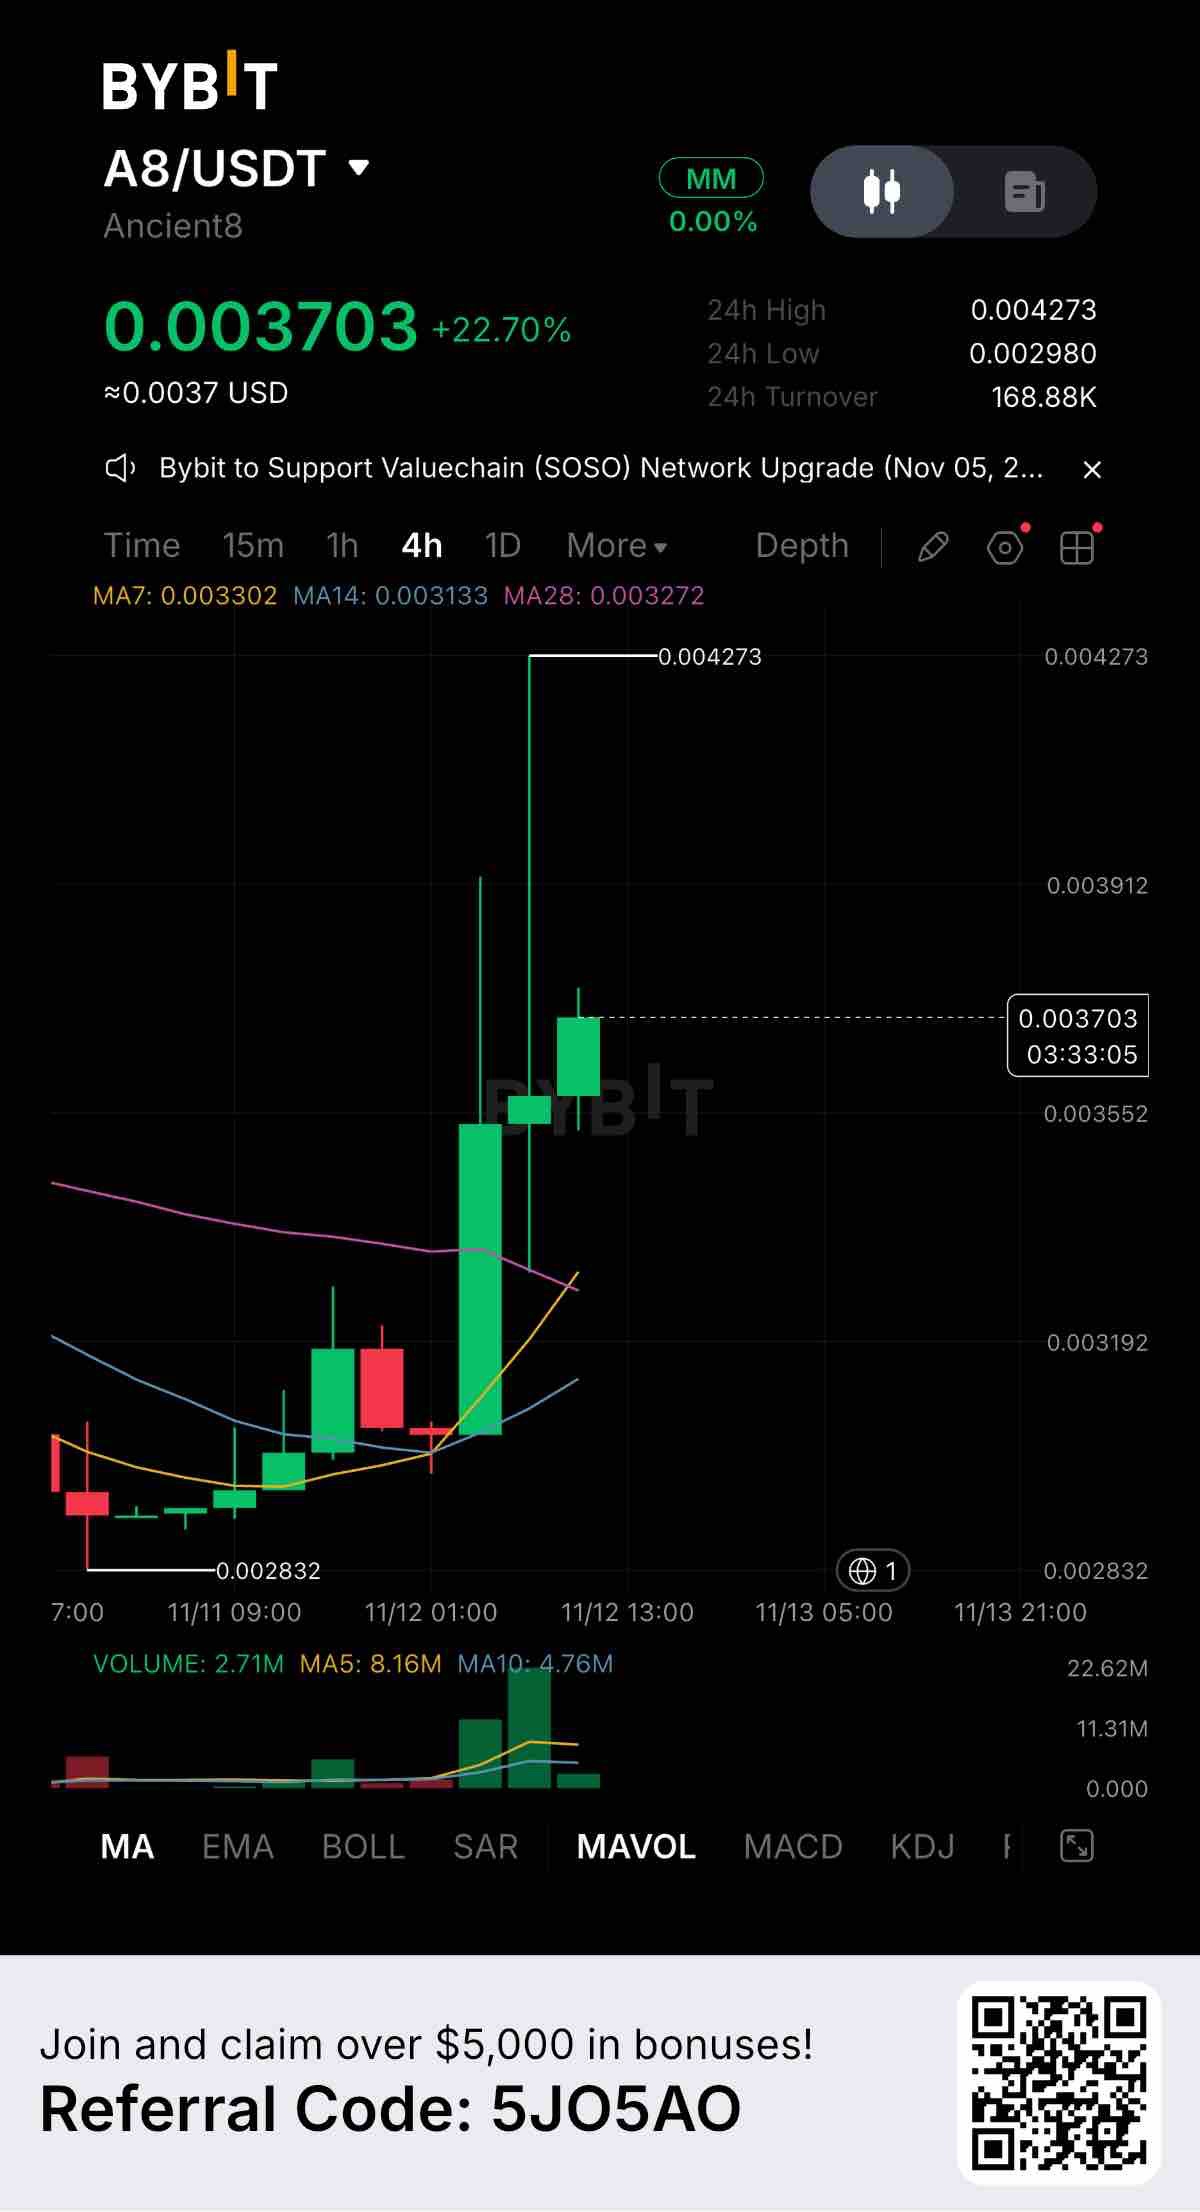
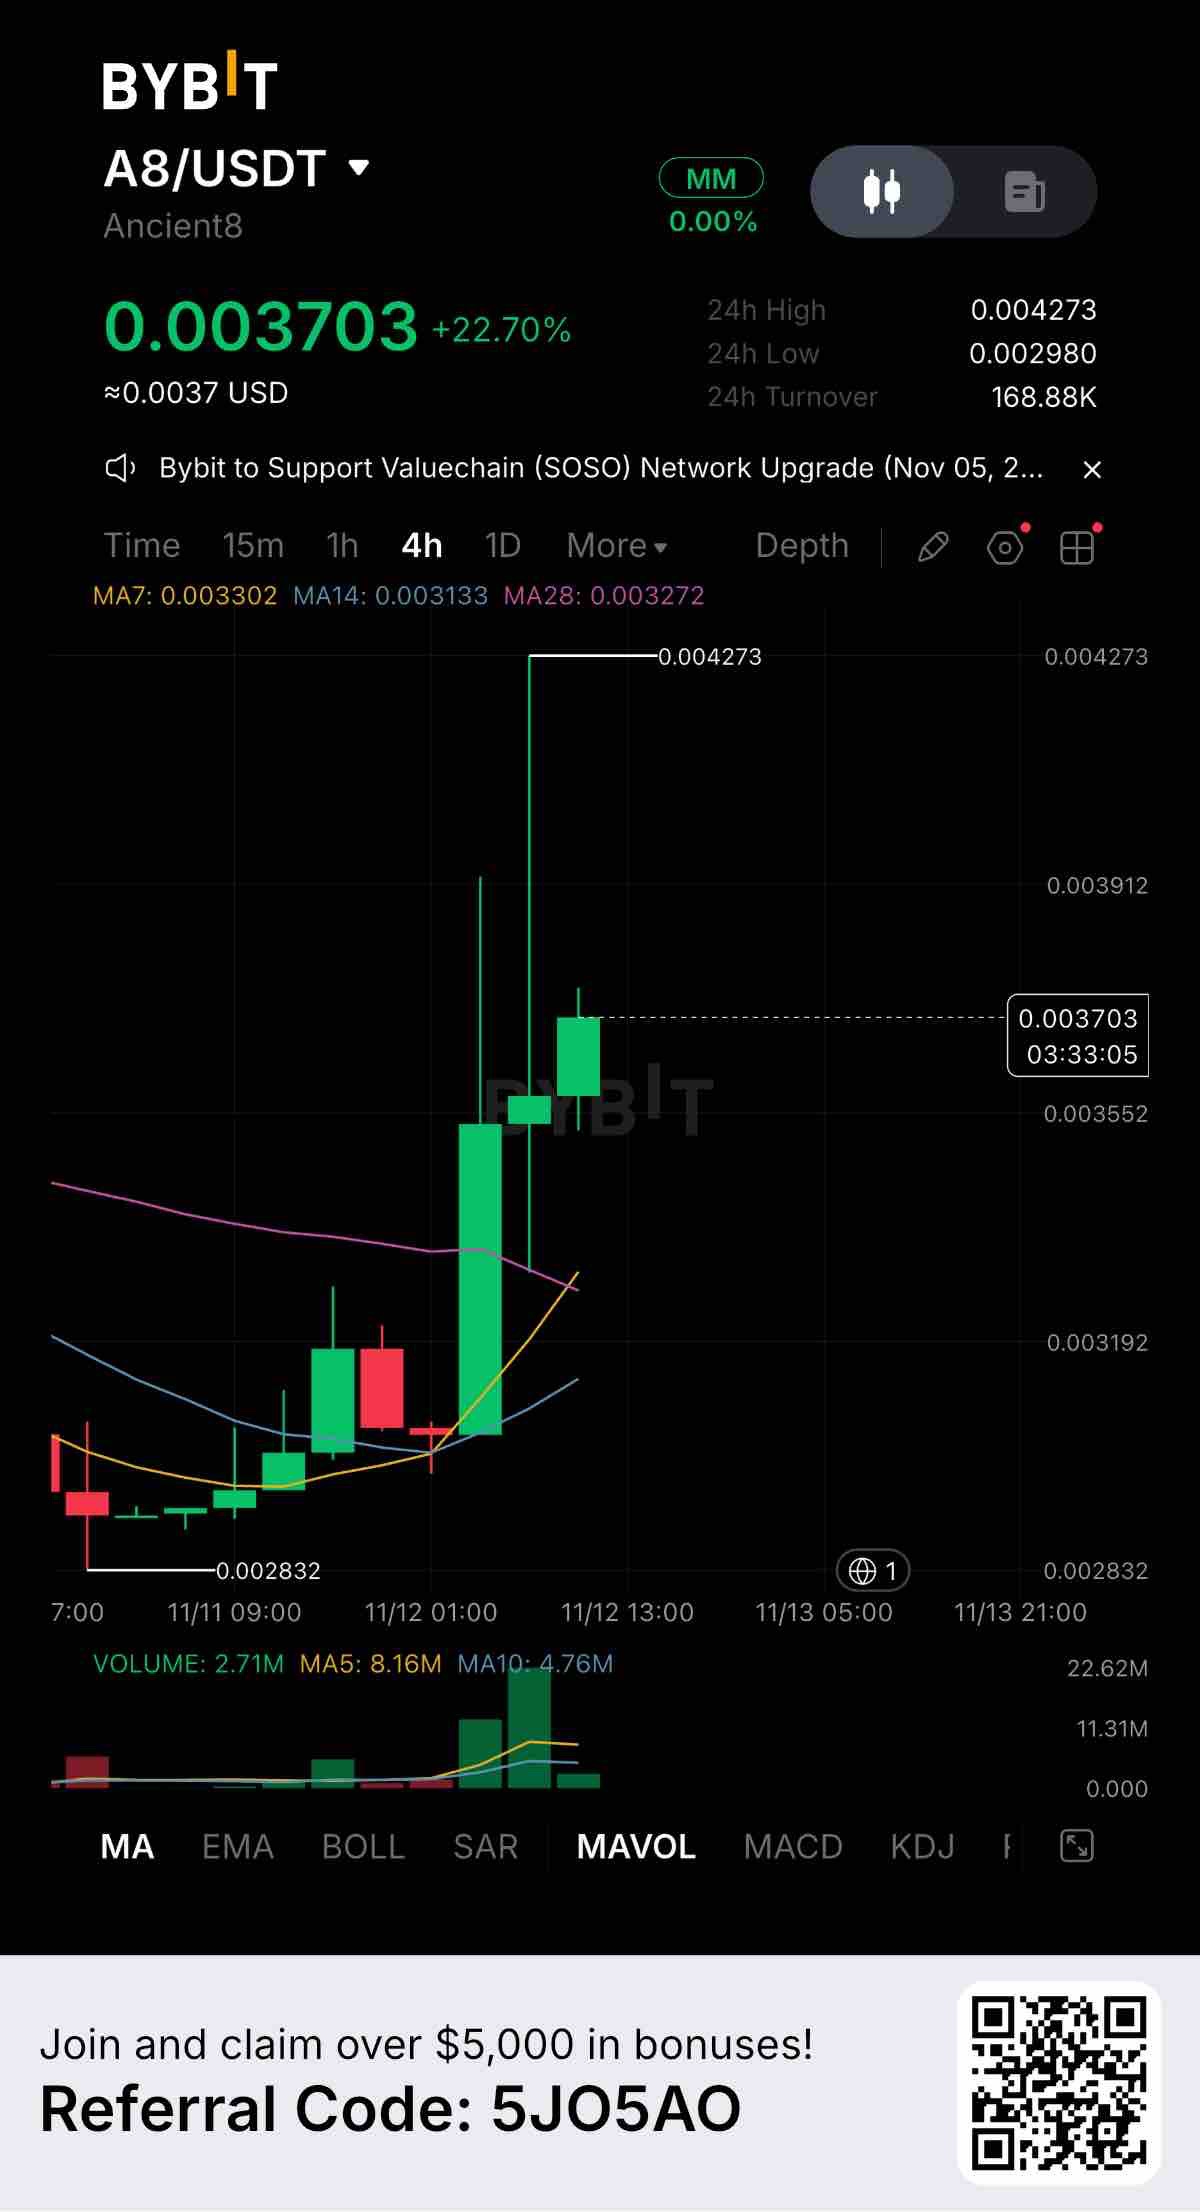
$A8USDT is putting on a wild show on the 4-hour chart, currently trading at 0.003703 with a massive +22.70% gain. This chart is a textbook example of extreme volatility. We saw an aggressive pump that left a massive upper wick stretching all the way to 0.004273 before sellers forcefully pushed the price back down. Key Levels to Watch: Resistance: 0.004273 (The top of the massive wick and the clear 24-hour high) Support 1: 0.003302 (7-day MA, the immediate dynamic support holding the current price) Support 2: 0.002980 (24-hour low, the structural floor) The moving averages are starting to cross over bullishly, and price is currently holding above MA7, MA14, and MA28. After that violent rejection at the highs, the price is now trying to stabilize. We are seeing a smaller green candle forming, indicating that buyers are attempting to build a base and defend the current levels. Volume is the main story here. The volume spike during the initial pump was massive, but 24-hour turnover has settled at 168.88K USDT. The key now is whether we see a surge of buying volume to push back up, or if the momentum is fading after that huge rejection. Fundamentally, Ancient8 (A8) is experiencing a sudden surge in market interest. Spikes like this often come from ecosystem news, but the heavy wick proves that sellers are very active at the top. If buyers can hold the 0.003302 support and build momentum, a retest of the highs is possible. But be careful: if support breaks, we could easily slide back down to the 0.002980 base. How are you playing this A8 volatility? Are you buying the dip or waiting for the dust to settle? Let me know below. #ByXIMPACT #WSOT2026
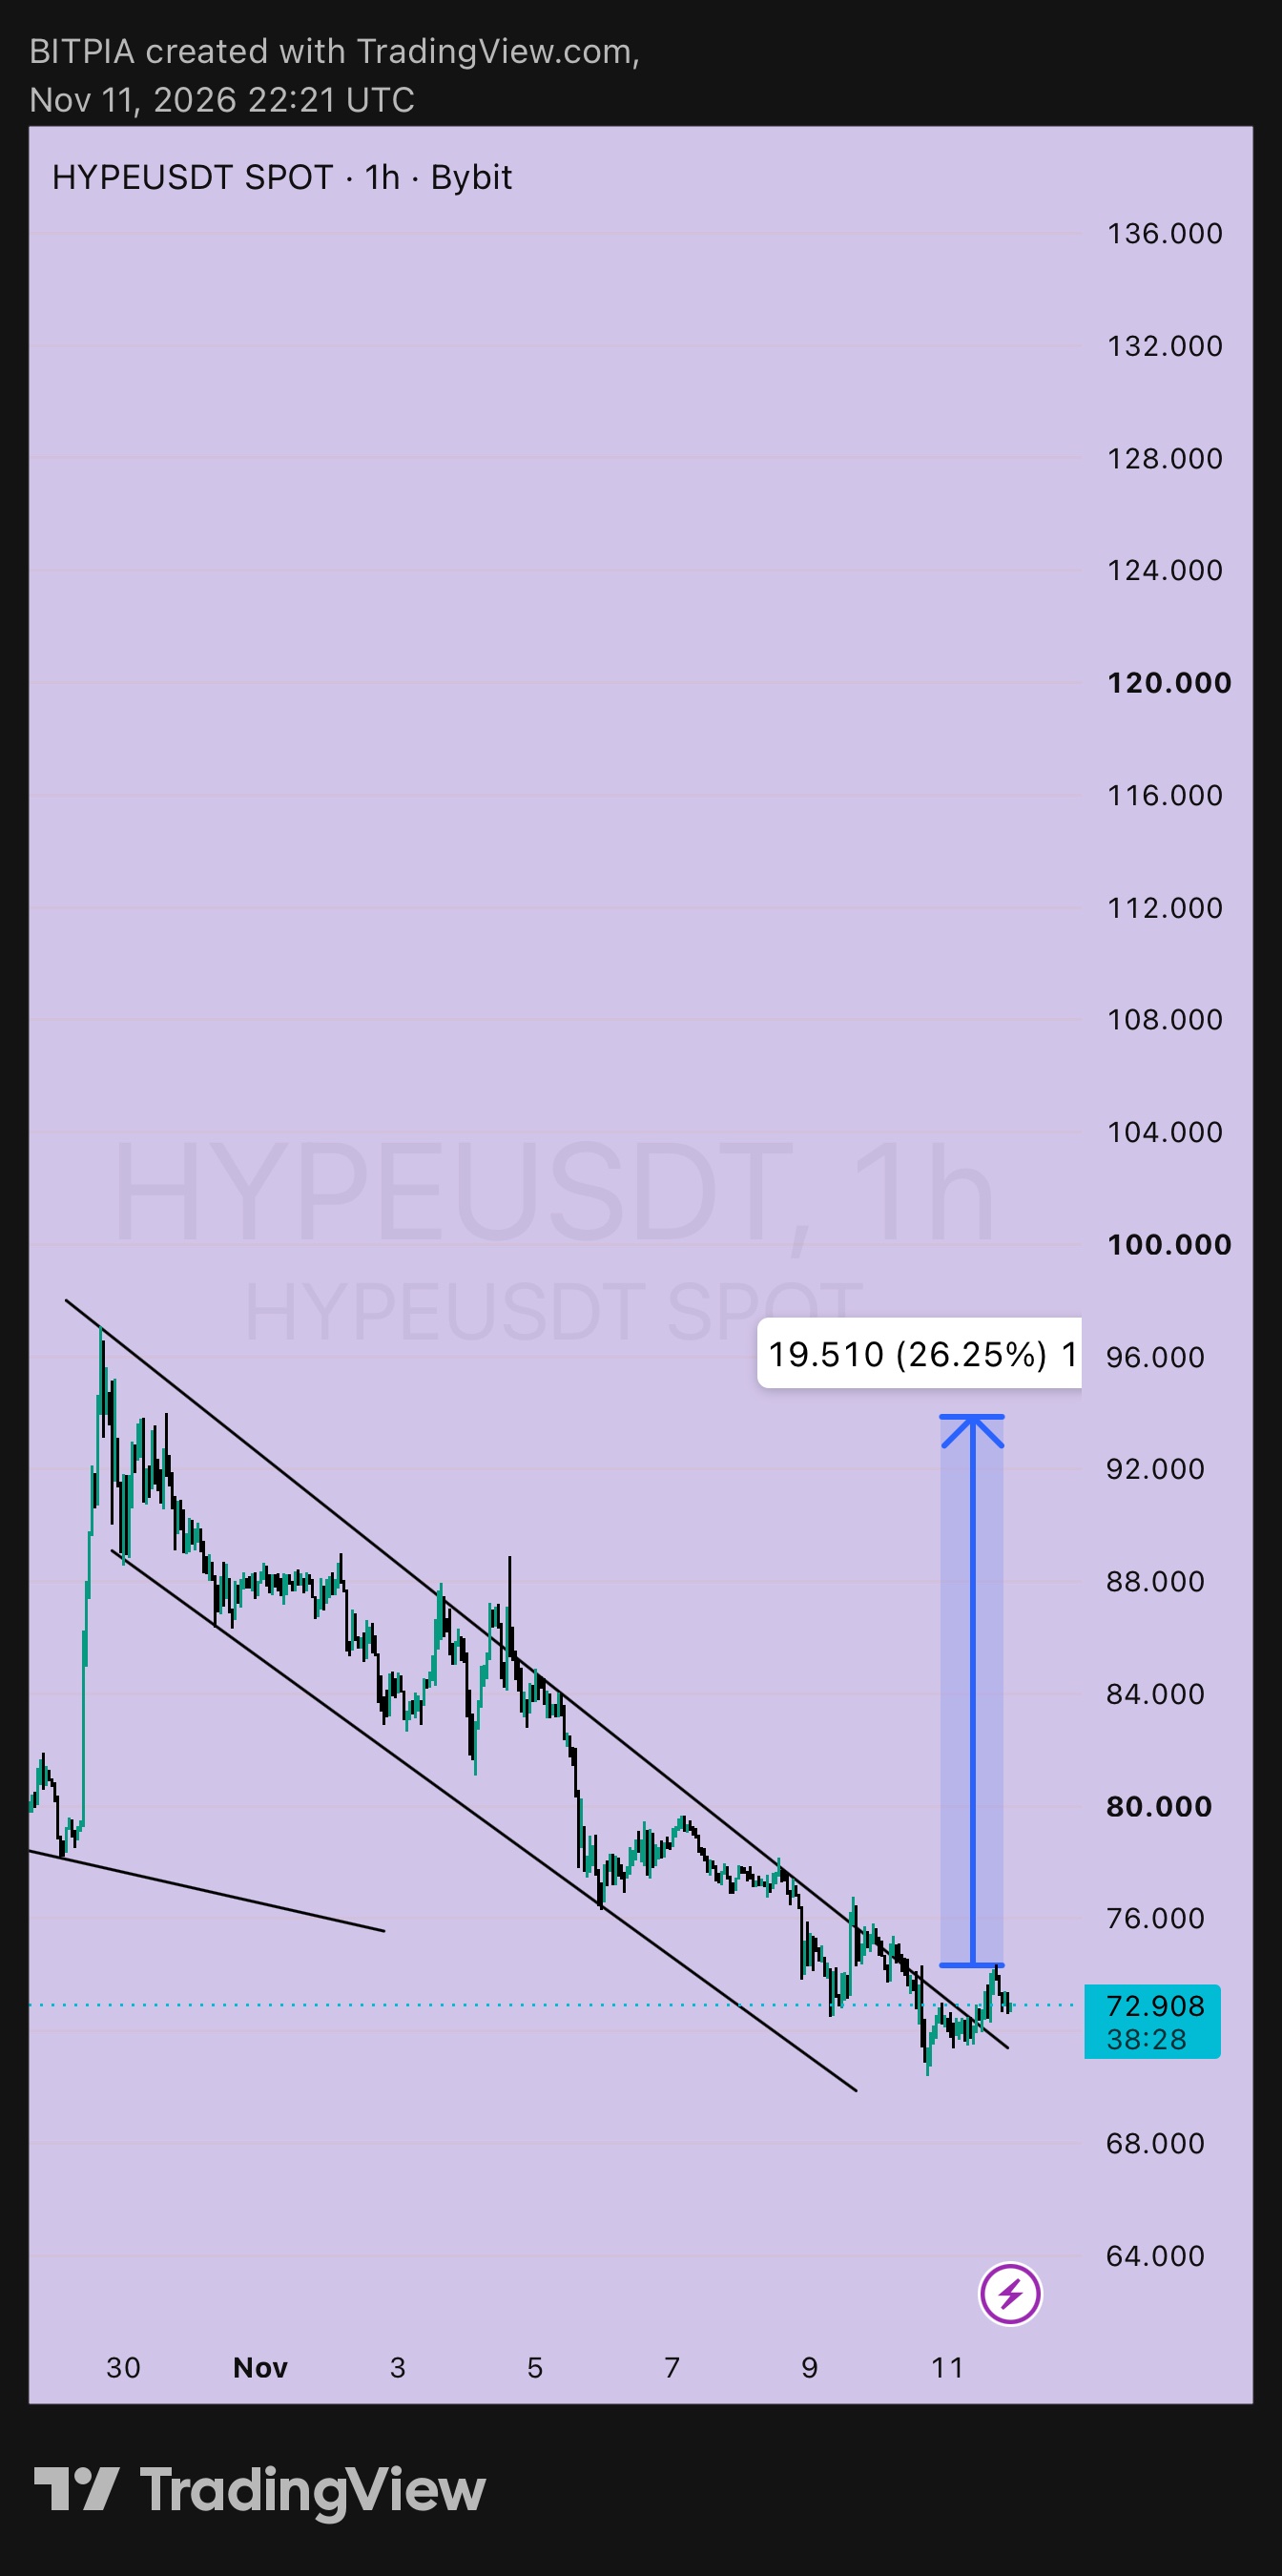
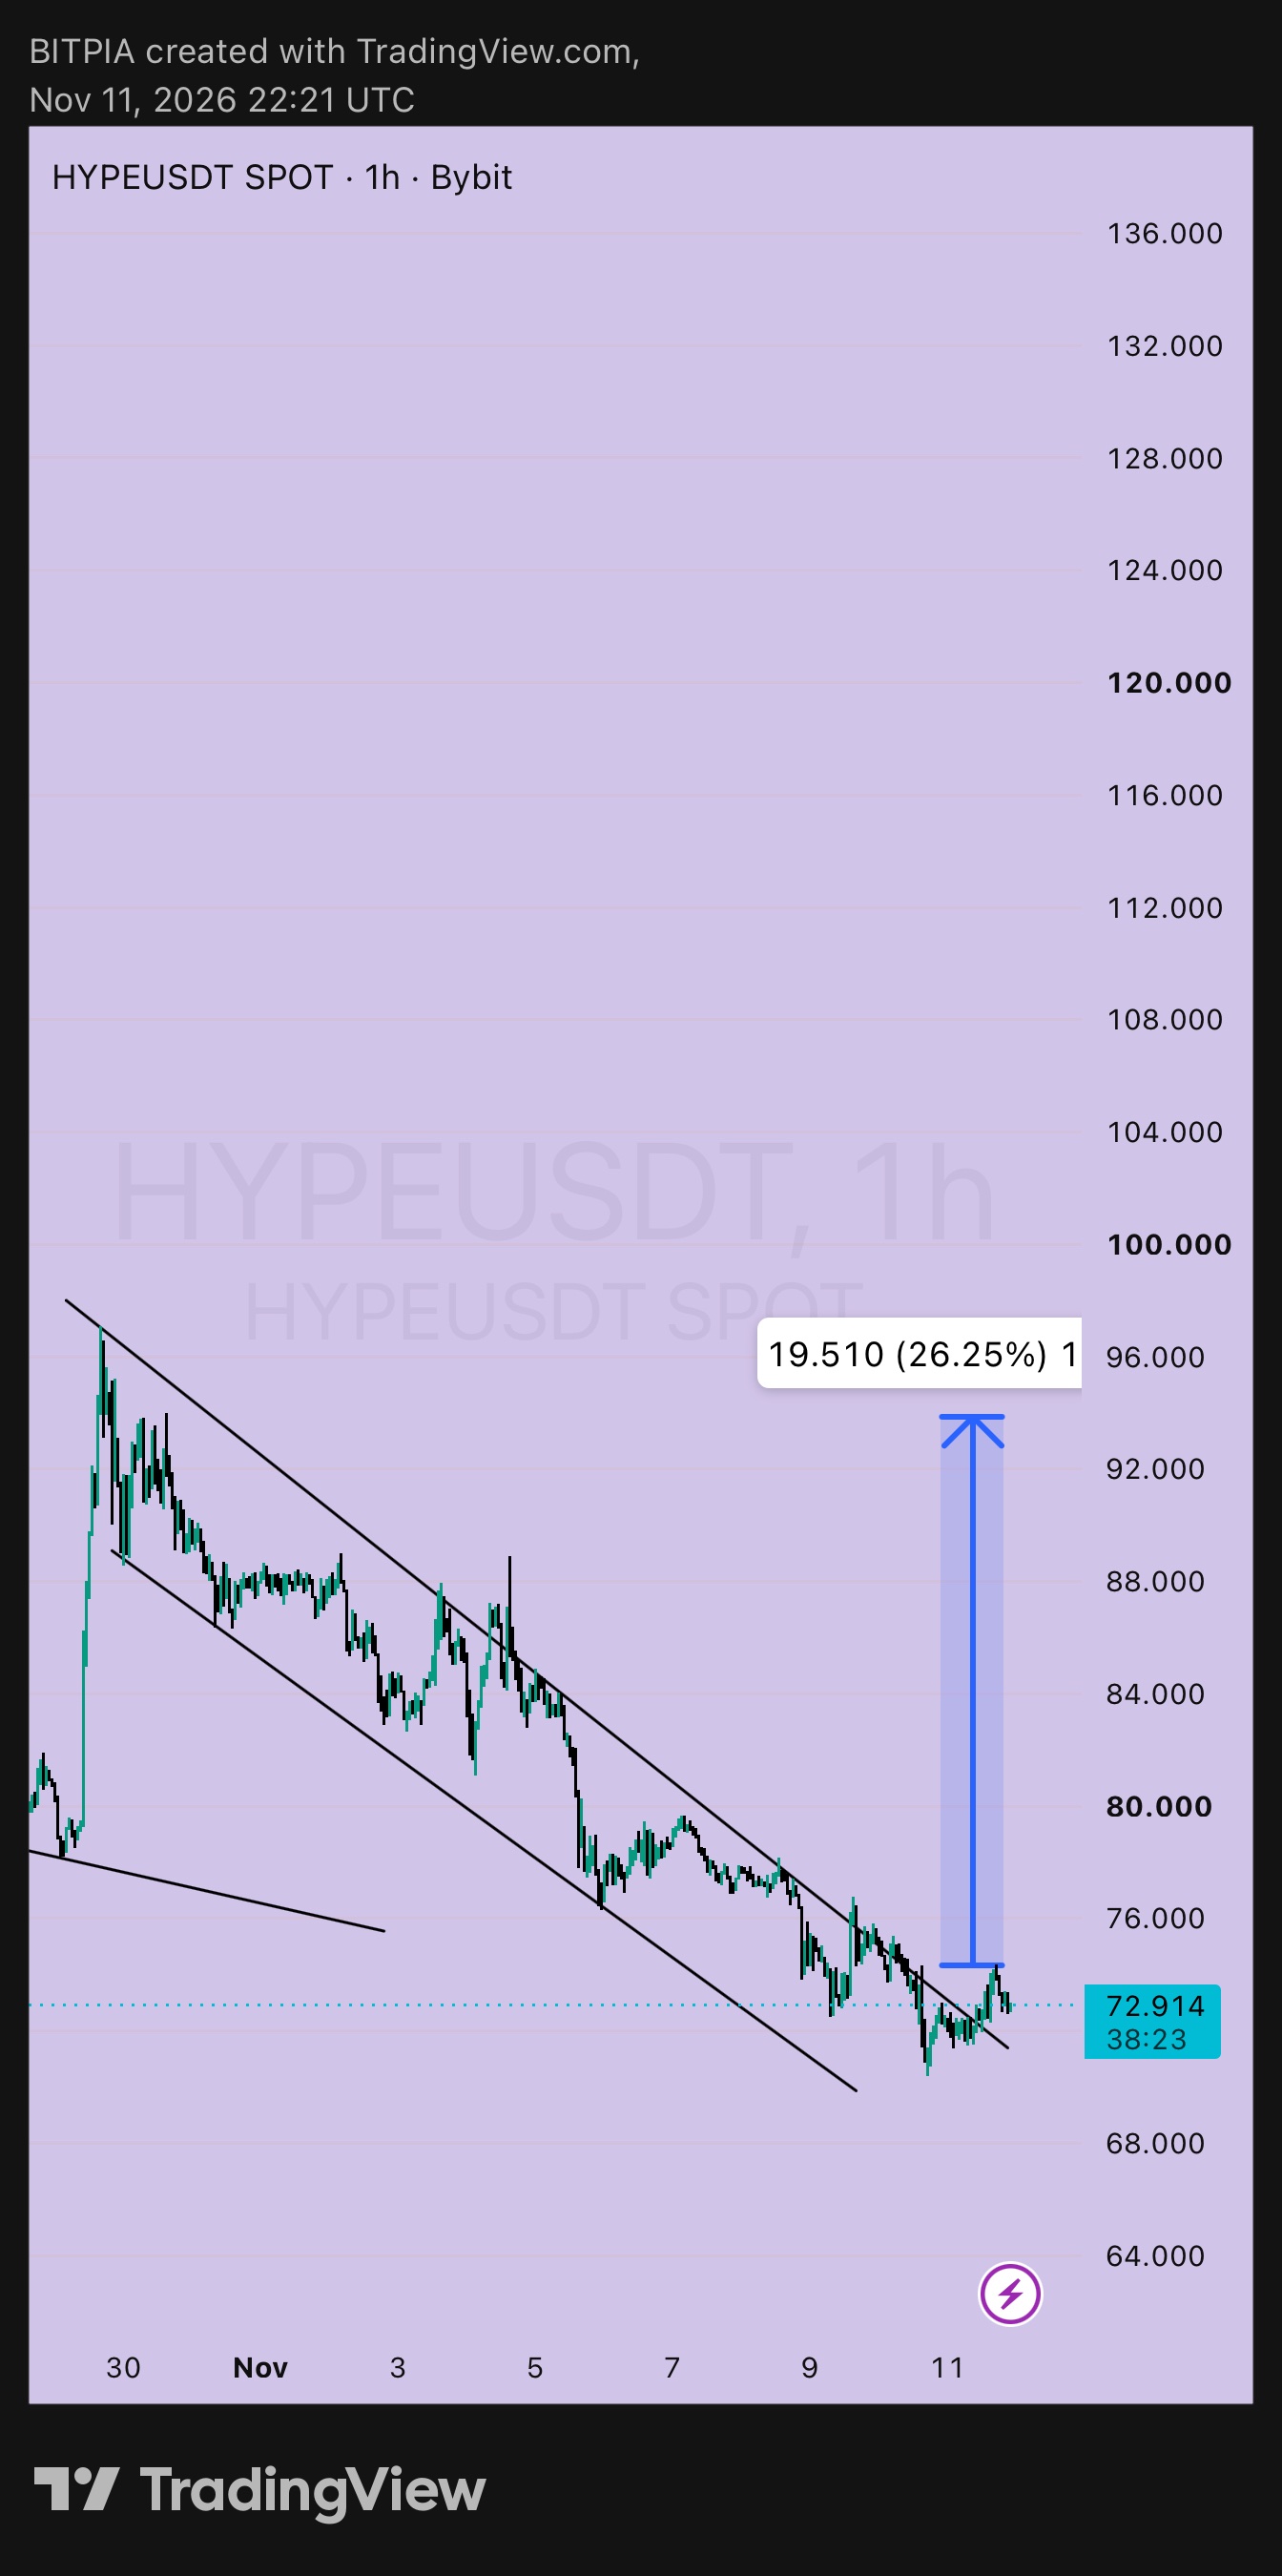
$HYPEUSDT 1時間足:自分用メモ ➤ ノート1:現状 11月9日に下降チャネル内のHYPEを73.802で投稿した。プランAは72.0付近での買い、ストップは69.5割れ。価格は70.3付近まで下落してから戻したので、エントリーは概ね約定しているはず。現在は72.914で、1ユニットあたり約+0.9、利益は約0.4R。 ➤ ノート2:変化点 ▸ 価格が72〜73付近にあるチャネル上限ラインを上抜けし、現在再テスト中 ▸ 70.3付近の安値が69.5のストップを割らずに維持されたため、プランは継続 ▸ チャート上のメジャードムーブは依然として94付近を示唆しており、チャネル下限から約26%上 ➤ ノート3:現在のオープンポジションの対応 ▸ ストップは1時間足が76を上回るまで69.5に維持 ▸ その後、建値(ブレークイーブン)である72付近まで引き上げる ▸ ターゲット:77(+5、約2R)、82.5(+10.5、約4.2R)、94(+22、約8.8R、かなり先なので少量を残す程度) ➤ ノート4:未エントリーの場合の対応 ▸ エントリー:72.5付近、上抜けたチャネルラインの再テストでサポートが確認できれば ▸ ストップロス:69.8割れ ▸ 1ユニットあたりのリスク:2.7 ▸ ターゲット:77(+4.5、約1.7R)、82.5(+10、約3.7R) ▸ 72.9で買うとストップが同じならリスクは3.1となり、77までは約1.3R。可能だが、再テストの方が数字が良い ➤ ノート5:プランBは待機中 ▸ トリガー:1時間足が77.5を上回って確定 ▸ エントリー:78付近、ストップは74割れ、リスク4 ▸ ターゲット:82.5(約1.1R)、90(約3R)、94(約4R) ➤ ノート6:無効条件 1時間足が69.5を下回って確定した場合はブレイク失敗とみなし、撤退する。 ポジションサイズは小さく、無期限先物を使う場合は低レバレッジで。さて、寝よう。🌙 投資助言ではありません。自己責任でリサーチを行い、失っても良い範囲のリスクで取引してください。 #ByXIMPACT #WSOT2026
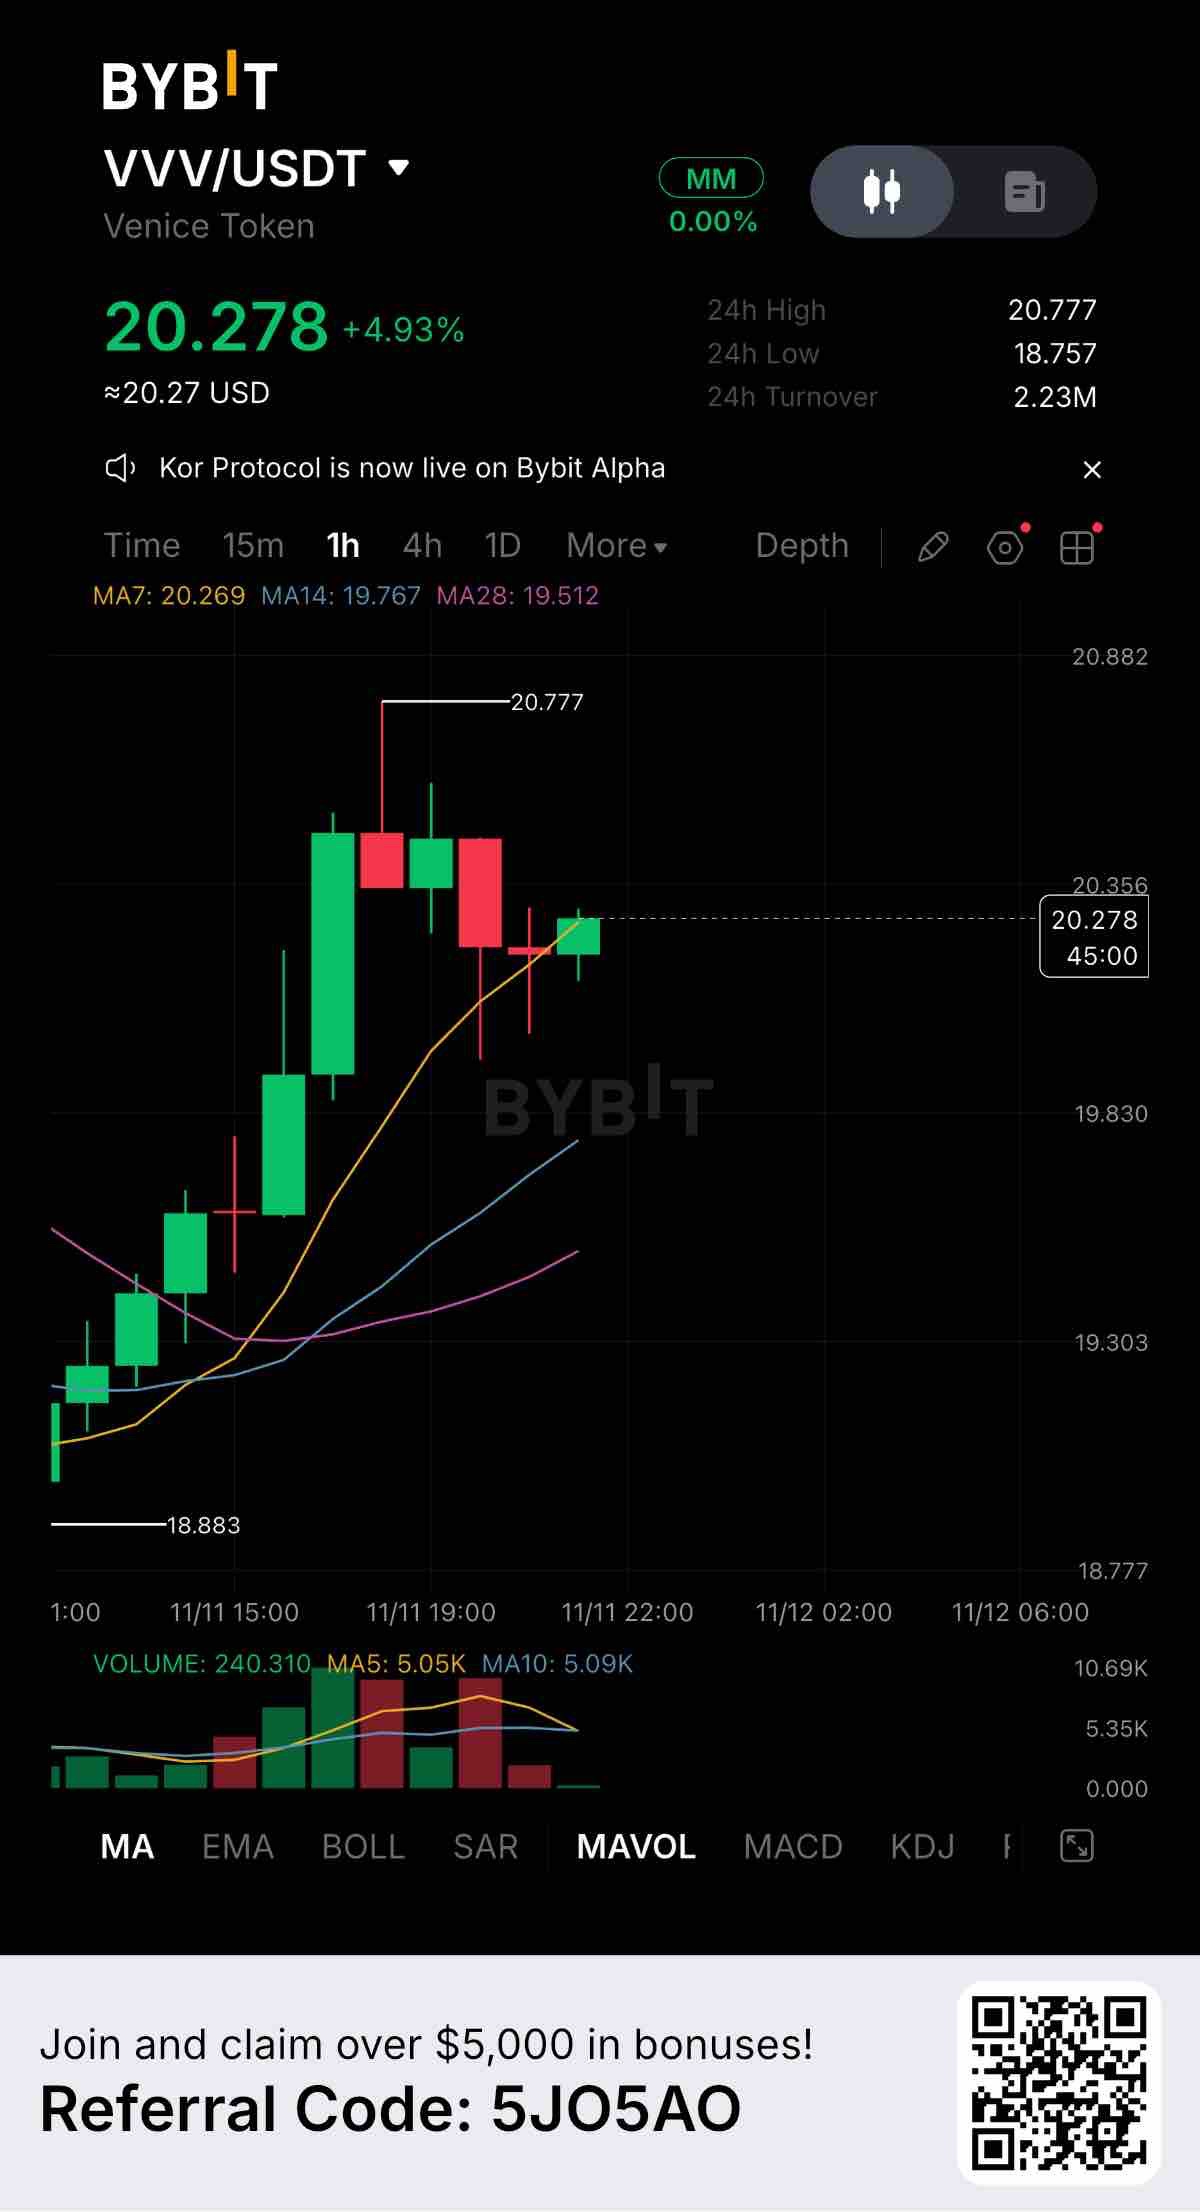
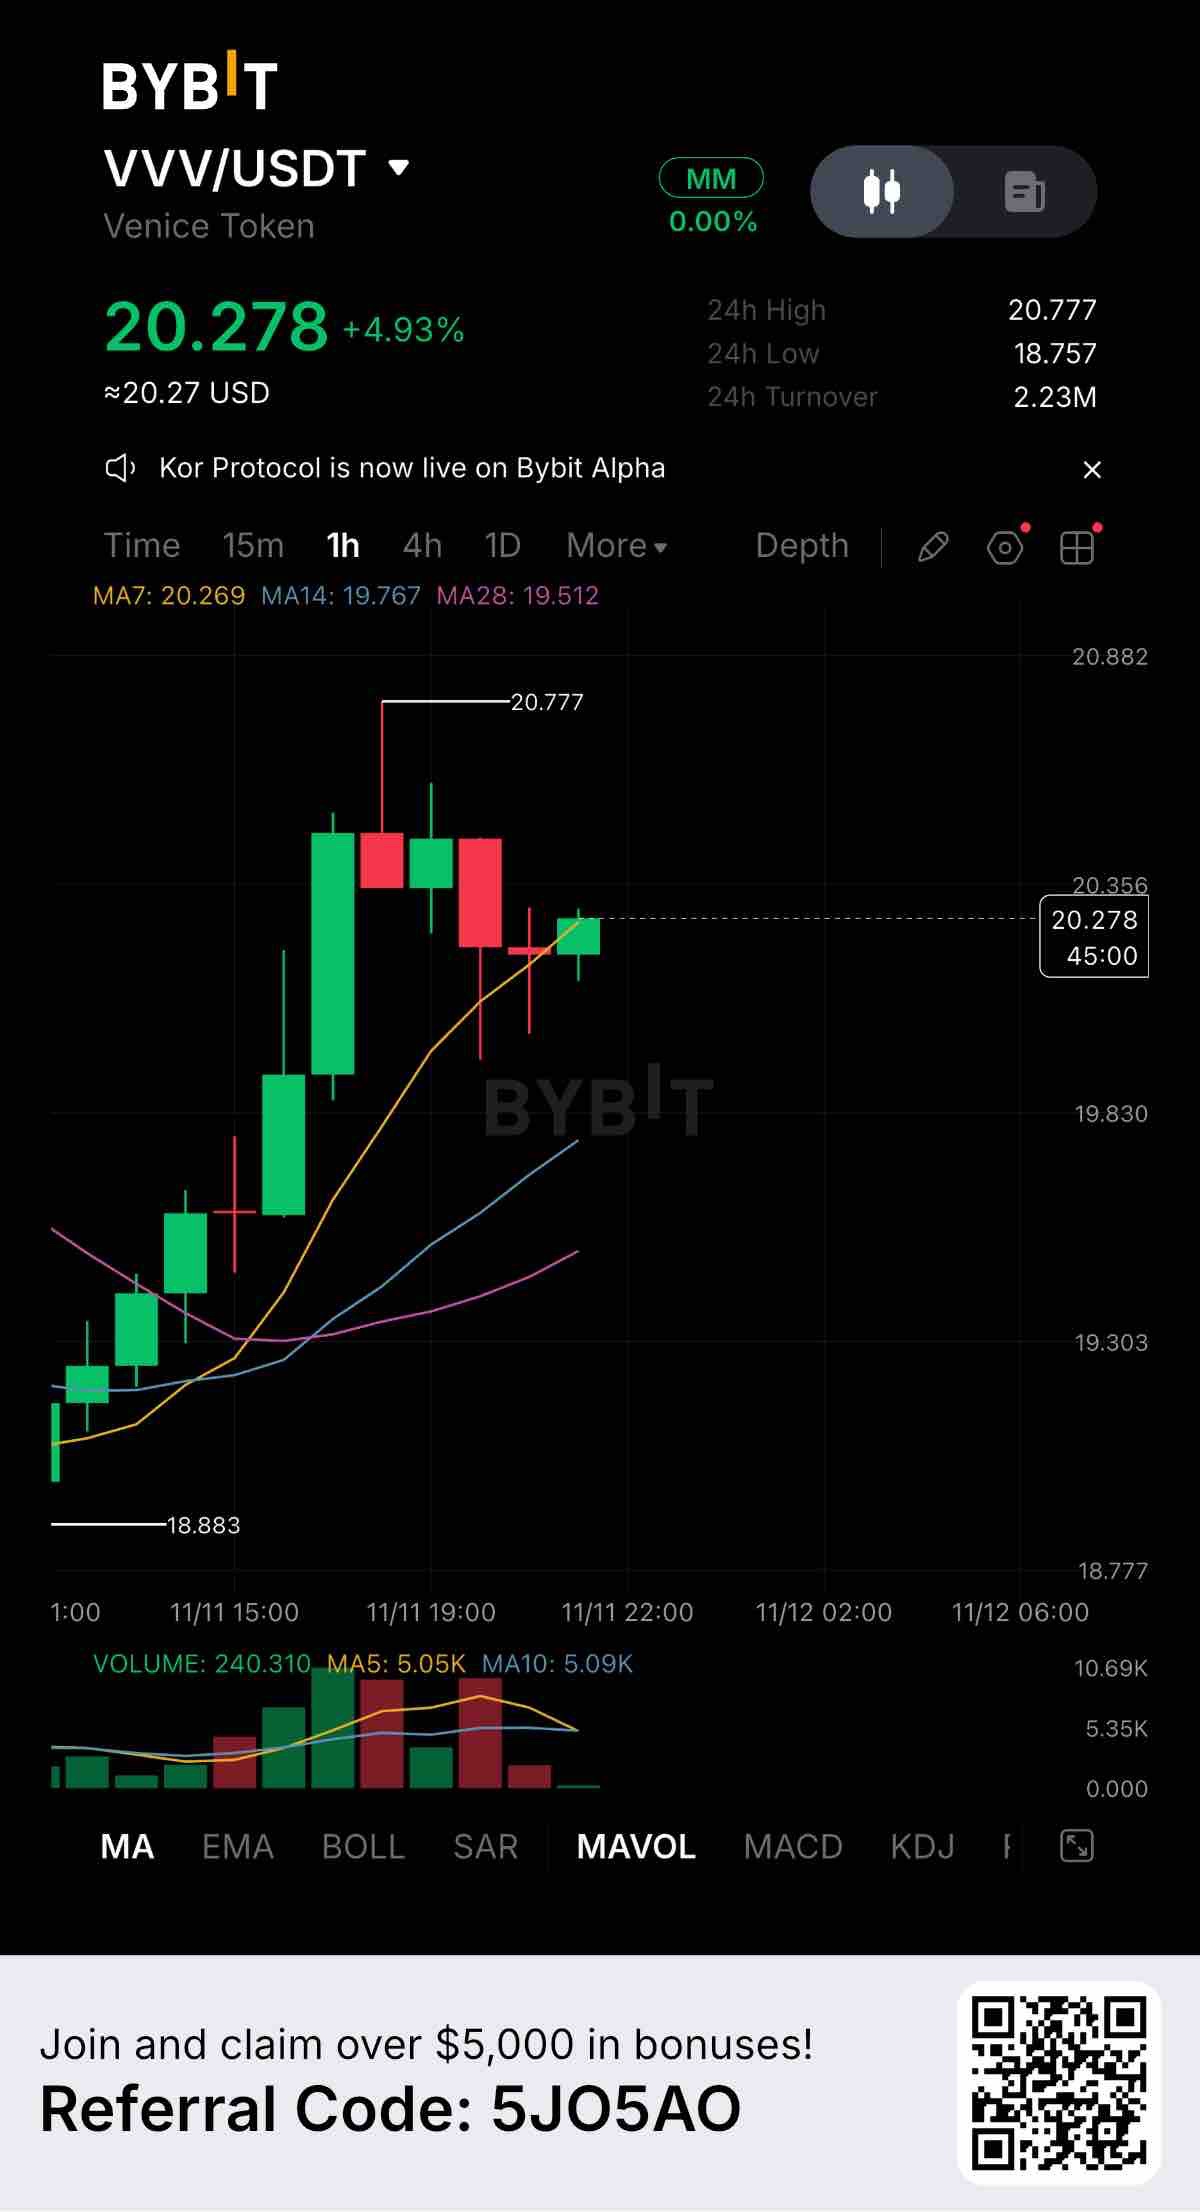
VVVUSDTは1時間足で典型的な市場の動きを見せており、現在20.278で取引され、4.93%上昇しています。価格を24時間最高値の20.777まで押し上げた急騰の後、初期の買い手が利益確定売りを行っているため、健全な押し目が見られます。 注視すべき主要レベル: レジスタンス: 20.777 (売りが介入した直近のピーク) サポート1: 20.269 (7日移動平均線、現在まさに攻防の焦点となっている) サポート2: 18.757 (24時間安値、下値におけるより強力な構造的サポート) 移動平均線を見ると、トレンドは全体として依然として強気です。価格は7日移動平均線(20.269)上にしっかりと維持されており、MA14(19.767)およびMA28(19.512)を十分に上回っています。現在の試練は、7日移動平均線がサポートとして機能し続けるか、それとも割り込むかです。 出来高は健全で、24時間取引高は2.23M USDTです。チャートを見ると、この押し目局面の売り出来高は、上昇初期の買い出来高よりもはるかに低く、強気派にとっては良い兆候です。 ファンダメンタルズ面では、Venice Token (VVV) は最近の上昇幅をしっかりと維持しています。このような押し目は、過熱した指標を冷やし、新たな買い手が参入する余地を作るためにしばしば必要です。 もし価格がこの20.269のサポートレベルで反発すれば、20.777の高値への再挑戦が見られるかもしれません。しかし、もしこのレベルを割り込めば、19.800付近(MA14付近)への下落も十分に考えられます。 あなたはVVVのこの押し目で買いますか?それともサポートが維持されるか様子見しますか?ぜひご意見をお聞かせください。 #ByXIMPACT #WSOT2026
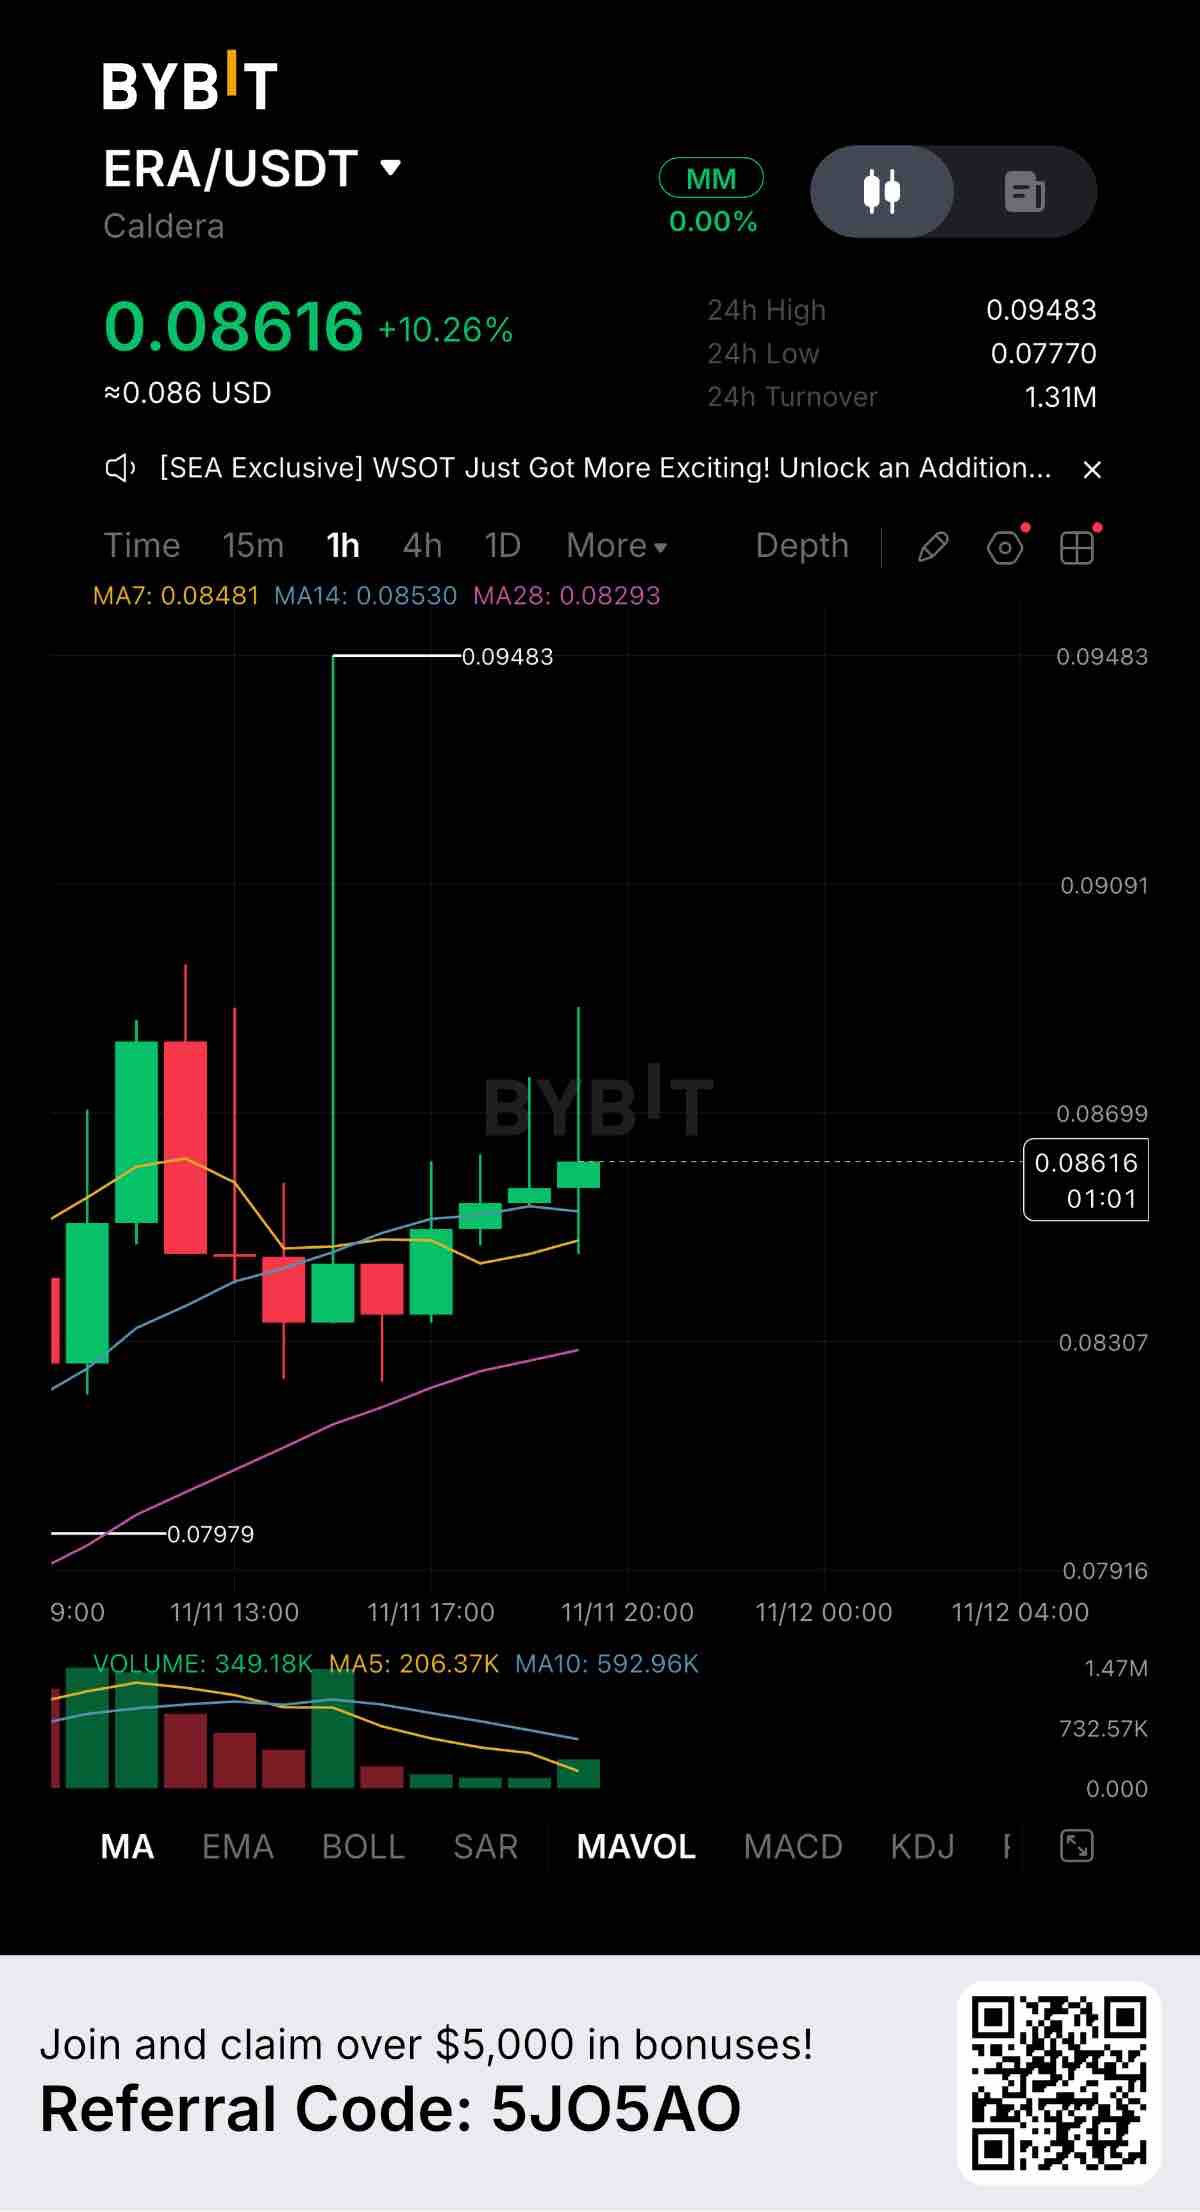
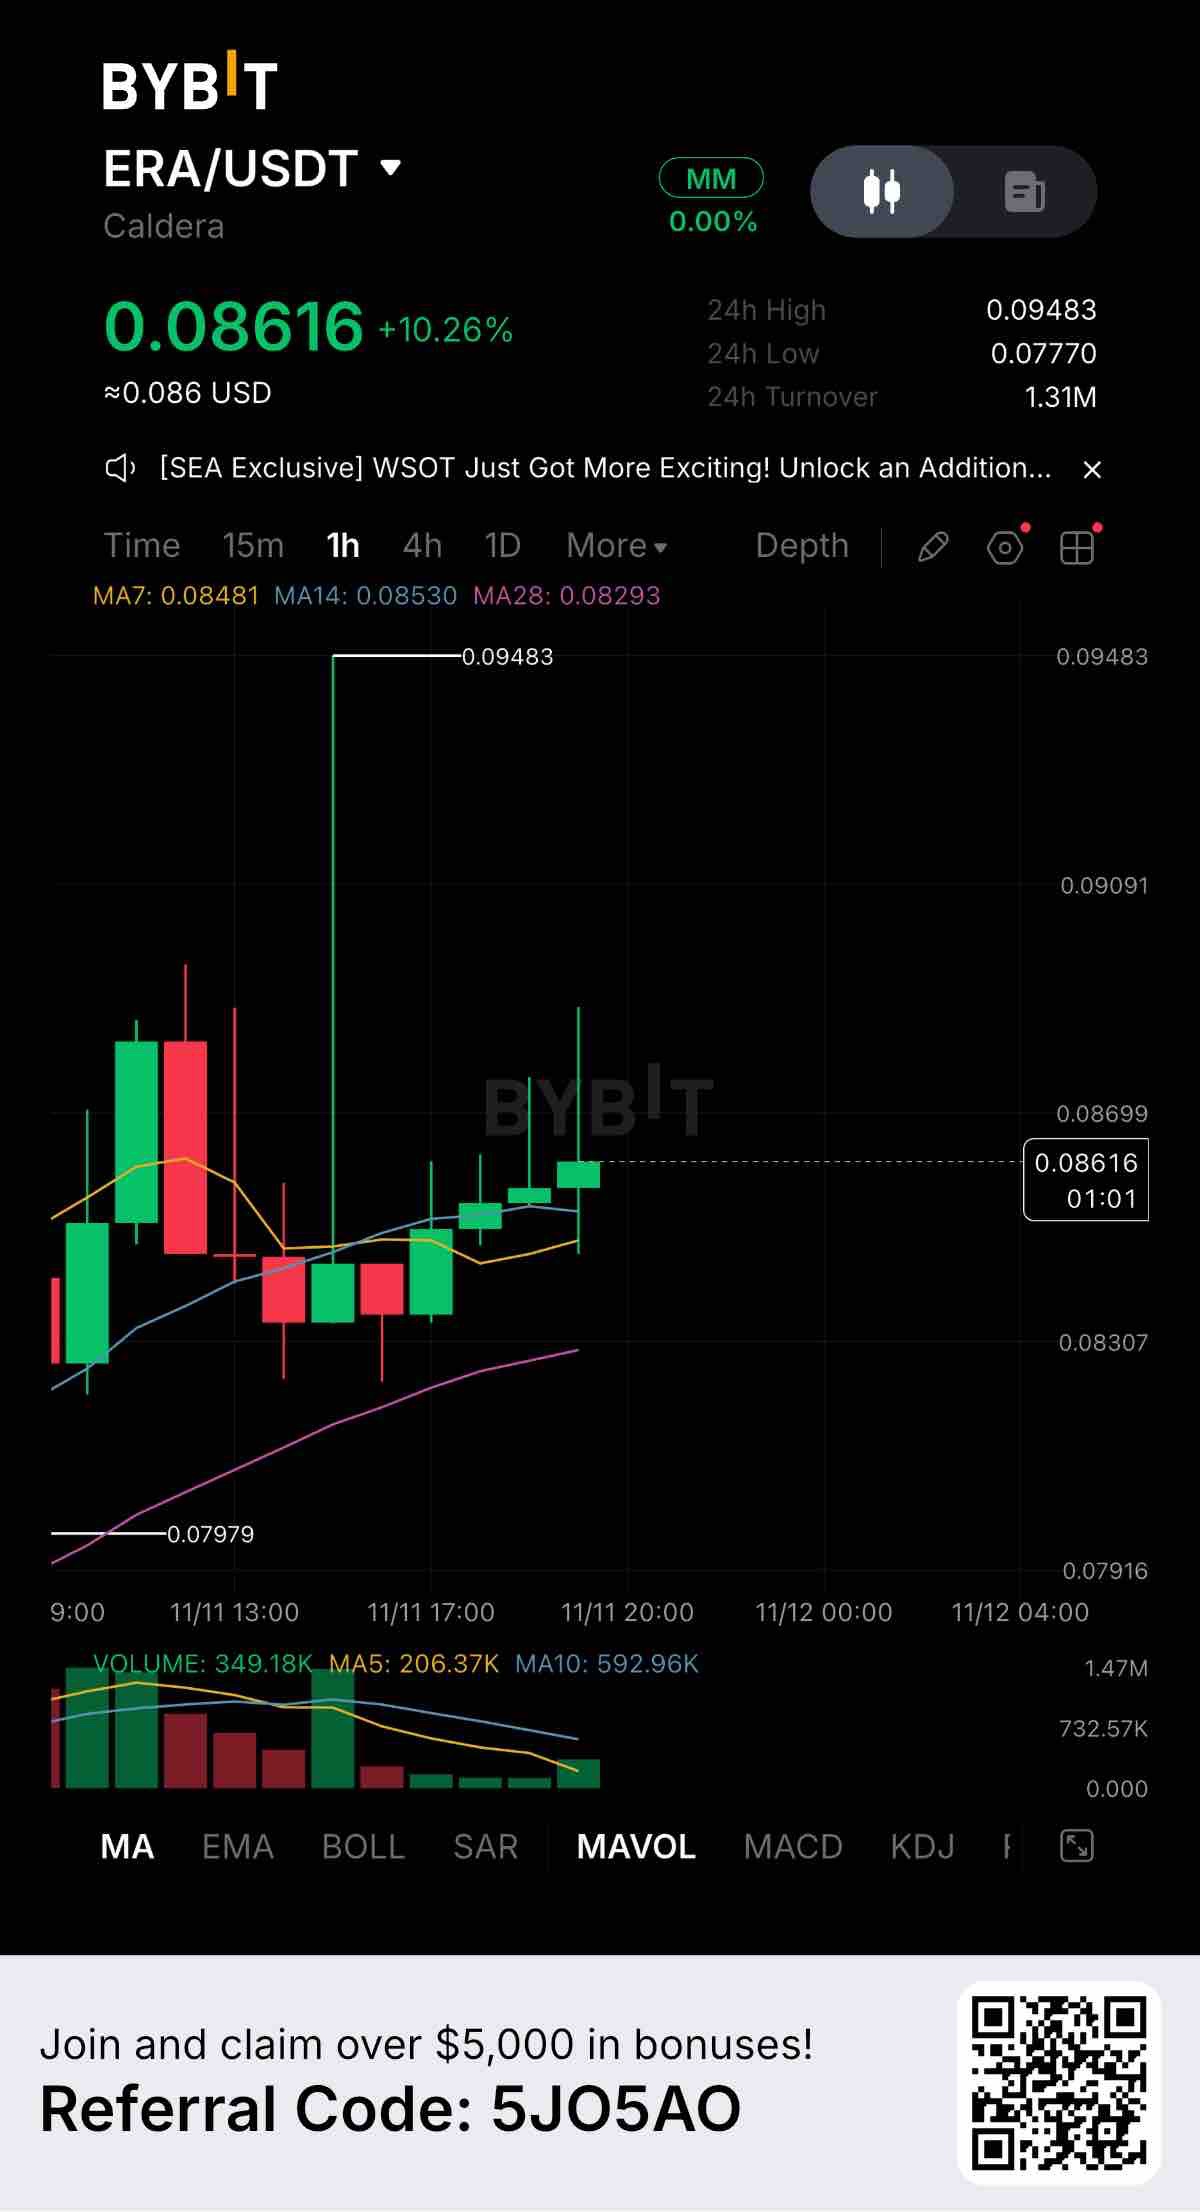
$ERAUSDT is showing interesting price action on the 1-hour chart, currently trading at 0.08616 with a solid +10.26% gain. However, looking closely at the chart, this isn't a simple straight line up. We saw a massive volatility spike that left a huge upper wick reaching all the way to 0.09483 before sellers pushed the price back down. Key Levels to Watch: Resistance: 0.09483 (The massive 24-hour high and the top of the recent wick) Support 1: 0.08481 (7-day MA, acting as immediate dynamic support) Support 2: 0.07770 (24-hour low, the structural floor) The moving averages are currently pinching together, but price is holding above MA7, MA14, and MA28. After that massive spike and rejection, the price is now consolidating and forming a series of smaller green candles. This suggests buyers are trying to build a base and regain control. Volume is a key factor here. The initial spike was met with heavy selling pressure, but the 24-hour turnover remains strong at 1.31M USDT. We need to see if buying volume can step back in to push through the previous rejection zone. Fundamentally, Caldera (ERA) is getting attention, and the sudden volatility spike often points to a reaction to news or a liquidity grab by larger players. If buyers can build enough momentum to test 0.09483 again, a breakout could follow. But right now, the safer play is watching to see if the 0.08481 support holds. If it does, we might have a solid setup for the next leg up. If it breaks, we could retest the lows. What is your read on ERA after that massive wick? Are you buying this consolidation? Let’s discuss in the comments. #ByXIMPACT #WSOT2026
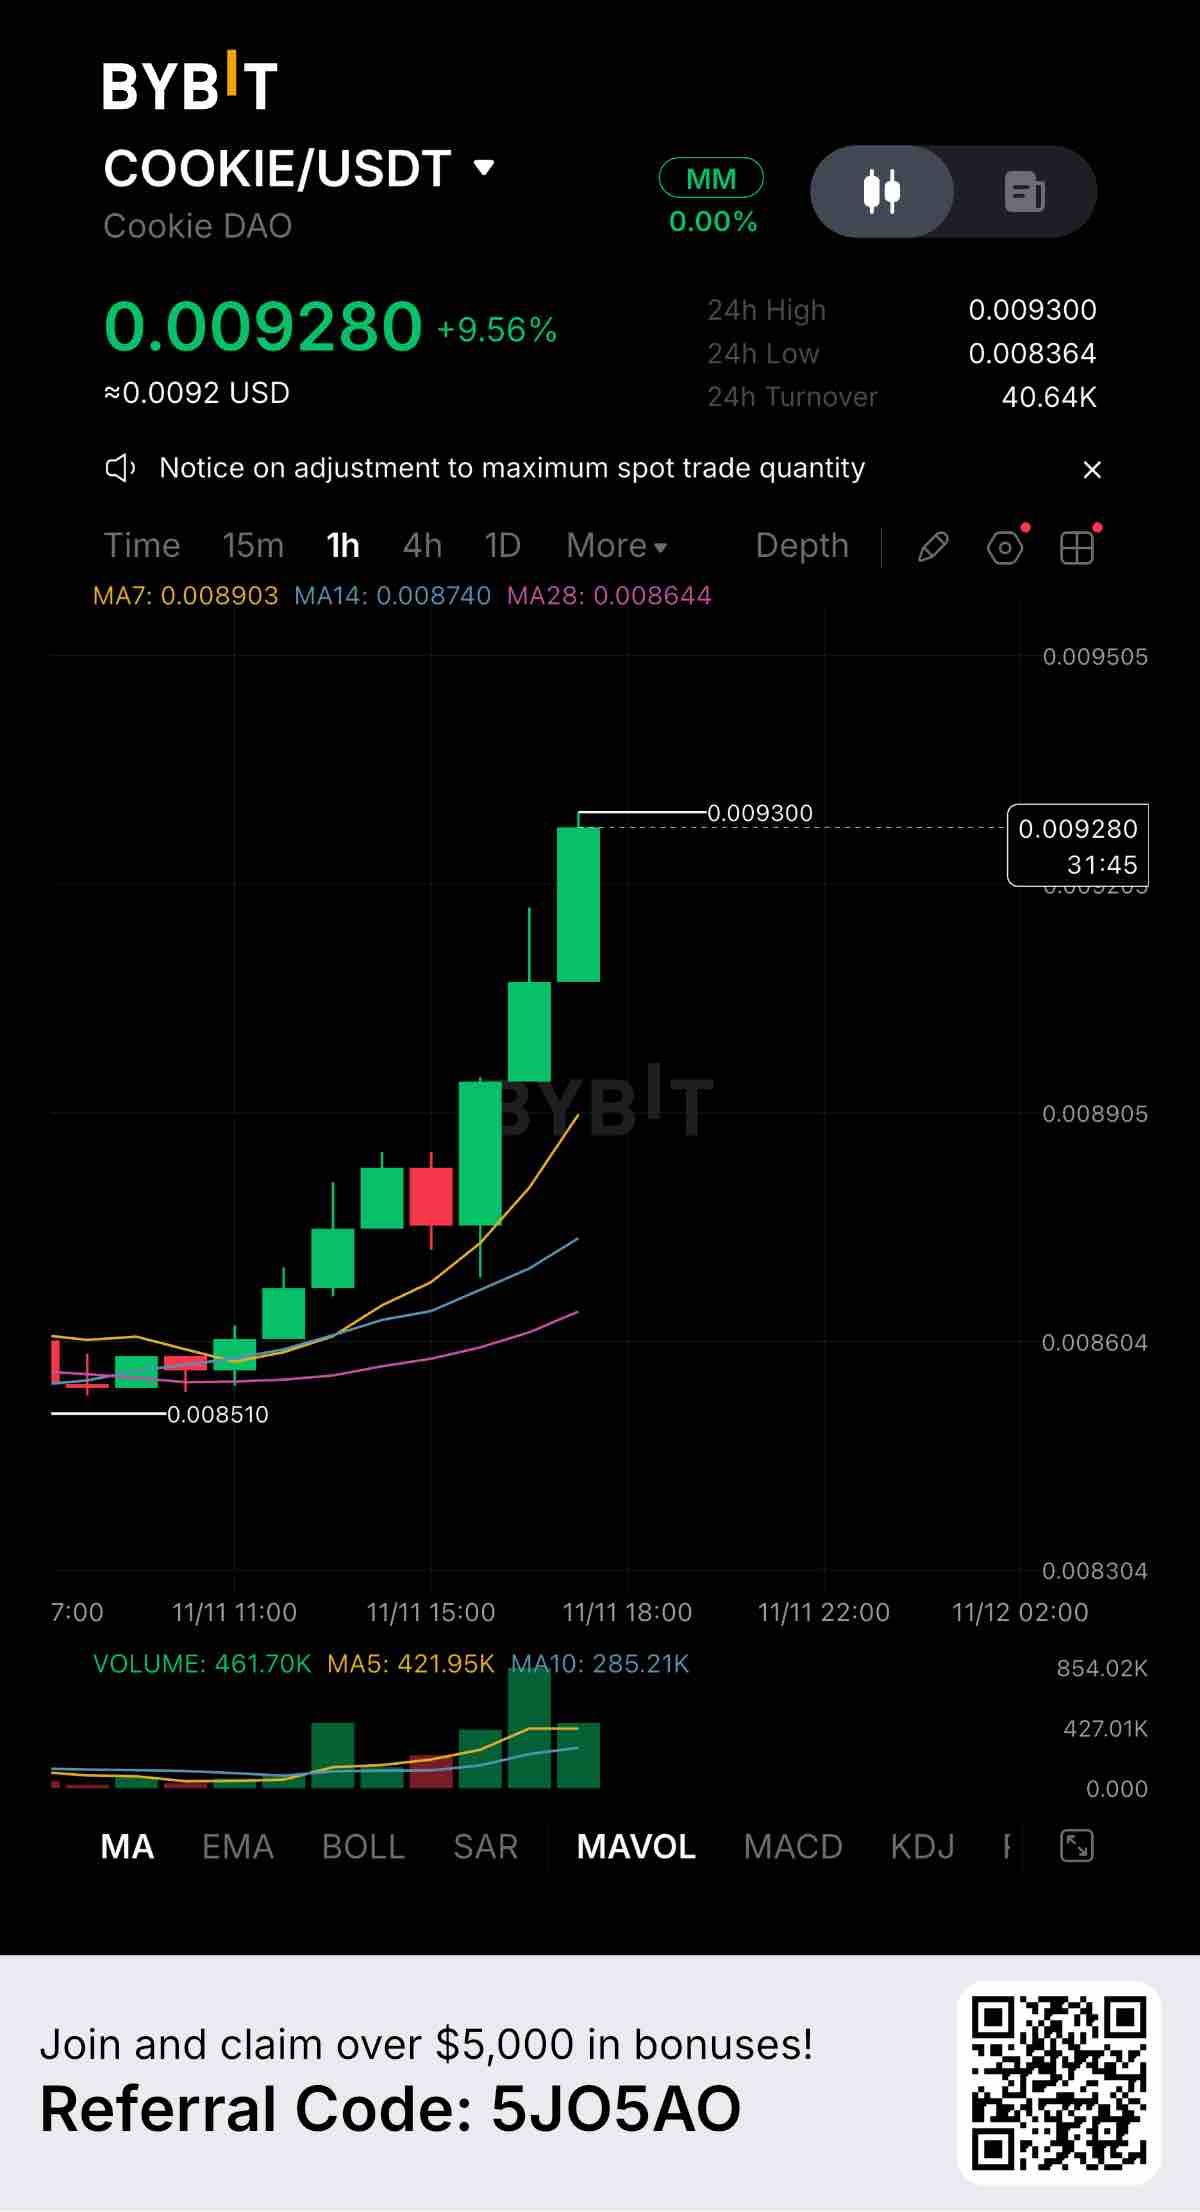
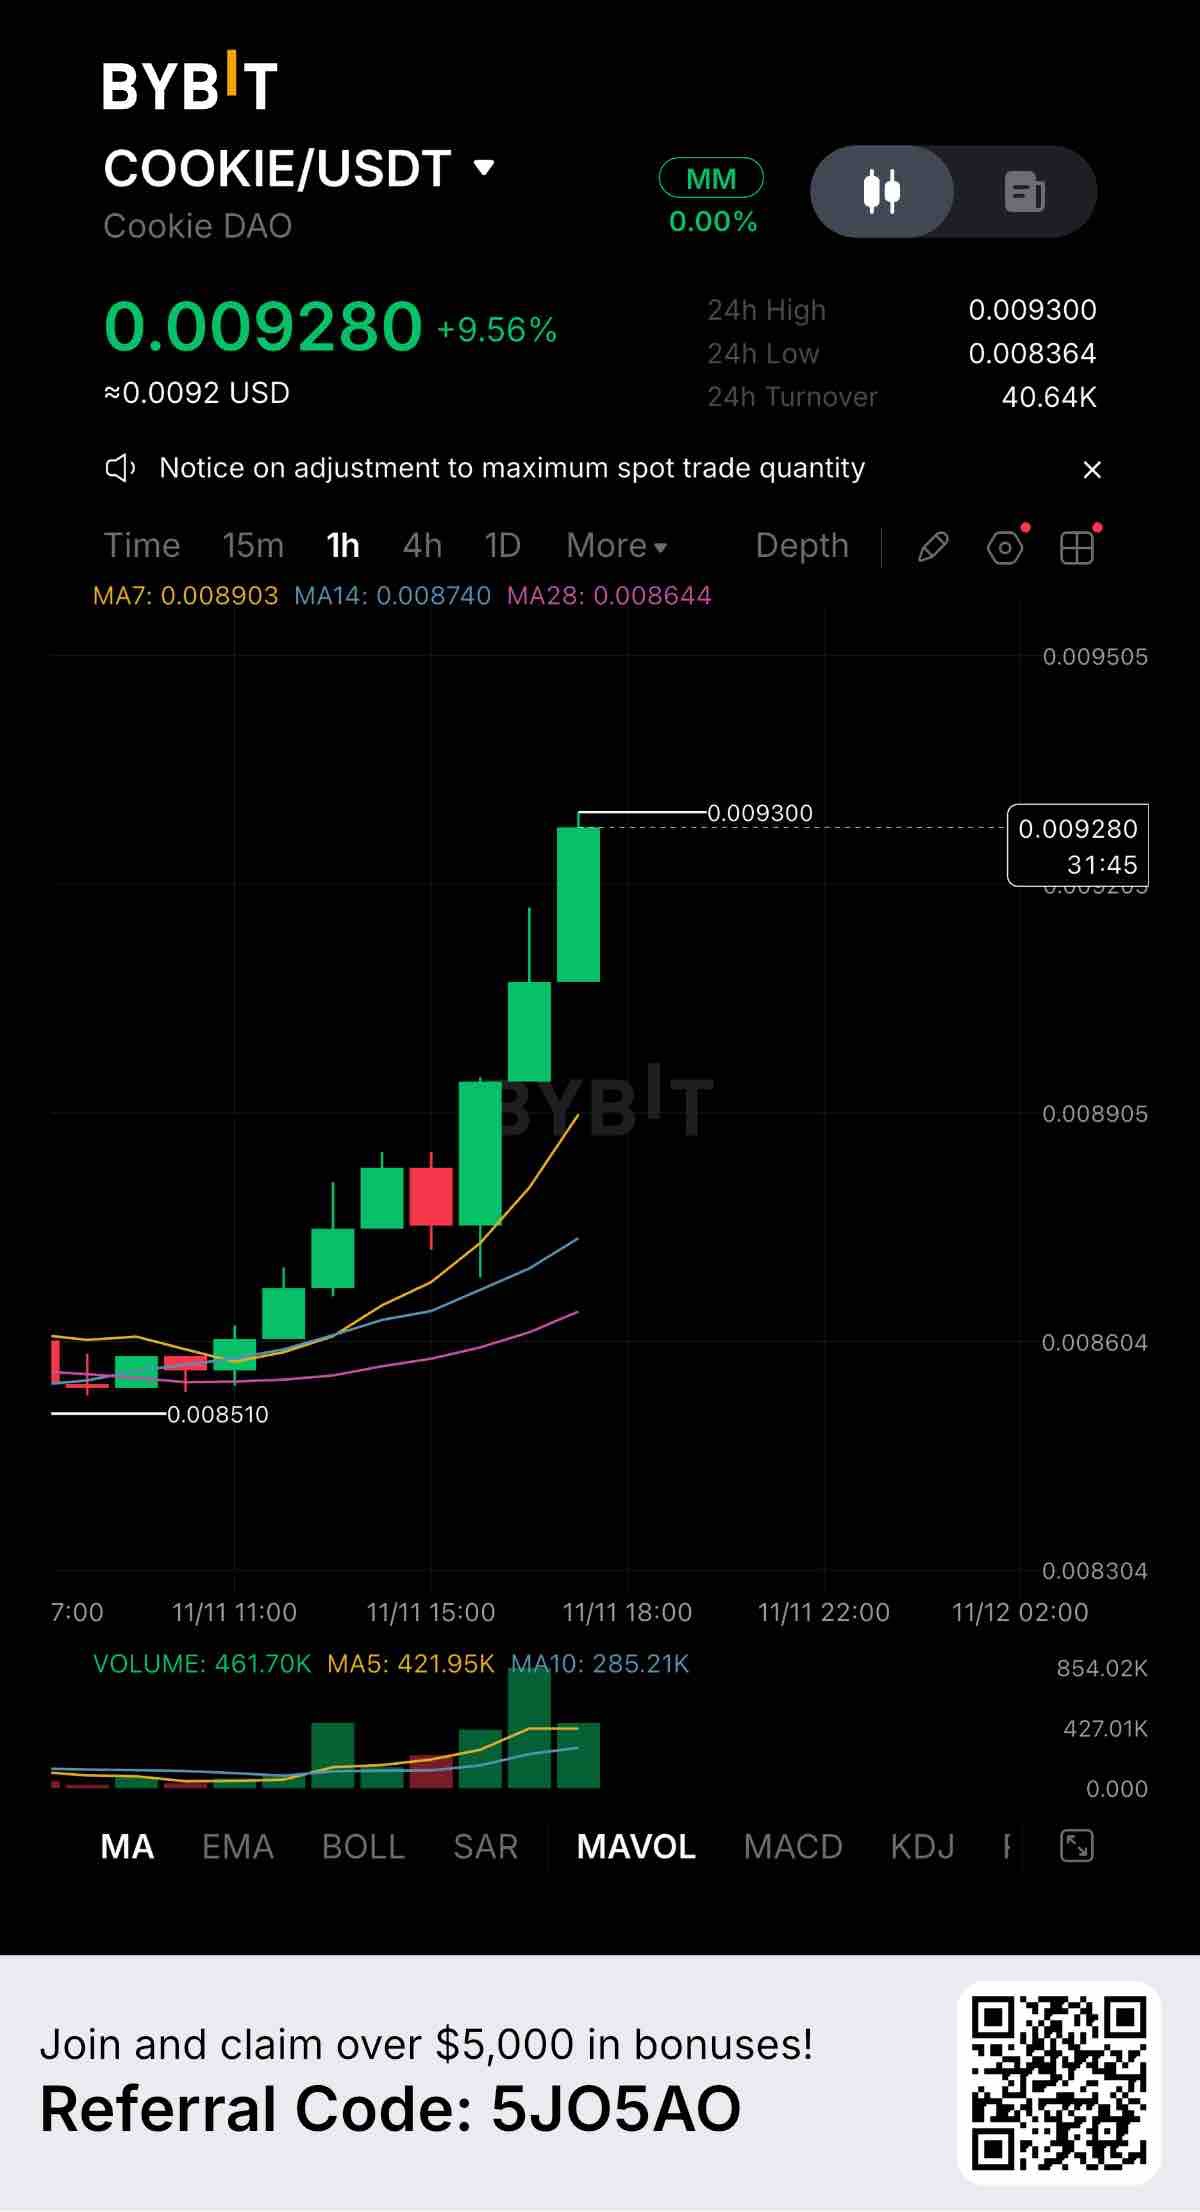
$COOKIEUSDT is putting in serious work on the 1-hour chart, currently trading at 0.009280 with a strong +9.56% gain. The price action is showing a relentless staircase pattern, with buyers stepping in aggressively on every pullback. Key Levels to Watch: Resistance: 0.009300 (The current 24-hour high, acting as the immediate ceiling) Support 1: 0.008903 (7-day MA, the first dynamic support zone) Support 2: 0.008364 (24-hour low, the stronger structural floor) The moving averages are perfectly fanned out. Price is trading well above MA7, MA14, and MA28, confirming a highly aggressive short-term uptrend. The chart shows almost no selling resistance, with only minor red candles before the next leg up. Volume is the real confirmation here. The green volume bars are expanding as the price pushes higher, backed by 40.64K USDT in 24-hour turnover. This indicates genuine buying pressure, not just low-liquidity spikes. Fundamentally, Cookie DAO (COOKIE) is capturing heavy attention. Steady, stair-step moves like this usually indicate strong community momentum and active accumulation. If buyers manage to break and hold above 0.009300, price discovery is likely. However, because the price is extended from the 7-day MA, chasing here carries risk. A retest of 0.008903 is the safer setup if you are looking to enter. Are you holding COOKIE or waiting for a pullback? Let’s hear your thoughts below. #ByXIMPACT #WSOT2026
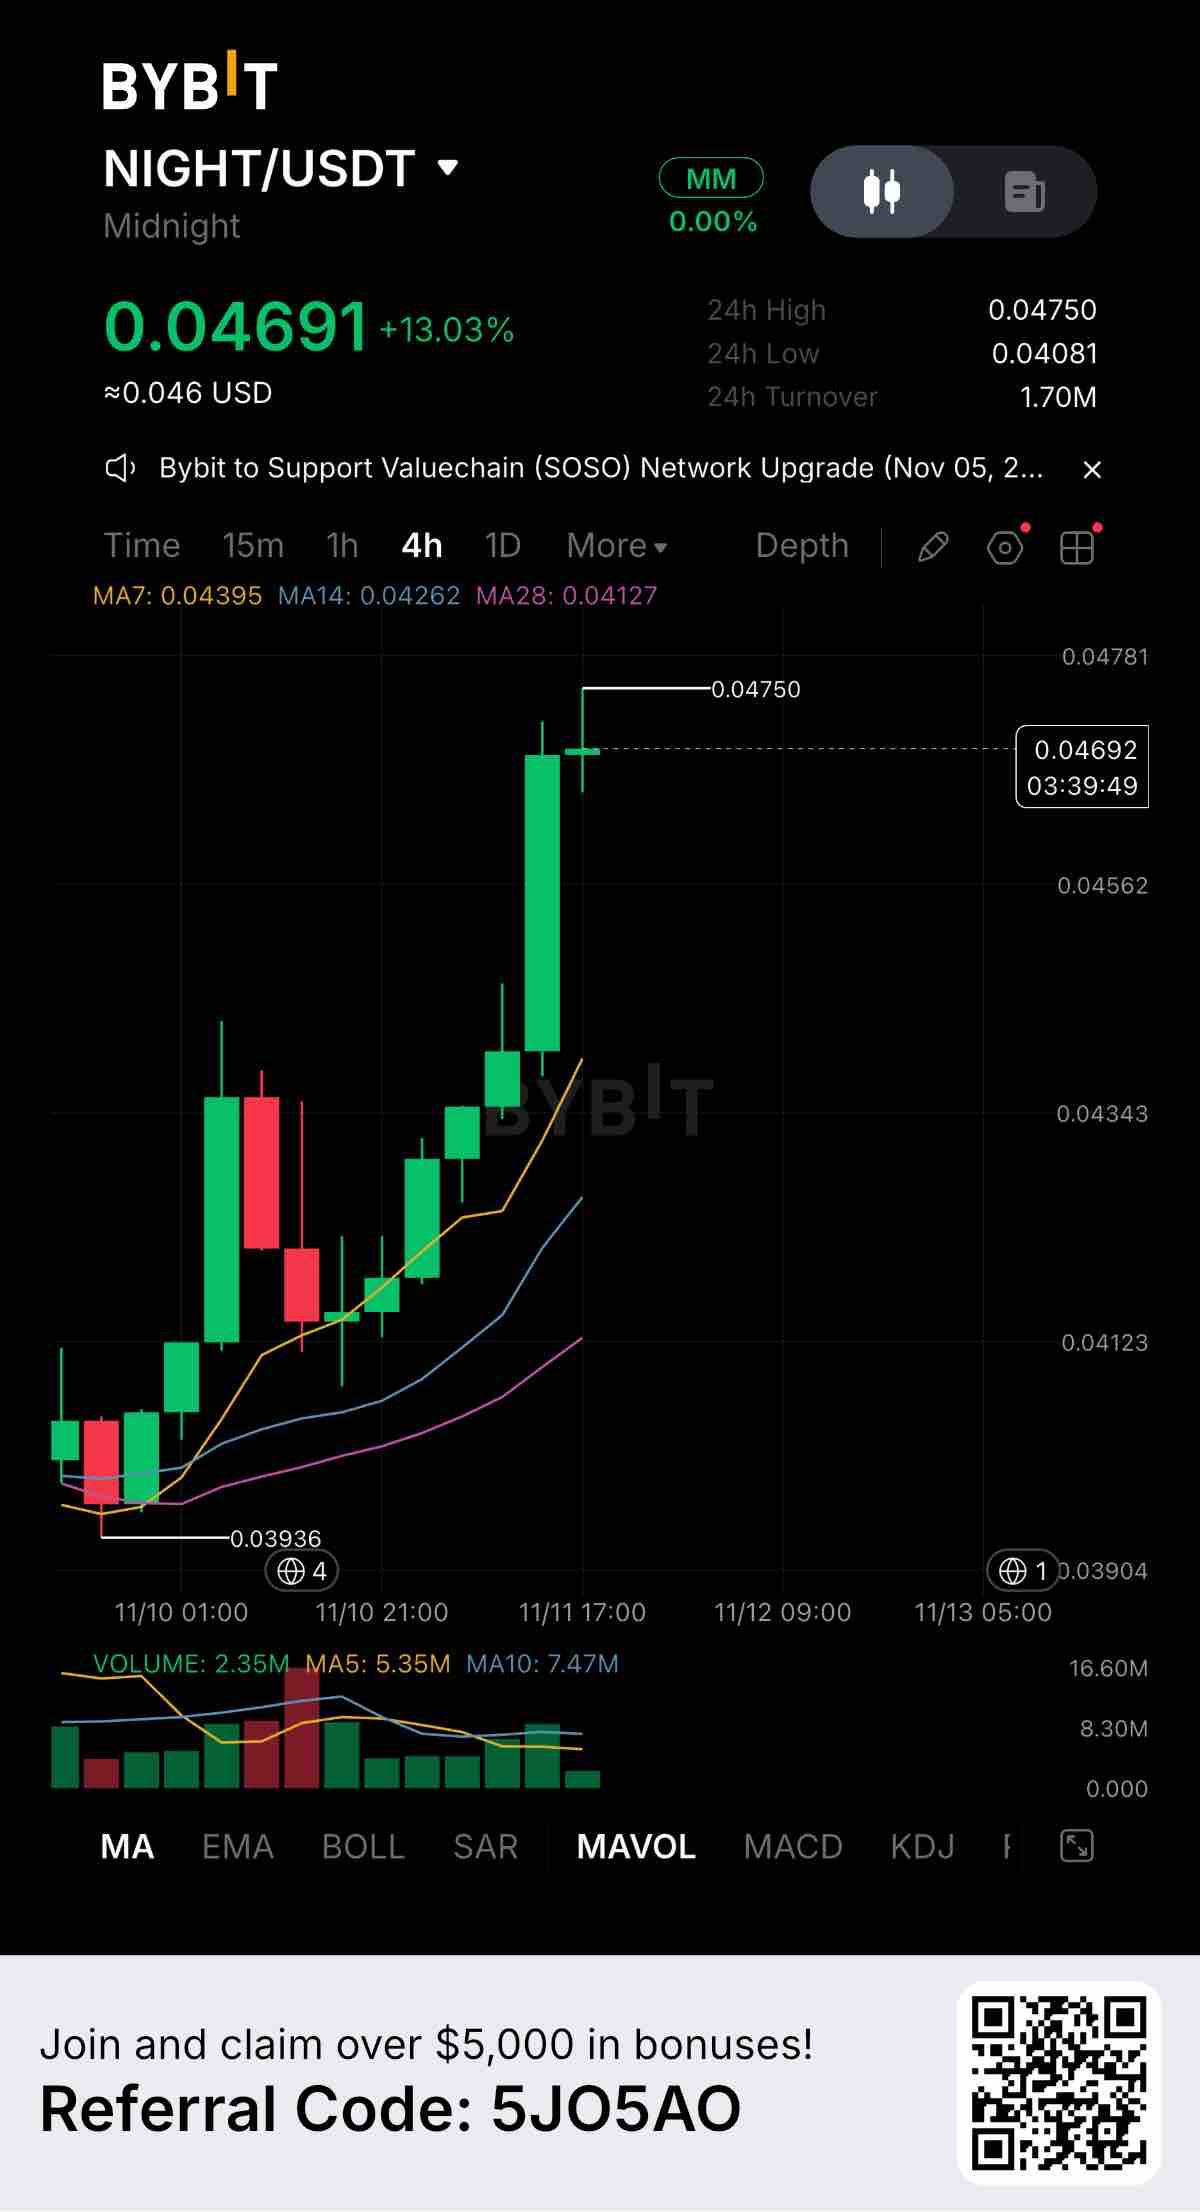
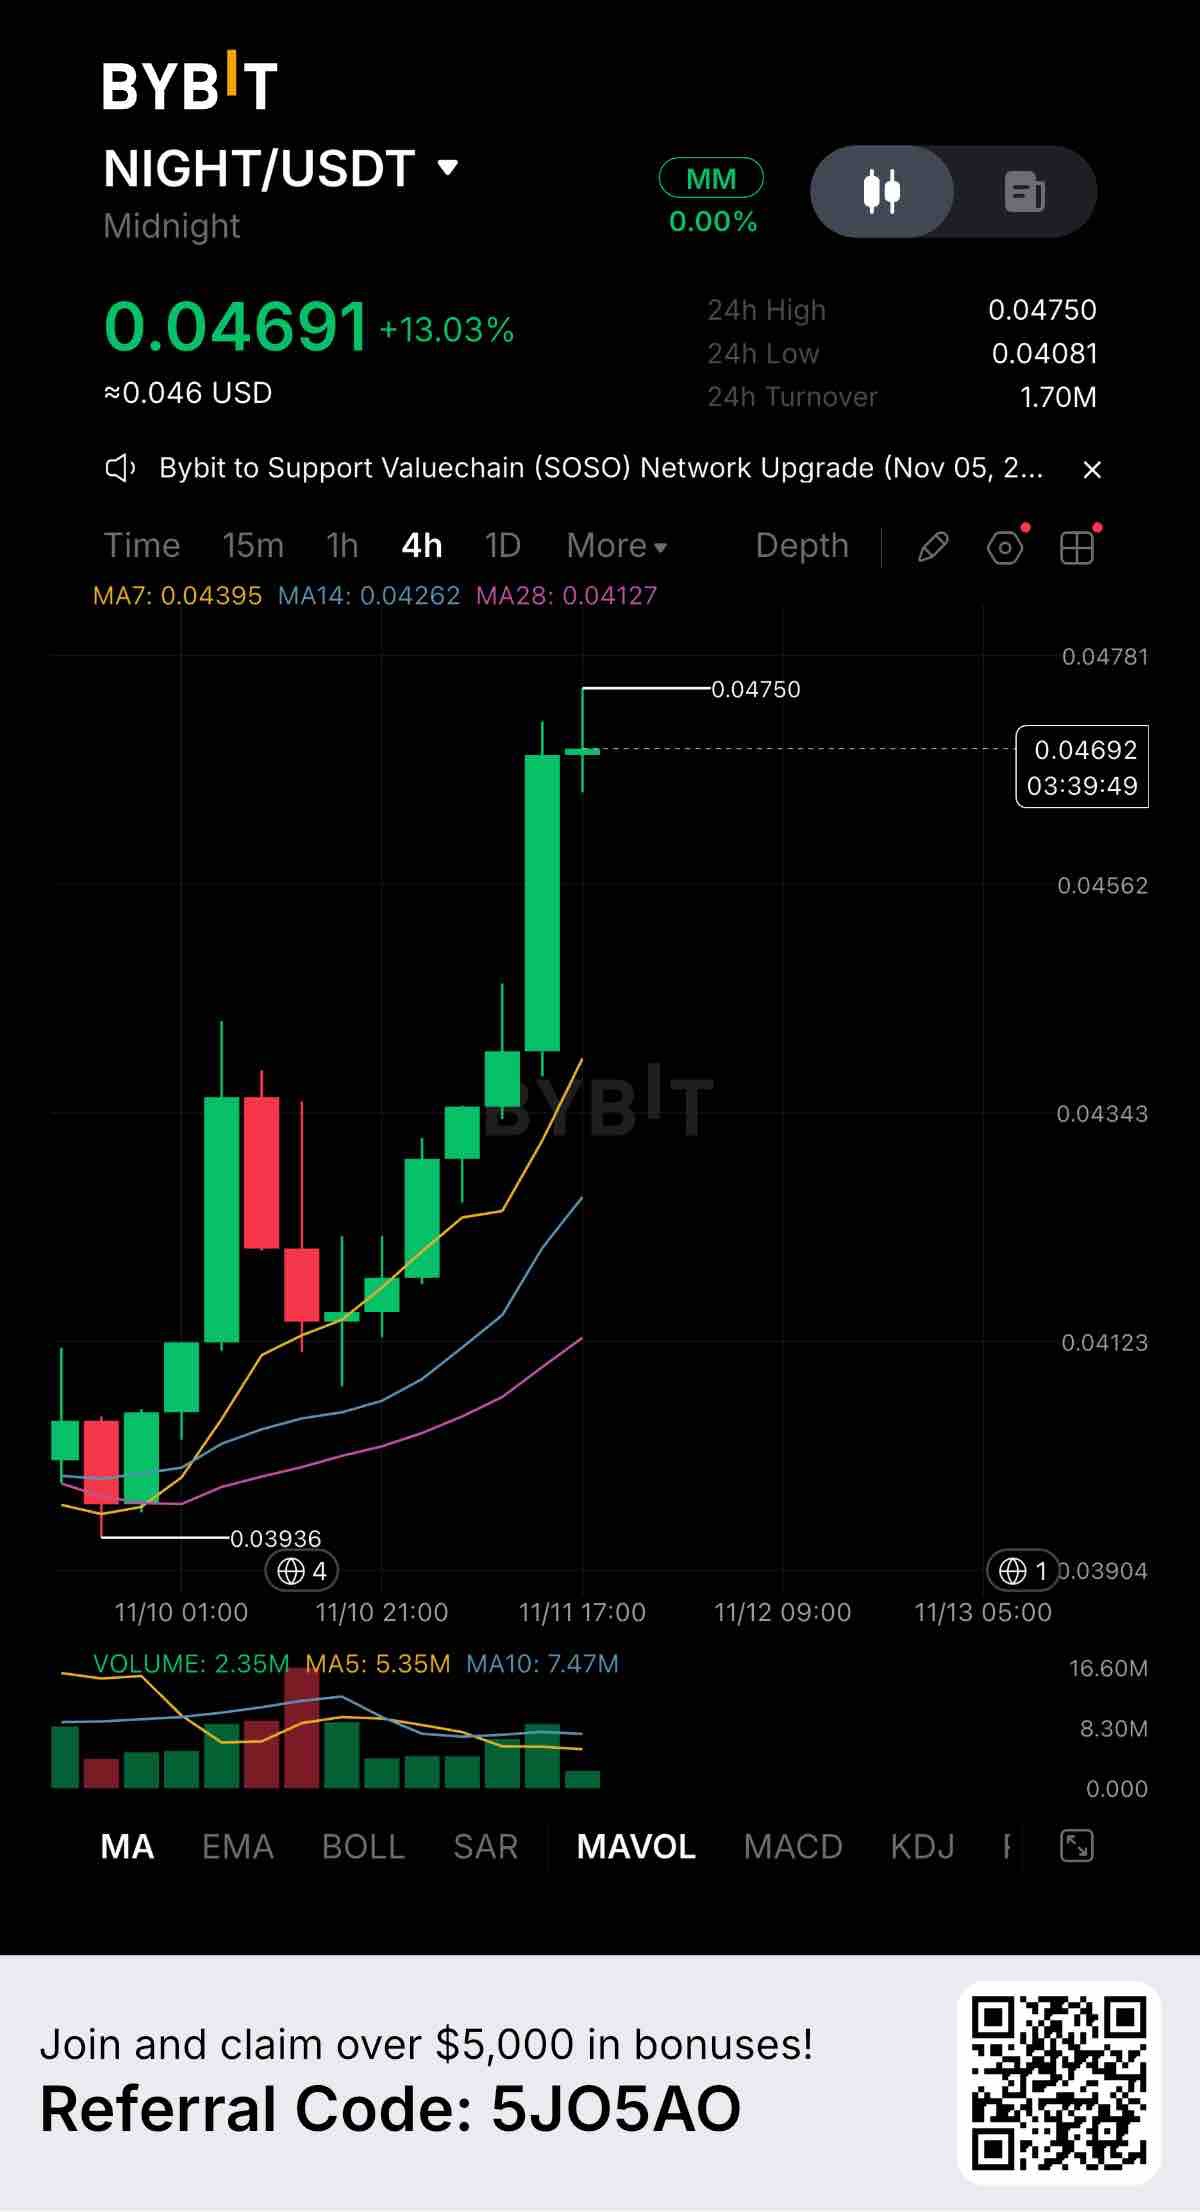
$NIGHTUSDT is showing strong bullish momentum today, currently trading at 0.04691 with a solid +13.03% gain over the last 24 hours. The 4-hour chart reveals a textbook upward trend, and buyers are clearly in control. Key Levels to Watch: Resistance: 0.04750 (The current 24-hour high, acting as the immediate ceiling) Support 1: 0.04395 (7-day MA, the first line of defense on a pullback) Support 2: 0.04081 (24-hour low, the stronger structural floor) The moving averages are perfectly stacked. Price is trading well above MA7, MA14, and MA28, which confirms the short-term trend remains incredibly strong. However, price is getting slightly extended from the 7-day MA, so a brief cool-off period wouldn't be surprising. Volume is healthy, with 1.70M USDT in 24-hour turnover. The chart shows consistent buying pressure supporting this move upward. Fundamentally, Midnight (NIGHT) is capturing solid market attention. Momentum like this usually points to growing ecosystem interest or traders rotating into fresh narratives. If buyers manage to break and hold above 0.04750, we could see price discovery continue. However, if sellers reject this level, waiting for a retest toward 0.04395 is a much safer strategy than chasing the top. Are you trading NIGHT right now? Let me know your strategy in the comments. #ByXIMPACT #WSOT2026
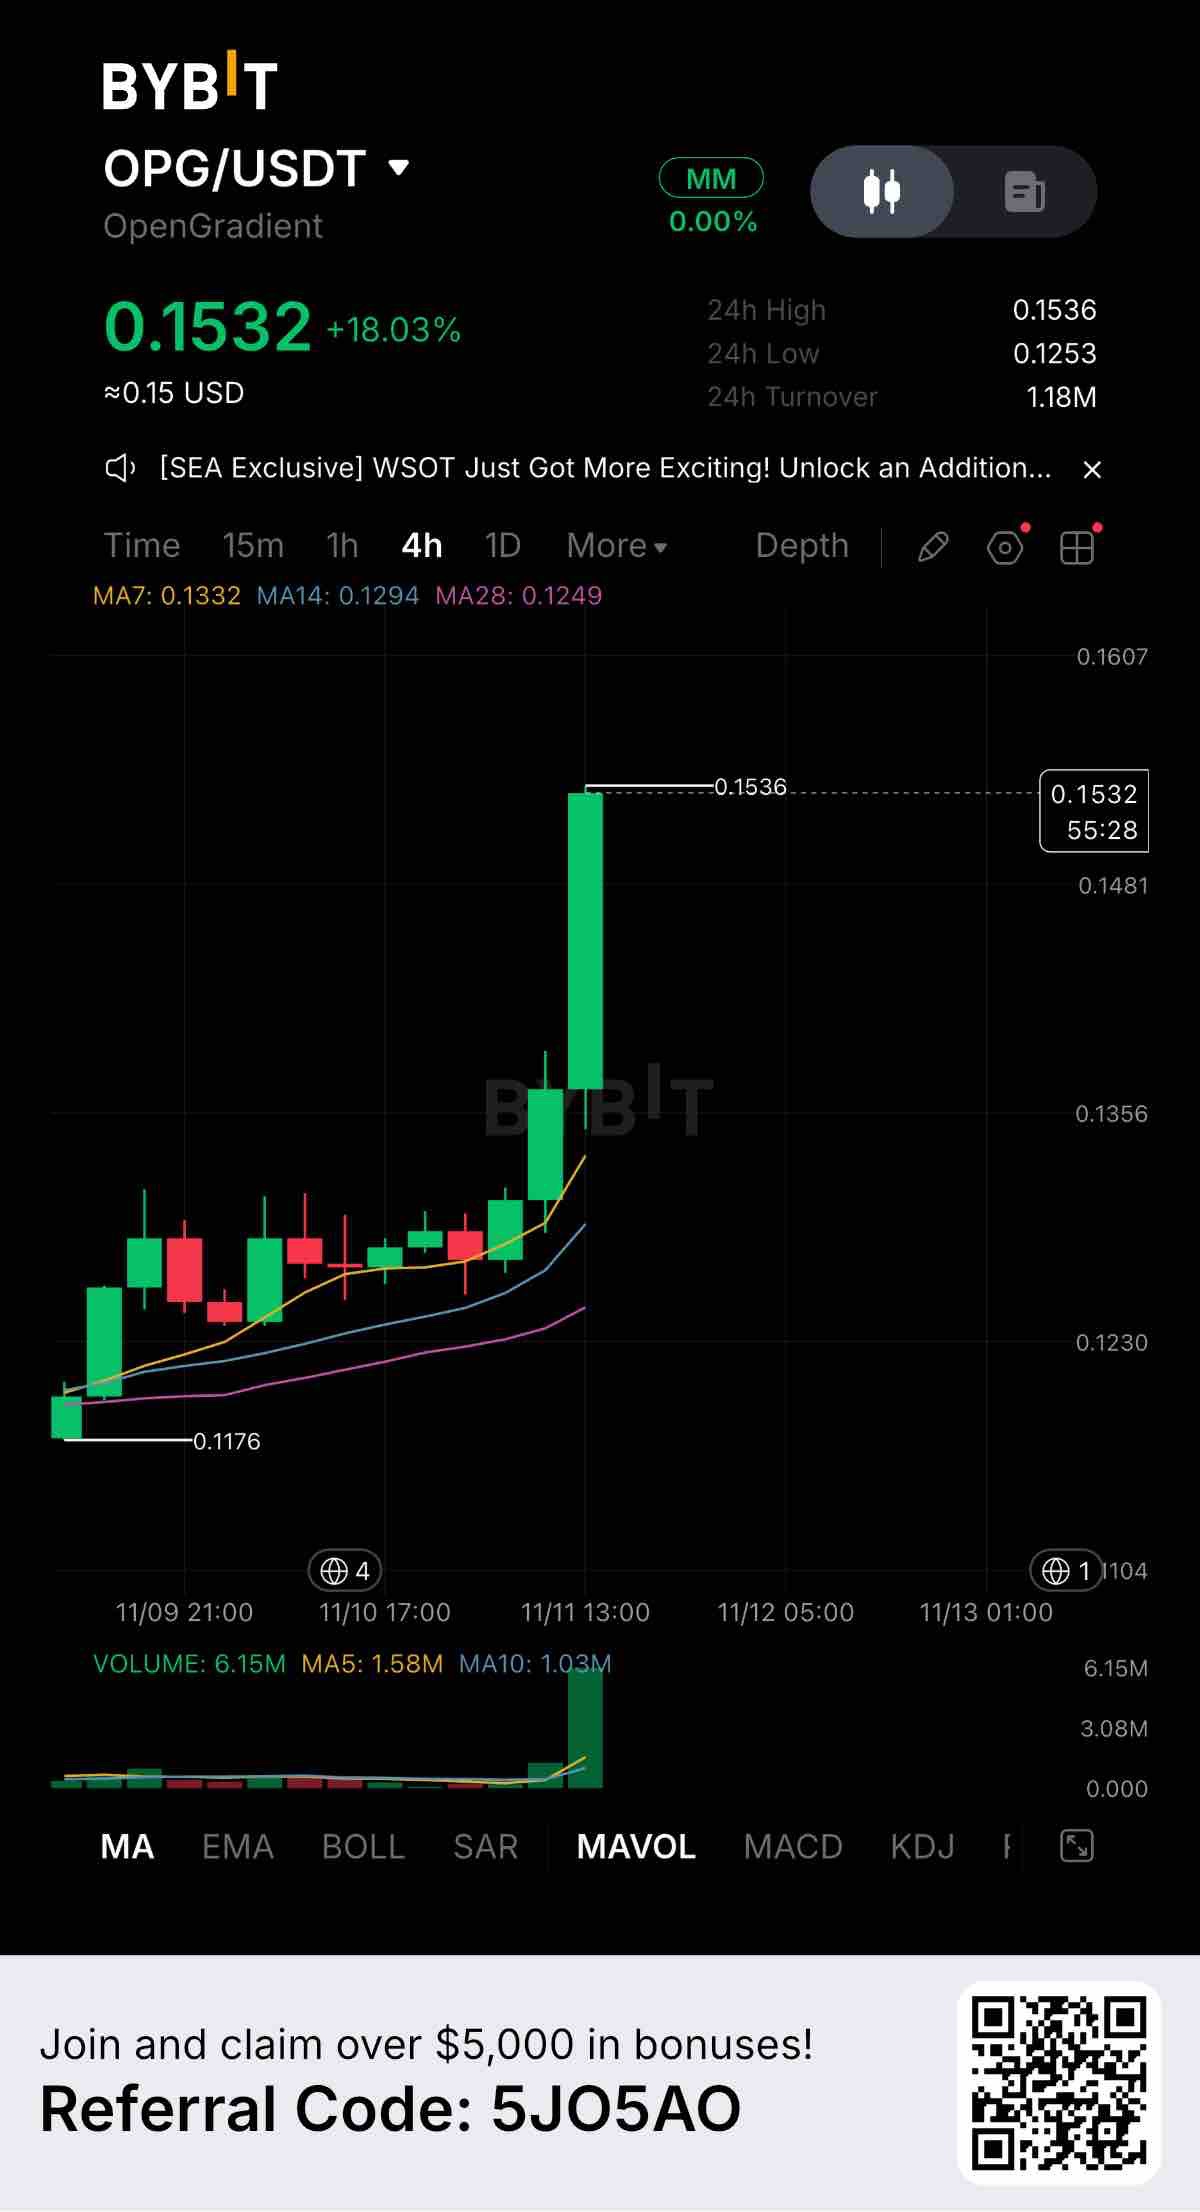
$OPGUSDT is making a massive statement today, currently trading at 0.1532 with an explosive +18.03% gain over the past 24 hours. The 4-hour chart is showing a textbook vertical breakout, and the volume confirms real money is entering the market. Key Levels to Watch: Resistance: 0.1536 (The current 24-hour high, being tested right now) Support 1: 0.1332 (7-day MA, first downside cushion) Support 2: 0.1253 (24-hour low, stronger structural floor) Looking at the moving averages, price is trading far above MA7, MA14, and MA28. This tells us momentum is incredibly fierce, but also means the asset is highly extended. Chasing a green candle this big carries risk. Volume is the real story here. The massive spike on the 4-hour chart shows strong buying pressure, backed by 1.18M USDT in 24-hour turnover. Fundamentally, OpenGradient (OPG) is capturing heavy market attention right now. Moves like this are usually driven by ecosystem developments or community momentum, and the volume proves capital is rotating in. If buyers manage to break and hold above 0.1536, we could see immediate price discovery. However, if sellers reject this level, waiting for a retest toward 0.1332 is the safer play. Are you riding this momentum or waiting for a pullback? Drop your thoughts below. #ByXIMPACT #WSOT2026
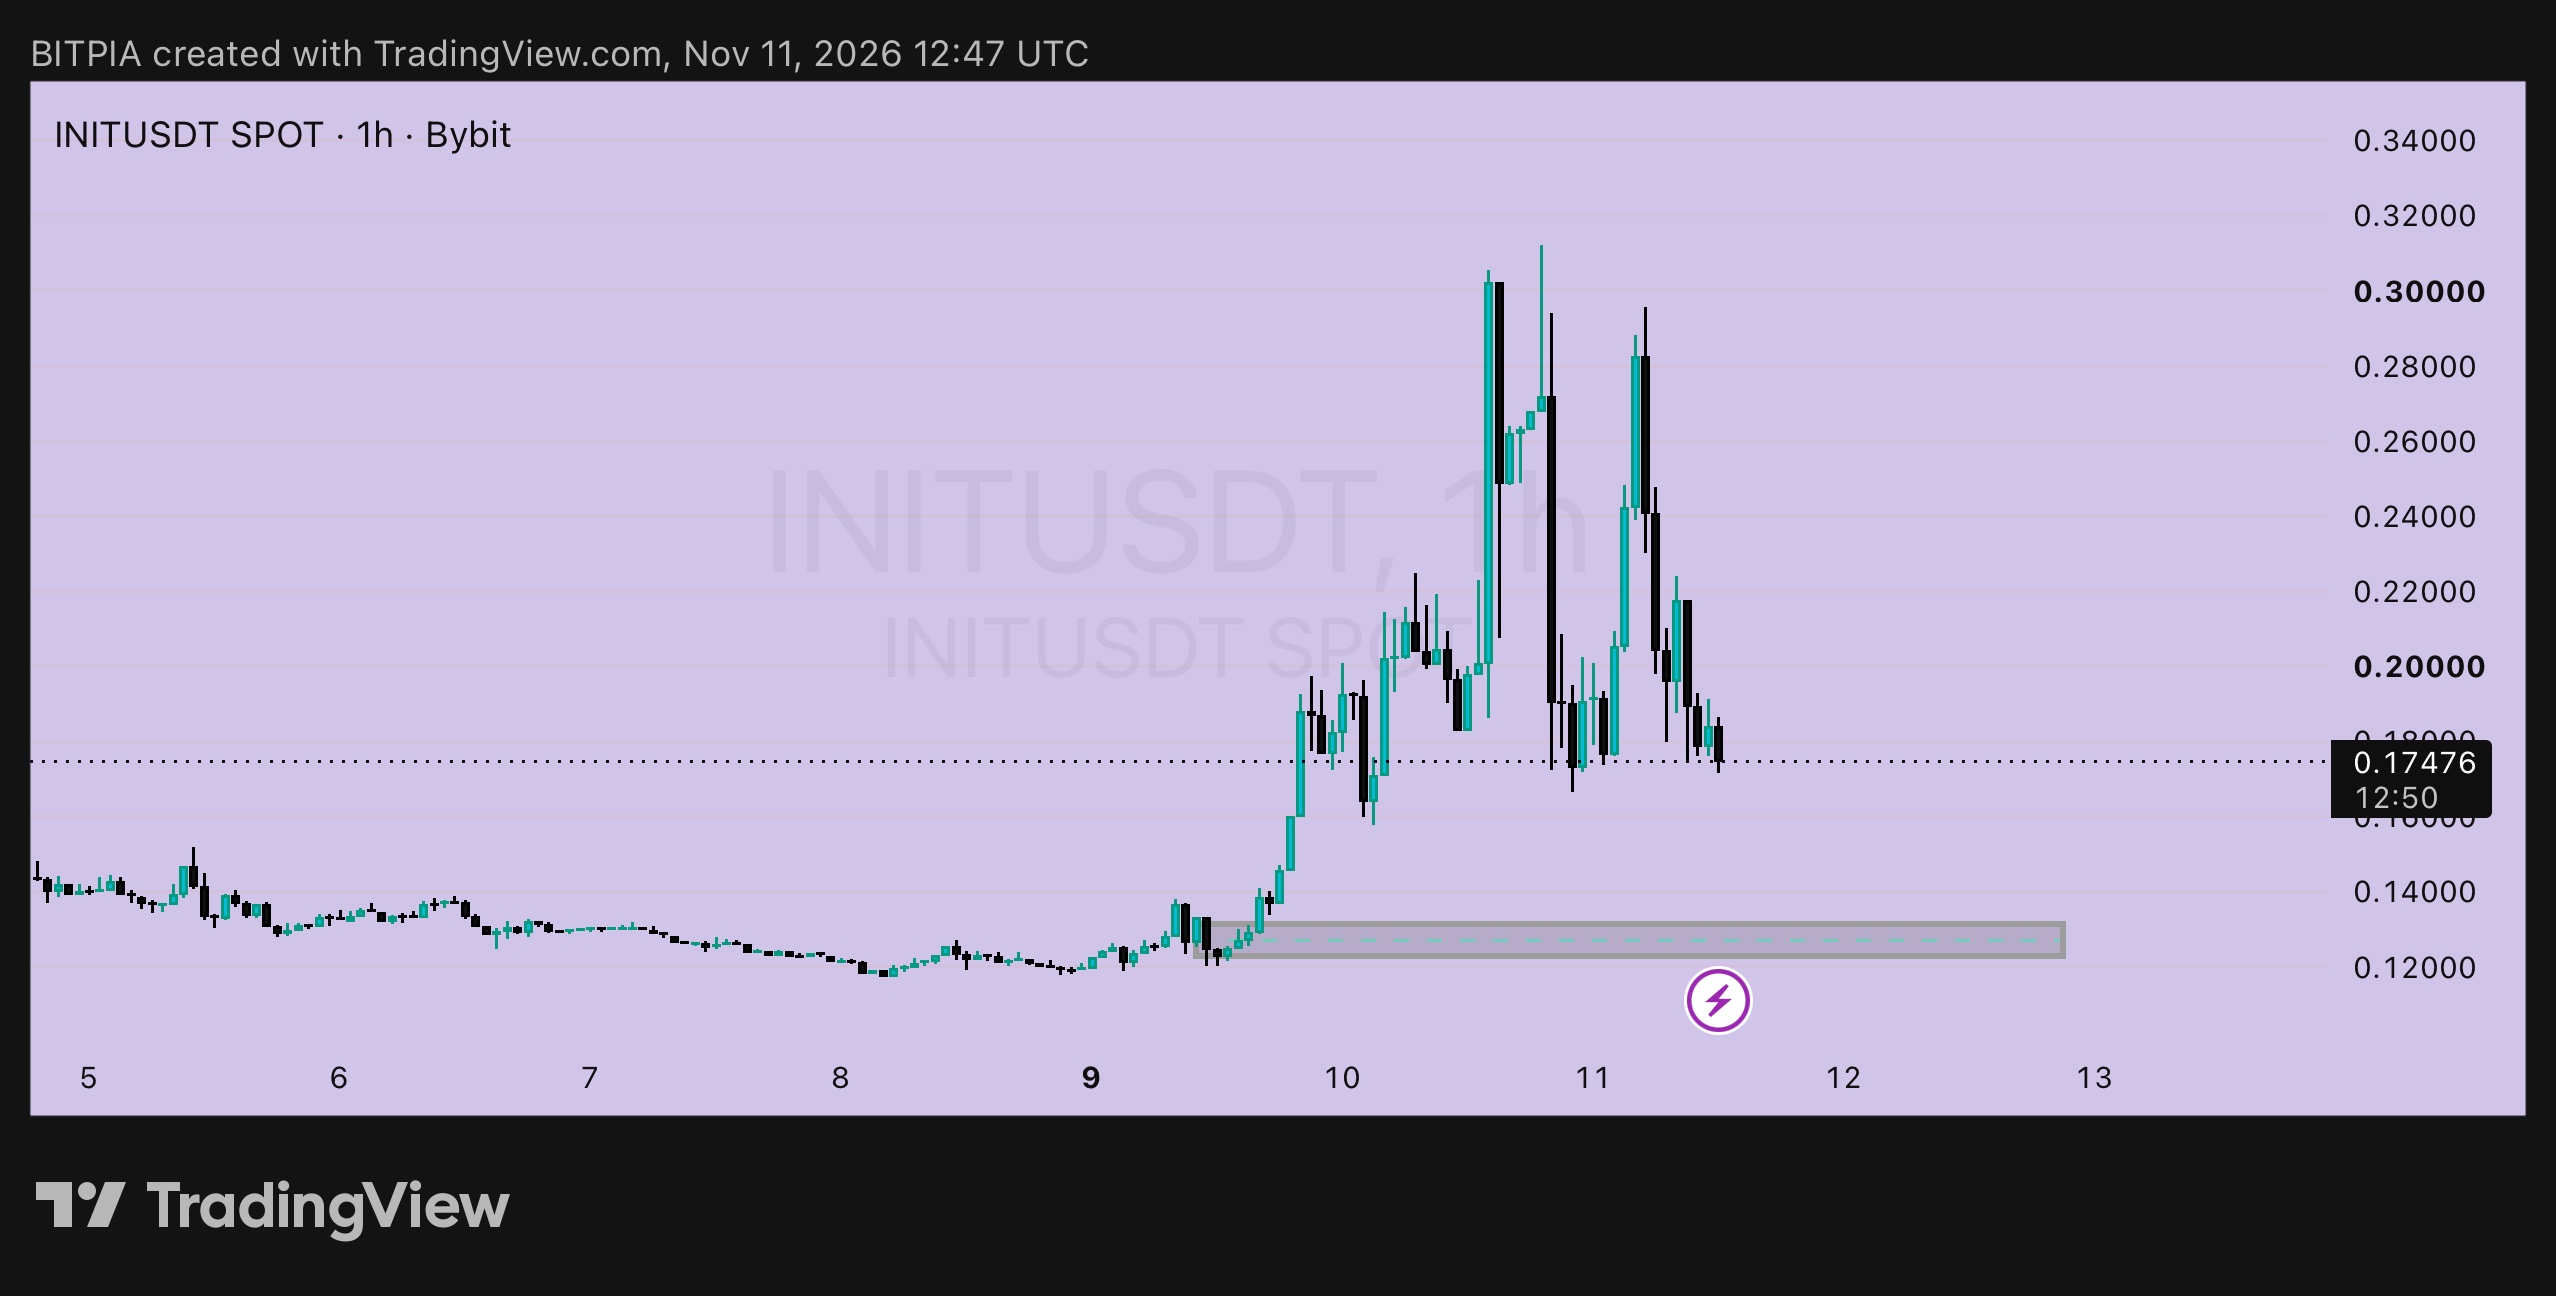
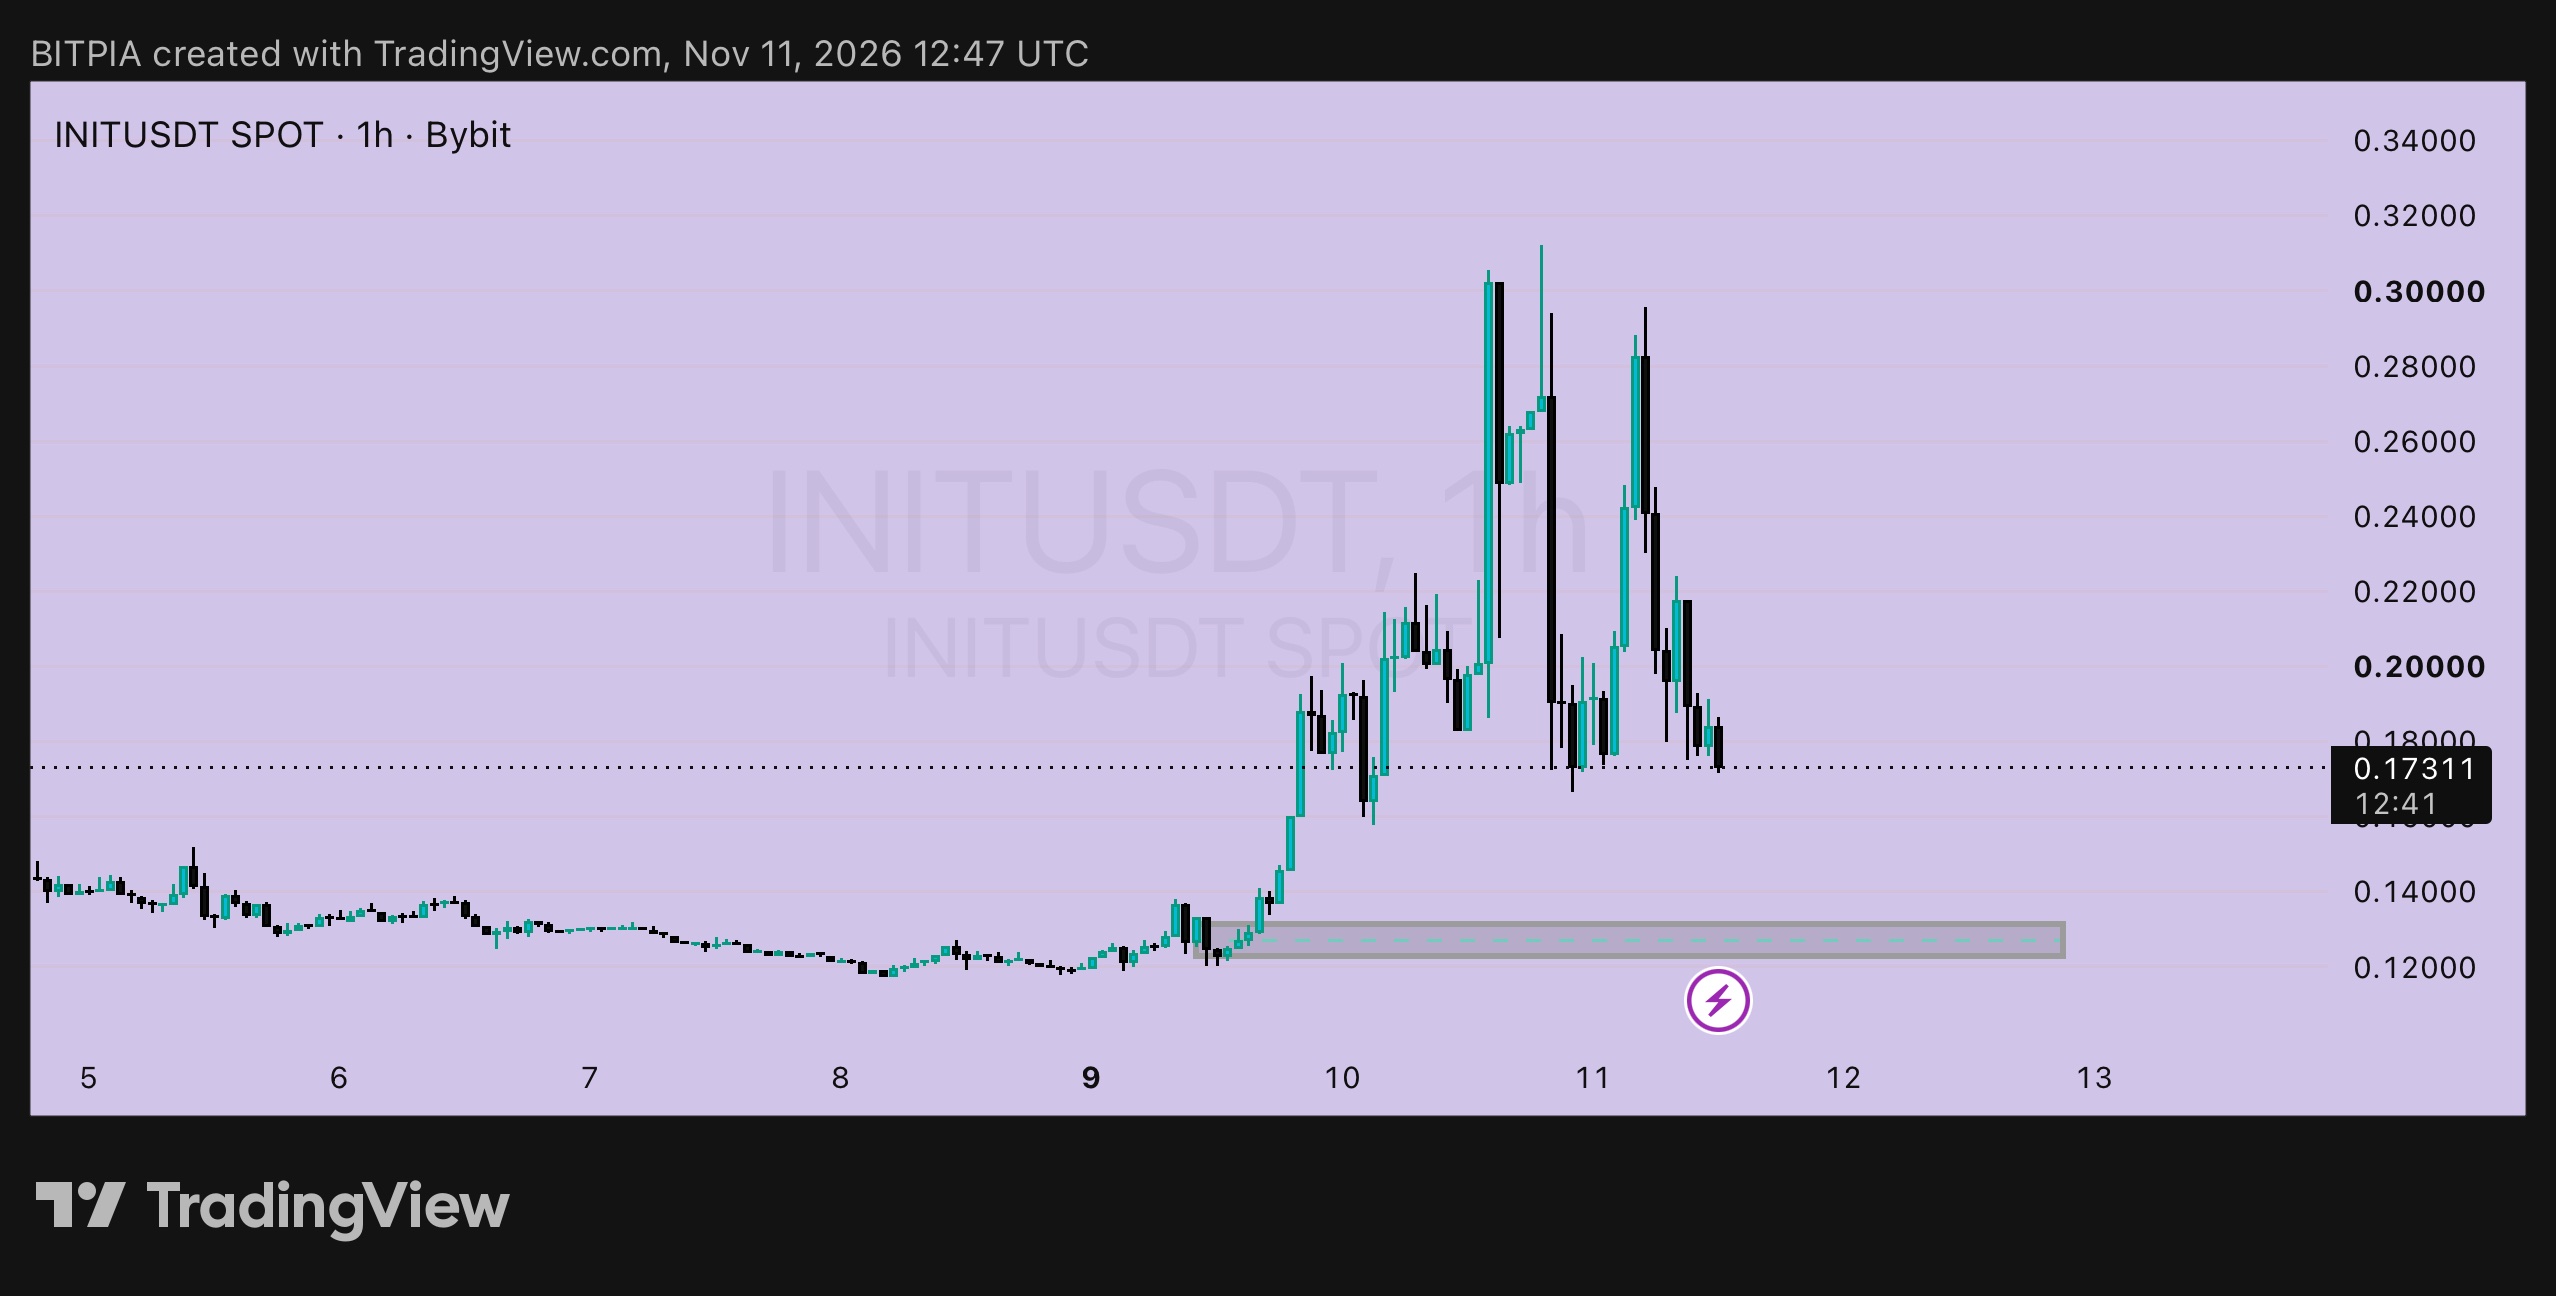
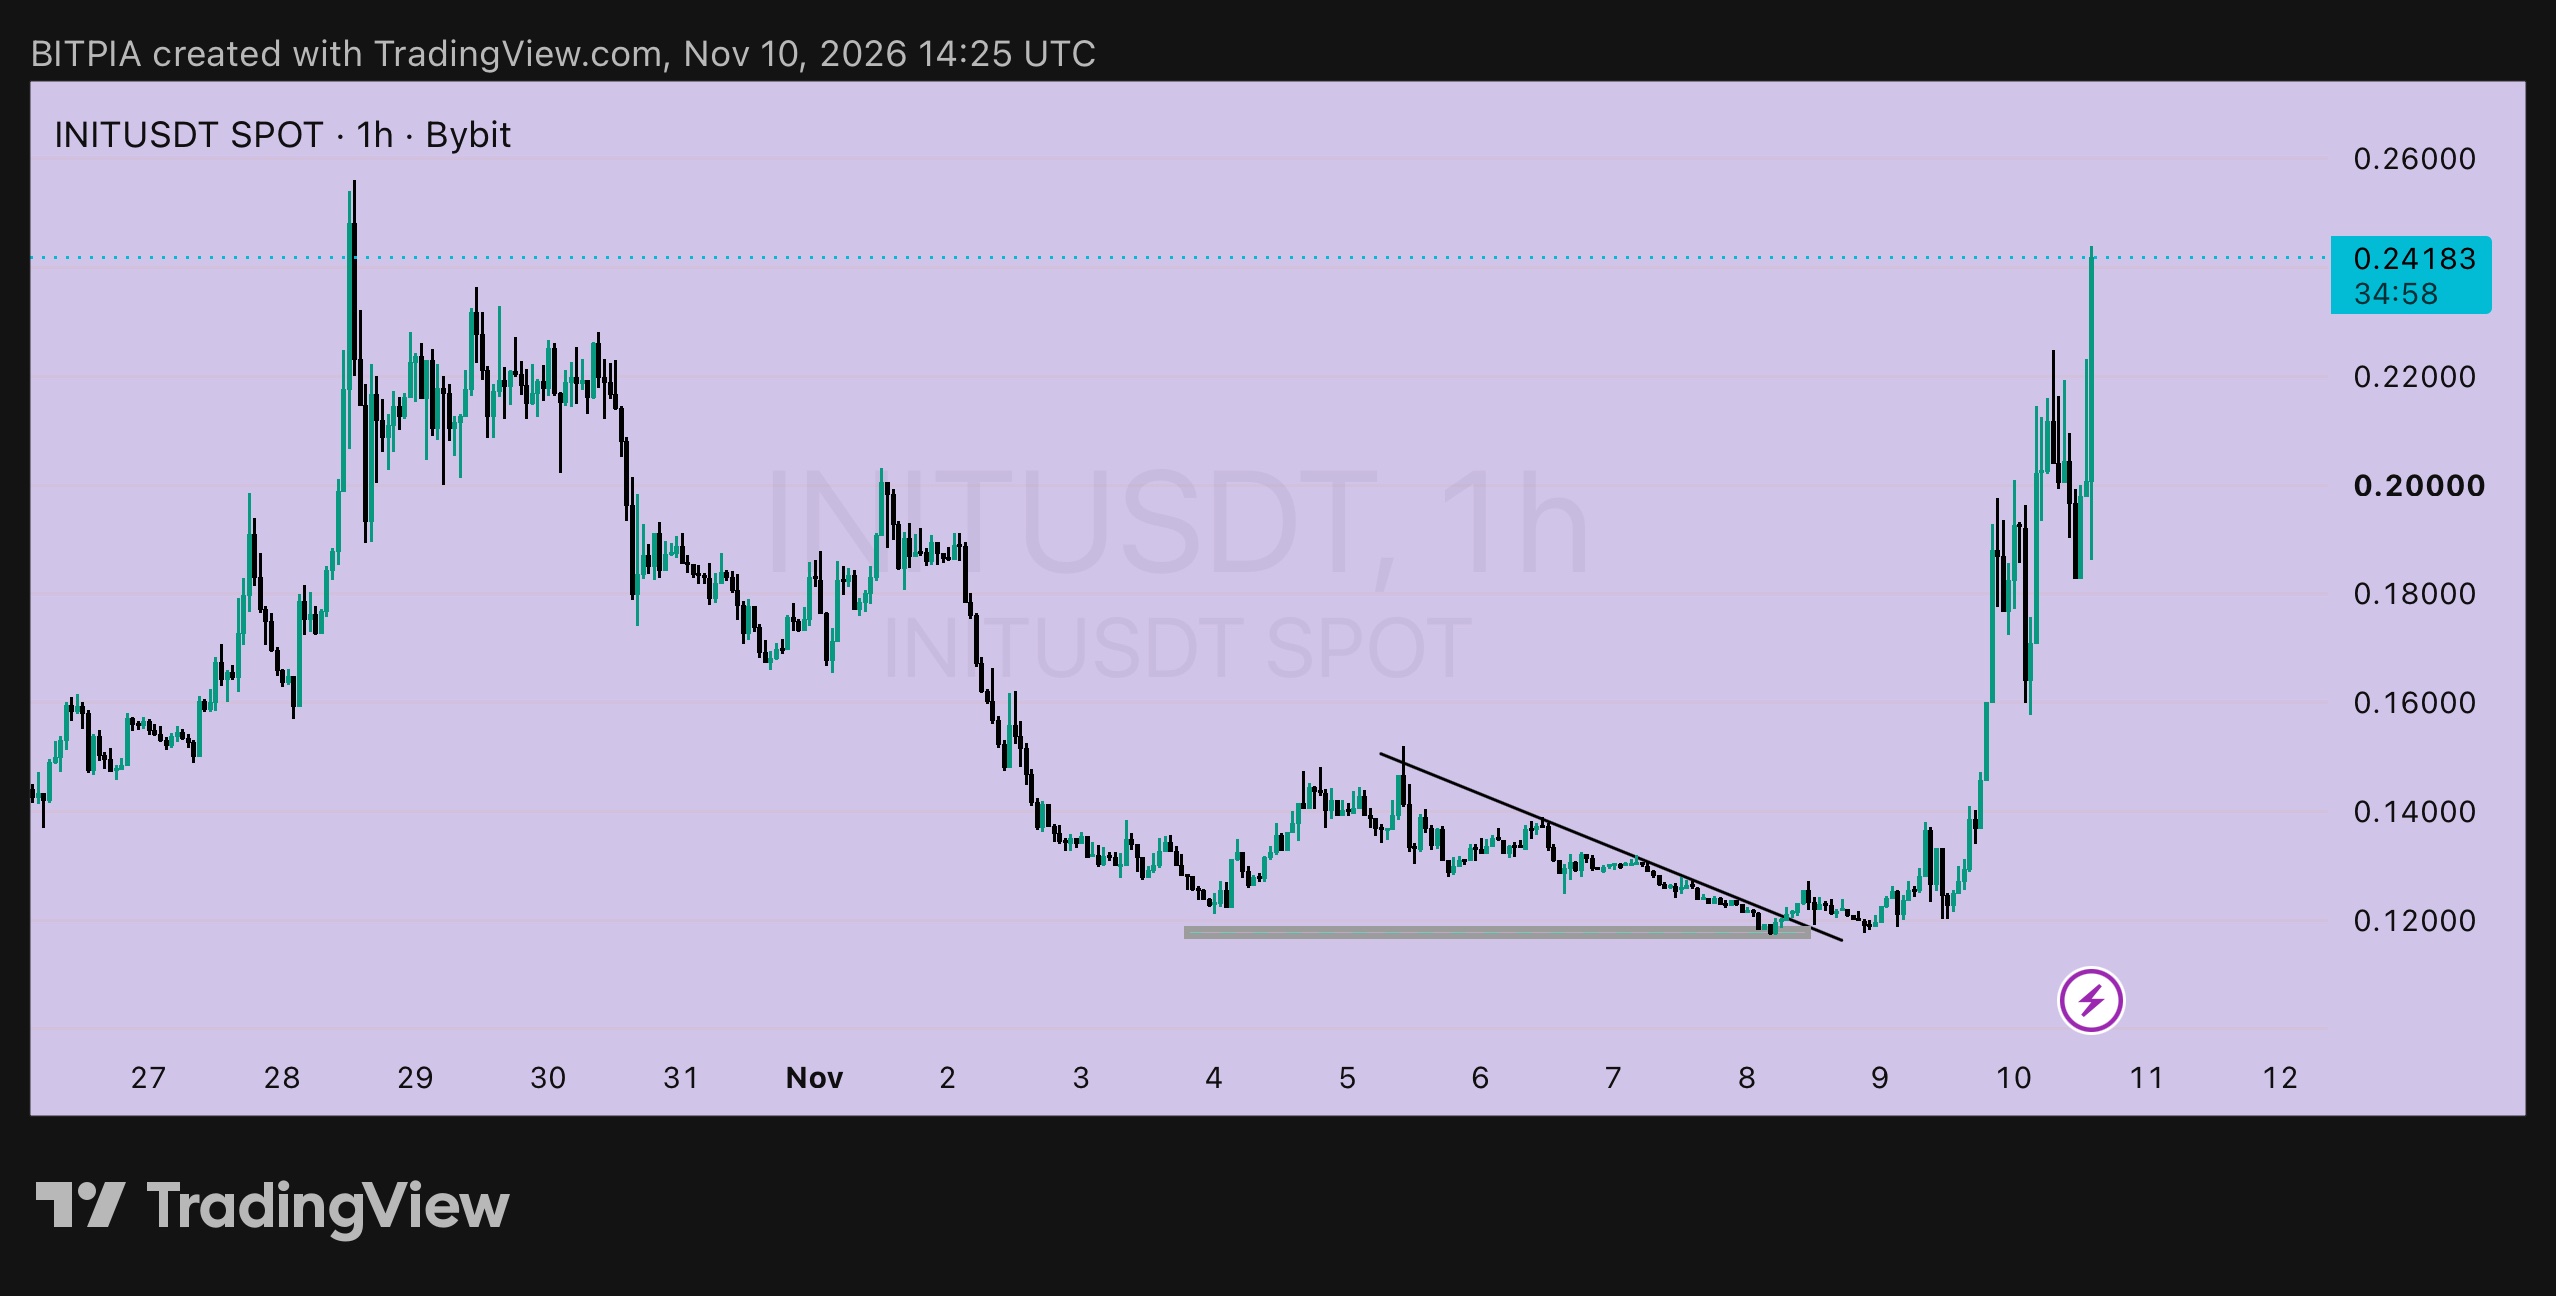
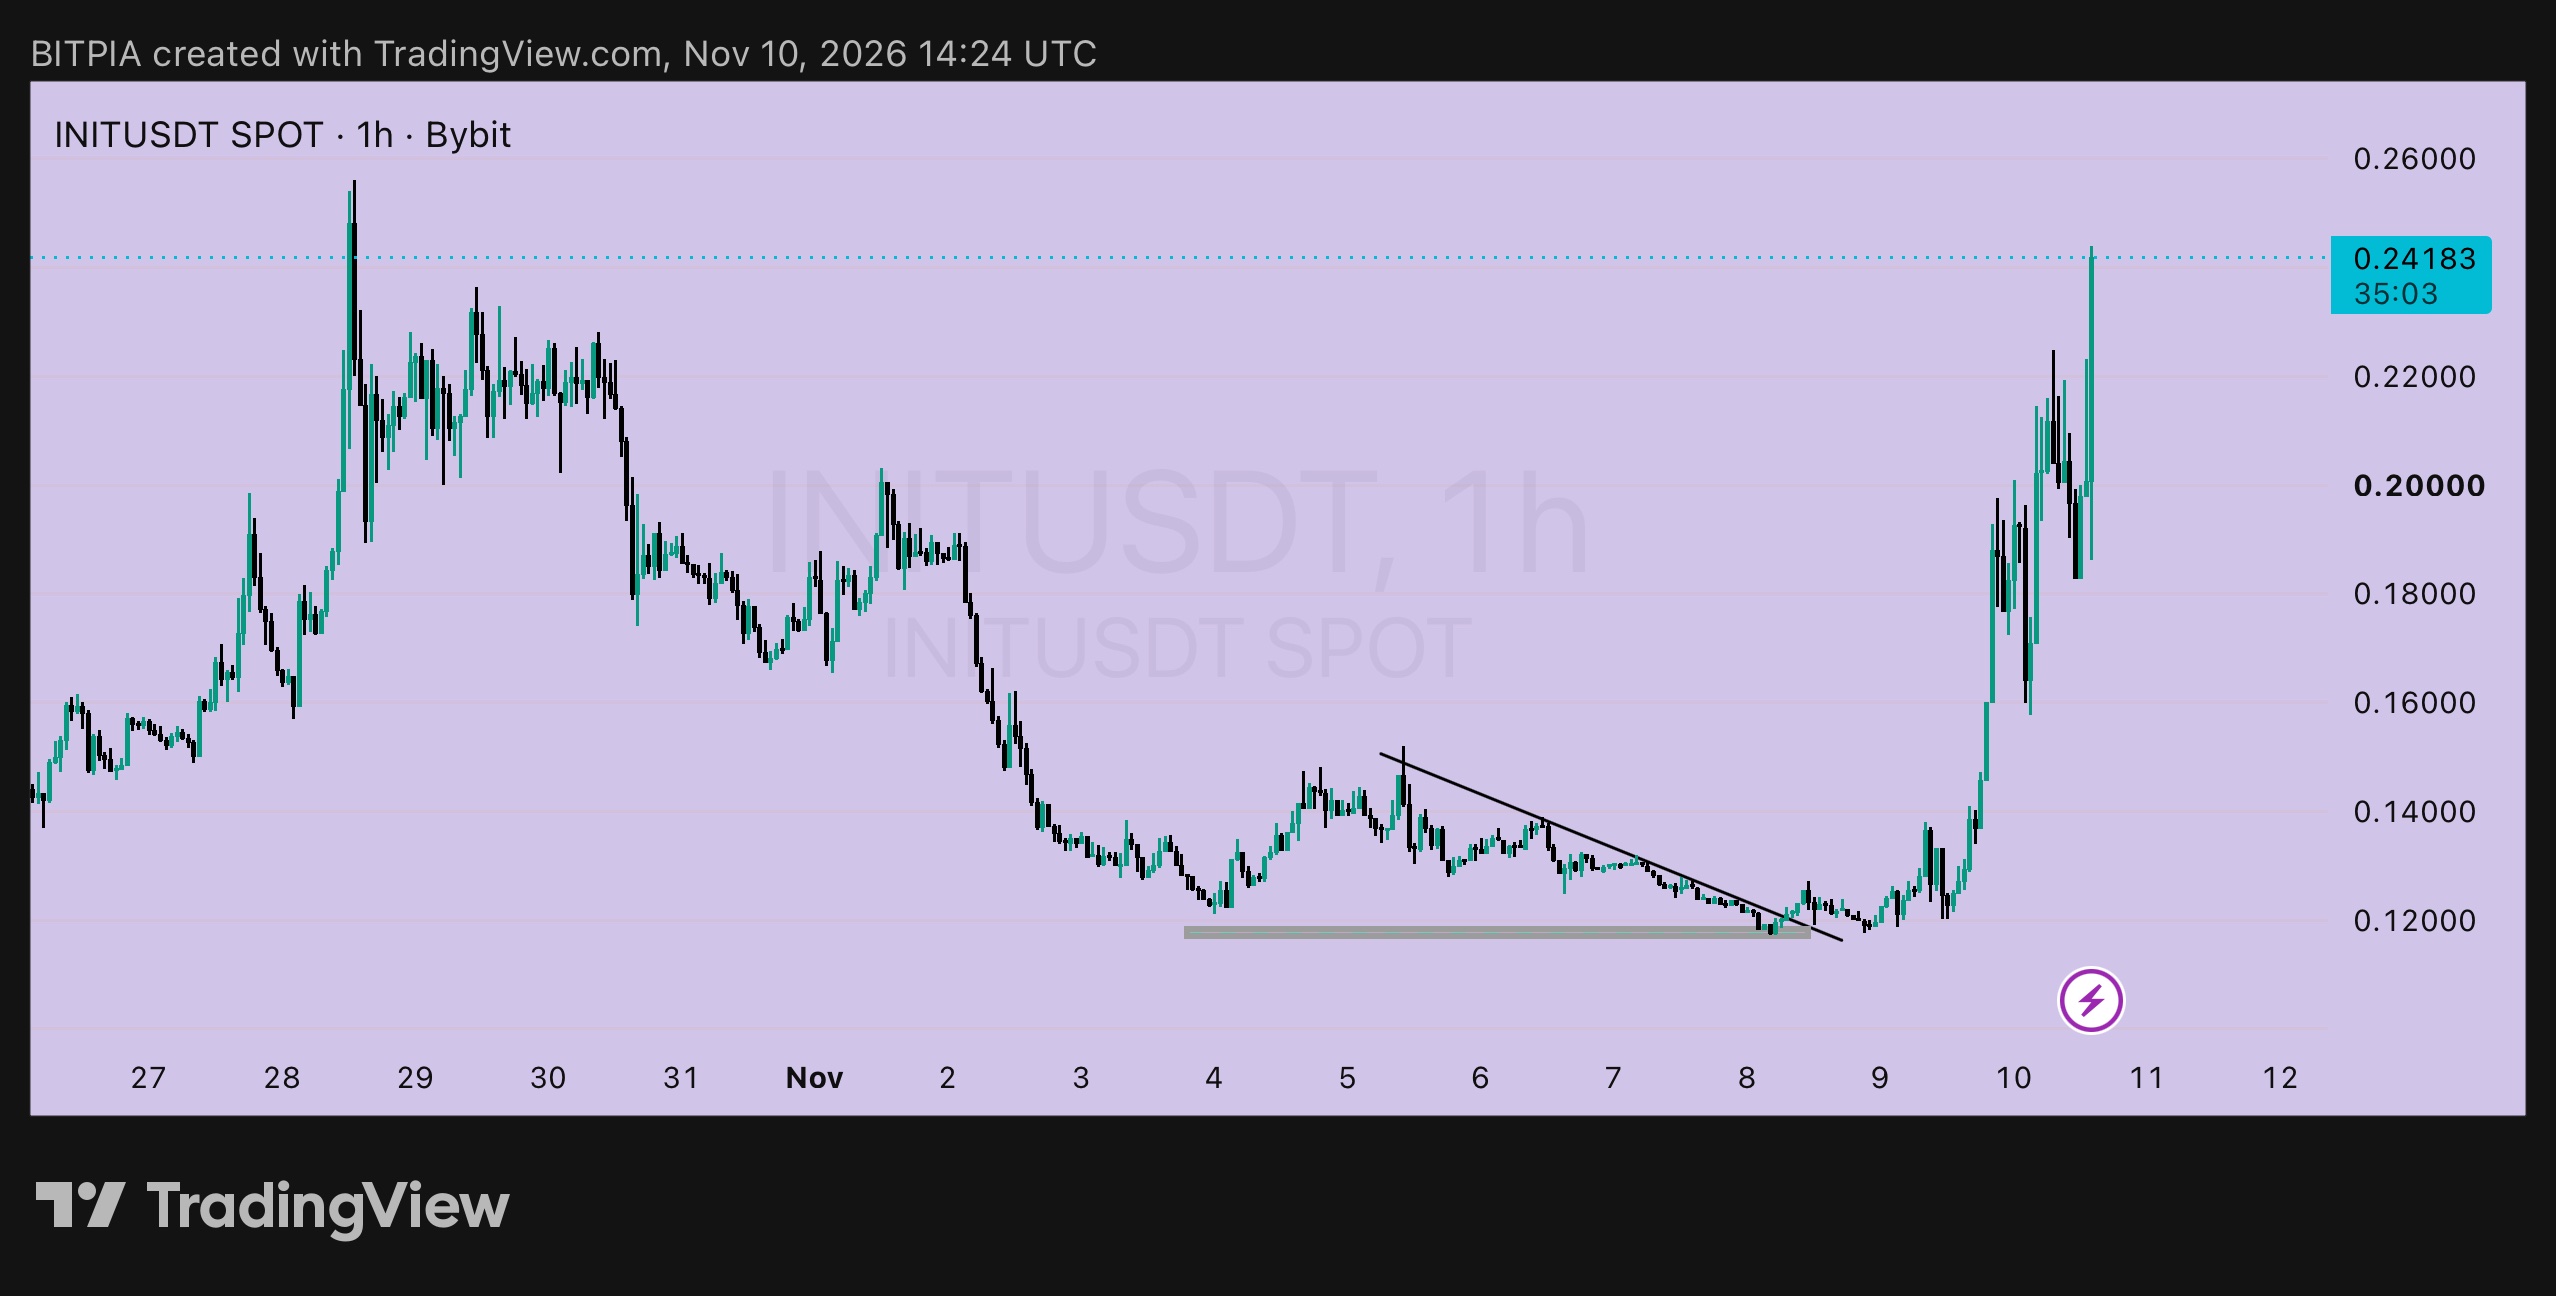
INIT 1h: closing the books 🧾 My last $INITUSDT post was at 0.24183 on Nov 10, with a plan to sell half near 0.2400 to 0.2500 and trail the stop on the rest to about 0.1800. Price went to about 0.312, fell back, made a second peak near 0.295, and is now 0.17311, under the trailing stop. Here's the receipt. ➤ The trade ▸ Entry (Door 2): 0.1200, risk 0.0050 ▸ First half: sold near 0.2400 to 0.2500, roughly 24R to 26R on that half ▸ Second half: stopped near 0.1800, roughly 12R on that half ▸ Blended result: around 18R on the whole position. A great outcome, even with a trailing stop catching the dip ➤ The honest part Price went well past my first sell zone, up to about 0.312, so selling near 0.2400 left some on the table. That's the price of taking profit before the top. I don't know the top in advance, and neither does anyone else. A 12R to 26R trade is not one I regret. ➤ What the chart says now ▸ The two tall peaks near 0.30 are behind us, and each one was sold into ▸ Price is at 0.1731, with a recent low near 0.160 ▸ The launch zone near 0.125 to 0.132 sits far below, and price may or may not return to it ➤ If you want back in Pullback plan: ▸ Entry: around 0.1650, only if the 0.160 area holds ▸ Stop-loss: below 0.1500 ▸ Risk per unit: 0.0150 ▸ Targets: 0.2000 (+0.0350, about 2.3R) and 0.2400 (+0.0750, about 5R) Reclaim plan: ▸ Trigger: a 1h close above 0.2000 ▸ Entry: around 0.2050 ▸ Stop-loss: below 0.1800 ▸ Risk per unit: 0.0250 ▸ Targets: 0.2400 (about 1.4R) and 0.2950 (+0.0900, about 3.6R) ➤ What cancels the pullback idea A 1h close under 0.1500 means the 0.160 area has failed, and I'd wait for the 0.125 to 0.132 zone before even thinking about it. Moves like this one are wild in both directions, so small size, and low leverage if you use perps. Not financial advice. Do your own research and only risk what you can afford to lose. #ByXIMPACT #WSOT2026
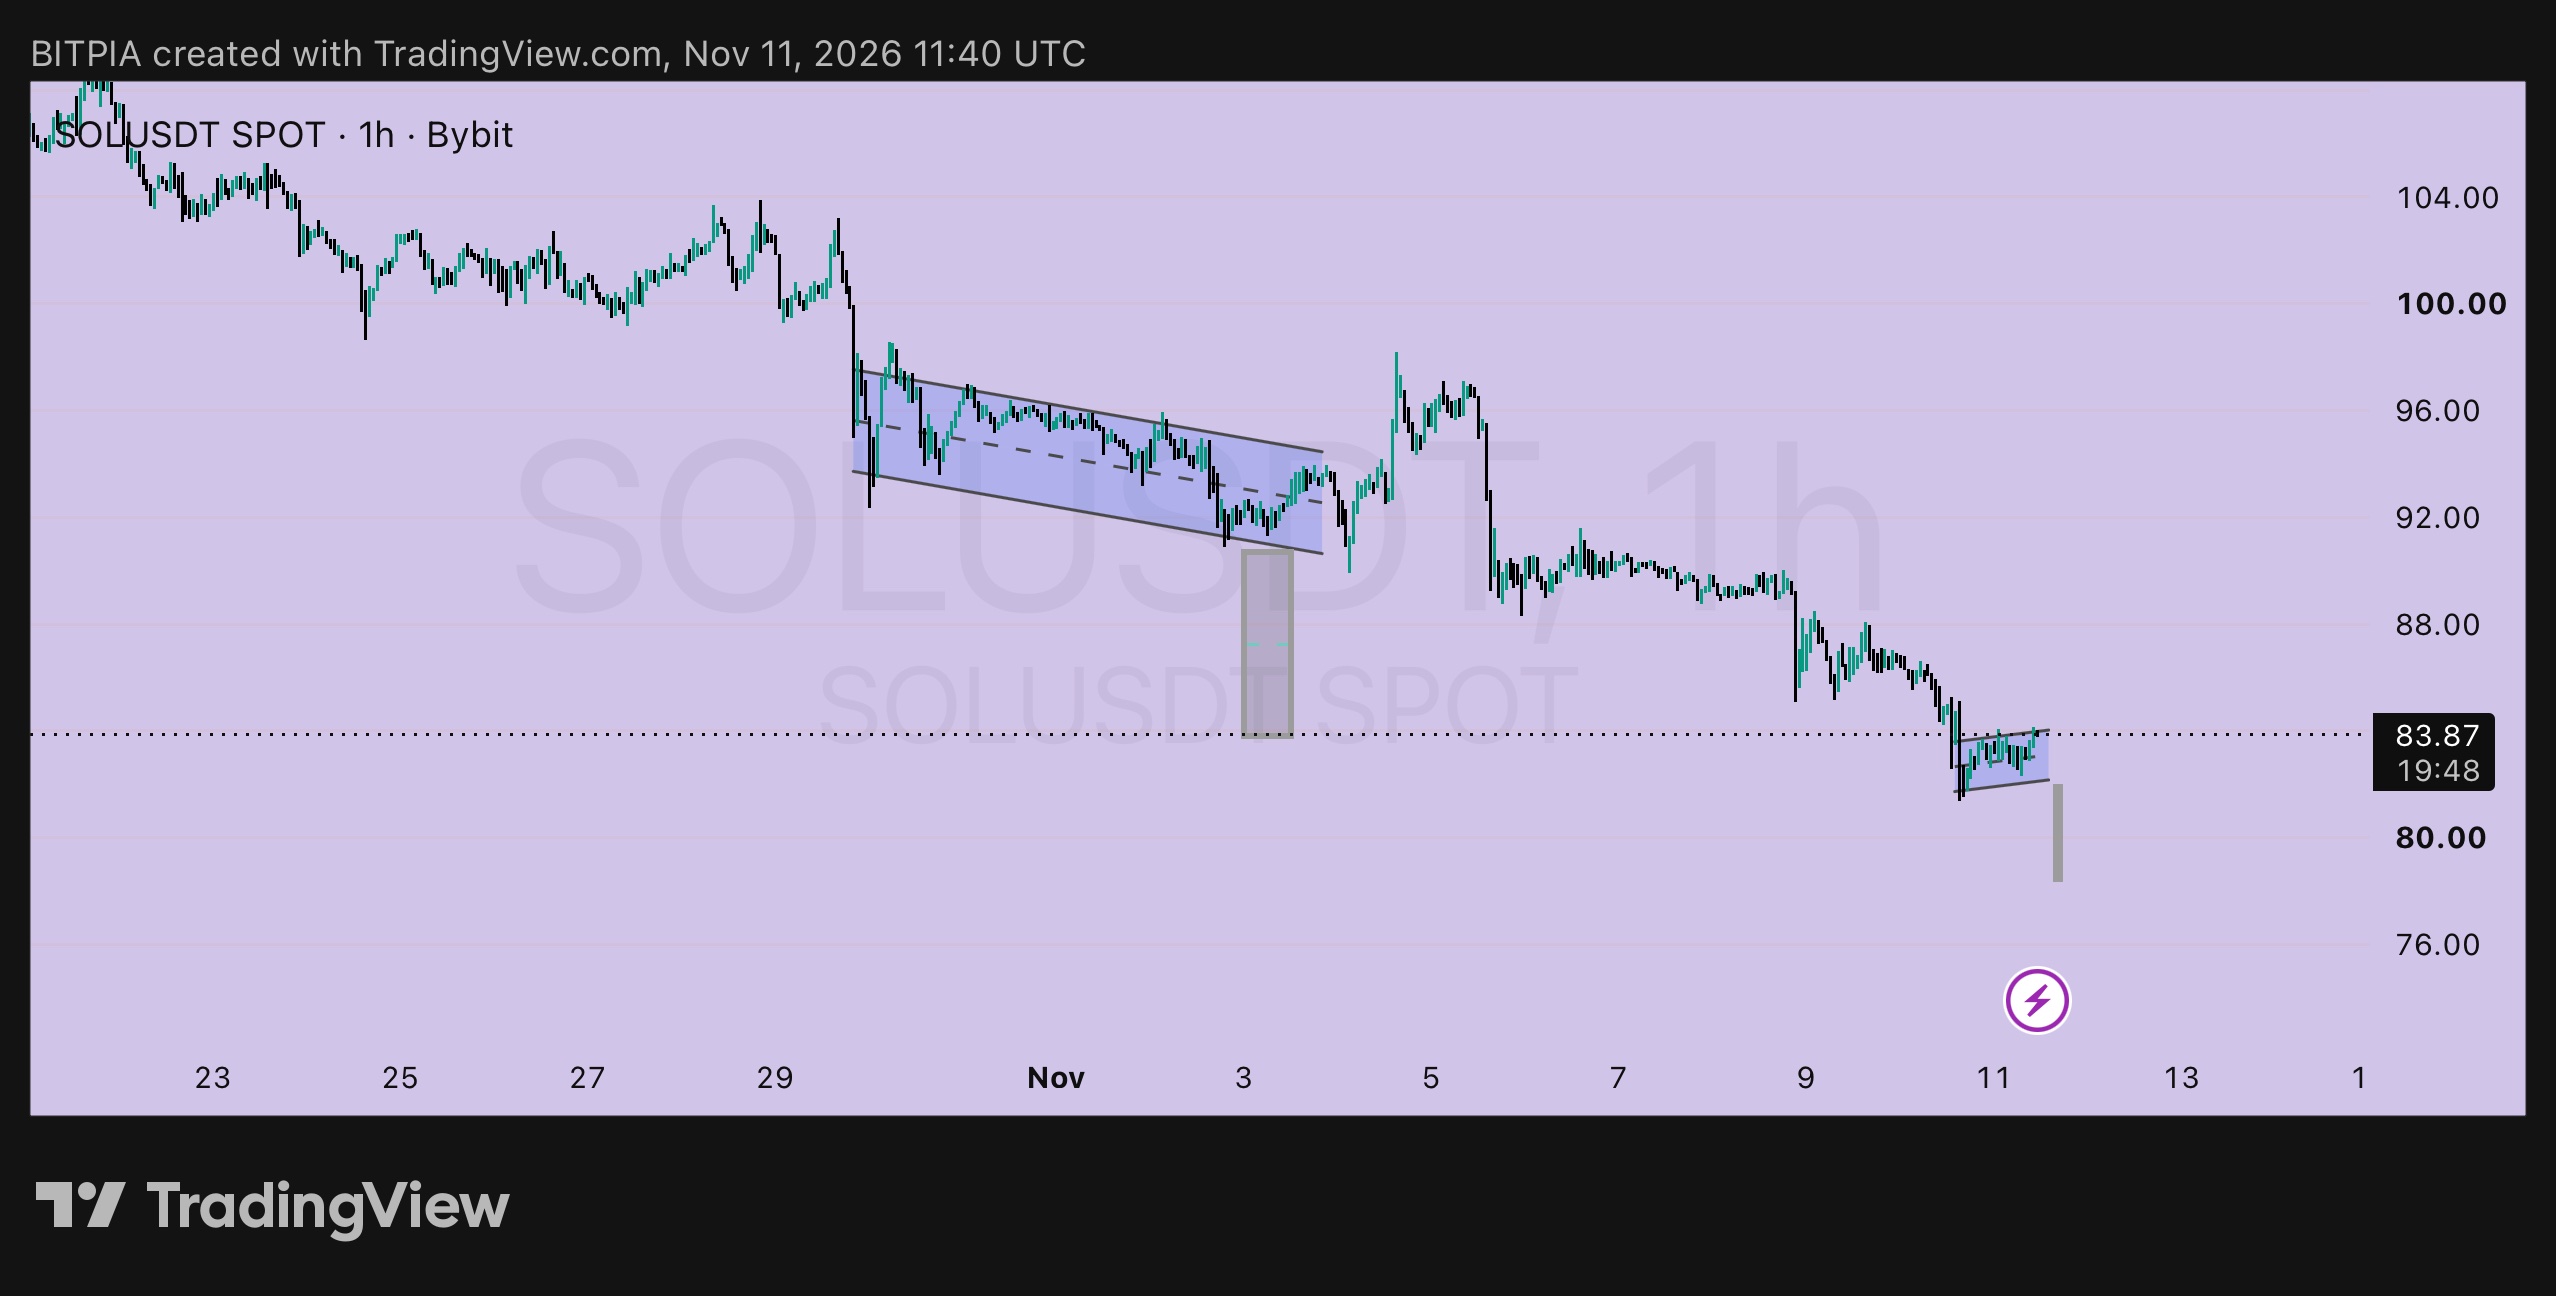
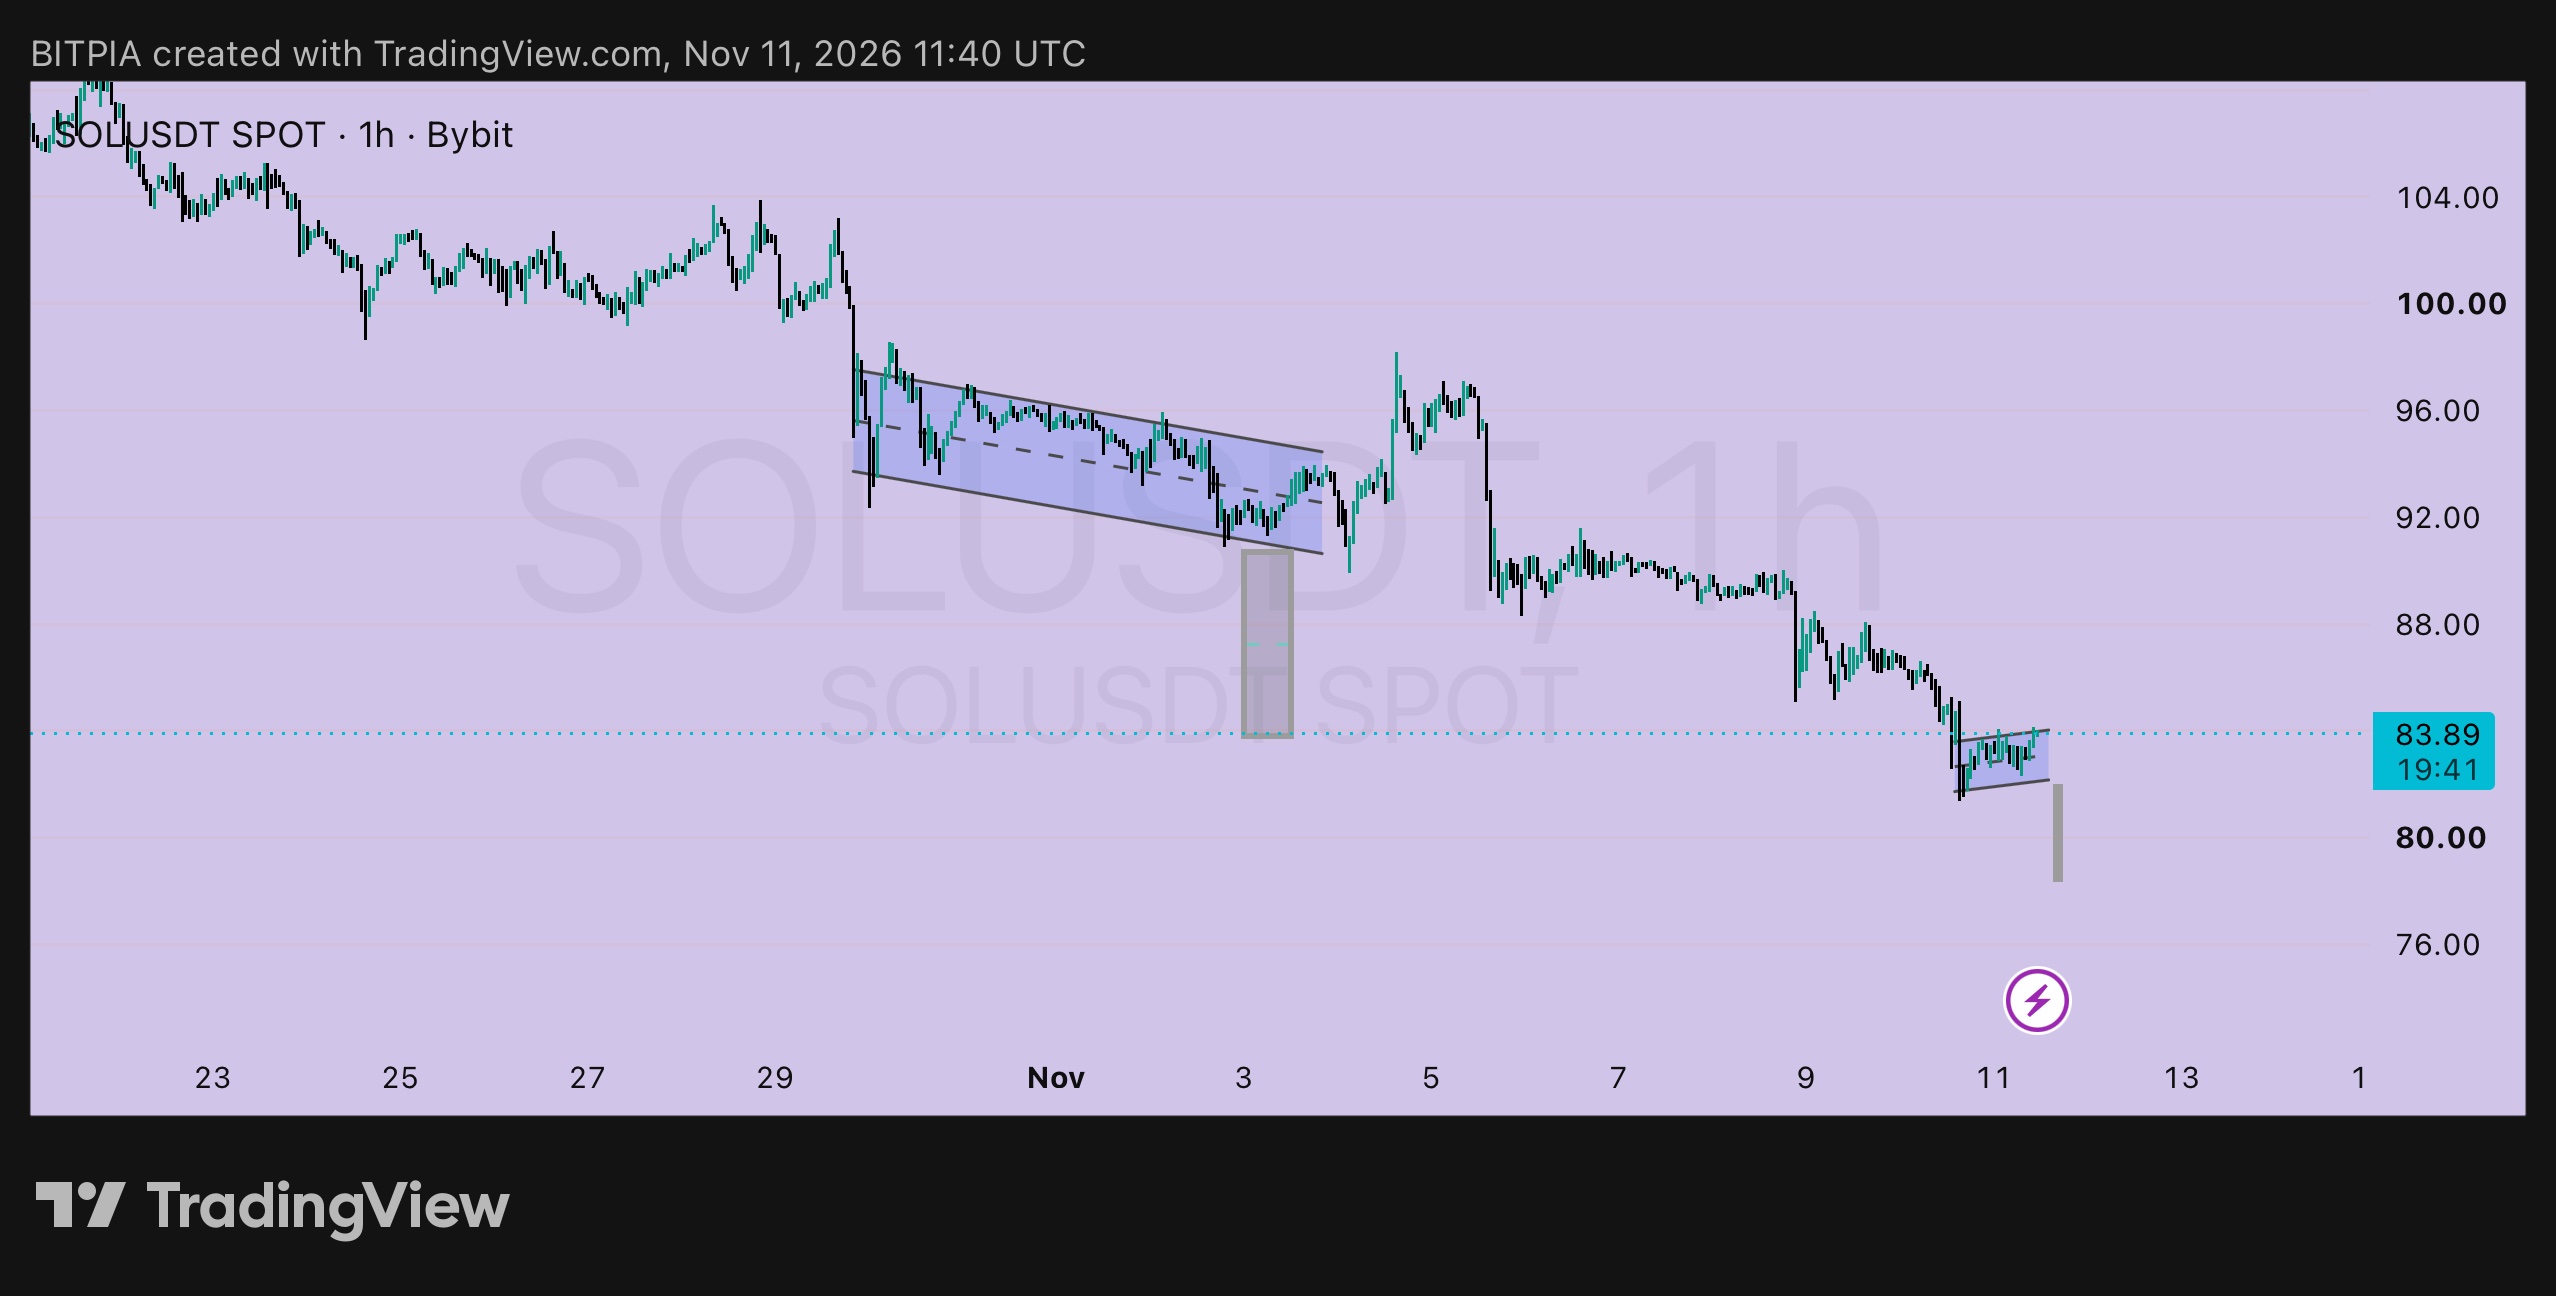
$SOLUSDT 1h: mirror review of my last plan 🪞 On Nov 6 I posted SOL at 89.77 with two sides. Here's what each one did. ➤ Side 1: short on a retest of 91.5 ▸ Plan: entry 91.5, stop above 94.0, targets 86 and 84 ▸ Result: price retested the area, then rolled over, and now trades at 83.89 ▸ Both targets were reached, about 3R from the entry for anyone who took it on a perp ➤ Side 2: long near 85 ▸ Plan: entry 85, stop below 82.5 ▸ Result: price went through 85 and made a low near 81.5, so the stop was hit ▸ Loss: about 1R. The 84 to 86 zone I expected didn't hold One side paid and the other cost me a small, planned loss. That's the reason I post both. ➤ What the chart says now ▸ Price is in a small flag on the 1h chart, roughly 82 to 84, after the move down ▸ The measured move from that flag points to about 78 ▸ The older channel and the Nov 3 flag target at 84 are both behind us ➤ Plan from here: short side, perps only ▸ Entry: around 84.0, on a retest of the flag top ▸ Stop-loss: above 85.5 ▸ Risk per unit: 1.5 ▸ Targets: 80 (+4, about 2.7R) and 78 (+6, about 4R) ➤ Plan from here: long side ▸ Trigger: a 1h close above 88 ▸ Entry: around 88.5 ▸ Stop-loss: below 86 ▸ Risk per unit: 2.5 ▸ Targets: 92 (+3.5, about 1.4R) and 96 (+7.5, about 3R) ➤ What cancels the short idea A 1h close above 85.5 means the flag is breaking up, and I'd drop it. For spot traders, the better move is to wait for a base to form, not to catch the move down. Small size, and low leverage on perps. Not financial advice. Do your own research and only risk what you can afford to lose. #ByXIMPACT #WSOT2026
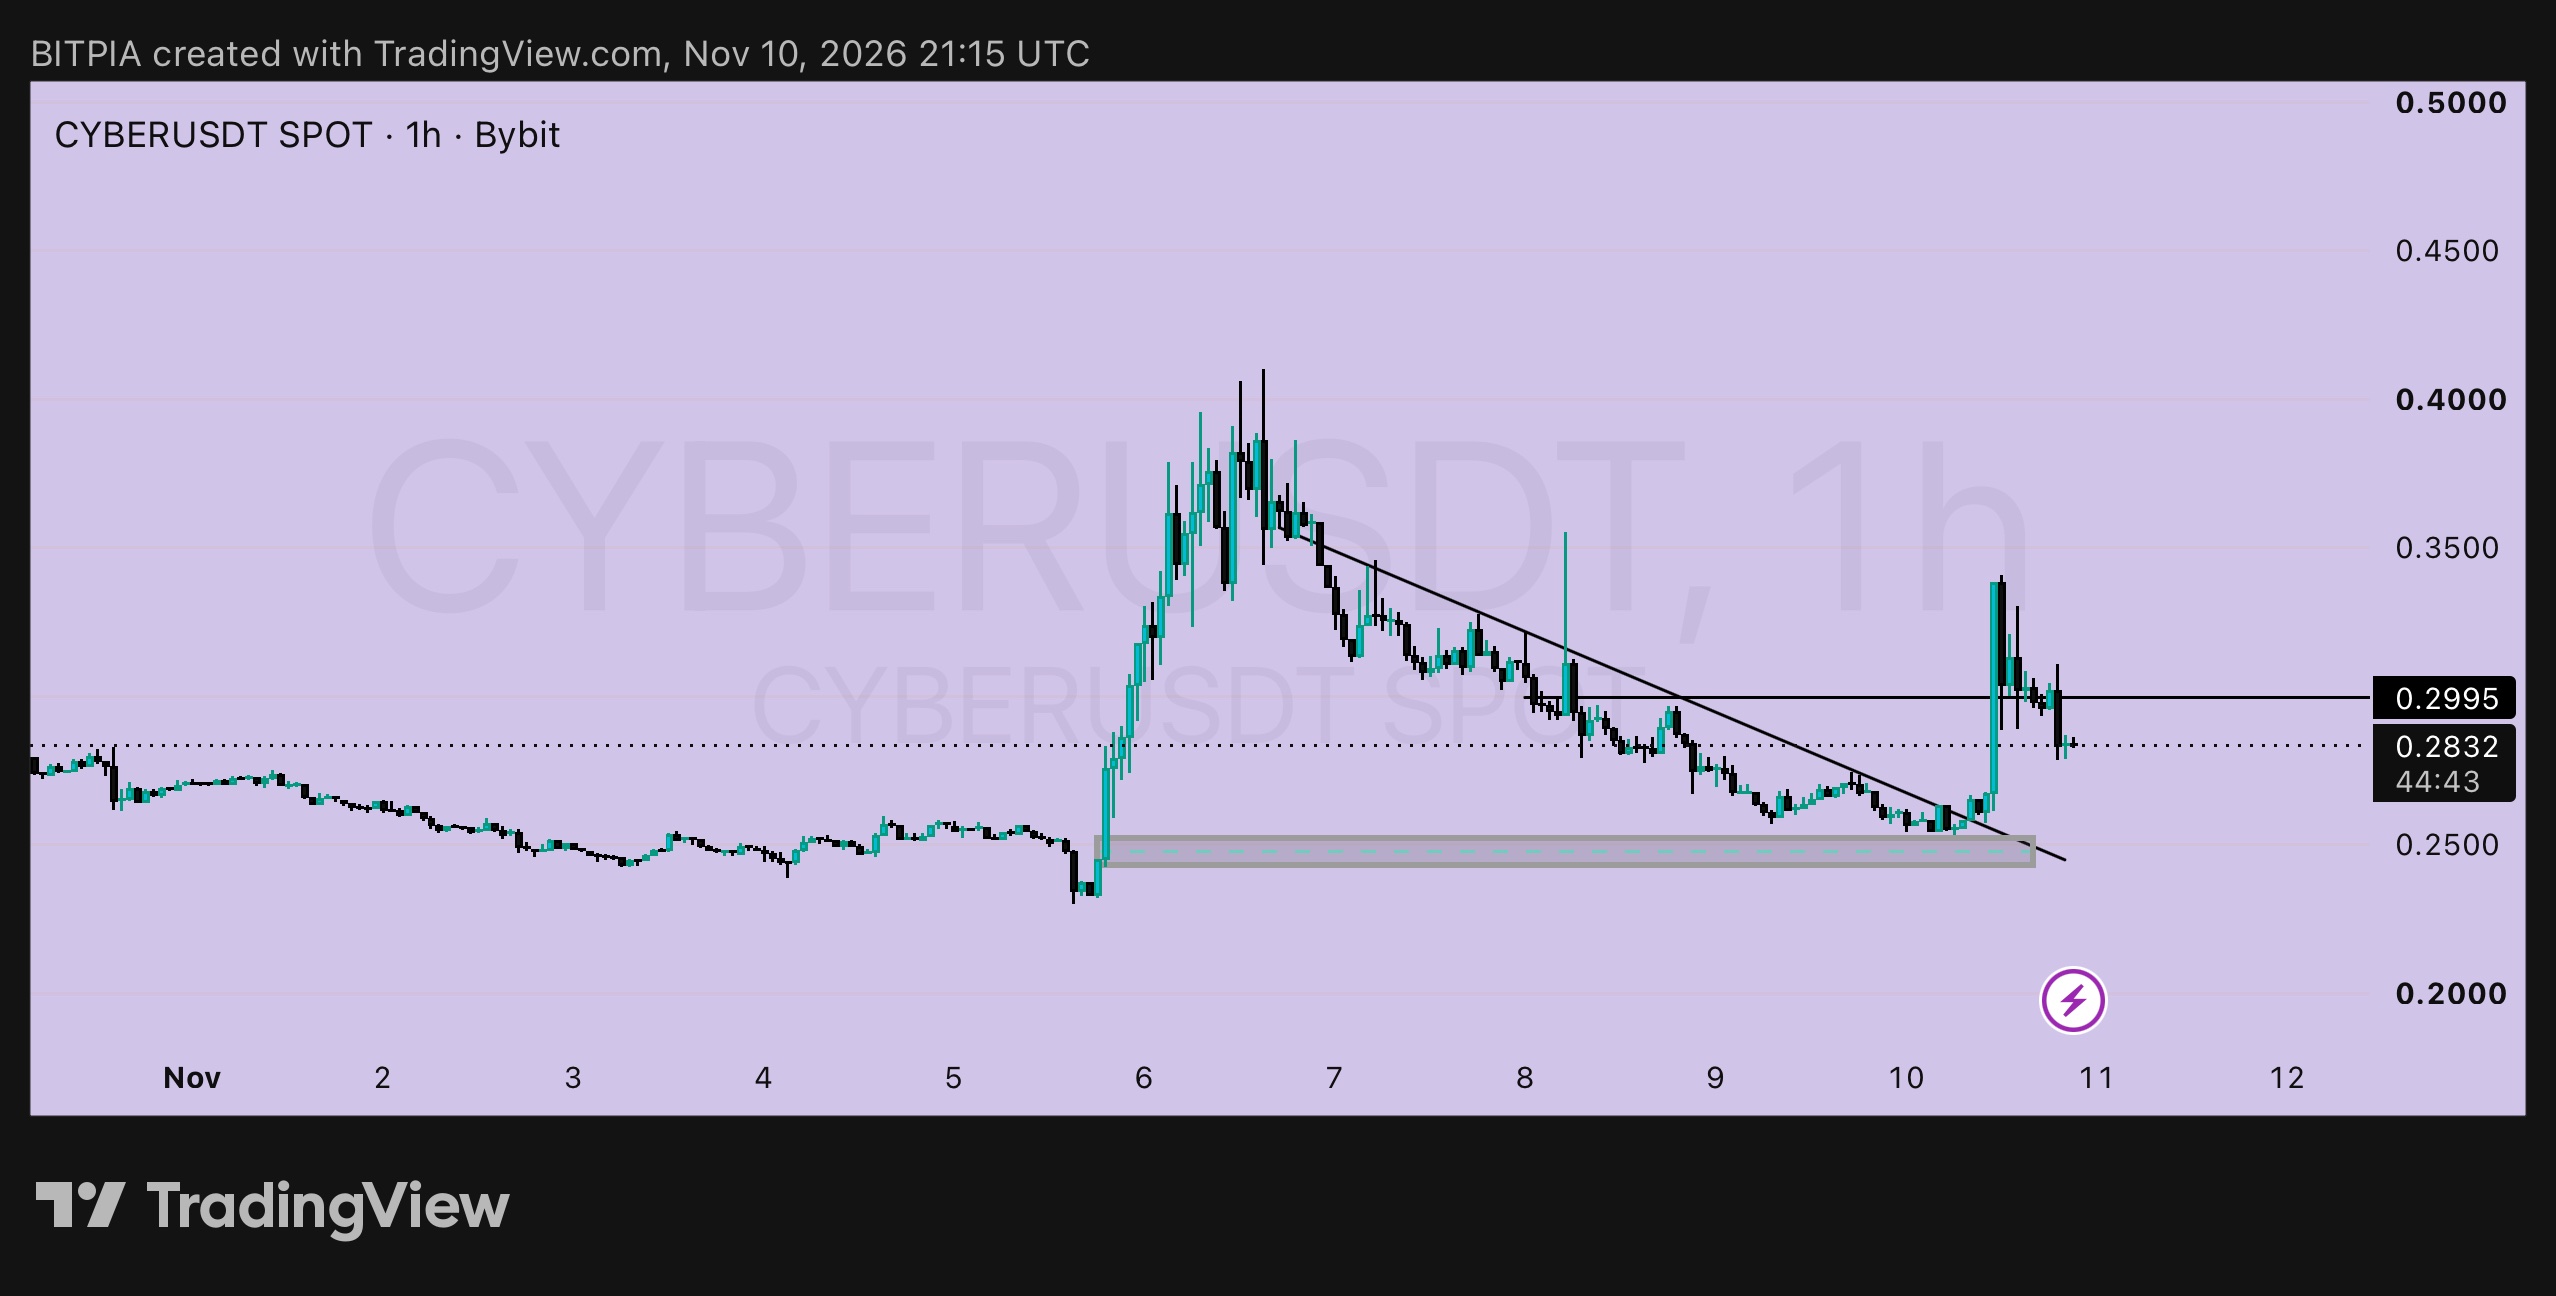
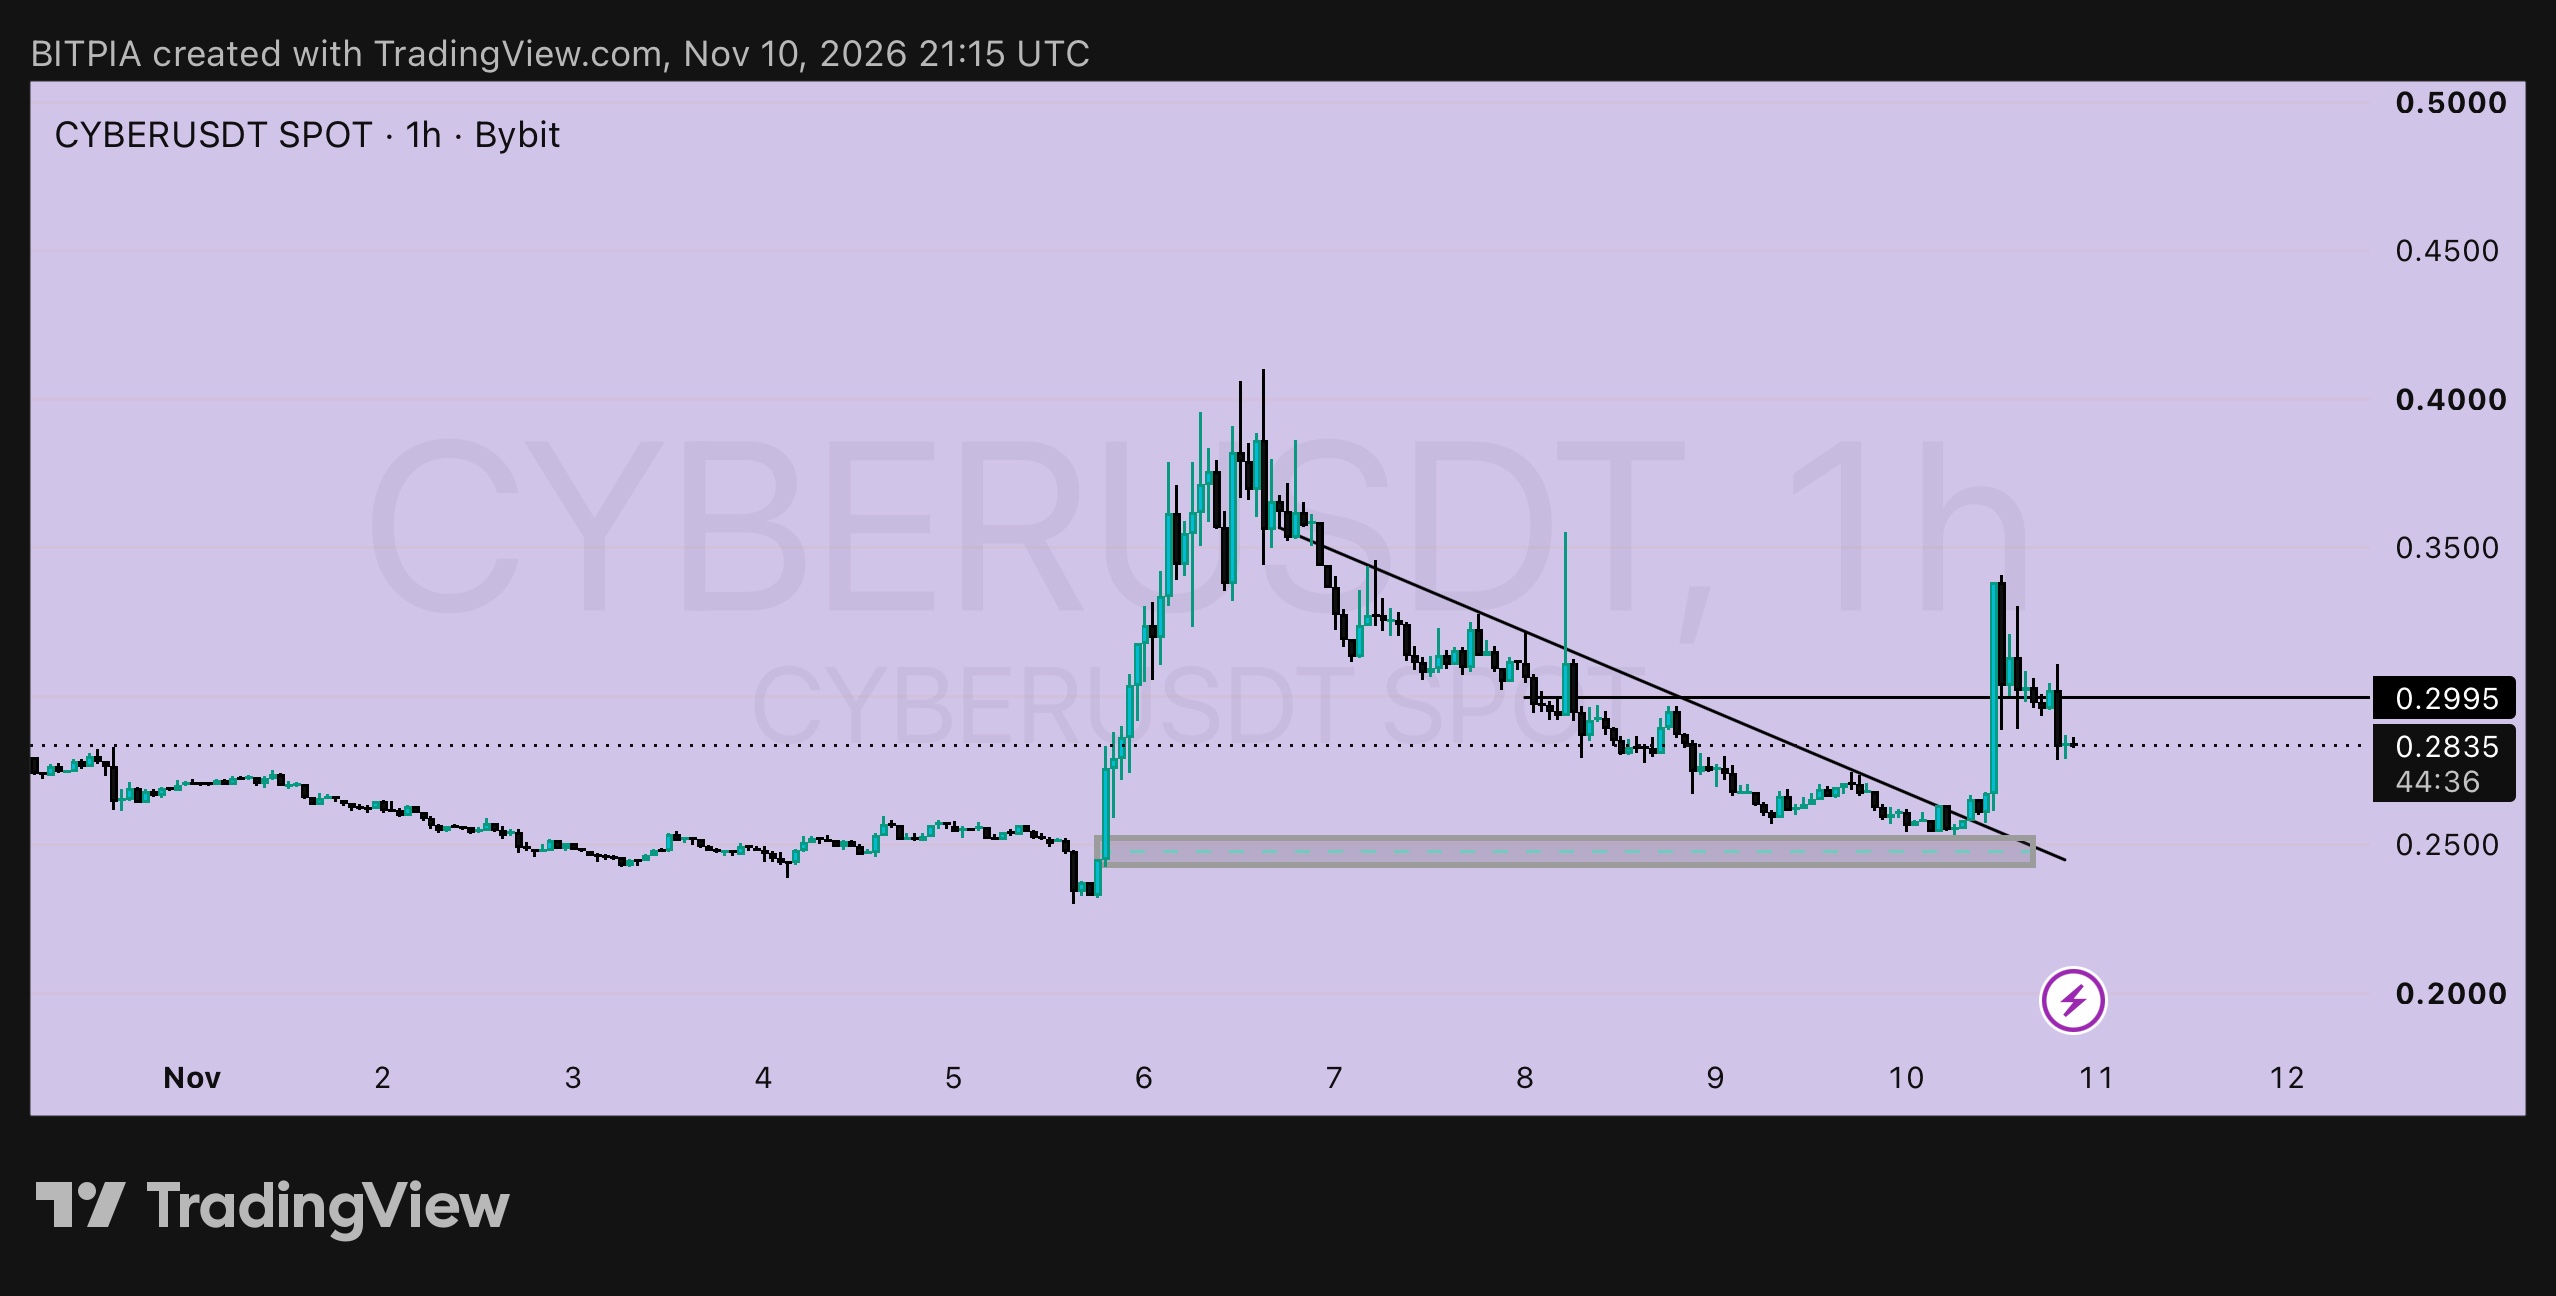
CYBER 1時間足:簡潔にまとめます🍬 $CYBERUSDTは今朝、下降トレンドラインをブレイクして約0.345まで急騰しましたが、その後上げ幅のほとんどを失い、0.2995を割り込みました。現在の価格は0.2835です。最初のレジスタンスラインを維持できずに下落したのは警告信号ですが、まだ失敗と決まったわけではありません。私は以下の2つの明確なシグナルのいずれかを待ちます。 ➤ シグナル1:フロア(サポートライン)の再テスト ▸ エントリー:0.2600付近(0.245~0.255のサポートゾーンおよび以前のトレンドライン付近) ▸ 損切り:0.2420割れ ▸ 1ユニットあたりのリスク:0.0180 ▸ ターゲット1:0.2995(+0.0395、約2.2R) ▸ ターゲット2:0.3450(+0.0850、約4.7R) ➤ シグナル2:0.2995を明確に上抜けて終値が確定 ▸ エントリー:0.3030付近 ▸ 損切り:0.2800割れ ▸ 1ユニットあたりのリスク:0.0230 ▸ ターゲット:0.3450(+0.0420、約1.8R)および0.4000(+0.0970、約4.2R) ➤ なぜ今ではないのか 0.2835の現在価格で損切りを0.2420に置くと、リスクは0.0415になります。一方で、直上のレジスタンスまではわずか0.0160しかありません。これではリスク1に対してリワードが0.5未満になってしまいます。 ➤ 無効となる条件 1時間足の終値が0.2420を下回った場合、サポートゾーンが崩壊したと判断し、様子見とします。 11月6日の高値付近(0.41)が示す通り、この銘柄は上下どちらにも急激に動く可能性があります。ポジションサイズは小さく、もし無期限先物(Perps)を使うならレバレッジは低めに抑えてください。 これは投資助言ではありません。DYOR(自己責任)で、失っても良い資金の範囲内で取引してください。 #ByXIMPACT #WSOT2026
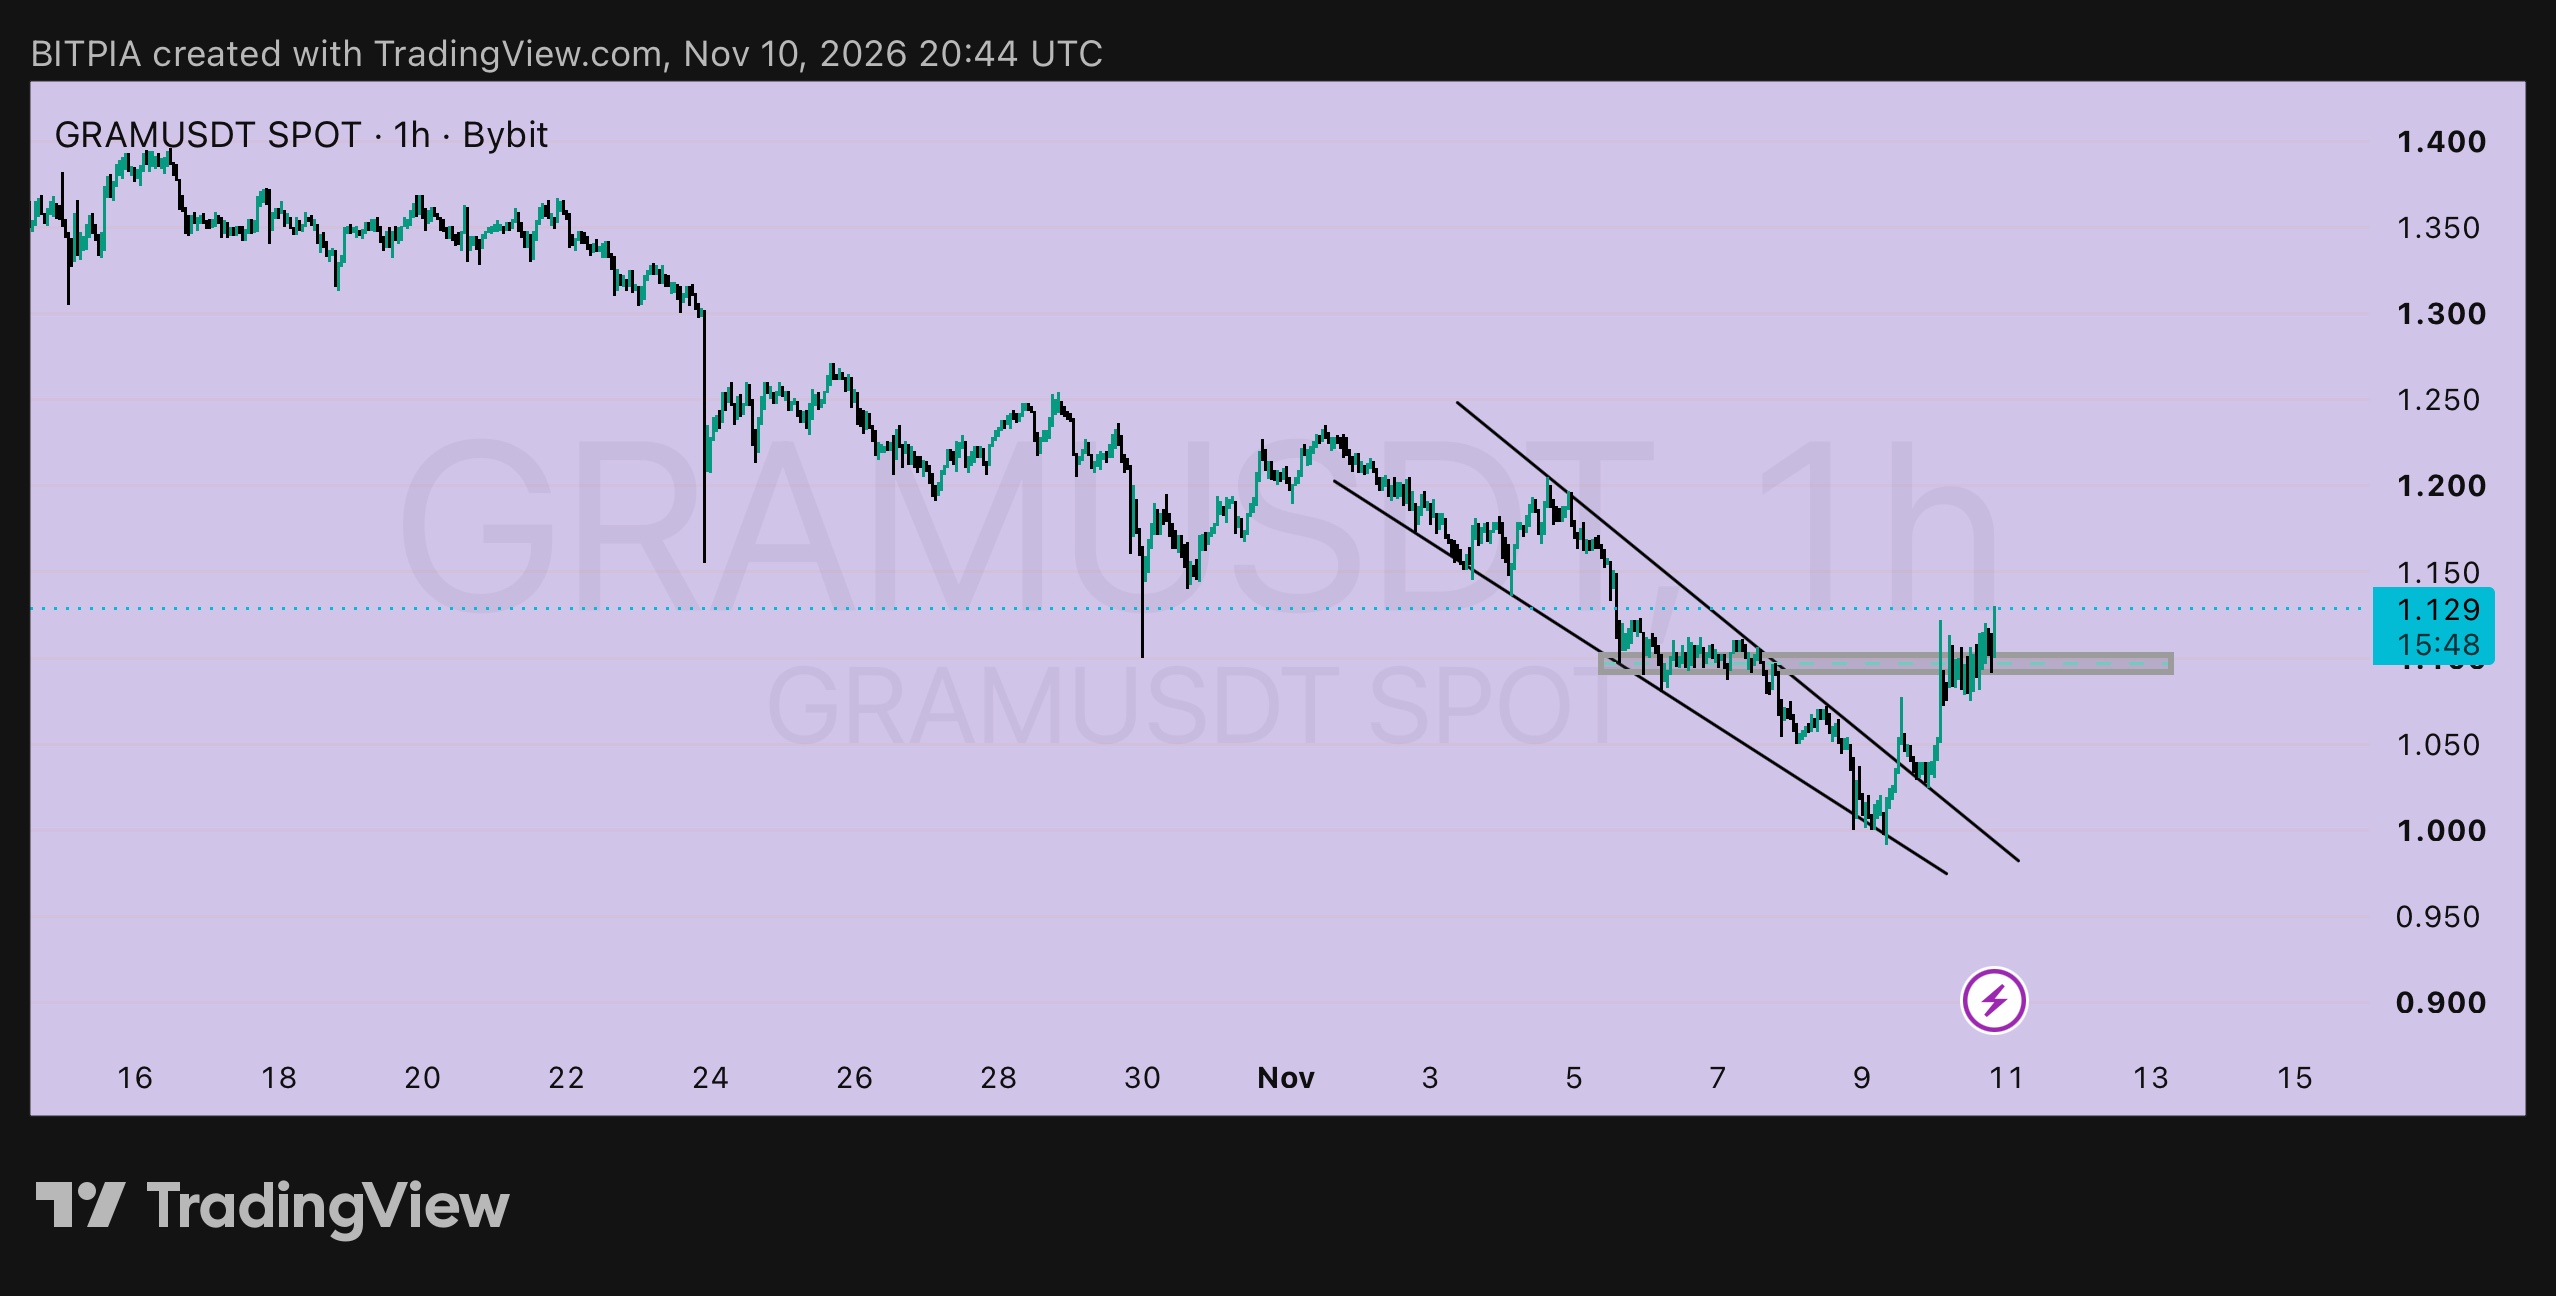
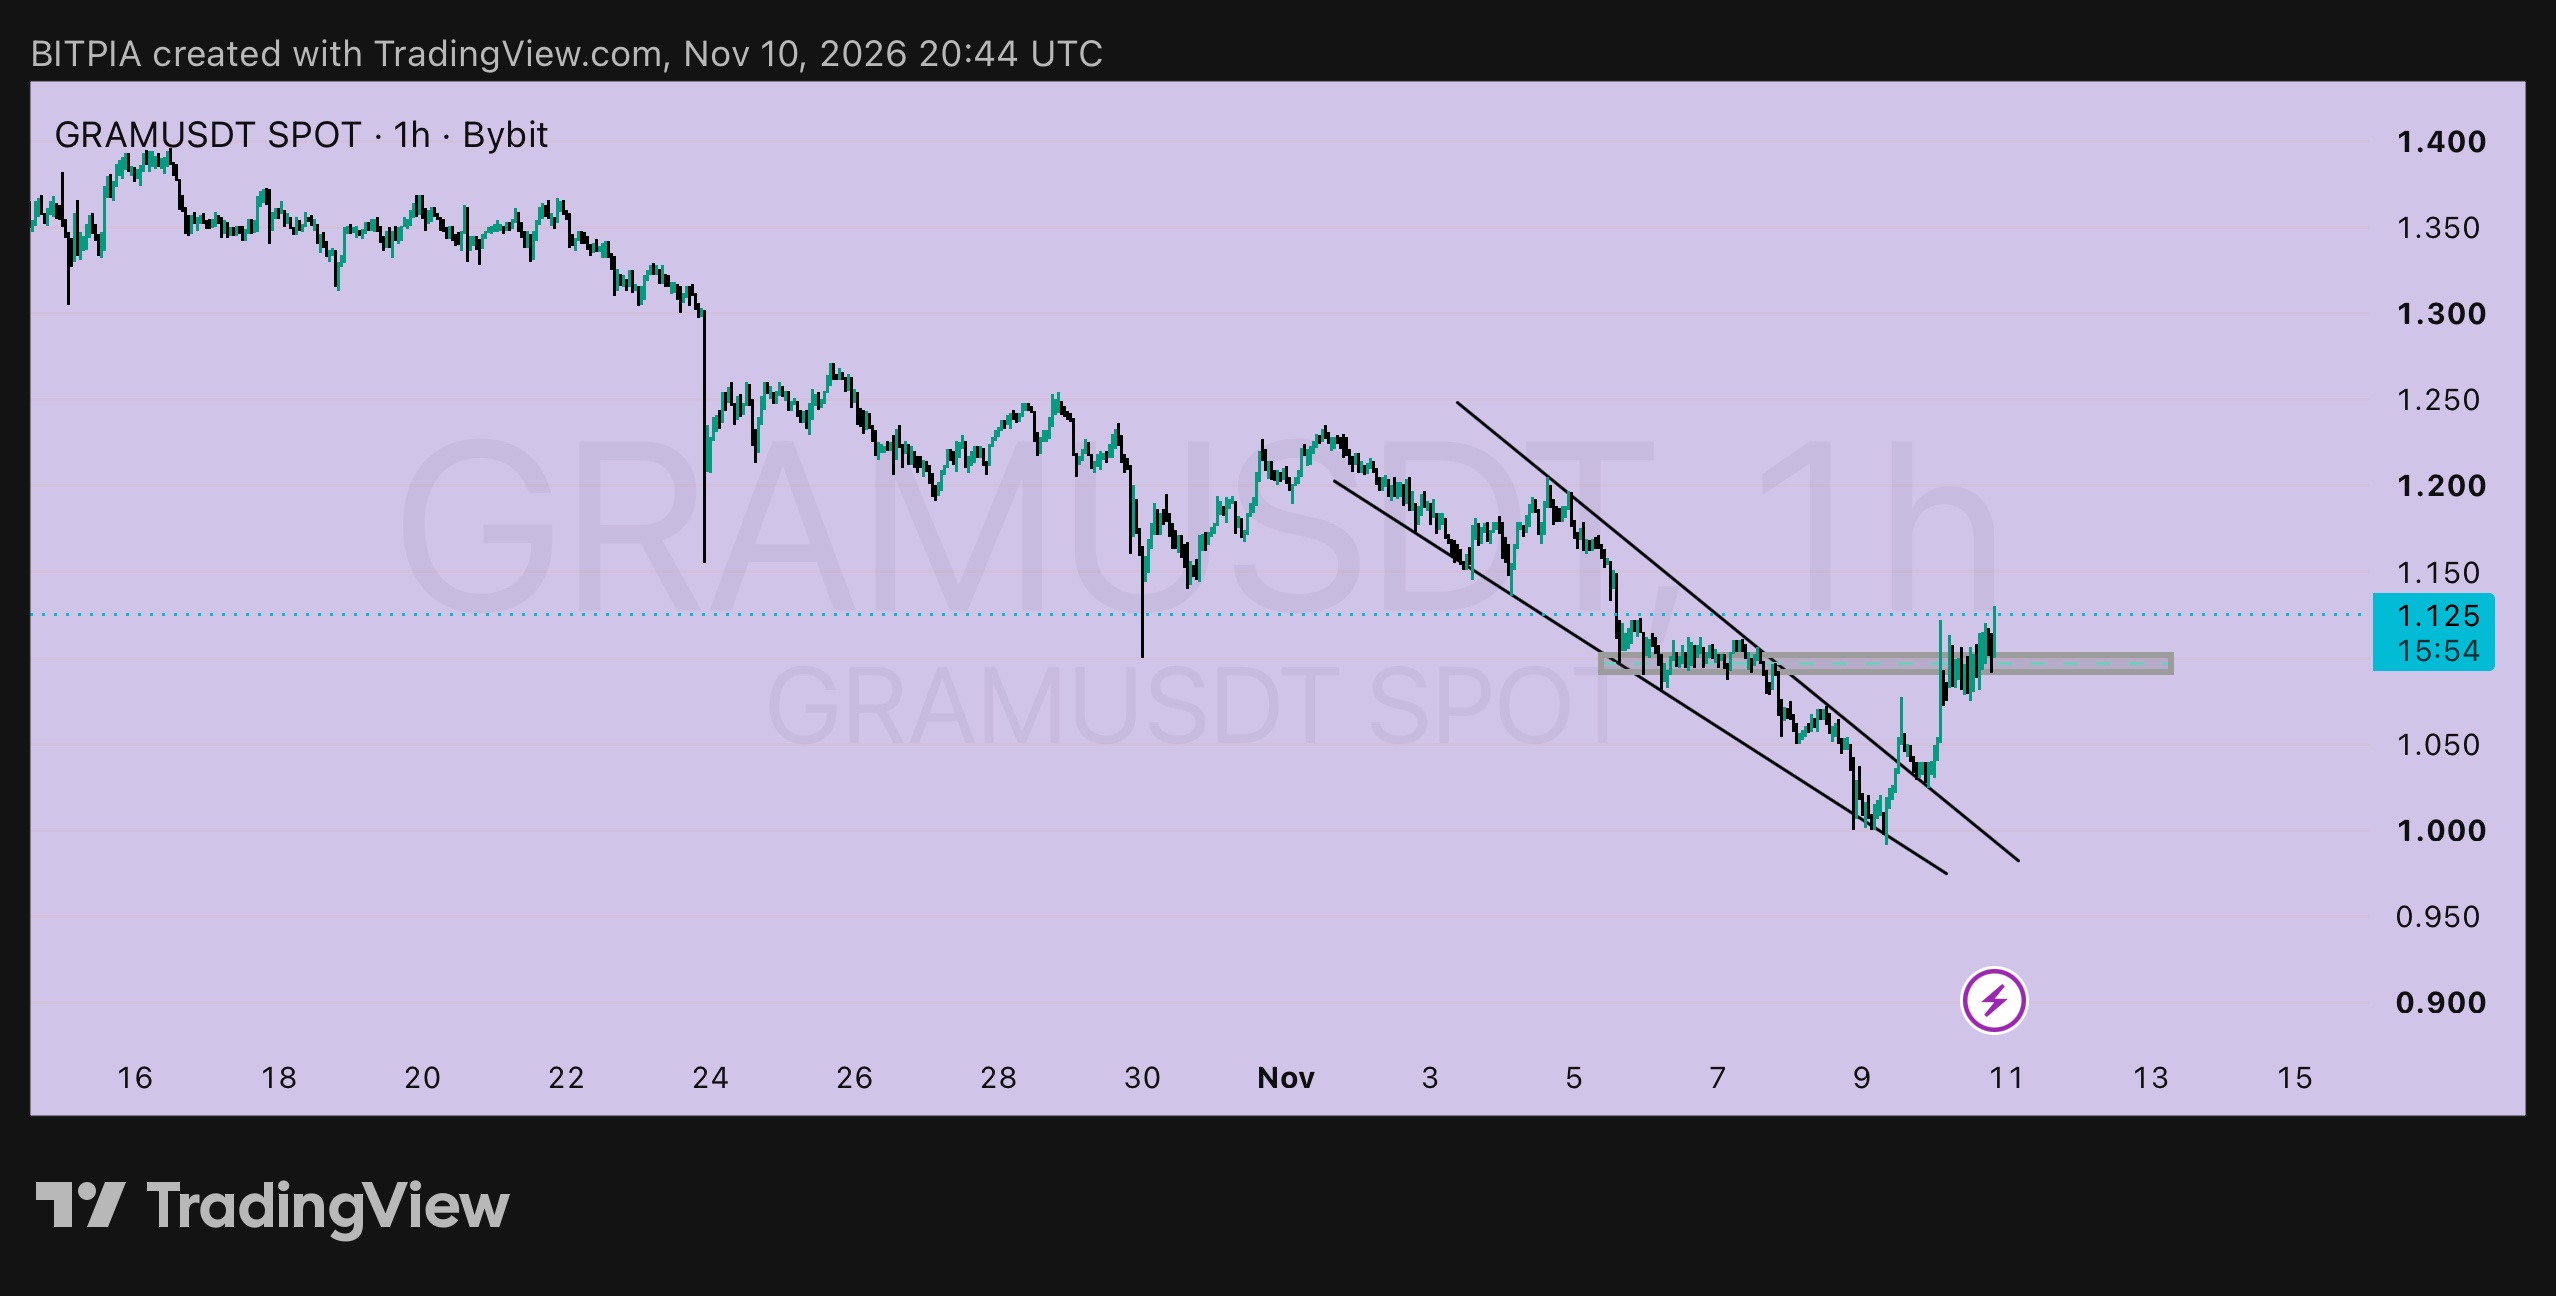
$GRAMUSDT 1時間足:ブレイクアウトサイクルの現在地は? ブレイクアウトには通常、「ブレイク(突破)」、「リテスト(再試行)」、「コンティニュエーション(継続)」の3つの段階があります。価格1.129のGRAMの現在地を見てみましょう。 ➤ ステージ1:ブレイク ✅ 完了 ▸ 11月9日、0.99付近の安値をつけた後、下降チャネルを上抜けた ▸ ブレイクはクリーンで、上値ラインを力強いローソク足で突破した ➤ ステージ2:リテスト ✅ ほぼ完了 ▸ 直近の下落前にサポートとして機能していた1.095~1.105のゾーンを奪還した ▸ 現在もそのゾーン上に留まっており、キープできている。これは期待していた動きだ ➤ ステージ3:コンティニュエーション ⏳ 未達 ▸ 1時間足で1.150を上回って引ければ、最初の確定シグナルとなる ▸ その後は、1.210(11月3日~4日の高値)、次に1.250(10月下旬のエリア)がターゲットとなる ➤ 私のプラン ▸ エントリー:1.105付近、ゾーンへの押し目 ▸ 損切り:1.055割れ、ブレイクしたチャネルラインの下 ▸ ユニットあたりのリスク:0.050 ▸ ターゲット1:1.150、+0.045、約0.9R ▸ ターゲット2:1.210、+0.105、約2.1R ▸ ターゲット3:1.250、+0.145、約2.9R ➤ 追随の計算 1.129でエントリーし同じストップを設定した場合、リスクは0.074となる。1.210までは約1.1R、1.250までは約1.6R。悪くはないが、最高でもない。押し目の方が良いが、そこまで下がってくる保証はない。 ➤ 無効になる条件 1時間足で1.055を下回って引けた場合、リテスト失敗とみなして古いチャネル内に戻ったと判断し、撤退する。 より大きなトレンドは今月初旬の1.40から依然として下落基調にあるため、ポジションサイズは小さくし、無期限先物を使う場合はレバレッジを低く抑えること。 これは投資助言ではありません。各自でリサーチを行い、失っても許容できる範囲のリスクで取引してください。 #ByXIMPACT #WSOT2026
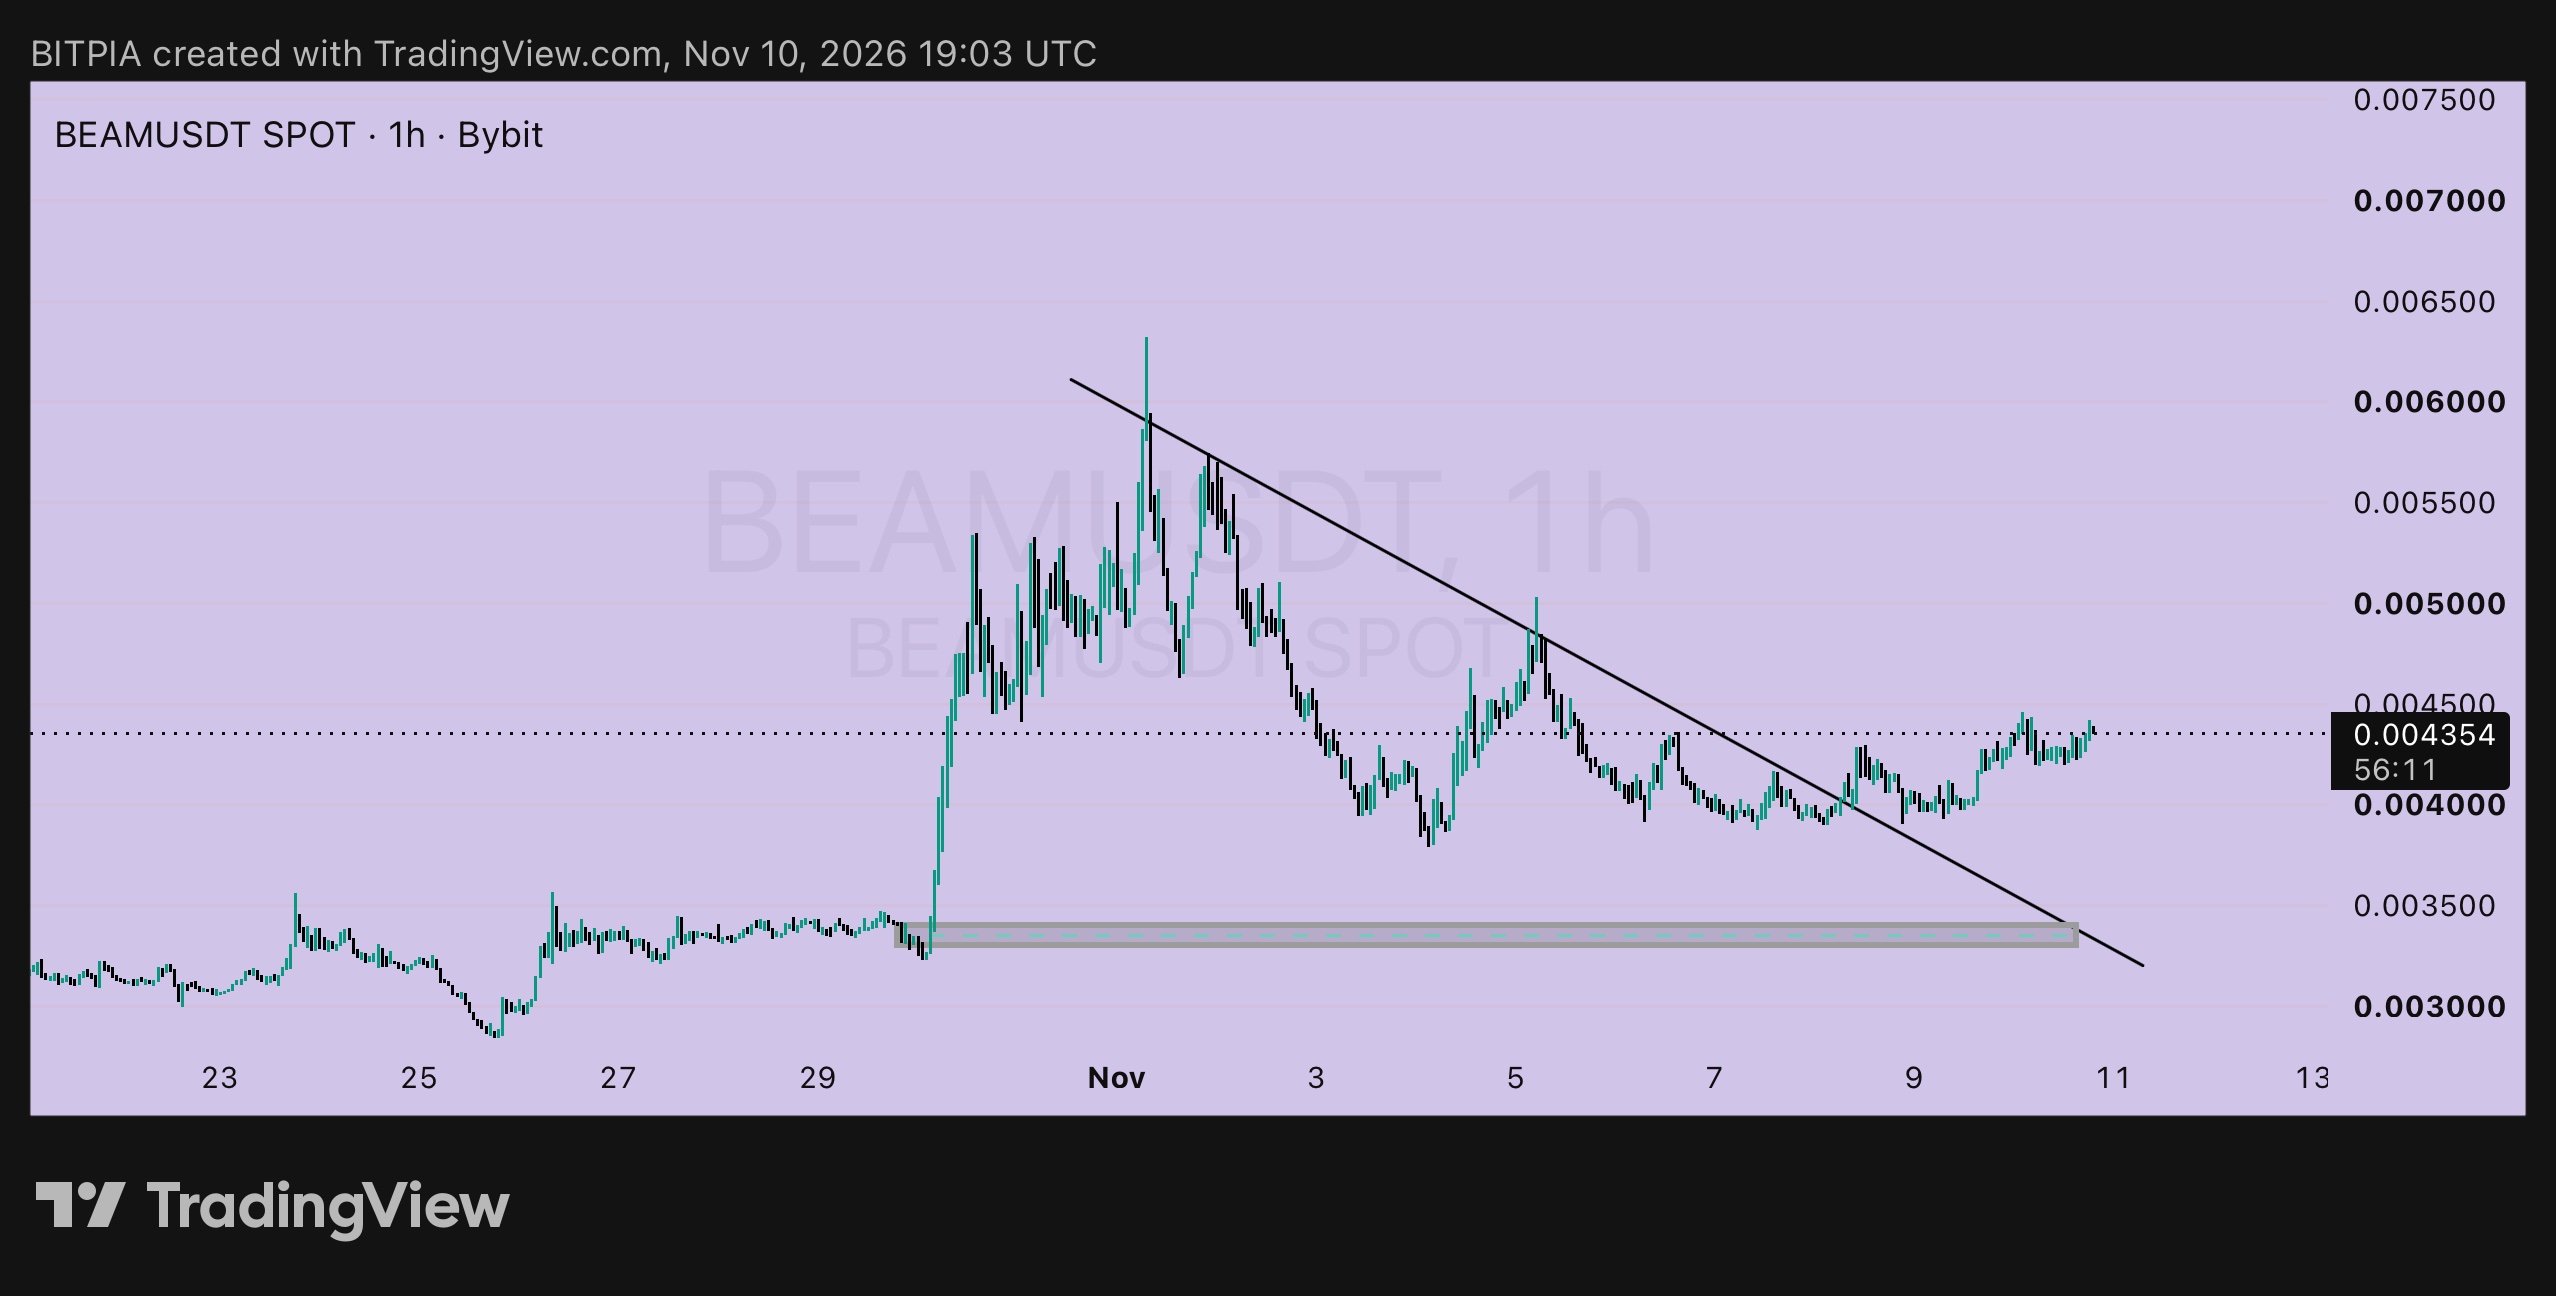
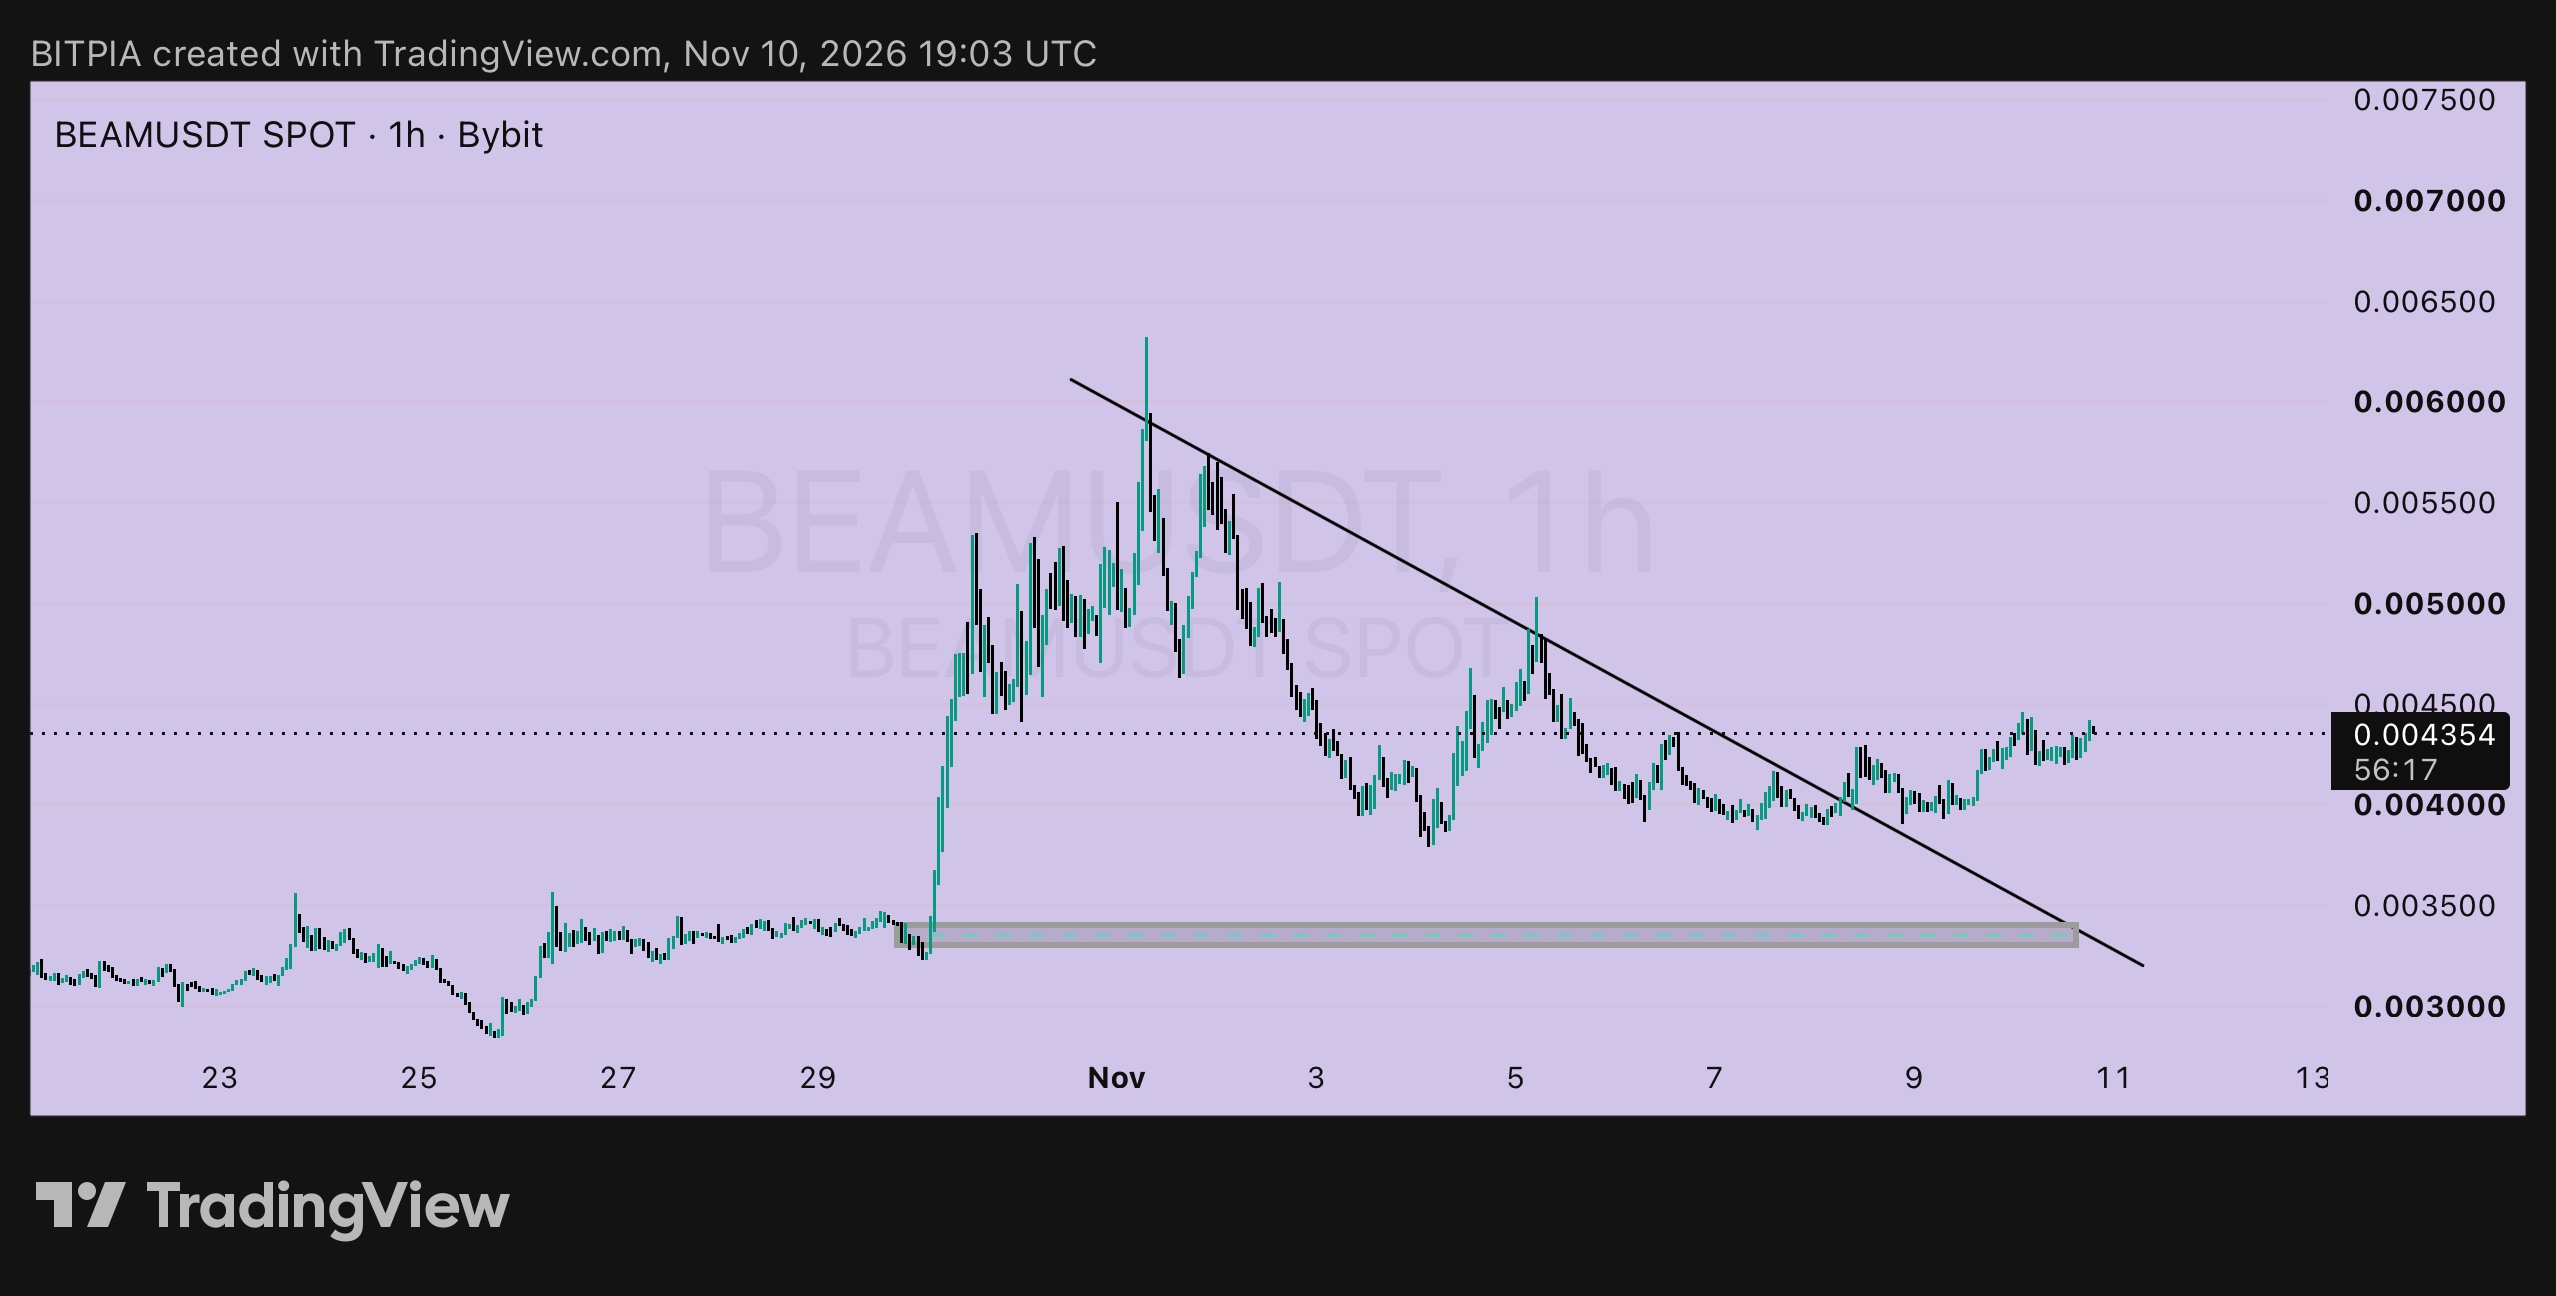
$BEAMUSDT 1時間足:ニュースティッカー 📰 ➤ 速報:トレンドラインをブレイク ▸ 価格は11月1日の高値からの下落ラインを11月8日にクリアし、2日間その上を維持 ▸ 現在は0.004354で、11月7日の投稿時(0.004041)から上昇 ➤ プランの確認:プランA、0.00425でのブレイクアウトエントリー ▸ ステータス:トリガー済み、価格はライン上でクローズ ▸ ストップロスは0.00385、リスクは0.00040 ▸ 現在約+0.0001、利益は約0.25R。まだ大きくはないが、ブレイクは維持されている ➤ プランの確認:プランB、0.00395での早めのエントリー ▸ ステータス:11月9日の安値が約0.0039に達したため、約定している可能性が高い ▸ ストップロスは0.00370、リスクは0.00025 ▸ 現在約+0.0004、利益は約1.6R ➤ 今後の展開:次にとるべき行動 ▸ オープントレードについては、ストップを11月9日の安値とブレイクしたラインの下である0.00385の直下に引き上げる ▸ ターゲット1:0.00500、11月5日に価格が拒絶されたエリア ▸ ターゲット2:0.00550 ▸ ターゲット3:0.00600、11月1日の高値エリアに近い プランAのエントリー(0.00425)からだと、それぞれ約1.9R、3.1R、4.4Rとなる。 ➤ まだポジションを持っていない場合 ▸ エントリー:0.00415付近へのディップ(押し目)、古いラインがサポートとして機能する場合 ▸ ストップロス:0.00385の下 ▸ ユニットあたりのリスク:0.00030 ▸ ターゲット:0.00500(+0.00085、約2.8R)および0.00550(+0.00135、約4.5R) ➤ 天気予報 0.0033から0.0034付近のベースゾーンははるか下にあるため、万が一反転した場合でも、価格と発射台の間には十分な余裕がある。 ➤ 無効となる条件 1時間足が0.00385を下回ってクローズした場合、ブレイクは失敗とみなし、撤退する。 ポジションサイズは小さめに。パーペチュアル取引を行う場合はレバレッジを低く抑えてください。 投資助言ではありません。自身の調査を行い、失っても許容できる範囲のリスクで取引してください。 #ByXIMPACT #WSOT2026
1時間足開始:利確のタイミング 💰 $INITUSDTは0.24183です。2日前に0.12304で投稿した際、0.1150割れにストップを置いた0.1200付近でのリテスト(ドア2)が私の狙い目だと言いました。昨日、ストップを0.1200に引き上げました。それ以来、価格はほぼ倍増しており、今こそ計算するタイミングです。 ➤ 数字で見ると ▸ ドア2 エントリー:0.1200、リスク 0.0050 ▸ 現在:1ユニットあたり約+0.1218、およそ24R ▸ ドア1(0.1230、リスク 0.0080)も大幅にプラスで、約14R ▸ 私が投稿したターゲット(0.1390と0.1520)はどちらもとうの昔に通過済み このような利益こそが、実際に起こる前に計画を立てておく理由です。 ➤ 私の利確方法 ▸ 0.2400から0.2500エリア付近、以前売りが出た10月28日の高値0.2550の近くで半分ほど利確 ▸ 残りは今朝のプルバックの安値である0.1800あたりまでストップを引き上げる ▸ 0.2550を超えると、このチャート上には目指すべき過去のレジスタンスがないため、トレイリングストップに任せる ➤ 買い増ししない理由 ▸ ローソク足が非常に大きい。数時間で0.158から0.225まで急騰し、0.183まで戻している ▸ 0.2418でストップを0.1780に置いた場合、リスクは0.0638であり、ターゲットの0.2550までは約0.2Rしかない。これはトレードではなく、ただの願望だ ➤ まだポジションを持っていない場合 ▸ 0.2050に向けたプルバックと、0.2000以上での維持を待つ ▸ ストップロス:0.1780以下 ▸ 1ユニットあたりのリスク:0.0270 ▸ ターゲット:0.2550、+0.0500、約1.9R ▸ もし戻ってこなくても問題ない。この相場はすでに終わっている ➤ シナリオ無効の条件 1時間足が0.1800を下回って引ければ、上昇の勢いが冷めたことを意味する。保有中のトレードについては、トレイリングストップがその役割を果たす。 これだけ大きな動きの後なので、ポジションサイズは小さく、もし無期限先物(perp)を使うならレバレッジは低く抑えること。 投資助言ではありません。自己責任でリサーチを行い、失ってもいい資金でのみリスクを取ってください。 #ByXIMPACT #WSOT2026
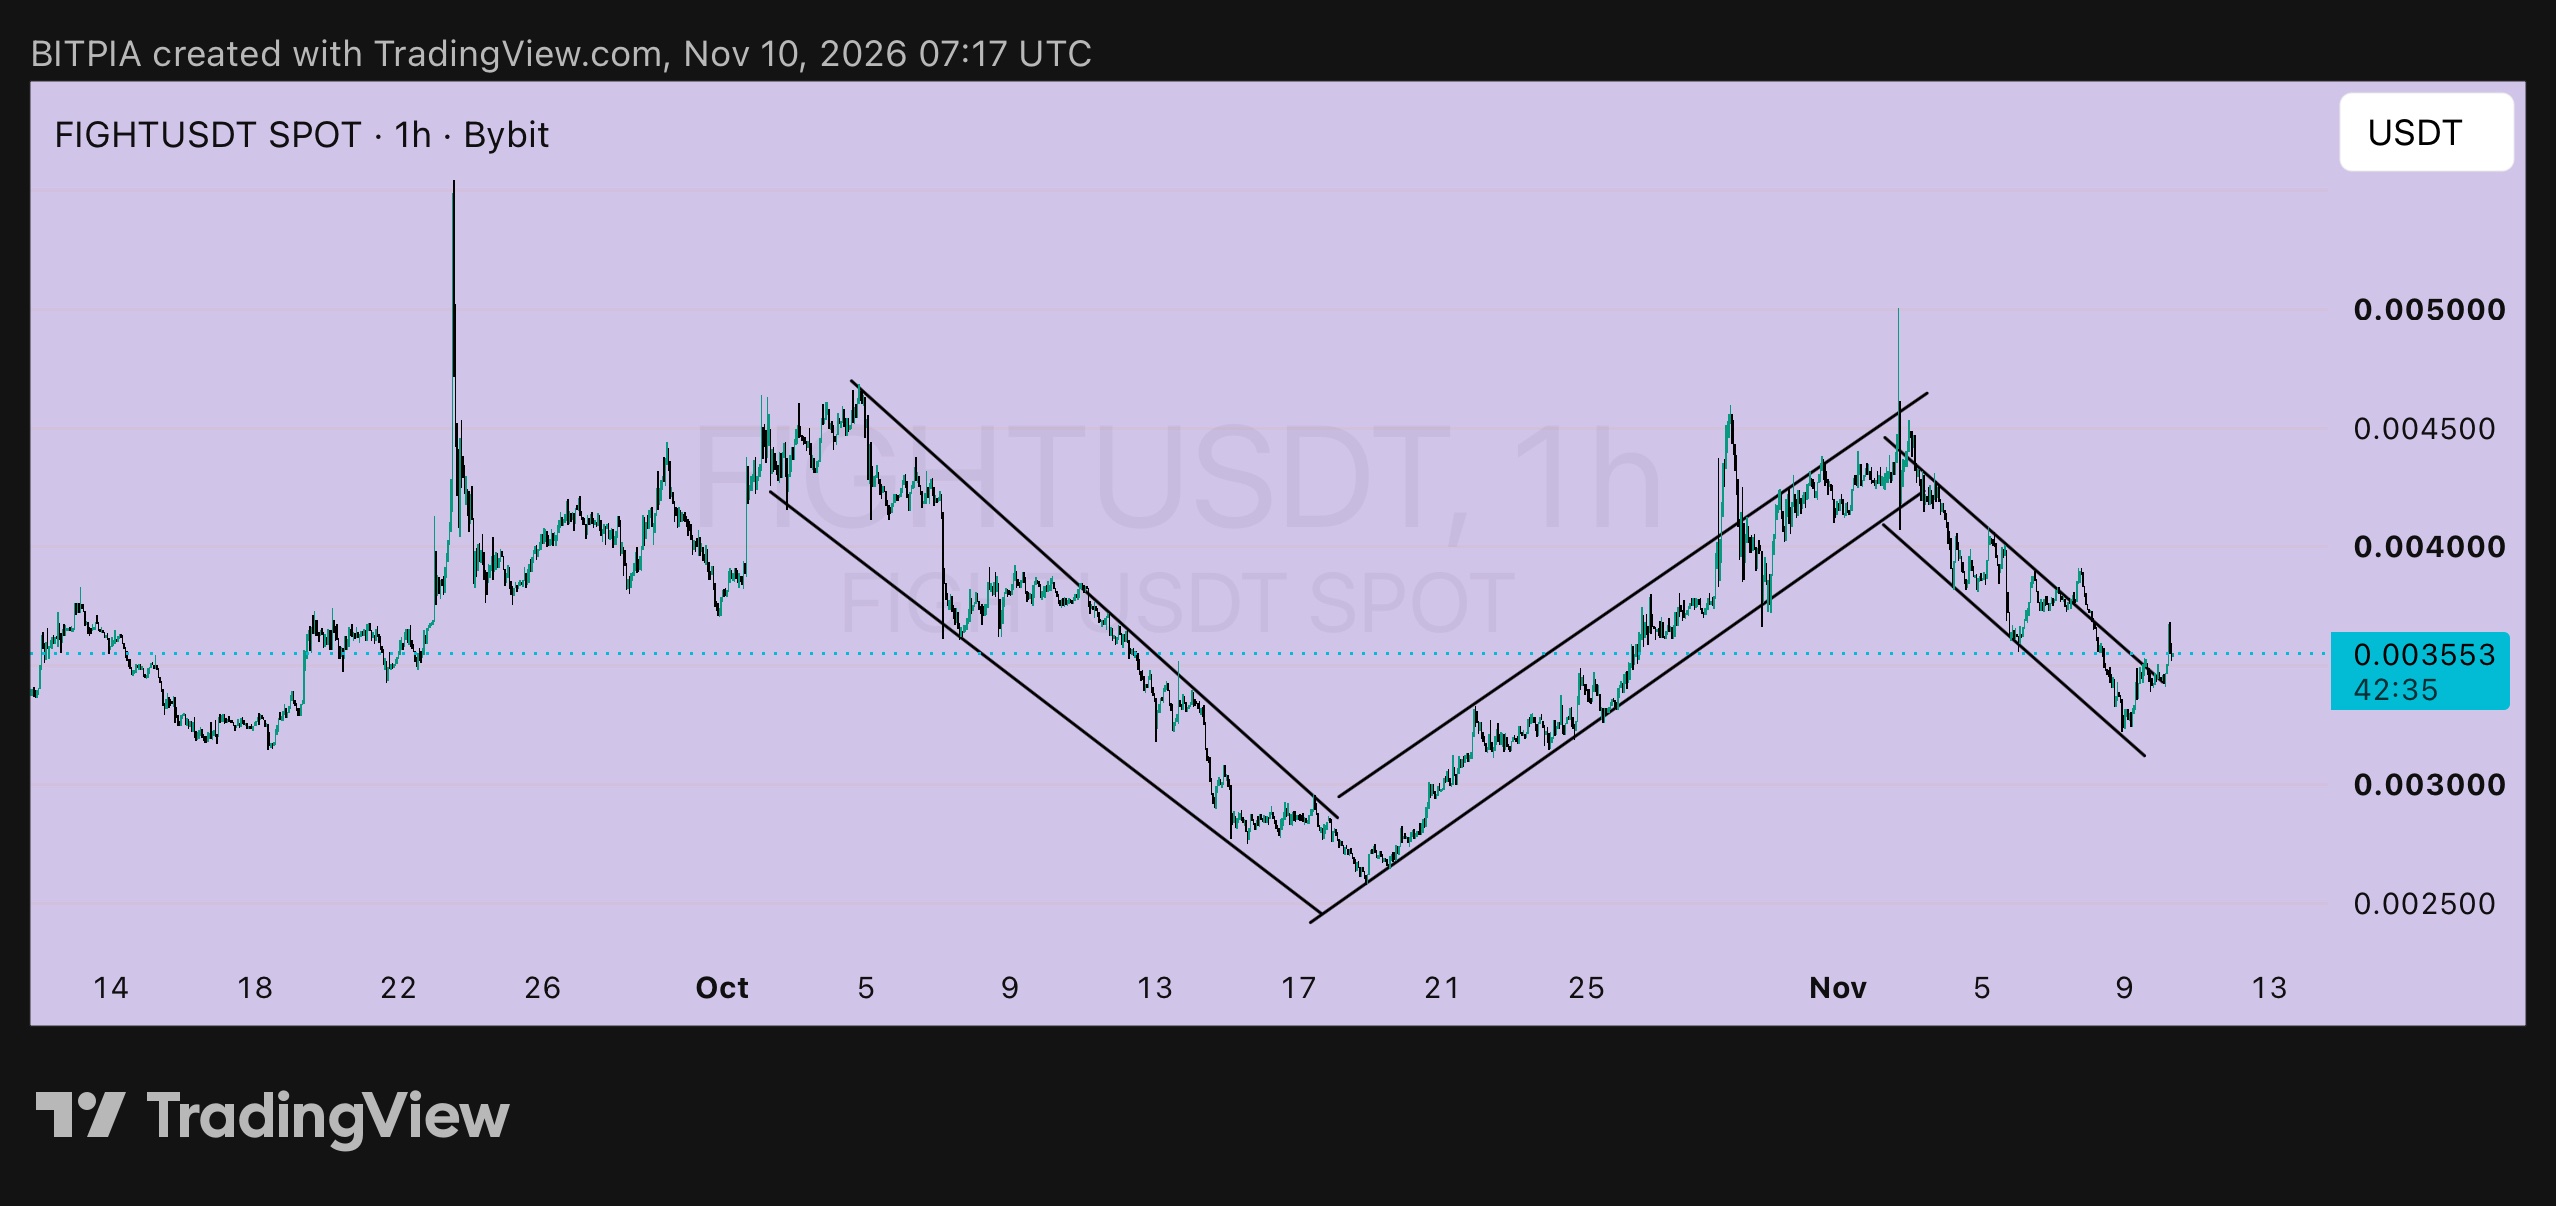
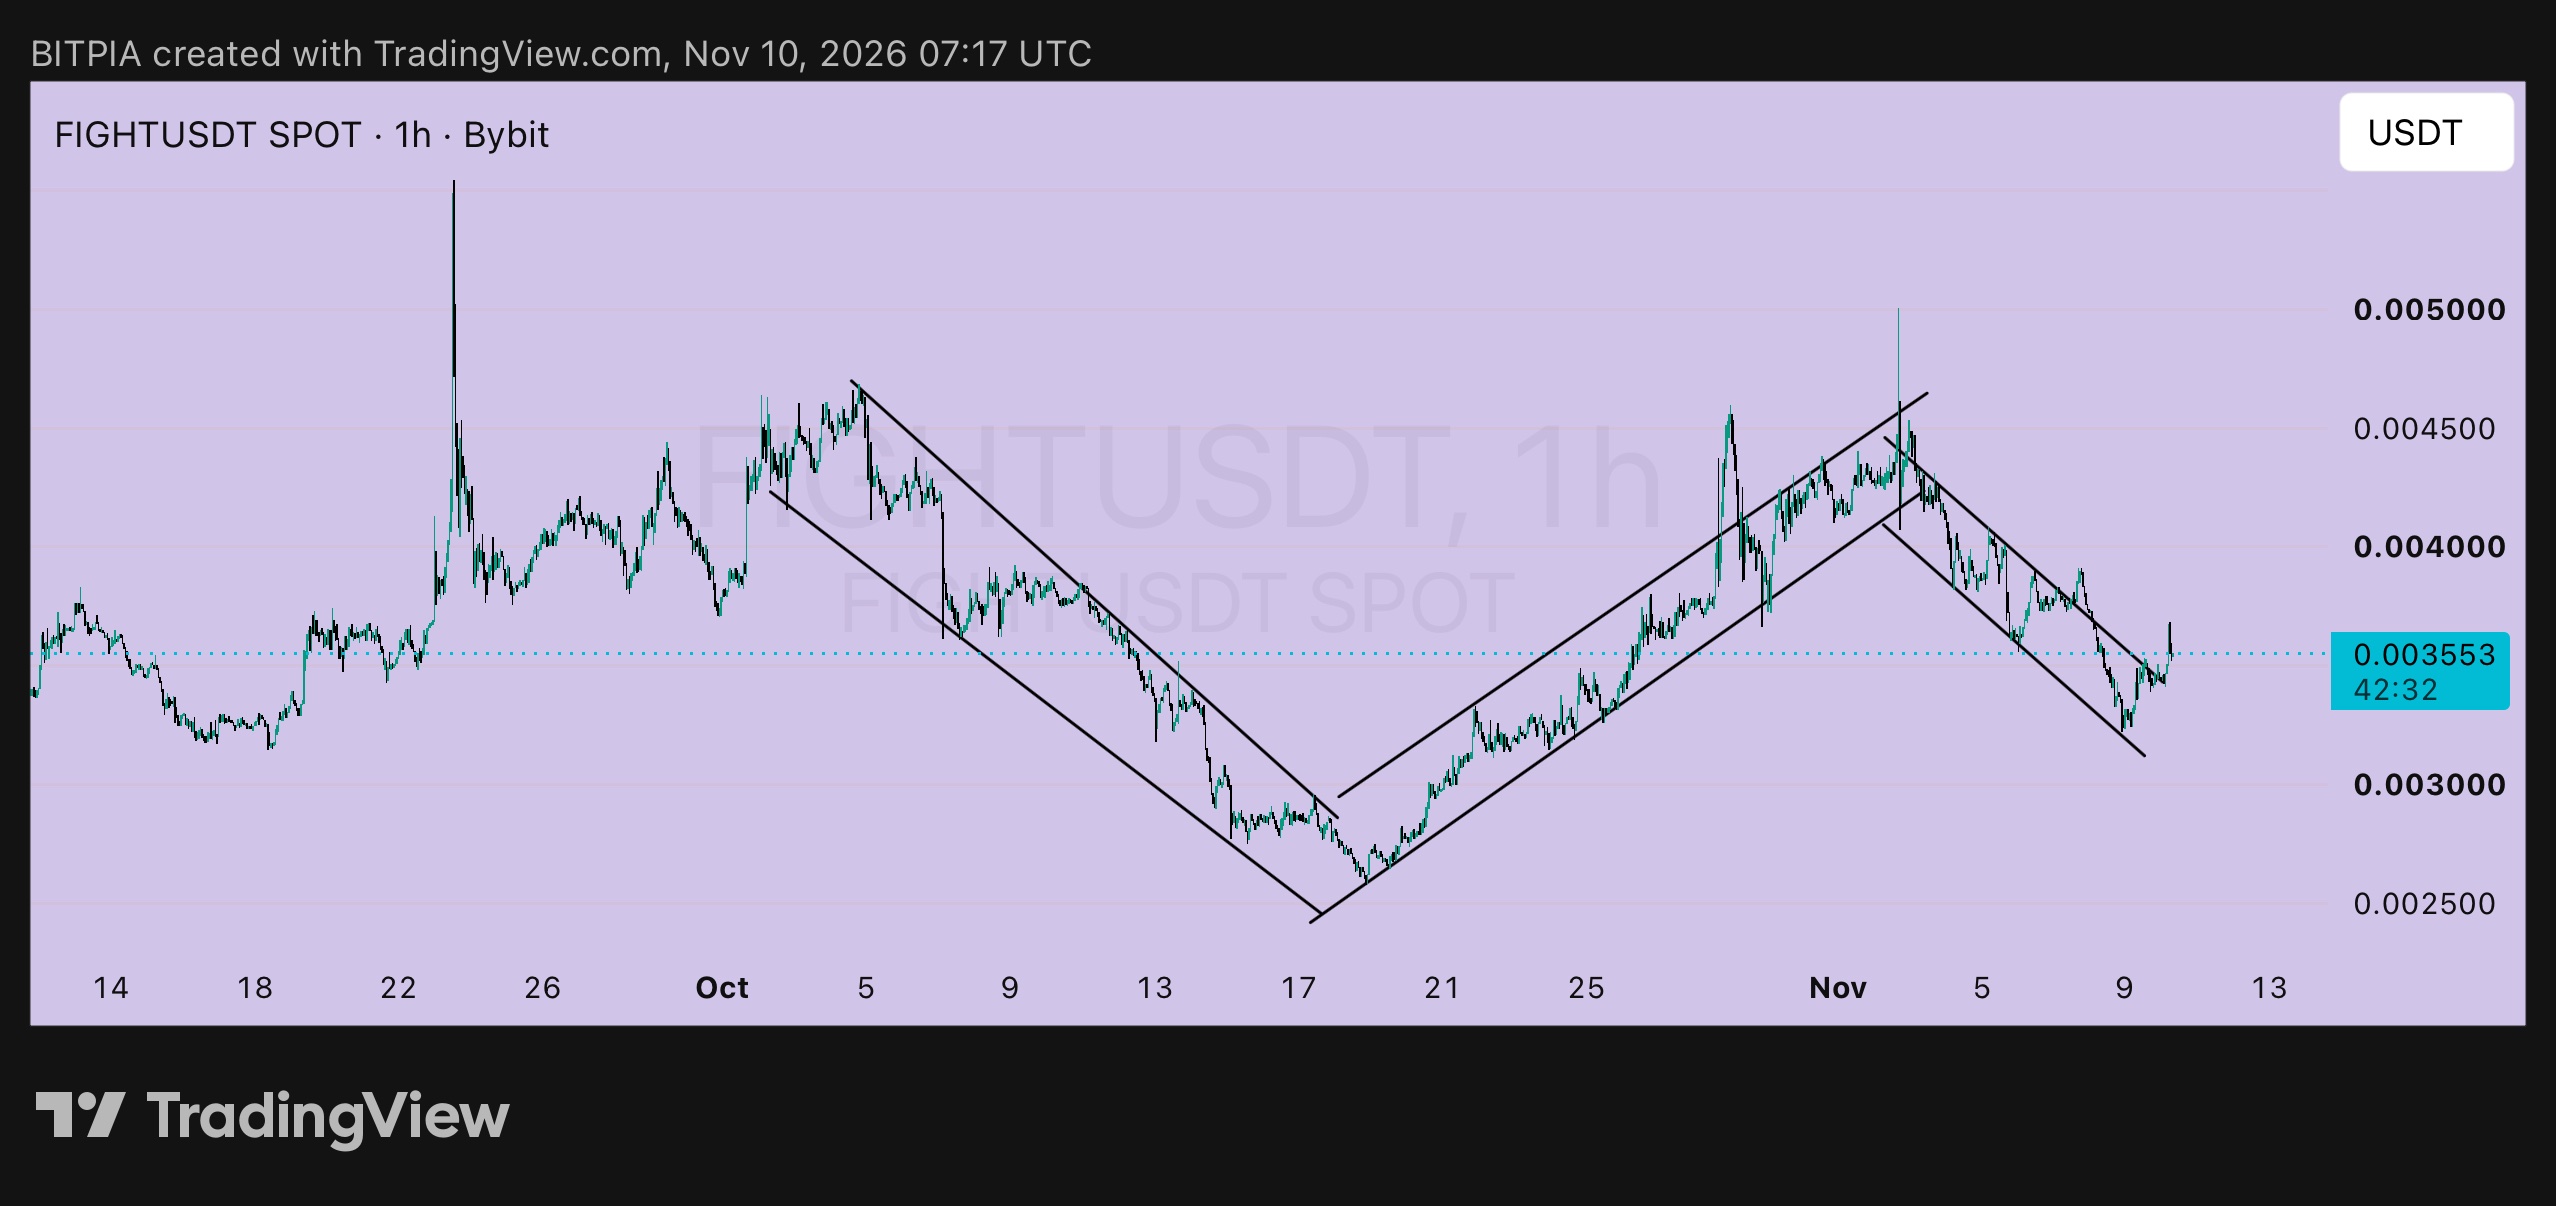
$FIGHT 1h: the zigzag 〰️ Since October, $FIGHTUSDT has been moving in clean legs, and this is the picture I like to keep in mind. ➤ The legs so far ▸ Oct 5 to 18: a falling channel down to about 0.0026 ▸ Oct 18 to Nov 2: a rising channel up to about 0.0046 to 0.0050 ▸ Nov 2 to 9: another falling channel, down to a low near 0.00322 ▸ Now: price is at 0.003553, and it has just moved above the top line of that last falling channel If the pattern repeats, a new leg up may be starting. I'm not counting on it, because legs can fail and the 0.00375 floor from last week has turned into resistance. ➤ Where I stand on my Nov 9 plan ▸ Trigger: a 1h close above 0.00358 ▸ Status: not confirmed yet. Price touched about 0.00367 this morning, then eased back ▸ Nothing has been triggered, so nothing lost ➤ Plan A: wait for the close ▸ Entry: around 0.00360 ▸ Stop-loss: below 0.00330 ▸ Risk per unit: 0.00030 ▸ Target 1: 0.00385, +0.00025, about 0.8R ▸ Target 2: 0.00420, +0.00060, about 2R ▸ Target 3: 0.00455, +0.00095, about 3.2R ➤ Plan B: a retest ▸ Entry: around 0.00345, if price returns to the broken channel line and holds ▸ Stop-loss: below 0.00322, under the last low ▸ Risk per unit: 0.00023 ▸ Targets: 0.00385 (+0.00040, about 1.7R) and 0.00420 (+0.00075, about 3.3R) Plan B has better numbers, and it only works if price gives it to me. ➤ What cancels it A 1h close under 0.00322 means the new leg has failed, and I step aside. The 0.0030 area would be the next level I'd watch. Small size, and low leverage if you use perps. Not financial advice. Do your own research and only risk what you can afford to lose. #WSOT2026
FIGHT 1h: the floor failed, and I'm saying it plainly On Nov 7 I posted $FIGHTUSDT at 0.003873 and said the 0.00375 to 0.00385 floor was the level to watch, with a stop under 0.00352. It didn't hold. Price slid to a low near 0.00322 and is now bouncing at 0.003442. ➤ What it means for the trade ▸ If you entered near 0.00385 and used the 0.00352 stop, you were stopped out for roughly a 1R loss ▸ If you added at 0.00375 with the 0.00355 stop, the loss is about the same size, a full 1R ▸ That's the job of a stop: it kept a wrong idea small. I'd rather show you this than hide it ➤ What the chart shows now ▸ Since October, FIGHT has been moving in clean swings: a falling channel, then a rising one, and now a falling one again ▸ Price is trading under the old floor, which has turned into resistance near 0.00375 ▸ The top line of the current channel sits near 0.00352 to 0.00358, and that's the first thing to clear ➤ Plan A: wait for the channel to break up ▸ Trigger: a 1h close above 0.00358 ▸ Entry: around 0.00360 ▸ Stop-loss: below 0.00330 ▸ Risk per unit: 0.00030 ▸ Targets: 0.00385 (+0.00025, about 0.8R), 0.00420 (+0.00060, about 2R), 0.00455 (+0.00095, about 3.2R) ➤ Plan B: the next real floor ▸ Entry: around 0.00305, only if buyers show up near 0.0030 ▸ Stop-loss: below 0.00285 ▸ Risk per unit: 0.00020 ▸ Targets: 0.00345 (+0.00040, about 2R) and 0.00380 (+0.00075, about 3.75R) ➤ What I'm not doing Not buying at 0.003442 in the middle of the channel. I have no close stop there and no confirmation. ➤ What cancels it Under 0.0028, I'd look at the 0.0025 to 0.0026 area from October and wait. Small size, and low leverage if you use perps. Not financial advice. Do your own research and only risk what you can afford to lose. #ByXIMPACT #WSOT2026
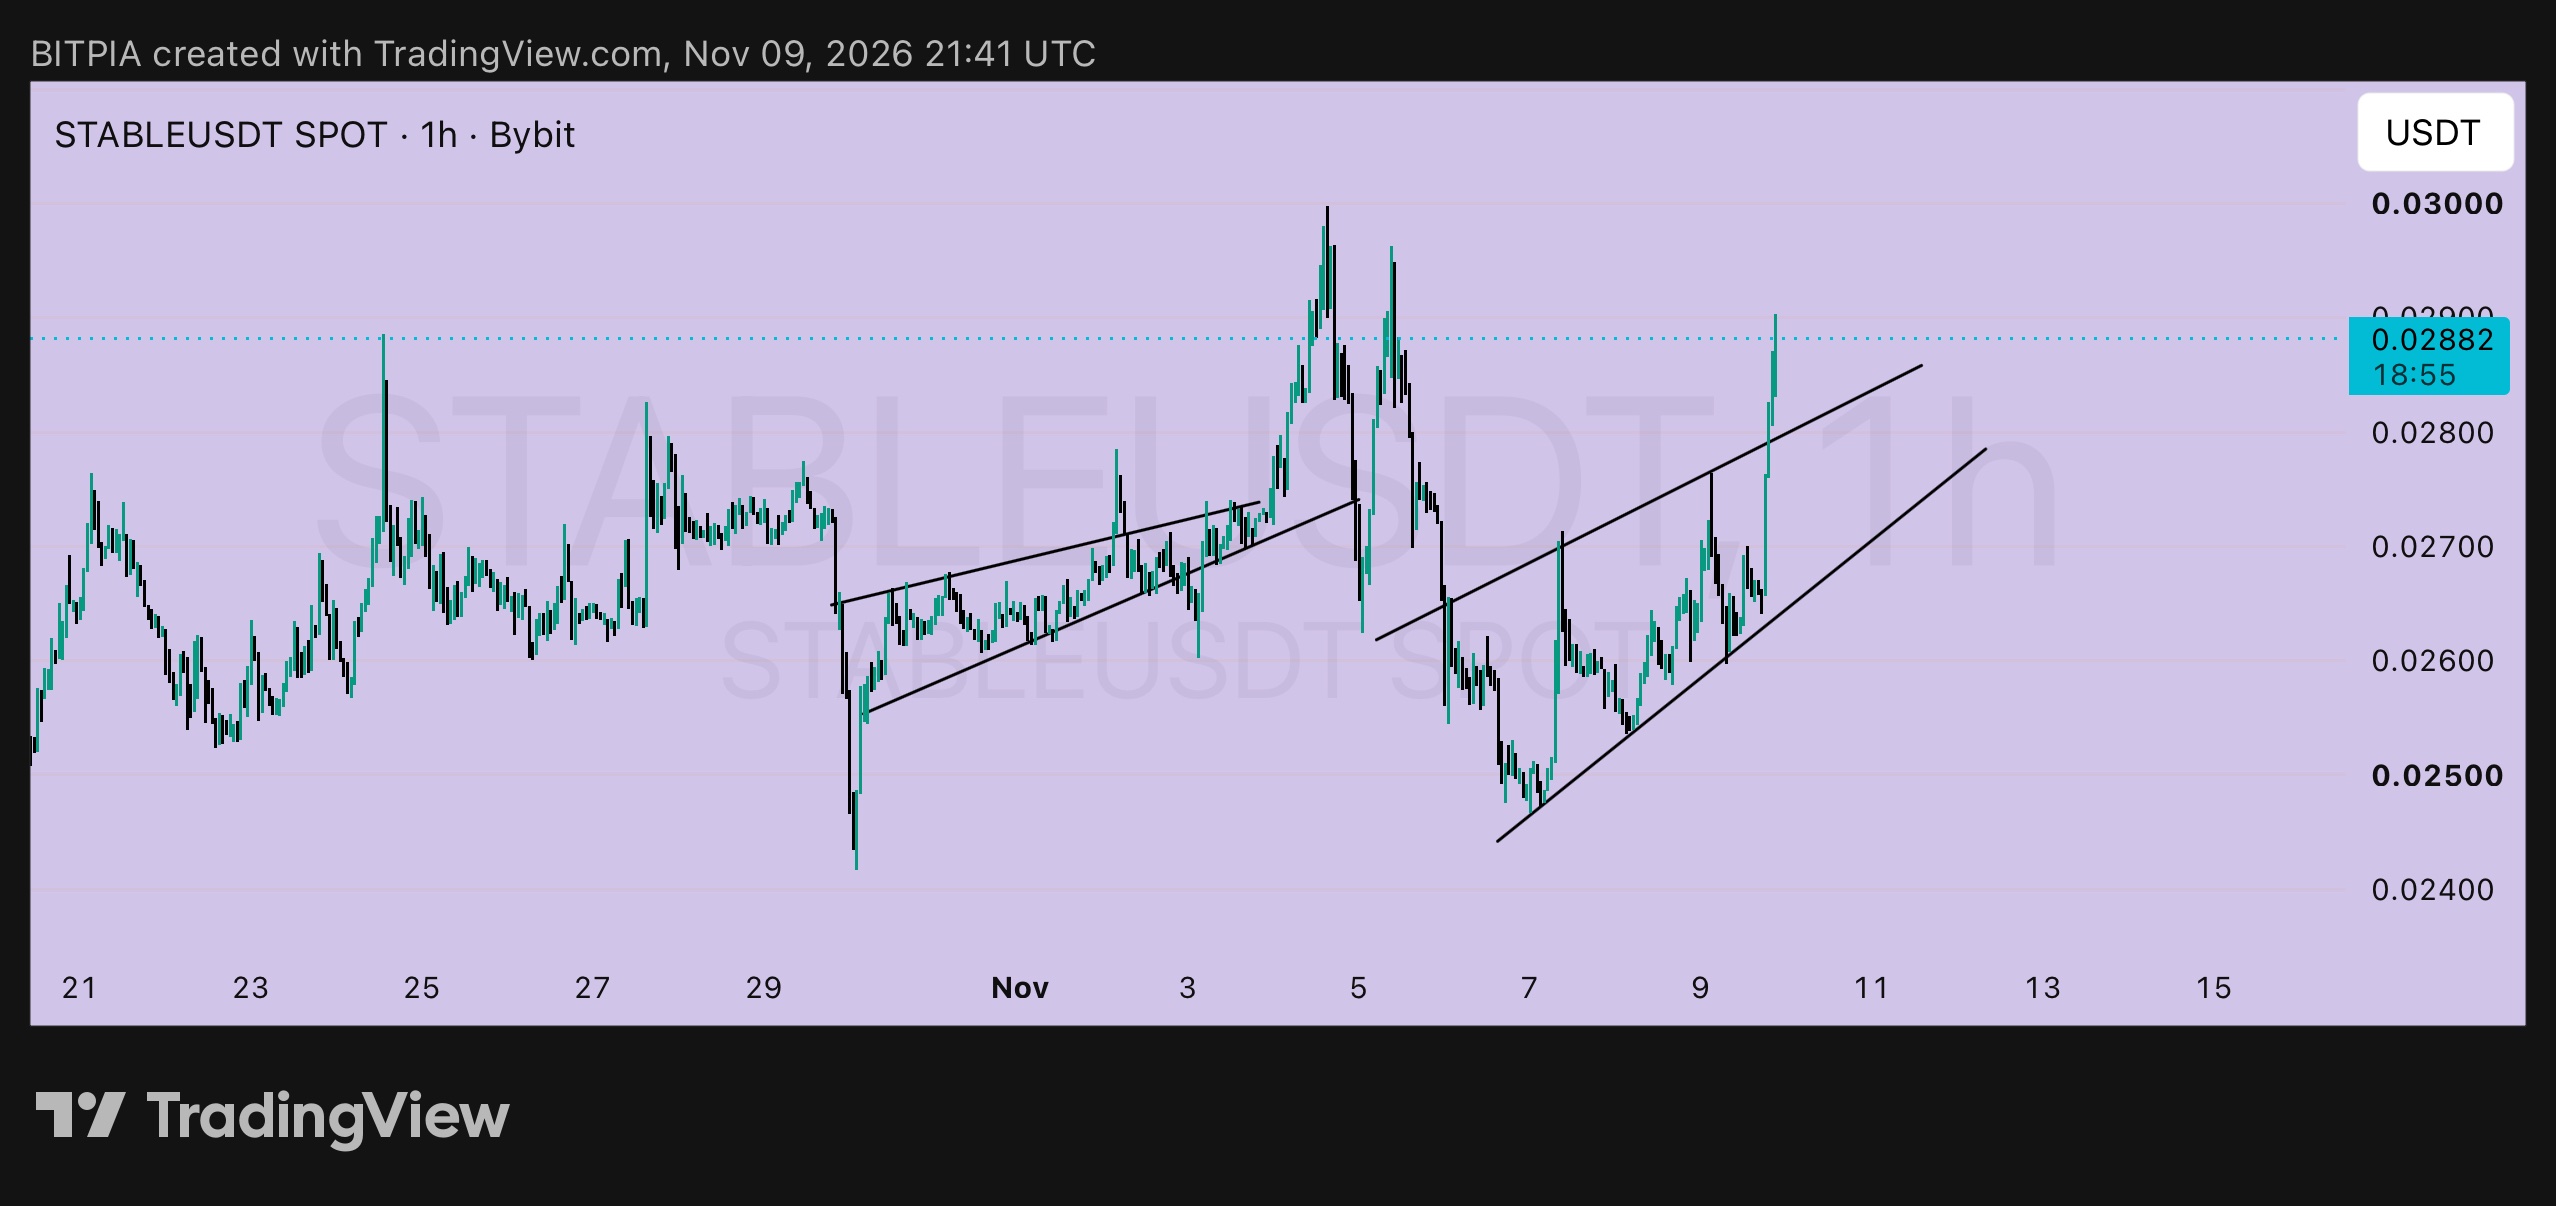
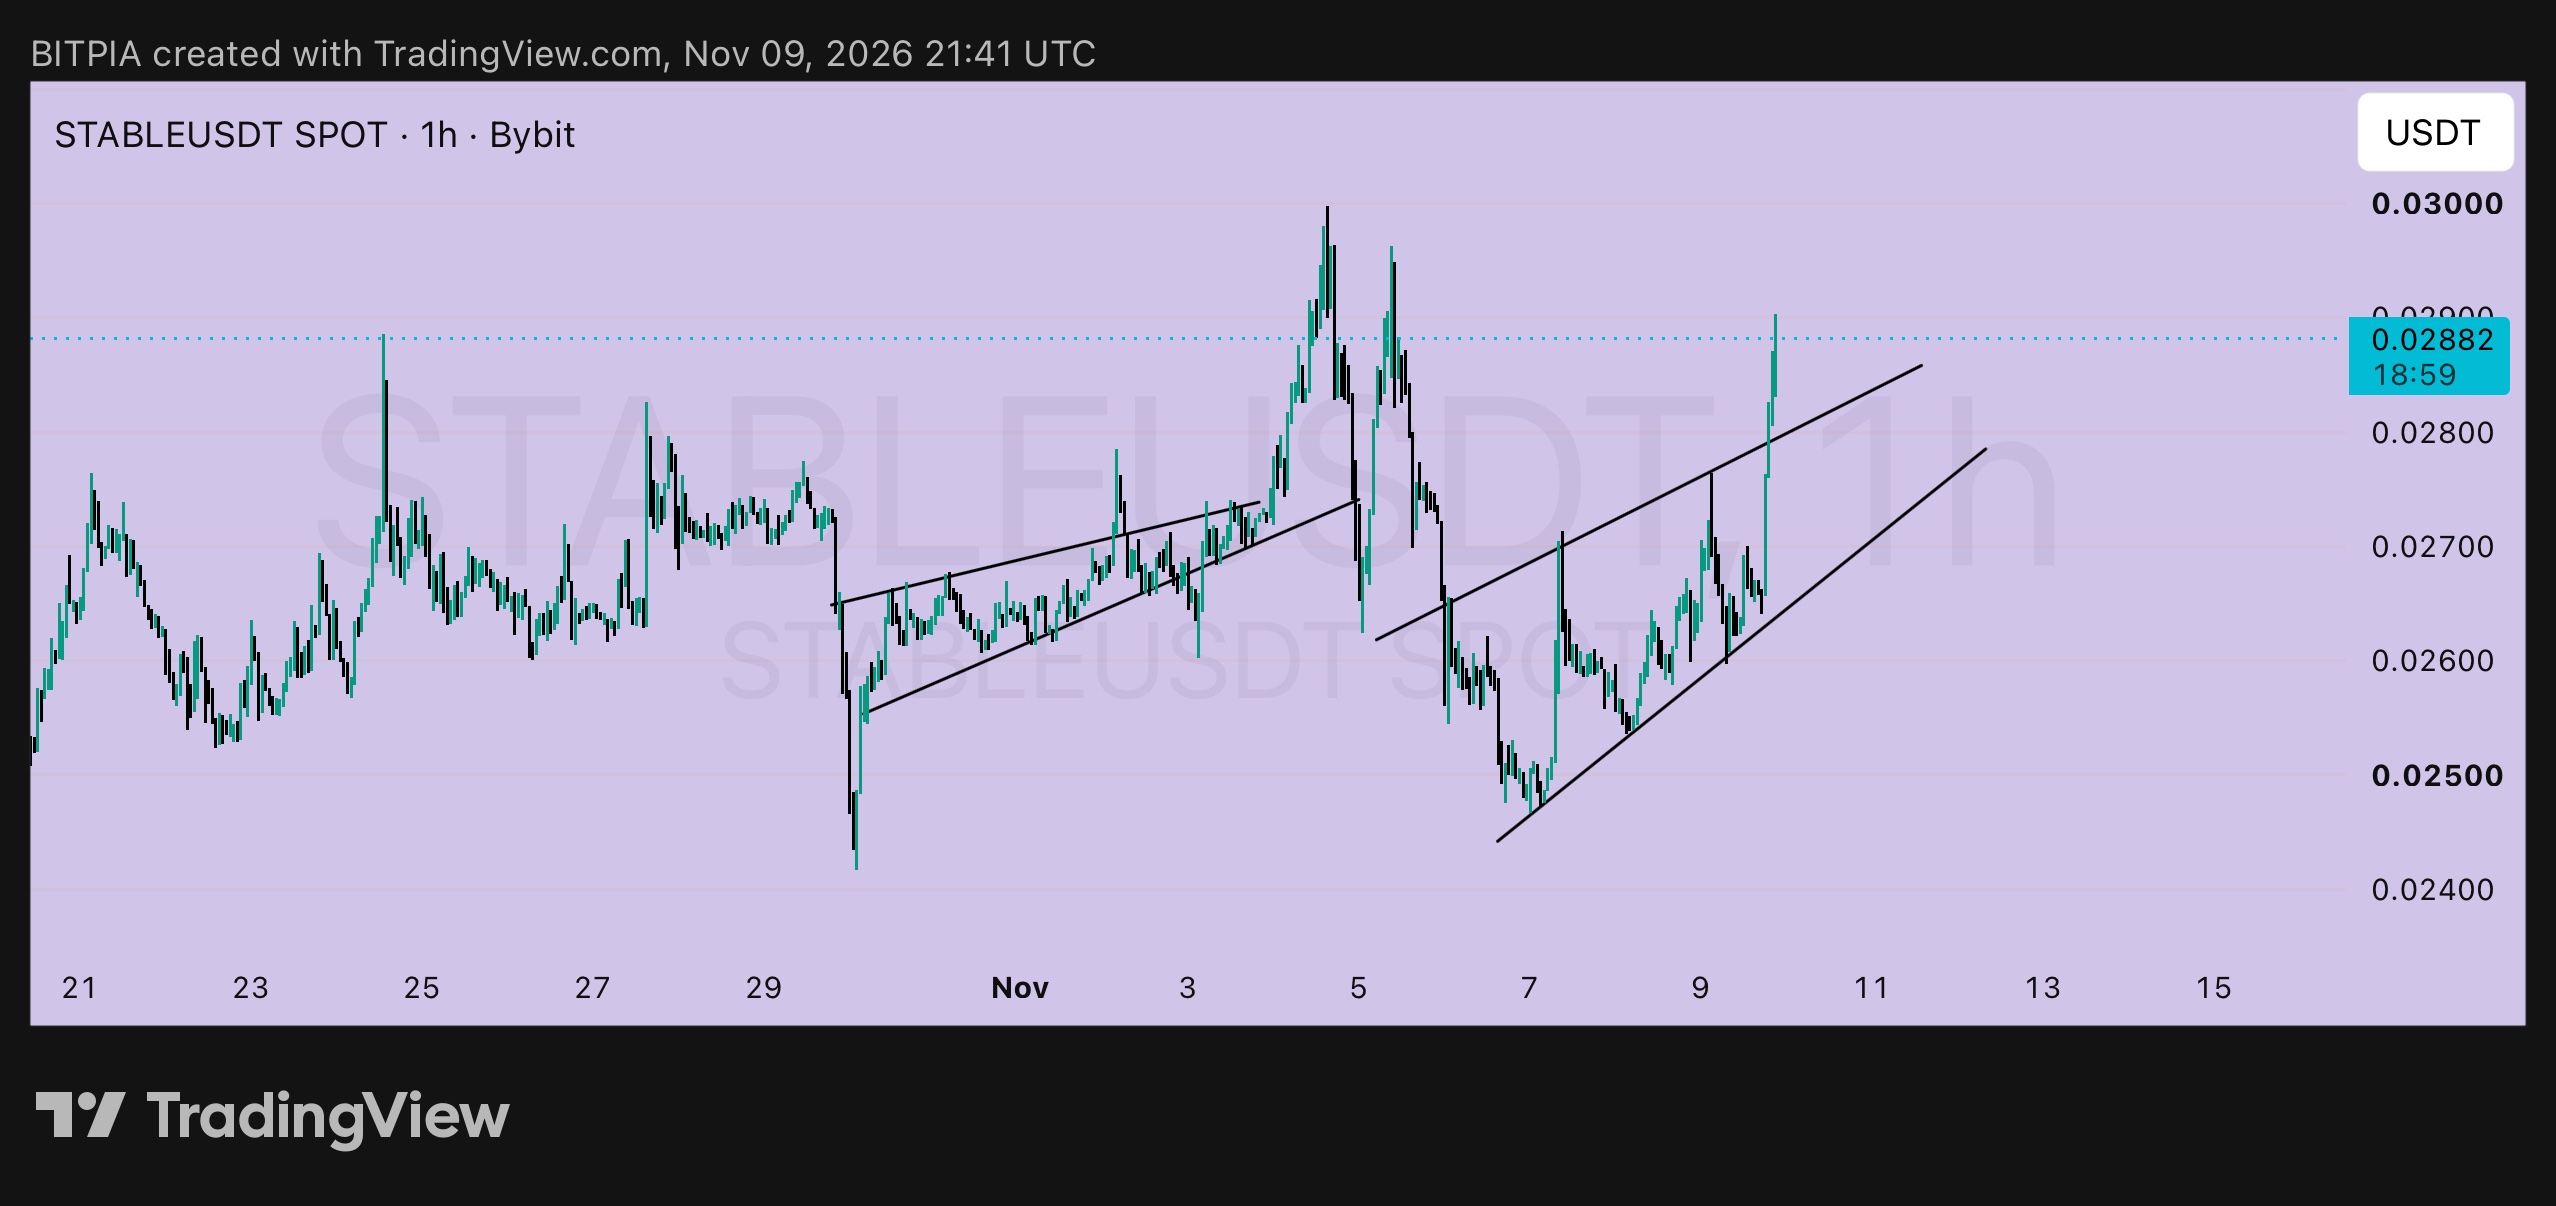
STABLE 1時間足: おやすみプラン 🌙 ラゴスはもう遅いので、$STABLEUSDTの「セット・アンド・フォゲット(設定したら放置)」版です。上昇チャネルをブレイクアウトした後、価格は0.02882。上値ラインは現在0.0280付近でサポートに転換しています。この3つを設定しておけば、一晩中チャートを監視する必要はありません。 ➤ アラート1: 0.0290 ▸ 10月24日の高値レベルであり、11月5日には一度反発(拒絶)された水準 ▸ 1時間足がここで確定すれば、モメンタムは本物 ➤ アラート2: 0.0300 ▸ 11月4日の高値であり、次の大きな節目となるラウンドナンバー ▸ ここを上抜けて確定すれば、ブレイクアウトのトリガー ➤ エントリーアイデア: リテスト狙い ▸ エントリー: 0.0278付近(以前のチャネルライン近辺)、価格が戻ってきてサポートを確認した場合 ▸ ストップロス: 0.0262割れ(チャネル下限ラインの下) ▸ ユニットあたりのリスク: 0.0016 ▸ ターゲット1: 0.0300 (+0.0022、約1.4R) ▸ ターゲット2: 0.0330 (+0.0052、約3.25R) ➤ ブレイクアウト狙い ▸ エントリー: 0.0302付近(0.0300を超えて1時間足が確定した後) ▸ ストップロス: 0.0286割れ ▸ ユニットあたりのリスク: 0.0016 ▸ ターゲット: 0.0330 (+0.0028、約1.75R) および 0.0350 (+0.0048、約3R) ➤ なぜ今買わないのか 現在0.02882でストップを0.0262に置くと、リスクは0.0026。ターゲットの0.0330までは約1.6Rしかありません。また、価格は過去に上値を抑えられた0.0290のすぐ下にあります。今はリテストか、明確なブレイクアウトを待つ方が賢明です。 ➤ 無効となる条件 1時間足がチャネル内に戻り、0.0262を下回った場合はブレイクアウト失敗とみなし、撤退します。 ポジションサイズは小さく、無期限先物を使うならレバレッジは低めで。あとはゆっくり眠りましょう。💙 投資助言ではありません。自身で調査を行い、失ってもよい資金で取引してください。 #ByXIMPACT #WSOT2026
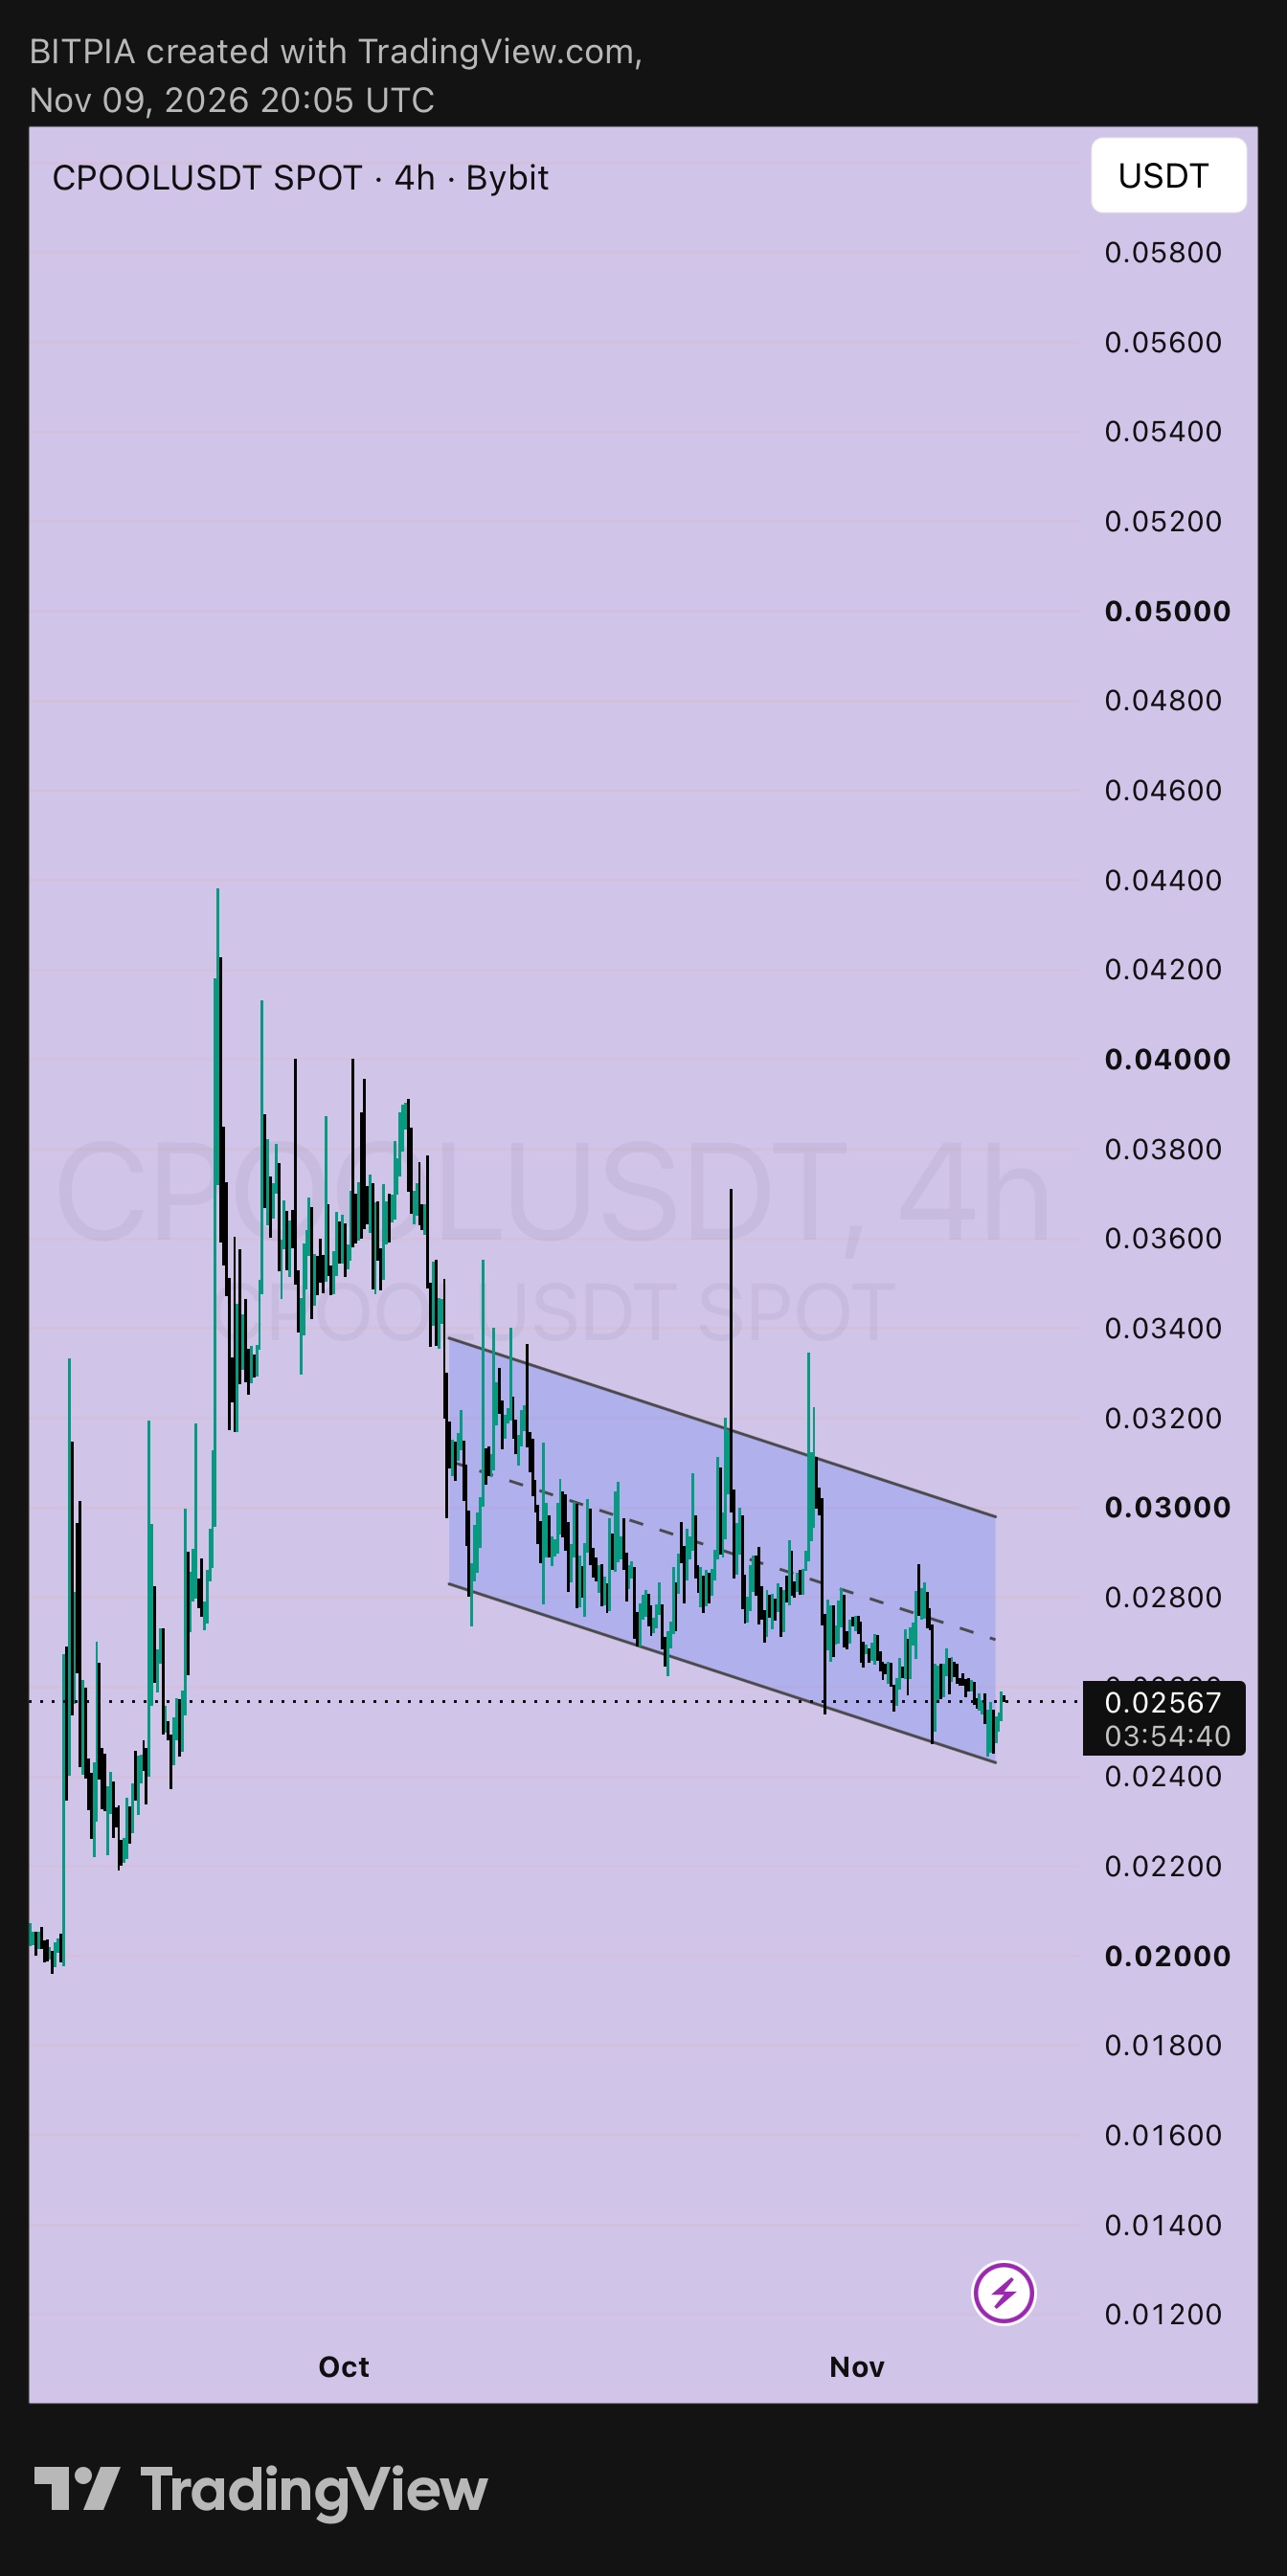
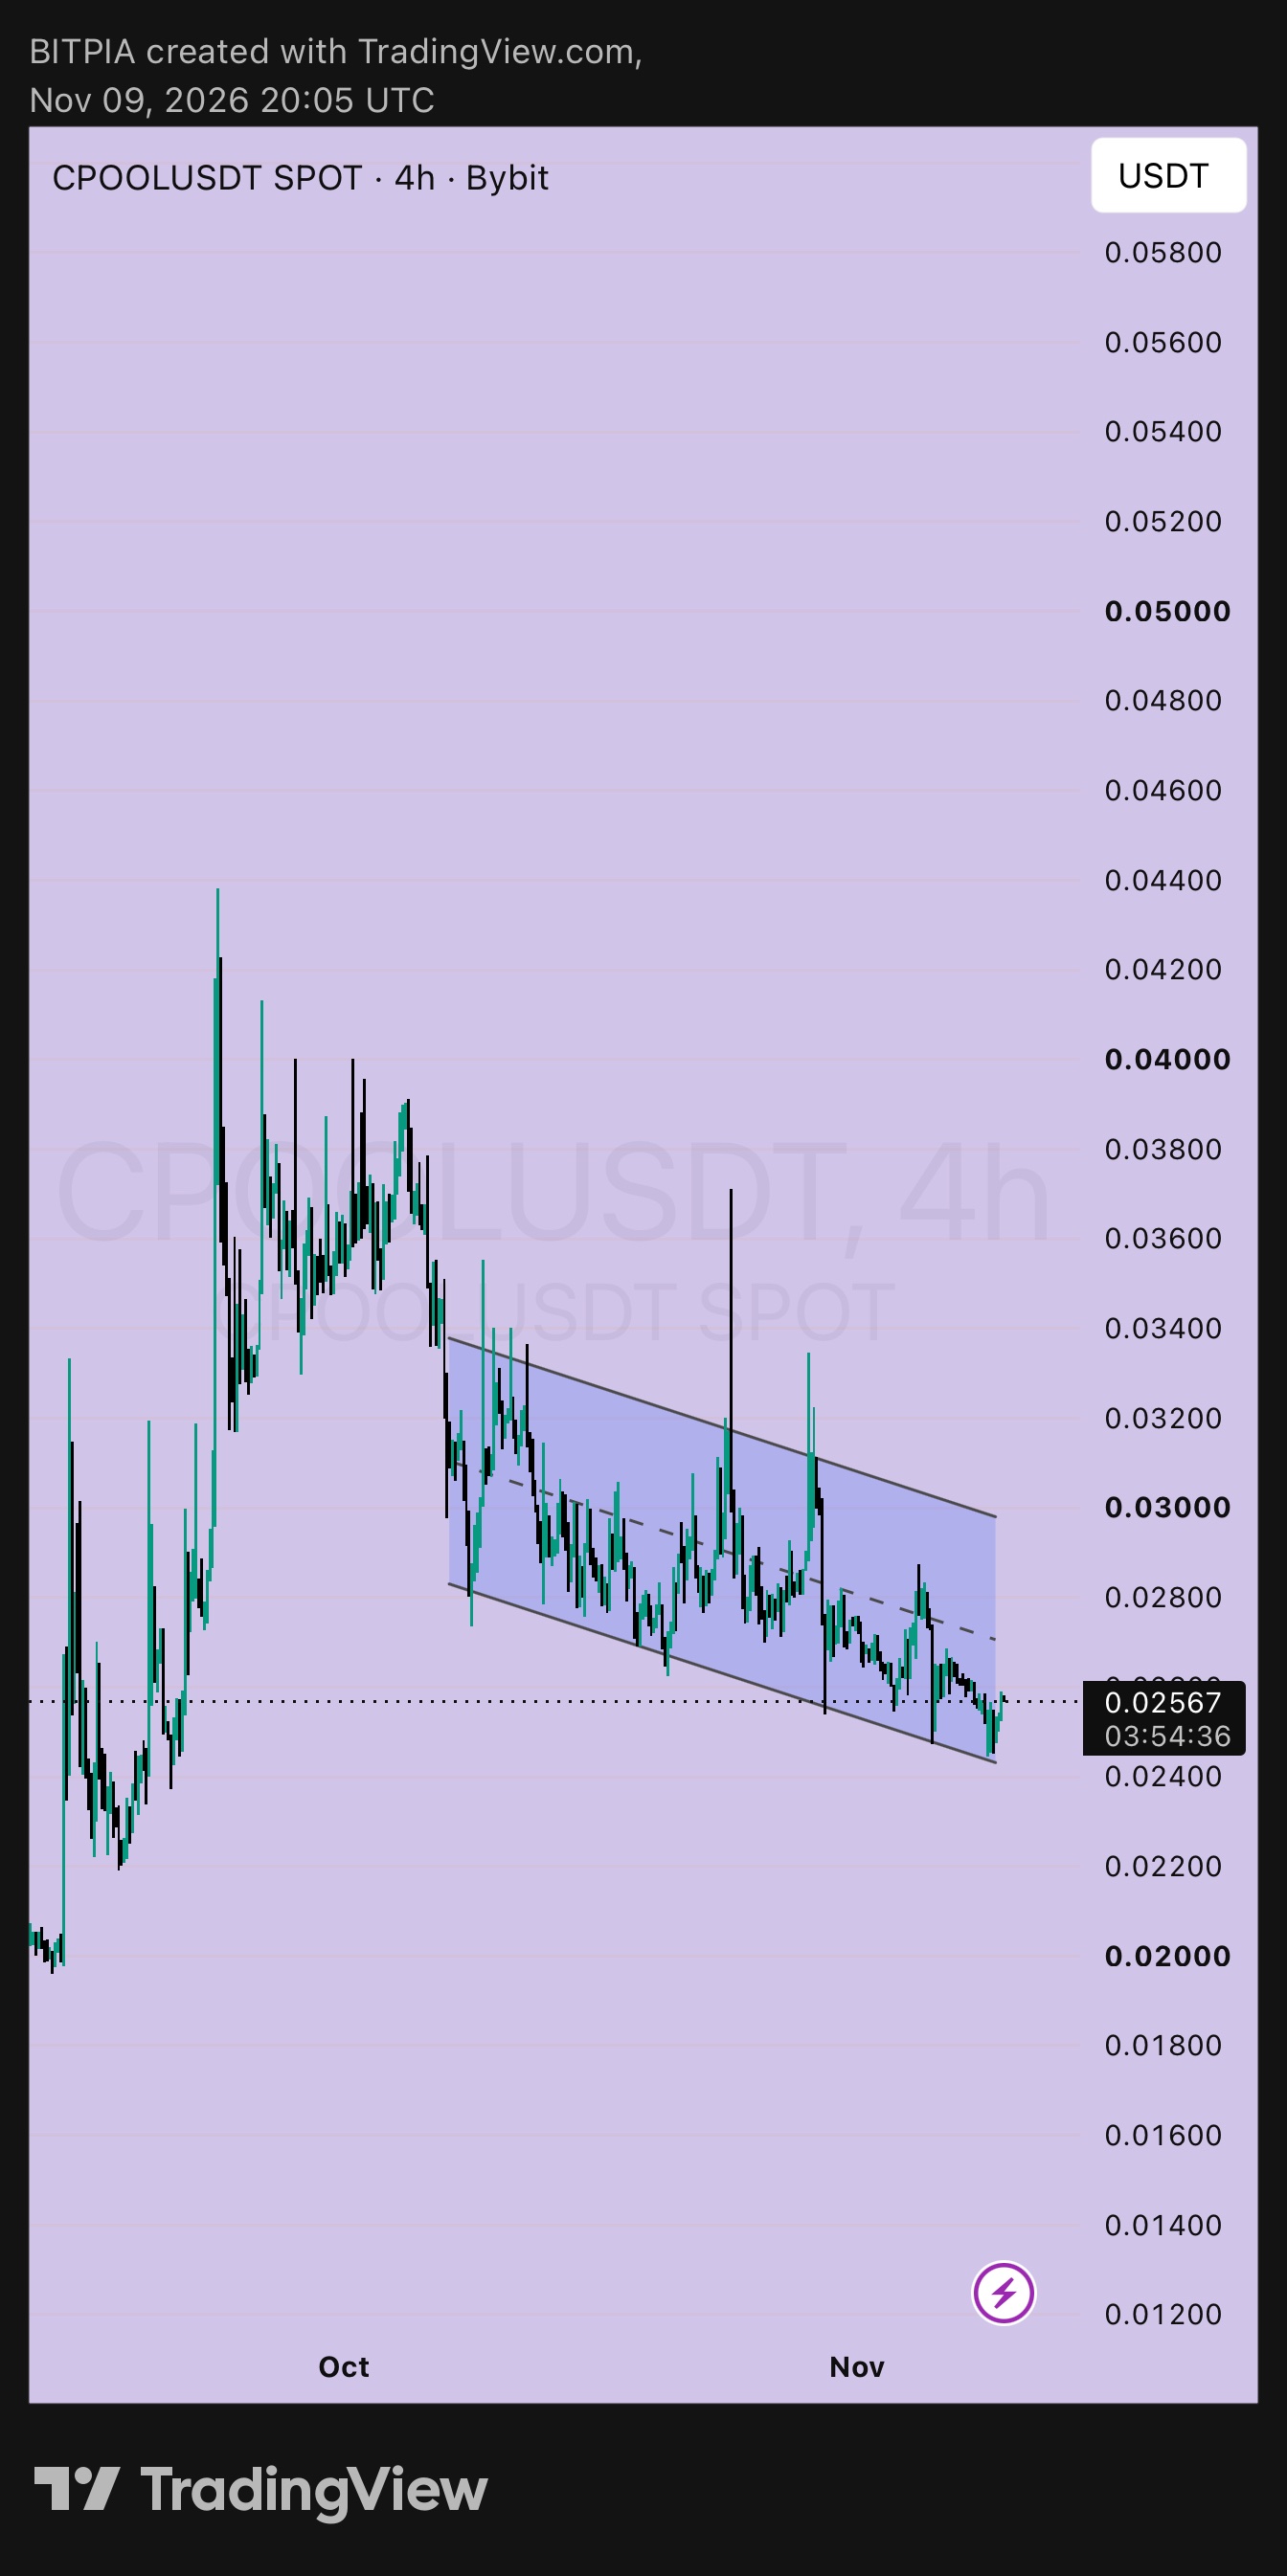
CPOOL 4h: three prices to remember 🔑 I used the latest of your two charts, with price at 0.02567. $CPOOLUSDT has been drifting down inside a falling channel since early October, and price is back near the lower line. If you remember only three prices on this chart, make it these. ➤ 0.0245: the floor ▸ The lower line and the recent lows, which buyers have defended several times ▸ Below it, the next area is the 0.0200 to 0.0220 base from September ➤ 0.0270: the middle ▸ The dashed centre line of the channel, and the first place I'd expect sellers ▸ It's also my first target ➤ 0.0300: the ceiling ▸ The upper line of the channel, with the older highs sitting above it at 0.0336 and 0.0370 ▸ A 4h close above it would be the first real sign that the channel is over ➤ Plan A: near the floor ▸ Entry: around 0.0250 ▸ Stop-loss: below 0.0235 ▸ Risk per unit: 0.0015 ▸ Target 1: 0.0270, +0.0020, about 1.3R ▸ Target 2: 0.0300, +0.0050, about 3.3R ▸ Target 3: 0.0340, +0.0090, about 6R ➤ Plan B: after the breakout ▸ Entry: around 0.0305, after a 4h close above 0.0300 ▸ Stop-loss: below 0.0280 ▸ Risk per unit: 0.0025 ▸ Targets: 0.0340 (about 1.4R) and 0.0370 (+0.0065, about 2.6R) ➤ Chase math At 0.02567 with the same stop, risk is 0.0022, and 0.0300 is about 2R away. Not terrible, but Plan A gives a better price if the floor is retested. ➤ What cancels it A 4h close under 0.0235 means the channel's lower line has failed. I'd step aside and watch the 0.0200 to 0.0220 base instead of guessing. Small size, and low leverage if you use perps. Not financial advice. Do your own research and only risk what you can afford to lose. #ByXIMPACT #WSOT2026
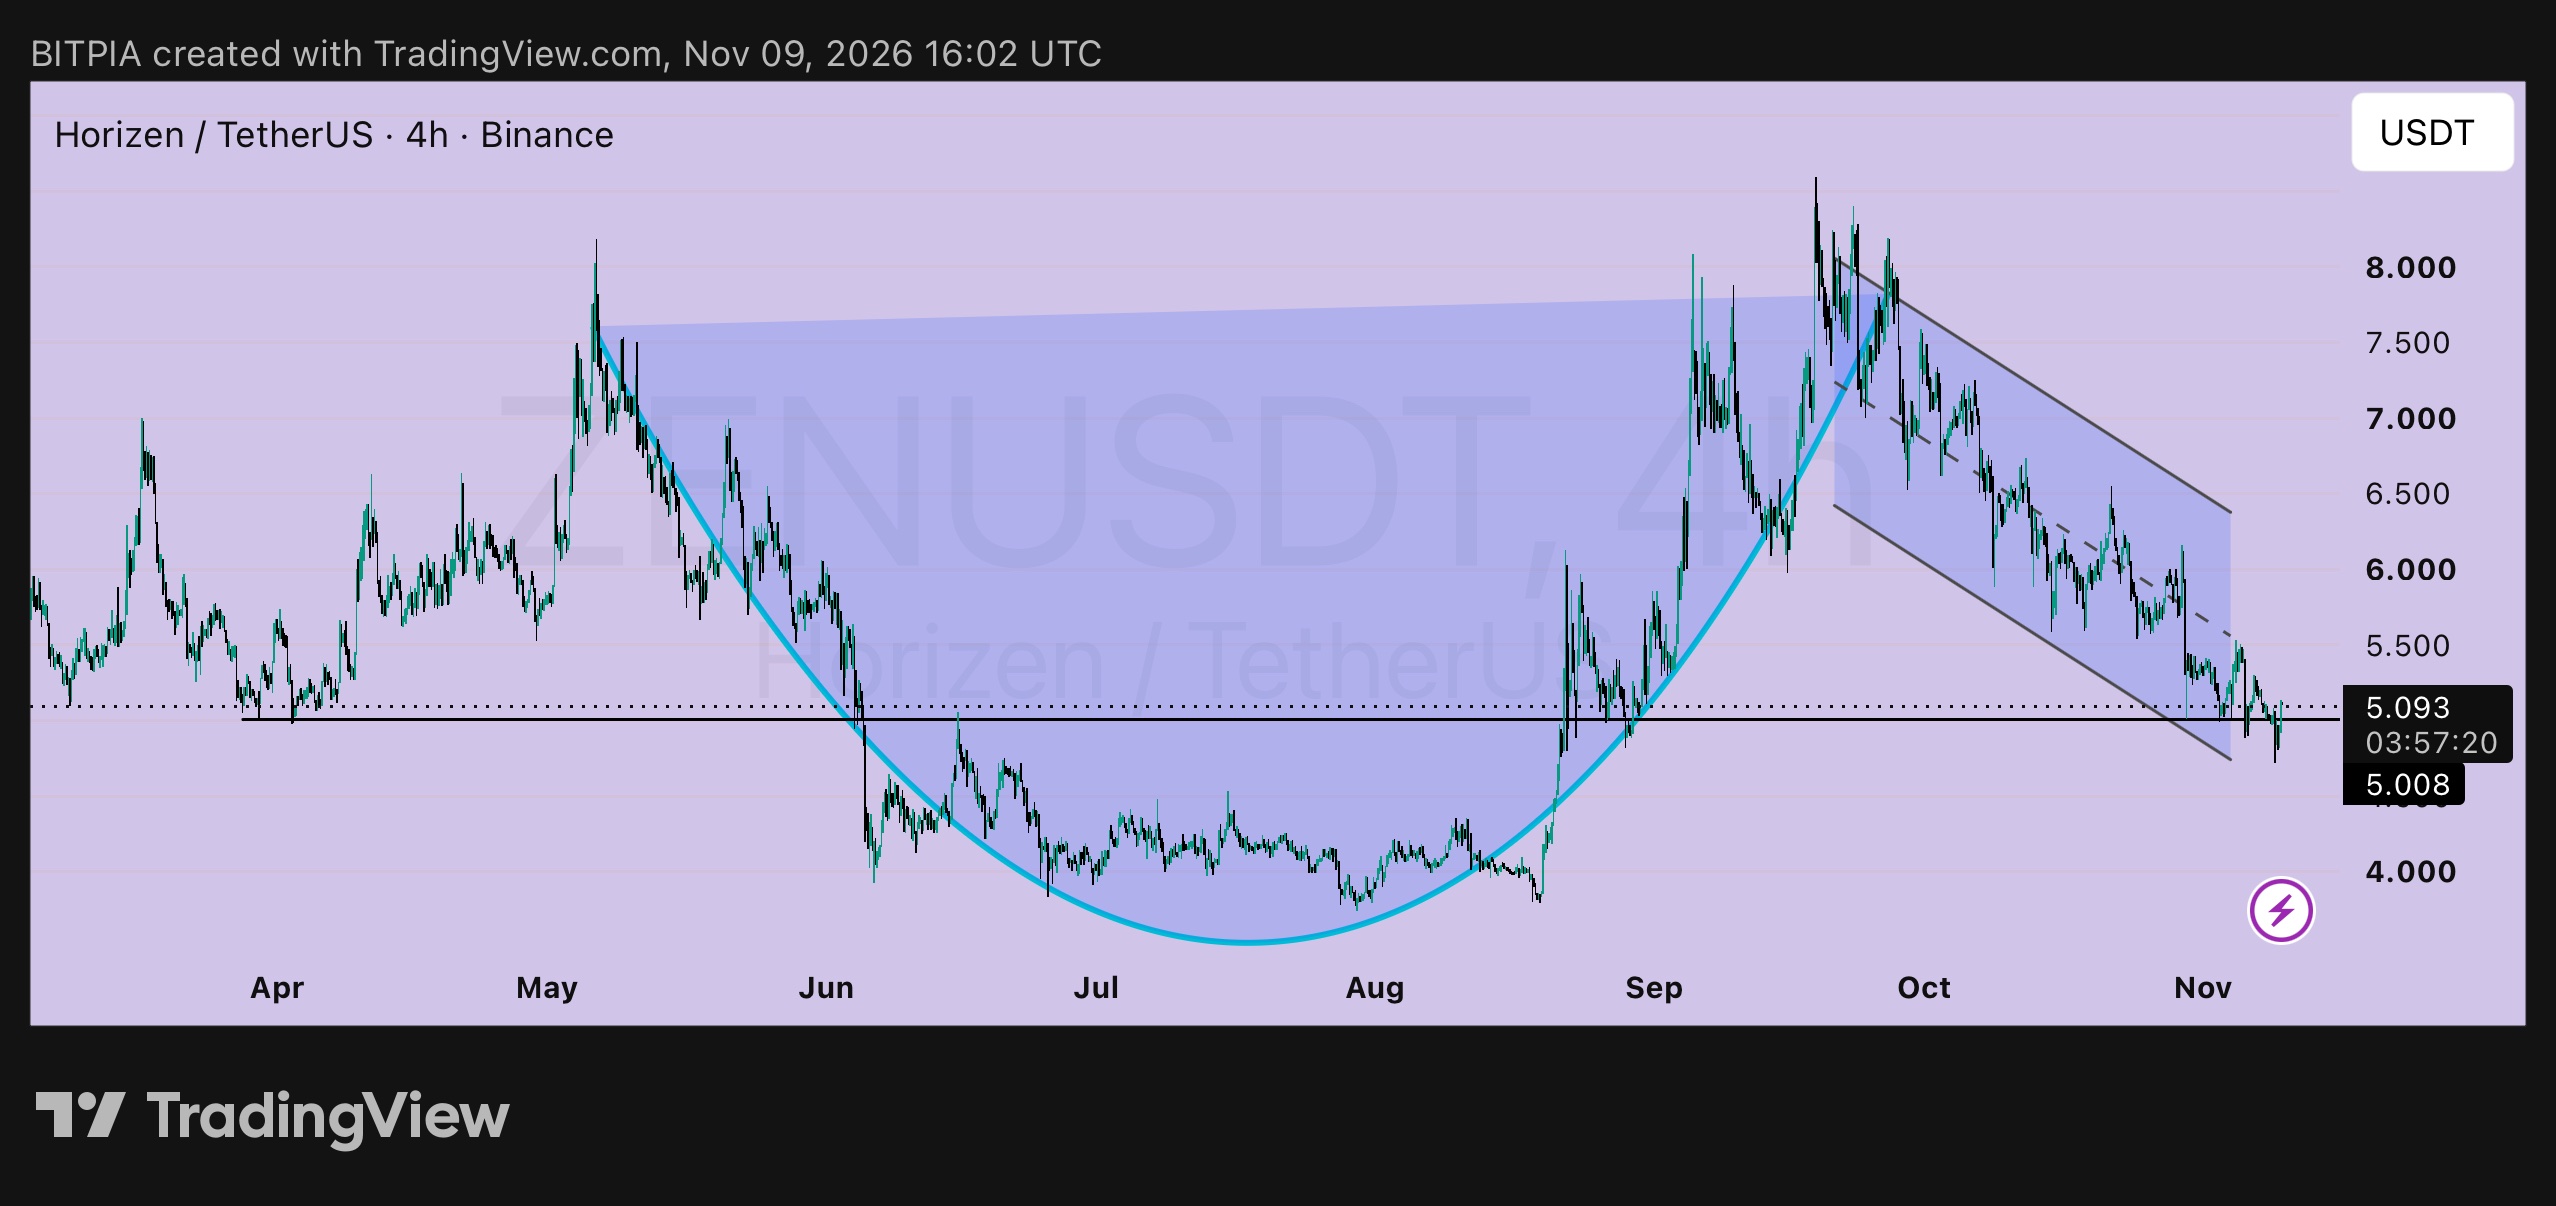
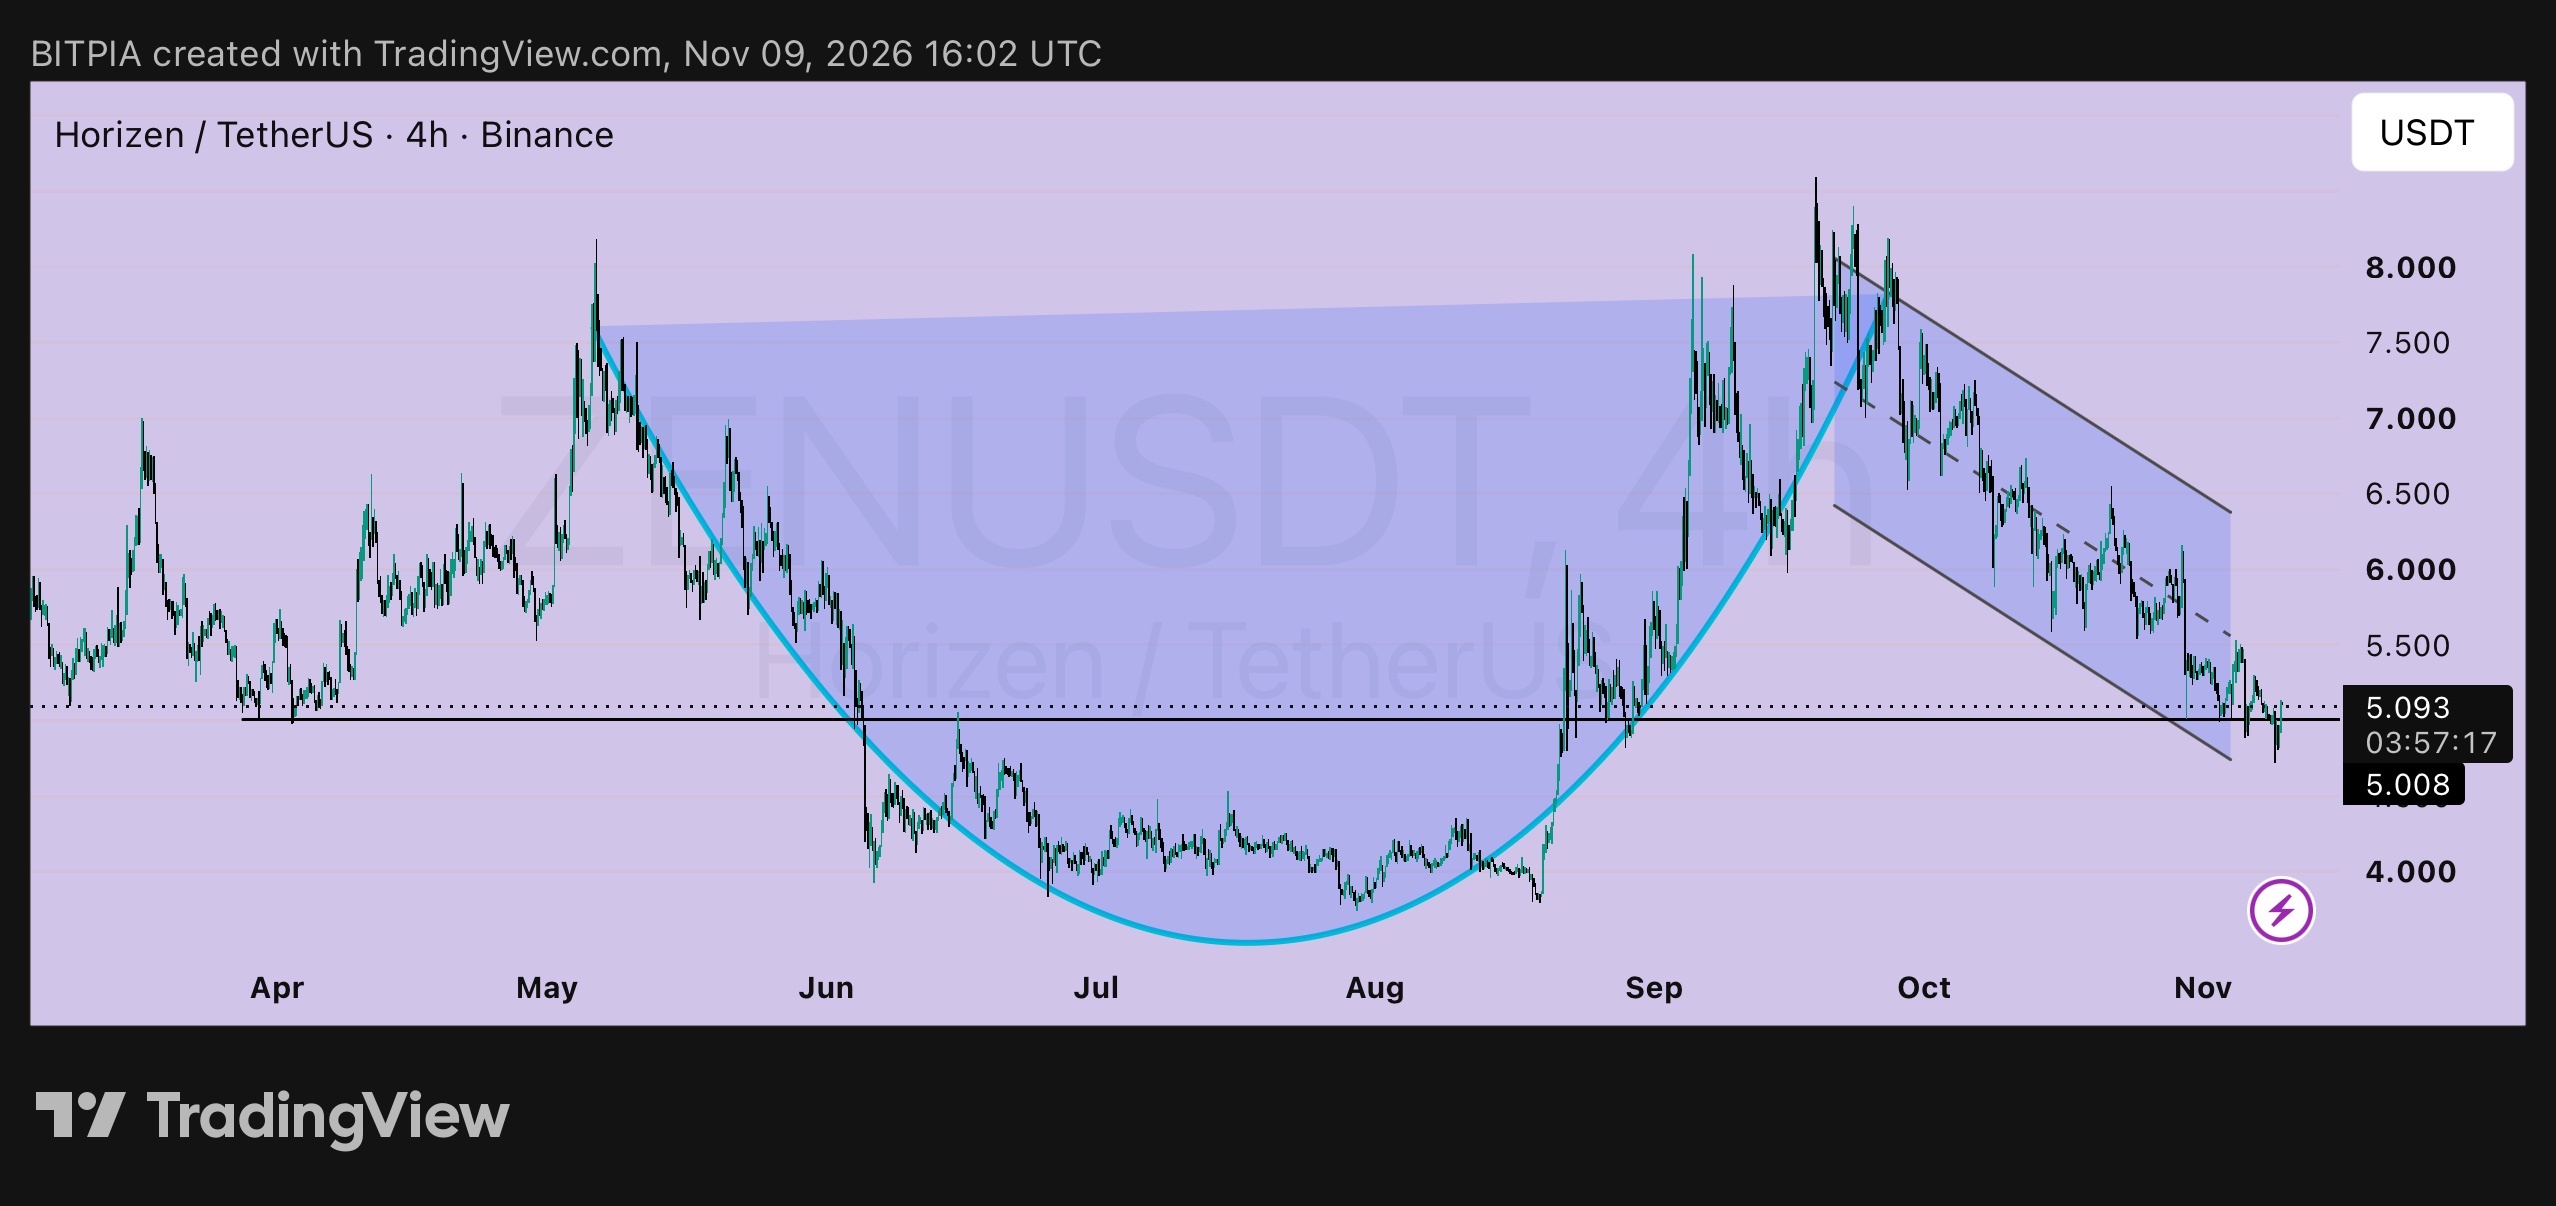
$ZEN: two timeframes, one story 🔭 I posted the daily $ZENUSDT chart on Nov 6 at 5.231 with a cup and handle plan. Now the 4h chart is at 5.093, so here's how the two views fit together. ➤ The daily view (the big picture) ▸ A rounded base from May to September, then a handle drifting down in a falling channel ▸ The cup rim sits near 7.8, and a daily close above the channel top near 6.4 would be the first sign of a breakout ▸ My early plan: entry 5.05, stop 4.65, risk 0.40 ➤ The 4h view (the details) ▸ Price is sitting on 5.008, the horizontal level that held in April and again in early September ▸ The dip this session reached about 4.97 and recovered, so buyers defended the level once more ▸ The channel's lower line sits just under, near 4.85 to 4.90 ➤ How they fit The handle looks like it's testing its lower end. If 5.008 holds and the 4h chart starts making higher lows, the early entry is working. If it doesn't, the 4.65 stop is there to keep the loss small. ➤ If you entered at 5.05 ▸ About +0.04, essentially flat ▸ Stop-loss stays at 4.65. I'm not tightening it just because price is near the level ▸ Targets: 6.40 (+1.35, about 3.4R) and 7.80 (+2.75, about 6.9R) ➤ If you're waiting for proof ▸ Trigger: a 4h close above 5.50 ▸ Entry: around 5.55 ▸ Stop-loss: below 5.00 ▸ Risk per unit: 0.55 ▸ Targets: 6.40 (about 1.5R) and 7.80 (+2.25, about 4.1R) ➤ What cancels it A 4h close under 4.85 would mean the 5.008 level and the channel's lower line have both failed, and I'd step aside. The daily plan fails below 4.65. Daily patterns take weeks, so small size, and low leverage if you use perps. Not financial advice. Do your own research and only risk what you can afford to lose. #ByXIMPACT #WSOT2026