Mdleganttop1
40770いいね10シェア862ファン6フォロー
💹 Bybit Square | Trade Smart, Earn Big 🚀 Crypto Moves | Bybit Square Hustler 💎 Trade 💰 Learn 📚 Grow 🌱 | Bybit Square 📈 Market Insights & Smart Trading | Bybit S
💹 Bybit Square | Trade Smart, Earn Big 🚀 Crypto Moves | Bybit Square Hustler 💎 Trade 💰 Learn 📚 Grow 🌱 | Bybit Square 📈 Market Insights & Smart Trading | Bybit S
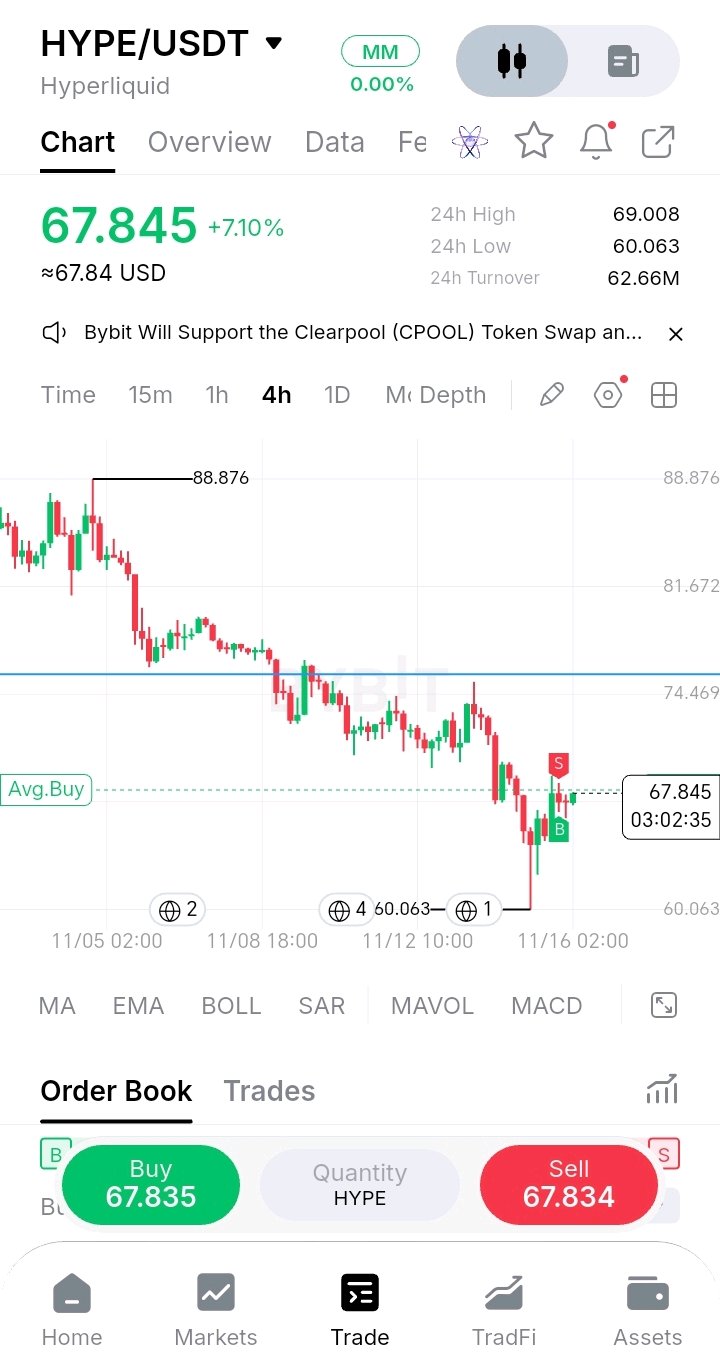
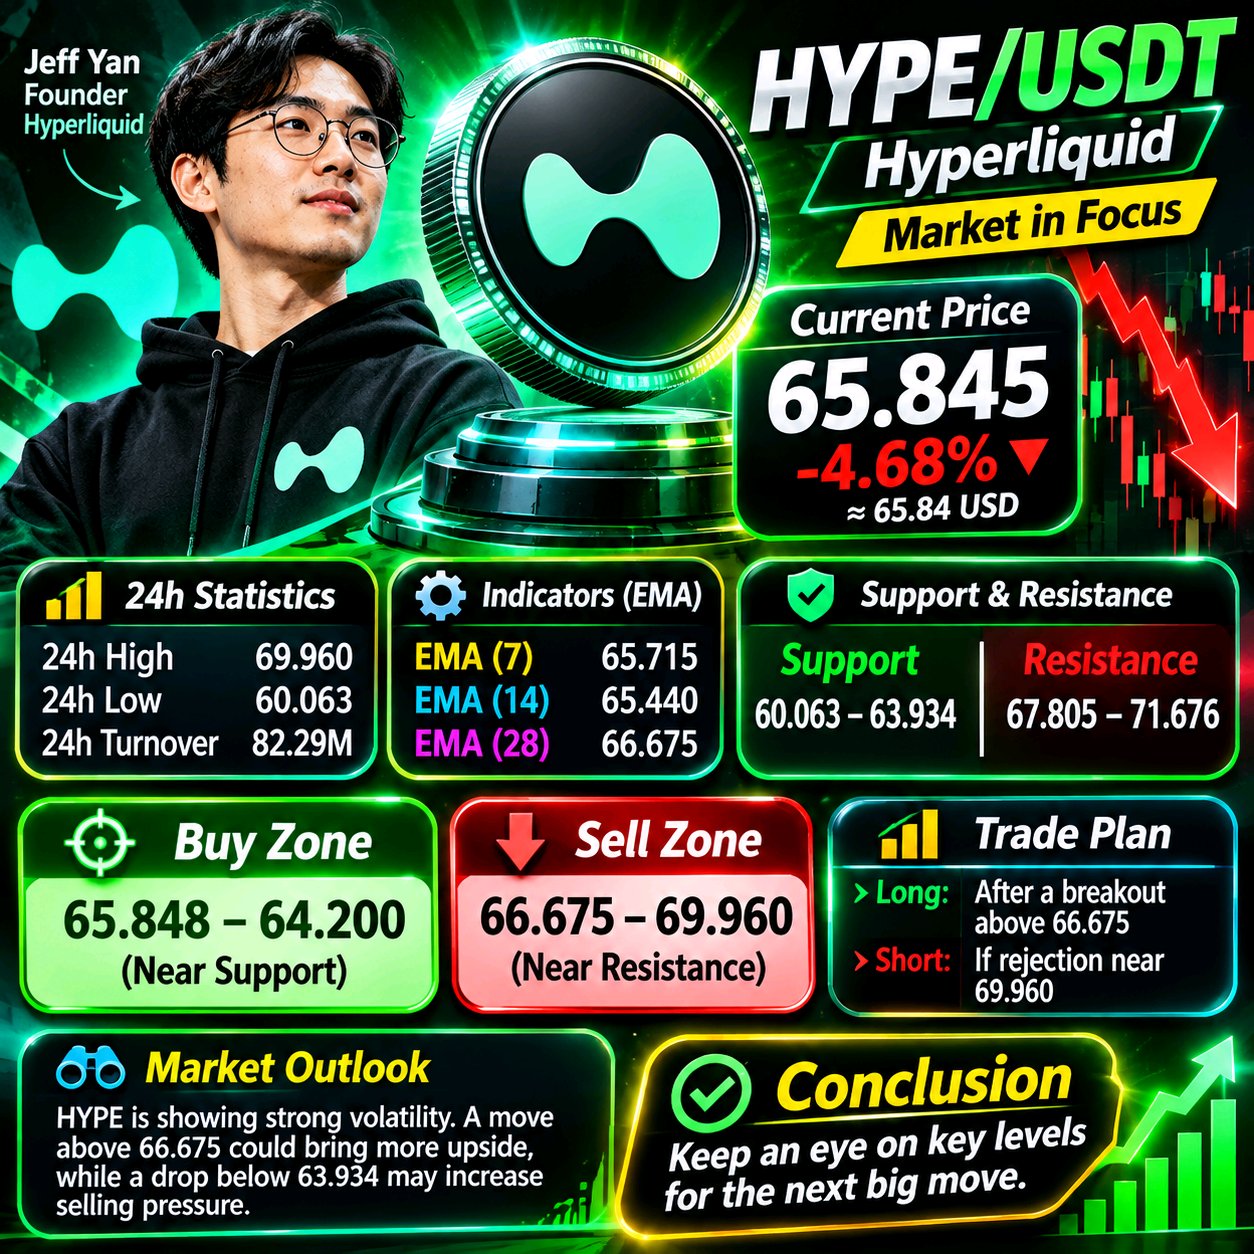
HYPEが7.1%の反発 — これが転換点となるか? Hyperliquidは長期的な下落を経て、強い回復の兆しを見せています。HYPEは一時$60.063付近で鋭く反発した後、$67.845まで上昇し、24時間で7.10%の上昇を記録しました。直近の陽線は買い手が戻ってきていることを示唆していますが、一度の強い反発だけでは、完全なトレンド転換が確定したとは言えません。 【市場構造】 4時間足チャートでは依然として広範な弱気構造が続いており、価格は以前$88.876から下落していました。しかし、今回の反発は直近の安値付近で需要が発生したことを示しています。 短期サポート:$65.00 – $63.00 主要サポート:$60.063 短期レジスタンス:$69.008 主要レジスタンス:$74.469 【強気シナリオ】 $69.008を上回って維持できれば、買い手にとって$72.00や$74.469のレジスタンス圏に挑戦するチャンスが生まれます。ブレイクアウトに成功し、リテストが行われれば、回復シナリオがより確かなものになるでしょう。 【回復が失敗する場合】 もしHYPEが$65のエリアを割り込み、売り圧力が強まれば、反発は弱まる可能性があります。さらなる調整により、$63の領域、最終的には$60.063が再び意識されることになるでしょう。 【私の市場見通し】 興味深いのは単なる7%の上昇という点ではなく、HYPEが直近の安値に到達した後の反応です。買い手は最初の一手を打ちましたが、依然として上値のレジスタンスを克服する必要があります。私は勢いに乗って追随するよりも、確認を取ることを優先し、リスク管理を徹底したいと考えます。 HYPEは$74に向けて回復するのでしょうか、それとも売り手がこの反発を阻むのでしょうか? #HYPE #Hyperliquid #仮想通貨市場 #WSOT2026 #WSOTあなたのAI取引を見せて10USDTを獲得 #ジェンスン・ファン、NvidiaのAIリーダーシップを試す出口戦略 #米PPIが「高金利長期化」取引を試す #米国のインフレ率は高止まりし、利上げ観測が高まる $HYPEUSDT $BTCUSDT

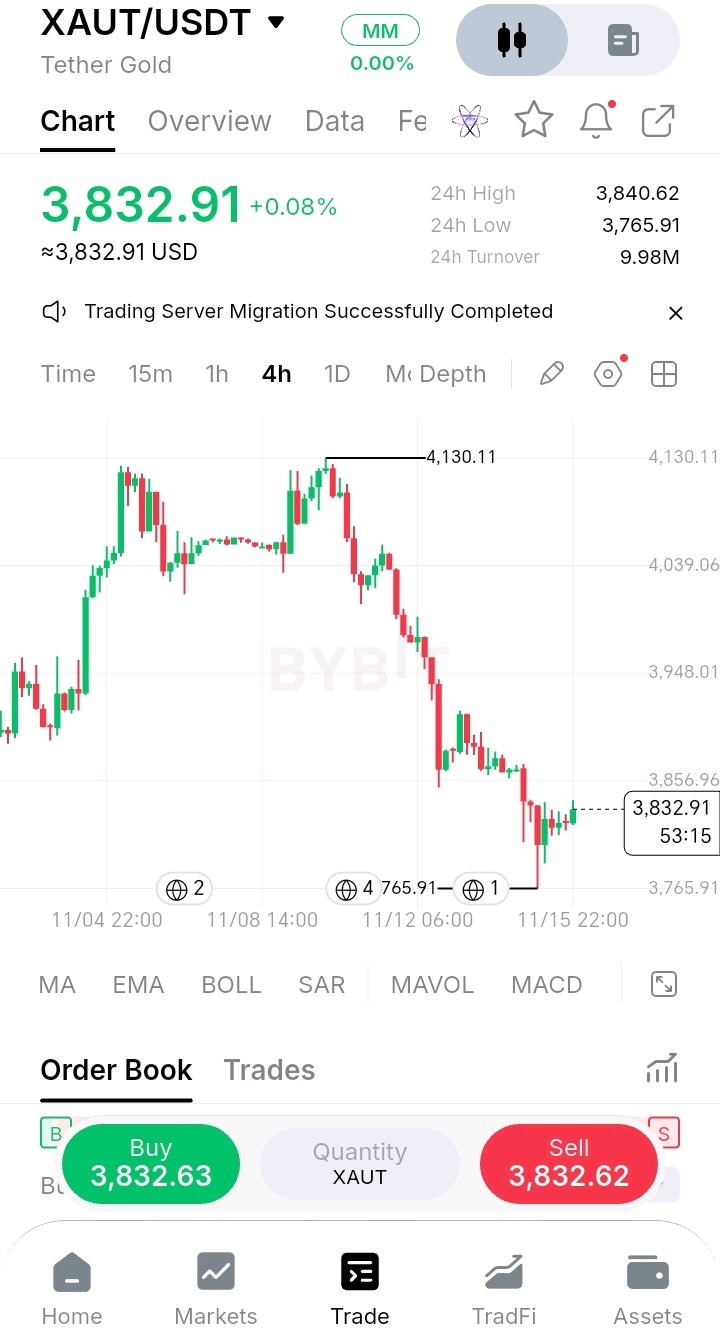
🏔️ ダブルトップが機能して、そのまま下落が続きましたね。 最初の反発が見た目には綺麗だからといって、$XAUTの底打ちだと決めつけたくはありません。4時間足が3,872.51を超えて引けるのを確認したいところです。そこはかつてのベースラインであり、今はレジスタンス(抵抗線)として機能しているからです。 4時間足チャートから読み取れることは以下の通りです: 🔹 ダブルトップ:金(ゴールド)は4,125付近でピークを迎え、4,005あたりまで下落し、その後再び戻して4,130.11で天井をつけました。同じ水準で2回高値をつけ、その間に安値があるという、典型的なダブルトップの形です。 🔹 下抜け:価格がネックラインの4,005を割り込んだ時点で、パターンが確定しました。この規模のパターンから導き出される通常の目標値は、およそ3,880です。 🔹 オーバーシュート:金はそこを大きく割り込み、4,130の高値から約8.8%下落した3,765.91の安値までいきました。教科書的な目標値を大きく超える動きとなりました。 🔹 反発:安値から価格は約1.8%回復し、3,832.91まで戻しました。最初の反発は3,910付近まで、次は3,870まで届きましたが、直近のものはより小さく、値幅も狭まっています。 🔹 かつてのベースライン:以前の3,872.51という水準が現在、価格の上値にあります。サポートを割り込むと、最初の再テスト時にはそれがレジスタンスに変わることがよくあります。 🔹 レンジ:24時間の高値は3,840.62、安値は3,765.91で、取引高は998万です。売りが殺到した時と比べると、市場は落ち着きを取り戻しました。 🟢 強気シナリオ:4時間足が3,872.51を上回って引け、その後3,948を目指す展開。そうなれば、下落が始まったエリアを買い手が奪還したことを意味します。 🔴 弱気シナリオ:4時間足が3,765.91を下回って引ける展開。チャート上、これより下に明確なサポートはありません。 チャートパターンは目標値を示すものであり、保証ではありません。一つオーバーシュートすれば、次に注目すべき水準は、直前に割り込んだ水準です。 皆さんは$XAUTや他のコインを監視していますか? #XAUT #Gold #Crypto #BinanceSquare #WSOT2026 #WSOTあなたのAI取引を見せて10USDTを獲得 #ジェンスン・ファン、NvidiaのAIリーダーシップを試す出口戦略 #米PPIが「高金利長期化」取引を試す #米国のインフレ率は高止まりし、利上げ観測が高まる $XAUTUSDT $BTCUSDT

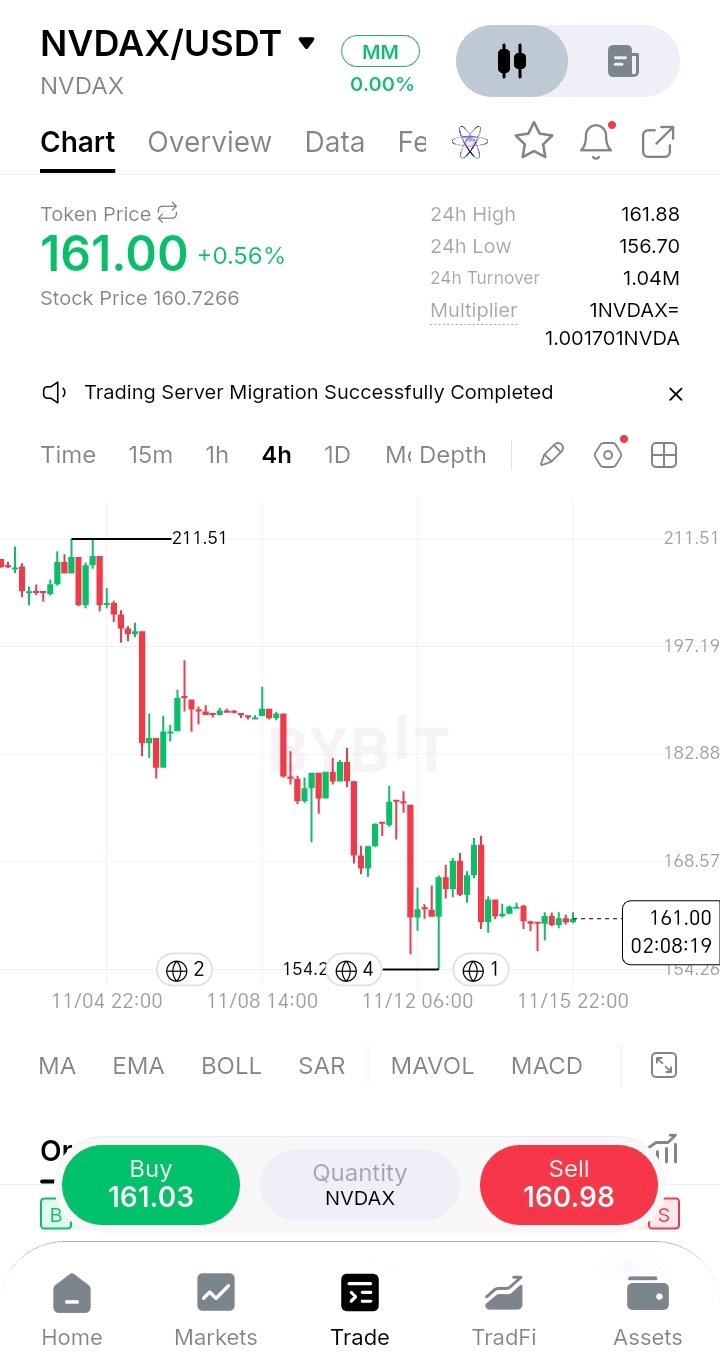
🧘 After a 27% slide, $NVDAX has gone almost silent. I don't want to call a bottom on $NVDAX just because candles got small. I want to see a 4H close above 168.57, because that's the first marked level that would break the sequence of lower highs. Here's what the 4H chart shows: 🔹 The slide: From the 211.51 high, price dropped to a low of about 154.2, roughly 27%, in a staircase of lower highs and lower lows. That's also well below the 186.64 close from the last NVDA chart. 🔹 The bounce: After the low, price recovered to the low 170s, was rejected, and has since pulled back to 161.00. 🔹 The silence: The last several candles are tiny and tightly packed. The 24H range is only 156.70 to 161.88, about 3.3%, so the market is waiting. 🔹 The token vs the stock: The token price is 161.00 and the underlying stock price is 160.7266, a gap of about 0.17%. The multiplier is 1 NVDAX = 1.0017 NVDA, so the token tracks the stock closely. 🔹 The market: $NVDAX trades around the clock, so it can move on weekends and overnight when the regular stock market is closed. 24H turnover is 1.04M. 🟢 Bullish: a 4H close above 168.57, then the low 170s where the last bounce failed. That would break the pattern of lower highs. 🔴 Bearish: a 4H close under 156.70 puts the 154.2 low back in play, with no marked support below it on this chart. Quiet charts after a big drop are decisions waiting to happen. The first close outside the range usually picks the side. Are you watching $NVDAX or another stock? #NVDAX #NVIDIA #Crypto #BinanceSquare #WSOT2026 #WSOTShowYourAITradeToEarn10USDT #JensenHuangExitTestsNvidiasAILeadership #USPPITestsTheHigherForLongerTrade #USInflationRunsHotAndRateHikeBetsRise $NVDAXUSDT $HYPEUSDT

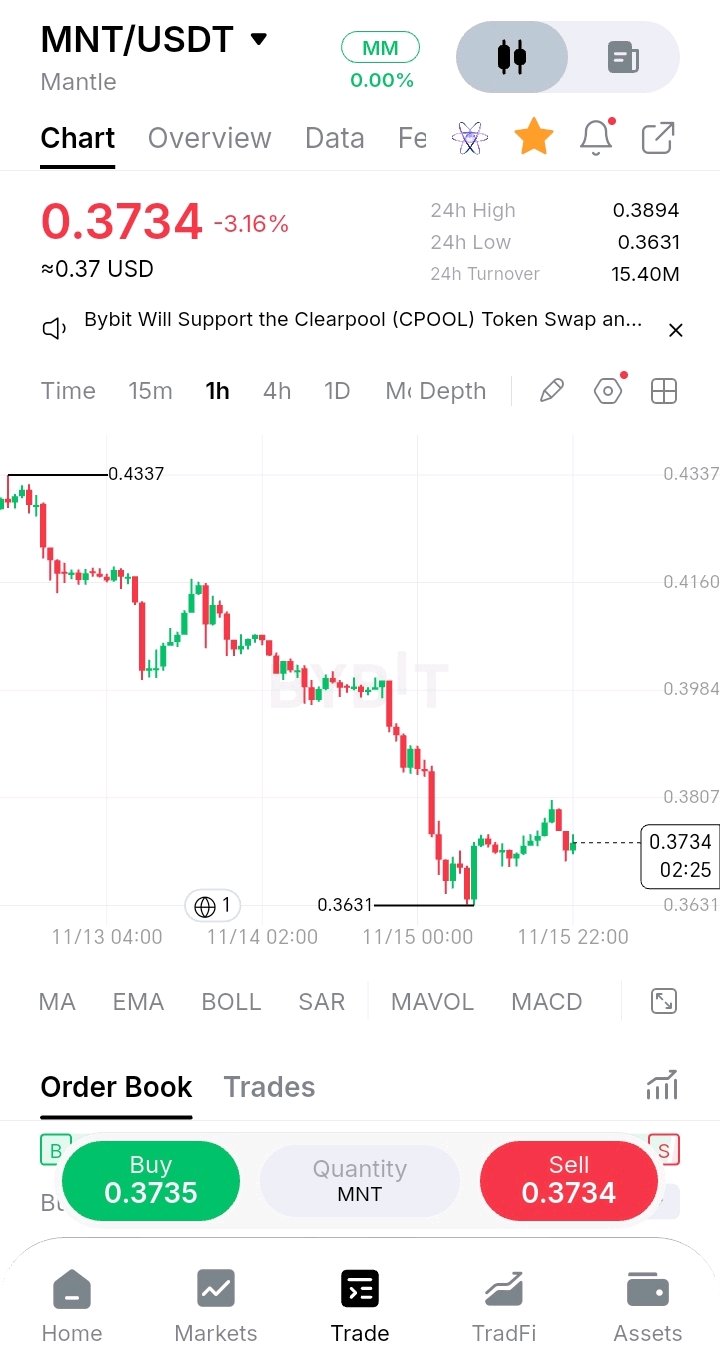
🪜 Every bounce on $MNT is getting smaller than the last. I don't want to buy $MNT just because it's down 16% and looks cheap. I want to see a 1H close above 0.3807, because that's the level that capped the latest bounce. Here's what the 1H chart shows: 🔹 The slide: From the 0.4337 high, $MNT has dropped to a low of 0.3631, about 16%, in a steady staircase of lower highs and lower lows. 🔹 The shrinking bounces: The first bounce reached about 0.4160, the next about 0.4075, then 0.3984, and the latest only reached 0.3807. Each recovery is shorter than the one before it. 🔹 The latest low: A sharp drop printed the 0.3631 low, followed by a V-shaped bounce of nearly 5%. Since then price has pulled back to 0.3734. 🔹 The range: 24H high 0.3894 and low 0.3631, with 24H turnover at 15.40M. The market is active, not quiet. 🔹 The support: 0.3631 is the lowest point on this chart. There is no marked support below it, so a break would be in open space. 🟢 Bullish: a 1H close above 0.3807, then 0.3984. Breaking the pattern of lower highs would be the first real sign of a change. 🔴 Bearish: a 1H close under 0.3631 extends the staircase with no marked floor nearby. Shrinking bounces show buyers losing strength. The first bounce that breaks the pattern is the one to watch. Are you watching $MNT or another coin? #MNT #Mantle #Crypto #BinanceSquare #WSOT2026 #WSOTShowYourAITradeToEarn10USDT #JensenHuangExitTestsNvidiasAILeadership #USPPITestsTheHigherForLongerTrade #USInflationRunsHotAndRateHikeBetsRise $MNTUSDT $BTCUSDT

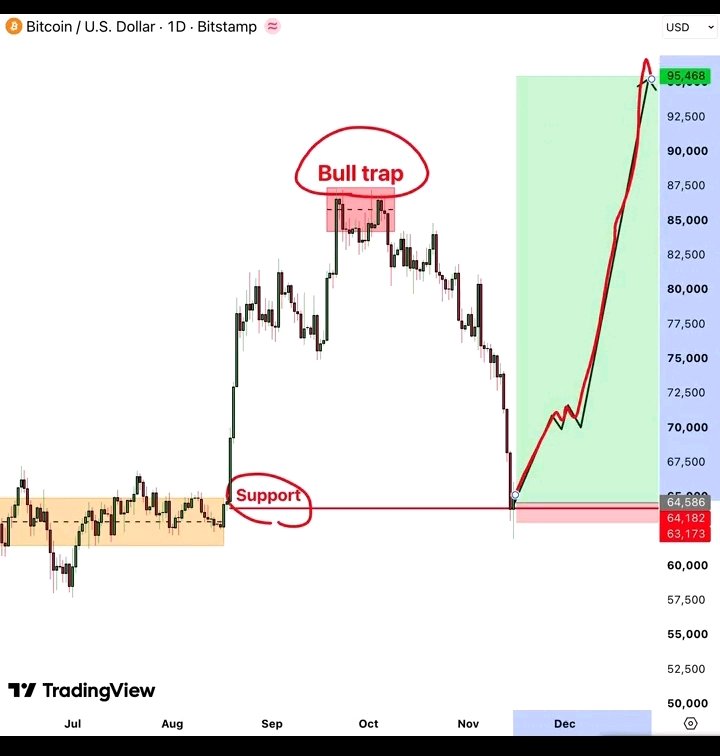
BITCOIN: THE $64K REACTION COULD CHANGE EVERYTHING Bitcoin's latest price action presents an interesting possibility: a major support region that previously acted as a launchpad may be preparing to play that role again. But this time, the market has something important to prove. The chart highlights a potential recovery structure around $64,586, a region that previously supported an extended period of consolidation before Bitcoin accelerated toward the $85K–$87K area. The recent decline back into this zone makes it particularly important for the next directional move. THE BULL TRAP LESSON The earlier rally toward $85K–$87K failed to establish sustainable strength. That rejection was followed by a prolonged decline, showing why a breakout alone is not enough. Buyers need follow-through, not just a temporary price spike. WHY $64,586 MATTERS This is the central support reference in the presented setup. If Bitcoin maintains acceptance above this region and starts building higher lows, the recovery scenario becomes more constructive. The nearby $63,173–$64,182 area represents the downside risk zone marked on the chart. THE POTENTIAL RECOVERY ROUTE The illustrated projection suggests several possible stages: - $70K–$72.5K: Initial recovery and momentum test. - $75K–$77.5K: Intermediate resistance region. - $82.5K–$85K: Stronger recovery challenge. - $95,468: Extended upside projection shown in the setup. These are projected reference areas, not confirmed targets. TRADE PERSPECTIVE A bullish position would require evidence that $64,586 is holding, followed by a convincing recovery and sustained buying pressure. A daily close below $63,173 would seriously weaken the illustrated bullish scenario. MY VIEW The most interesting part of this setup is not the projected move toward $95K. It is the possibility that an old consolidation region could become the foundation for a new recovery. Bitcoin must first demonstrate that buyers can defend this area. If that happens, the market may begin developing a very different structure from the one that produced the recent decline. Patience and confirmation matter here. A strong recovery needs a foundation before it can become a trend. #WSOTShowYourAITradeToEarn10USDT #JensenHuangExitTestsNvidiasAILeadership #USPPITestsTheHigherForLongerTrade #USInflationRunsHotAndRateHikeBetsRise #SanDiskAnnounces8For1StockSplit $BTCUSDT $HYPEUSDT
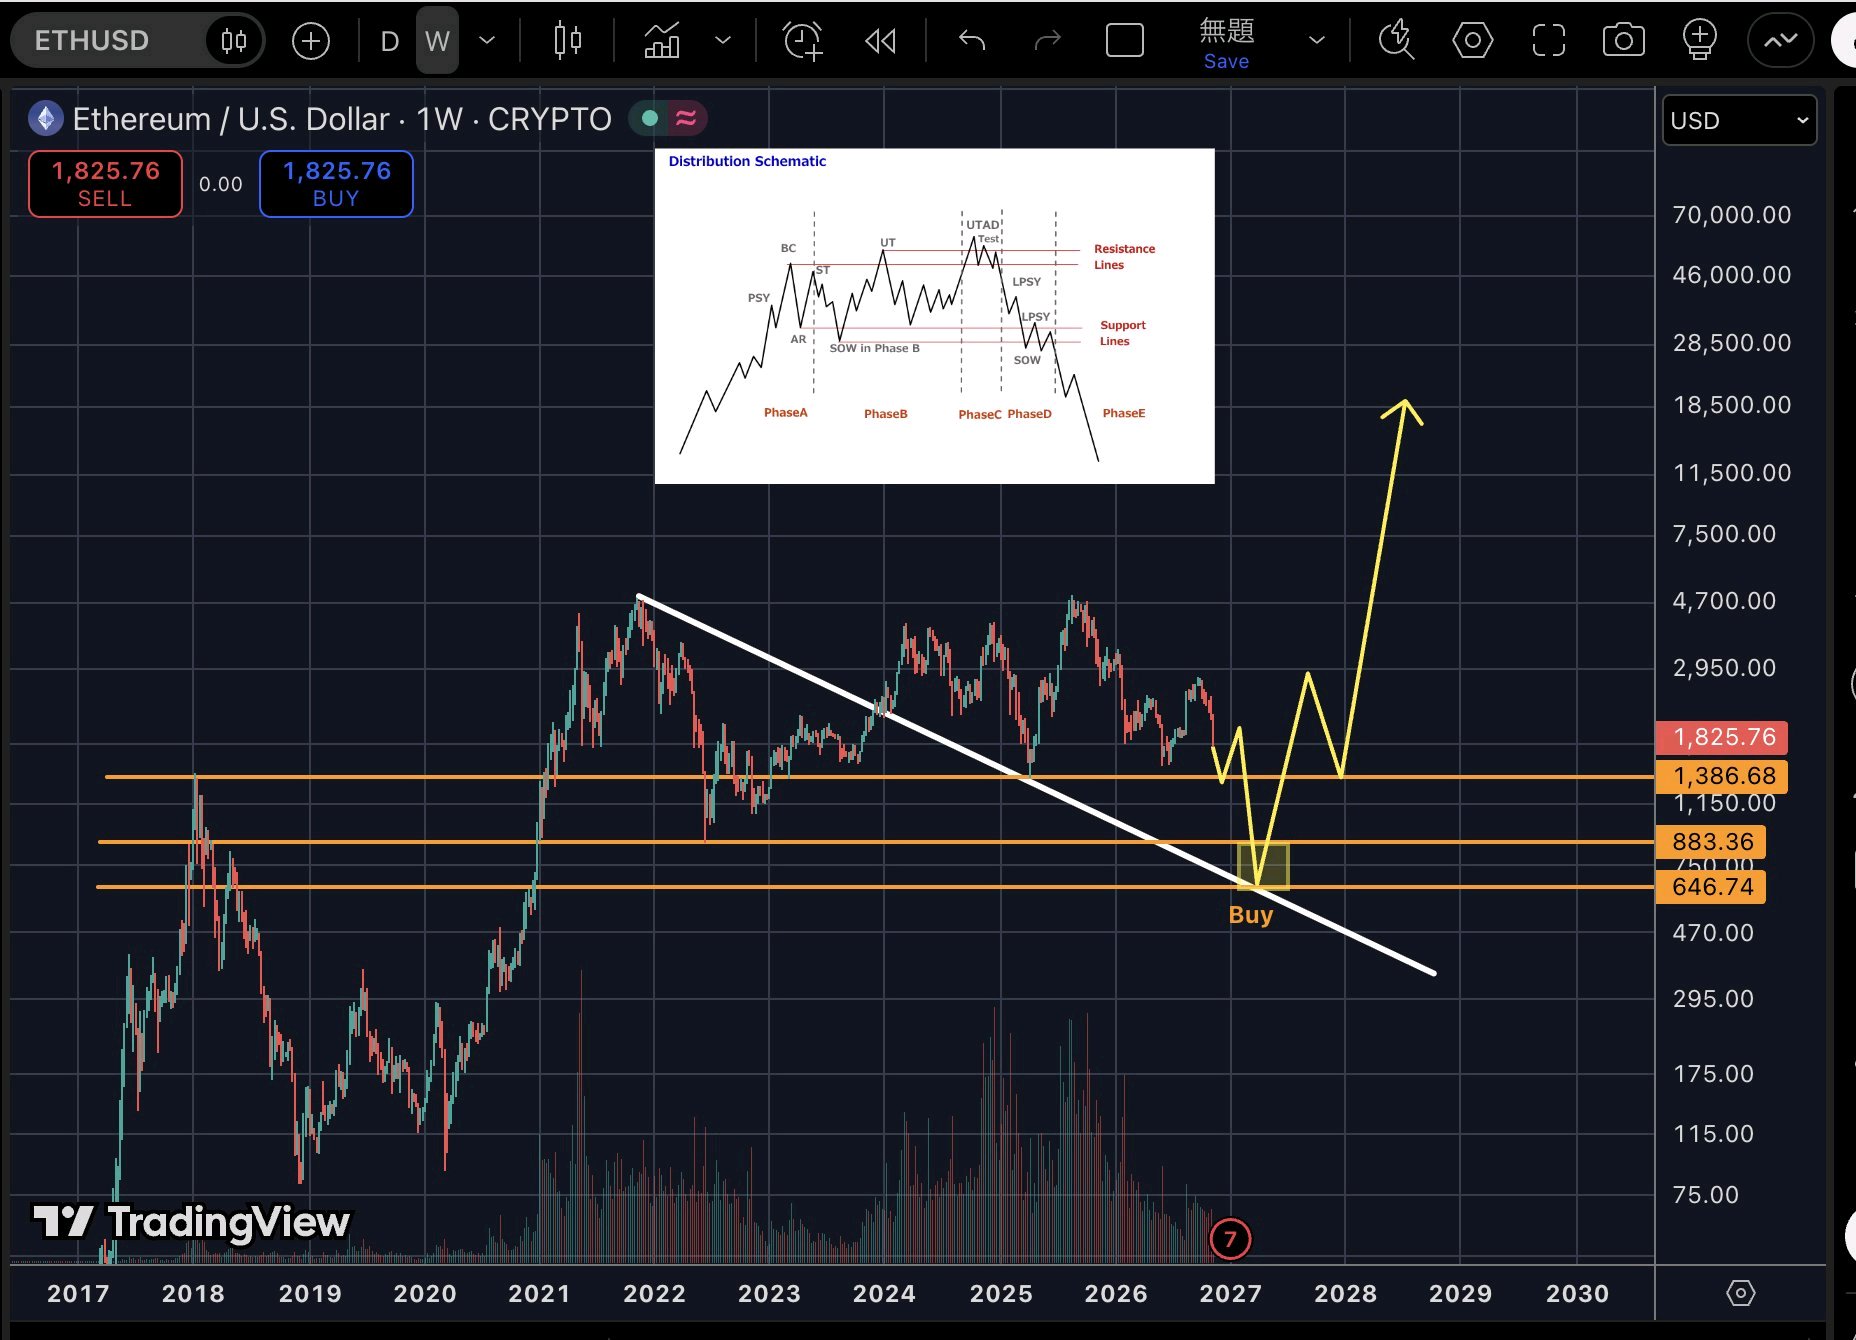
🗺️ Here's one map for $ETH, and it comes with a big "if". I don't want to assume ETH's bottom is already in. I want to see how it behaves at 1,386.68 on the weekly chart, because that's the first level that decides which map applies. Here's what this weekly chart shows: 🔹 The big picture: $ETH is at 1,825.76, about 60% below its peak near 4,800. The chart has been making lower highs since the 2025 top. 🔹 The ladder of levels: Three horizontal supports are marked below price, 1,386.68, 883.36 and 646.74. They sit about 24%, 52% and 65% under the current price. 🔹 The trendline: A falling line drawn from the 2021 peak has been touched several times and is projected to meet the lower levels in 2027. 🔹 The pattern: The chart overlays a Wyckoff distribution schematic. In that model, a long distribution is followed by a markdown phase before a new base forms. 🔹 The scenario: The plan marks a buy zone where the trendline meets the 646 to 883 area, followed by a recovery. That's a scenario, not a forecast, and it requires a very deep drop first. 🟢 Bullish: weekly closes that hold above 1,386.68 would mean the deeper scenario isn't playing out, with the current structure intact. 🔴 Bearish: a weekly close under 1,386.68 would open the path toward 883.36, and then the 646.74 zone. Long-term maps are useful for context, not for timing. The weekly closes at each level tell you what's actually happening. Are you watching $ETH or another coin? #ETH #Ethereum #Crypto #BinanceSquare #WSOT2026 #WSOTShowYourAITradeToEarn10USDT #JensenHuangExitTestsNvidiasAILeadership #USPPITestsTheHigherForLongerTrade #USInflationRunsHotAndRateHikeBetsRise $ETHUSDT $HYPEUSDT

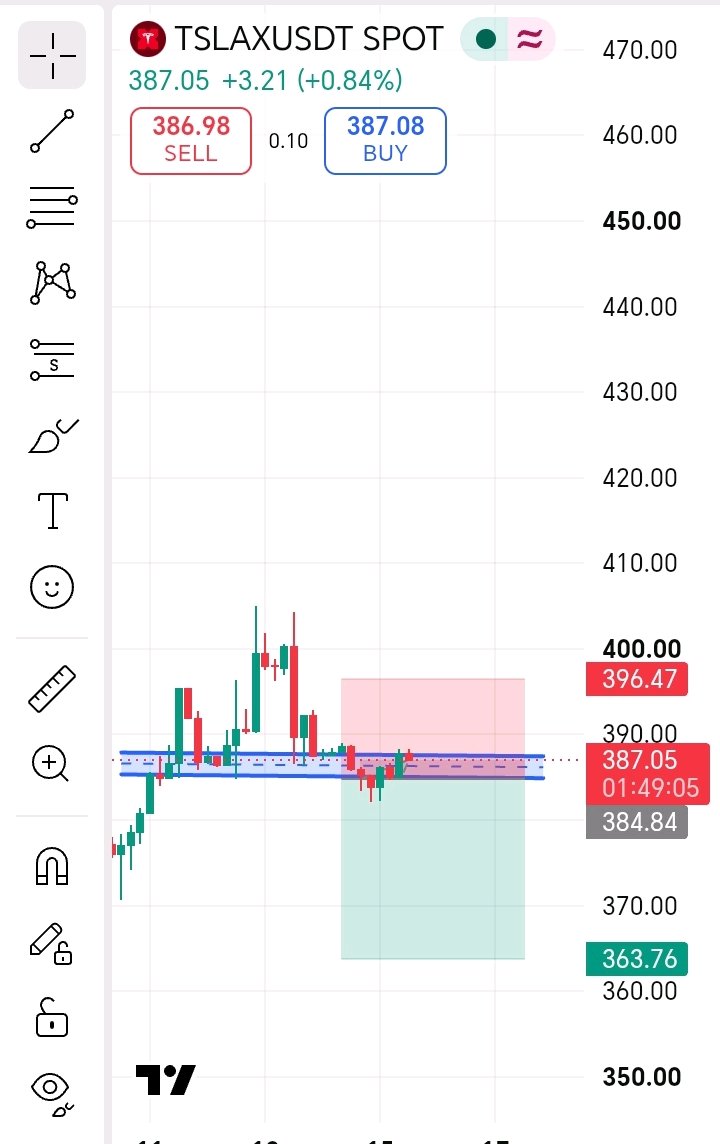
🎯 価格が維持できなかったゾーンに戻ってきました。ここがショートのアイデアを試す場所です。 単に価格がレジスタンスラインにあるからといって $TSLAX をショートしたいわけではありません。売り手がゾーンを守っていることを確認できるレベルである384.84を下回って引けるという拒絶反応を確認したいのです。 このチャートが示していることは以下の通りです: 🔹 ゾーン:385から388の狭い帯域がピボット(転換点)として機能しています。価格は380台前半まで下落して反発し、現在は387.05で再びその範囲内に戻っています。 🔹 コンテキスト:価格は安値から力強く回復した後、405付近でピークに達し、それ以来横ばいの動きが続いています。リバウンドの勢いは鈍化しています。 🔹 ショートのアイデア:エントリーは384.84付近、ストップ(損切り)は直近レンジの上である396.47、ターゲットは363.76。これはリスク約3%に対してリワード5.5%、つまりリスクリワード比は約1:1.8となります。 🔹 注意点:ゾーンへの反発は依然として陽線であり、価格は簡単に突き抜ける可能性があります。3%のストップが機能するのは、ポジションサイズがそれに適している場合のみです。 🔹 市場:$TSLAX は24時間取引可能なトークン化された株式であるため、ギャップや週末の動きが通常の市場時間とは異なる場合があります。 🔴 ベアリッシュ(弱気):384.84を下回って引け、ゾーンで拒絶されれば、363.76に向けた動きが始まります。 🟢 ブルッシュ(強気):396.47を上回って引ければ、ショートのアイデアは無効となり、次の参考値は高値の405となります。 ゾーンは価格が反応して初めて意味を持ちます。次の終値がどちらに向かうかを教えてくれるでしょう。 あなたは $TSLAX か、それとも別の株を見ていますか? #TSLAX #Tesla #Crypto #BinanceSquare #WSOT2026 #WSOTあなたのAI取引を見せて10USDTを獲得 #ジェンスン・ファン、NvidiaのAIリーダーシップを試す出口戦略 #米PPIが「高金利長期化」取引を試す #米国のインフレ率は高止まりし、利上げ観測が高まる $TSLAXUSDT $BTCUSDT

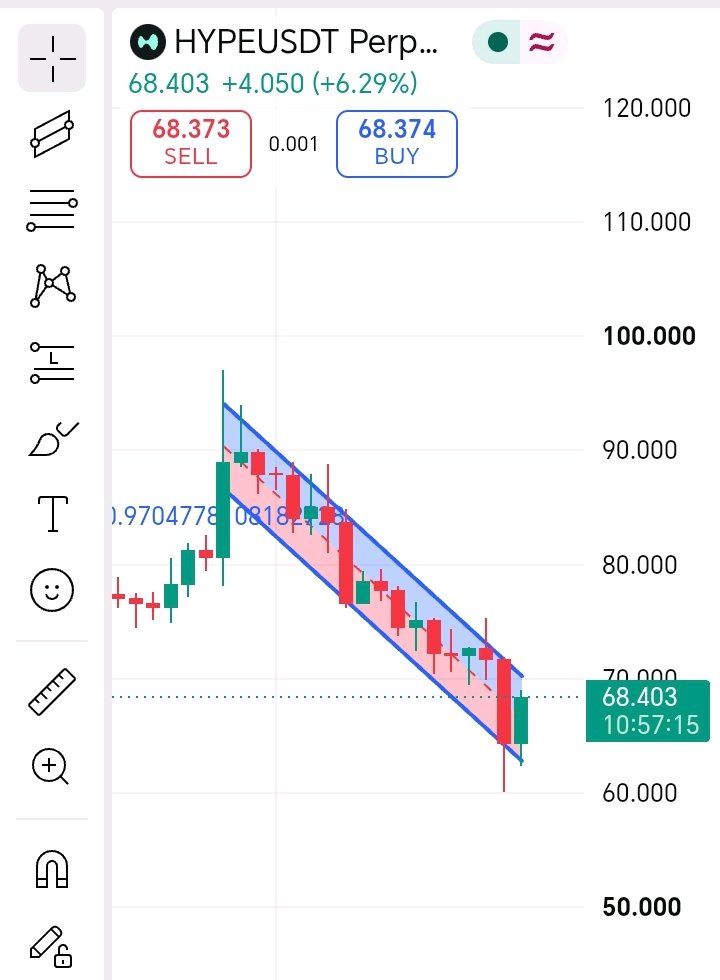
🪝 Price dipped below the channel, then got pulled right back in. I don't want to call a trend change on $HYPE just because of one big green candle. I want to see a close above the upper channel line near 70 to 71, because that's what would actually break the downtrend. Here's what this chart shows: 🔹 The channel: Since the peak near 97, $HYPE has moved inside a clean falling channel, with lower highs and lower lows, each bounce capped by the upper line. 🔹 The dip below: The previous candle pushed below the lower channel line and wicked all the way down to about 60. That's a drop of roughly 38% from the peak, and it came with a sharp flush. 🔹 The snap-back: The latest candle is green, up 6.29%, and closed back inside the channel at 68.40. A move below a channel that immediately reverses is often called a false breakdown. 🔹 The position: Price is now in the upper part of the channel, about 3% under the upper line. That's the first real test. 🔹 The bounce size: From the 60 wick low, price has recovered about 14%. That's a strong reaction, but it's still a bounce inside a downtrend until the channel breaks. 🟢 Bullish: a close above 70 to 71, the upper channel line. That would end the pattern of lower highs and turn the false breakdown into a real reversal signal. 🔴 Bearish: a close back under the lower line near 62 to 63, and especially under 60. That would confirm the wick was only a pause. A false breakdown can start a reversal, but the channel only breaks when the upper line does. Are you watching $HYPE or another coin? #HYPE #Hyperliquid #Crypto #BinanceSquare #WSOT2026 #WSOTShowYourAITradeToEarn10USDT #JensenHuangExitTestsNvidiasAILeadership #USPPITestsTheHigherForLongerTrade #USInflationRunsHotAndRateHikeBetsRise $HYPEUSDT $BTCUSDT

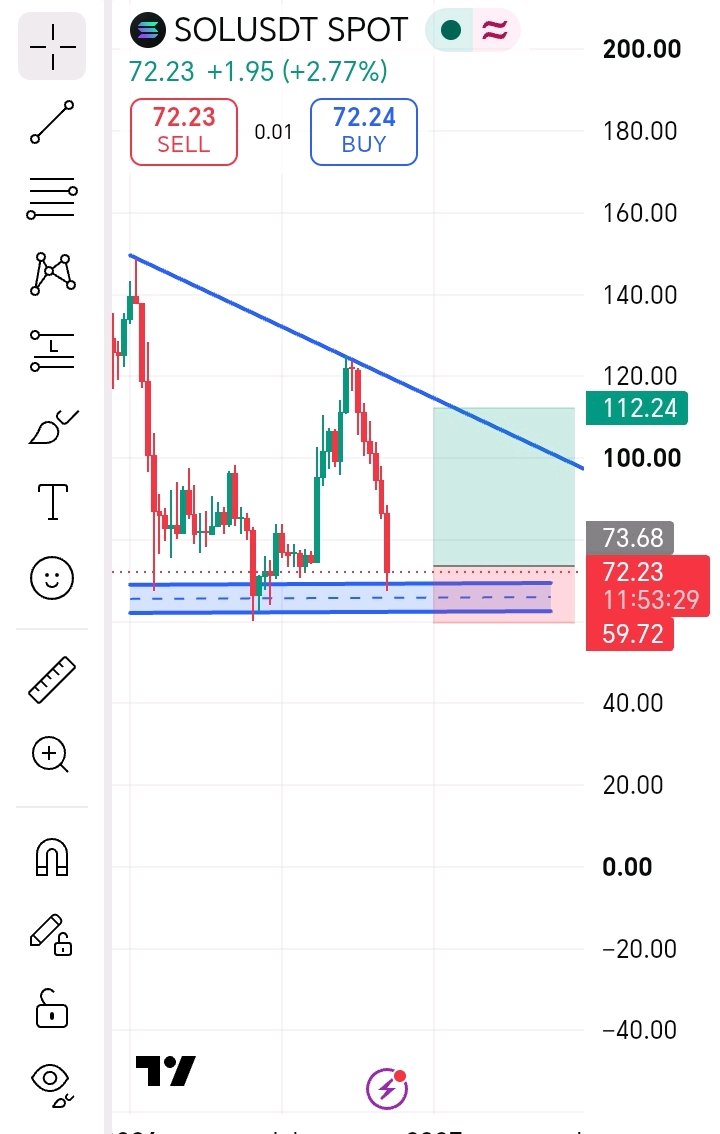
⚖️ フラットなフロアと下降する天井:$SOLはディセンディング・トライアングル(下降三角形)に収束しています。 過去にサポートされたという理由だけでフロアで買いを入れたくはありません。私は$SOLが73.68を奪還し、それを維持するのを確認したいです。なぜなら、それこそが買い手が再びそのゾーンを守っていることを示すものだからです。 このチャートが示していることは以下の通りです: 🔹 フロア:62〜69付近のフラットなサポートゾーンは何度か試されています。毎回価格は反発していますが、その反発は弱まっています。 🔹 天井:150付近の初期ピークからの安値を切り下げた高値、125付近の拒絶、そして100付近へと向かう下降トレンドライン。売り手はより低い価格で現れ続けています。 🔹 パターン:これはディセンディング・トライアングルであり、フラットな底値と切り下がる高値で構成されます。フロアが何度も試されるため弱気なパターンになることが多いですが、買い手が守れば上方向に転じる可能性もあります。 🔹 現在の価格:$SOLは72.23で、本日2.77%上昇し、ゾーンのすぐ上に位置しています。 🔹 トレード計算:73.68からのロング、ストップロスを59.72、ターゲットを112.24に設定すると、リスクリワード比は約1:2.8になります。ストップまでの距離は約19%あるため、ポジションサイズが重要です。 🟢 強気シナリオ:73.68を回復して終値で維持できれば、次は90年代、そしてより大きなターゲットとして100〜112付近の下降トレンドラインが視野に入ります。 🔴 弱気シナリオ:62付近のゾーンを下回っての終値、特に59.72を下回った場合。ディセンディング・トライアングルからのブレイクダウンは、多くの場合パターンの高さと同等の動きをターゲットにします。 フロアは今のところ持ちこたえています。問題は、4度目も耐えられるかどうかです。 皆さんは$SOLや他のコインを監視していますか? #SOL #Solana #仮想通貨 #BinanceSquare #WSOT2026 #byx #WSOTあなたのAI取引を見せて10USDTを獲得 #ジェンスン・ファン、NvidiaのAIリーダーシップを試す出口戦略 #米PPIが「高金利長期化」取引を試す #米国のインフレ率は高止まりし、利上げ観測が高まる

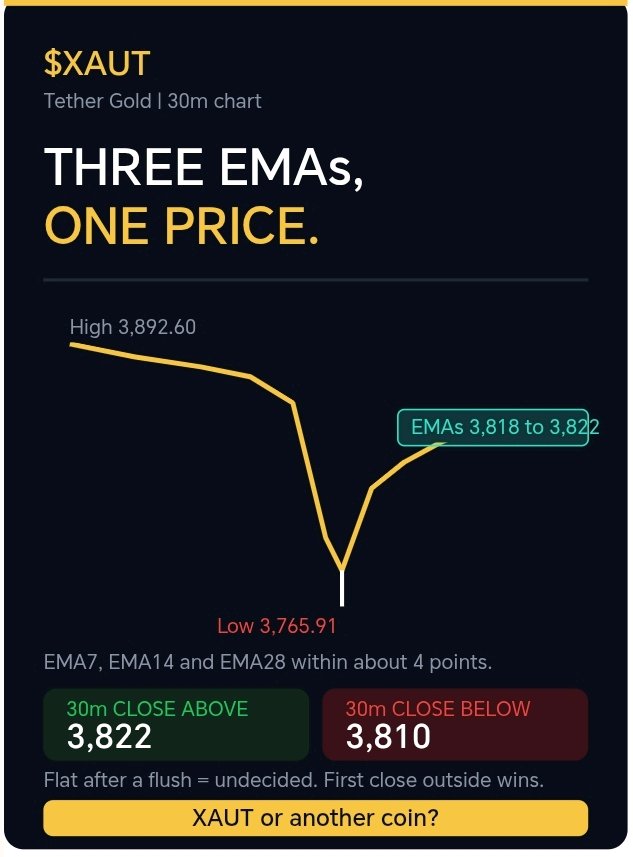
🧲 Three EMAs, one price, and nothing between them. I don't want to guess the direction of $XAUT when the 30m chart has gone this flat. I want to see a 30m close outside the 3,810 to 3,822 cluster, because that's where the next real move starts. Here's what the 30m chart shows: 🔹 The flush: Gold dropped from the 3,892.60 area and printed a low of 3,765.91 with a long wick. That's below the 3,872.51 base from last week and about 9% under the 4,128 range high. 🔹 The rebound: Price recovered about 1.4% to the 3,834 area, then stalled and has been drifting flat. 🔹 The cluster: EMA7 is 3,818.70, EMA14 3,818.17 and EMA28 3,822.07. All three sit within about 4 points of each other, and price is right on top of them at 3,817.01. That's an unusually tight squeeze. 🔹 The bands: Upper 3,839.25 | Mid 3,810.32 | Lower 3,781.39. They're narrowing after the volatility spike, which fits the flat price. 🔹 The range: 24H high 3,871.27 and low 3,765.91, with turnover at 13.33M. The big move already happened. Now the market is deciding what to do with it. 🟢 Bullish: a 30m close above 3,822, then the upper band at 3,839 and the 3,870 level. That would turn the flat stretch into a recovery. 🔴 Bearish: a 30m close under 3,810 puts the lower band at 3,781 and the 3,765.91 low in play. Flat averages after a big flush mean the market is undecided. The first close outside the cluster usually picks the direction. Are you watching $XAUT or another coin? #XAUT #Gold #Crypto #BinanceSquare #WSOTShowYourAITradeToEarn10USDT #WSOT2026 #JensenHuangExitTestsNvidiasAILeadership #USPPITestsTheHigherForLongerTrade #USInflationRunsHotAndRateHikeBetsRise $XAUTUSDT $BTCUSDT
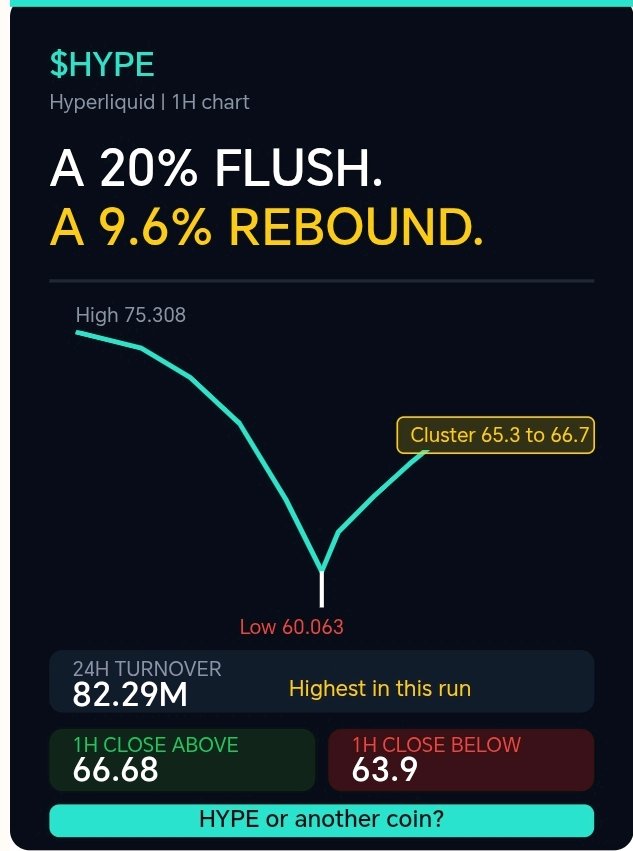
🌊 A 20% flush, a 9.6% rebound, and the biggest volume in a while. I don't want to call the low on $HYPE just because the wick was dramatic. I want to see a 1H close above 66.68, because that's where the rebound has to break through to mean something. Here's what the 1H chart shows: 🔹 The flush: From the 75.308 high, $HYPE dropped to 60.063, about 20%, with the final leg ending in a long red wick that looks like a forced selloff. 🔹 The rebound: Buyers stepped in at the low and price recovered to around 66.6, a gain of nearly 10% off the bottom. It has since pulled back slightly to 65.85. 🔹 The volume: 24H turnover is 82.29M, the highest in this run and well above the 25M to 53M range of the last few sessions. Big flushes tend to come with big volume. 🔹 The cluster: EMA7 65.28, EMA14 65.44, the Bollinger mid 65.72 and EMA28 66.68 are all bunched within about 2% of price. The rebound has run straight into them. 🔹 The bands: Upper 69.76 | Lower 61.68. Volatility is high, so moves in either direction can be sharp. 🔹 The context: Even after the bounce, price is still about 12% below the 75.3 high, and the broader trend has been down. 🟢 Bullish: a 1H close above 66.68, then 67.8 and the upper band near 69.8. That would turn the flush into a trap for sellers. 🔴 Bearish: a 1H close under 63.9 puts the 60.063 low back in play, and a break there extends the slide. Flushes can mark exhaustion, or just a pause. The next few 1H closes after the rebound will tell us which one this is. Are you watching $HYPE or another coin? #HYPE #Crypto #BinanceSquare #WSOT2026 #WSOTShowYourAITradeToEarn10USDT #JensenHuangExitTestsNvidiasAILeadership #USPPITestsTheHigherForLongerTrade #USInflationRunsHotAndRateHikeBetsRise $HYPEUSDT $BTCUSDT
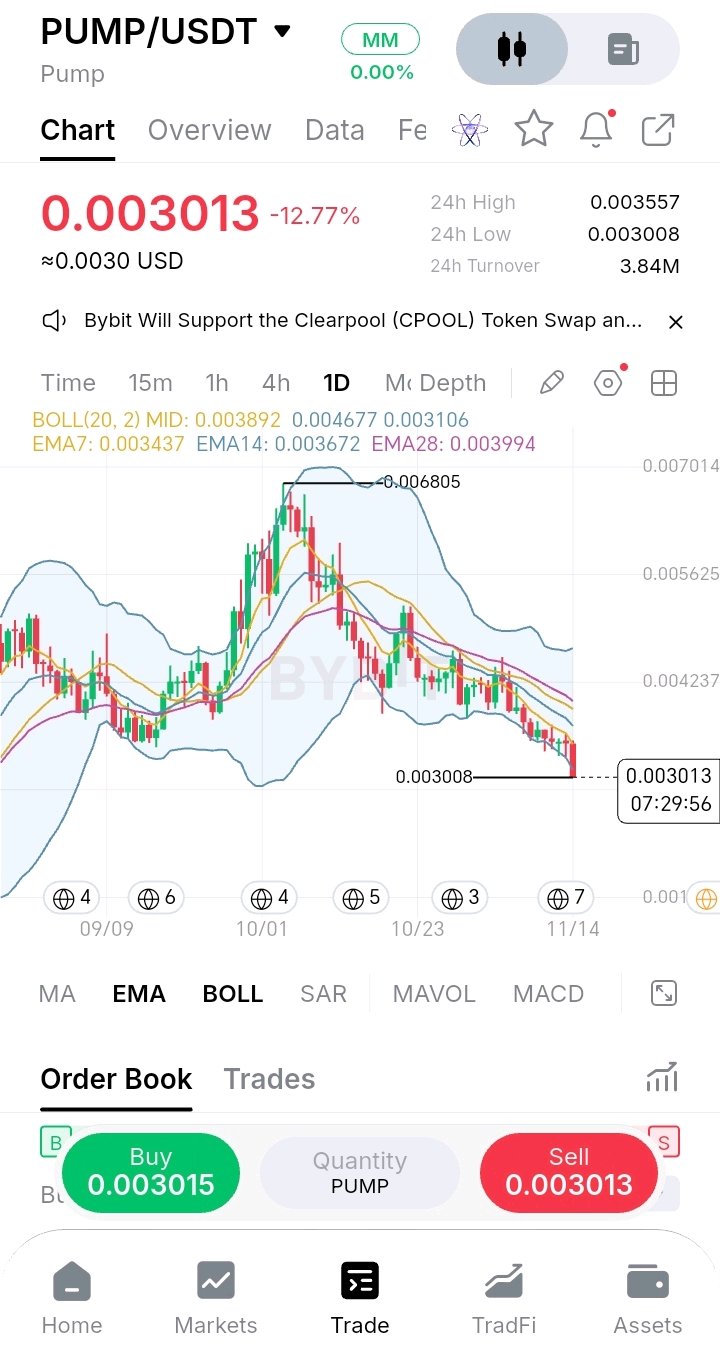
🧨 One 12.8% red candle just punched through the lower Bollinger Band. I don't want to buy $PUMP just because it's down more than half from its high. I want to see a daily close back above 0.003106, because that would put price back inside the bands and show this move was stretched. Here's what the daily chart shows: 🔹 The big candle: Today's daily candle is down 12.77% and is trading at 0.003013, just above the 0.003008 low of the day. 🔹 The band break: The lower Bollinger Band is at 0.003106 and price has dropped below it. That's an extended move, and extended moves can snap back or keep running. 🔹 The slide: From the 0.006805 high, $PUMP is down about 56%, with lower highs and lower lows all the way. Today's low is the lowest level visible on this chart. 🔹 The averages: EMA7 0.003437, EMA14 0.003672 and EMA28 0.003994, with the Bollinger mid at 0.003892. All slope down and sit above price. The nearest one is about 14% away. 🔹 The activity: 24H turnover is 3.84M, with a range of 0.003008 to 0.003557. The move came with real participation. 🔹 The support: There isn't much marked support below 0.0030 on this chart, so a break gives price very little to lean on. 🟢 Bullish: a daily close back above 0.003106, then 0.003437 (EMA7). Reclaiming EMA7 would show sellers are losing control. 🔴 Bearish: a daily close under 0.003008 keeps the downtrend intact with no marked floor nearby. The daily candle is still open, so the close matters more than the swing. Are you watching $PUMP or another coin? #PUMP #Crypto #BinanceSquare #WSOTShowYourAITradeToEarn10USDT #WSOT2026 #JensenHuangExitTestsNvidiasAILeadership #USPPITestsTheHigherForLongerTrade #USInflationRunsHotAndRateHikeBetsRise $PUMPUSDT $TRUMPUSDT

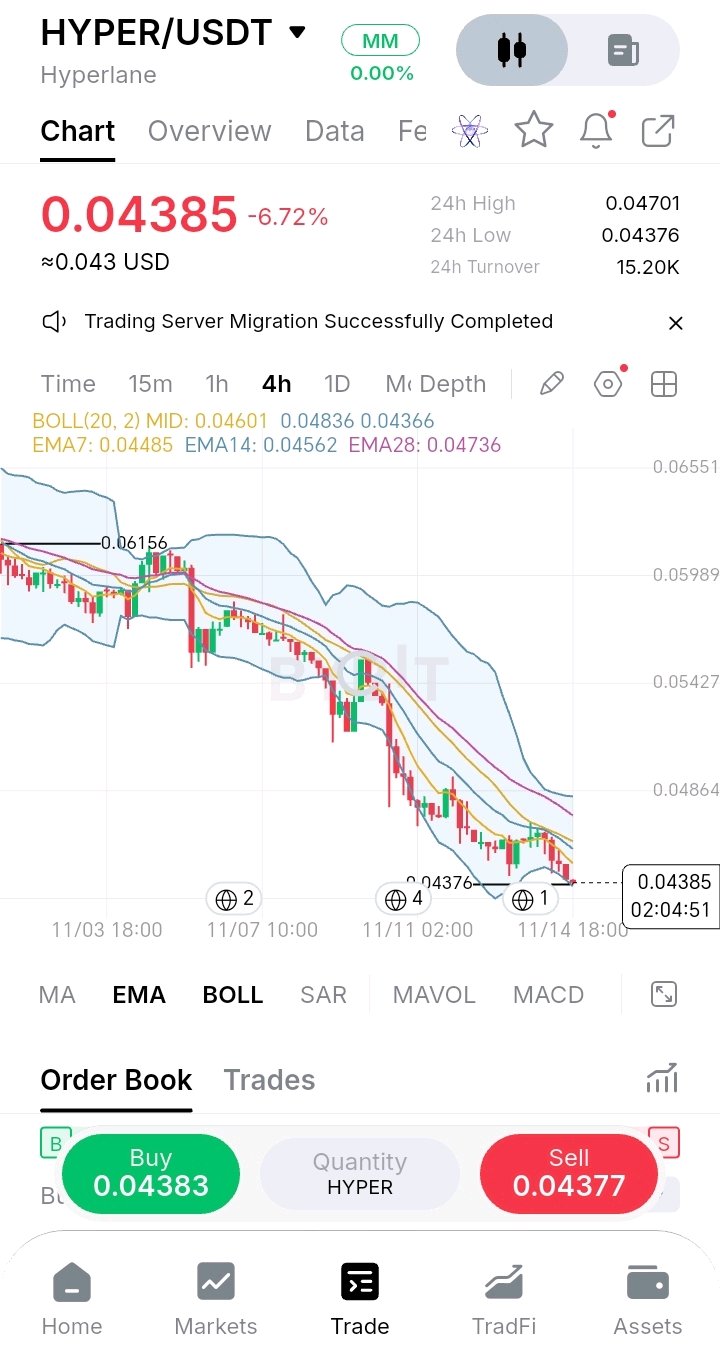
🥀 The green shoot didn't survive. I don't want to buy $HYPER just because it's down another 6.7% and looks cheap. I want to see a 4H close above 0.04485 (EMA7), because that's the first sign the bounce attempt is back. Here's what the 4H chart shows: 🔹 The failed bounce: Price recovered to the 0.047 area, right under the Bollinger mid-band, and got rejected. It then gave back the whole move. 🔹 The new low: The 0.04420 low from before has broken. The latest low is 0.04376, and price is trading at 0.04385, sitting on the lower band at 0.04366. 🔹 The slide: From the 0.06156 high on this chart, price is down about 29%, still making lower highs and lower lows. 🔹 The averages: EMA7 0.04485, EMA14 0.04562 and EMA28 0.04736, all above price and sloping down. The Bollinger mid at 0.04601 is the next ceiling. 🔹 The liquidity: 24H turnover is only 15.20K, thinner than before. A market this small can gap and slip, in both directions. 🔹 The range: 24H high 0.04701 and low 0.04376, a swing of about 7%. 🟢 Bullish: a 4H close above 0.04485, then 0.04562 and 0.04601. Reclaiming the mid-band would turn this into a failed breakdown. 🔴 Bearish: a 4H close under 0.04366 and there is very little marked support below on this chart. One rejected bounce doesn't end a downtrend, but it shows who is in control. On a market this thin, size small and keep a stop. Are you watching $HYPER or another coin? #HYPER #Hyperlane #Crypto #BinanceSquare #WSOTShowYourAITradeToEarn10USDT #JensenHuangExitTestsNvidiasAILeadership #USPPITestsTheHigherForLongerTrade #USInflationRunsHotAndRateHikeBetsRise #WSOT2026 $HYPERUSDT $BTCUSDT

The Bybit Stockholm Open, on and off court 🎾 Our VIPs got their turn on court, fans picked up exclusive merch at the booth, and one winner had €1,000 to celebrate. An unforgettable event filled with thrilling matches, amazing energy, and unforgettable moments for everyone involved! 🏆✨ #WSOTShowYourAITradeToEarn10USDT #JensenHuangExitTestsNvidiasAILeadership #USPPITestsTheHigherForLongerTrade #USInflationRunsHotAndRateHikeBetsRise #SanDiskAnnounces8For1StockSplit $HYPEUSDT $BTCUSDT

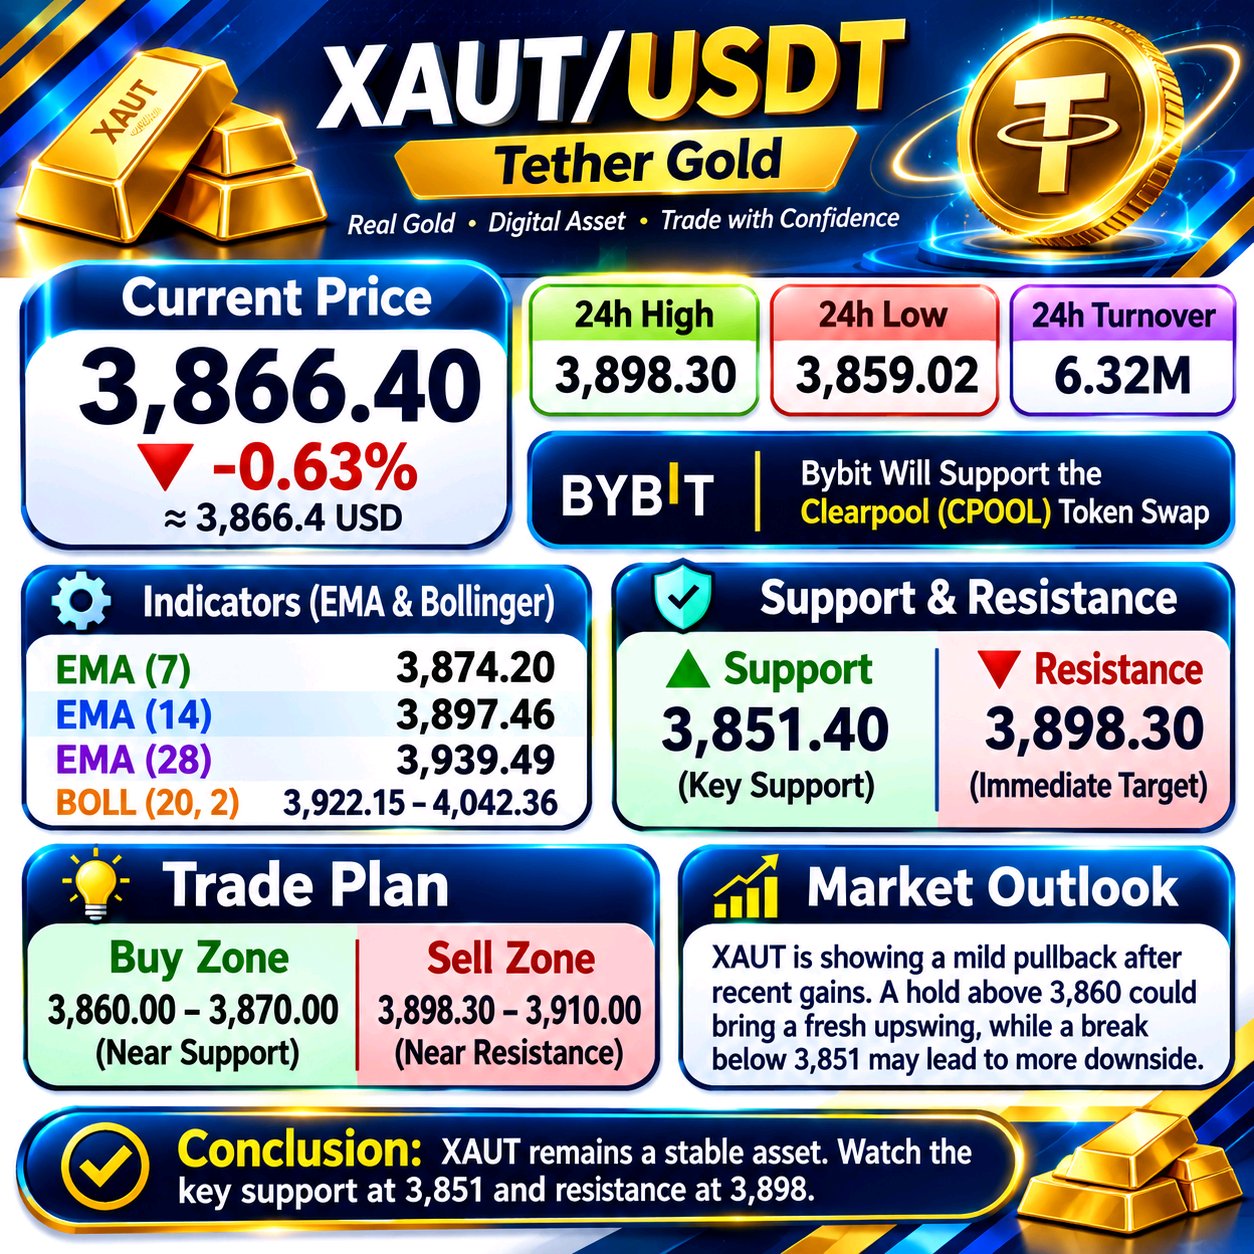
XAUT:ゴールドが買い手の信頼を試す ゴールド裏付け型の暗号資産は、その根本的な価値提案が魅力的であっても、短期的には売り圧力を受けることがあります。XAUTは現在、長期的な資産エクスポージャーと短期的な市場モメンタムの間に生じるそのような乖離を示しています。 XAUTは3,866.40ドルで推移しており、24時間で0.63%の下落です。直近の4時間足チャートでは、4,130.11ドル付近の直近高値からかなりの下落が見られます。3,851.40ドルの安値に達した後、価格は安定しようと試みましたが、反発の勢いはまだトレンドを転換させるほど十分ではありません。 テクニカル分析 現在、3本の移動平均線(EMA 7:3,874.20ドル、EMA 14:3,897.46ドル、EMA 28:3,939.49ドル)が価格の上方に位置しています。この配置は、短期的な構造において依然として売り手が優勢であることを示しています。ボリンジャーバンドの中央線である3,922.15ドルも、重要な回復の閾値となります。 重要な価格帯 3,859ドル〜3,851ドルの領域が当面のサポートエリアです。買い手がこのゾーンを死守し、3,874ドルを奪還できれば、市場は3,897ドル〜3,898ドルへの回復を試みる可能性があります。その領域を上回る強い動きが見られれば、3,922ドルが視野に入ってくるでしょう。 しかし、3,851.40ドルを明確に割り込むと、ボリンジャーバンドの下限である3,801.94ドル付近まで下落する可能性があります。そうなれば、現在の調整局面において十分な買い需要を集められなかったことを示唆することになります。 トレード戦略 ロングポジション(買い)については、3,898ドルを超えて回復が確認された後の方が魅力的であり、3,922ドルや3,939ドルが上値の目安となります。ショートポジション(売り)については、3,897ドル〜3,922ドル付近での拒絶、あるいは3,851.40ドルを下回るブレイクダウンが確認できれば、より説得力のある弱気シナリオとなるでしょう。 市場心理 注目すべき詳細は、オーダーブックの不均衡です。売りが96%に対し、買いは4%となっています。これは、その瞬間のスナップショットにおいてかなりの売り関心があることを示していますが、オーダーブックの割合は急速に変化する可能性があり、将来の価格動向を保証するものではありません。報告されている24時間の出来高は約632万ドルです。 最終的な見解 XAUTは現在、一時的な反発よりも、直近の安値を守れるかどうかが重要となる局面にあります。この資産はデジタル形式を通じて引き続きゴールドへのエクスポージャーを提供しますが、取引価格は変動する可能性があります。私は、この下落が終了したと判断する前に、より強い買い手の参加と移動平均線を上回る回復を確認したいと考えています。現在の市場環境においては、忍耐強く、確認を待つことが特に重要です。 #WSOTあなたのAI取引を見せて10USDTを獲得 #ジェンスン・ファン、NvidiaのAIリーダーシップを試す出口戦略 #米PPIが「高金利長期化」取引を試す #米国のインフレ率は高止まりし、利上げ観測が高まる #サンディスクが8対1の株式分割を発表 $XAUTUSDT $BTCUSDT
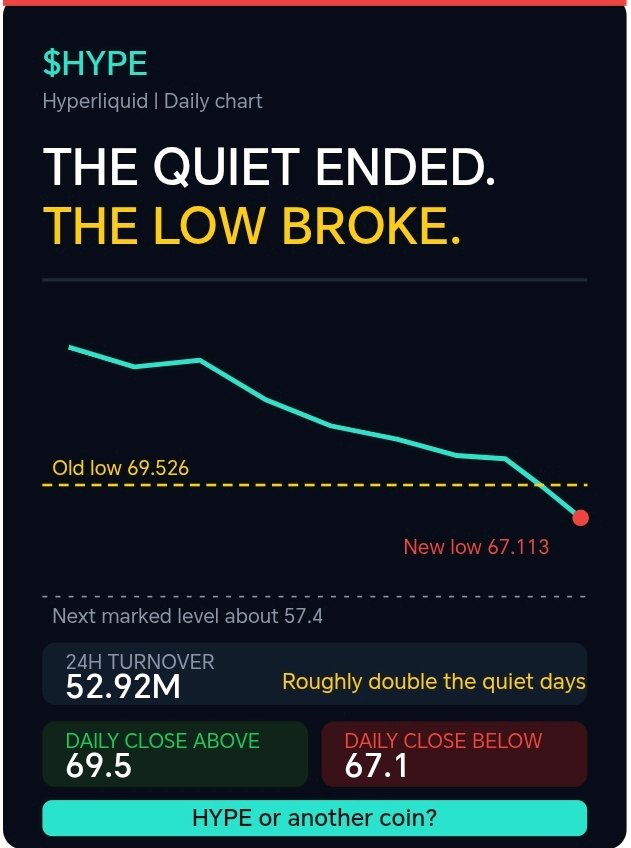
🔔 The quiet just ended, and the 69.5 low went with it. I don't want to call this drop capitulation on $HYPE. I want to see a daily close back above 69.5, because that would turn this break into a trap instead of a trend. Here's what the daily chart shows: 🔹 The break: For days, the 69.526 low was the line everyone watched. Today's candle dropped to 67.113, below it, and is still trading under it at around 69.05. 🔹 The swing: The 24H range is 67.113 to 75.308, about 11%. After a few calm sessions, the volatility is back. 🔹 The volume: 24H turnover is 52.92M, roughly double the recent quiet days. That means the move came with real participation, not a drift. 🔹 The averages: EMA7 is 72.82, EMA14 75.62 and EMA28 78.44, with the Bollinger mid at 79.44. All of them slope down and sit above price. 🔹 The band: Lower Bollinger is 66.83, just under today's low. Price is stretched near it. 🔹 The order book: Asks are about 60% vs 40% bids, a modest sell lean. 🔹 The gap below: On this chart, the next marked level is around 57.4, about 17% under here. 🟢 Bullish: a daily close back above 69.5, then 72.8. That would make today's low a failed breakdown. 🔴 Bearish: a daily close under 67.1 and the lower band near 66.8 opens the way toward the 57.4 area. The daily candle is still open, so the close matters more than any single swing. Are you watching $HYPE or another coin? #HYPE #Crypto #BinanceSquare #WSOTShowYourAITradeToEarn10USDT #JensenHuangExitTestsNvidiasAILeadership #USPPITestsTheHigherForLongerTrade #USInflationRunsHotAndRateHikeBetsRise #SanDiskAnnounces8For1StockSplit $HYPEUSDT $BTCUSDT

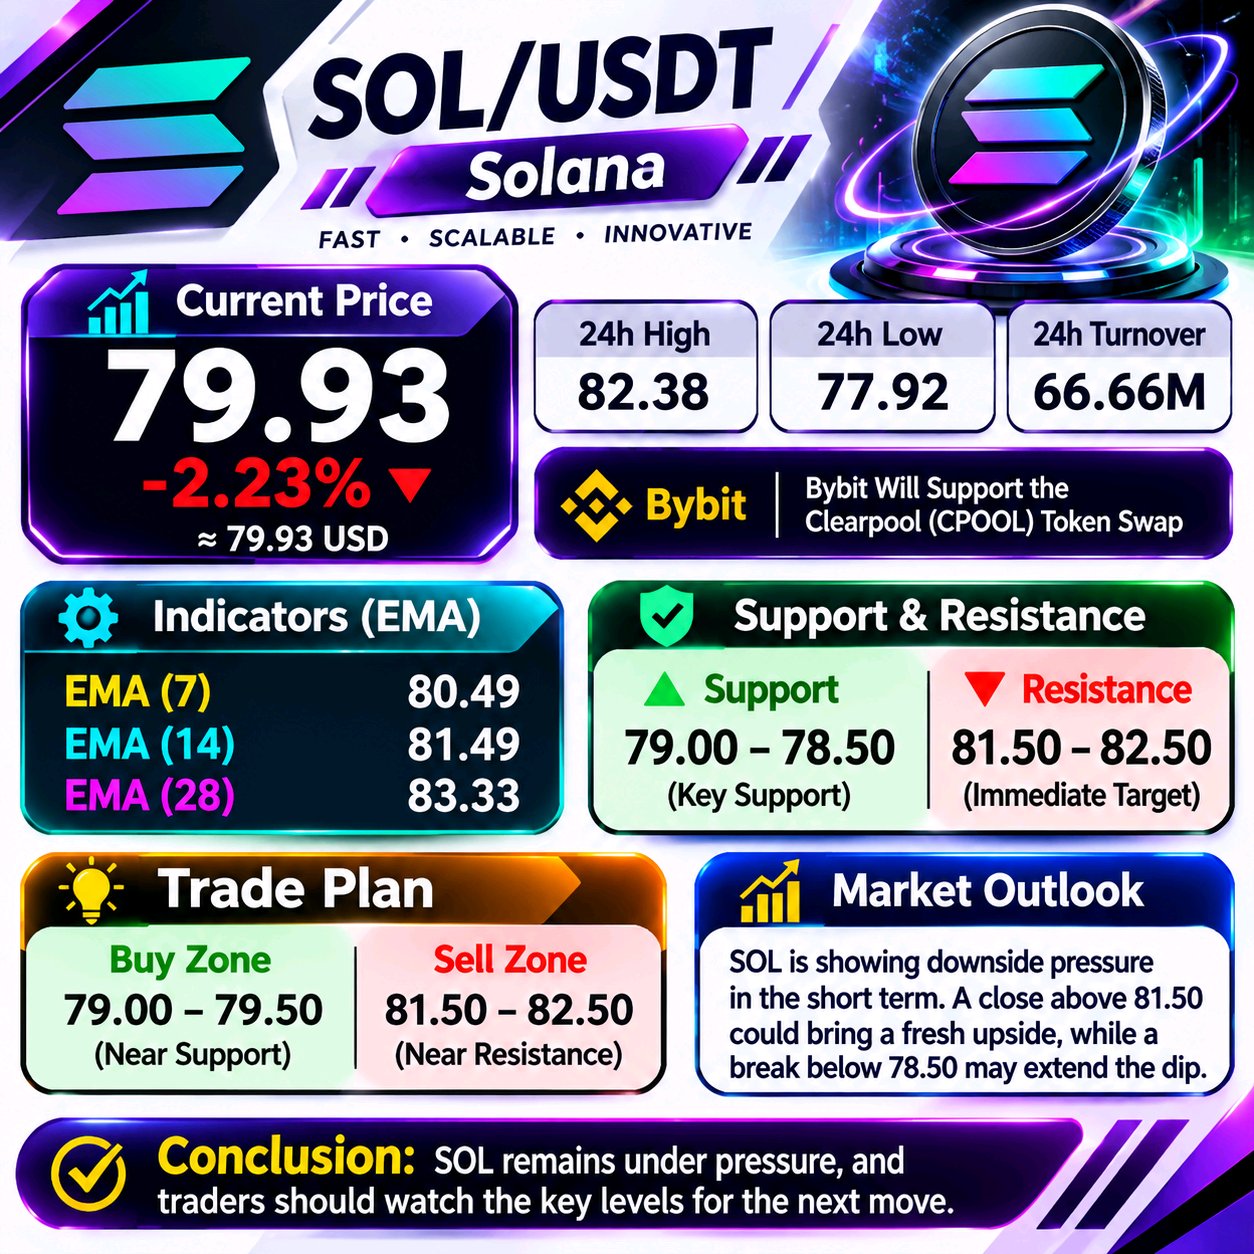
SOLANAは厳しい市場試験に直面している Solanaは現在、売り手が広範な価格構造を支配する時期を経験しています。SOLは79.93ドルで、24時間で2.23%下落しており、現在の価格とより高い移動平均線との乖離は、意味のあるトレンド回復が発展する前に、買い手がまだやるべきことがあることを示しています。 現在の構造の理解 4時間足の指標では、EMA 7が80.49ドル、EMA 14が81.49ドル、EMA 28が83.33ドルとなっています。3つとも現在の価格を上回っており、複数のレジスタンスポイントを生み出しています。82.24ドルのボリンジャーバンド中心線も、上値圧力を強めています。 しかし、直近の安値である77.92ドルには買いの関心が集まっています。これは、売り手がまだ決定的なブレイクダウンを達成していないことを示唆しています。 次の動きが展開される可能性のある場所 77.92ドル~78.50ドルの領域が、最初の重要なサポートエリアです。もし買い手がこのゾーンを守り、価格が80.50ドル以上に回復すれば、81.49ドルおよび82.24ドルへの回復が可能になります。 一方で、77.92ドルを下回るブレイクダウンが確定すれば、SOLはさらなる下落圧力にさらされる可能性があります。より強力な強気回復のためには、買い手が83.33ドルを奪還し、それを超えて勢いを維持する必要があります。 トレーディングアプローチ 慎重なロング戦略であれば、80.50ドルを上回る回復の確認が必要となり、目標としては81.49ドルおよび82.24ドルが考えられます。ショート戦略であれば、81.49ドル~83.33ドル付近での反発失敗、またはサポートラインのブレイクダウンが確定した方が、より説得力のある弱気シナリオとなるでしょう。 市場参加状況 24時間の売買代金は約6666万ドルです。オーダーブックの現状では、売り側が81%、買い側が19%となっており、現時点では売り注文の方が多く表示されています。オーダーブックの数値は急速に変化する可能性があり、将来の方向性を保証するものとして扱うべきではありません。 最終的な見解 SOLが回復を信頼できるものにするためには、いくつかのレジスタンス層を克服する必要があります。それが起こるまでは、短期的な熱狂に基づいて取引を行うよりも、資本を保護し、価格の確認を待つ方が効果的かもしれません。77.92ドルと80.50ドル付近での反応は、次のフェーズを理解するために特に重要となるでしょう。 #WSOTあなたのAI取引を見せて10USDTを獲得 #ジェンスン・ファン、NvidiaのAIリーダーシップを試す出口戦略 #米PPIが「高金利長期化」取引を試す #米国のインフレ率は高止まりし、利上げ観測が高まる #サンディスクが8対1の株式分割を発表 $SOLUSDT $BTCUSDT

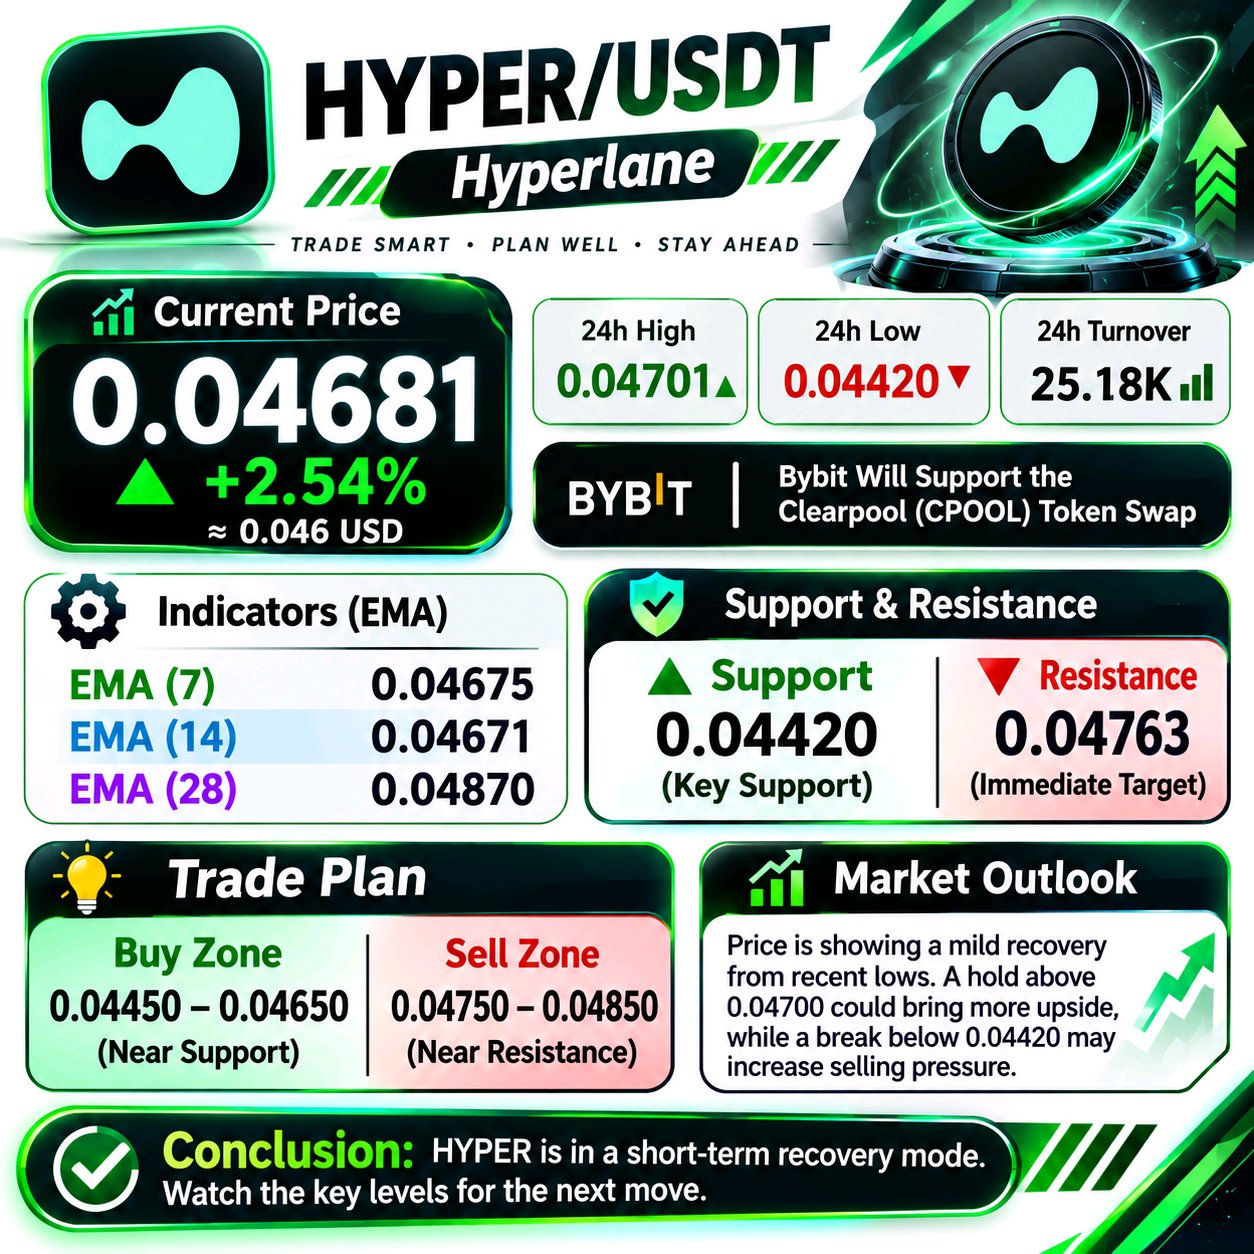
🌱 First green shoot after a 36% slide, but it's a very small one. I don't want to chase a +2.5% candle on $HYPER without more proof. I want to see a 4H close above 0.04704 (mid-band), because that would turn a bounce into a real attempt at a recovery. Here's what the 4H chart shows: 🔹 The slide: $HYPER fell from 0.06904 to a low of 0.04420, about 36%, in a steady staircase of lower highs and lower lows. 🔹 The bounce: Price touched the lower Bollinger Band area, printed the 0.04420 low, and has recovered about 6% to 0.04681. The latest candle closed back above EMA7 (0.04619) and right at EMA14 (0.04680). 🔹 The ceiling: The Bollinger mid at 0.04704 and EMA28 at 0.04870 sit just above. Both slope down and are the first real tests. 🔹 The bands: Upper 0.04961 | Mid 0.04704 | Lower 0.04447. The channel has narrowed since the selloff, which fits a pause after a long fall. 🔹 The order book: Asks are about 67% vs 33% bids. Sellers are still leaning on it, so the bounce hasn't convinced the book yet. 🔹 The liquidity: 24H turnover is only 25.18K. That's extremely thin. Price can jump or drop quickly on small orders, and slippage can be large. 🟢 Bullish: a 4H close above 0.04704, then 0.04870 and 0.04961. That would show the downtrend is losing control. 🔴 Bearish: a close under 0.04619, then the lower band at 0.04447 and the 0.04420 low. A break there continues the slide. One green candle in a downtrend is a spark, not a fire. On a market this thin, size small and respect your stop. Are you watching $HYPER or another coin? #HYPER #Hyperlane #Crypto #BinanceSquare #WSOT2026 #WSOTShowYourAITradeToEarn10USDT #JensenHuangExitTestsNvidiasAILeadership #USPPITestsTheHigherForLongerTrade #USInflationRunsHotAndRateHikeBetsRise $HYPERUSDT $HYPEUSDT

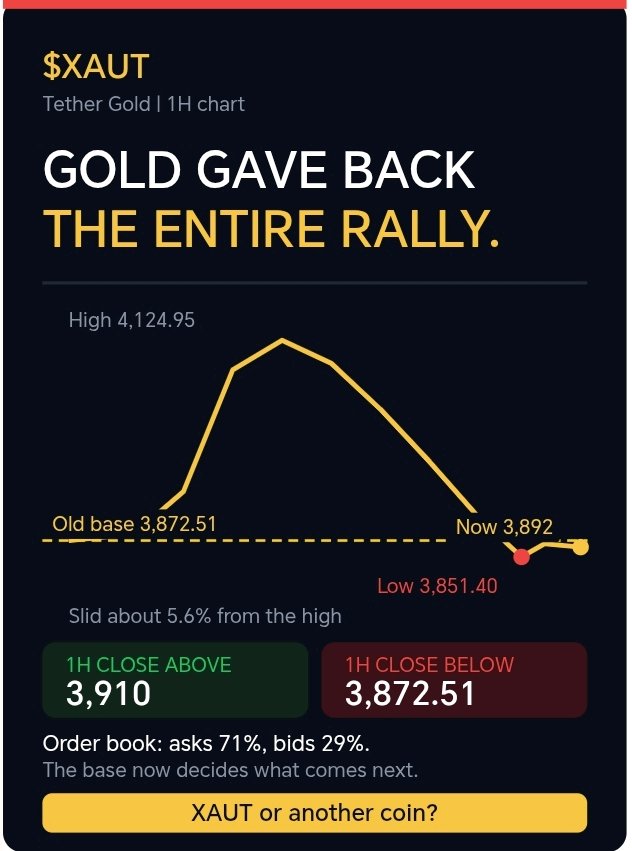
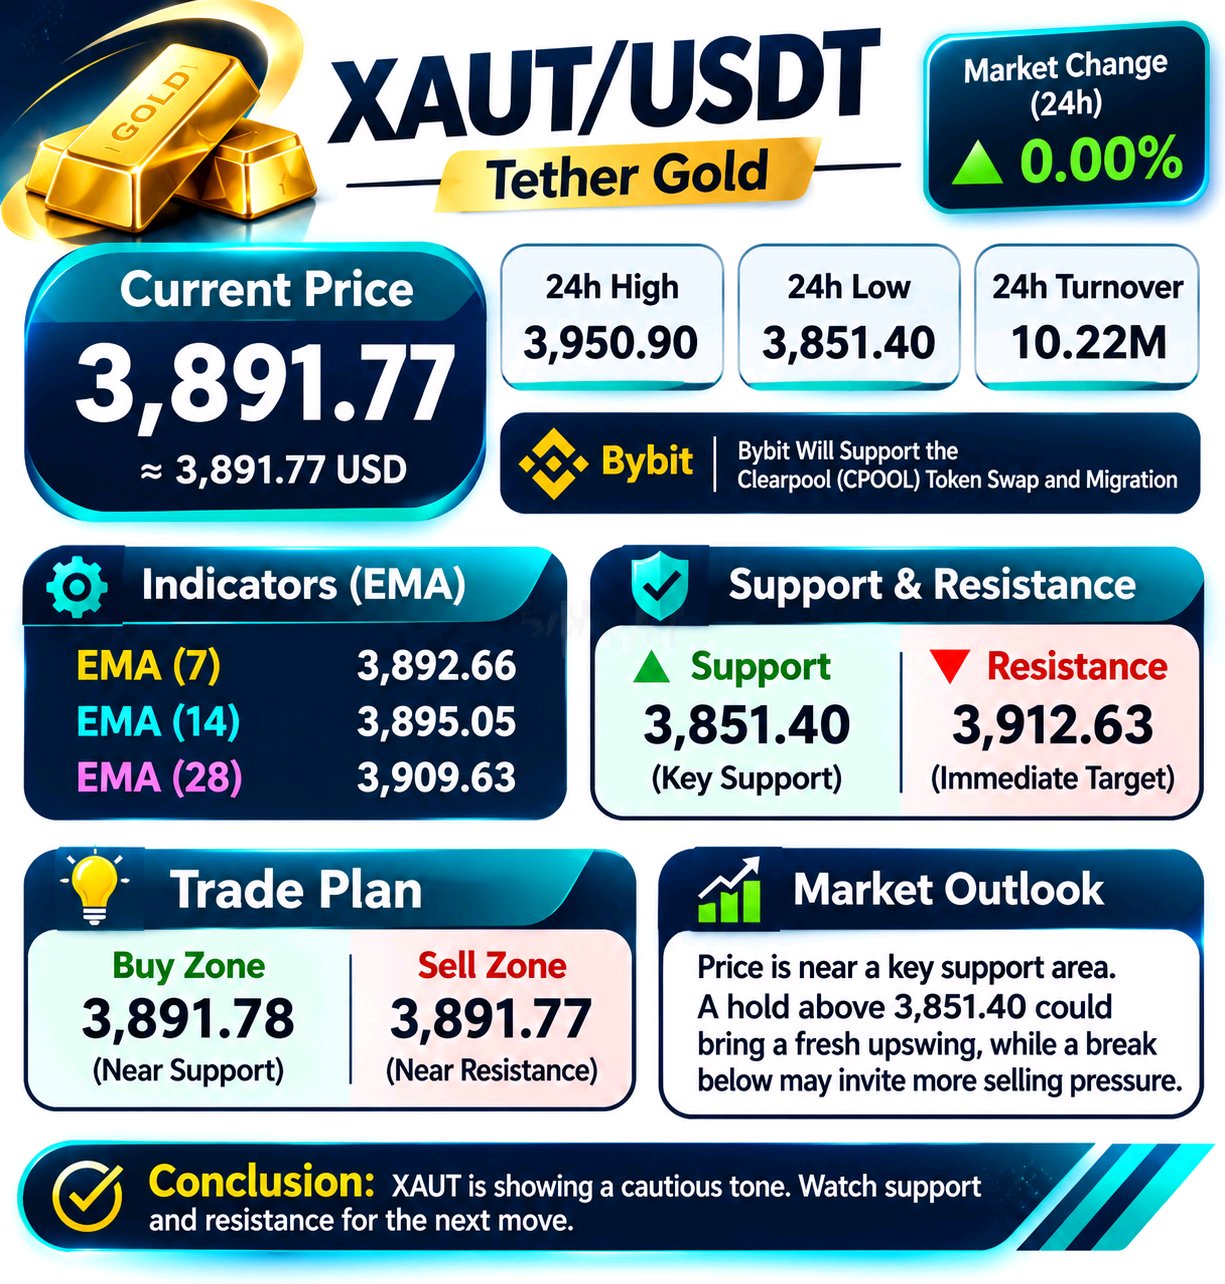
🔄 ゴールドが上昇分をすべて吐き出してしまいました。 $XAUTの売り圧力が板に残っている間は、ボトム(底)とは断定したくないですね。まずは過去のベースラインである3,872.51を維持し、1時間足で3,910を超えて引けるのを確認したいところです。 1時間足チャートは以下の通りです: 🔹 全戻し:ゴールドは先週3,872.51から上昇を開始し、4,128付近まで走りました。その後は全戻しとなり、元のベースをわずかに下回る3,851.40まで下落しました。 🔹 下落:4,124.95の高値から、高値と安値を切り下げるステアケース(階段状)の動きで約5.6%下落しました。 🔹 下ヒゲ:3,851.40の安値は過去のベースを一時的に割り込みましたが、その後反発し、現在は3,892付近まで戻しています。これはブレイクダウンの失敗(ダマシ)の可能性がありますが、まだ確定とは言えません。 🔹 移動平均線:価格はEMA7(3,892.66)とEMA14(3,895.05)のちょうど上に位置し、ボリンジャーバンドの中央線は3,886.56です。EMA28の3,909.63が最初のレジスタンスとなります。 🔹 バンド:アッパーが3,913.02、ロワーが3,860.09。バンド幅が収縮しており、ここ数時間の横ばいの動きと一致しています。 🔹 板情報(オーダーブック):売り板が約71%に対し、買い板が29%。売り圧力が強く、上値を試す動きが失敗に終わっている現状と一致しています。 🔹 レンジ:24時間の高値は3,950.90、安値は3,851.40。出来高は1,022万。 🟢 強気(ブル):1時間足で3,910を超えて引ければ、次は3,950.90を目指します。3,872.51の上を維持できれば、ベースラインを割った動きは罠(ダマシ)だったことになります。 🔴 弱気(ベア):1時間足で3,872.51を下回り、さらに3,860も割れると、3,851.40の安値へ向かう展開です。その下には目立ったサポートがほとんどありません。 全戻しにより、上昇分は完全に消滅しました。ここからの展開は、このベースラインが鍵を握っています。 皆さんは$XAUTを監視していますか?それとも他のコインを見ていますか? #XAUT #ゴールド #暗号資産 #BinanceSquare #WSOT2026 #米国のインフレ率は高止まりし、利上げ観測が高まる #サンディスクが8対1の株式分割を発表 #AnthropicIPOValuationTest #米中間選挙後、ビットコインが2か月ぶりの安値を記録 $XAUTUSDT $BTCUSDT
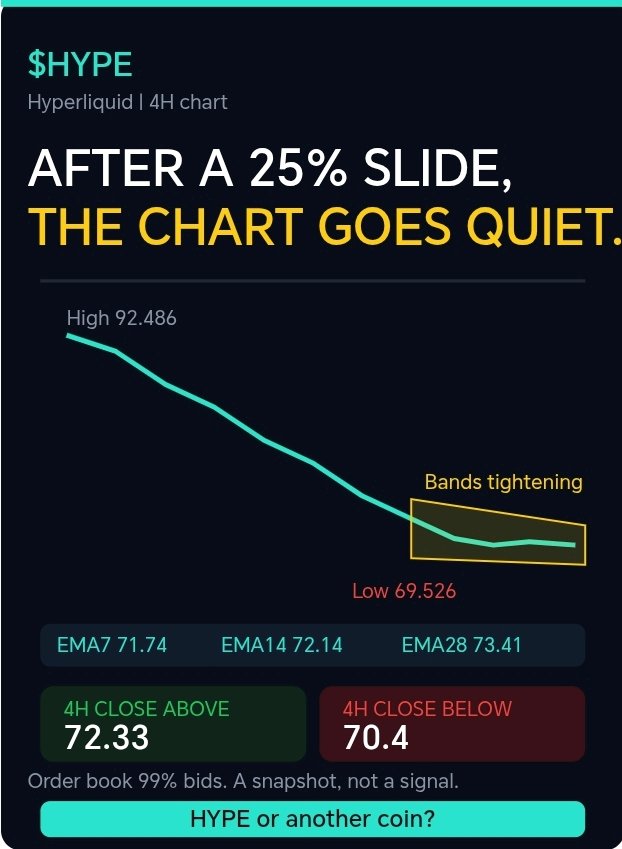
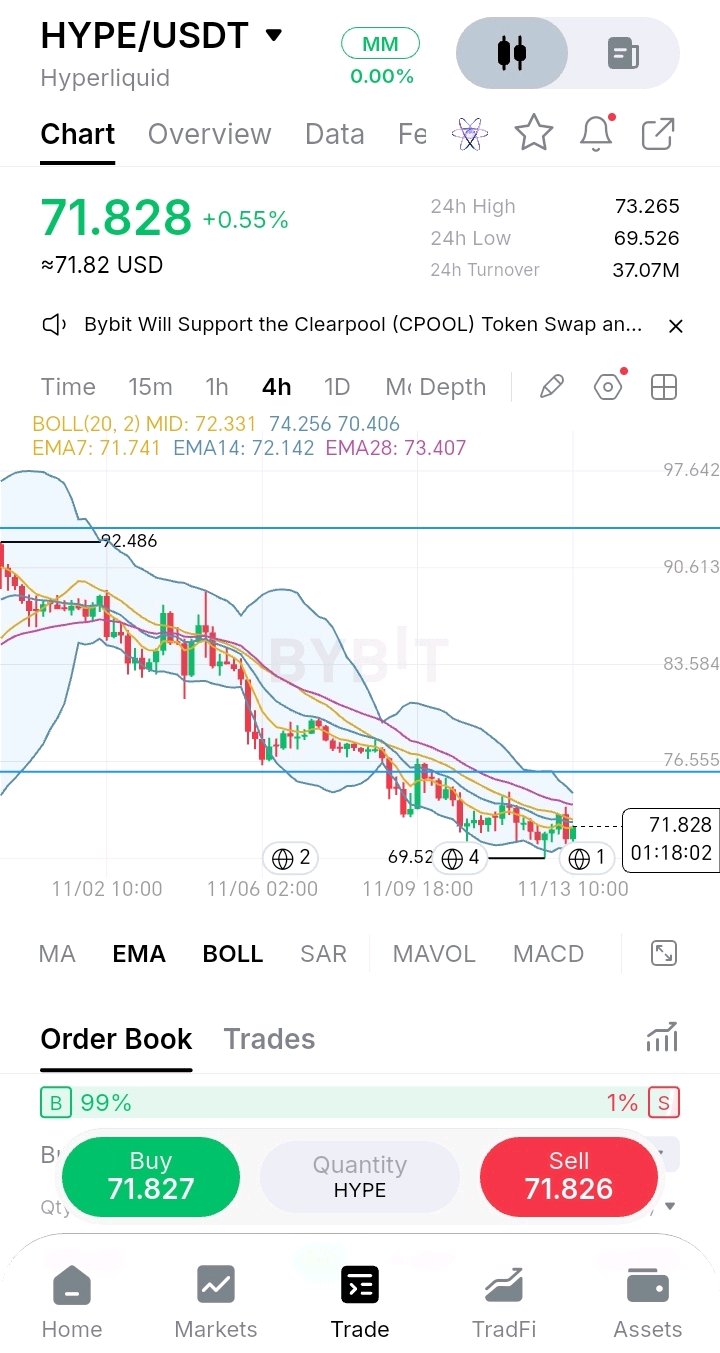
🧘 2週間足らずで25%下落した後、4時間足チャートはようやく静まり返ってきた。 $HYPEのこの落ち着きを「反転」と呼ぶのはまだ早い。回復への転換点となるのは、4時間足で72.33(ミドルバンド)を上回って確定することだ。 4時間足チャートの現状は以下の通り: 🔹 下落:92.486の高値から$HYPEは69.526まで、約25%下落。高値を切り下げ、安値を切り下げる階段状の下落が続いた。 🔹 落ち着き:ここ数日、ローソク足は小さくなり、価格は新たな安値を更新することなく、同じような水準で推移している。69.526の安値は形成されて以来、維持されている。 🔹 移動平均線:EMA7は71.74、EMA14は72.14、EMA28は73.41。短期の2本(EMA7とEMA14)は0.6%以内の範囲に収まっており、価格はそのすぐ上に位置している。下落トレンドから横ばいへと転じつつある。 🔹 ボリンジャーバンド:バンド幅が収束してきている。アッパーバンド 74.26 | ミドルバンド 72.33 | ロワーバンド 70.41。売り優勢だった時よりもチャネルが狭まっている。 🔹 オーダーブック:買い板が約99%、売り板が1%という極端な状況。しかし、買い板が90%以上あった過去の急落時も下落は止まらなかったため、これはあくまでスナップショットであり、シグナルではない。 🔹 レンジ:24時間の高値73.265、安値69.526。出来高は3,707万。 🟢 強気シナリオ:4時間足で72.33を上回って確定すれば、次は73.4、そして74.3を目指す展開。75.8のラインへの到達が、本格的な回復の第一歩となるだろう。 🔴 弱気シナリオ:4時間足で70.4を下回って確定すれば、69.526の安値が再び意識され、そこを割り込めば下落が再開する。 下落後の横ばいは「一服」に過ぎない。この後に何が来るかが重要だ。 皆さんは$HYPE、それとも別のコインを監視中ですか? #HYPE #仮想通貨 #BinanceSquare #米国のインフレ率は高止まりし、利上げ観測が高まる #サンディスクが8対1の株式分割を発表 #AnthropicIPOValuationTest #米中間選挙後、ビットコインが2か月ぶりの安値を記録 #AITechSelloffErases2Point5TrillionFromNasdaq100 $HYPEUSDT $BTCUSDT