
KnoxCrypto
5226いいね0シェア102ファン58フォロー
Spot Trader & Comunty Builder
Spot Trader & Comunty Builder
$ZILUSDT DELIVERS ALL THREE TARGETS SUCCESSFULLY ACHIEVED! Another strong move from Zilliqa ($ZIL)! Price followed the expected direction, with TP1, TP2, and TP3 all reached successfully. ZILUSDT Perpetual Current Price: $0.001179 24H Change: -14.99% All three targets have been completed, marking another successful trading opportunity. Congratulations to everyone who followed the analysis and captured this move. More market opportunities ahead. Stay focused, manage risk, and keep watching the charts! #WSOT2026

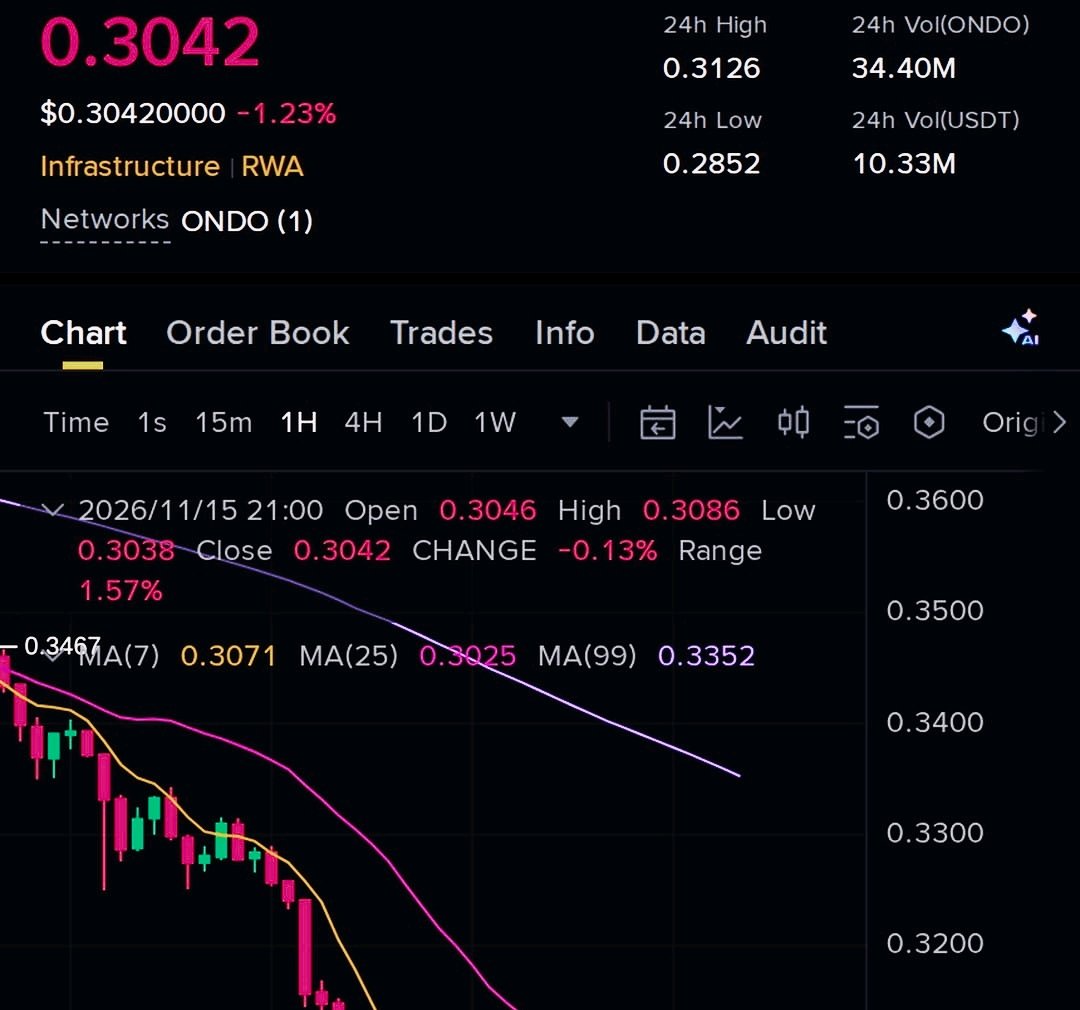
$ONDOUSDT FACES ANOTHER REJECTION SELLERS REMAIN IN CONTROL ONDO bounced toward a key resistance zone, but buyers failed to maintain upward momentum. Sellers quickly stepped in, suggesting that bearish pressure is still present and the recovery may be losing strength. The rejection around $0.3041–$0.3055 is an important area to watch. If price continues to struggle below this zone, further downside could develop. Key figures $0.3041–$0.3055 — Resistance and rejection zone $0.3122 — Level that would invalidate the bearish outlook $0.2941 — First downside support $0.2850 — Secondary support $0.2743 — Deeper downside level Bearish outlook: Continued rejection below resistance could keep sellers in control, with $0.2941 as the first important downside area. A breakdown could expose $0.2850 and potentially $0.2743. Bullish outlook: If ONDO reclaims resistance and establishes acceptance above $0.3055, bearish momentum could weaken. A move above $0.3122 would further challenge the current bearish structure. For now, ONDO remains under pressure, and the next reaction around resistance will be important. #WSOT2026

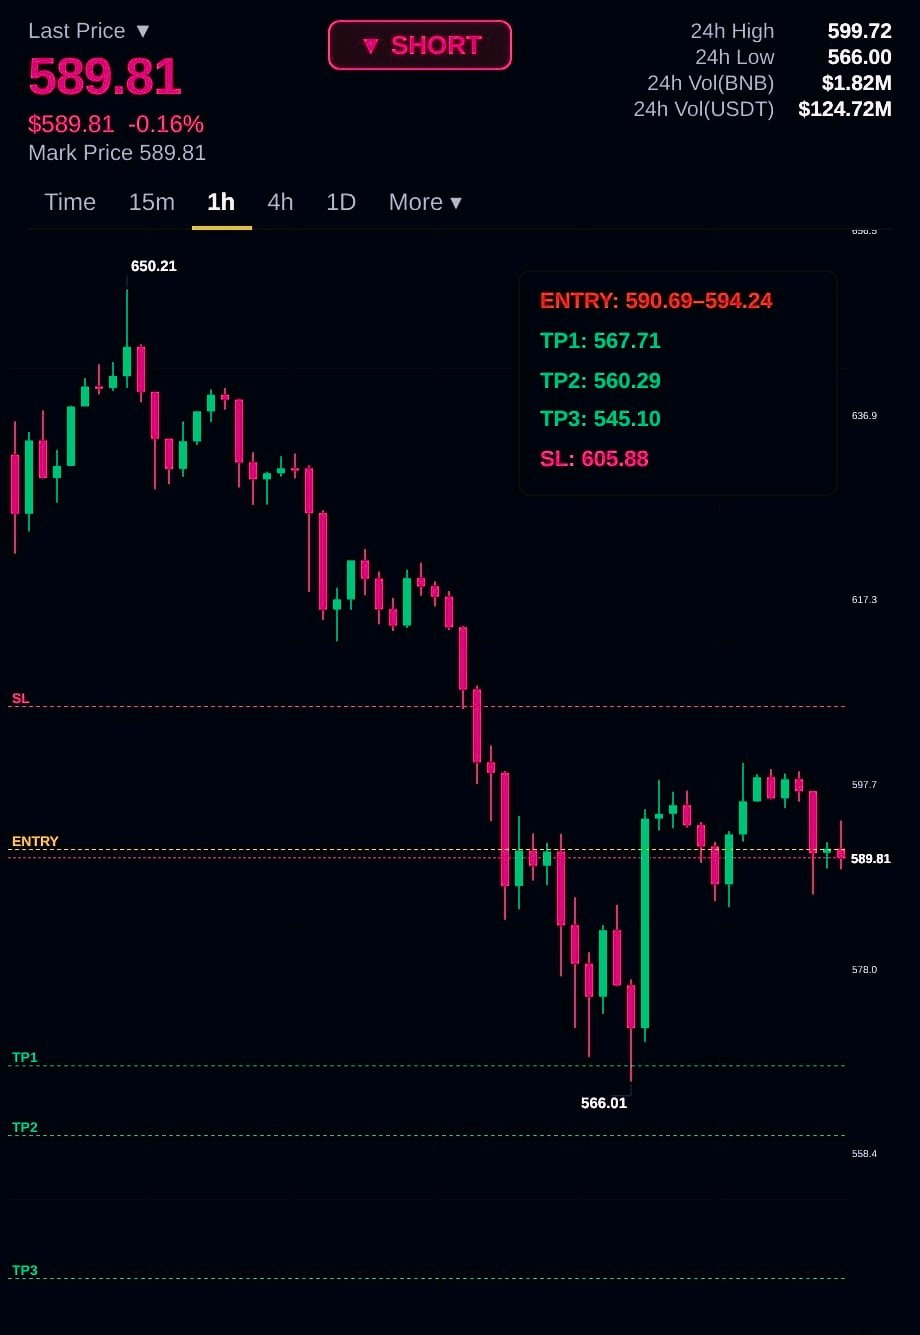
$BNBUSDT BEARS REMAIN IN CONTROL SELLING PRESSURE PERSISTS BNB is showing signs of weakness, with RSI currently around 43, indicating that bearish momentum remains stronger than buying pressure. The price is struggling to regain bullish strength, keeping the short-term outlook tilted toward the downside. Key figures $590.69–$594.24 — Entry zone $605.88 — Stop-loss level $567.71 — First downside target $560.29 — Second downside target $545.10 — Extended downside target Market outlook As long as BNB remains below the $594.24 region, sellers may continue to dominate. A rejection from this area could increase the possibility of further downside movement. However, a sustained recovery above $594.24 would weaken the bearish structure, while a move above $605.88 would invalidate this short-term bearish outlook. RSI: 43 — Momentum currently favors sellers, but further confirmation is important. Stay disciplined and manage risk carefully. #WSOT2026
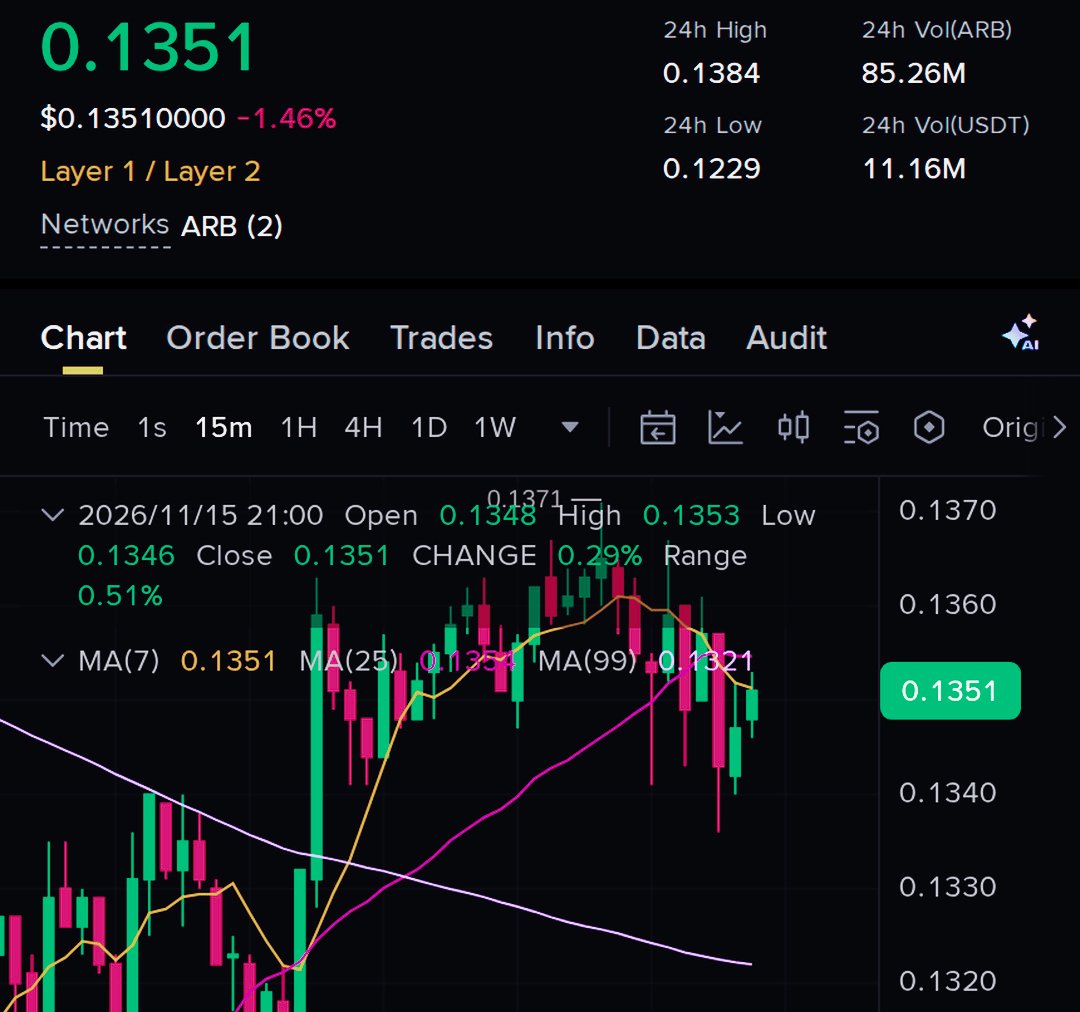
ARBUSDT は底堅さを見せており、買い手が主導権を奪還しようと試みています。 Arbitrum(ARB)は、直近の価格下落局面において予想以上の底堅さを見せており、好感の持てる強さを示しています。市場全体に不透明感が漂う中、買い手が現在の価格帯を死守しており、売り圧力は徐々に弱まりつつあることを示唆しています。 0.1348ドル~0.1352ドルの付近での反応は特に重要です。このエリアで価格が安定すれば、特に買い手の参入が続き、さらなる下落が阻止されることで、短期的な回復構造を築く助けとなるでしょう。しかし、ARBがこの反発を持続的な上昇トレンドへと発展させるには、より強力な買いの出来高が必要です。 主要指標 0.1348ドル~0.1352ドル — 買い手が価格維持を試みている重要な需要ゾーン。 0.1382ドル — 第1レジスタンスライン、初期回復のチェックポイント。 0.1406ドル — 強気モメンタムが継続した場合の次の上値目標エリア。 0.1449ドル — さらなる回復局面における高値のレジスタンス目標。 0.1328ドル — 現在の強気構造を維持するための重要なサポートラインであり、無効化ライン。 強気シナリオ ARBが0.1348ドルの水準を維持し続ければ、買い手が徐々に価格を0.1382ドルに向けて押し上げる可能性があります。このレベルを上回る動きに成功すれば、短期的な構造が改善され、0.1406ドルへのさらなる回復余地が生まれる可能性があります。 もし買い圧力が高まり、出来高がブレイクアウトを後押しすれば、0.1449ドルのエリアが次に注目すべき重要な領域となるでしょう。 弱気シナリオ 買い手が現在の需要ゾーンを守れなければ、回復の芽は摘まれてしまいます。0.1348ドルを維持できず下回る動きが続けば、需要の弱まりを示し、売り圧力がさらに強まる可能性があります。 0.1328ドルのサポートを割り込むと、現在の強気の見通しは無効となり、短期的なトレンドの主導権が売り手に戻ったことを意味します。 市場見通し ARBは直近の安値付近でより強い回復力を見せており、買い手にとっては心強い展開です。しかし、サポートを維持することは最初のステップに過ぎません。真の確認は、0.1382ドルを上回る持続的な回復、そして0.1406ドル付近での安定した推移が達成された時にもたらされます。 現時点では、買い手がこの守りのプライスアクションを真の上昇モメンタムに変えられるかどうかが鍵となります。 WSOT2026

$UNIUSDT 再び拒絶に直面、売り圧力が復活。 Uniswap(UNI)は、重要なレジスタンスゾーン付近で再び売り手が介入し、回復を維持するのに苦戦しています。直近の反発により価格は再び弱気圧力が目立つエリアに戻っており、買い手が主導権を握るのに依然として苦労していることを示唆しています。 5.12ドルから5.148ドル付近での拒絶には注目が必要です。もしUNIがこの領域を維持できなければ、回復の勢いが失われ、さらなる下落への道が開かれる可能性があります。ただし、深い調整を予想する前に、プライスアクションによる確認が引き続き重要です。 注目すべき重要な数値 5.12ドル~5.148ドル — 直近のレジスタンスおよび拒絶ゾーン。 4.972ドル — 注目すべき最初の下値水準。 4.849ドル — 売り手が主導権を維持した場合の二次的なサポート。 4.679ドル — さらなる弱気展開となった場合の深い下値領域。 5.241ドル — 弱気シナリオの無効化水準。 弱気シナリオ UNIがレジスタンスゾーンを下回ったままであれば、売り手が短期的な構造を支配し続ける可能性があります。4.972ドルを割り込むと、4.849ドルに向けた下落圧力が強まるかもしれません。暗号資産市場全体でさらなる弱気な動きがあれば、4.679ドルの領域まで試す展開が予想されます。 強気シナリオ 一方で、5.148ドルを上回る力強い回復を見せれば、弱気な見通しに異議を唱えることになります。買い手がレジスタンスを奪還し、その上で維持できれば、売り圧力は徐々に弱まる可能性があります。5.241ドルへの上昇は、現在の弱気構造が力を失いつつあることを示す重要なシグナルとなるでしょう。 市場の見通し UNIは直近の回復の試みの後、躊躇(ちゅうちょ)を見せており、レジスタンスは引き続き売り手を引き寄せています。次の動きは、買い手が5.14ドルのエリアを奪還できるか、それとも売り手が価格をより低いサポートまで押し下げられるか次第となるでしょう。 短期的な動き一つひとつに反応するのではなく、確認作業に集中し、慎重にリスク管理を行ってください。 #WSOT2026

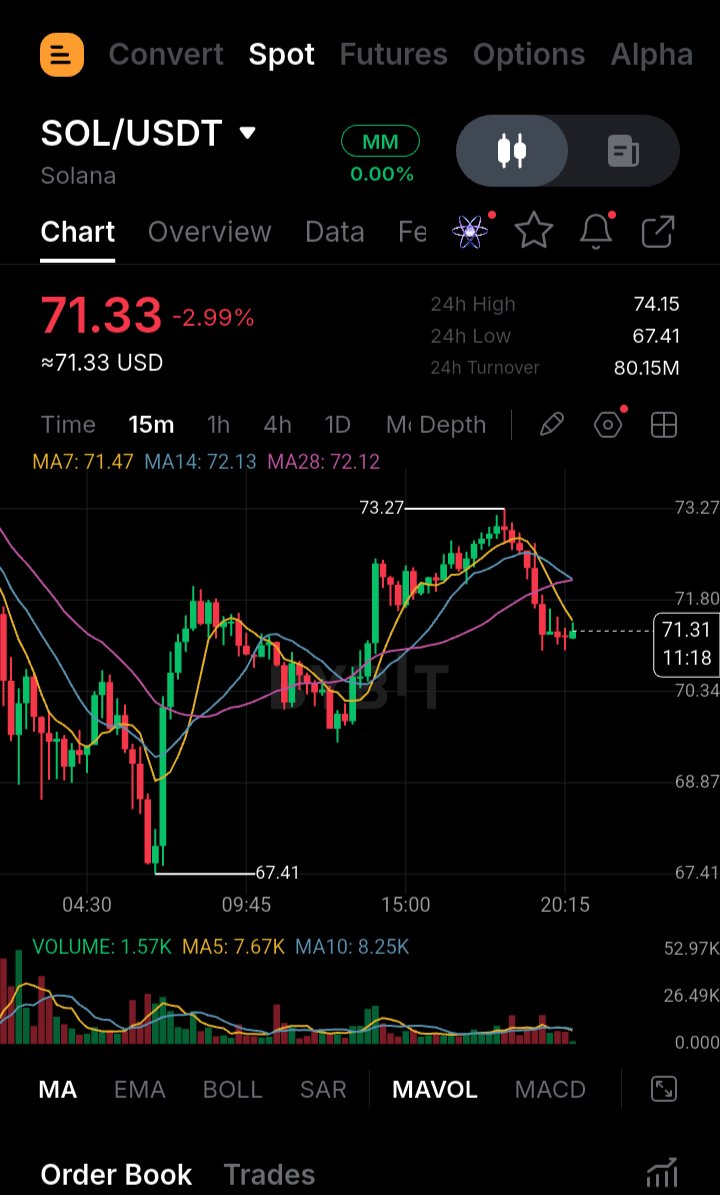
$SOLUSDT 売り圧力に直面、さらなる調整を警戒 Solanaは、主要なレジスタンスエリア付近で上値を維持するのに苦戦しており、弱さの兆候が見られます。買い手は価格を押し上げようと試みていますが、売り圧力が顕著になりつつあり、回復の勢いが失われつつあることを示唆しています。 現在のチャート構造は、特にSOLが71.30ドル付近で引き続き拒絶される場合、慎重な弱気の見通しを示唆しています。このエリアを奪還できなければ、売り手が再び価格をより低いサポートレベルまで押し下げる機会を与える可能性があります。 重要な数値 71.14ドル〜71.30ドル — 重要なレジスタンスおよびエントリーゾーン。 69.09ドル — 注視すべき最初のダウンサイドレベル。 67.30ドル — 売り圧力が強まった場合の二次的なサポート。 65.52ドル — 調整が拡大した場合のより深いダウンサイドレベル。 73.39ドル — 弱気構造の無効化レベル。 弱気シナリオ SOLがレジスタンスゾーンを突破できず、高値を切り下げる動きが続けば、売り手がコントロールを取り戻す可能性があります。69.09ドルを下回る持続的な動きは、下落の勢いを強め、67.30ドルの領域が試される可能性があります。市場全体の弱さが続けば、65.52ドルのエリアも視野に入ってくるでしょう。 強気シナリオ しかし、買い手が71.30ドルを奪還し、レジスタンスの上で価格が定着すれば、弱気の見通しは弱まる可能性があります。73.39ドルへの回復は、現在のダウンサイド構造を無効化し、買い手が主導権を取り戻しつつあることを示唆します。 市場の見通し SOLはレジスタンス付近で引き続き圧力を受けていますが、さらなる大幅な下落を想定する前に確認が重要です。71.14ドル〜71.30ドル付近での反応と、最初のサポート付近での価格動向を注視してください。 言及されたレバレッジ:24倍。ボラティリティの高い市場環境では、リスク管理が不可欠です。 #WSOT2026

$2.05B IN CRYPTO POSITIONS WIPED OUT AS LONGS FACE MASSIVE PRESSURE The crypto market has experienced a major liquidation wave over the past 24 hours, affecting 329,339 traders. Long traders absorbed most of the damage, accounting for approximately $1.922 billion (93%) of total liquidations. The largest individual wipeout was a $16.17 million ETH position on Binance. Meanwhile, ETH is trading around $1,831.38, down 3.21%. Is this massive sell-off clearing excessive leverage before a potential market rebound, or could further downside still be ahead? The next move could reveal whether buyers are ready to step back in or sellers remain in control.$ETHUSDT $NEARUSDT #WSOT2026

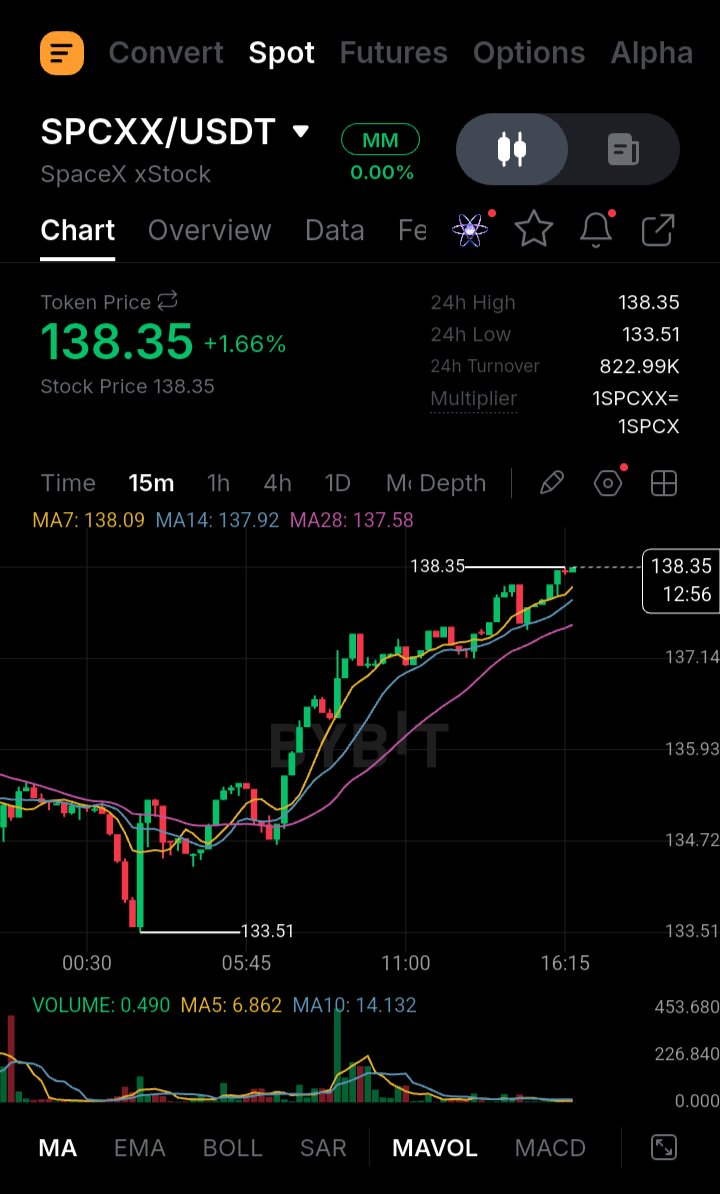
$SPCXXUSDT RECOVERY MOMENTUM BUILDING CAN BUYERS PUSH TOWARD $148.50? SPCX is showing encouraging signs of recovery after buyers stepped in around the $133.00 support region and prevented further downside. Price has climbed from $133.55 to $138.33, indicating that buying interest is gradually returning after the recent correction. The latest rebound suggests that sellers are losing some control, but bulls still need to overcome nearby resistance before a stronger upward move can develop. The $139.40 level is particularly important because a decisive breakout above this area could attract additional buying pressure and strengthen the recovery structure. Key figures $138.33 — Current price area $133.00–$133.55 — Major support zone $139.40 — Immediate resistance and breakout level $142.70 — Next upside objective $148.50 — Extended recovery level Bullish Scenario If SPCX continues holding above $133.00, buyers may have an opportunity to extend the current recovery. A sustained move above $139.40 would be an important confirmation of improving momentum and could open the way toward $142.70. If bullish pressure remains strong beyond that level, the next area to watch would be $148.50. Reaching this zone would indicate a more substantial recovery rather than just a temporary bounce. Bearish Scenario On the downside, failure to break above $139.40 could lead to another period of consolidation or a short-term pullback. Losing the $133.00 support zone would weaken the recovery structure and suggest that sellers are regaining control. Market Outlook SPCX is showing early signs of renewed buying interest, but confirmation is still needed. The reaction around $139.40 will be important in determining whether this recovery can develop into a stronger rally. Can SPCX bulls secure a breakout above $139.40 and push toward $142.70, or will sellers interrupt the recovery? #WSOT2026

$ADAUSDT SHOWS RECOVERY STRENGTH AFTER RECLAIMING $0.1539 BUYERS TRY TO REGAIN CONTROL Cardano is showing renewed buying interest after recovering from the $0.1430 support area and pushing back above the important $0.1539 level. This recovery suggests that buyers are attempting to regain control after the recent downside pressure. The latest price movement is encouraging, but the bigger question is whether ADA can maintain its position above the reclaimed level and attract enough buying volume to extend the recovery. The $0.1539 area is now an important level to monitor. If buyers successfully defend it during upcoming pullbacks, it could gradually become a stronger support zone rather than acting as previous resistance. However, a brief move above resistance is not enough to confirm a sustained trend reversal. Consistent buying activity and stronger volume will be important. Key figures $0.1430 — Previous support and recent recovery base $0.1539 — Important reclaimed price level $0.1539–$0.1548 — Current breakout and retest area $0.1580 — First major upside resistance $0.1600 — Psychological resistance and important market level $0.1630 — Higher resistance and potential recovery objective $0.1500 — Important downside level to monitor Bullish market scenario: If ADA continues holding above $0.1539, buyers could maintain the recovery structure and attempt another move toward $0.1580. A convincing breakout above this resistance, supported by stronger volume, would improve the short-term outlook and potentially open the way toward $0.1600. If buying pressure remains consistent beyond $0.1600, the next important area to watch would be $0.1630. A successful move above these resistance levels could indicate that market sentiment is gradually shifting in favor of buyers. Bearish market scenario: On the other hand, failure to maintain $0.1539 could weaken the current recovery. If sellers push ADA back below this level and buyers fail to reclaim it, the market may experience another pullback. A move toward $0.1500 would become important to monitor, as losing this area could increase downside pressure and bring the previous $0.1430 support zone back into focus. Overall market structure: ADA is showing early signs of recovery, but the market still needs stronger confirmation before calling this a sustained bullish reversal. The most important factor now is whether buyers can turn $0.1539 into reliable support. Trading volume, Bitcoin's overall direction, and ADA's reaction around nearby resistance levels will help determine whether this recovery has enough strength to continue or whether sellers will regain control. For now, $0.1539 remains the level that deserves the closest attention. #WSOT2026

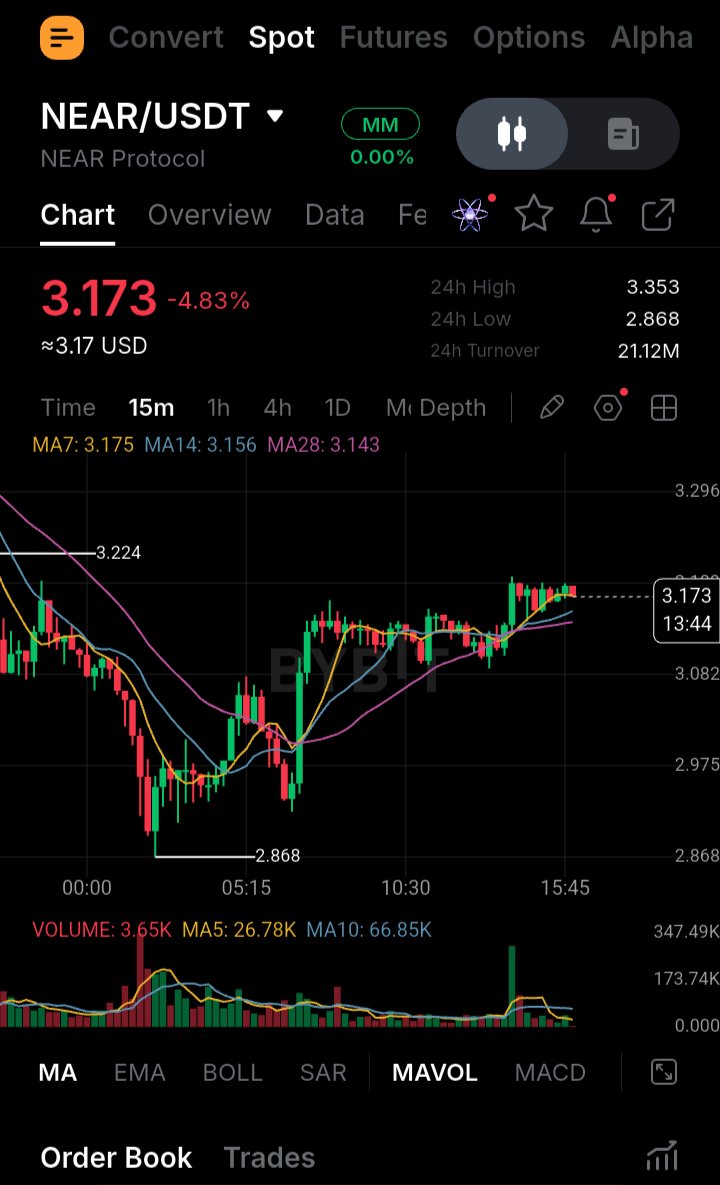
$NEARUSDT BULLISH MOMENTUM: BUYERS DEFEND $3.087 SUPPORT AS RECOVERY CONTINUES NEAR is showing signs of renewed buying interest after bouncing from the $3.0870 support zone. Price is currently trading around $3.183, indicating that buyers are attempting to maintain control and extend the recovery. The key area to watch is $3.130–$3.087. As long as buyers continue defending this zone, the bullish structure remains intact. A strong breakout above $3.198, supported by increasing trading volume, could provide further momentum for an upward move. Key figures $3.183 — Current market price $3.130–$3.087 — Major support and demand zone $3.198 — Important breakout resistance $3.220 — First upside target $3.300 — Secondary resistance $3.400 — Major upside objective $3.050 — Critical downside invalidation level Bullish scenario: If NEAR holds above the support zone and successfully breaks through $3.198 with strong volume, buyers could push the price toward $3.220. Continued momentum may open the way toward $3.300, with $3.400 becoming the next major upside objective. Bearish scenario: However, losing the $3.087 support could weaken the recovery and bring sellers back into control. A deeper move below $3.050 would invalidate the current bullish setup and suggest further downside risk. Market outlook: NEAR is showing encouraging recovery signals, but confirmation is still important. Watch the $3.198 breakout level, support strength, trading volume, and Bitcoin's direction before drawing conclusions. The next move will depend on whether buyers can turn this recovery into a sustained bullish continuation. #WSOT2026
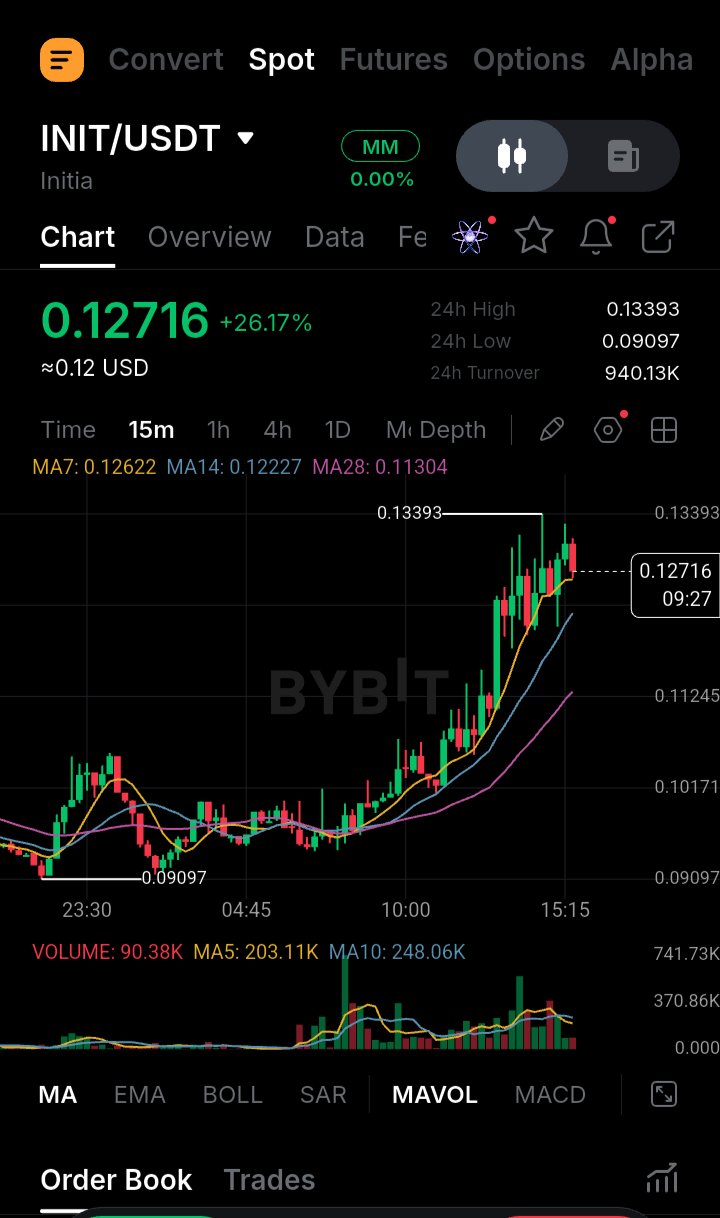
$INITUSDT SHOWS STRENGTH AFTER 32% RALLY CAN BUYERS PUSH TOWARD $0.15? INIT is showing encouraging bullish momentum following its recent 32% surge. Buyers are attempting to maintain control, with the $0.1320 area becoming an important level to watch. As long as price stays above this zone, the recovery structure remains constructive. A move above $0.1397 could attract additional buying interest and create room for a continuation toward $0.1450 and potentially $0.1520. Key figures $0.1320–$0.1340 — Important support and price-holding zone. $0.1397 — Key resistance and bullish breakout level. $0.1450 — Next upside area. $0.1520 — Higher resistance target. Bullish Scenario: Holding above $0.1320 and breaking through $0.1397 could strengthen upward momentum and support a move toward $0.1450–$0.1520. Bearish Scenario: Losing $0.1320 could weaken the recovery structure, while a drop below $0.1270 would put the bullish outlook under further pressure. Market Outlook remains worth watching, but confirmation above resistance is important before assuming the rally has more room to run. #WSOT2026

Tom Lee sees the crypto crash as temporary, believing current market pressures won't derail the bigger supercycle. Is he right, or is more downside coming? $NVDA


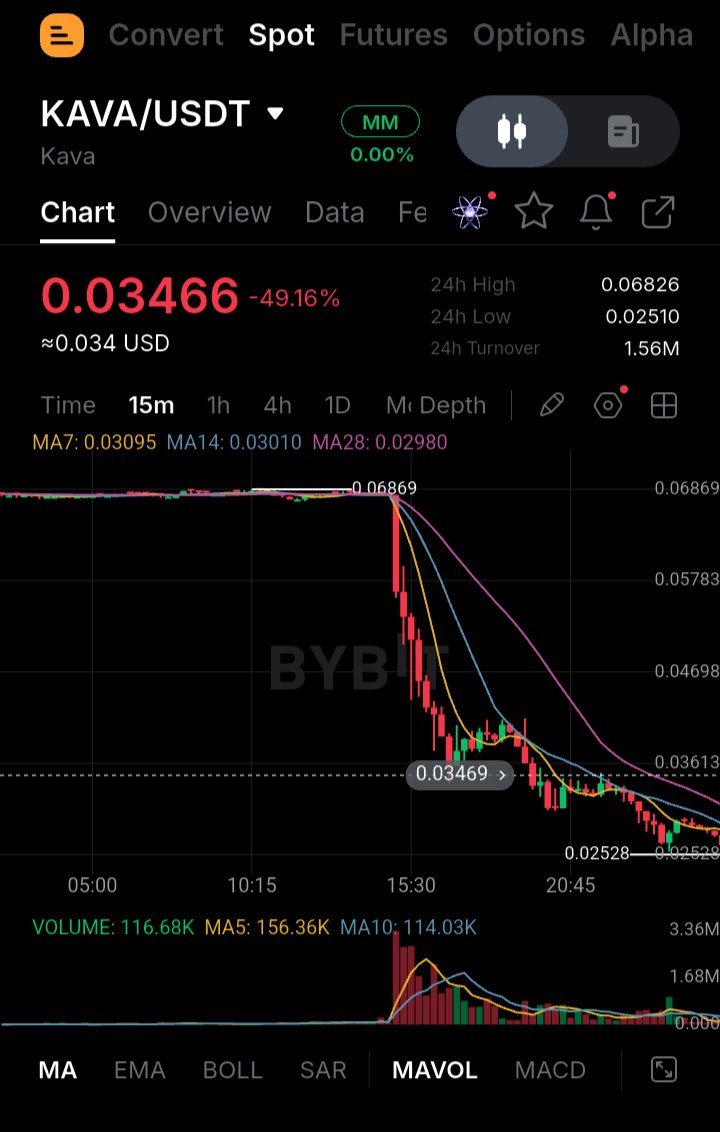
$KAVAUSDT SHOWING EARLY RECOVERY SIGNS $0.043 BACK IN FOCUS? has experienced a significant decline of more than 52%, but recent price action suggests that buyers are starting to defend the $0.025 support area. The rebound toward $0.03234 indicates that selling pressure may be easing, although a confirmed trend reversal is still needed. Key figures $0.03234 — Current price area $0.02500 — Major support zone to watch $0.03700 — First important resistance $0.04300 — Next upside level if recovery continues Bullish scenario: If KAVA continues holding above $0.025, buyers could gradually regain control. A sustained move above $0.03234 would strengthen the recovery outlook, with $0.037 and eventually $0.043 becoming important resistance areas. Bearish scenario: Despite the recent bounce, the broader market structure remains weak. If buyers fail to maintain momentum and KAVA loses the $0.025 support, renewed selling pressure could push the price toward lower levels. For now, the $0.025 zone remains the most important level to monitor. The next move will depend on whether buyers can turn this relief bounce into a stronger recovery. Is $KAVA preparing for a genuine comeback, or are we simply seeing a temporary relief rally?

Tom Lee Sees the Recent Crypto Sell-Off as a Temporary Setback, Not the End of the Bull Cycle. Tom Lee believes the latest pressure across crypto markets is being driven by several external factors rather than a breakdown in the long-term market outlook. He points to Nvidia-related margin calls, investors reducing exposure ahead of the anticipated Anthropic IPO, the release of previously frozen hack-related funds, growing concerns around AI disruption, and increased US scrutiny of chip exports. Despite these challenges, Lee remains confident that the broader crypto supercycle is still intact. In his view, the current weakness is part of a temporary phase, and these market pressures could fade with time. But what do you think? Is this simply a short-term correction before the next major crypto rally, or could the market face more downside before recovering? #WSOT2026 $NAVXUSDT $ETHUSDT


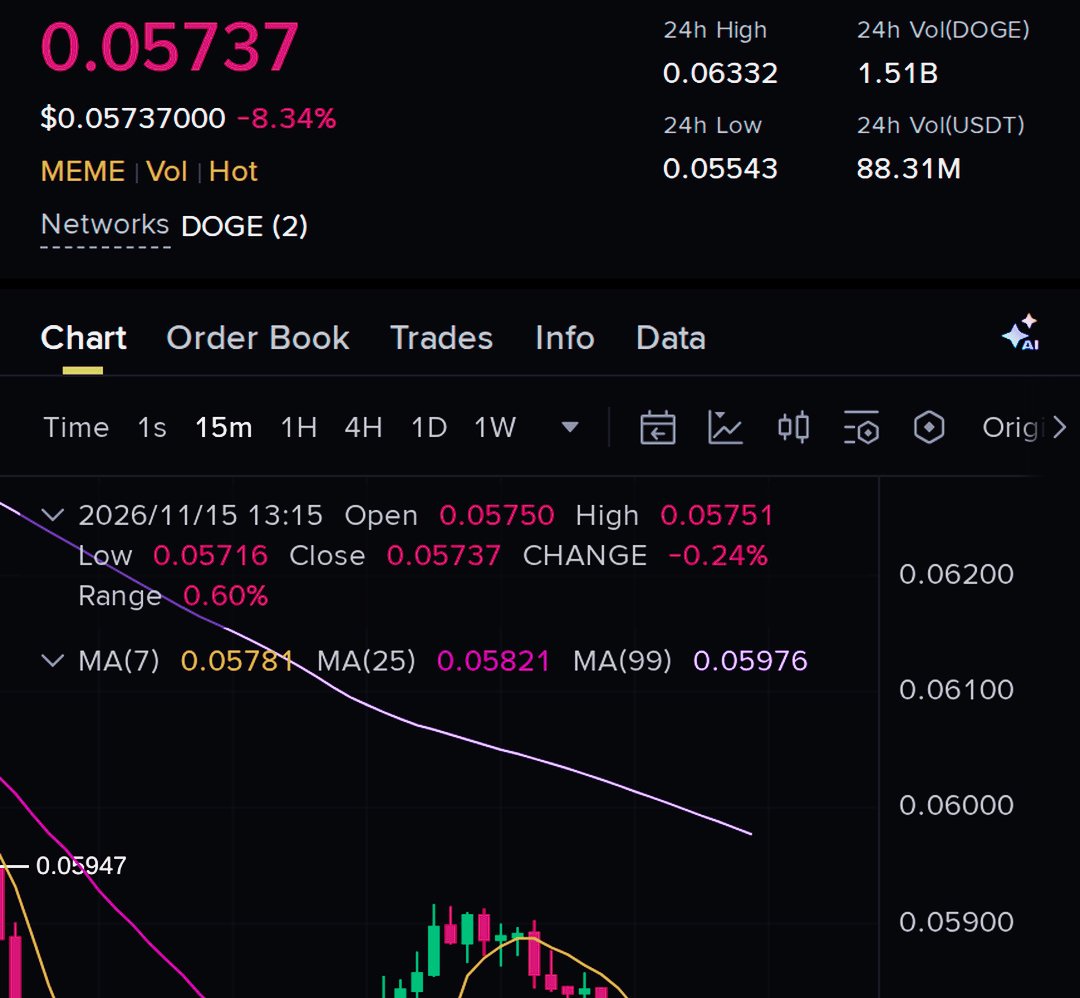
$DOGEUSDT 弱気トレンドが継続中 Dogecoinは依然として以前のサポートエリアを回復するのに苦戦しており、買い手が現在の短期的な弱気トレンドを反転させるのに十分な強さを見せていないことを示唆しています。回復の試みが失敗するたびに売り圧力が強まり、以前のサポートゾーンを上回る強力なポジションを確立できないことが、売り手に優位性をもたらしています。 ここでの重要な要素は、現在の価格帯周辺でDOGEがどのような反応を示すかです。買い手がこのエリアを維持し続けることができなければ、さらなる下落が展開する可能性があります。しかし、急激な回復と強力な買い注文が入れば、この弱気な構造に挑戦できるかもしれません。 主要数値 エントリーゾーン: 0.05735–0.05747 — 弱気トレンドの継続の可能性を監視するエリア。 TP1(利益確定目標1): 0.05569 — 最初の下値目標。 TP2(利益確定目標2): 0.05425 — 次の重要な下値レベル。 TP3(利益確定目標3): 0.05282 — 売り圧力が加速した場合のさらなる下値目標。 損切り(ストップロス): 0.05867 — この設定を無効にするレベル。 レバレッジ: 40倍 — ハイリスクなレバレッジポジション。 弱気シナリオ DOGEが回復ゾーンを下回って取引を続け、売り手が主導権を握り続けた場合、価格は徐々に0.05569に向かう可能性があります。このレベルを明確に割り込むと、0.05425付近の次のサポートが試される可能性があります。市場全体の弱さが続けば、0.05282が注視すべき重要なエリアとなるでしょう。 強気シナリオ 一方で、DOGEが失われたサポートを回復し、買い圧力を維持できれば、弱気の見通しは弱まり始める可能性があります。0.05867に向けて上昇すれば、現在の設定は無効となり、買い手が主導権を取り戻していることを示します。 市場の見通し 今のところ、DOGEは説得力のある回復を見せていないため、売り目線が中心となります。ただし、40倍のレバレッジは重大な清算リスクを伴うため、ポジションサイジングとリスク管理が特に重要です。 #WSOT2026

Bitcoin Whales Are Accumulating While Smaller Players Reduce Exposure$BTCUSDT $DOGEUSDT Despite Bitcoin's sharp 24% correction, large holders appear to be taking a different approach. Data from CryptoQuant shows that wallets holding more than 1,000 BTC added approximately 47,000 BTC during the market downturn. On the other side, mid-sized investors have been reducing their holdings, while overall Bitcoin demand has weakened to its lowest point since April 2025. This creates an interesting market dynamic: major holders are increasing their exposure while broader demand remains under pressure. The key question now is whether whale accumulation can eventually outweigh selling pressure and support Bitcoin's next recovery phase. #WSOT2026

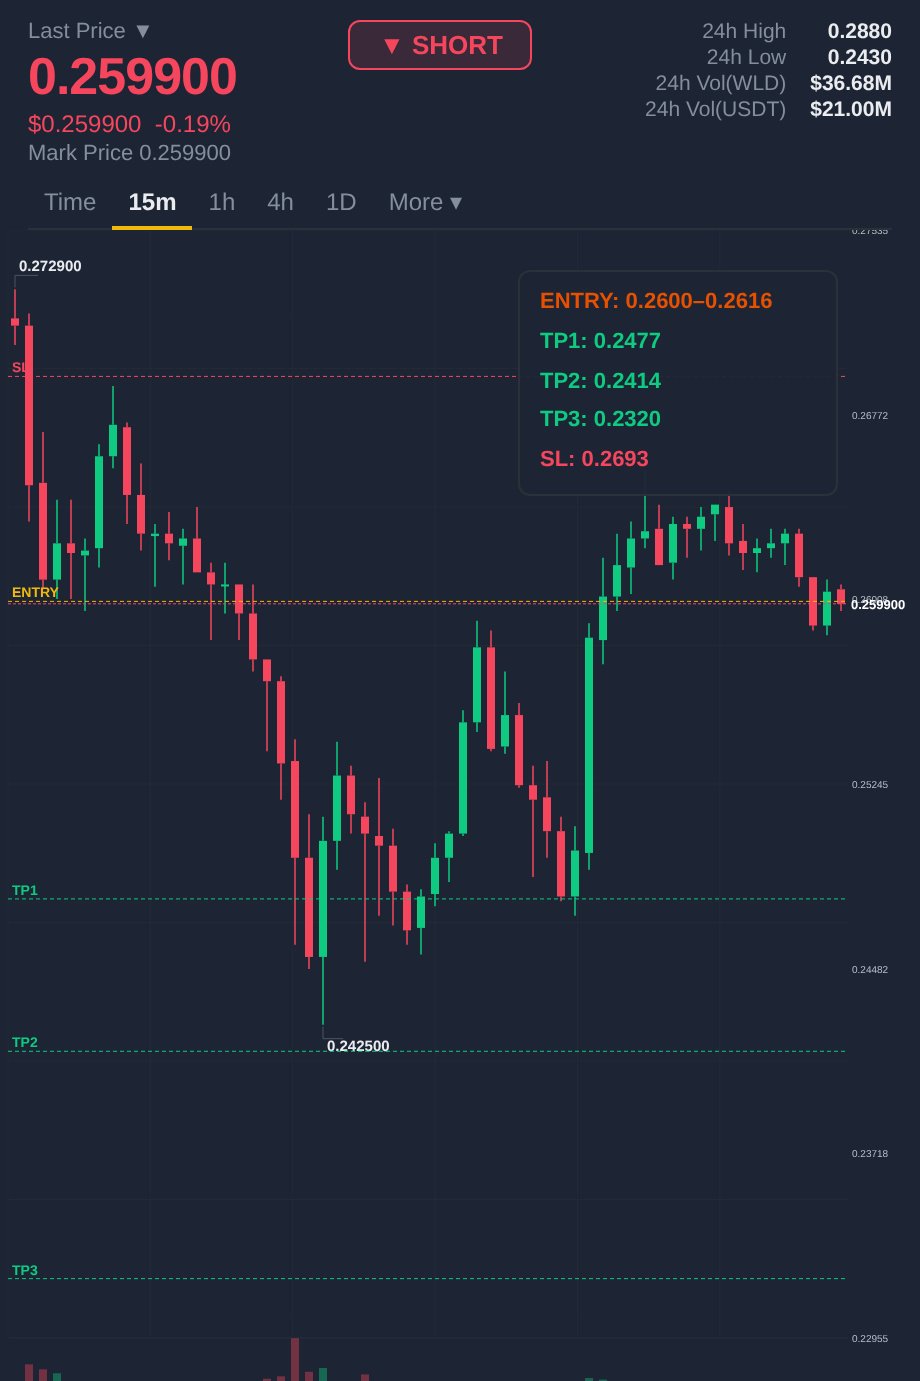
WLDUSDTはレジスタンス付近で拒絶された後、弱気な反転の兆しを見せています。RSIが42まで冷え込んでいるため、モメンタムには細心の注意が必要です。 -0.044%というマイナスの資金調達率も、デリバティブ市場における異常なポジションを示唆しています。売り手が圧力を維持すれば、WLDはより低いサポートゾーンを再テストする可能性があります。 主要数値 $0.2600–$0.2616 — レジスタンスおよび拒絶ゾーン $0.2693 — 重要な無効化レベル $0.2477 — 最初のダウンサイドサポート $0.2414 — 第2サポート $0.2320 — 主要なダウンサイドレベル 市場見通し レジスタンス以下での持続的な拒絶は、弱気の勢いを強め、さらなる下落の可能性を高める可能性があります。しかし、$0.2693を超えると弱気の見通しは弱まります。 結論を出す前に、価格動向と出来高を注視してください。 #WSOT2026

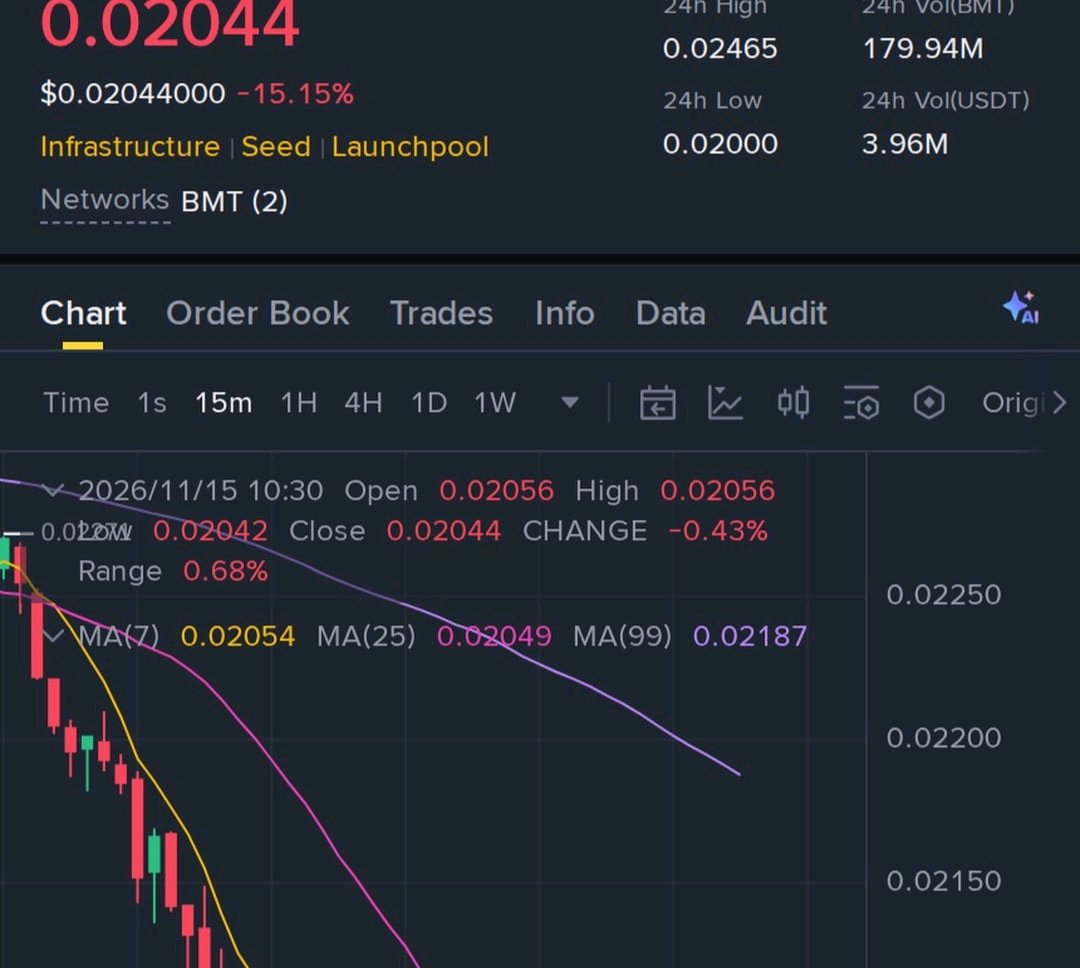
$BMTUSDT is showing potential signs of a bullish recovery, and buyers could step in if the price manages to hold its nearby support zone. After recent price movements, a successful bounce could open the door for another upward move. Keeping this long setup on watch with approximately 46x leverage. Entry Zone: 0.02038–0.02045 Key figures - 0.01980 — First upside target - 0.01929 — Second upside target - 0.01878 — Third upside target - 0.02088 — Risk level A strong bounce from the current area could support a recovery, but confirmation from buying volume is important before expecting further upside. #WSOT2026
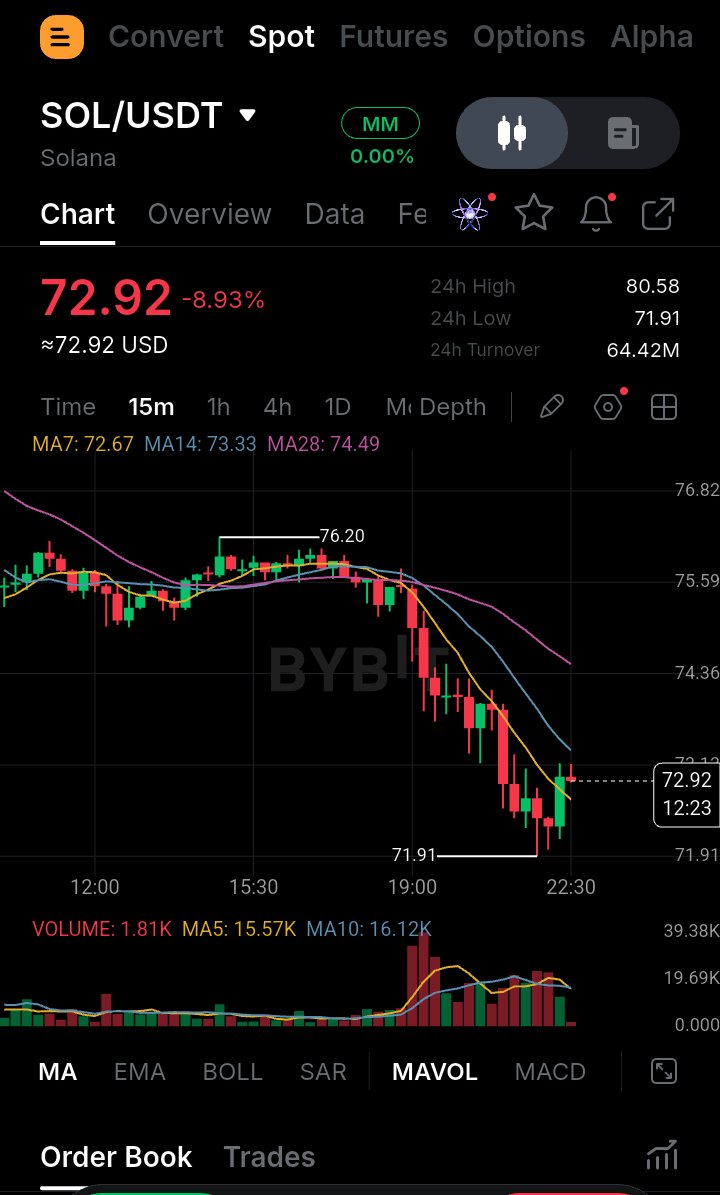
$SOLUSDT Market Analysis: Bears Are Testing Lower Support Solana is showing continued bearish pressure as sellers attempt to push the price below its recent support structure. With SOL trading around $72.96, the market remains vulnerable to further downside if buyers fail to defend the current region. Key figures $76.50 — Upper resistance area $73.50 — Important short-term price zone $72.96 — Current reference price $71.80 — First downside support $70.00 — Psychological support level $68.50 — Next potential support $66.00 — Deeper downside area Bearish Scenario If SOL fails to reclaim the $73.50–$76.50 region, selling pressure could remain dominant. A sustained move below $71.80 may expose the $70.00 and $68.50 support zones, while continued weakness could bring $66.00 into focus. Bullish Scenario On the other hand, a strong recovery above $76.50 could weaken the bearish structure. A move toward $80.50 would be an important sign that buyers are regaining control. For now, SOL remains under selling pressure, and traders should watch how price reacts around nearby support before drawing conclusions. #WSOT2026

$HYPEUSDT Shows Bullish Potential as Buyers Defend Key Support HYPE is attracting attention as buyers attempt to defend the current support zone on the 1H timeframe. The RSI is around 30, indicating oversold conditions and the possibility of a short-term recovery. Funding is currently at +0.002%, while price action suggests buyers are stepping in around the $65.80–$66.20 region. However, sustained buying pressure will be important to confirm a stronger upward move. Key figures - $65.80–$66.20 — Important support and reaction zone - $63.81 — Critical downside level - $68.16 — First upside resistance - $68.50 — Next resistance area - $69.80 — Higher recovery target - RSI: 30 — Oversold territory - Funding Rate: +0.002% Bullish Scenario If HYPE continues holding support and buying volume increases, a recovery toward $68.16 and $68.50 could develop. A sustained move above these levels may open the way toward $69.80. Bearish Scenario If buyers fail to defend the current zone, selling pressure could push price lower. A break below $63.81 would weaken the bullish recovery outlook. HYPE is at an important technical area, and the next reaction from buyers could determine its short-term direction. #WSOT2026