jasonfurman
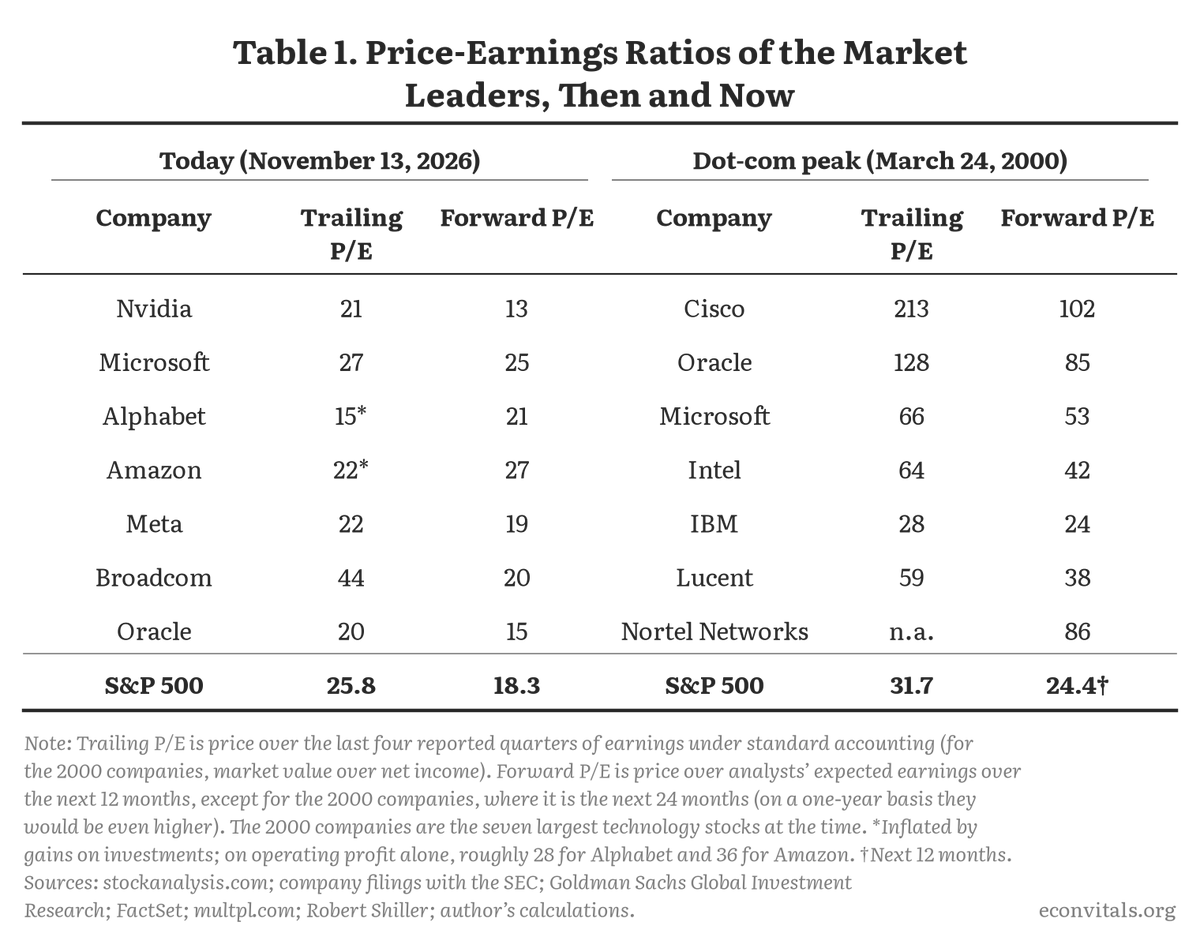
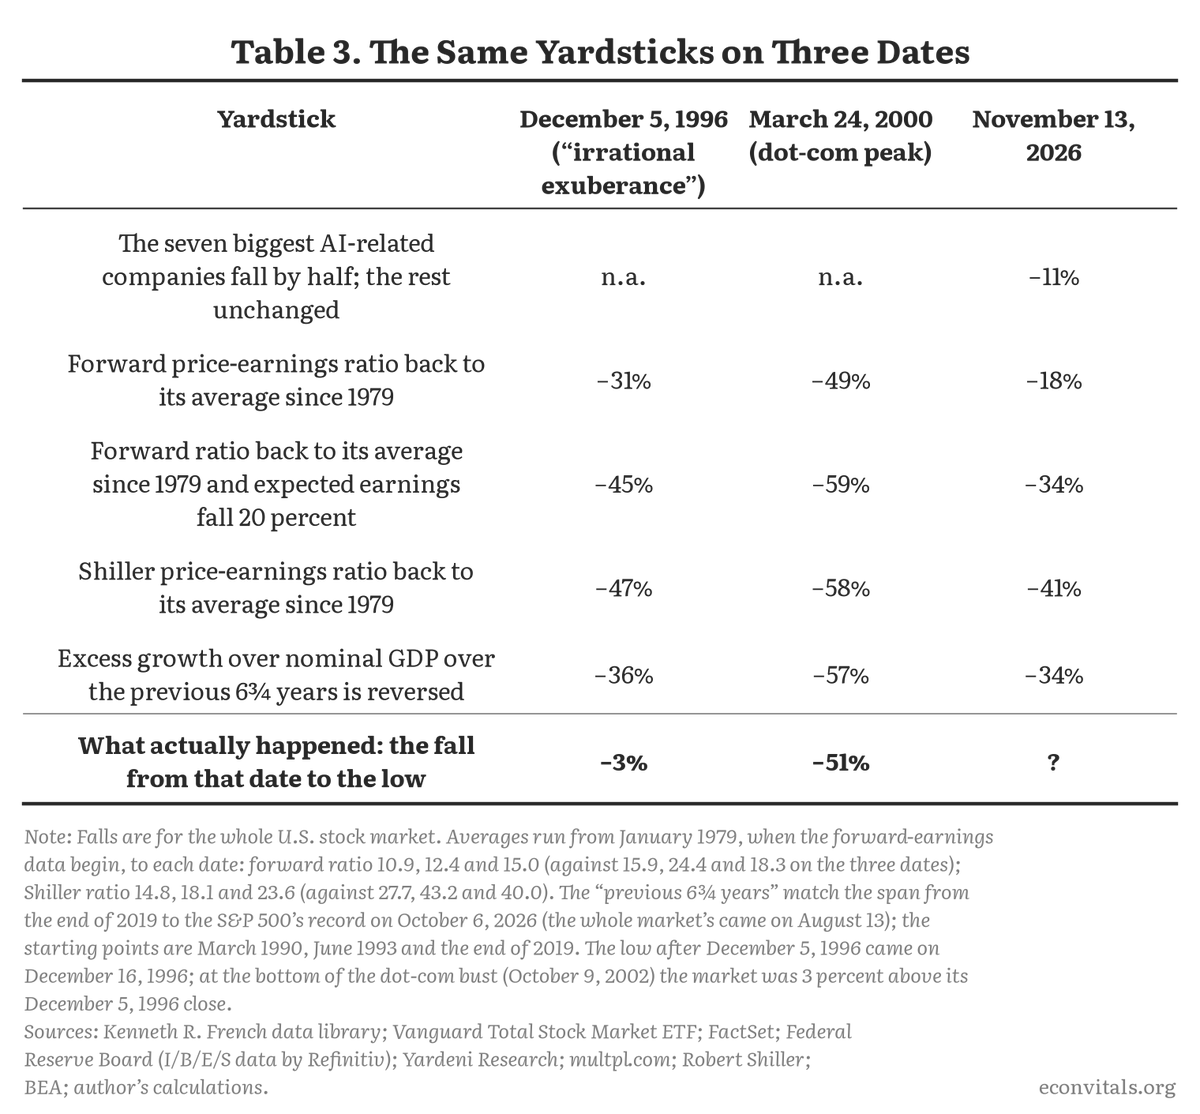
Most entries in the table from the first post are exactly what you’d expect under a simple mean-reversion story—i.e., if earnings were temporarily inflated and then drift back toward trend.
これが、予想PERのデータがある最も古い時点です。基準をより直近に設定すれば、示唆される下落幅はさらに小さくなります。逆に基準をさらに過去へ遡れば、下落幅はより大きく見えるようになります。特に、本文でも少し触れているシラーCAPE(景気調整後株価収益率)で見るとその傾向が顕著です。
Right — that’s why I wrote “didn’t find any asymmetries.” That’s different from claiming there aren’t any; it just means nothing jumped out in what I looked at. And you’re right to flag the wording. Most people would read past that distinction.
This isn’t 2000. The run-up in equity prices is being led by genuinely large firms with substantial—and still rapidly growing—revenues. Valuations, measured against earnings, look meaningfully less stretched than they were during the dot-com peak.
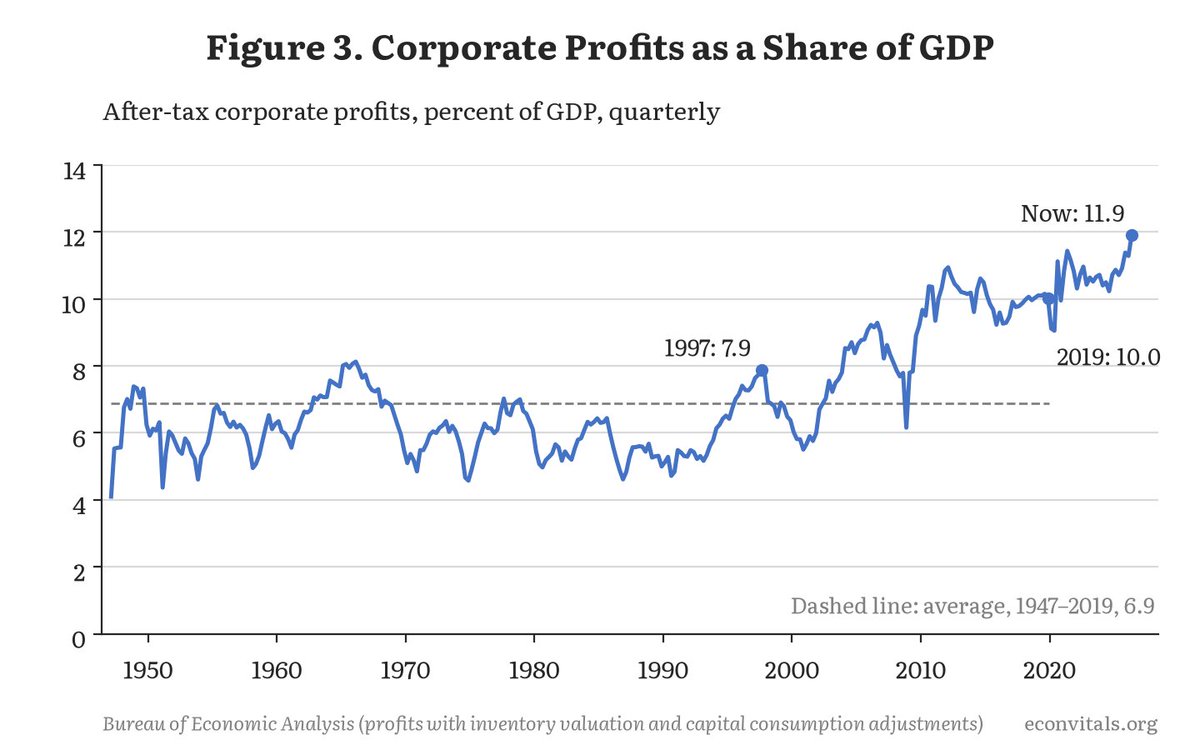
One way to frame it is that the profit share has been climbing steadily, and in most AI-based projections it continues to edge higher.
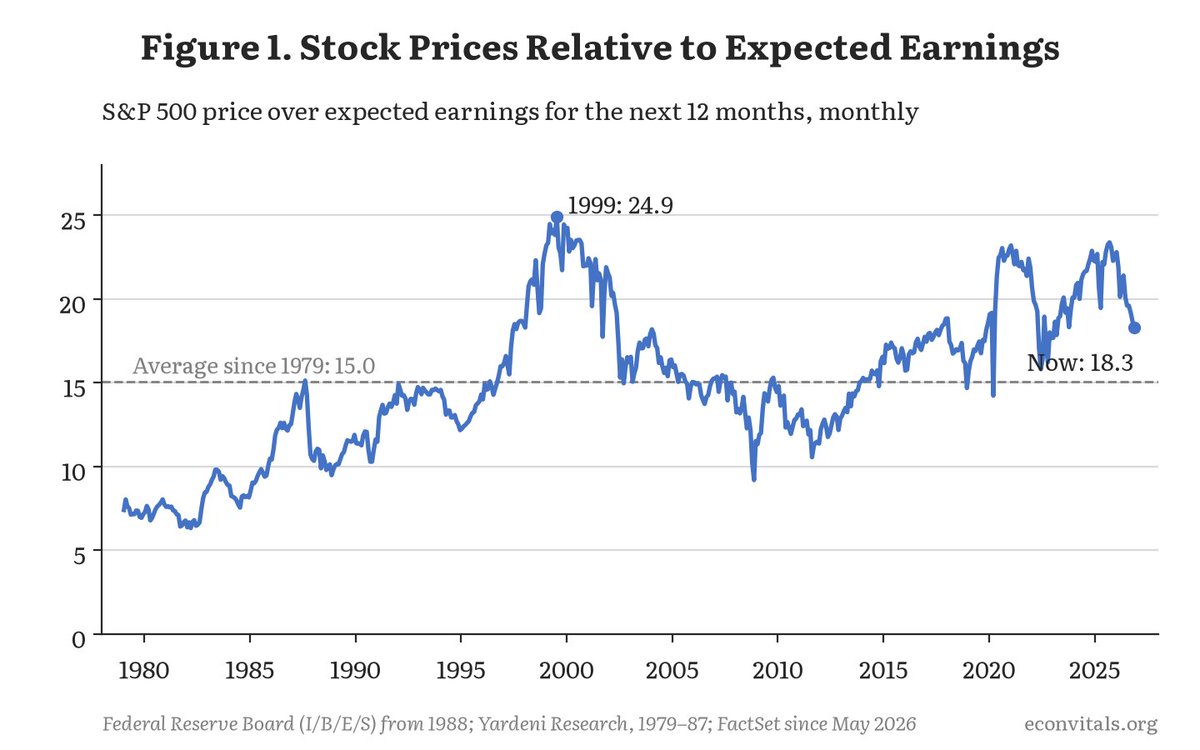
That’s why valuations look only mildly stretched when you benchmark them against expected earnings.
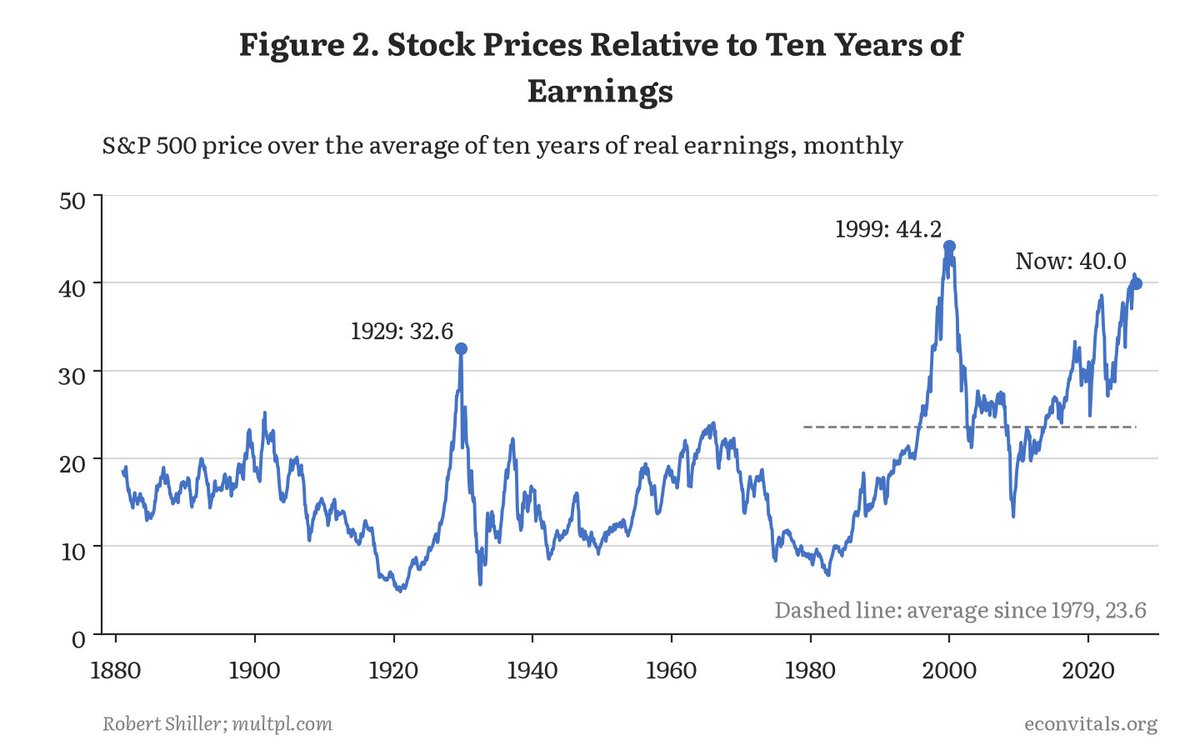
NFP headline aside, it’s worth flagging that the “E” in P/E may not be a stable anchor. Earnings can be cyclical and, in a boom, temporarily inflated—so today’s valuation picture may be overstating the economy’s underlying earning power. That’s essentially what the Shiller CAPE is trying to control for by averaging real earnings over the past decade. On that measure, the market is sitting just below its dot‑com peak, which is about as strong a bubble warning as you can get from a fundamentals-based metric.
This works well only if you already know you’re at the top of a bubble—run it at the March 2000 peak and it gives you a reasonable sense of the subsequent drawdown. The problem is that in real time you don’t observe the peak. If you had applied the same framework when Greenspan warned about “irrational exuberance” in December 1996, it would have implied a decline far earlier than what actually occurred, and the estimate would have been materially off.
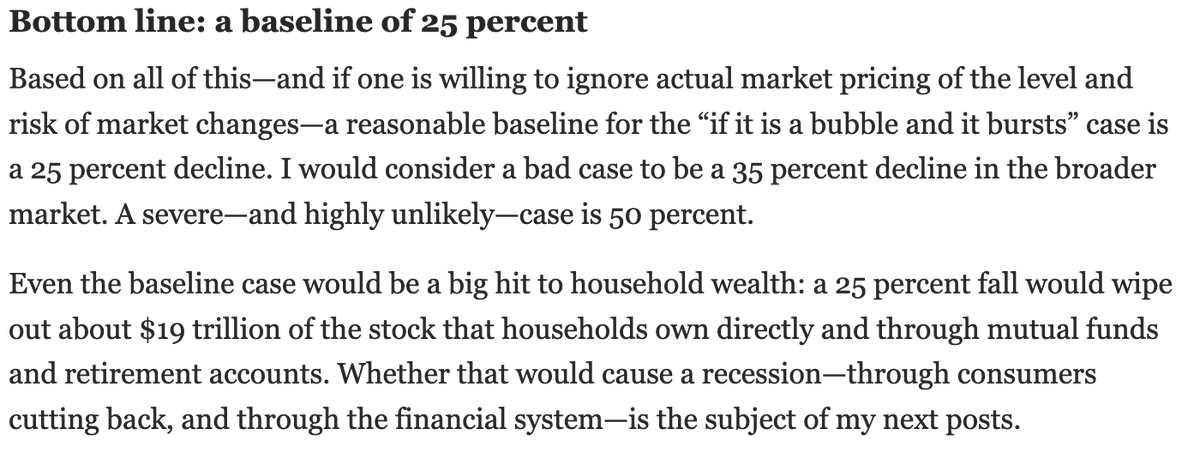
This is the second of five posts examining the economic fallout from the bubble’s unwind. The next installment will focus on consumption under a stock-market drawdown, using the magnitudes laid out here and taking a 25% decline as the baseline scenario.
People often draw moral conclusions from a narrow slice of the fiscal system—looking at one line item in isolation and treating it as the whole story. A common version is counting payroll taxes while ignoring what those taxes finance. Once you leave out the benefits side of the ledger, you’re not analyzing the system—you’re missing the point.
You’re exactly who I had in mind when I put this together—glad it was useful, and thanks for passing it along.
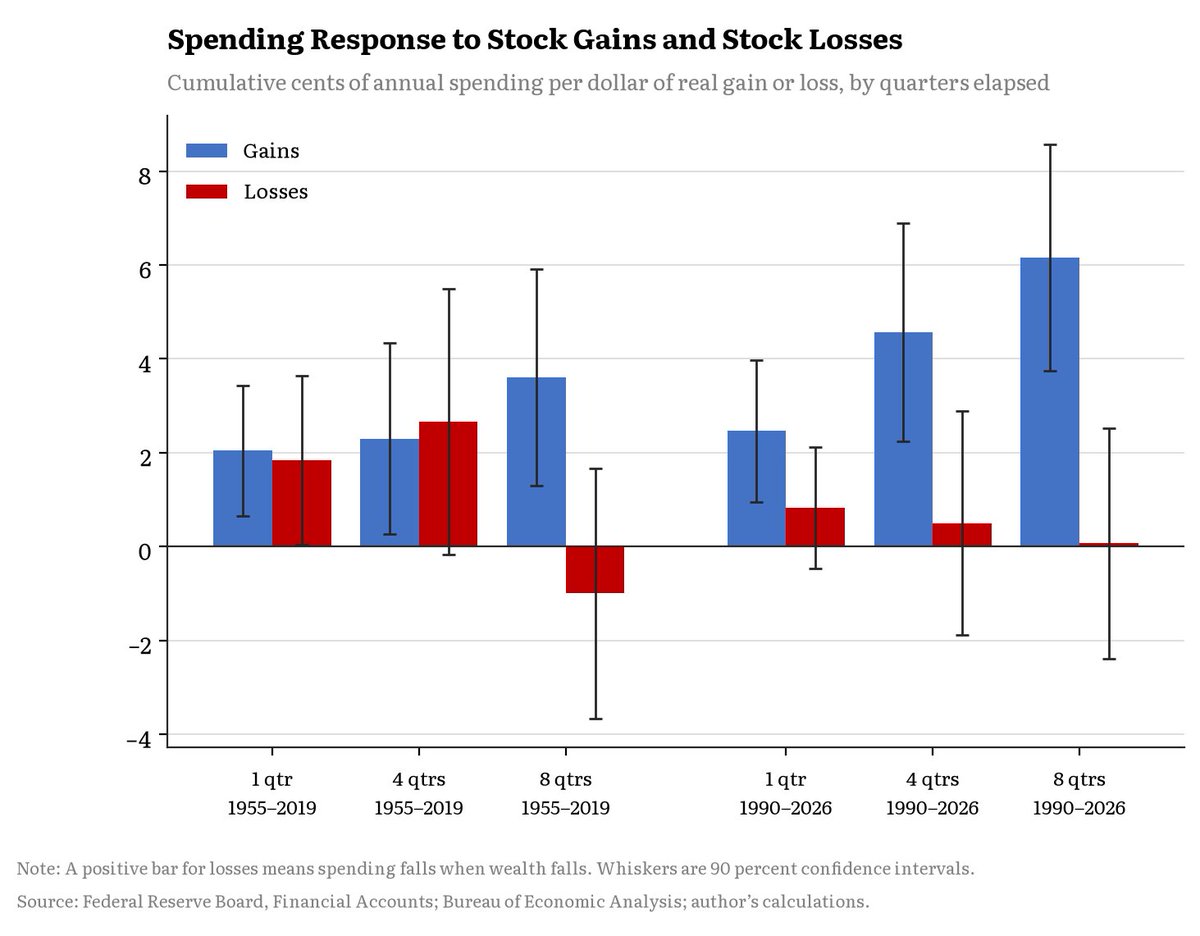
An asymmetrically large response to wealth declines is intuitively plausible. But when I’ve gone looking—both in the literature and in the data—I haven’t found much that clearly supports it. I may fold this into a longer piece I’m working on. That said, I’m not ruling it out; it’s certainly within the realm of possibility.
It wouldn’t shock me if he ended up creating trillions in value—he helped found the company. In any case, he owned about 3.5% of the firm he co-founded. That’s a pretty standard outcome: founders take equity, and sometimes that stake becomes extremely valuable. If you think that’s a problem, what specific alternative are you proposing—limits on founder equity, forced dilution, a different tax treatment? On the “size” point, though, that seems like a separate claim. It’s no longer just “his wealth should be lower,” but “the company itself should be smaller.” So is the argument that policy should actively discourage large firms even when traditional antitrust standards—consumer welfare, pricing, innovation—don’t show harm? In other words, would you accept higher costs or worse products for consumers if the tradeoff is a smaller corporate footprint that you view as socially or politically preferable? If that isn’t what you mean, then what exactly is the relevance of the company’s size to your critique?
民間セクターの報酬における「公正な取り分(fair share)」が何を意味するのか、私にはよくわかりません。その定義とは何なのか、そして実際に何を基準に測定するのでしょうか?誰と比較して、どのくらいの期間で、どのようなベンチマークを使うのか? 具体的な反事実の例を挙げてみましょう。議論のために、もしジェンスン・フアン氏が約1500億ドルではなく150億ドルを受け取っていたとしても、NVIDIAの時価総額は本質的に変わらなかったと仮定します。もしそれが少しでも真実なら、NVIDIAの株主が1350億ドル豊かになり、フアン氏が1350億ドル貧しくなる世界の方が、社会福祉が有意義に高まる理由は何でしょうか?スローガンではなく、比較すべきはそこなのです。 「公平性」が税制において機能するのは、社会厚生関数を特定して初めてのことです。私の考えは広範な功利主義に基づいています。問題は彼の税引前報酬が何か神秘的な公平性のルールに違反していることではなく、最高税率の課税が低すぎるために彼の税引後所得が極端に高くなっているという点です。そして、そうした税収の適切な使い道は、非常に裕福な個人と、彼よりは裕福ではないにせよ私が最も懸念している層ではない株主集団との間でのわずかな再分配ではなく、子供、学校、基本的な公共の能力といった公共財であるべきなのです。
CEOから株主へドルを移動させることは、私の優先順位リストの中ではかなり低い位置にあります。 もし目的が、本当に恩恵を受けるべき人々に届くような再分配なのであれば、実行可能な手段はより累進的な税制です。私はそれを支持します。
経済学者がCEOの報酬に割いている注意の10%でも「セクション199A(米国国内歳入法)」に向けたなら、税引き後所得や投資インセンティブ、そして最終的には労働需要を実際に動かしているものは何かについて、はるかに生産的な議論ができるはずだ。
He was a co-founder, and the bulk of his net worth comes from his equity stake rather than cash compensation. His pay package was on the order of ~$50 million a year—big in absolute terms, but plausibly still below what his marginal product would be if you value his role in scaling the firm. And the political influence that comes with someone like that is driven less by “having $15B” per se and more by what a company of that size represents—jobs, investment, supply chains, and the ability to move policy-relevant outcomes. Even at $15B, though, the wealth itself is still enormous.
The headline point is that the U.S. tax-and-transfer system is already quite progressive in practice. You can debate whether it should be more progressive—I’d personally lean that way—but it’s important to acknowledge the existing progressivity before making the case for further changes. I understand the counterarguments, but I have limited patience for claims that ignore the basic distributional facts.