POOKiEE
1903いいね0シェア18ファン2フォロー
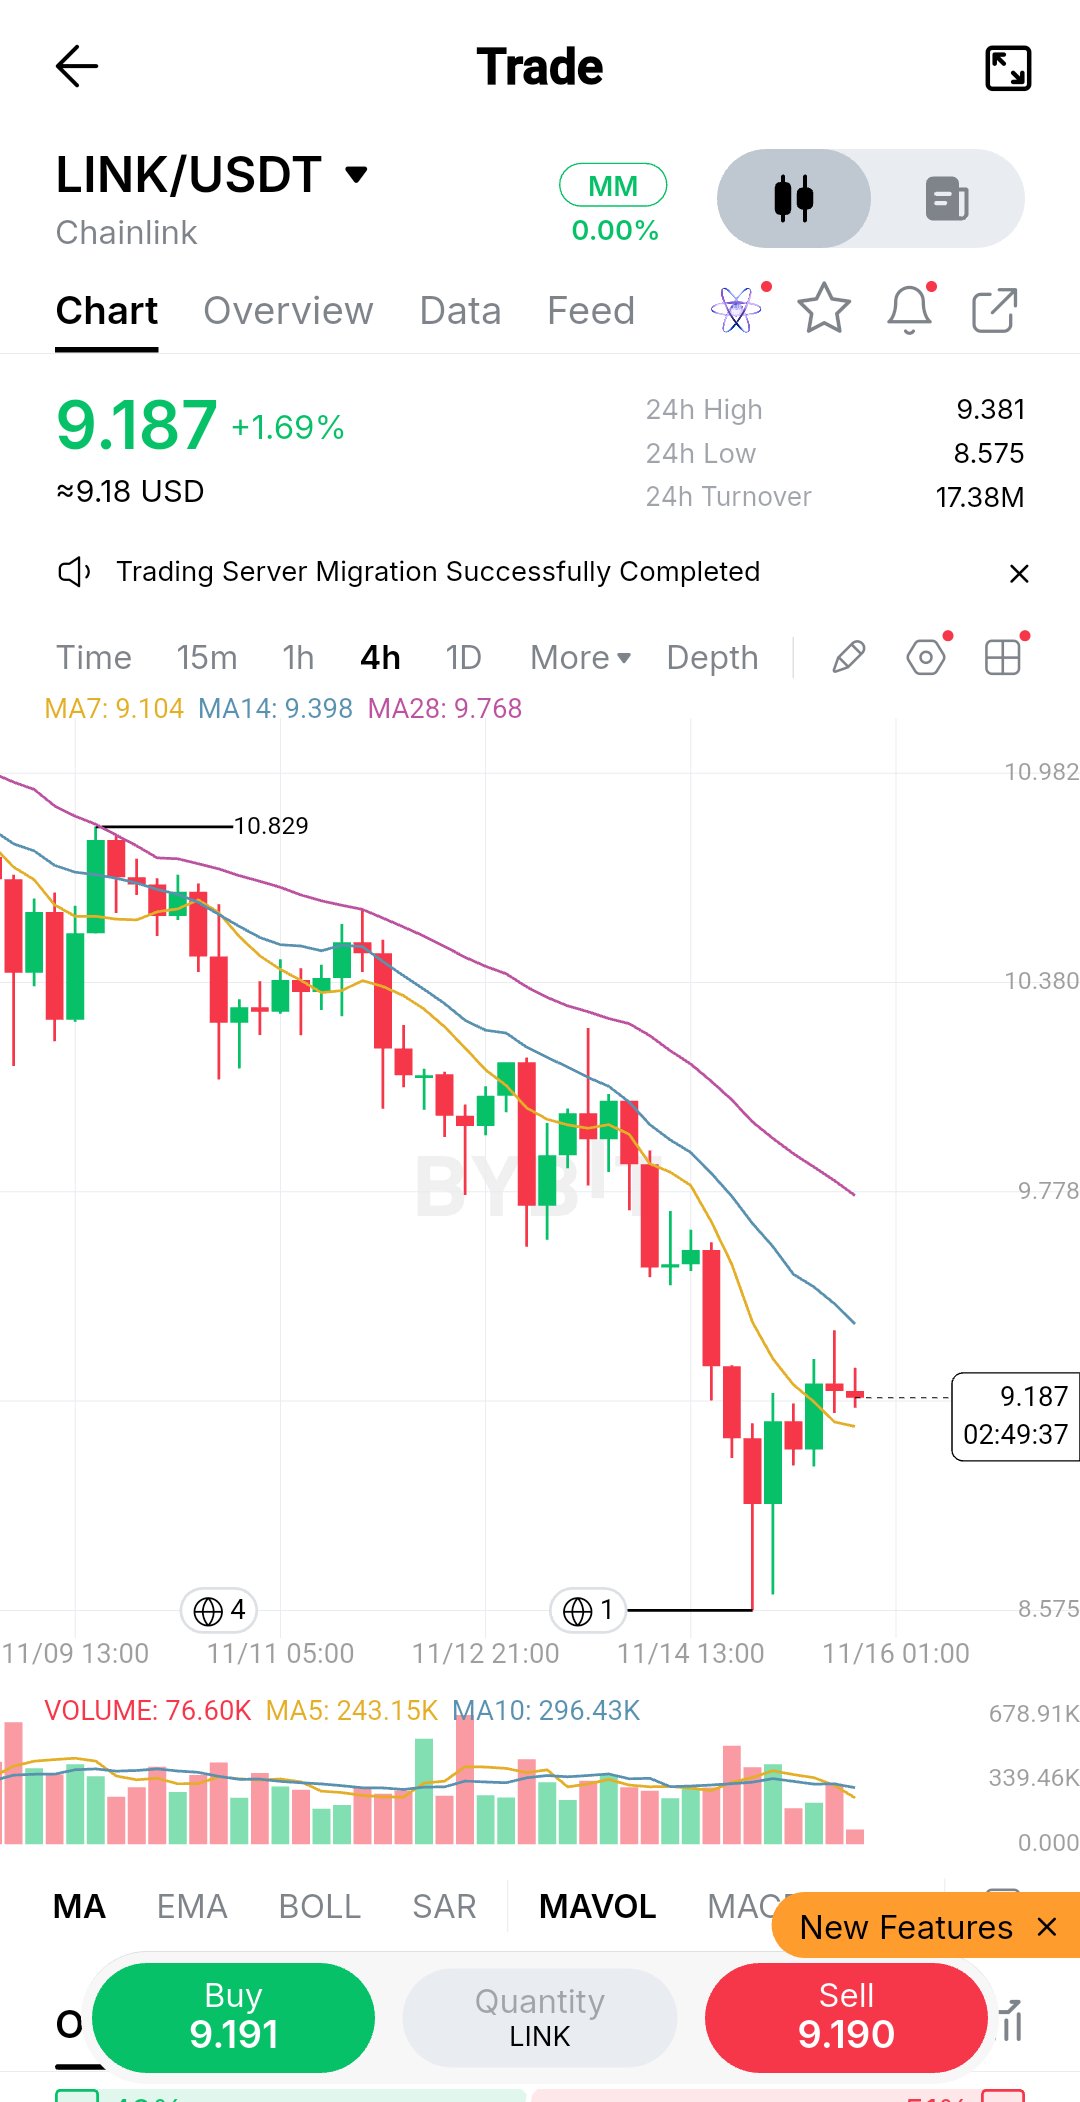
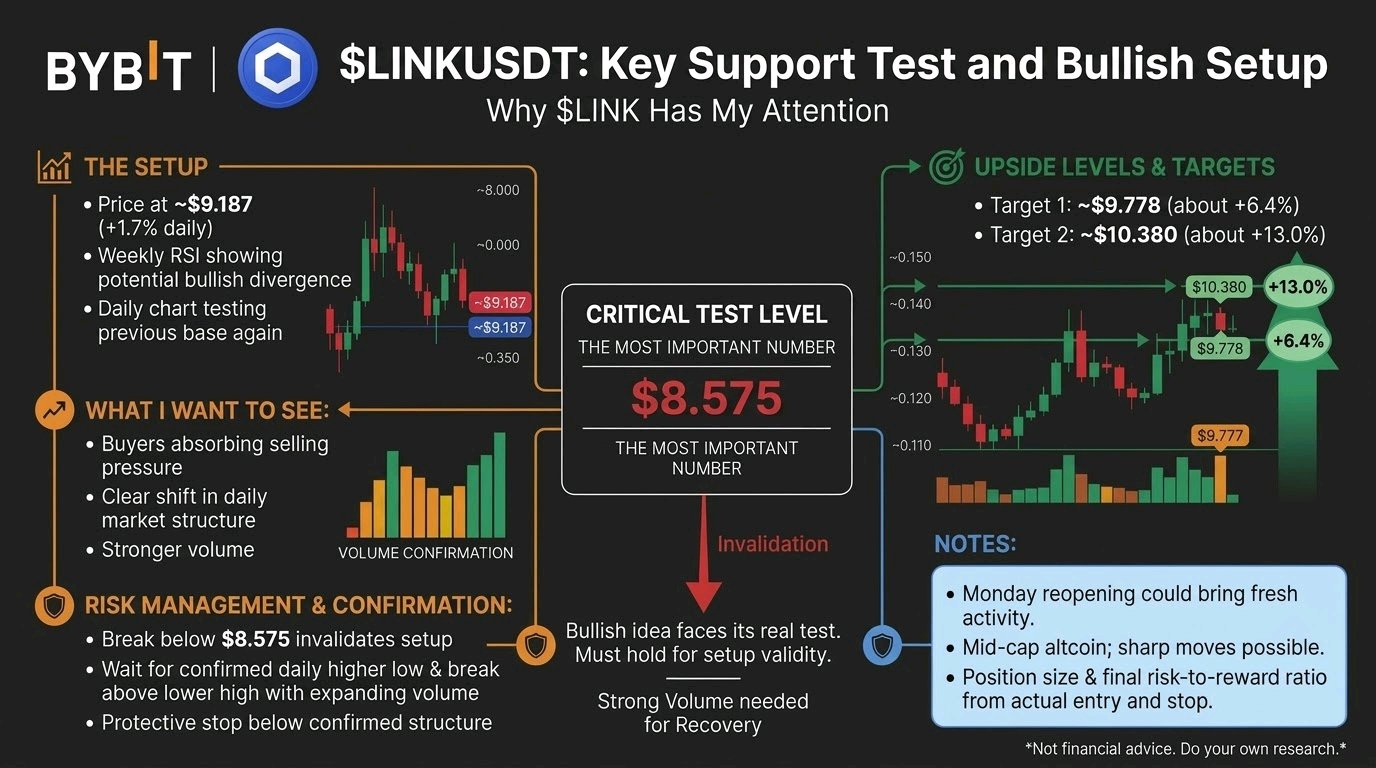
One red line. Two upside levels. This is why $LINKUSDT has my attention. The most important number on my chart is $8.575. That's where my bullish idea faces its real test. The setup $LINK is up about 1.7% on the day at roughly $9.187 after a bounce off the lows, and it is trading far below its prior highs after a steep multi-day slide. Weekly RSI analysis suggests a possible bullish divergence. The daily chart has already shown an initial reaction, and price is now testing that base again. What I want to see is buyers absorbing the selling pressure, followed by a clear shift in daily market structure. If that happens with stronger volume, I'm watching two swing levels: 🎯 Target 1: ~$9.778 (about +6.4% from $9.187) 🎯 Target 2: ~$10.380 (about +13% from $9.187) These are ambitious scenarios, not guaranteed returns. Monday's reopening of traditional markets could bring fresh activity, but $LINK needs its own buying volume to support a meaningful recovery. As a mid-cap altcoin, sharp moves can happen in either direction. Management: If price breaks below $8.575 and cannot recover that level, my bullish setup is no longer valid. For a new position, I want a confirmed daily higher low, a break above the latest lower high, and expanding volume. The protective stop belongs below the confirmed structure. Position size and the final risk-to-reward ratio must be calculated from the actual entry and stop, not assumed in advance. I'm heavily bullish on $LINK's recovery potential, but the next volume-backed move will determine whether this remains a promising chart or becomes a trade worth taking. Not financial advice. Do your own research and manage your risk. #IMPACTbyTrade
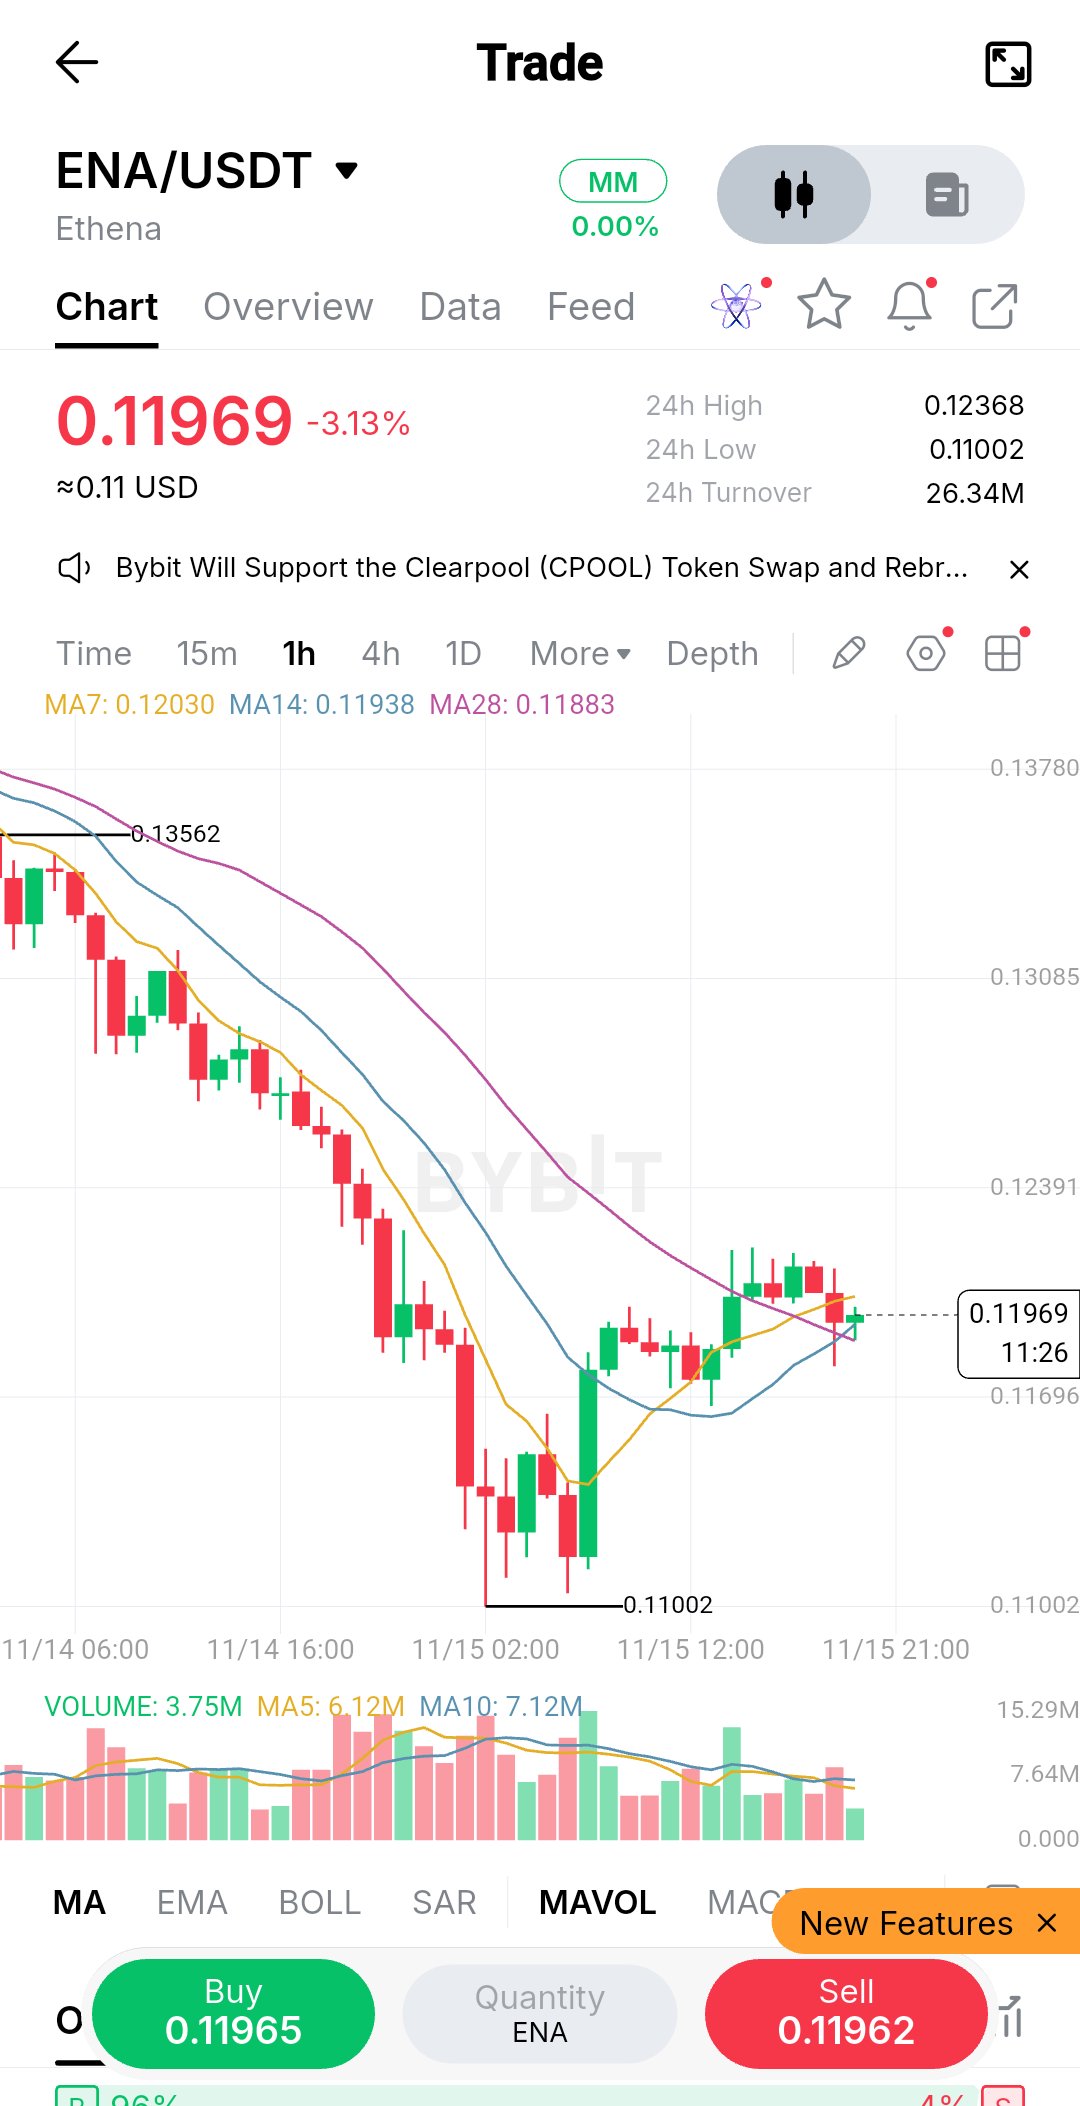
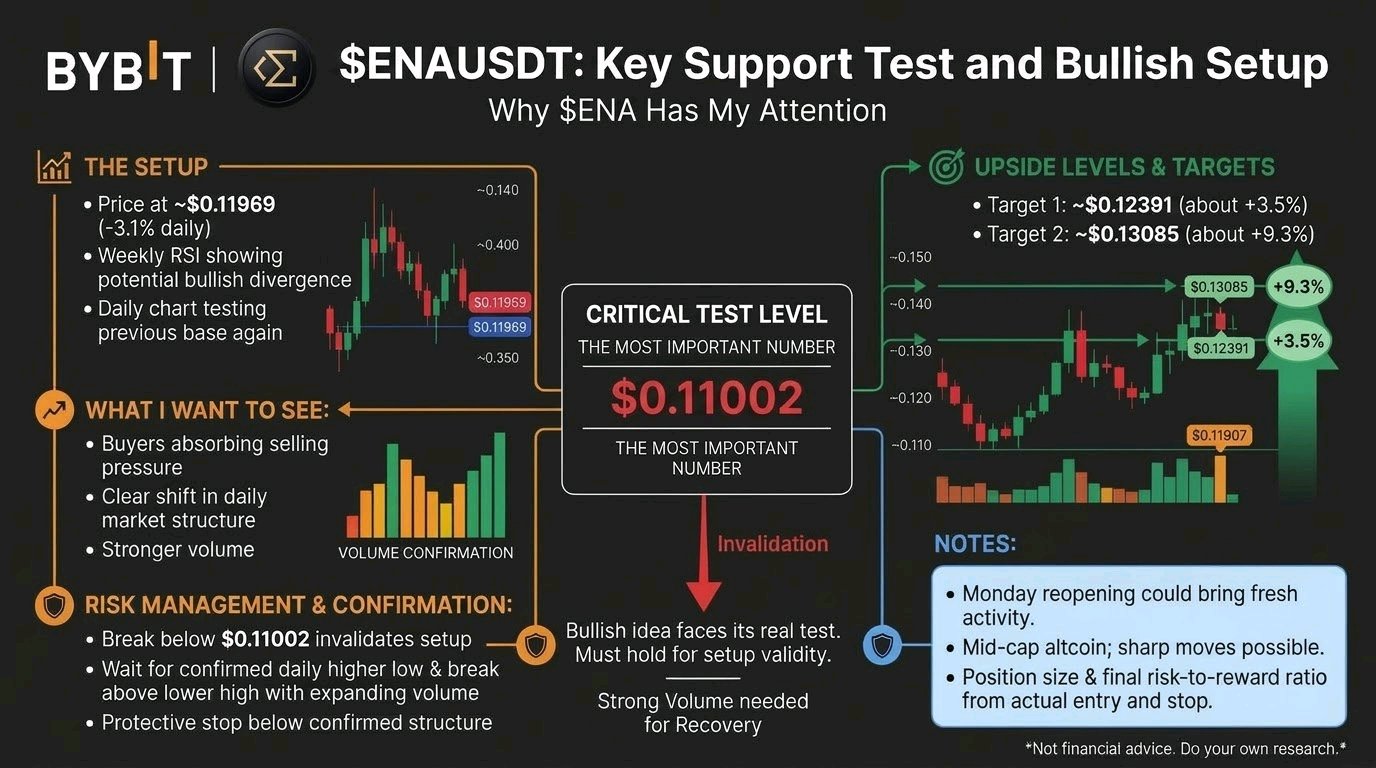
One red line. Two upside levels. This is why $ENAUSDT has my attention. The most important number on my chart is $0.11002. That's where my bullish idea faces its real test. The setup $ENA is down about 3.1% on the day at roughly $0.11969, and it is trading far below its prior highs after a steep multi-day slide. Weekly RSI analysis suggests a possible bullish divergence. The daily chart has already shown an initial reaction, and price is now testing that base again. What I want to see is buyers absorbing the selling pressure, followed by a clear shift in daily market structure. If that happens with stronger volume, I'm watching two swing levels: 🎯 Target 1: ~$0.12391 (about +3.5% from $0.11969) 🎯 Target 2: ~$0.13085 (about +9.3% from $0.11969) These are ambitious scenarios, not guaranteed returns. Monday's reopening of traditional markets could bring fresh activity, but $ENA needs its own buying volume to support a meaningful recovery. As a mid-cap altcoin, sharp moves can happen in either direction. Management: If price breaks below $0.11002 and cannot recover that level, my bullish setup is no longer valid. For a new position, I want a confirmed daily higher low, a break above the latest lower high, and expanding volume. The protective stop belongs below the confirmed structure. Position size and the final risk-to-reward ratio must be calculated from the actual entry and stop, not assumed in advance. I'm heavily bullish on $ENA's recovery potential, but the next volume-backed move will determine whether this remains a promising chart or becomes a trade worth taking. Not financial advice. Do your own research and manage your risk. #IMPACTbyTrade
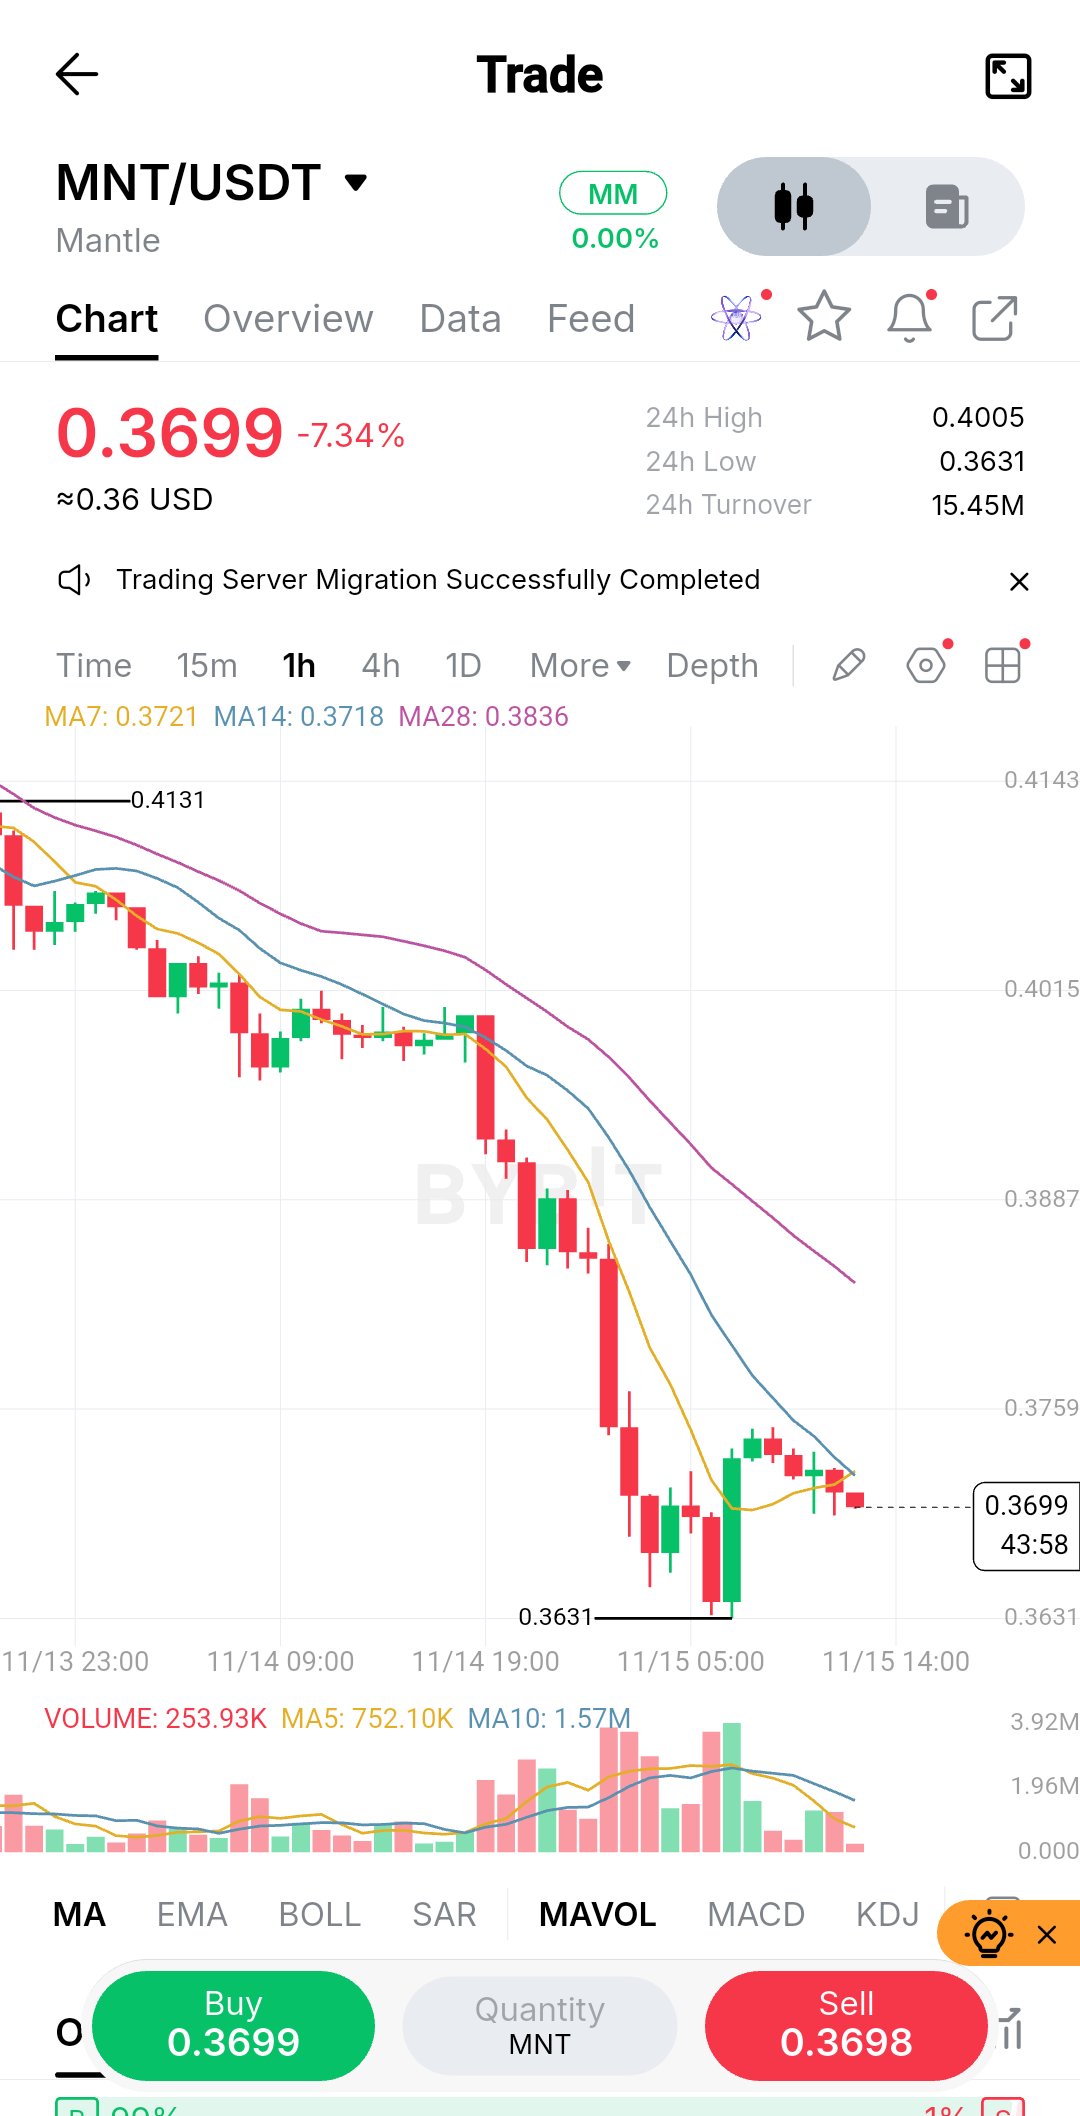
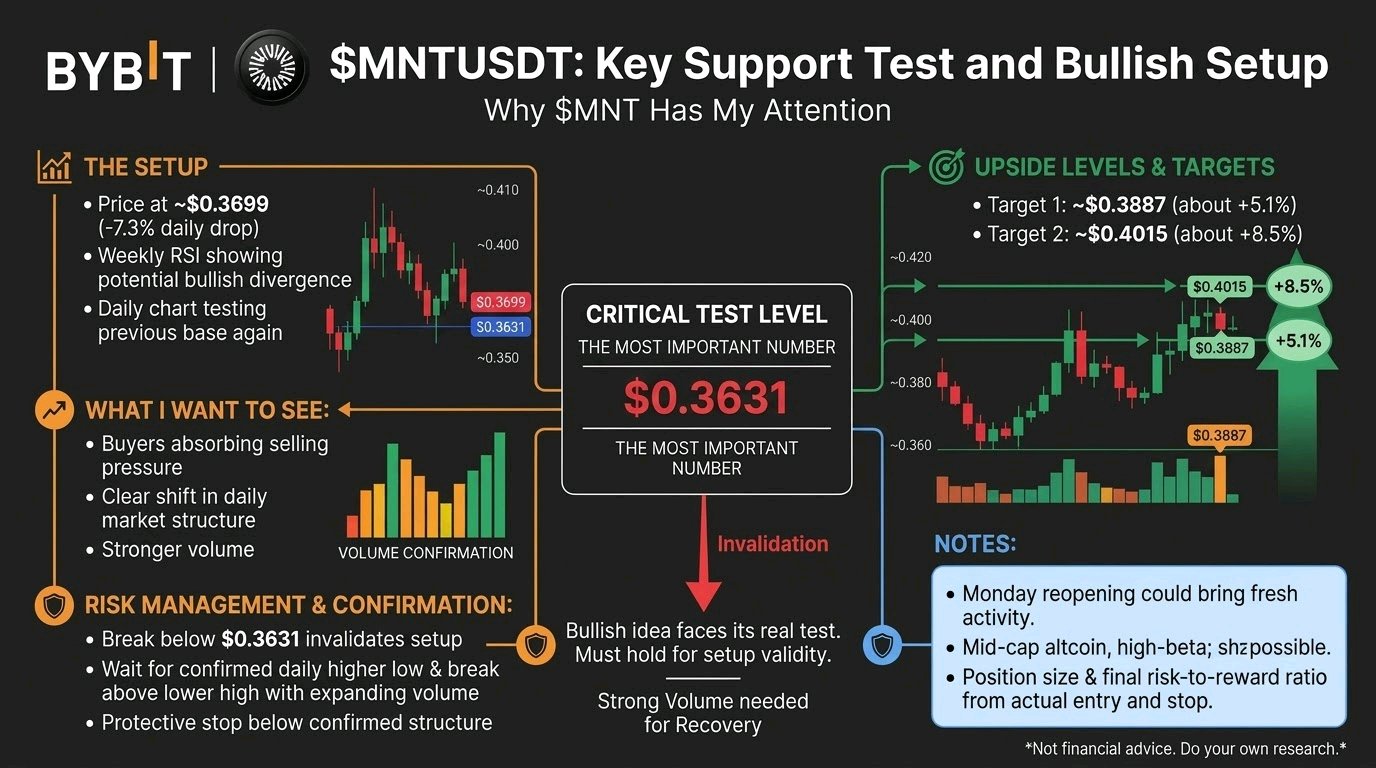
1本の赤いライン。2つの上値レベル。これが私が$MNTUSDTに注目している理由です。 私のチャートで最も重要な数値は$0.3631です。ここが私の強気な見通しにとって真の試練となります。 セットアップ $MNTは現在、約$0.3699で、1日で約7.3%下落しており、数日間の急激な下落を経て以前の高値を大きく下回っています。 週足RSI分析では、強気のダイバージェンスの可能性が示唆されています。 日足チャートではすでに最初の反応が見られ、価格はそのベースを再テストしているところです。 私が見たいのは、買い手が売り圧力を吸収し、その後に日足の市場構造が明確に変化することです。 もしそれが出来高の増加を伴って実現すれば、以下の2つのスイングレベルに注目します。 🎯 目標1: ~$0.3887 ($0.3699から約+5.1%) 🎯 目標2: ~$0.4015 ($0.3699から約+8.5%) これらは野心的なシナリオであり、リターンを保証するものではありません。 月曜の伝統的市場の再開が新たな動きをもたらす可能性がありますが、$MNTが本格的な回復をするには、それ自体の買い出来高が必要です。中型アルトコインであるため、急激な動きがどちらの方向にも起こり得ます。1日で-7%という下落は、どれほど速く動くかを示しています。 管理:もし価格が$0.3631を割り込み、そのレベルを回復できない場合、私の強気セットアップは無効となります。新規ポジションについては、日足での確実な切り上げ(Higher Low)の確認、直近の戻り高値(Lower High)のブレイク、そして出来高の増加が必要です。損切りライン(ストップロス)は、確認された構造の下に置くべきです。ポジションサイズと最終的なリスク・リワード比は、想定ではなく、実際のエントリーとストップロスから計算する必要があります。私は$MNTの回復ポテンシャルに対して非常に強気ですが、次に出来高を伴う動きが出るかどうかが、これが有望なチャートであり続けるか、それとも取引する価値のあるものになるかを決定します。 投資助言ではありません。ご自身でリサーチを行い、リスク管理を徹底してください。 #IMPACTbyTrade $MNTUSDT
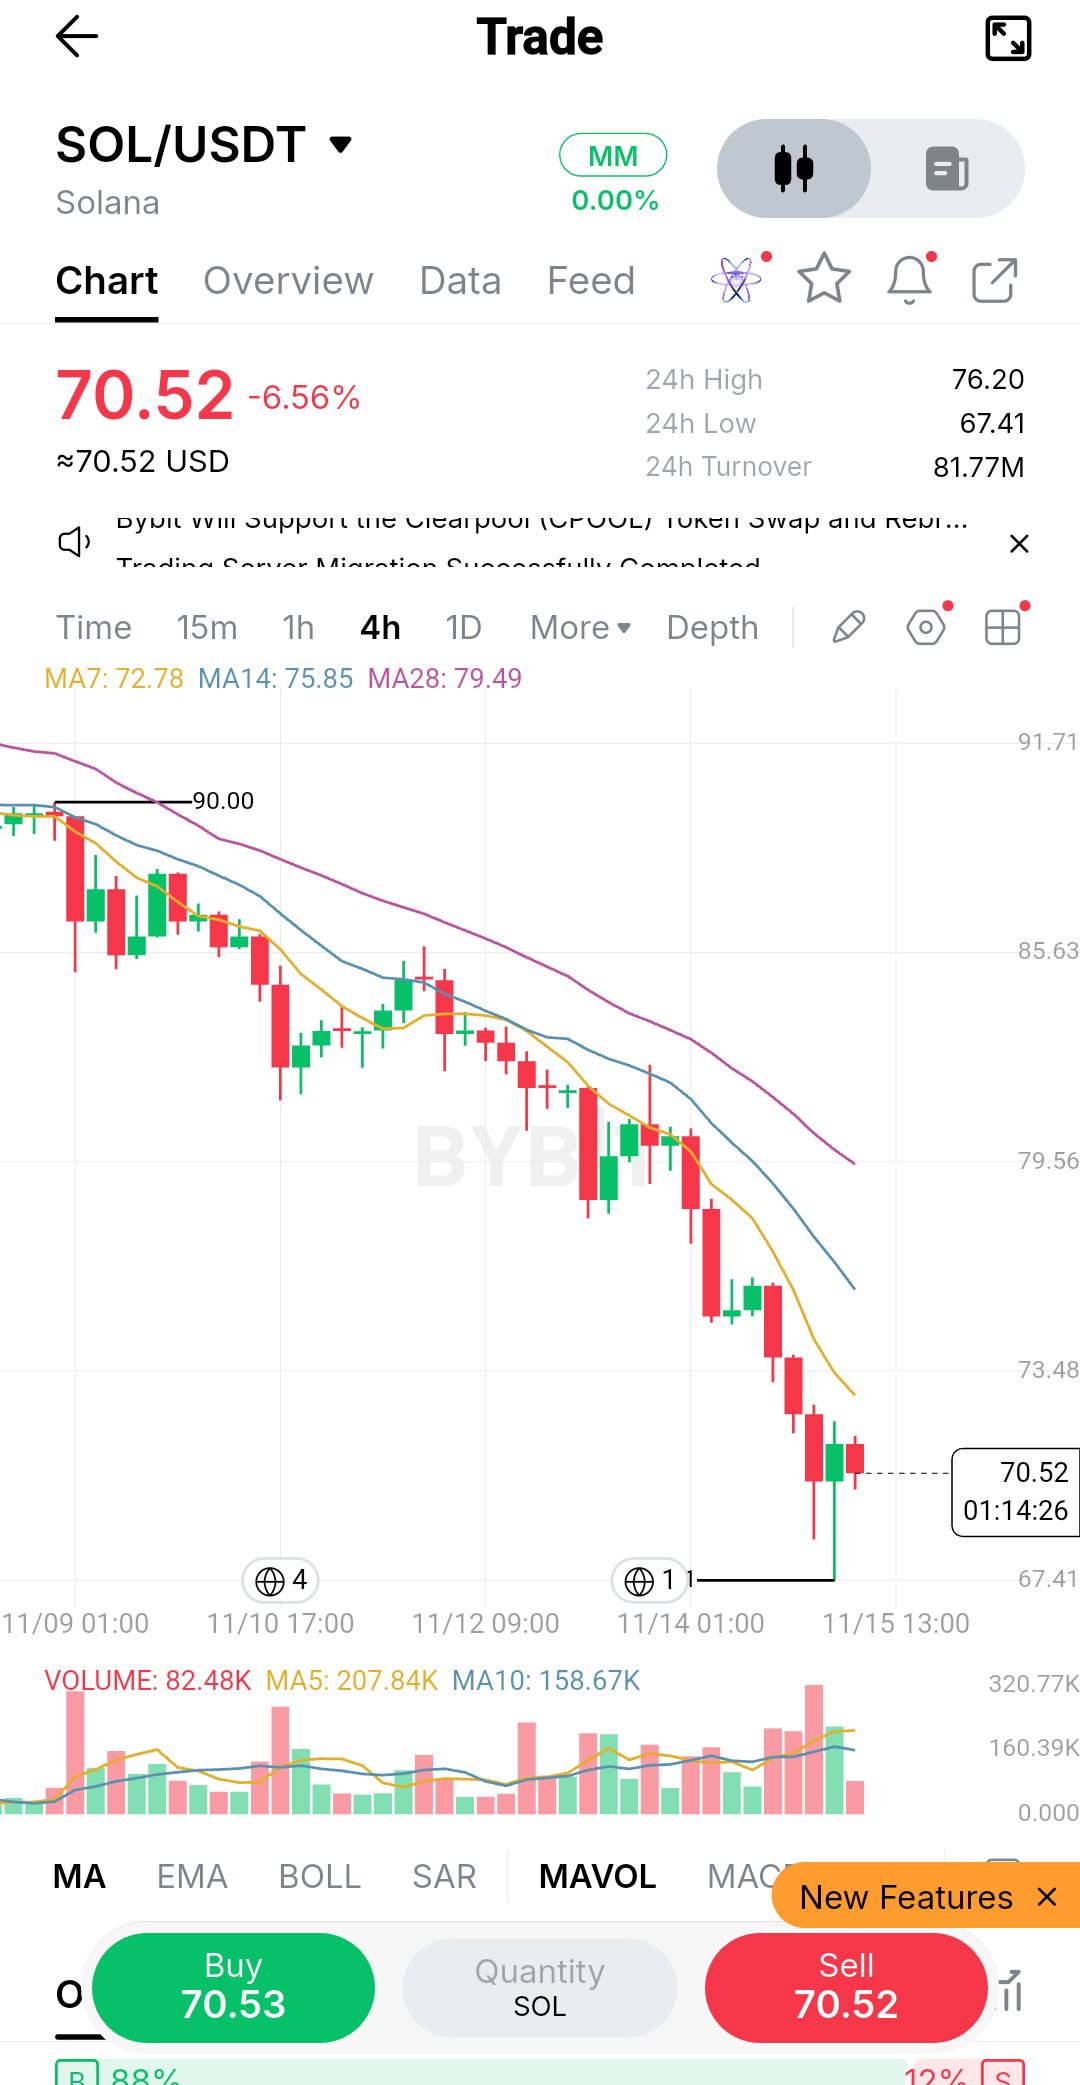
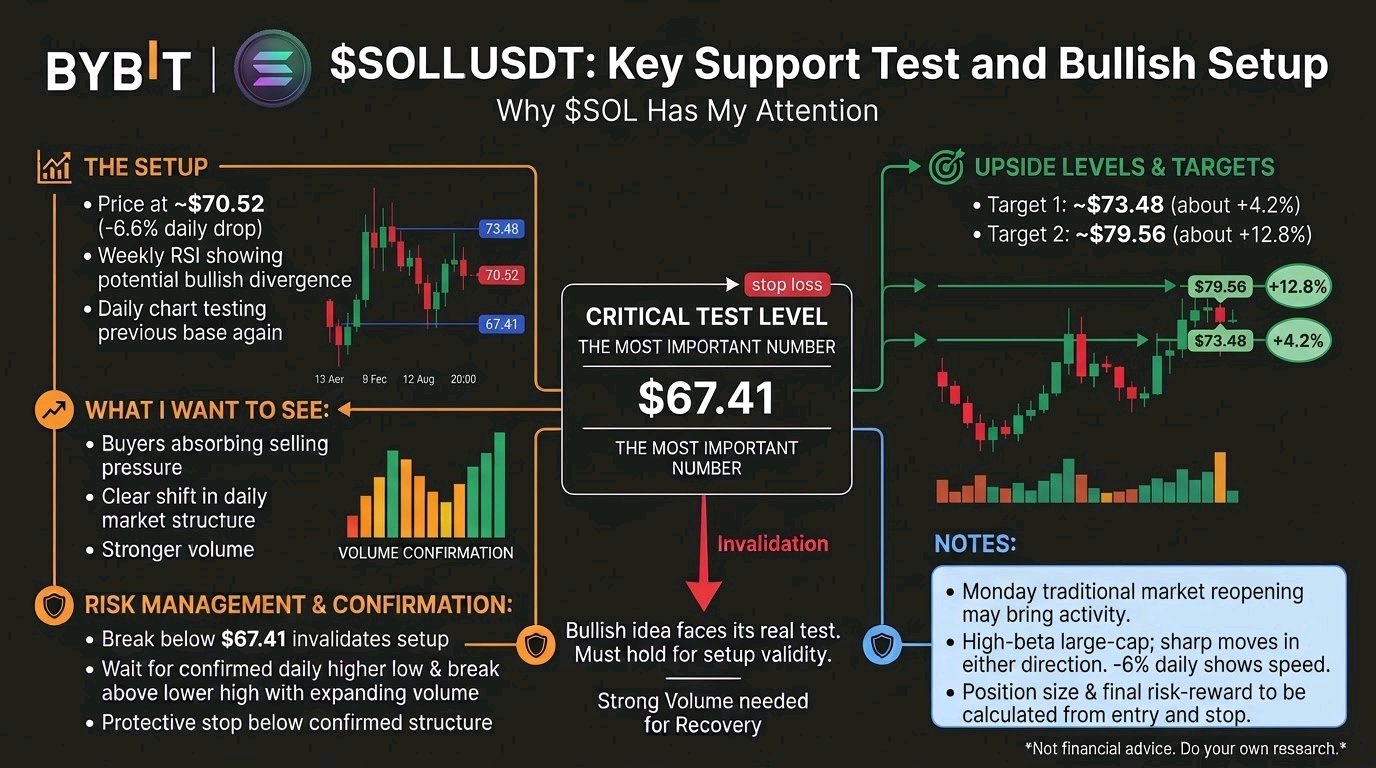
1本の赤いライン、2つの上昇レベル。これが私が$SOLUSDTに注目している理由です。 チャート上で最も重要な数字は67.41ドルです。そこが私の強気な見通しにとっての正念場となります。 セットアップ $SOLは現在約70.52ドルで、日次で約6.6%下落しており、数日間にわたる急落の後、以前の高値を大きく下回って推移しています。 週足RSI分析では、強気のダイバージェンスが発生する可能性があります。 日足チャートではすでに最初の反応が見られ、現在そのベースラインを再テストしている状況です。 私が期待しているのは、売り圧力を買い手が吸収し、それに続いて日足の市場構造が明確に転換することです。 もしそれがより強い出来高を伴って実現すれば、以下の2つのスウィングレベルに注目します: 🎯 ターゲット1:約73.48ドル(70.52ドルから約+4.2%) 🎯 ターゲット2:約79.56ドル(70.52ドルから約+12.8%) これらは野心的なシナリオであり、利益が保証されているわけではありません。 月曜日に伝統的市場が再開すれば新たな動きがあるかもしれませんが、$SOLには回復を支えるための独自の買い出来高が必要です。ハイベータの大型株として、どちらの方向にも急激な動きが起こり得るため、1日で6%下落するということは、どれだけ速く動くかを示しています。 管理:もし価格が67.41ドルを割り込み、そのレベルを回復できない場合、私の強気セットアップは無効となります。新規ポジションについては、確認された日足の高値切り上げ(Higher Low)、直近の安値切り下げ後の高値(Lower High)のブレイク、そして出来高の増加を望みます。プロテクティブ・ストップ(損切りライン)は、確認された構造の下に置くべきです。ポジションサイズと最終的なリスク・リワード比は、事前の想定ではなく、実際のエントリーとストップ価格から計算しなければなりません。私は$SOLの回復の可能性には非常に強気ですが、次に出来高を伴った動きが起こるかどうかで、このチャートが有望なままであるか、取引する価値のあるものになるかが決まります。 投資助言ではありません。ご自身で調査を行い、リスク管理を行ってください。 #IMPACTbyTrade
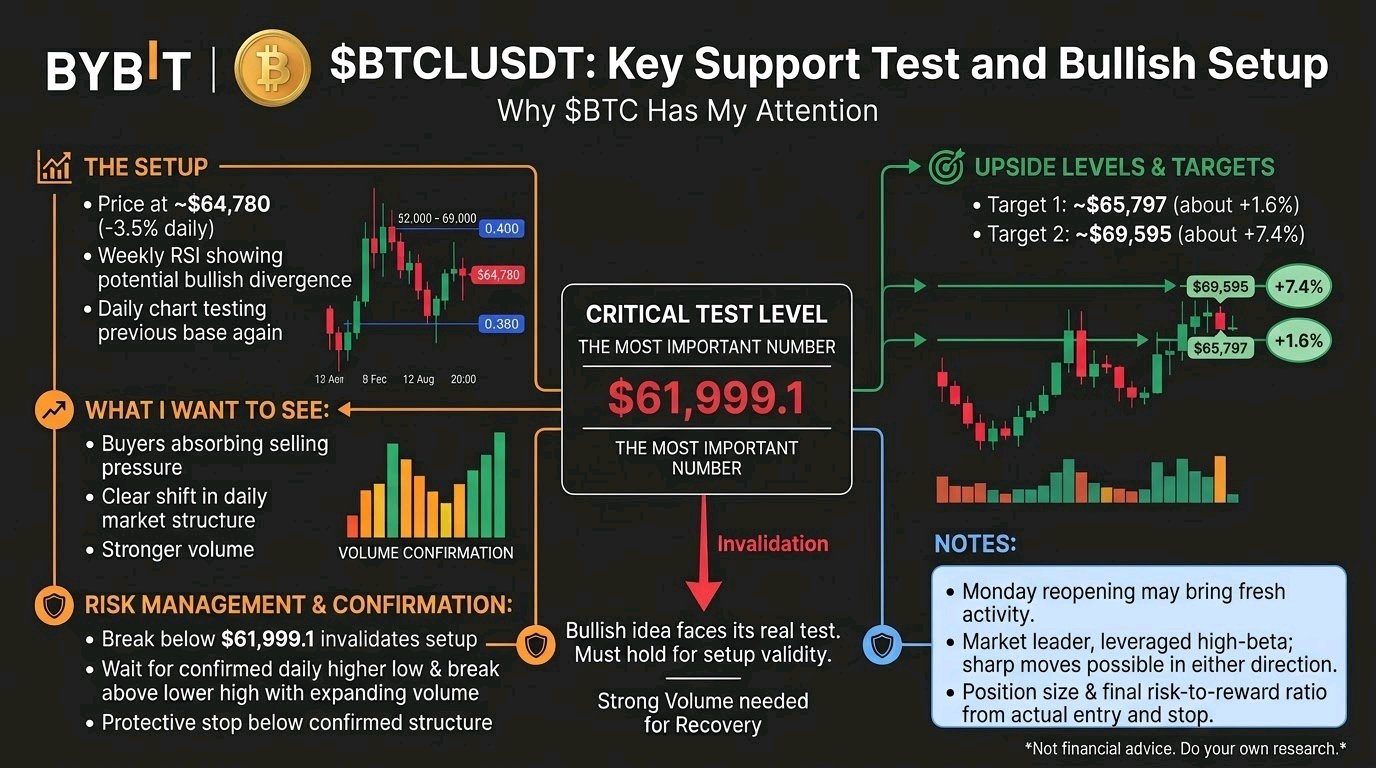
1本の赤いライン。2つの上方レベル。これが私が BTCUSDT に注目している理由です。 チャート上で最も重要な数字は $61,999.1 です。ここが私の強気な見通しにとって真の試練となります。 セットアップ $BTC は約3.5%下落して約$64,780となっており、数日間にわたる急落を経て以前の高値を大きく下回って推移しています。 週足RSI分析は、強気ダイバージェンスの可能性を示唆しています。 日足チャートではすでに初期の反応が見られ、現在価格はそのベースラインを再テストしているところです。 私が見たいのは、売り圧力が買い手によって吸収され、その後に日足の市場構造が明確に変化することです。 もしそれがより強い出来高を伴って起これば、私は以下の2つのスイングレベルに注目します。 🎯 ターゲット1: ~$65,797 (約$64,780から+1.6%) 🎯 ターゲット2: ~$69,595 (約$64,780から+7.4%) これらは野心的なシナリオであり、利益が保証されているわけではありません。 月曜の伝統的な市場の再開が新たな動きをもたらす可能性がありますが、$BTC が意味のある回復を見せるには、それ自体の買い出来高が必要です。市場のリーダーとはいえ、レバレッジが効いたハイベータな市場であるため、どちらの方向にも急激な動きが起こり得ます。 管理: もし価格が $61,999.1 を割り込み、そのレベルを回復できなければ、私の強気なセットアップは無効となります。新規ポジションについては、日足での確実な高値切り上げ(higher low)と直近の安値切り下げ(lower high)のブレイク、そして出来高の拡大を確認したいところです。プロテクティブ・ストップは確定した構造の下に置くべきです。ポジションサイズと最終的なリスク・リワード比は、想定ではなく実際のエントリーとストップから計算する必要があります。私は $BTC の回復ポテンシャルに対して非常に強気ですが、次に出来高を伴う動きが出るかどうかが、このチャートが有望なままであるか、それとも取引する価値のあるものになるかを決定づけるでしょう。 投資助言ではありません。ご自身で調査を行い、リスク管理を徹底してください。 #IMPACTbyTrade
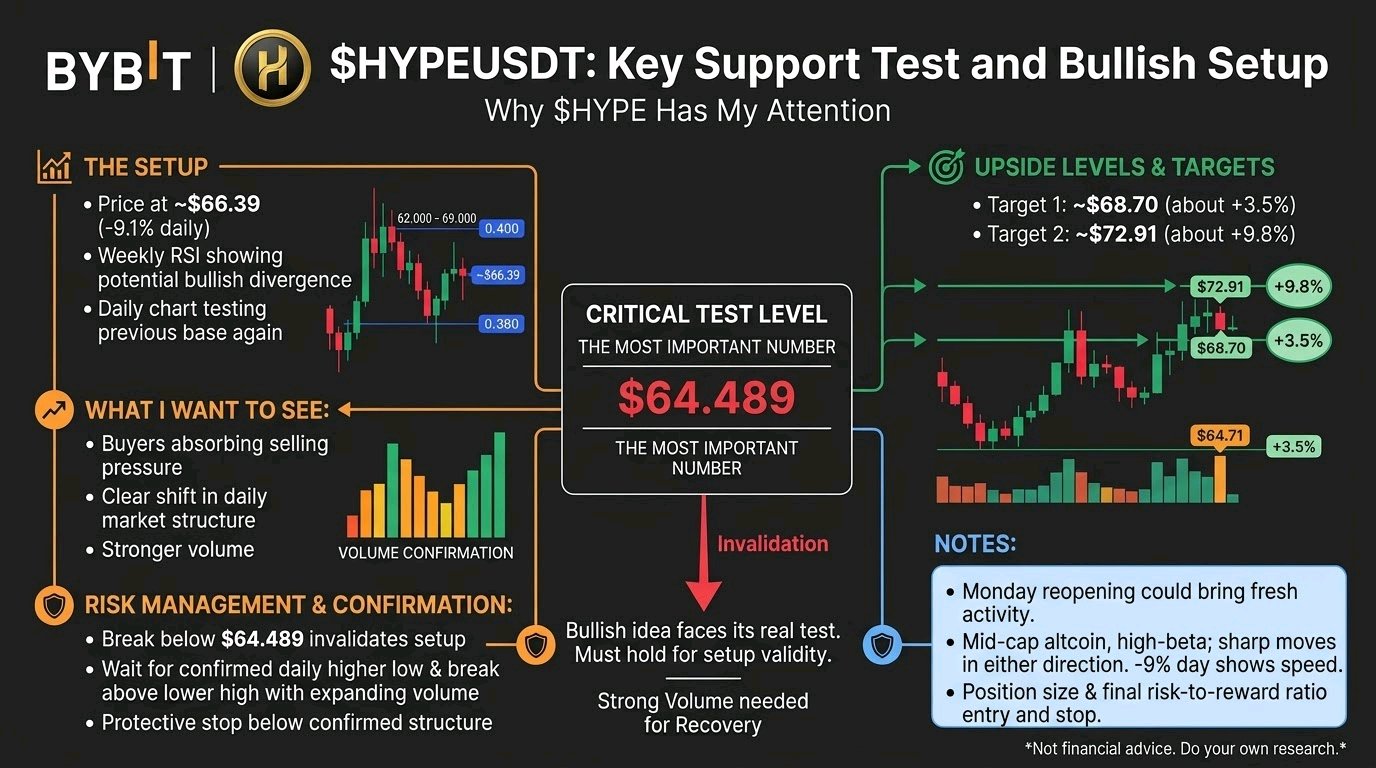
1本の赤いライン、2つの上値レベル。これが私が$HYPEUSDTに注目している理由です。 私のチャート上で最も重要な数字は$64.489。ここが私の強気シナリオの真の試金石となります。 セットアップ $HYPEは本日約9.1%下落し、およそ$66.39で推移しています。数日間にわたる急落を経て、以前の高値を大きく下回る水準です。 週足のRSI分析からは、強気のダイバージェンスの可能性が示唆されています。 日足チャートではすでに最初の反応が見られ、現在そのベースラインを再度テストしています。 私が期待するのは、買い手が売り圧力を吸収し、それに続いて日足の市場構造が明確に変化することです。 もし出来高を伴ってそれが実現すれば、以下の2つのスイングレベルに注目します。 🎯 ターゲット1: ~$68.70 ($66.39から約+3.5%) 🎯 ターゲット2: ~$72.91 ($66.39から約+9.8%) これらは野心的なシナリオであり、リターンを保証するものではありません。 月曜の伝統的市場の再開が新たな動きをもたらす可能性がありますが、$HYPEには回復を裏付ける独自の買い出来高が必要です。ハイベータの中型株(またはコイン)として、どちらの方向にも急激な動きが発生する可能性があり、本日の-9%の下落はその速さを物語っています。 管理:もし価格が$64.489を割り込み、そのレベルを回復できない場合、私の強気セットアップは無効となります。新規ポジションについては、日足での確実な切り上げ(higher low)、直近の切り下げ高値(lower high)のブレイク、そして出来高の増加を確認したいところです。プロテクティブ・ストップは、確定した構造の下に置くべきです。ポジションサイズと最終的なリスク・リワード比は、想定ではなく実際のエントリーとストップに基づいて計算される必要があります。私は$HYPEの回復ポテンシャルに強く強気ですが、次に出来高を伴った動きが出るかどうかが、これが単なる有望なチャートで終わるか、それとも実際にトレードする価値のあるものになるかを決定づけるでしょう。 投資助言ではありません。ご自身でリサーチを行い、リスク管理を徹底してください。 #IMPACTbyTrade
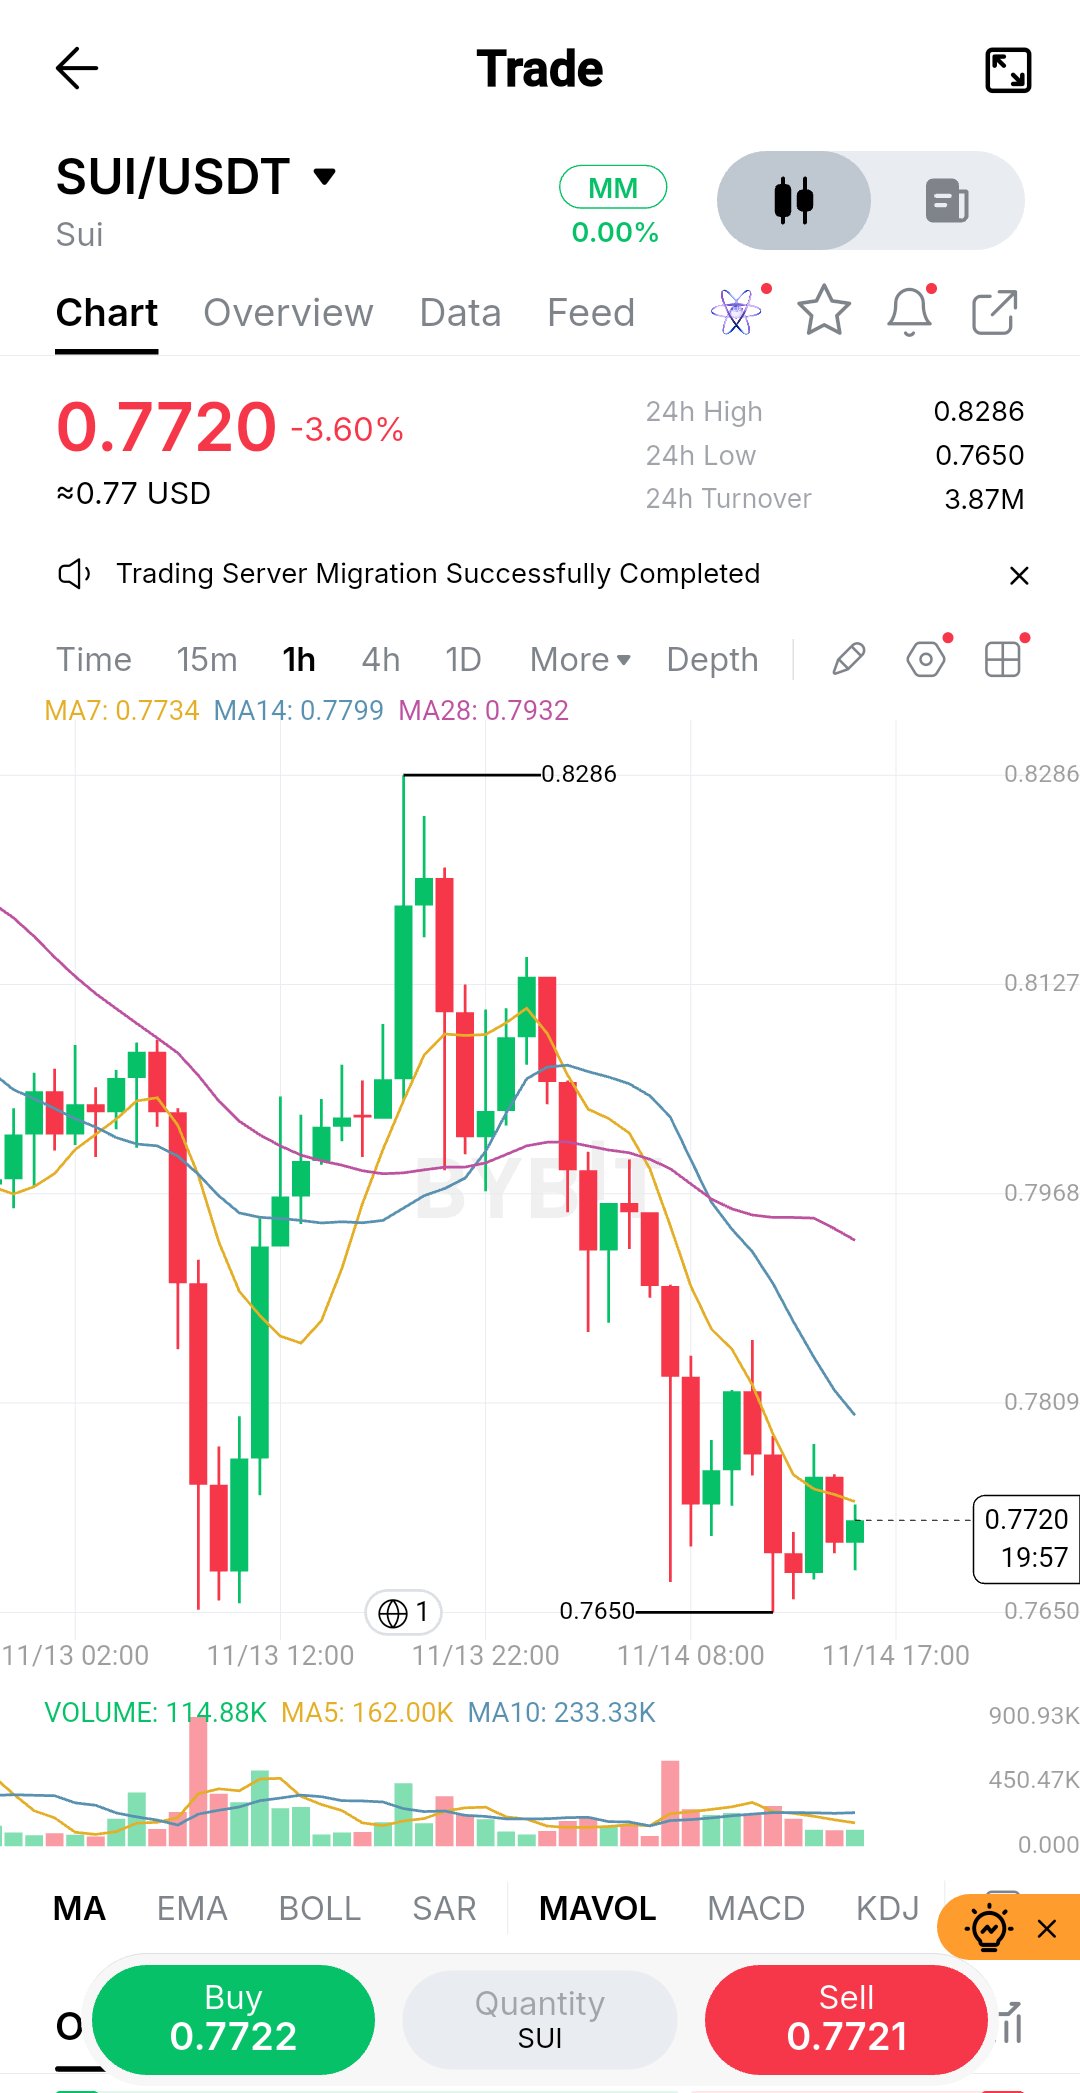
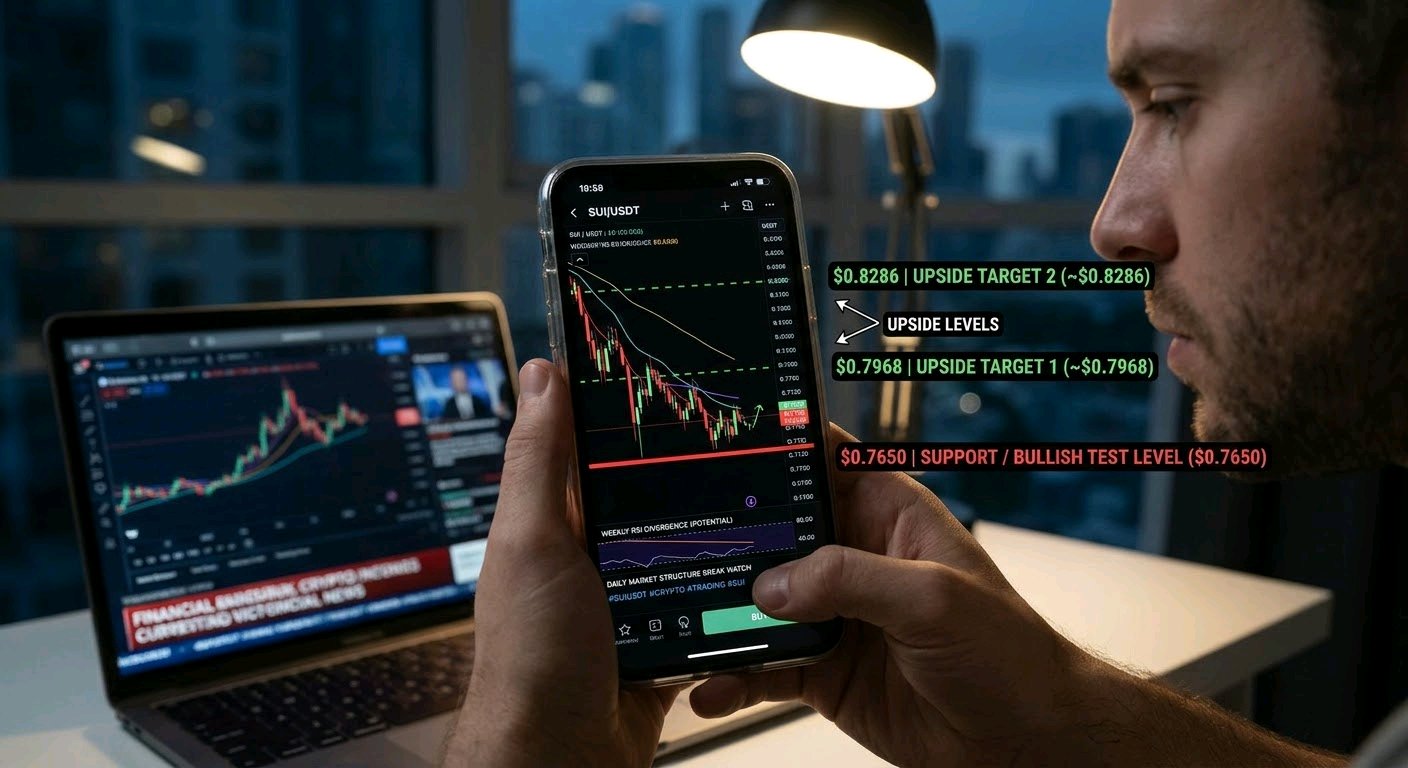
1本の赤いライン。2つの上昇レベル。これが$SUIUSDTに注目している理由だ。 チャート上で最も重要な数字は$0.7650。ここが私の強気シナリオの正念場となる。 セットアップ $SUIは本日約3.6%下落し、$0.7720付近で推移しており、以前の高値を大きく下回っている。 週足RSI分析では、強気のダイバージェンスの可能性があることを示唆している。 日足チャートではすでに最初の反応が見られ、現在価格はそのベースを再テストしている。 私が見たいのは、買い手が売り圧力を吸収し、その後に日足市場構造が明確に変化することだ。 もし出来高を伴ってそれが実現すれば、以下の2つのスイングレベルに注目する。 🎯 ターゲット1: ~$0.7968 ($0.7720から約+3.2%) 🎯 ターゲット2: ~$0.8286 ($0.7720から約+7.3%、直近のスイングハイ) これらは野心的なシナリオであり、リターンを保証するものではない。 月曜の伝統的市場の再開が新たな動きをもたらす可能性もあるが、$SUIには回復を支える独自の買い出来高が必要だ。中型アルトコインであるため、どちらの方向にも急激な動きが起こり得る。 管理: もし価格が$0.7650を割り込み、そのレベルを回復できない場合、私の強気セットアップは無効となる。新規ポジションについては、日足での確実な高値切り上げ(Higher Low)の確認、直近の安値切り下げ(Lower High)ラインのブレイク、そして出来高の拡大を確認したい。プロテクティブ・ストップ(損切り)は、確定した構造の下に置くべきだ。ポジションサイズと最終的なリスク・リワード比は、事前の想定ではなく、実際のエントリーとストップに基づいて計算しなければならない。私は$SUIの回復の可能性に強く期待しているが、これが有望なチャートのままか、トレードする価値のあるものになるかは、次に来る出来高を伴った動き次第だ。 投資助言ではない。各自でリサーチを行い、リスク管理を徹底すること。 #IMPACTbyTrade

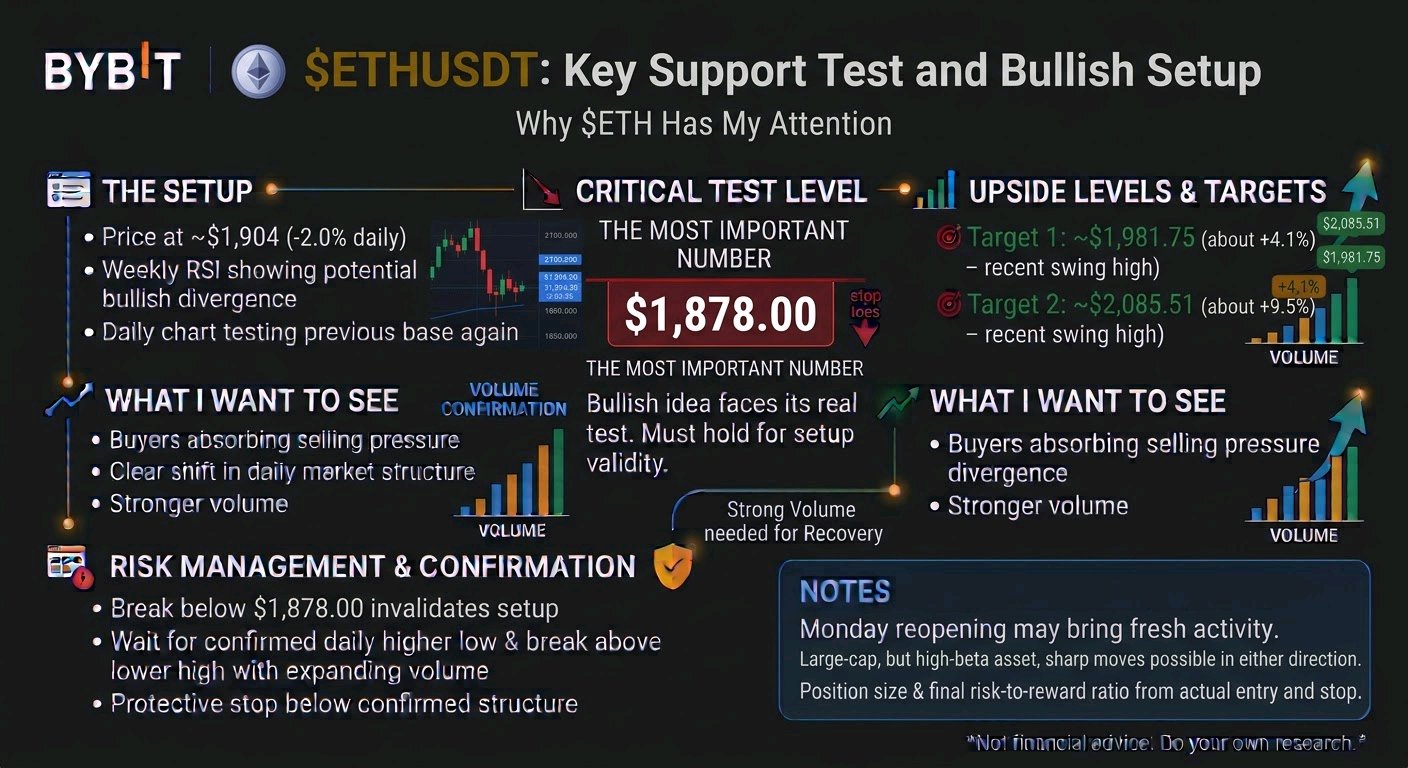
赤いラインが1本。上のレベルが2つ。これが、$ETHUSDTに注目している理由だ。 チャート上で最も重要な数字は1,878.00ドル。ここが私の強気シナリオの真の試金石となる。 セットアップ $ETHは本日約2%下落し、1,904ドル付近。数日間にわたる急落を経て、以前の高値を大きく下回って推移している。 週足RSI分析では、強気ダイバージェンスの可能性がある。 日足チャートではすでに初期反応が見られ、価格は現在その底値を再度テストしている。 私が見たいのは、買い手が売り圧力を吸収し、それに続いて日足の市場構造が明確に変化することだ。 もし出来高を伴ってそれが実現すれば、以下の2つのスイングレベルに注目する: 🎯 ターゲット1: 約1,981.75ドル(1,904ドルから約+4.1%) 🎯 ターゲット2: 約2,085.51ドル(1,904ドルから約+9.5%) これらは野心的なシナリオであり、利益を保証するものではない。 月曜日の伝統的市場の再開が新たな動きをもたらすかもしれないが、$ETHが意味のある回復を見せるには、それ自体の買い出来高が必要だ。大型銘柄とはいえ依然としてハイベータ資産であるため、どちらの方向にも急激な動きが発生する可能性がある。 管理:もし価格が1,878.00ドルを割り込み、その水準を回復できない場合、私の強気セットアップは無効となる。新規ポジションについては、日足での確実な安値切り上げ(Higher Low)、直近の高値切り下げ(Lower High)のブレイク、そして出来高の増加を確認したい。プロテクティブ・ストップ(損切り)は、確定した構造の下に置くべきだ。ポジションサイズと最終的なリスク・リワード比は、前もって想定するのではなく、実際のエントリーとストップに基づいて計算しなければならない。私は$ETHの回復ポテンシャルに強く強気だが、このチャートが有望なままか、それともトレードする価値があるものになるかは、次にくる出来高を伴う動き次第だ。 投資助言ではない。ご自身でリサーチを行い、リスク管理を徹底すること。 $IMPACTbyTrade

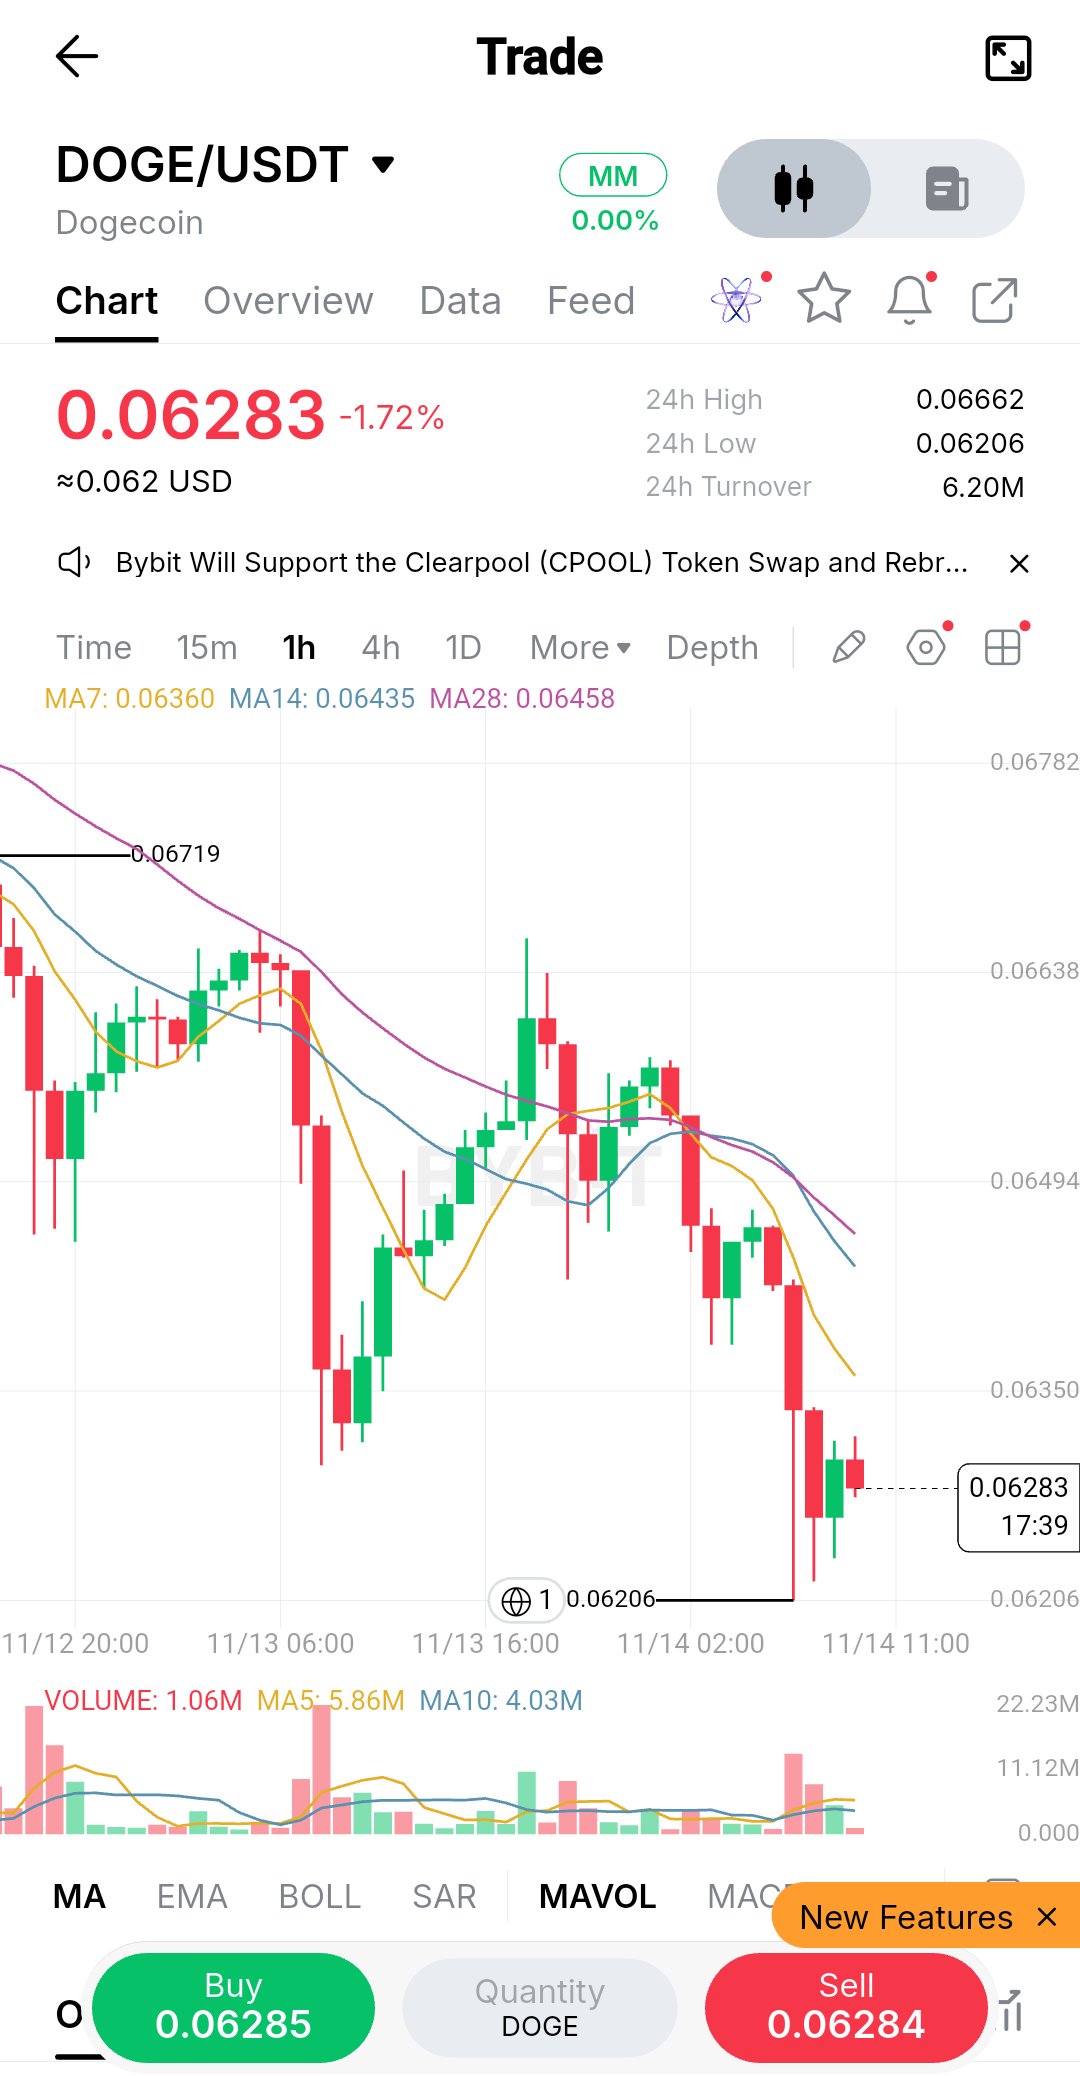
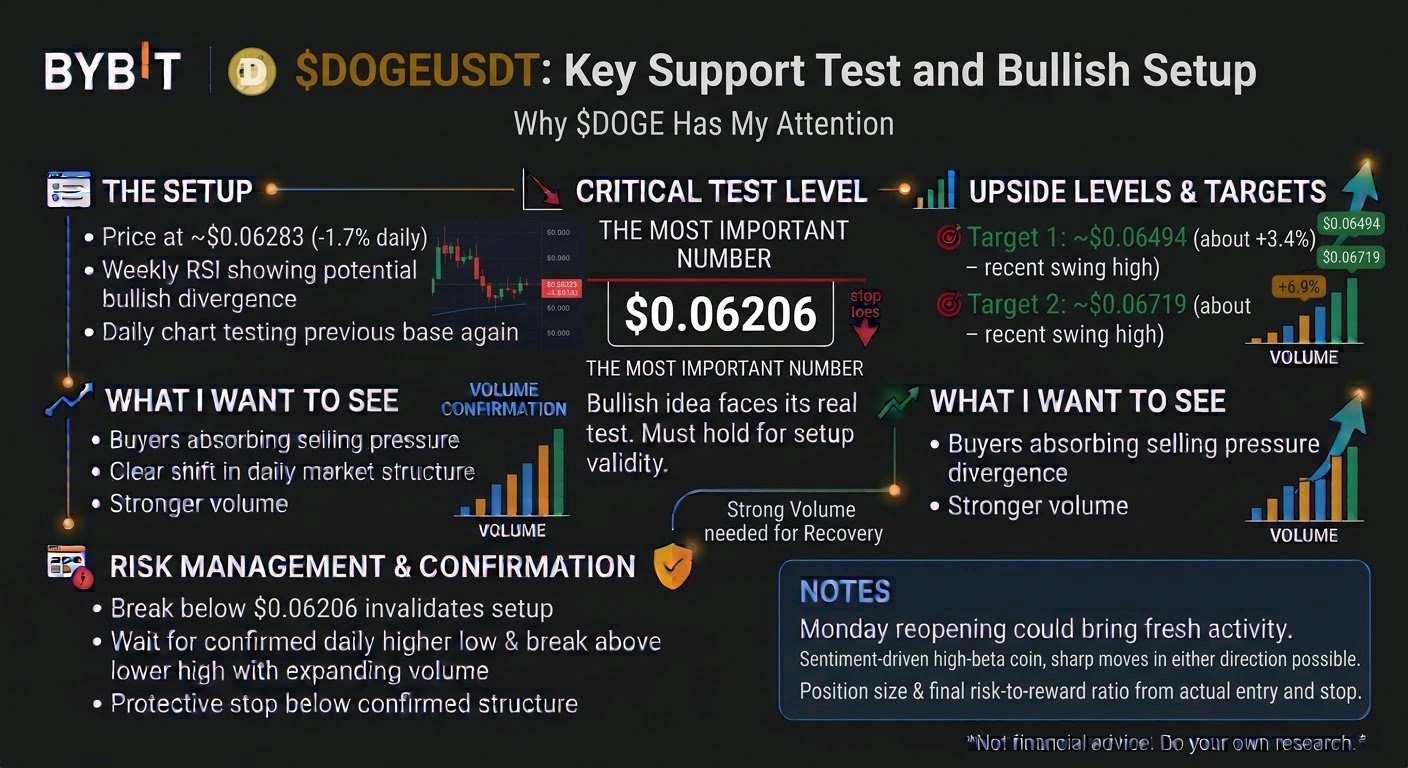
One red line. Two upside levels. This is why $DOGEUSDT has my attention. The most important number on my chart is $0.06206. That's where my bullish idea faces its real test. The setup $DOGE is down about 1.7% on the day at roughly $0.06283, and it is trading well below its prior highs. Weekly RSI analysis suggests a possible bullish divergence. The daily chart has already shown an initial reaction, and price is now testing that base again. What I want to see is buyers absorbing the selling pressure, followed by a clear shift in daily market structure. If that happens with stronger volume, I'm watching two swing levels: 🎯 Target 1: ~$0.06494 (about +3.4% from $0.06283) 🎯 Target 2: ~$0.06719 (about +6.9% from $0.06283), the recent swing high These are ambitious scenarios, not guaranteed returns. Monday's reopening of traditional markets could bring fresh activity, but $DOGE needs its own buying volume to support a meaningful recovery. As a high-beta, sentiment-driven coin, sharp moves can happen in either direction. Management: If price breaks below $0.06206 and cannot recover that level, my bullish setup is no longer valid. For a new position, I want a confirmed daily higher low, a break above the latest lower high, and expanding volume. The protective stop belongs below the confirmed structure. Position size and the final risk-to-reward ratio must be calculated from the actual entry and stop, not assumed in advance. I'm heavily bullish on $DOGE's recovery potential, but the next volume-backed move will determine whether this remains a promising chart or becomes a trade worth taking. Not financial advice. Do your own research and manage your risk. #IMPACTbyTrade
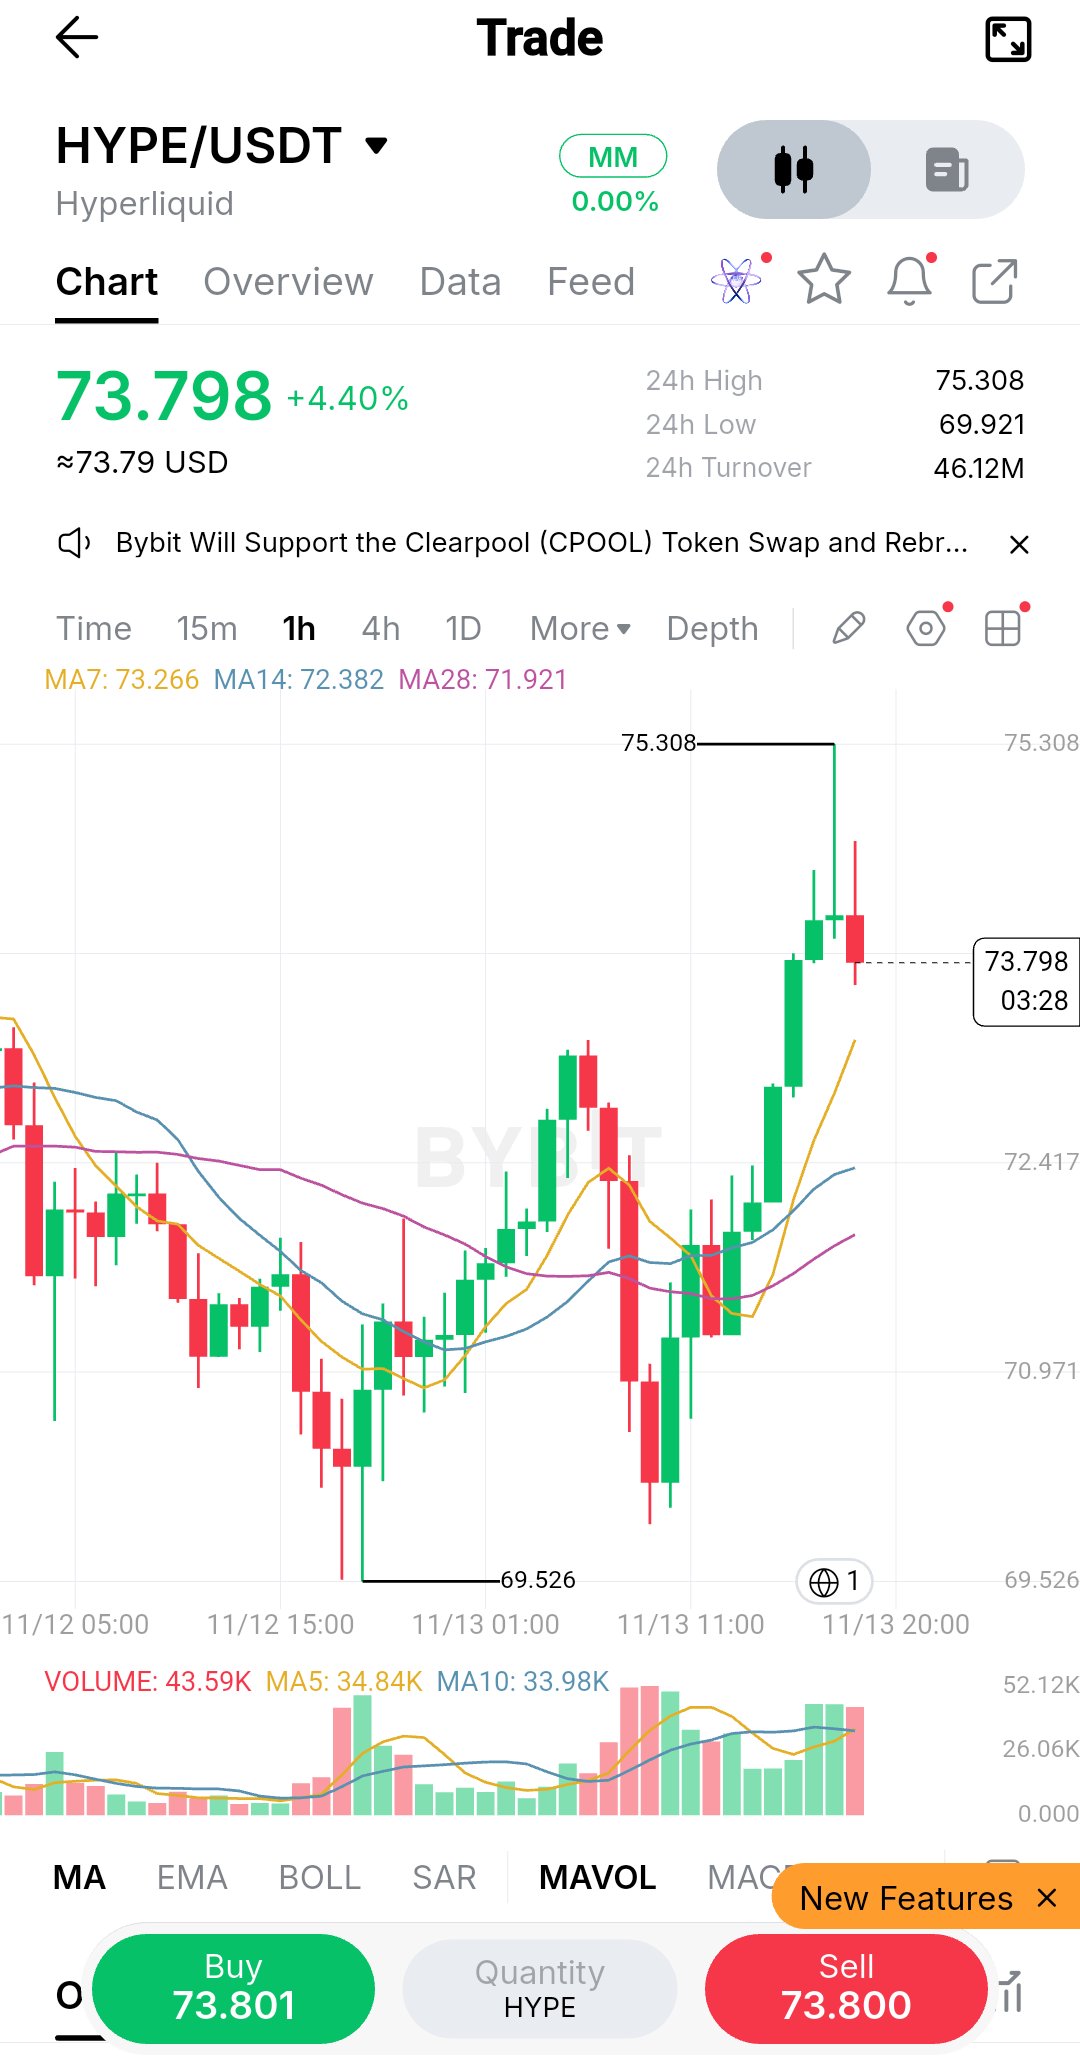
一本の赤いライン。2つの上値レベル。これが私が$QNTUSDTに注目している理由です。 私のチャートで最も重要な数字は$154.97です。ここが私の強気シナリオの正念場となります。 セットアップ $QNTは本日約1.3%下落し、$156.93付近で推移しており、直近の高値を大きく下回っています。 週足RSI分析では、強気のダイバージェンスの可能性が示唆されています。 日足チャートではすでに最初の反応が見られ、現在そのベースを再テストしています。 私が見たいのは、売り圧力を買い手が吸収し、その後に日足の市場構造が明確に転換することです。 もし出来高を伴ってそれが実現すれば、以下の2つのスイングレベルに注目します。 🎯 目標1: ~$163.84 ($156.93から約+4.4%) 🎯 目標2: ~$168.95 ($156.93から約+7.7%)、直近のスイングハイ これらは野心的なシナリオであり、リターンが保証されているわけではありません。 月曜の伝統的市場の再開で新たな動きがあるかもしれませんが、$QNTには回復を支えるための独自の買い出来高が必要です。また、時価総額が比較的小さいため、どちらの方向にも急激な動きが発生する可能性があり、取引高の薄さ(1日約200万ドル)がそれを増幅させる可能性があります。 管理: もし価格が$154.97を割り込み、そのレベルを回復できない場合、私の強気セットアップは無効となります。新規ポジションについては、日足での確実な高値切り上げ、直近の戻り高値のブレイク、そして出来高の拡大を確認したいところです。プロテクティブ・ストップ(損切り)は、確定した構造の下に置くべきです。ポジションサイズと最終的なリスク・リワード比は、想定ではなく、実際のエントリーとストップから計算する必要があります。私は$QNTの回復ポテンシャルに強く強気ですが、出来高を伴った次の動きが、これが単なる有望なチャートにとどまるのか、それとも実際にトレードする価値のあるものになるのかを決定づけるでしょう。 投資助言ではありません。ご自身でリサーチを行い、リスク管理を徹底してください。 #IMPACTbyTrade
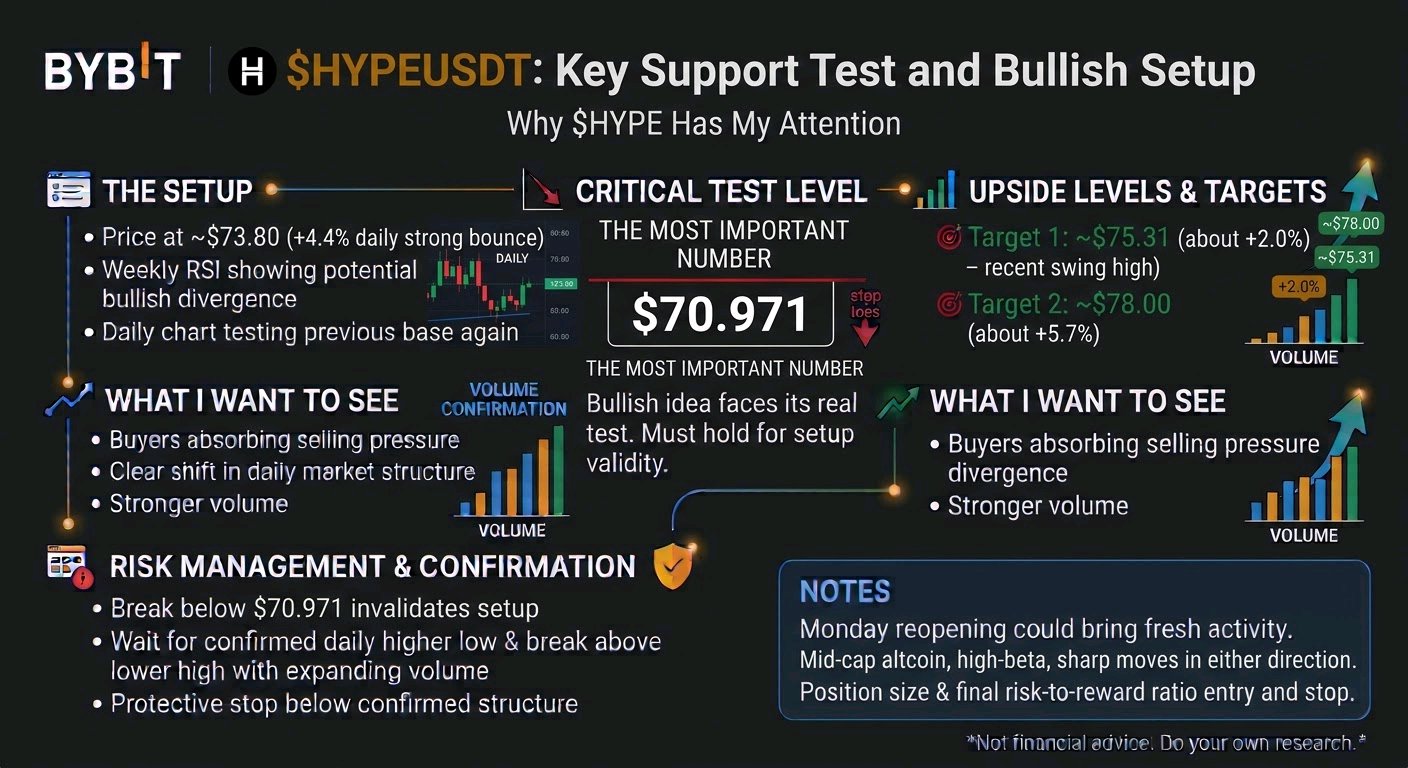
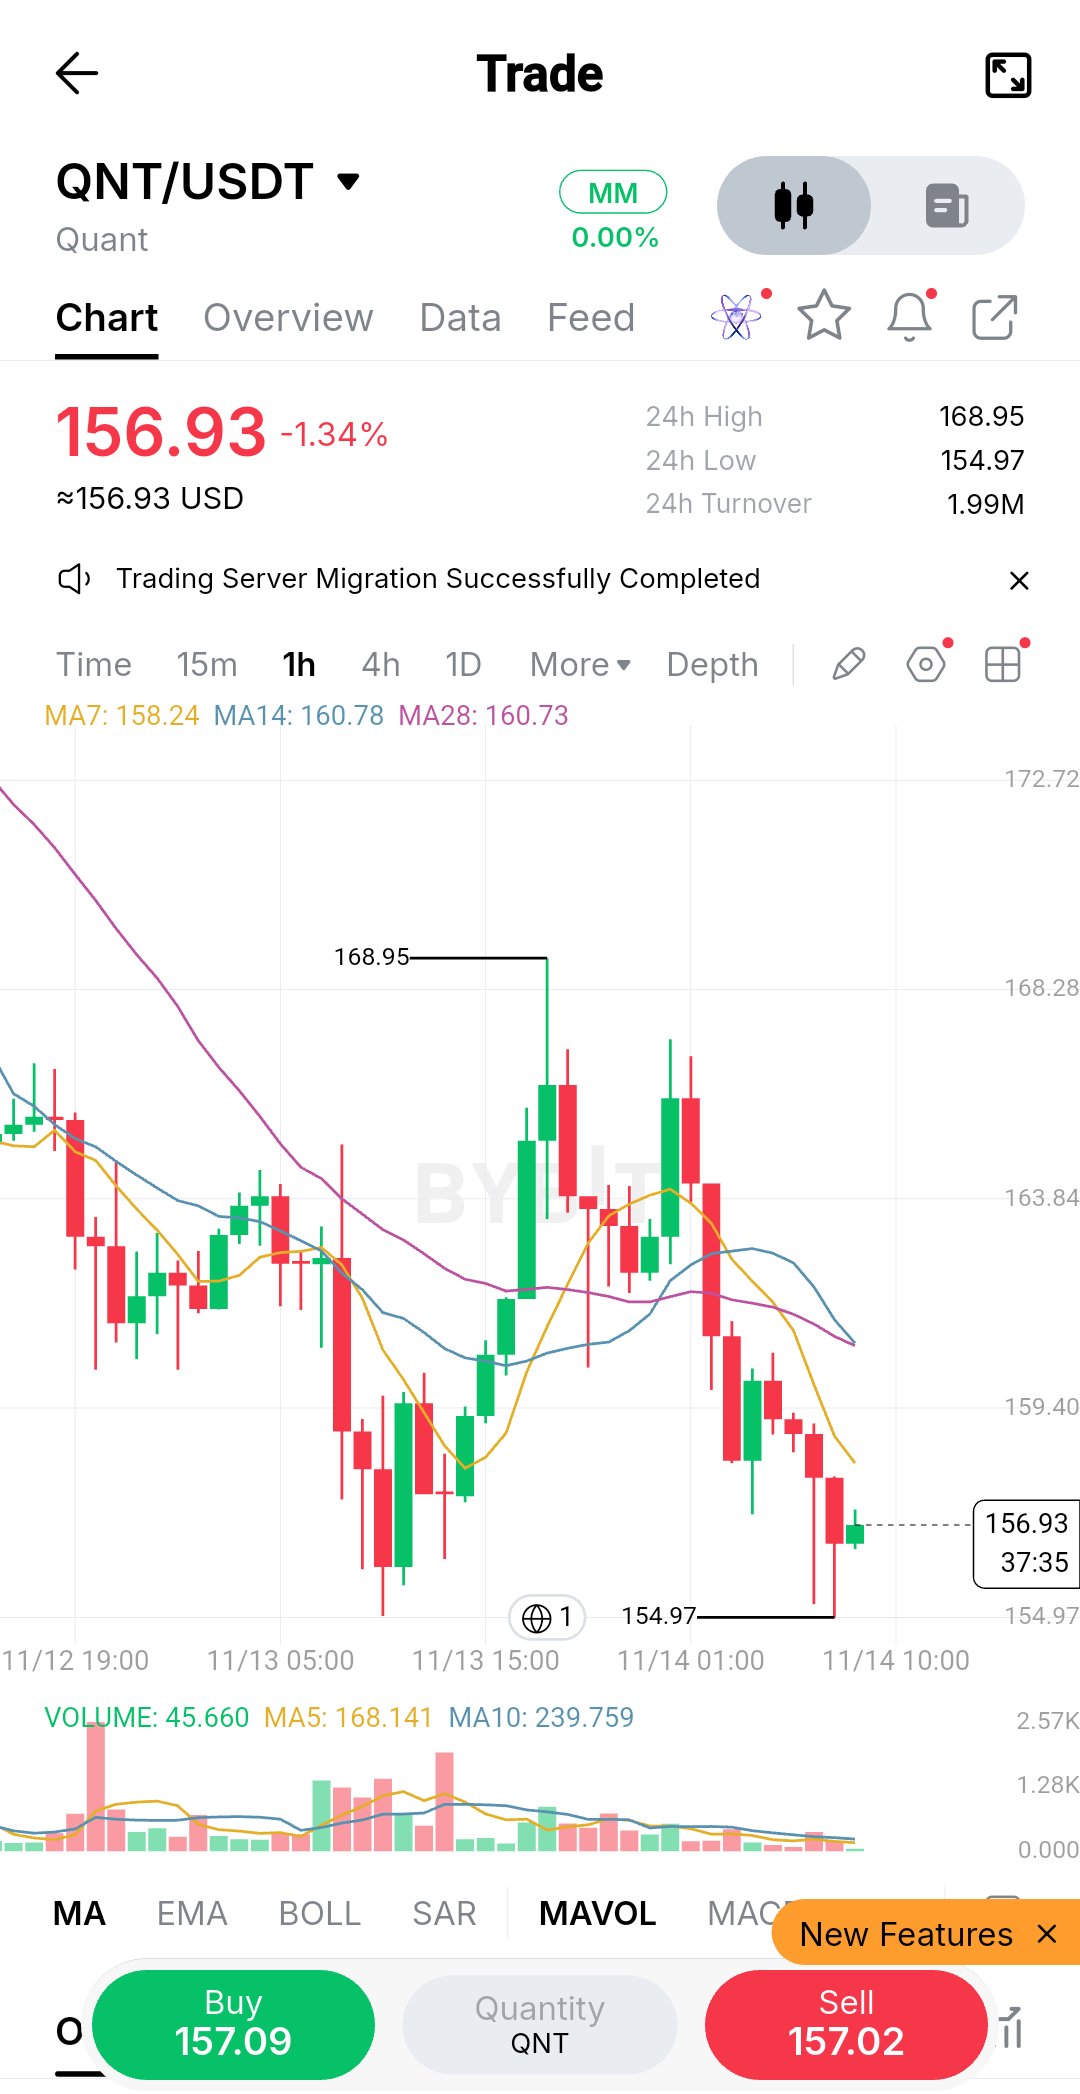

一本の赤いライン。二つのアップサイドレベル。これが私が$HYPEUSDTに注目している理由です。 私のチャートで最も重要な数字は$70.971です。ここが、私の強気シナリオが真に試される場所です。 セットアップ $HYPEは安値からの力強い反発を経て、現在約$73.80、本日比約4.4%上昇しており、ここから上昇を維持できるか注視しています。 週足RSI分析では強気ダイバージェンスの可能性が示唆されています。 日足チャートではすでに初期反応が見られ、価格は現在そのベースを再度テストしている状況です。 私が確認したいのは、売り圧力を買い手が吸収し、その後に日足の市場構造が明確に変化することです。 もし出来高を伴ってそれが実現すれば、以下の二つのスイングレベルに注目します。 🎯 ターゲット1: 約$75.31($73.80から約+2%)、直近のスイングハイ 🎯 ターゲット2: 約$78.00($73.80から約+5.7%) これらは野心的なシナリオであり、リターンが保証されているわけではありません。 月曜の伝統的市場の再開により新たな動きがあるかもしれませんが、$HYPEが本格的な回復を見せるには、それ自体の買い出来高が必要です。ハイベータの中型株として、どちらの方向にも急激な動きが起こり得ます。 管理:もし価格が$70.971を割り込み、そのレベルを回復できない場合、私の強気セットアップは無効となります。新規ポジションについては、日足での確実な高値切り上げ(Higher Low)、直近の安値切り下げ(Lower High)ラインの上抜け、そして出来高の増加を確認したいところです。プロテクティブ・ストップは、確定した構造の下に置くべきです。ポジションサイズと最終的なリスク・リワード比は、あらかじめ想定するのではなく、実際の参入価格とストップ価格から算出する必要があります。私は$HYPEの回復ポテンシャルに対して非常に強気ですが、次に出来高を伴った動きがあるかどうかが、これが有望なチャートであり続けるのか、それとも見送るべきトレードになるのかを決定づけるでしょう。 投資助言ではありません。ご自身で調査を行い、リスク管理を行ってください。 #IMPACTbyTrade

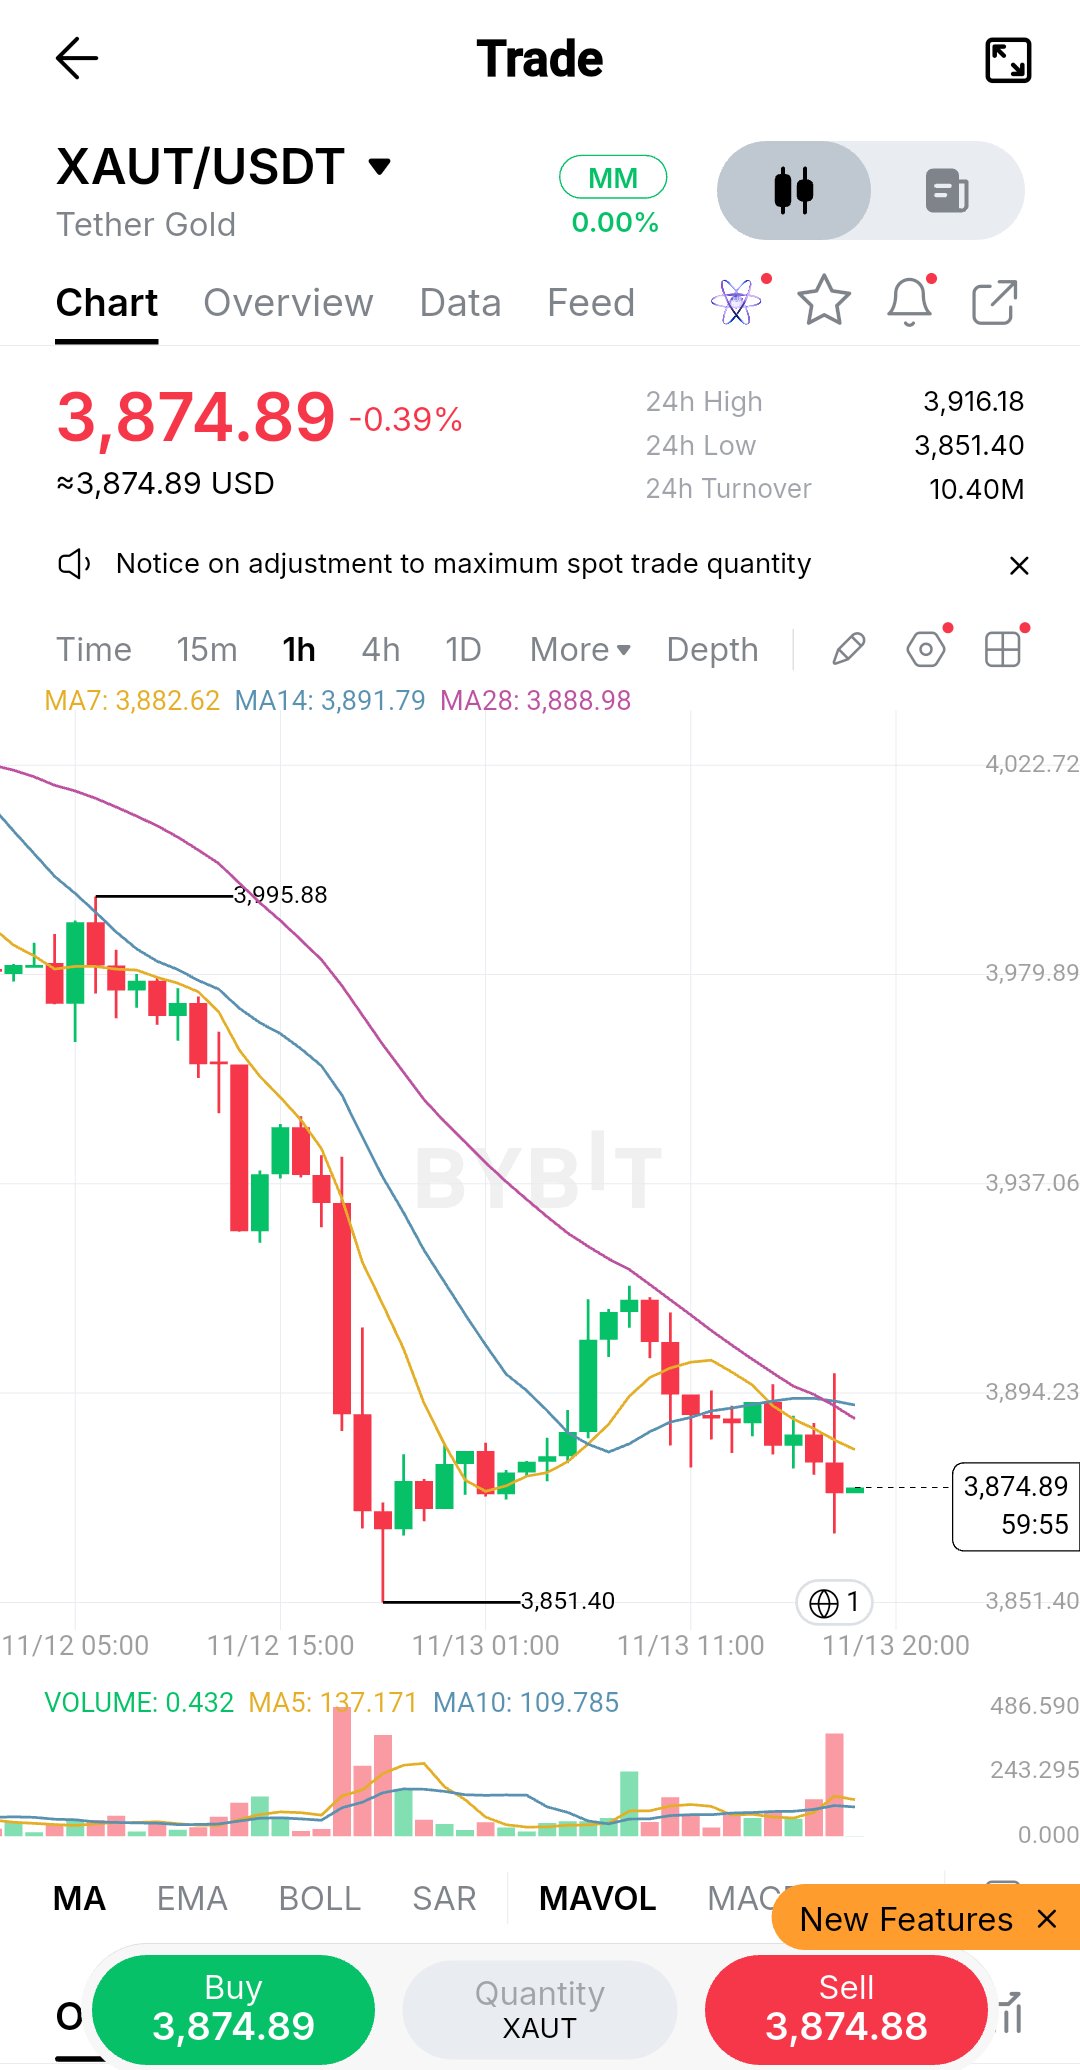
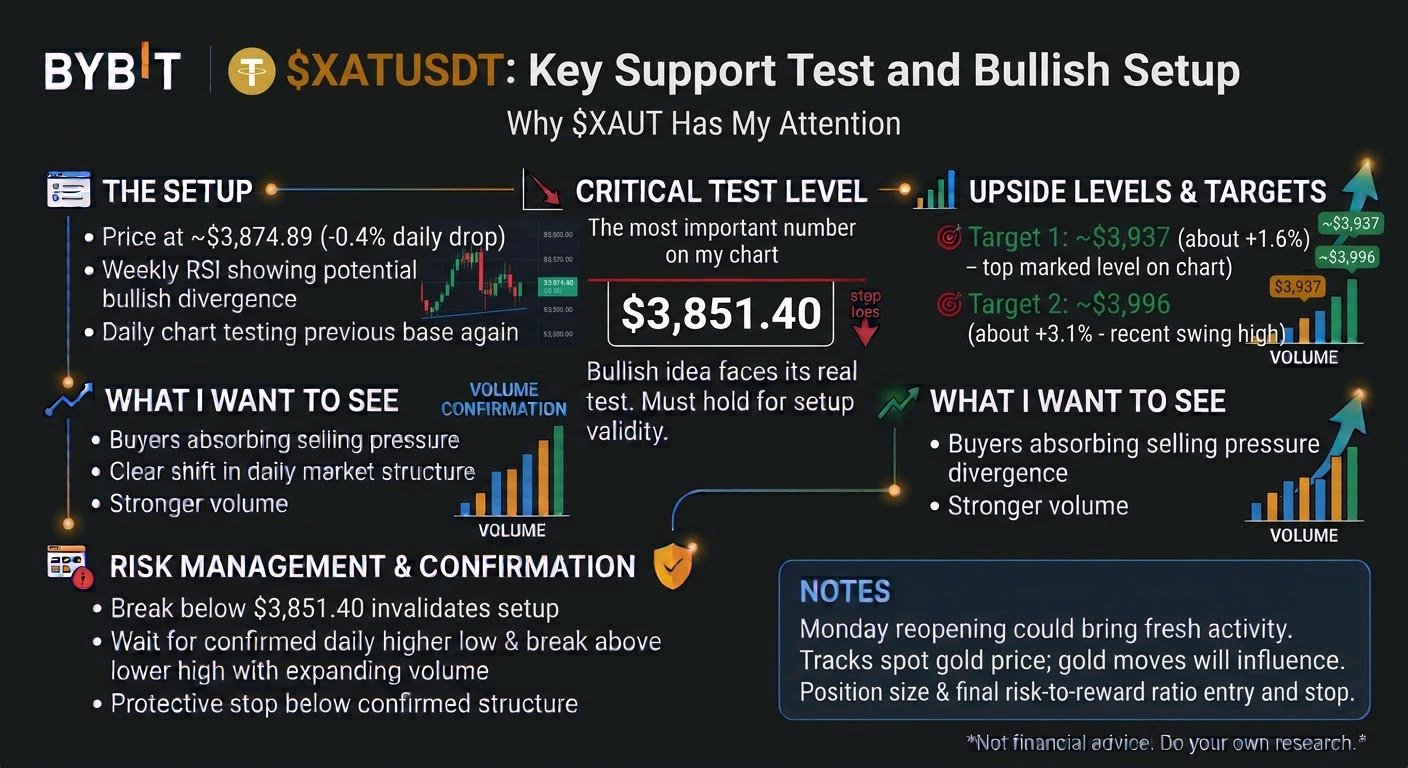
One red line. Two upside levels. This is why $XAUTUSDT has my attention. The most important number on my chart is $3,851.40. That's where my bullish idea faces its real test. The setup $XAUT is down about 0.4% on the day at roughly $3,874.89, and it is trading below its recent highs after a steady pullback. Weekly RSI analysis suggests a possible bullish divergence. The daily chart has already shown an initial reaction, and price is now testing that base again. What I want to see is buyers absorbing the selling pressure, followed by a clear shift in daily market structure. If that happens with stronger volume, I'm watching two swing levels: 🎯 Target 1: ~$3,937 (about +1.6% from $3,874.89) 🎯 Target 2: ~$3,996 (about +3.1% from $3,874.89), the recent swing high These are ambitious scenarios, not guaranteed returns. Monday's reopening of traditional markets could bring fresh activity, but $XAUT needs its own buying volume to support a meaningful recovery. As a gold-backed token, it also tracks the spot gold price, so moves in gold can push it in either direction. Management: If price breaks below $3,851.40 and cannot recover that level, my bullish setup is no longer valid. For a new position, I want a confirmed daily higher low, a break above the latest lower high, and expanding volume. The protective stop belongs below the confirmed structure. Position size and the final risk-to-reward ratio must be calculated from the actual entry and stop, not assumed in advance. I'm heavily bullish on $XAUT's recovery potential, but the next volume-backed move will determine whether this remains a promising chart or becomes a trade worth taking. Not financial advice. Do your own research and manage your risk. #IMPACTbyTrade

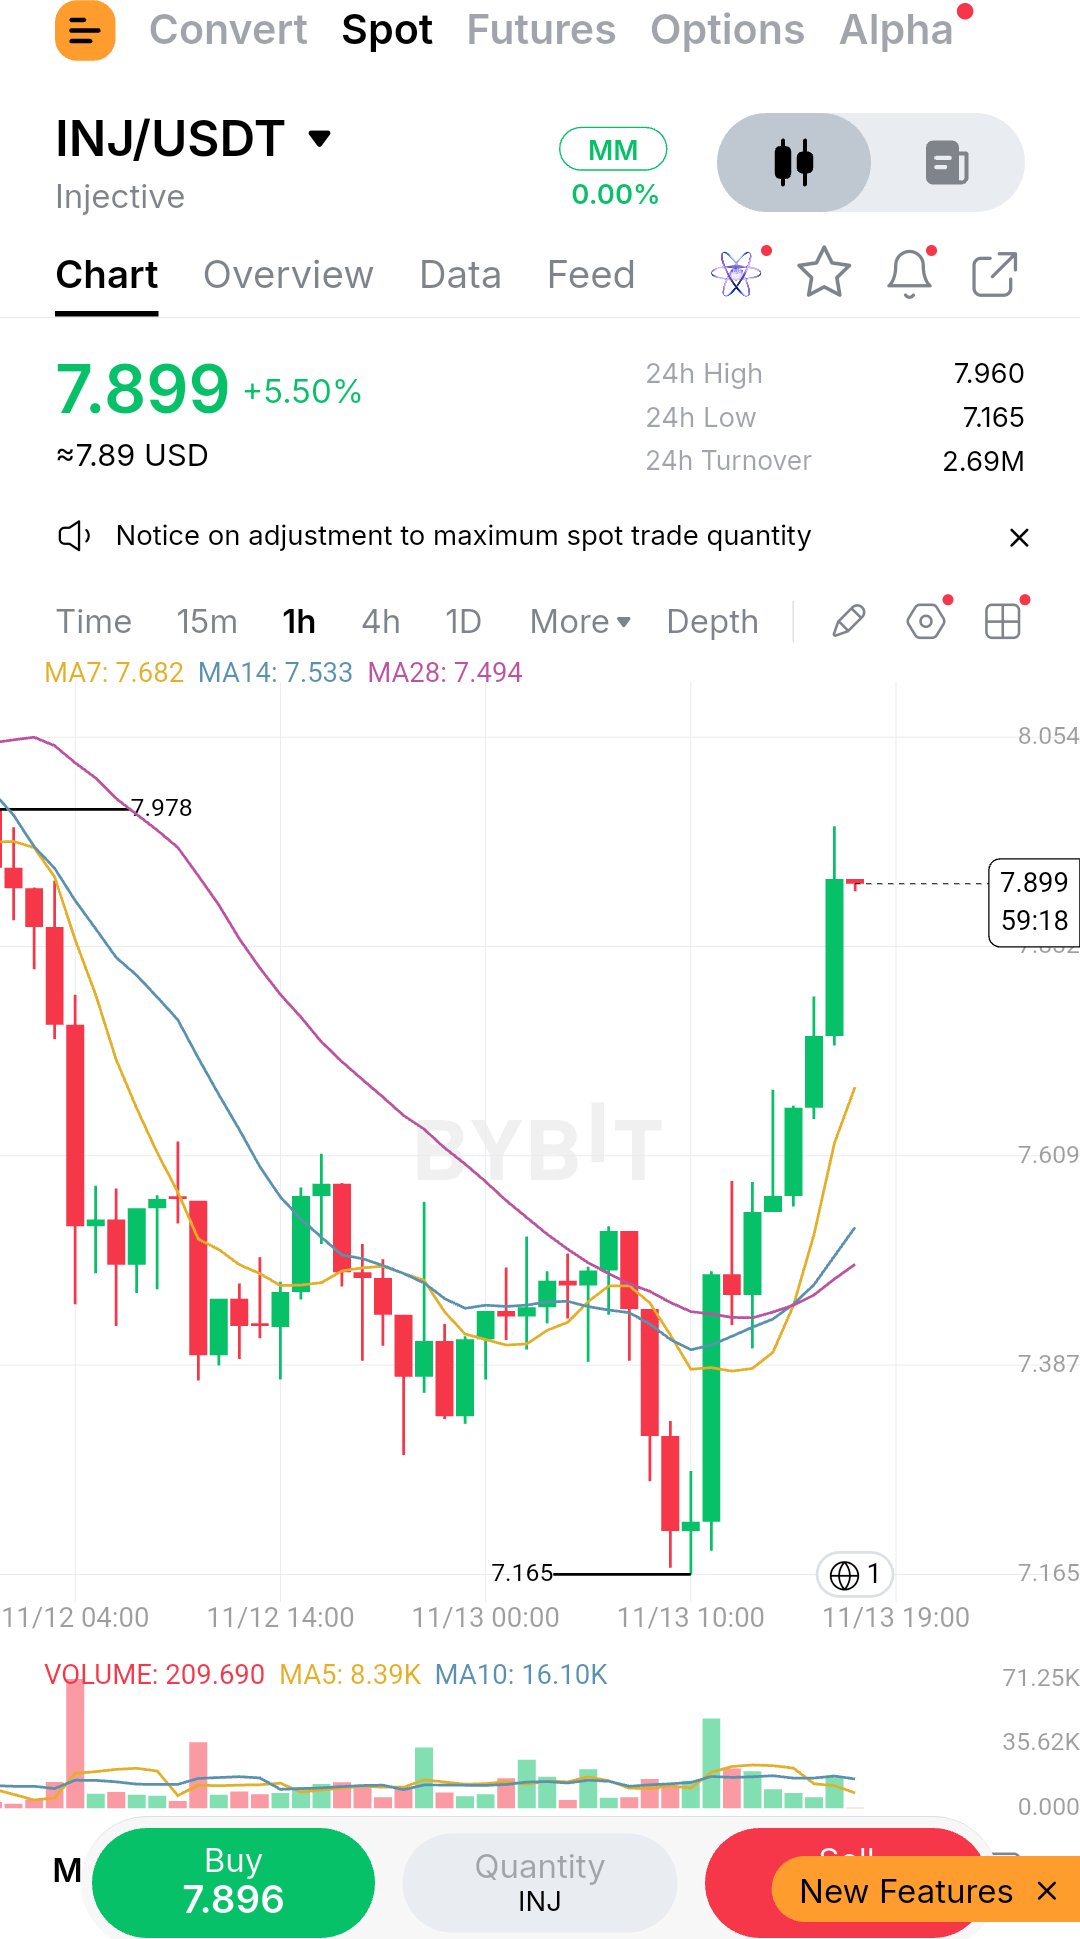
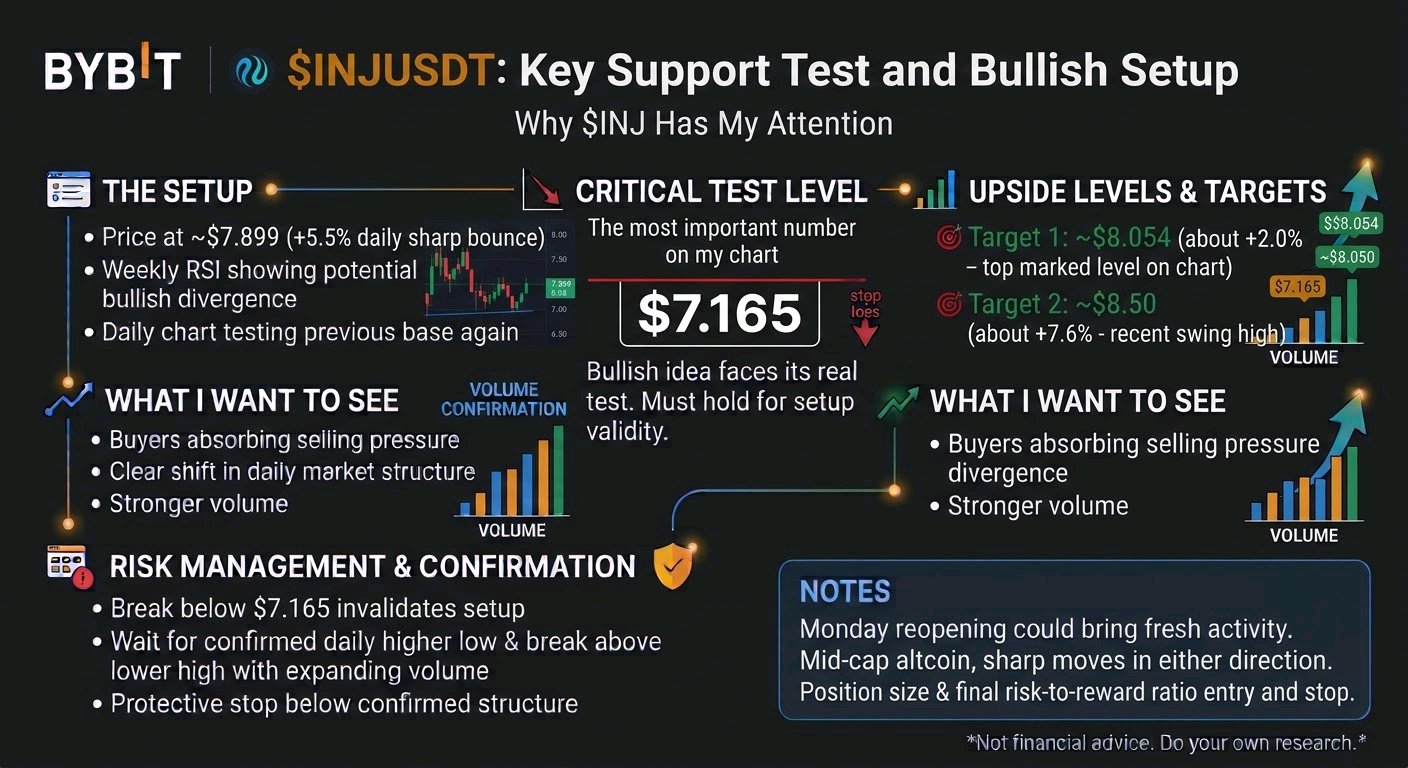
One red line. Two upside levels. This is why $INJUSDT has my attention. The most important number on my chart is $7.165. That's where my bullish idea faces its real test. The setup $INJ is up about 5.5% on the day at roughly $7.899 after a sharp bounce, and it is trading well below its prior highs. Weekly RSI analysis suggests a possible bullish divergence. The daily chart has already shown an initial reaction, and price is now testing that base again. What I want to see is buyers absorbing the selling pressure, followed by a clear shift in daily market structure. If that happens with stronger volume, I'm watching two swing levels: 🎯 Target 1: ~$8.054 (about +2% from $7.899), the chart's top marked level 🎯 Target 2: ~$8.50 (about +7.6% from $7.899) These are ambitious scenarios, not guaranteed returns. Monday's reopening of traditional markets could bring fresh activity, but $INJ needs its own buying volume to support a meaningful recovery. As a mid-cap altcoin, sharp moves can happen in either direction. Management: If price breaks below $7.165 and cannot recover that level, my bullish setup is no longer valid. For a new position, I want a confirmed daily higher low, a break above the latest lower high, and expanding volume. The protective stop belongs below the confirmed structure. Position size and the final risk-to-reward ratio must be calculated from the actual entry and stop, not assumed in advance. I'm heavily bullish on $INJ's recovery potential, but the next volume-backed move will determine whether this remains a promising chart or becomes a trade worth taking. Not financial advice. Do your own research and manage your risk. #IMPACTbyTrade

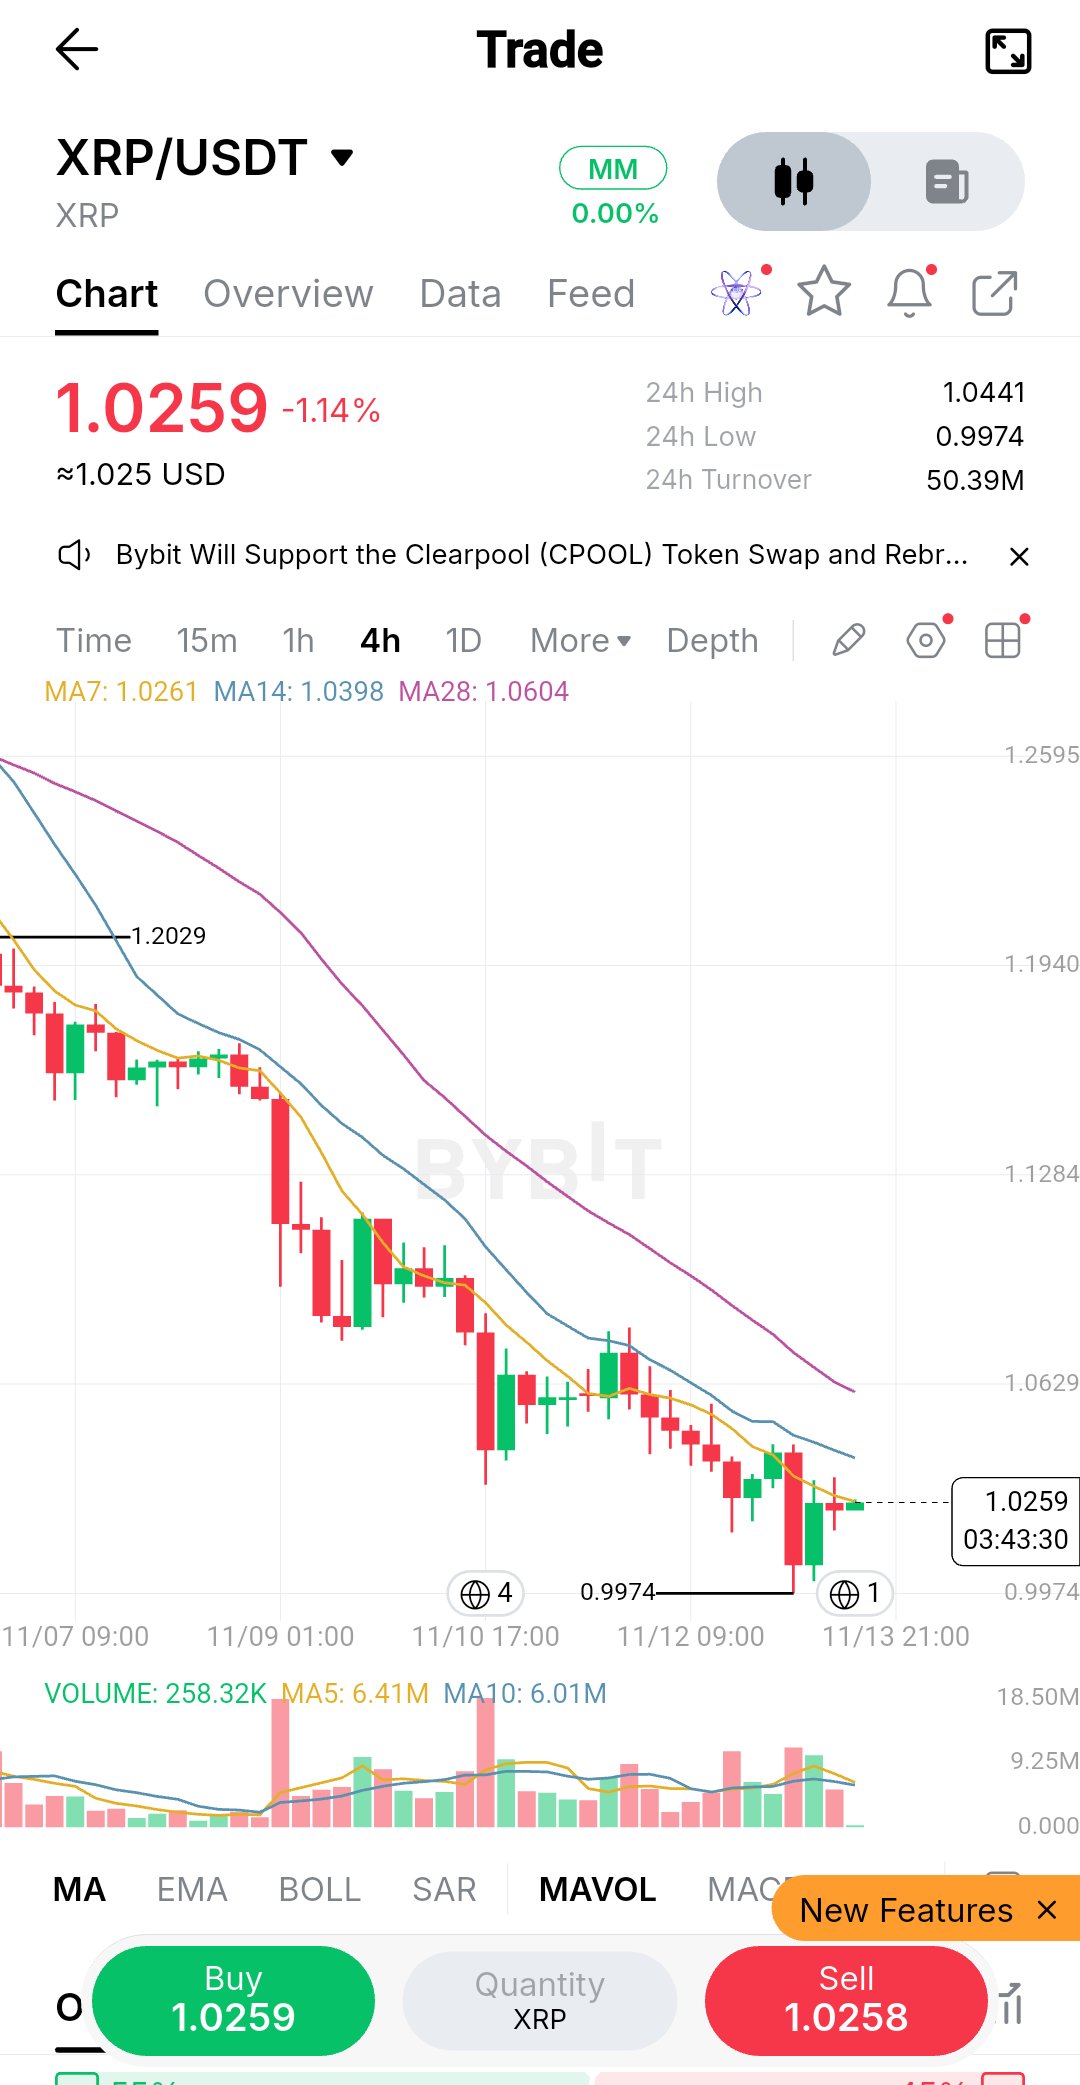
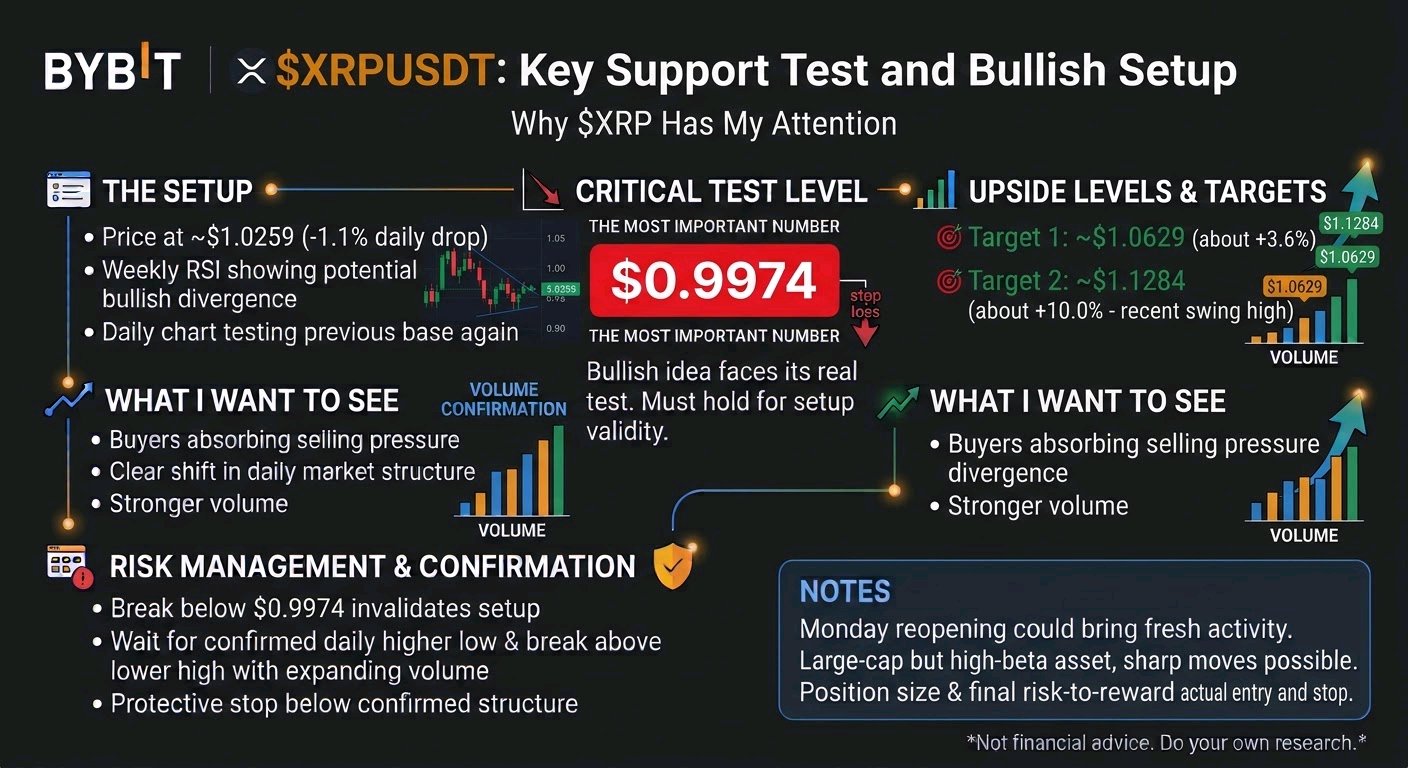
One red line. Two upside levels. This is why $XRPUSDT has my attention. The most important number on my chart is $0.9974. That's where my bullish idea faces its real test. The setup $XRP is down about 1.1% on the day at roughly $1.0259, and it is trading far below its prior highs after a long grind lower. Weekly RSI analysis suggests a possible bullish divergence. The daily chart has already shown an initial reaction, and price is now testing that base again. What I want to see is buyers absorbing the selling pressure, followed by a clear shift in daily market structure. If that happens with stronger volume, I'm watching two swing levels: 🎯 Target 1: ~$1.0629 (about +3.6% from $1.0259) 🎯 Target 2: ~$1.1284 (about +10% from $1.0259) These are ambitious scenarios, not guaranteed returns. Monday's reopening of traditional markets could bring fresh activity, but $XRP needs its own buying volume to support a meaningful recovery. As a high-beta large-cap, sharp moves can happen in either direction. Management: If price breaks below $0.9974 and cannot recover that level, my bullish setup is no longer valid. For a new position, I want a confirmed daily higher low, a break above the latest lower high, and expanding volume. The protective stop belongs below the confirmed structure. Position size and the final risk-to-reward ratio must be calculated from the actual entry and stop, not assumed in advance. I'm heavily bullish on $XRP's recovery potential, but the next volume-backed move will determine whether this remains a promising chart or becomes a trade worth taking. Not financial advice. Do your own research and manage your risk. #IMPACTbyTrade

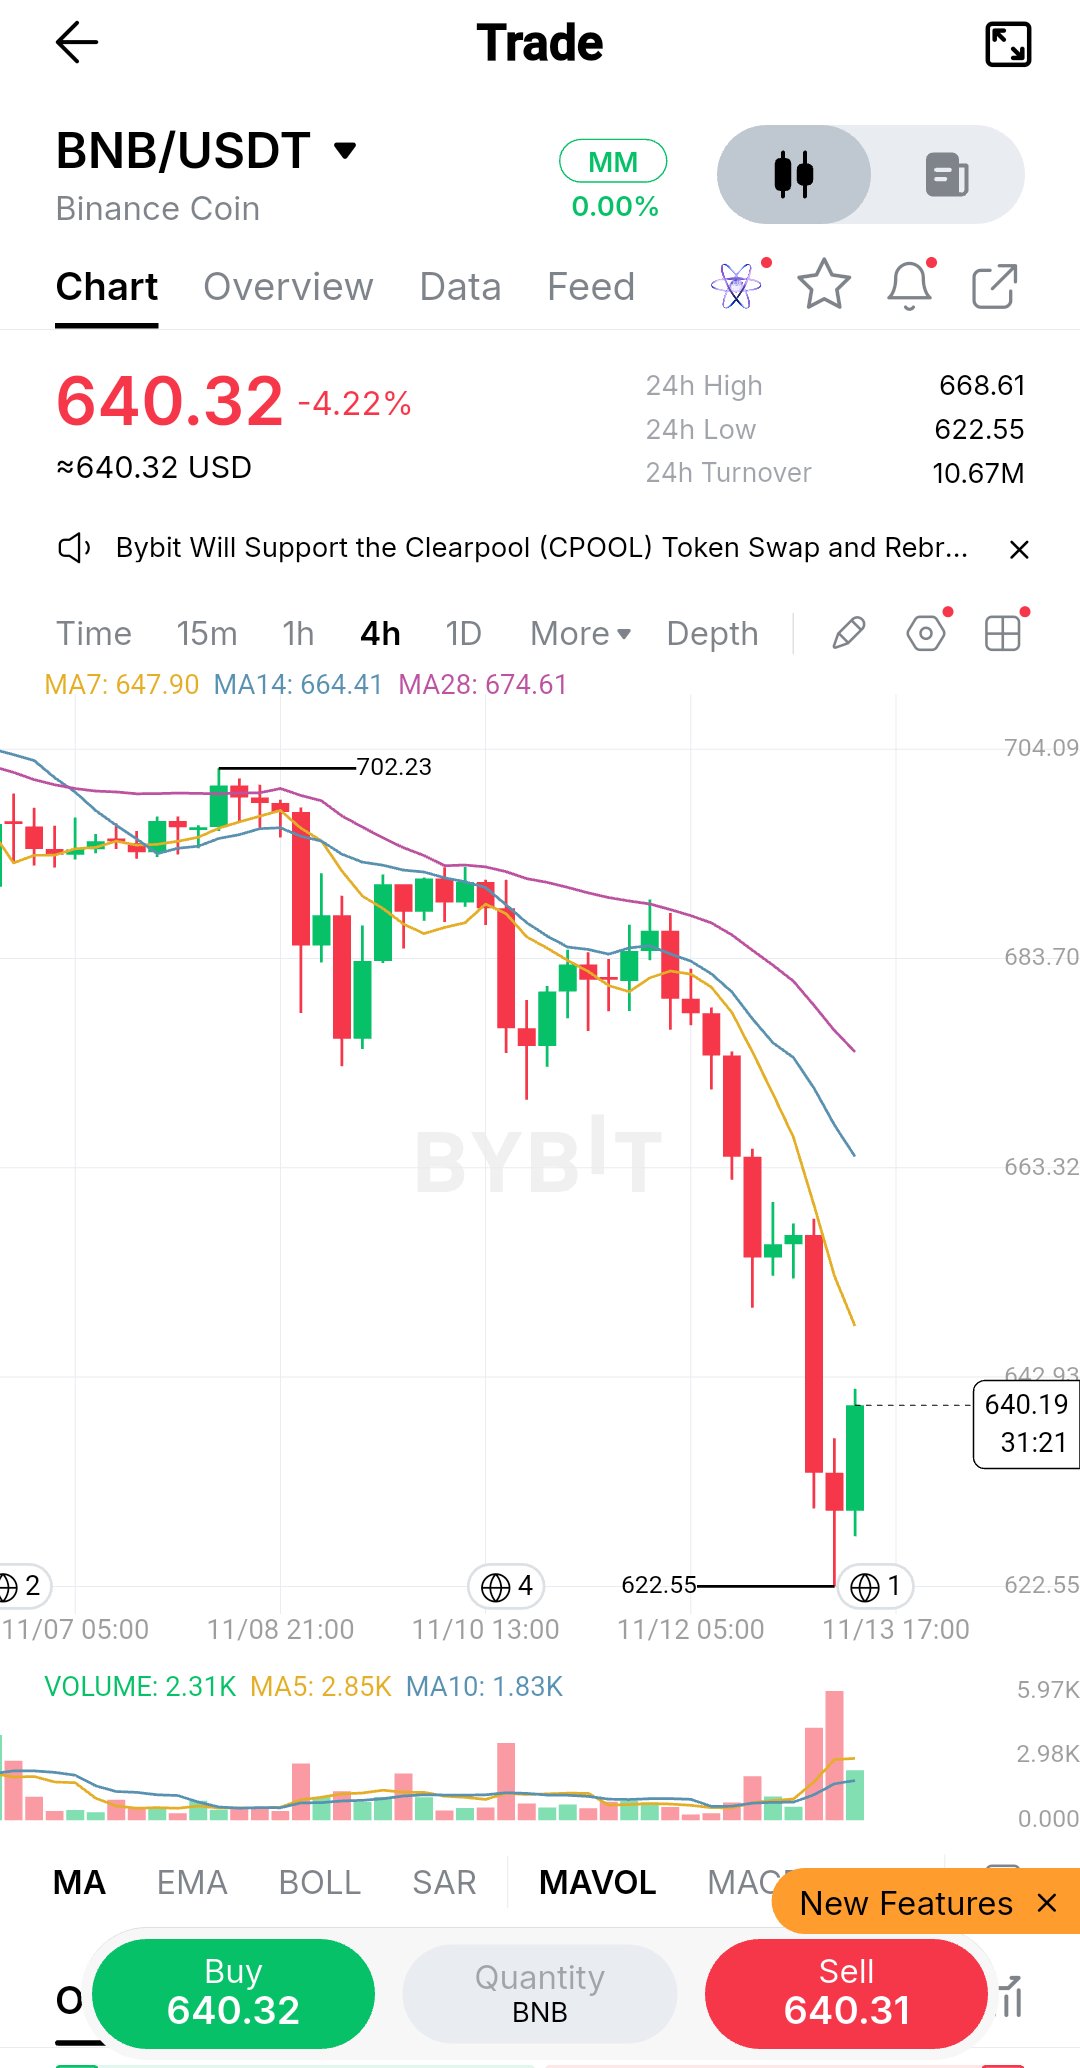
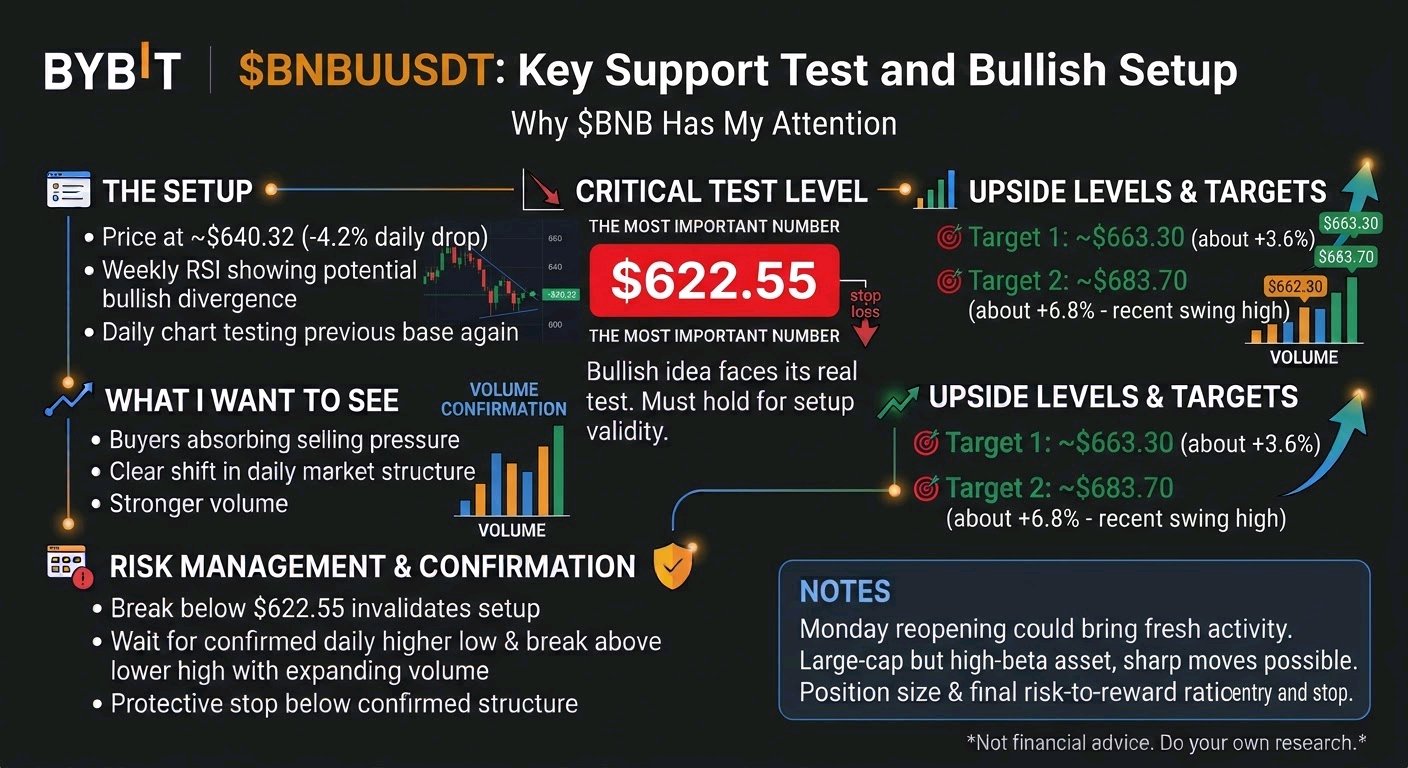
One red line. Two upside levels. This is why $BNBUSDT has my attention. The most important number on my chart is $622.55. That's where my bullish idea faces its real test. The setup $BNB has dropped about 4.2% on the day to roughly $640.32, and it is trading well below its prior highs. Weekly RSI analysis suggests a possible bullish divergence. The daily chart has already shown an initial reaction, and price is now testing that base again. What I want to see is buyers absorbing the selling pressure, followed by a clear shift in daily market structure. If that happens with stronger volume, I'm watching two swing levels: 🎯 Target 1: ~$663.30 (about +3.6% from $640.32) 🎯 Target 2: ~$683.70 (about +6.8% from $640.32) These are ambitious scenarios, not guaranteed returns. Monday's reopening of traditional markets could bring fresh activity, but $BNB needs its own buying volume to support a meaningful recovery. As a large-cap it is still a high-beta asset, so sharp moves can happen in either direction. Management: If price breaks below $622.55 and cannot recover that level, my bullish setup is no longer valid. For a new position, I want a confirmed daily higher low, a break above the latest lower high, and expanding volume. The protective stop belongs below the confirmed structure. Position size and the final risk-to-reward ratio must be calculated from the actual entry and stop, not assumed in advance. I'm heavily bullish on $BNB's recovery potential, but the next volume-backed move will determine whether this remains a promising chart or becomes a trade worth taking. Not financial advice. Do your own research and manage your risk. #IMPACTbyTrade

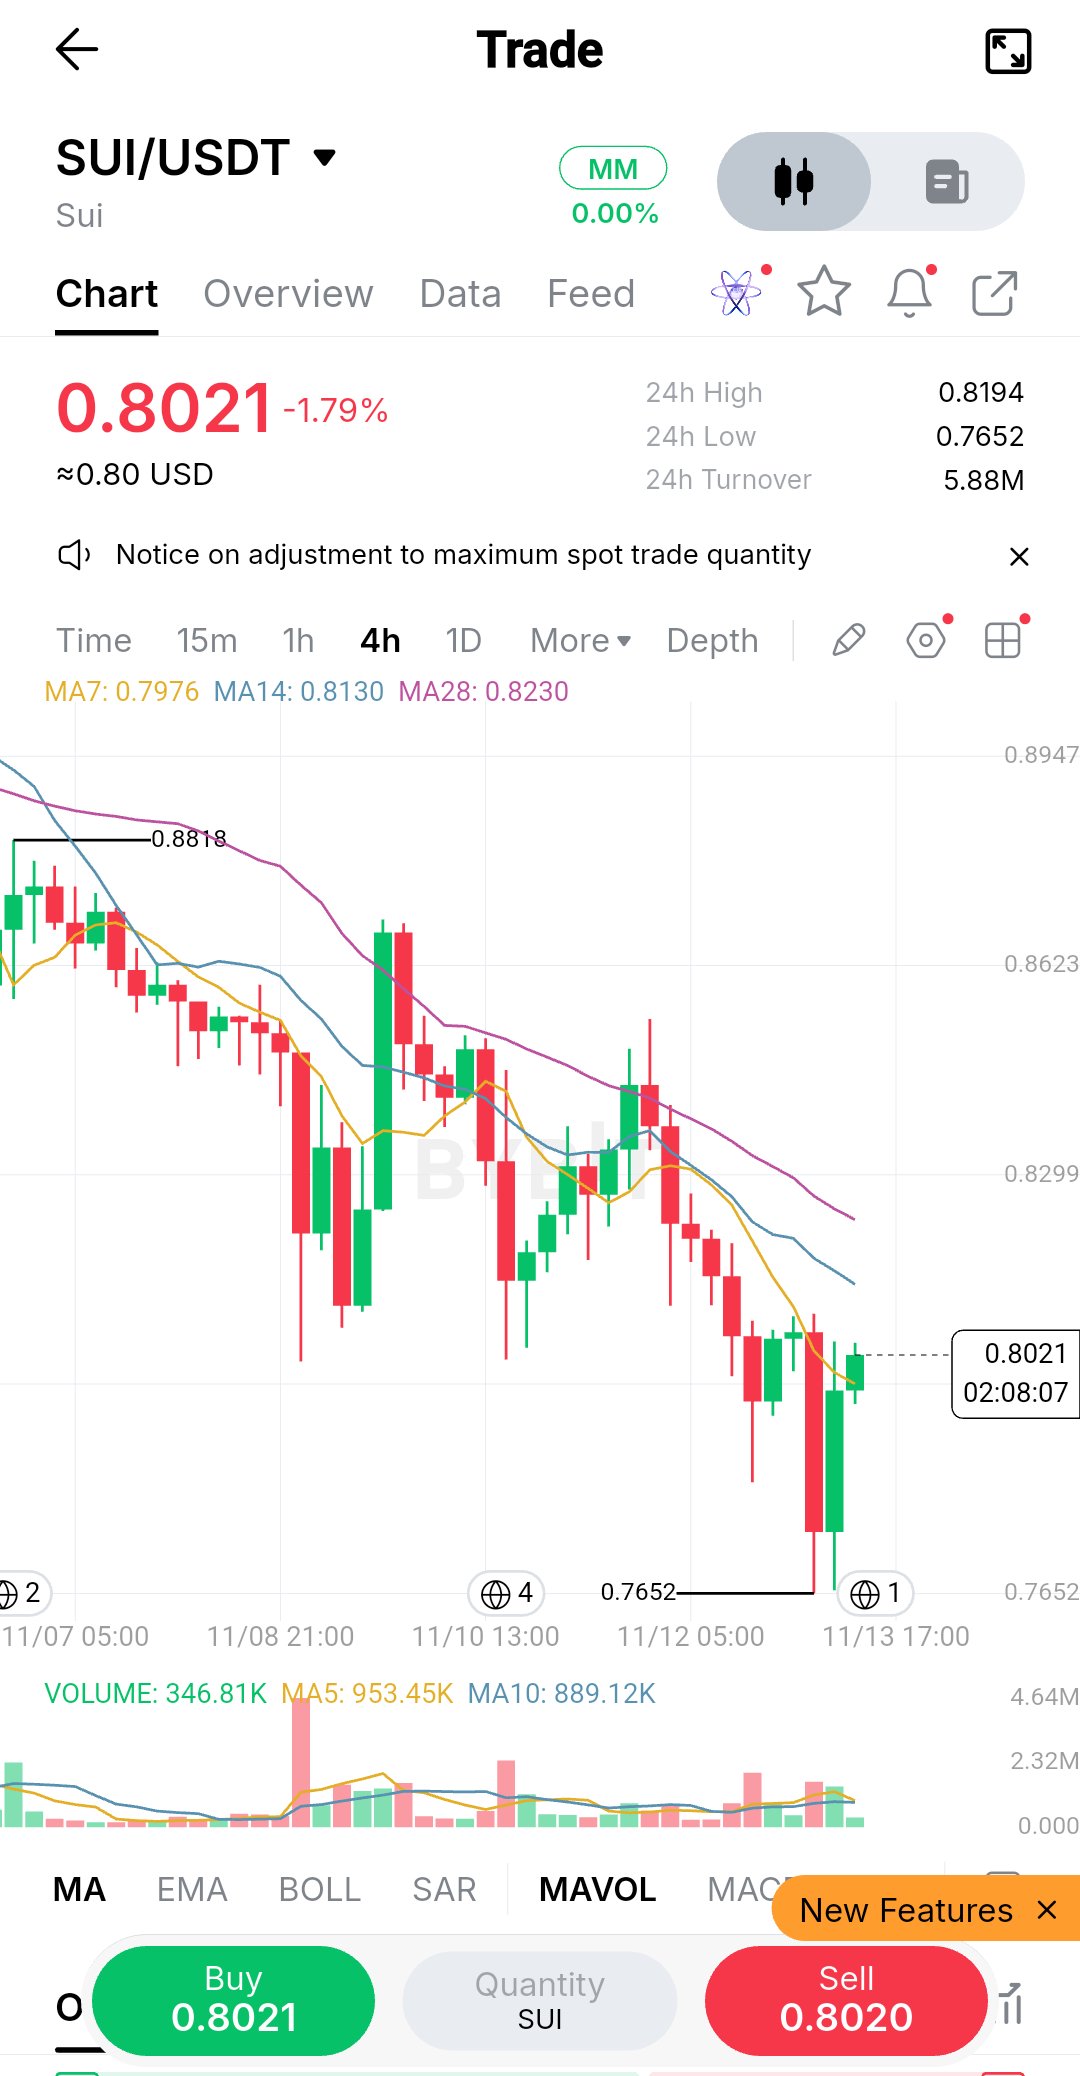
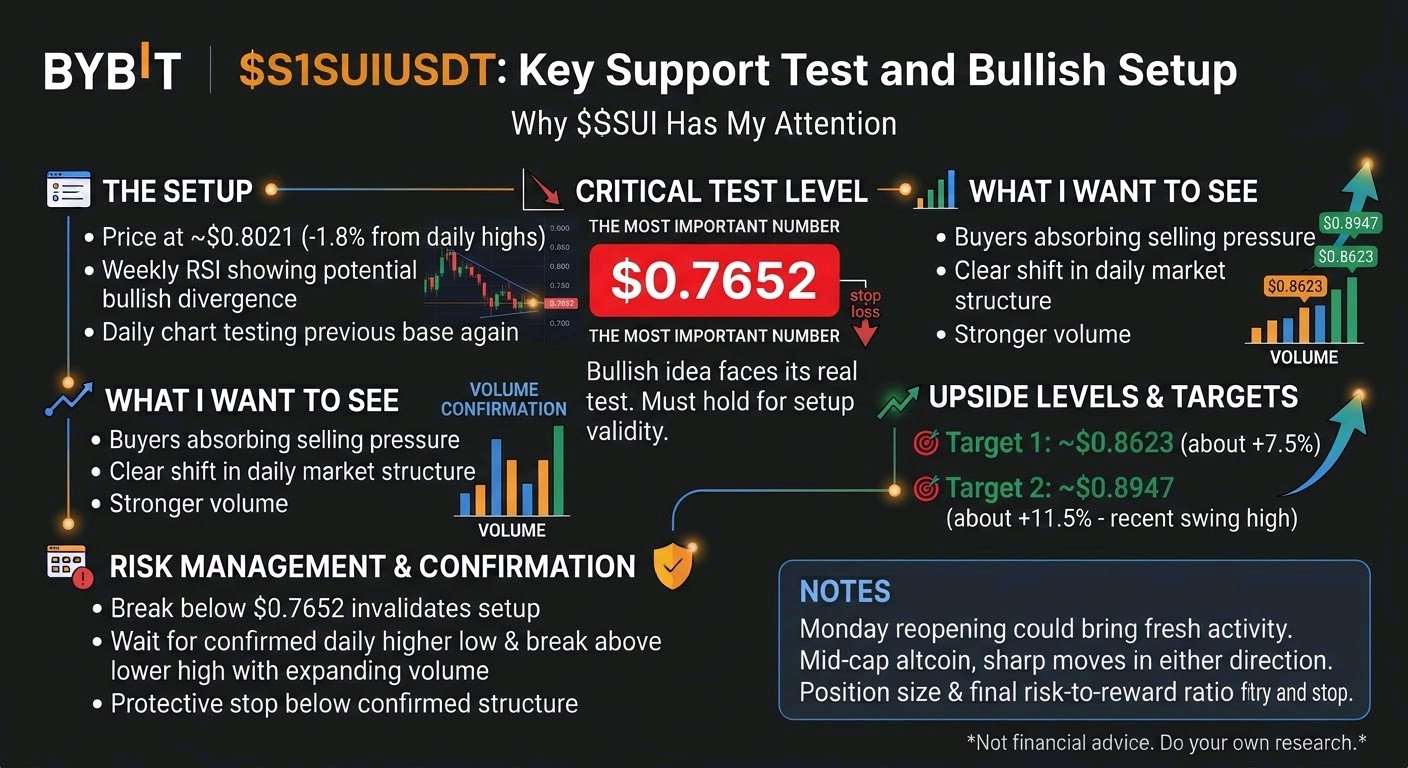
1本の赤いライン。2つの上値目標。これが私が$SUIUSDTに注目している理由です。 私のチャート上で最も重要な数字は$0.7652です。そこが私の強気シナリオにとっての真の試練となります。 セットアップ $SUIは本日約1.8%下落し、$0.8021前後で推移しており、以前の高値を大きく下回っています。 週足RSI分析からは、強気のダイバージェンスの可能性が示唆されています。 日足チャートではすでに最初の反応が見られ、現在そのベースラインを再度テストしている状況です。 私が見たいのは、売り圧力を買い手が吸収し、その後に日足の市場構造が明確に変化することです。 もし出来高を伴ってそれが実現すれば、以下の2つのスイングレベルに注目します。 🎯 目標1: ~$0.8623($0.8021から約+7.5%) 🎯 目標2: ~$0.8947($0.8021から約+11.5%) これらは野心的なシナリオであり、利益が保証されているわけではありません。 月曜日の伝統的な市場の再開が新たな動きをもたらす可能性がありますが、$SUIが意味のある回復を見せるには、独自の買い出来高が必要です。中型アルトコインであるため、どちらの方向にも急激な動きが発生し得ます。 管理:もし価格が$0.7652を下回り、その水準を回復できない場合、私の強気セットアップは無効となります。新規ポジションについては、日足での確実な切り上げ(Higher Low)の確認、直近の戻り高値(Lower High)の上抜け、そして出来高の増加を確認したいと考えています。損切りラインは、確定した構造の下に置くべきです。ポジションサイズと最終的なリスクリワード比は、事前の想定ではなく、実際のエントリーとストップ位置から計算する必要があります。私は$SUIの回復ポテンシャルに強く強気ですが、次に出来高を伴った動きが出るかどうかが、これが単なる有望なチャートで終わるのか、それとも実際にエントリーする価値のあるトレードになるのかを決定づけるでしょう。 投資助言ではありません。ご自身でリサーチを行い、リスク管理を行ってください。 #IMPACTbyTrade

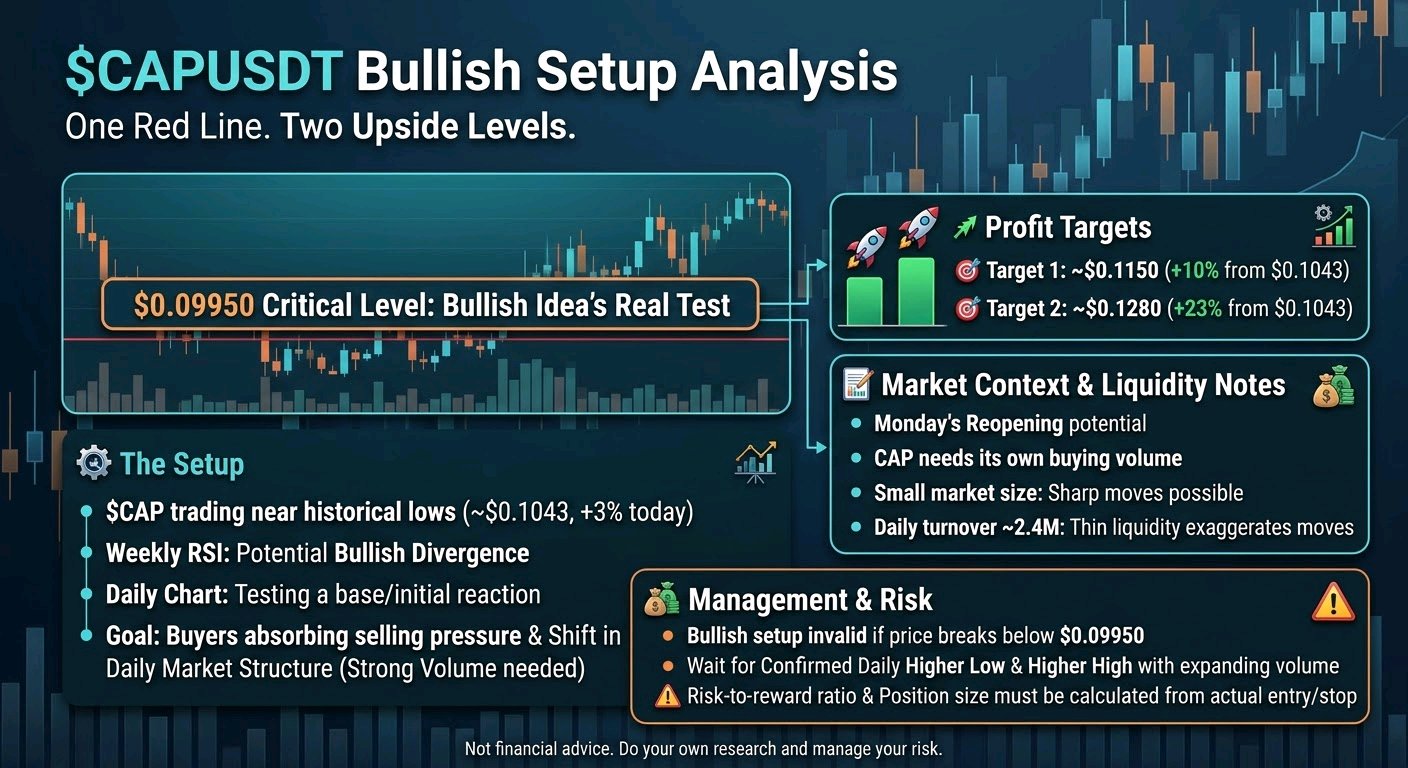
One red line. Two upside levels. This is why $CAPUSDT has my attention. The most important number on my chart is $0.09950. That's where my bullish idea faces its real test. The setup $CAP is trading near historical lows, up about 3% on the day at roughly $0.1043. Weekly RSI analysis suggests a possible bullish divergence. The daily chart has already shown an initial reaction, and price is now testing that base again. What I want to see is buyers absorbing the selling pressure, followed by a clear shift in daily market structure. If that happens with stronger volume, I'm watching two swing levels: 🎯 Target 1: ~$0.1150 (about +10% from $0.1043) 🎯 Target 2: ~$0.1280 (about +23% from $0.1043) These are ambitious scenarios, not guaranteed returns. Monday's reopening of traditional markets could bring fresh activity, but $CAP needs its own buying volume to support a meaningful recovery. Its relatively small market size also means sharp moves can happen in either direction. Daily turnover is only about 2.4M, so thin liquidity can exaggerate both pumps and dumps. Management: If price breaks below $0.09950 and cannot recover that level, my bullish setup is no longer valid. For a new position, I want a confirmed daily higher low, a break above the latest lower high, and expanding volume. The protective stop belongs below the confirmed structure. Position size and the final risk-to-reward ratio must be calculated from the actual entry and stop, not assumed in advance. I'm heavily bullish on $CAP's recovery potential, but the next volume-backed move will determine whether this remains a promising chart or becomes a trade worth taking. Not financial advice. Do your own research and manage your risk. #IMPACTbyTrade

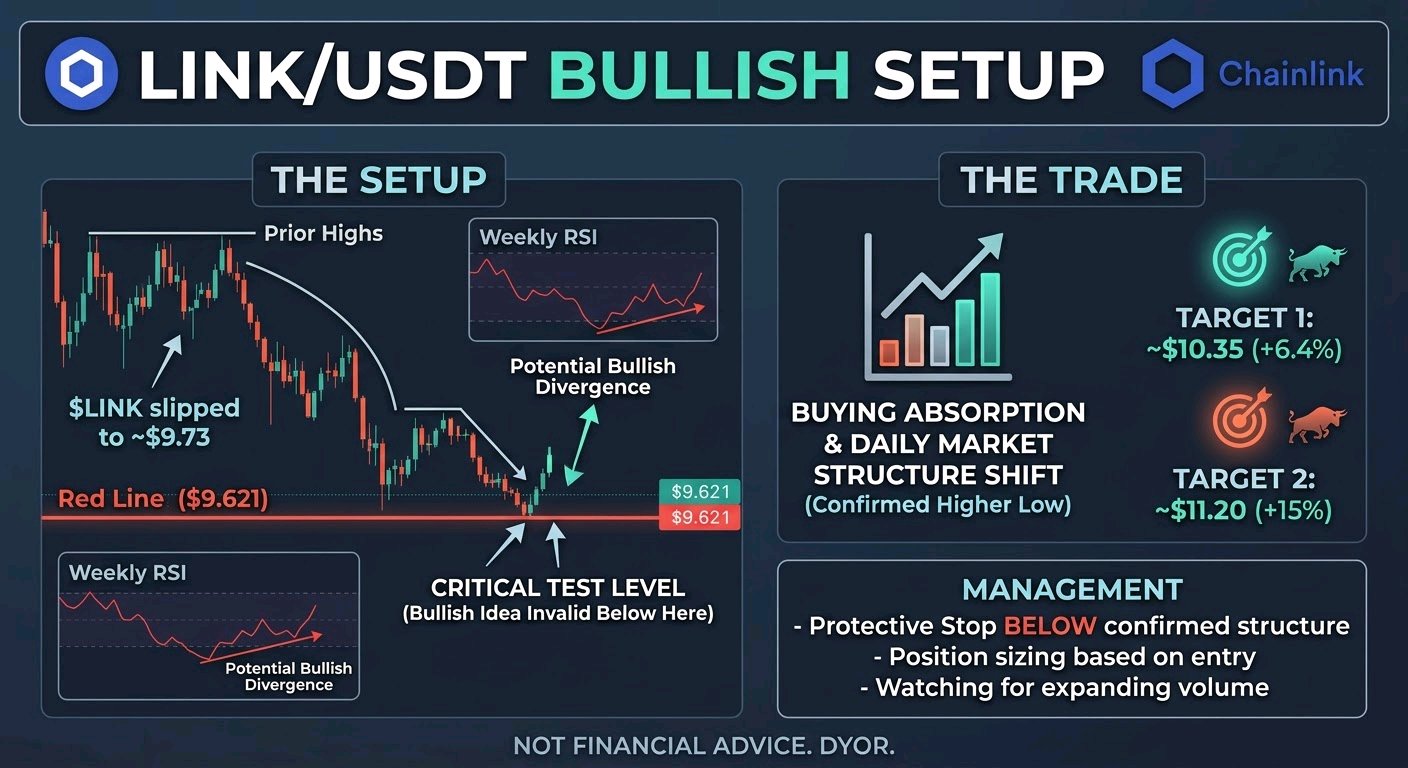
One red line. Two upside levels. This is why $LINKUSDT has my attention. The most important number on my chart is $9.621. That's where my bullish idea faces its real test. The setup $LINK has slipped about 3.6% on the day to roughly $9.73, and it is trading well below its prior highs. Weekly RSI analysis suggests a possible bullish divergence. The daily chart has already shown an initial reaction, and price is now testing that base again. What I want to see is buyers absorbing the selling pressure, followed by a clear shift in daily market structure. If that happens with stronger volume, I'm watching two swing levels: 🎯 Target 1: ~$10.35 (about +6.4% from $9.73) 🎯 Target 2: ~$11.20 (about +15% from $9.73) These are ambitious scenarios, not guaranteed returns. Monday's reopening of traditional markets could bring fresh activity, but $LINK needs its own buying volume to support a meaningful recovery. Its market size is also modest next to the majors, so sharp moves can happen in either direction. Management: If price breaks below $9.621 and cannot recover that level, my bullish setup is no longer valid. For a new position, I want a confirmed daily higher low, a break above the latest lower high, and expanding volume. The protective stop belongs below the confirmed structure. Position size and the final risk-to-reward ratio must be calculated from the actual entry and stop, not assumed in advance. I'm heavily bullish on $LINK's recovery potential, but the next volume-backed move will determine whether this remains a promising chart or becomes a trade worth taking. Not financial advice. Do your own research and manage your risk. #IMPACTbyTrade

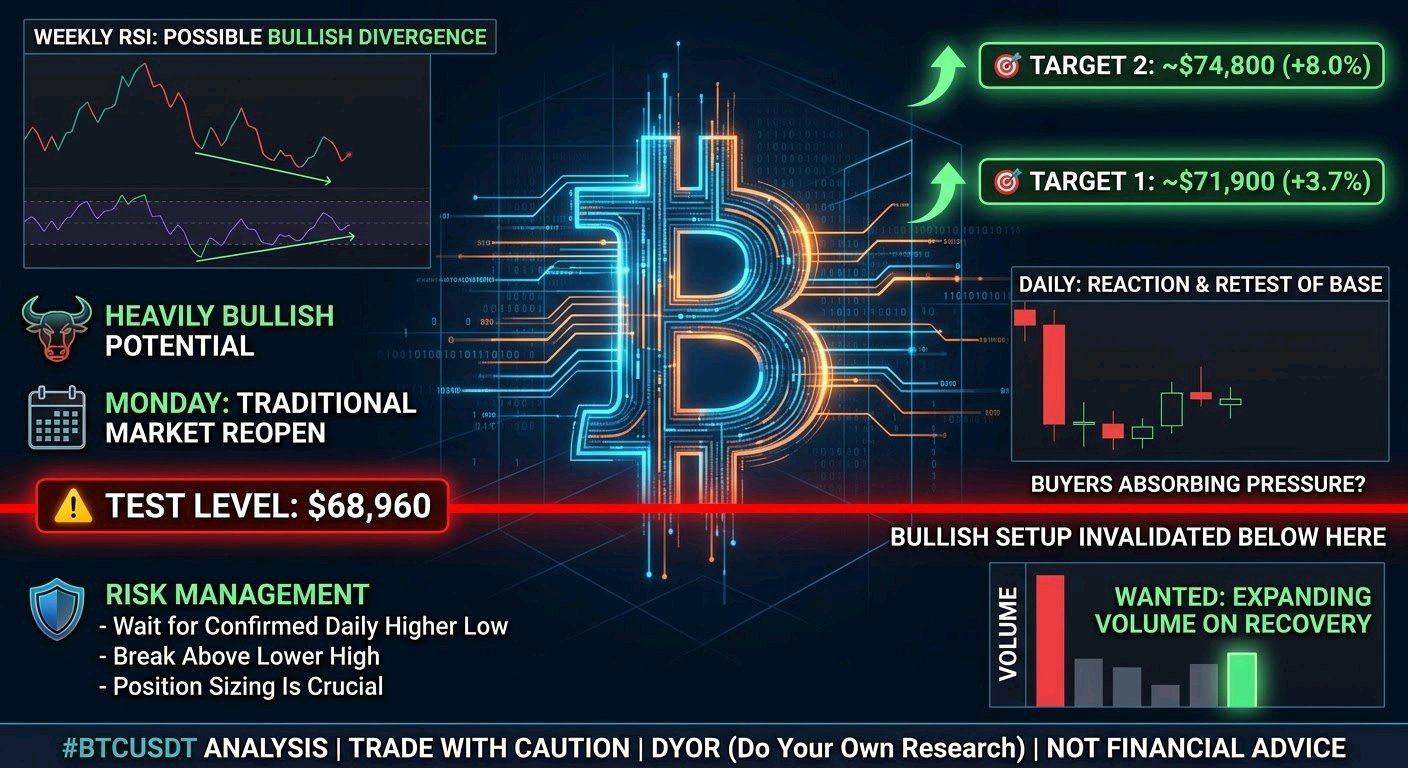
一本の赤いライン、2つのアップサイドレベル。これこそが、私が$BTCUSDTに注目している理由です。 私のチャートで最も重要な数字は68,960ドルです。ここが私の強気シナリオにとっての正念場となります。 セットアップ $BTCは大きく売られ、1日で約6%下落して69,300ドル前後となっており、以前の高値を大きく下回る水準で推移しています。 週足のRSI分析では、強気のダイバージェンスの可能性が示唆されています。 日足チャートではすでに最初の反応が見られ、現在価格はそのベースを再テストしている状態です。 私が期待しているのは、買い手が売り圧力を吸収し、それに続いて日足の市場構造が明確に転換することです。 もしそれがより強い出来高を伴って実現すれば、私は以下の2つのスイングレベルを注視します。 🎯 ターゲット1:約71,900ドル(69,300ドルから約+3.7%) 🎯 ターゲット2:約74,800ドル(69,300ドルから約+8%) これらは野心的なシナリオであり、リターンを保証するものではありません。 月曜の伝統的市場の再開で新たな動きが出るかもしれませんが、$BTCには本格的な回復を支えるための買い出来高が必要です。これだけの規模があっても、これほどレバレッジのかかった市場はどちらの方向にも急激に動き得ますし、直近のローソク足を見ればその速さがわかります。 管理:もし価格が68,960ドルを割り込み、そのレベルを回復できなければ、私の強気セットアップは無効となります。新規ポジションについては、日足での確実な高値切り上げ(Higher Low)、直近の戻り高値(Lower High)の上抜け、そして出来高の増加を確認したいところです。プロテクティブ・ストップ(損切り)は確定した構造の下に置くべきです。ポジションサイズと最終的なリスク・リワード比は、事前の想定ではなく、実際のエントリーとストップ価格に基づいて計算しなければなりません。私は$BTCの回復ポテンシャルに対して非常に強気ですが、これが単なる期待できるチャートで終わるのか、それとも実際にトレードする価値があるものになるのかは、次に来る出来高を伴った動き次第です。 投資助言ではありません。ご自身でリサーチを行い、リスク管理を行ってください。 #IMPACTbyTrade

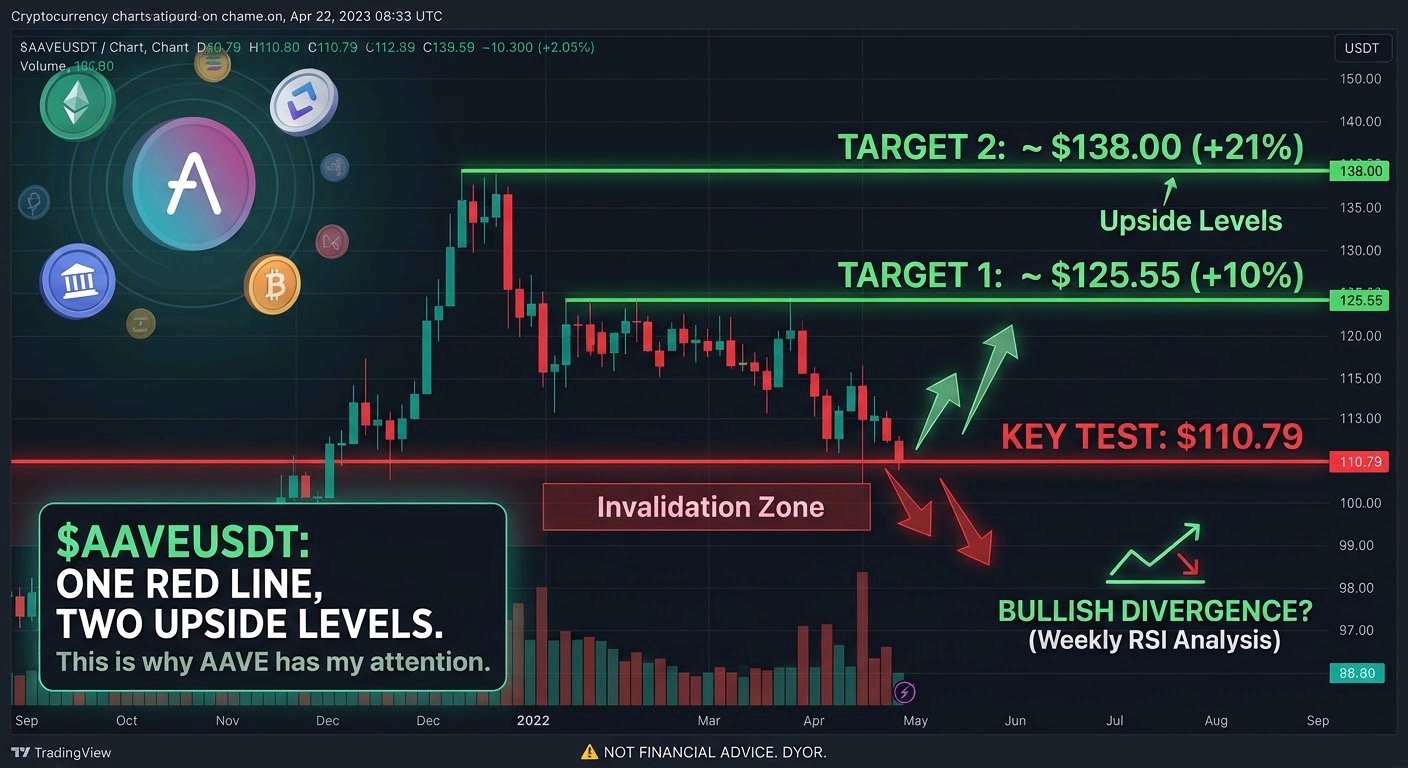
One red line. Two upside levels. This is why $AAVEUSDT has my attention. The most important number on my chart is $110.79. That's where my bullish idea faces its real test. 📉 The setup $AAVE is trading near its recent lows after a sharp ~8% daily drop. Weekly RSI analysis suggests a possible bullish divergence. The daily chart has already shown an initial reaction, and price is now testing that base again. 👀 What I want to see Buyers absorbing the selling pressure, followed by a clear shift in daily market structure. 🎯 If that happens with stronger volume, I'm watching two swing targets: ~$125.55 (previous swing high): roughly +10% from $114.03 ~$138.00 (next resistance zone): roughly +21% from $114.03 These are ambitious scenarios, not guaranteed returns. 🌍 Monday's reopening of traditional markets could bring fresh activity, but $AAVE needs its own buying volume to support a meaningful recovery. Its relatively modest market size also means sharp moves can happen in either direction. Management: If price breaks below $110.79 and cannot recover that level, my bullish setup is no longer valid. For a new position, I want a confirmed daily higher low, a break above the latest lower high, and expanding volume. The protective stop belongs below the confirmed structure. Position size and the final risk-to-reward ratio must be calculated from the actual entry and stop, not assumed in advance. I'm heavily bullish on $AAVE's recovery potential, but the next volume-backed move will determine whether this remains a promising chart or becomes a trade worth taking. Not financial advice. Do your own research and manage your risk. #IMPACTbyTrade