MdSalmanAhmedShanto
2752いいね0シェア57ファン1フォロー
空军头子|仅作观点分享不构成任何投资建议|关注我的人都暴富了
空军头子|仅作观点分享不构成任何投资建议|关注我的人都暴富了
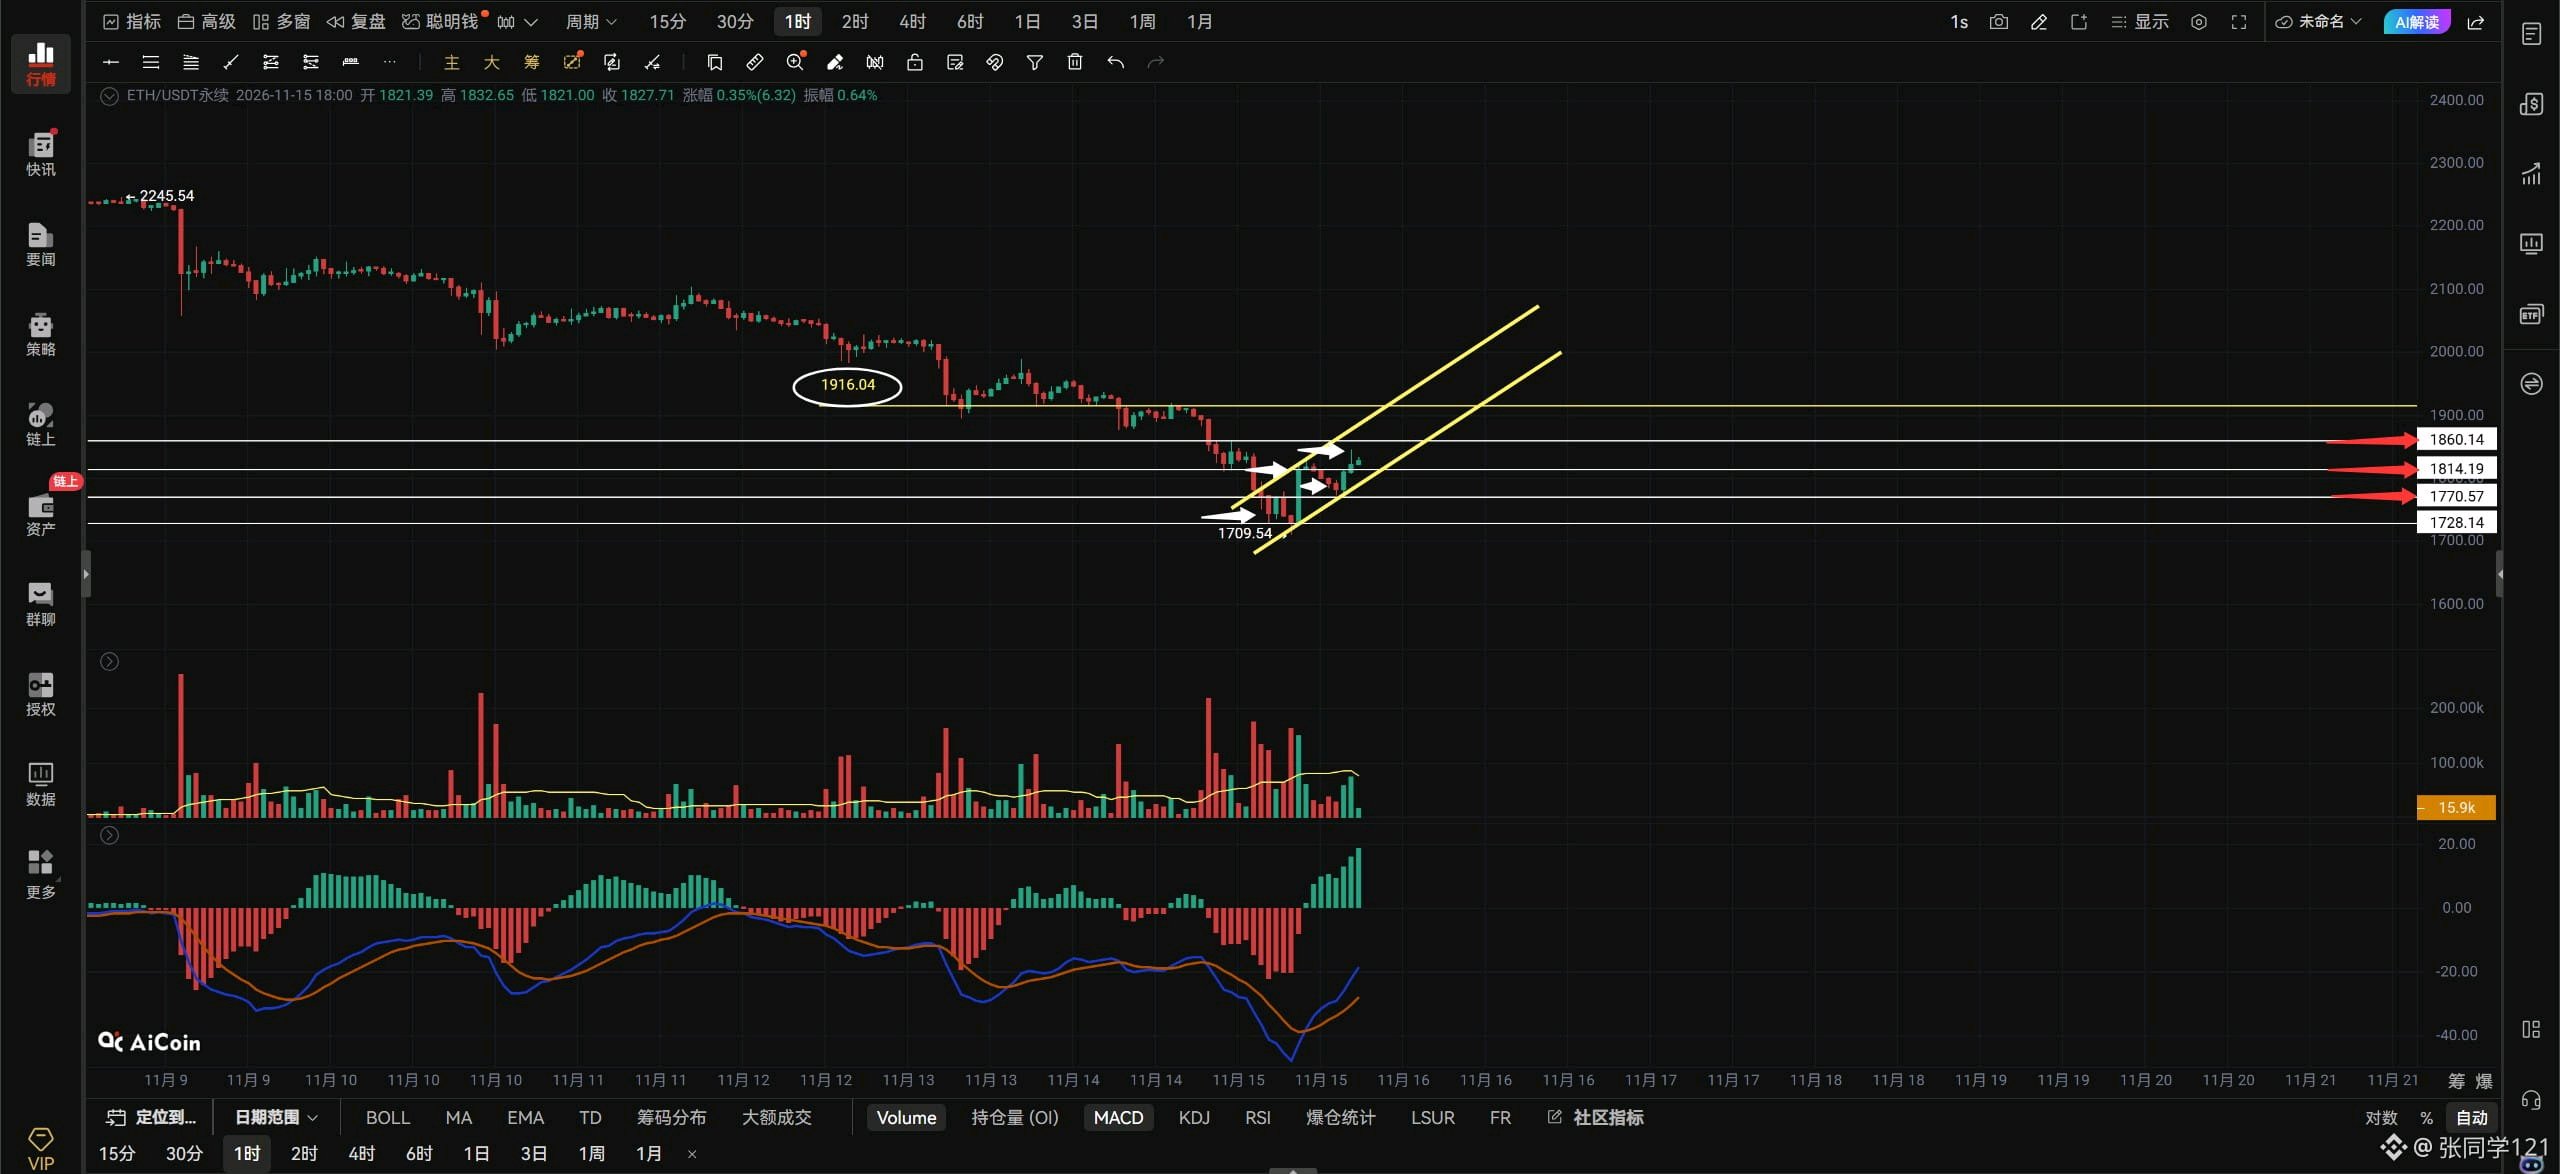
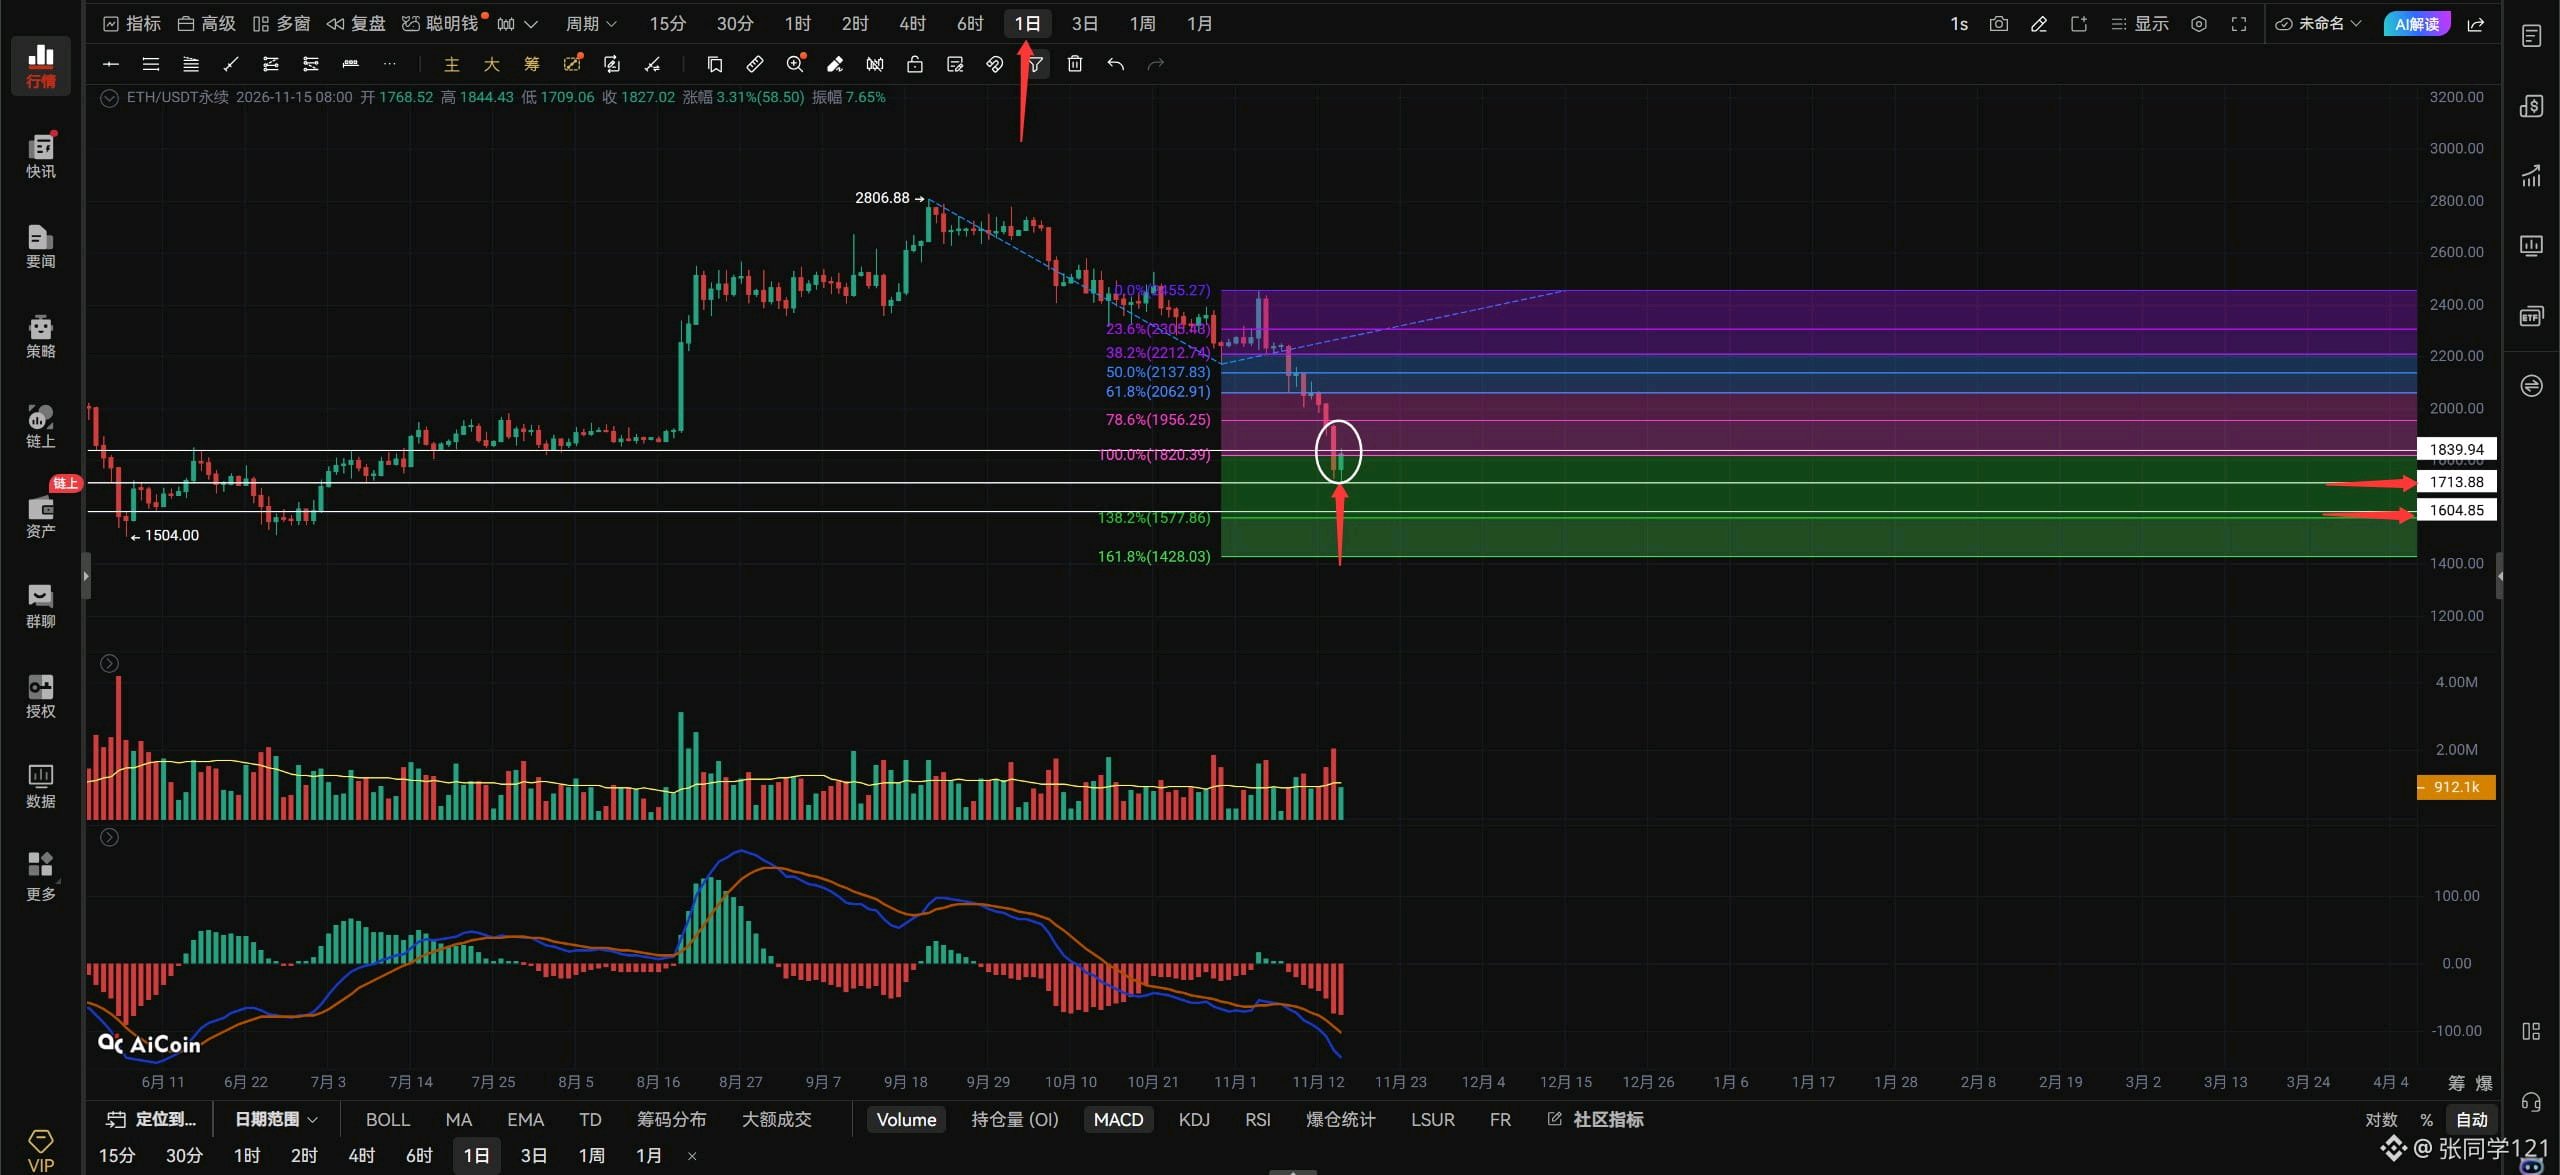
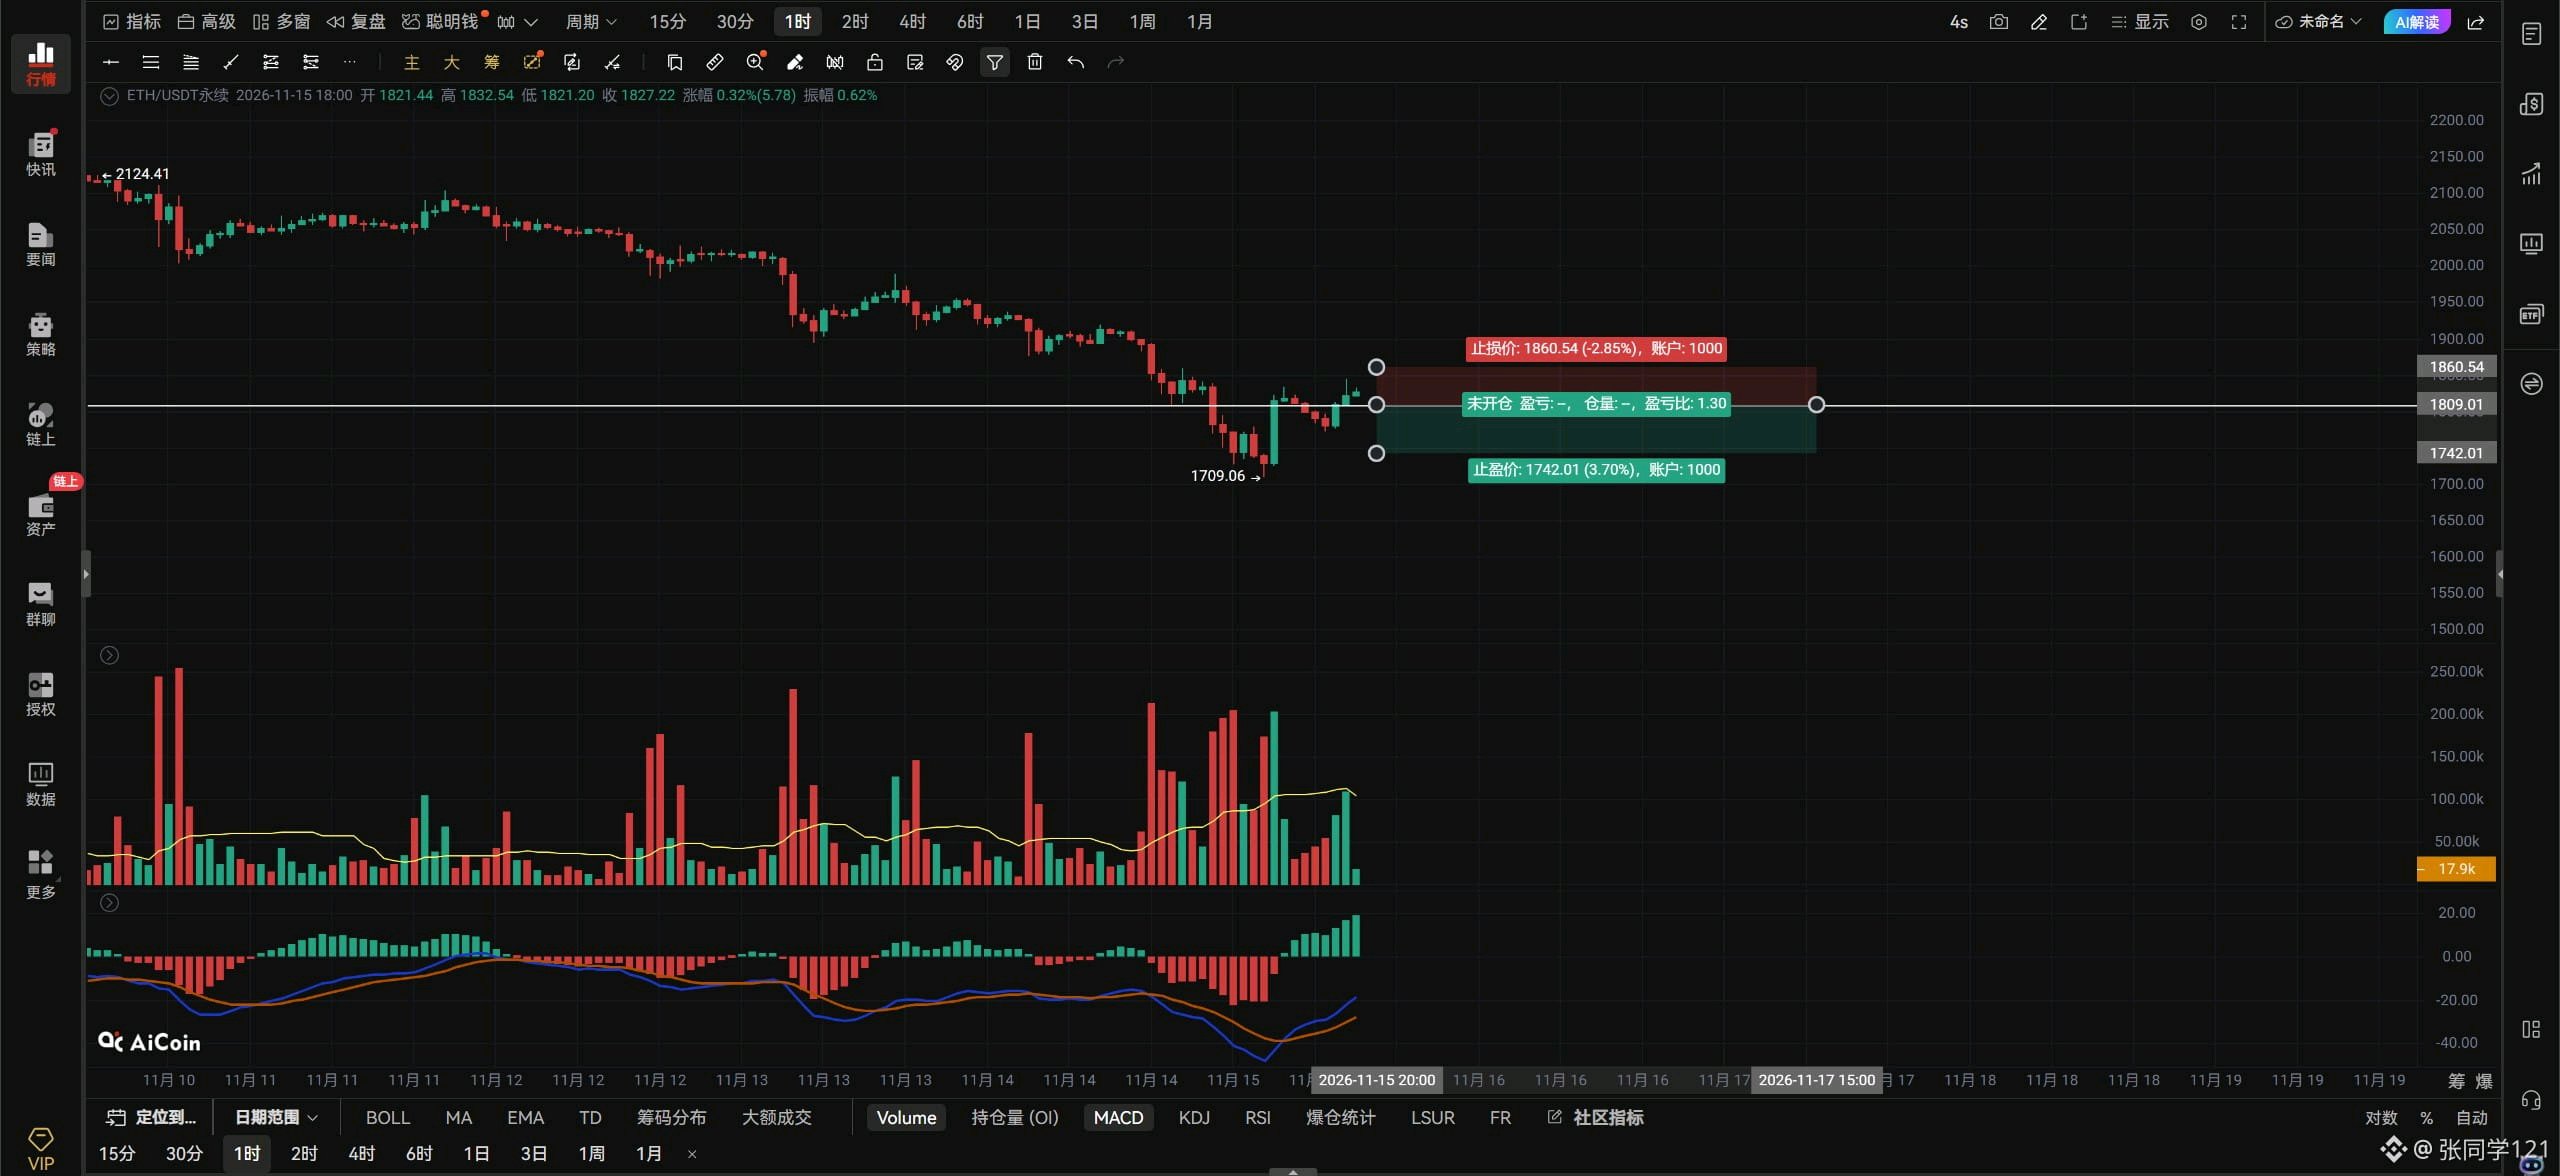
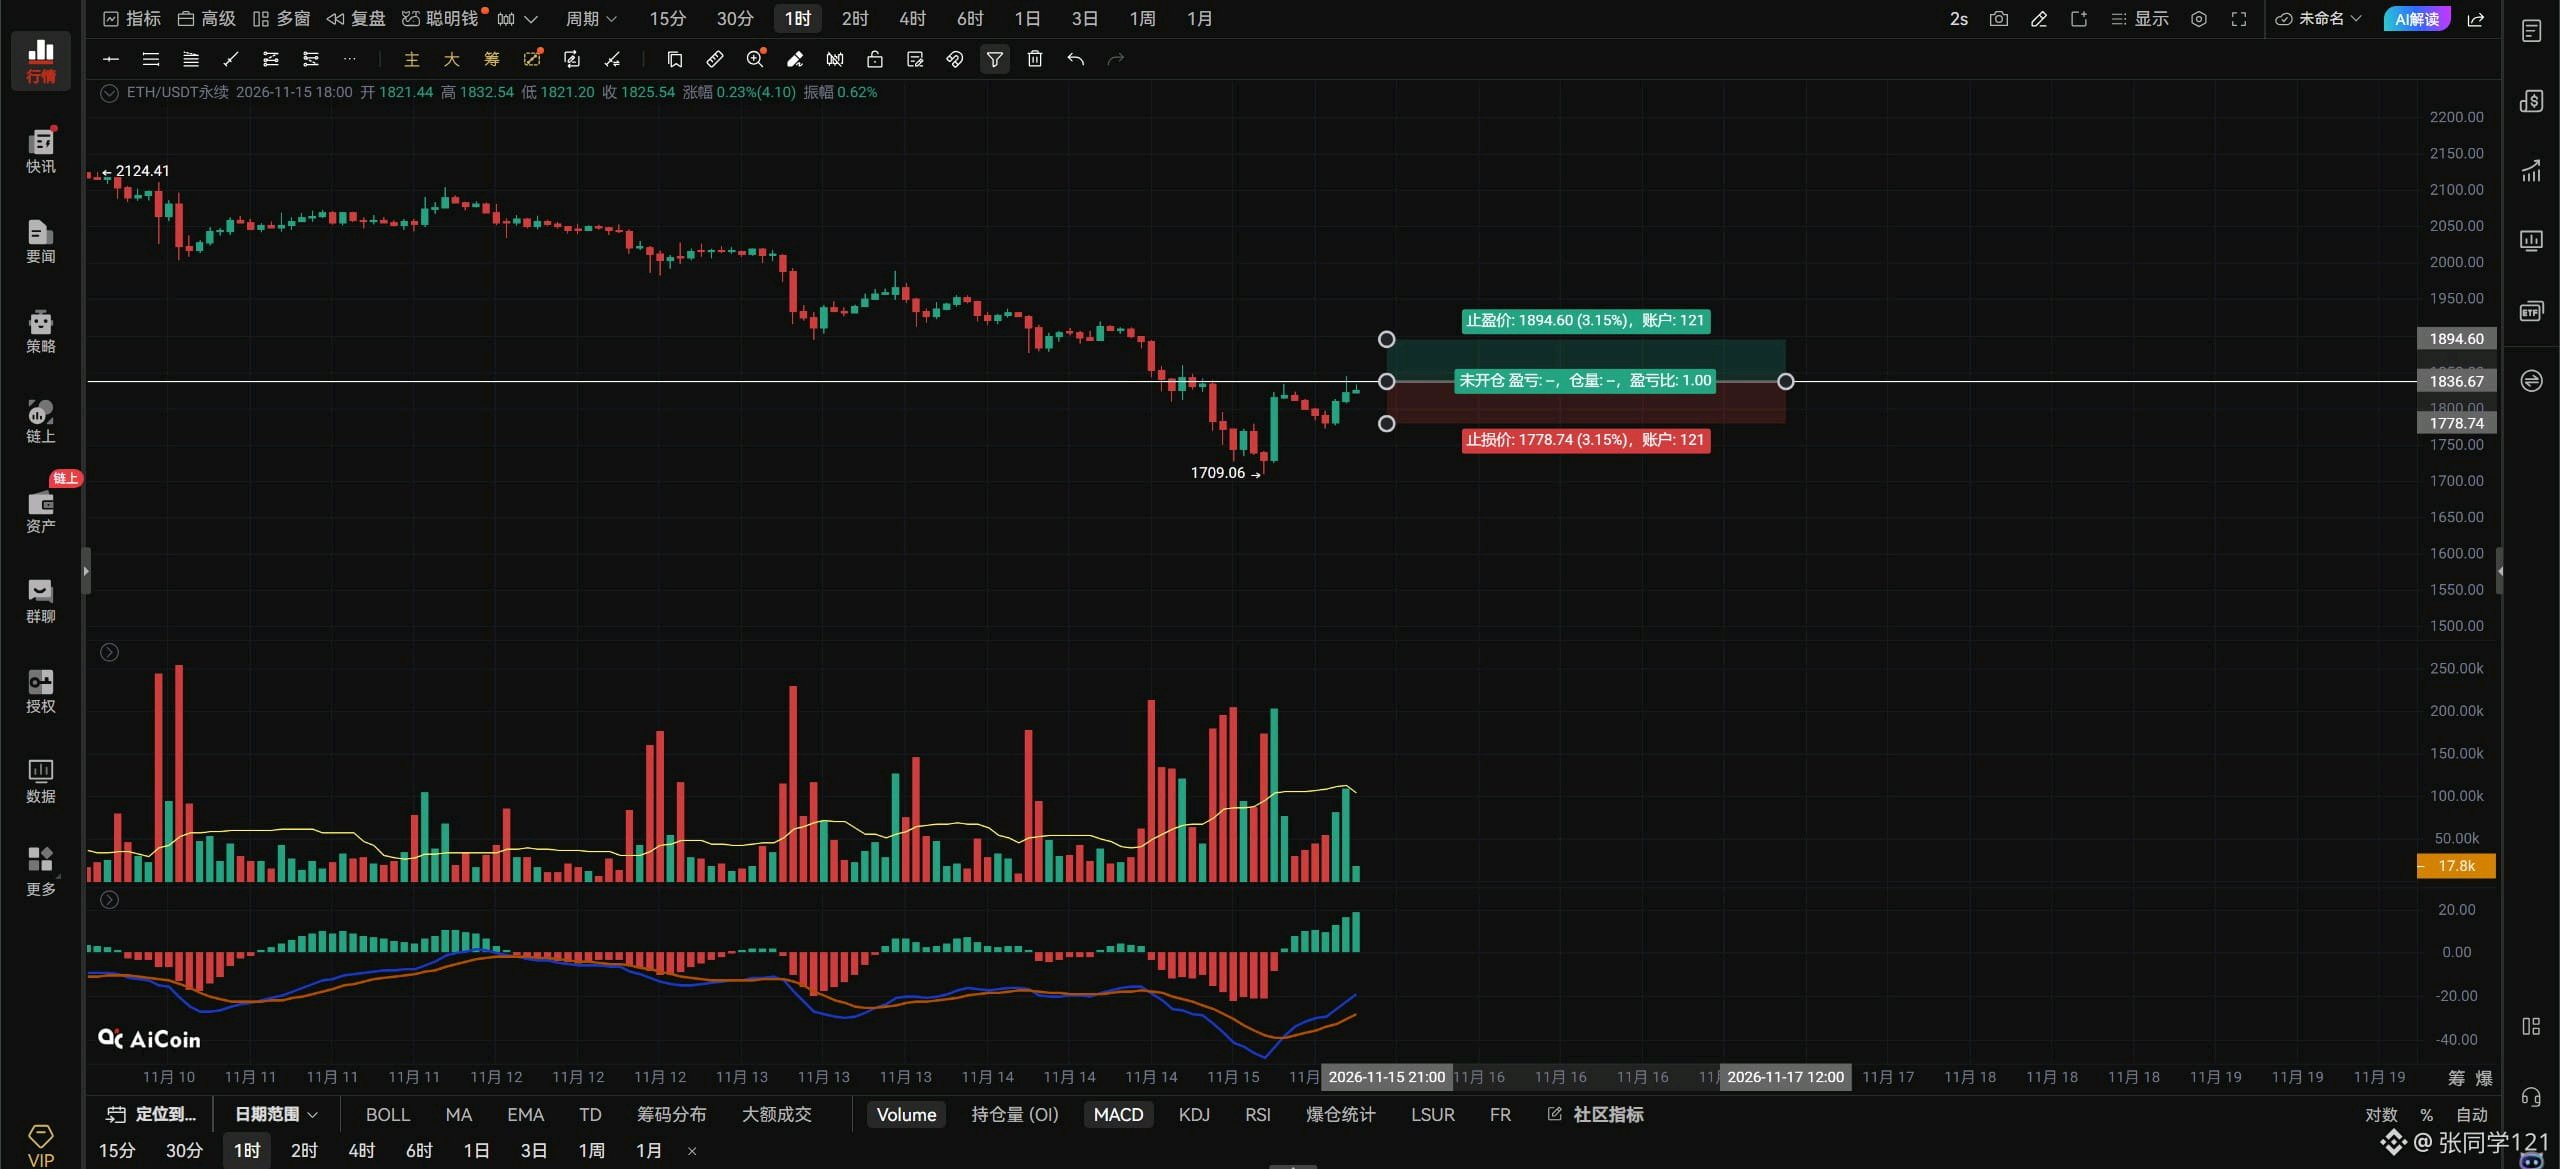
$ETHUSDT 夕方の見通し:11/15。 ETHは現在、上昇チャネル内で推移しており、白矢印が示すように高値と安値を切り上げています。ETHは1時間足レベルでの反発を開始した可能性があります。もし1814のレジスタンスを維持できれば、反発を継続して1860のレジスタンスを試す展開になるでしょう。1916を目指すには、1860を突破する必要があります。ETHの調整が1770を割り込まない限り、この反発は力強いものになるはずです。もし1770を下回れば、必然的に前回の安値を再テストすることになります。極端な再テストになったとしても、前回の安値を割り込まない限り問題はありません。ですので、今ETHでロングを狙うなら、1770~1728のサポートゾーンまで押し目を待って、反転のシグナルを確認してからエントリーするのが最も安全です。このゾーンでロングのシグナルが出ない場合はトレードを見送りましょう。価格が下落し続ける可能性があることを意味します。 ETHが1836を出来高を伴って上にブレイクした場合、積極的なトレーダーはロングを追随しても良いでしょう。逆に1809を出来高を伴って下にブレイクした場合は、ショートを追いかけましょう。出来高の変化に注意し、損切りを設定してください。 ETHが1時間足で1836を維持できれば、1861~1916を目指す展開になります。 4時間足で1809を割り込めば、1770~1728を目指す展開になります。 幸いなことに、ETHは日足チャートで1713付近でサポートを確認できました。もし1713付近でサポートを固められなかった場合、次の日足レベルの下値ターゲットは1600になっていたでしょう。今回の下落の背景に弱気なニュースはありませんでした。なぜこれほど下落したのか?それは週末だったからです!週末は少ない資金で相場を押し下げることが可能です。ETHの日足チャートにおいて重要なのは、明日の日足終値が1820を維持できるかどうかです。1820を超えて引ければ、ETHの日足レベルでの下降トレンドは終了する可能性があります。また、明日の日足終値が1820を超えれば、白枠で囲ったエリアが「強気の切り込み線(ピアスング・パターン)」を形成し、日足レベルでの反発をさらに後押しすることになります。今回は以上です。#ByXIMPACT
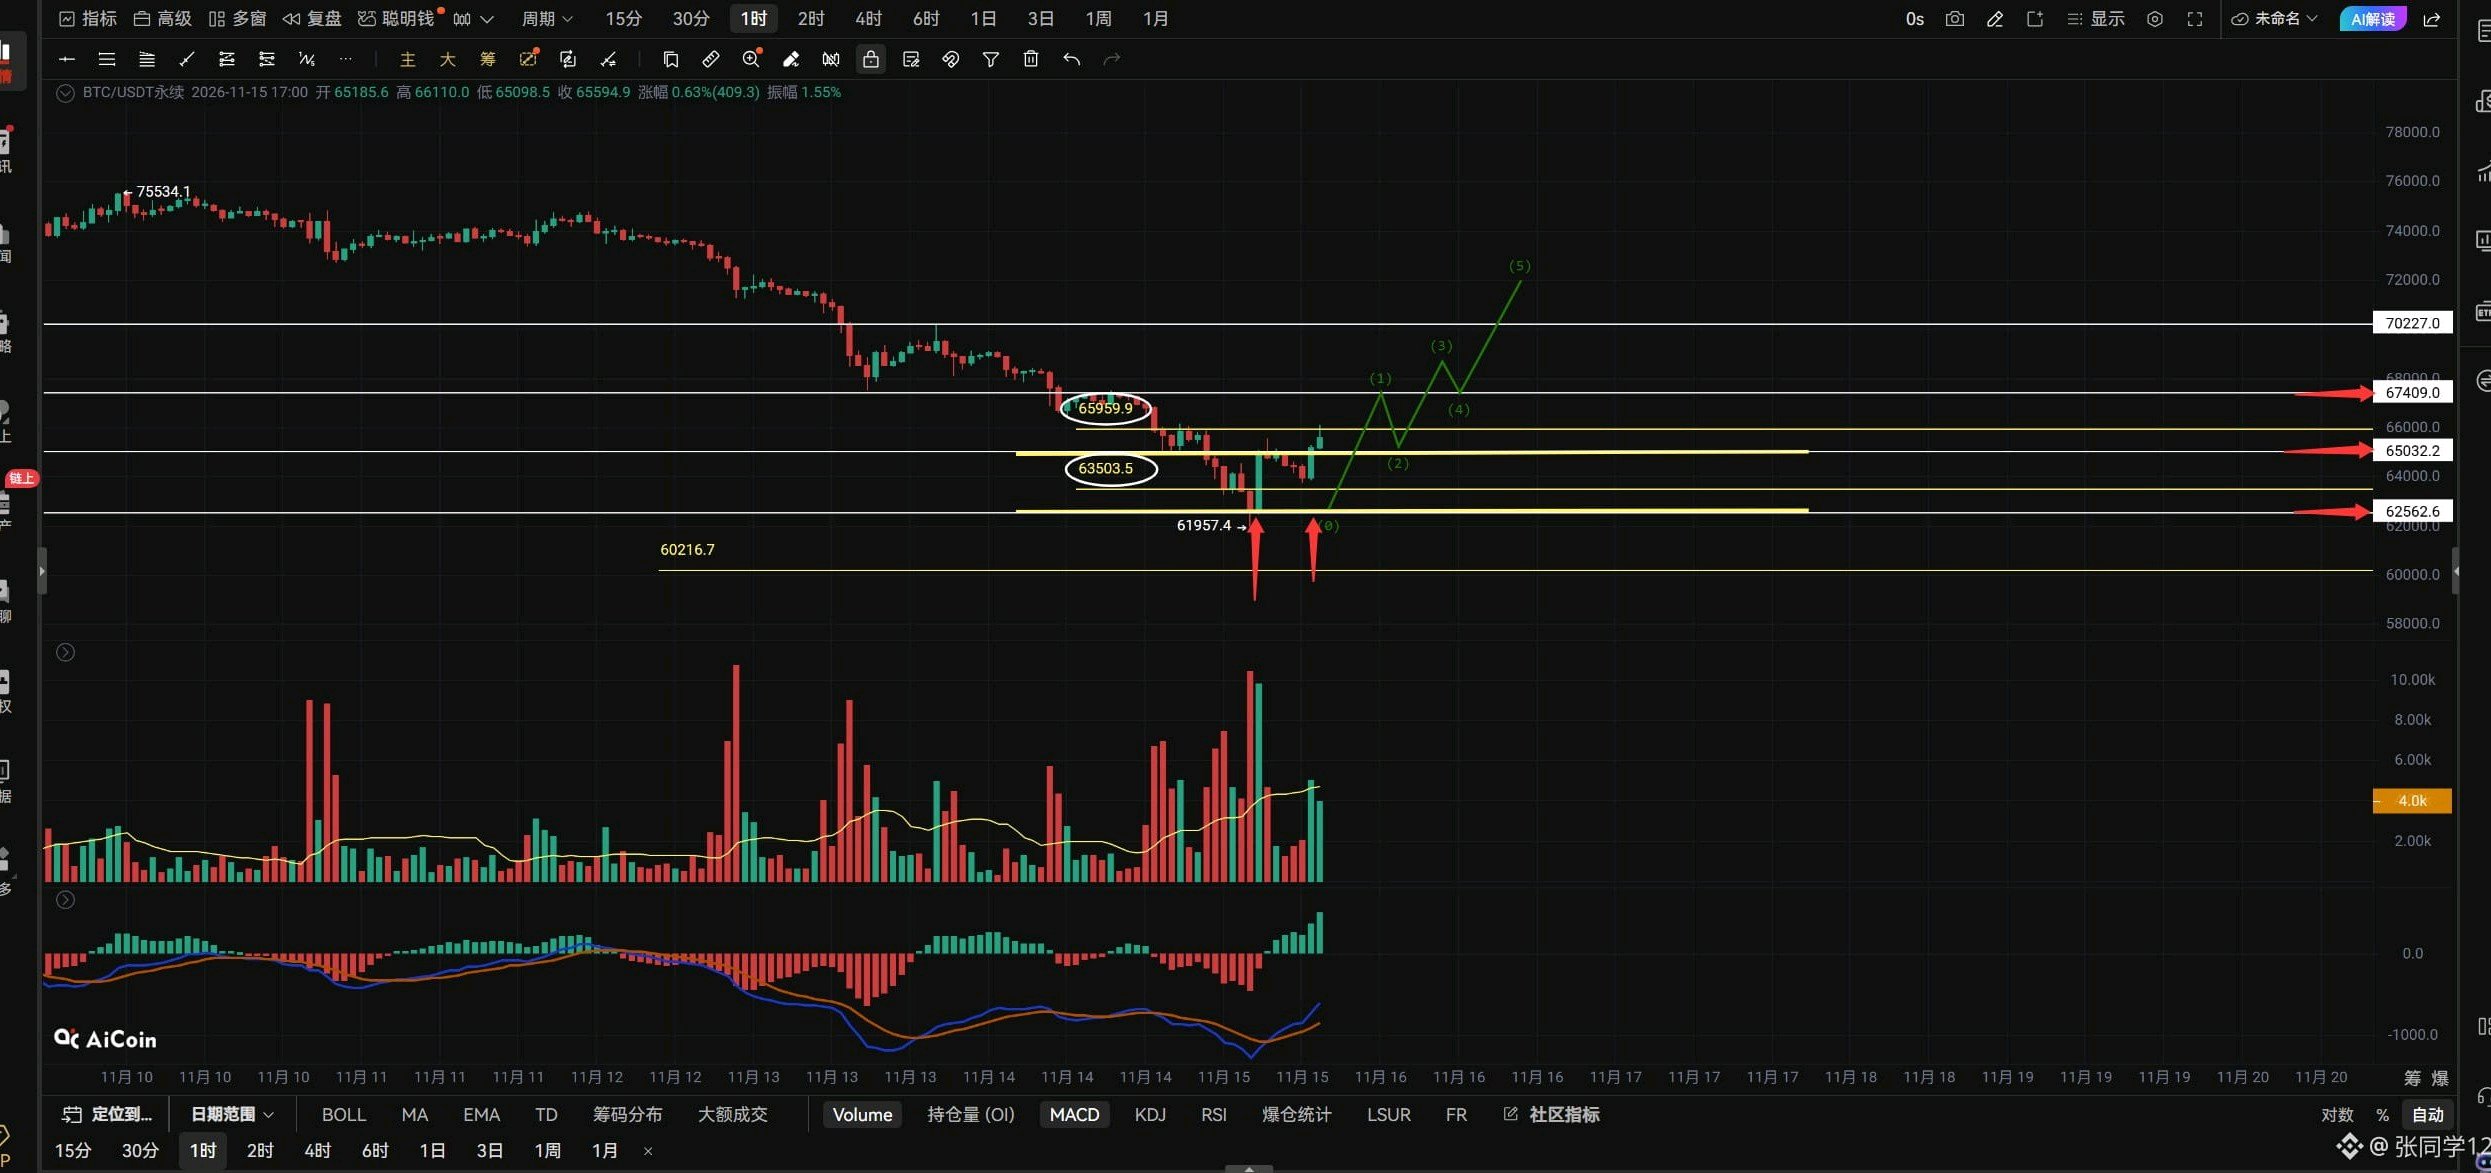
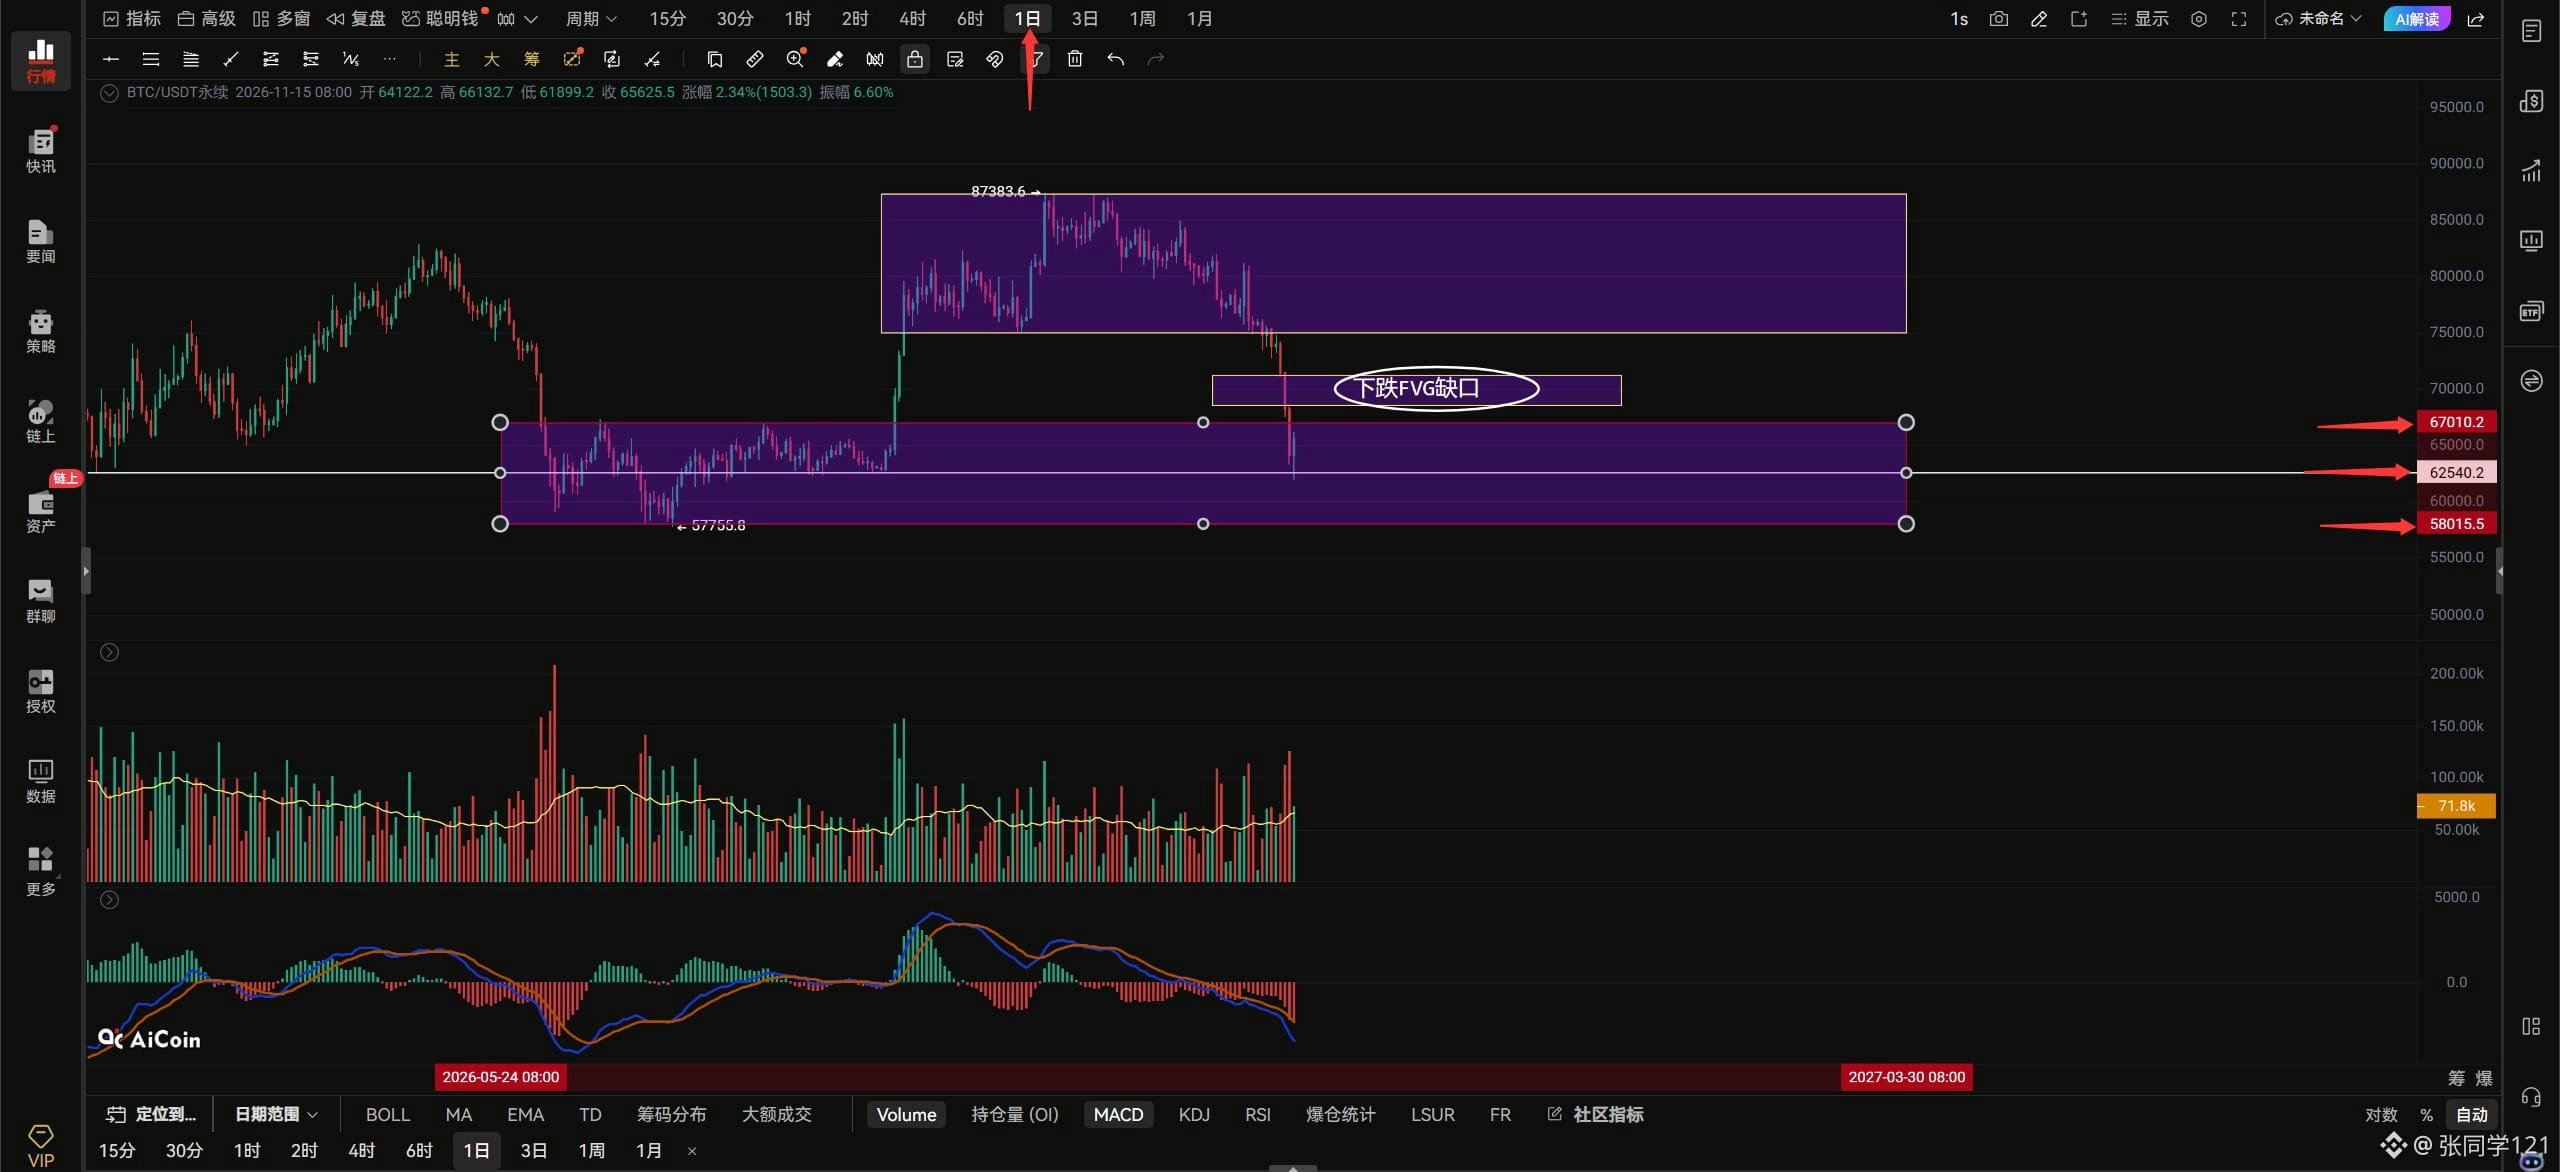
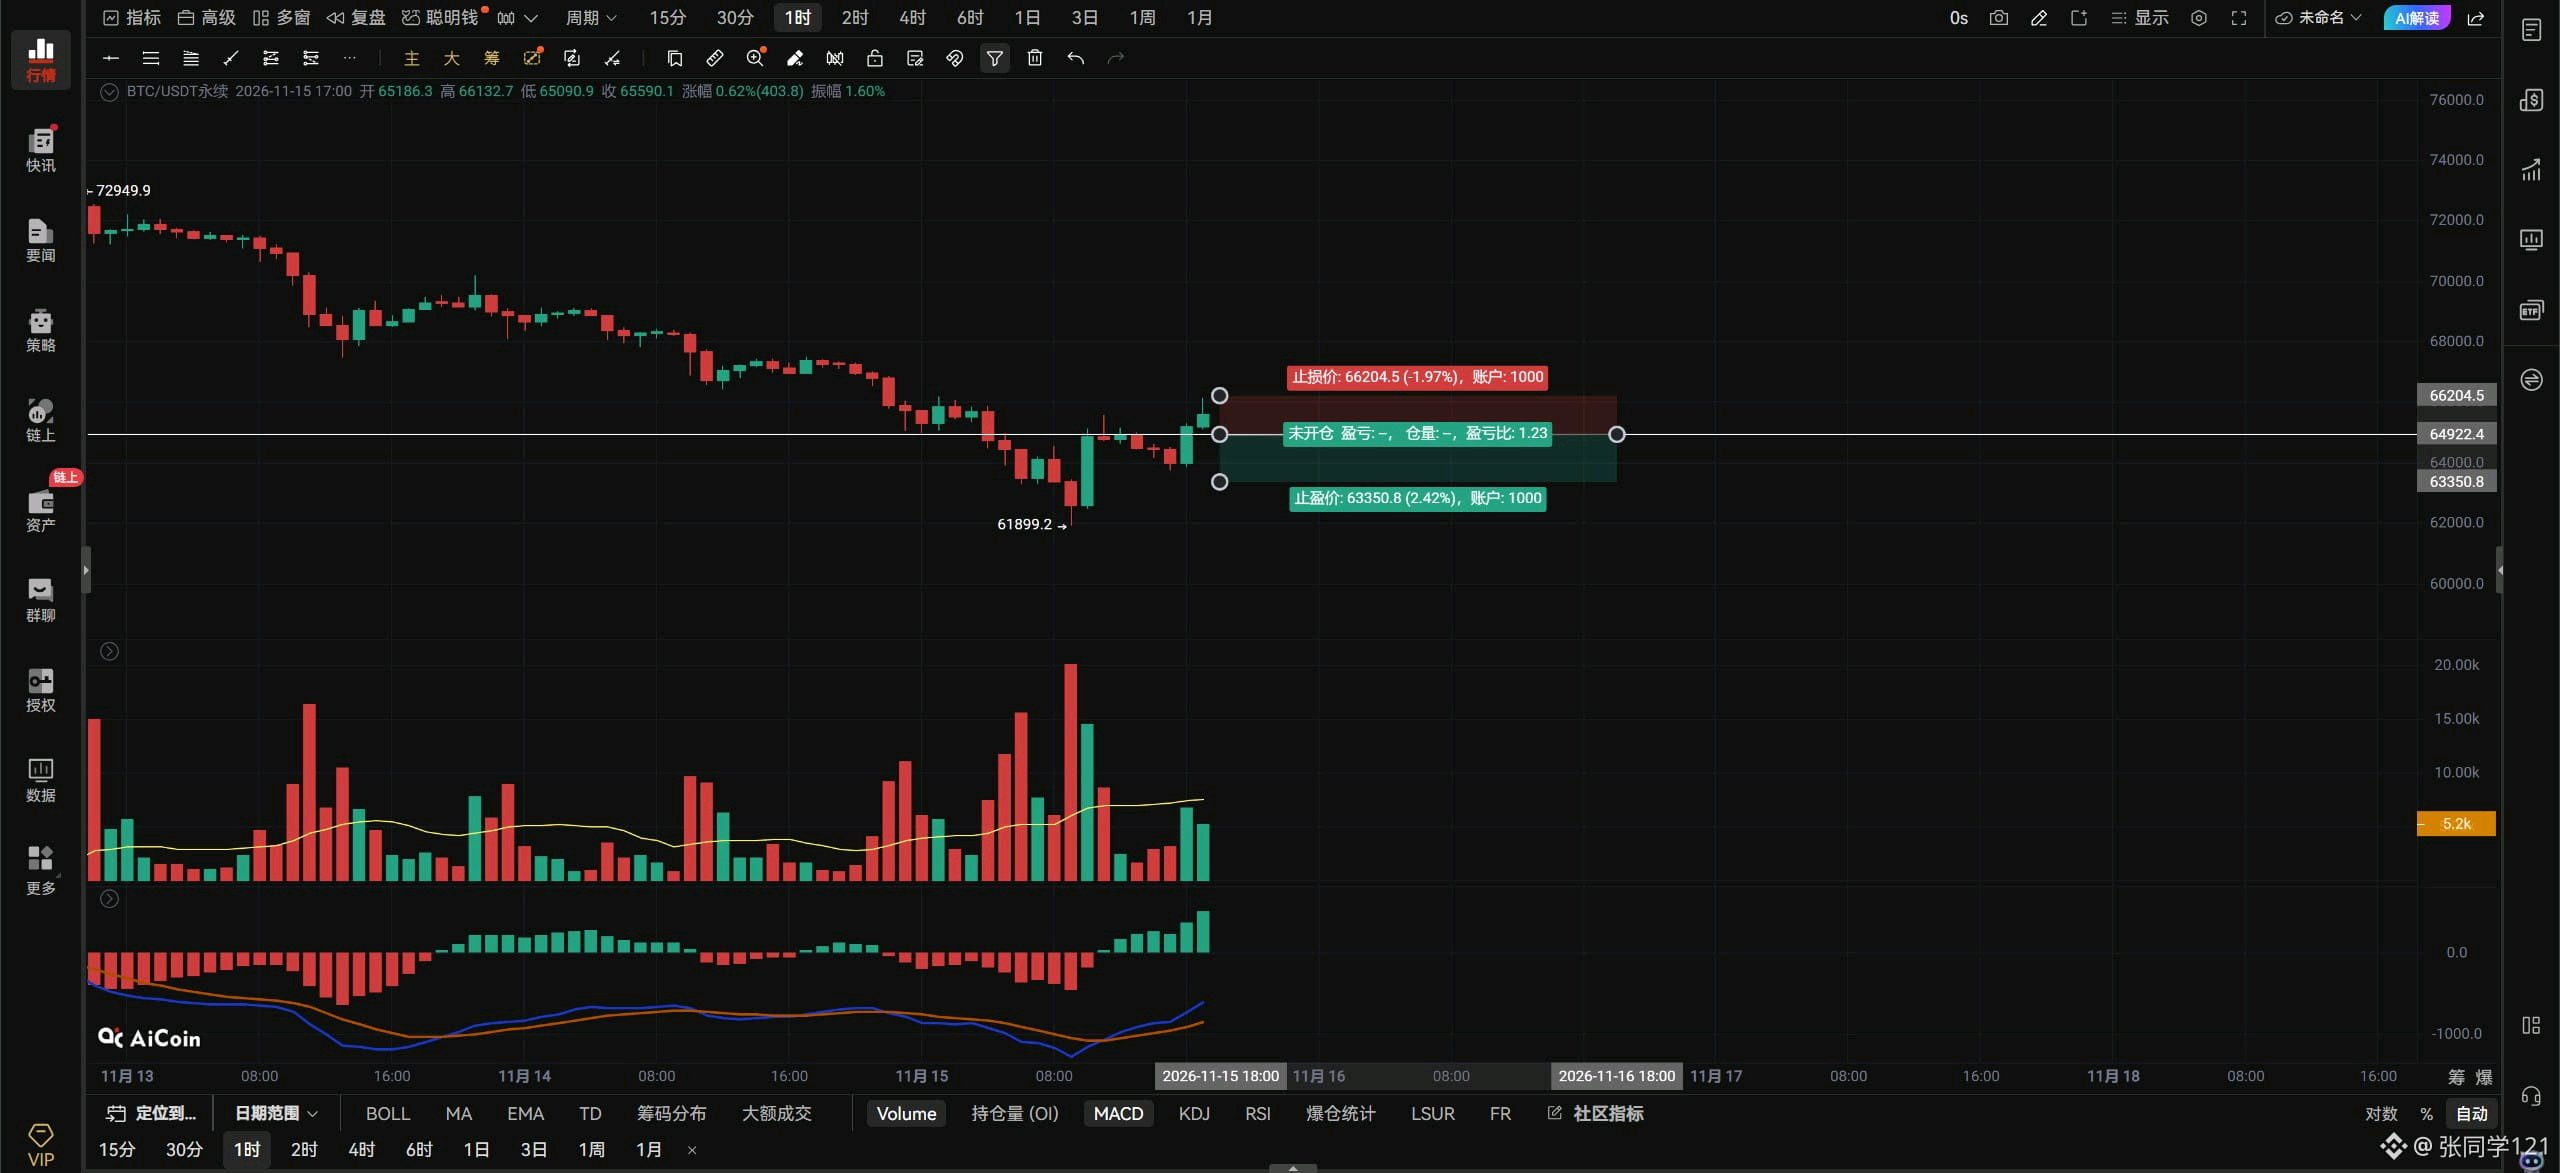
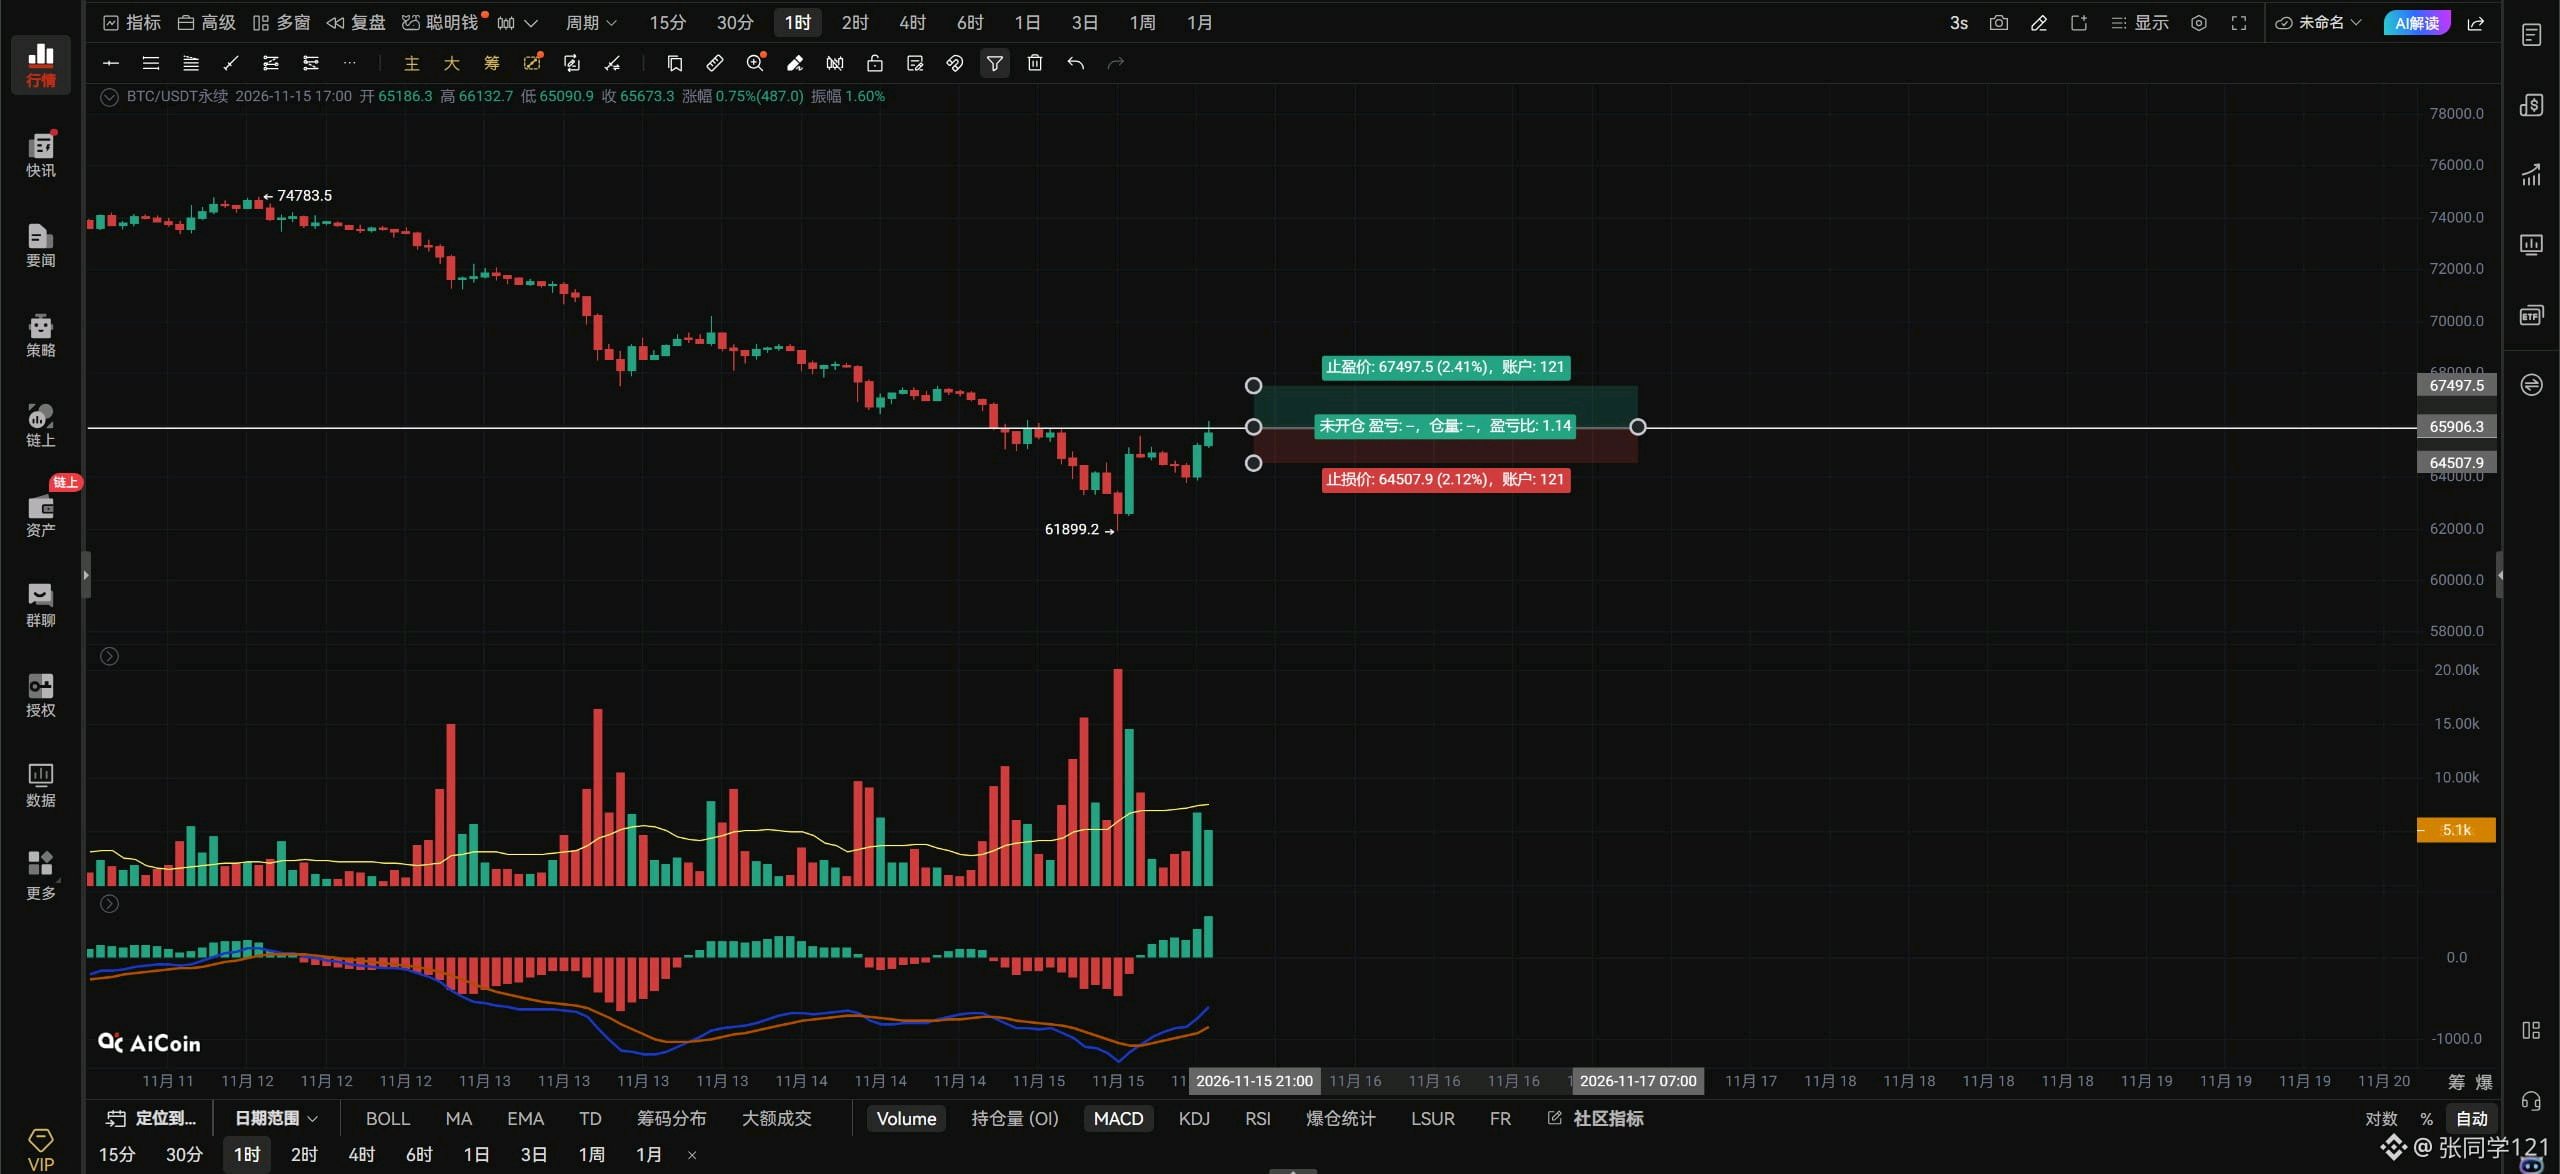
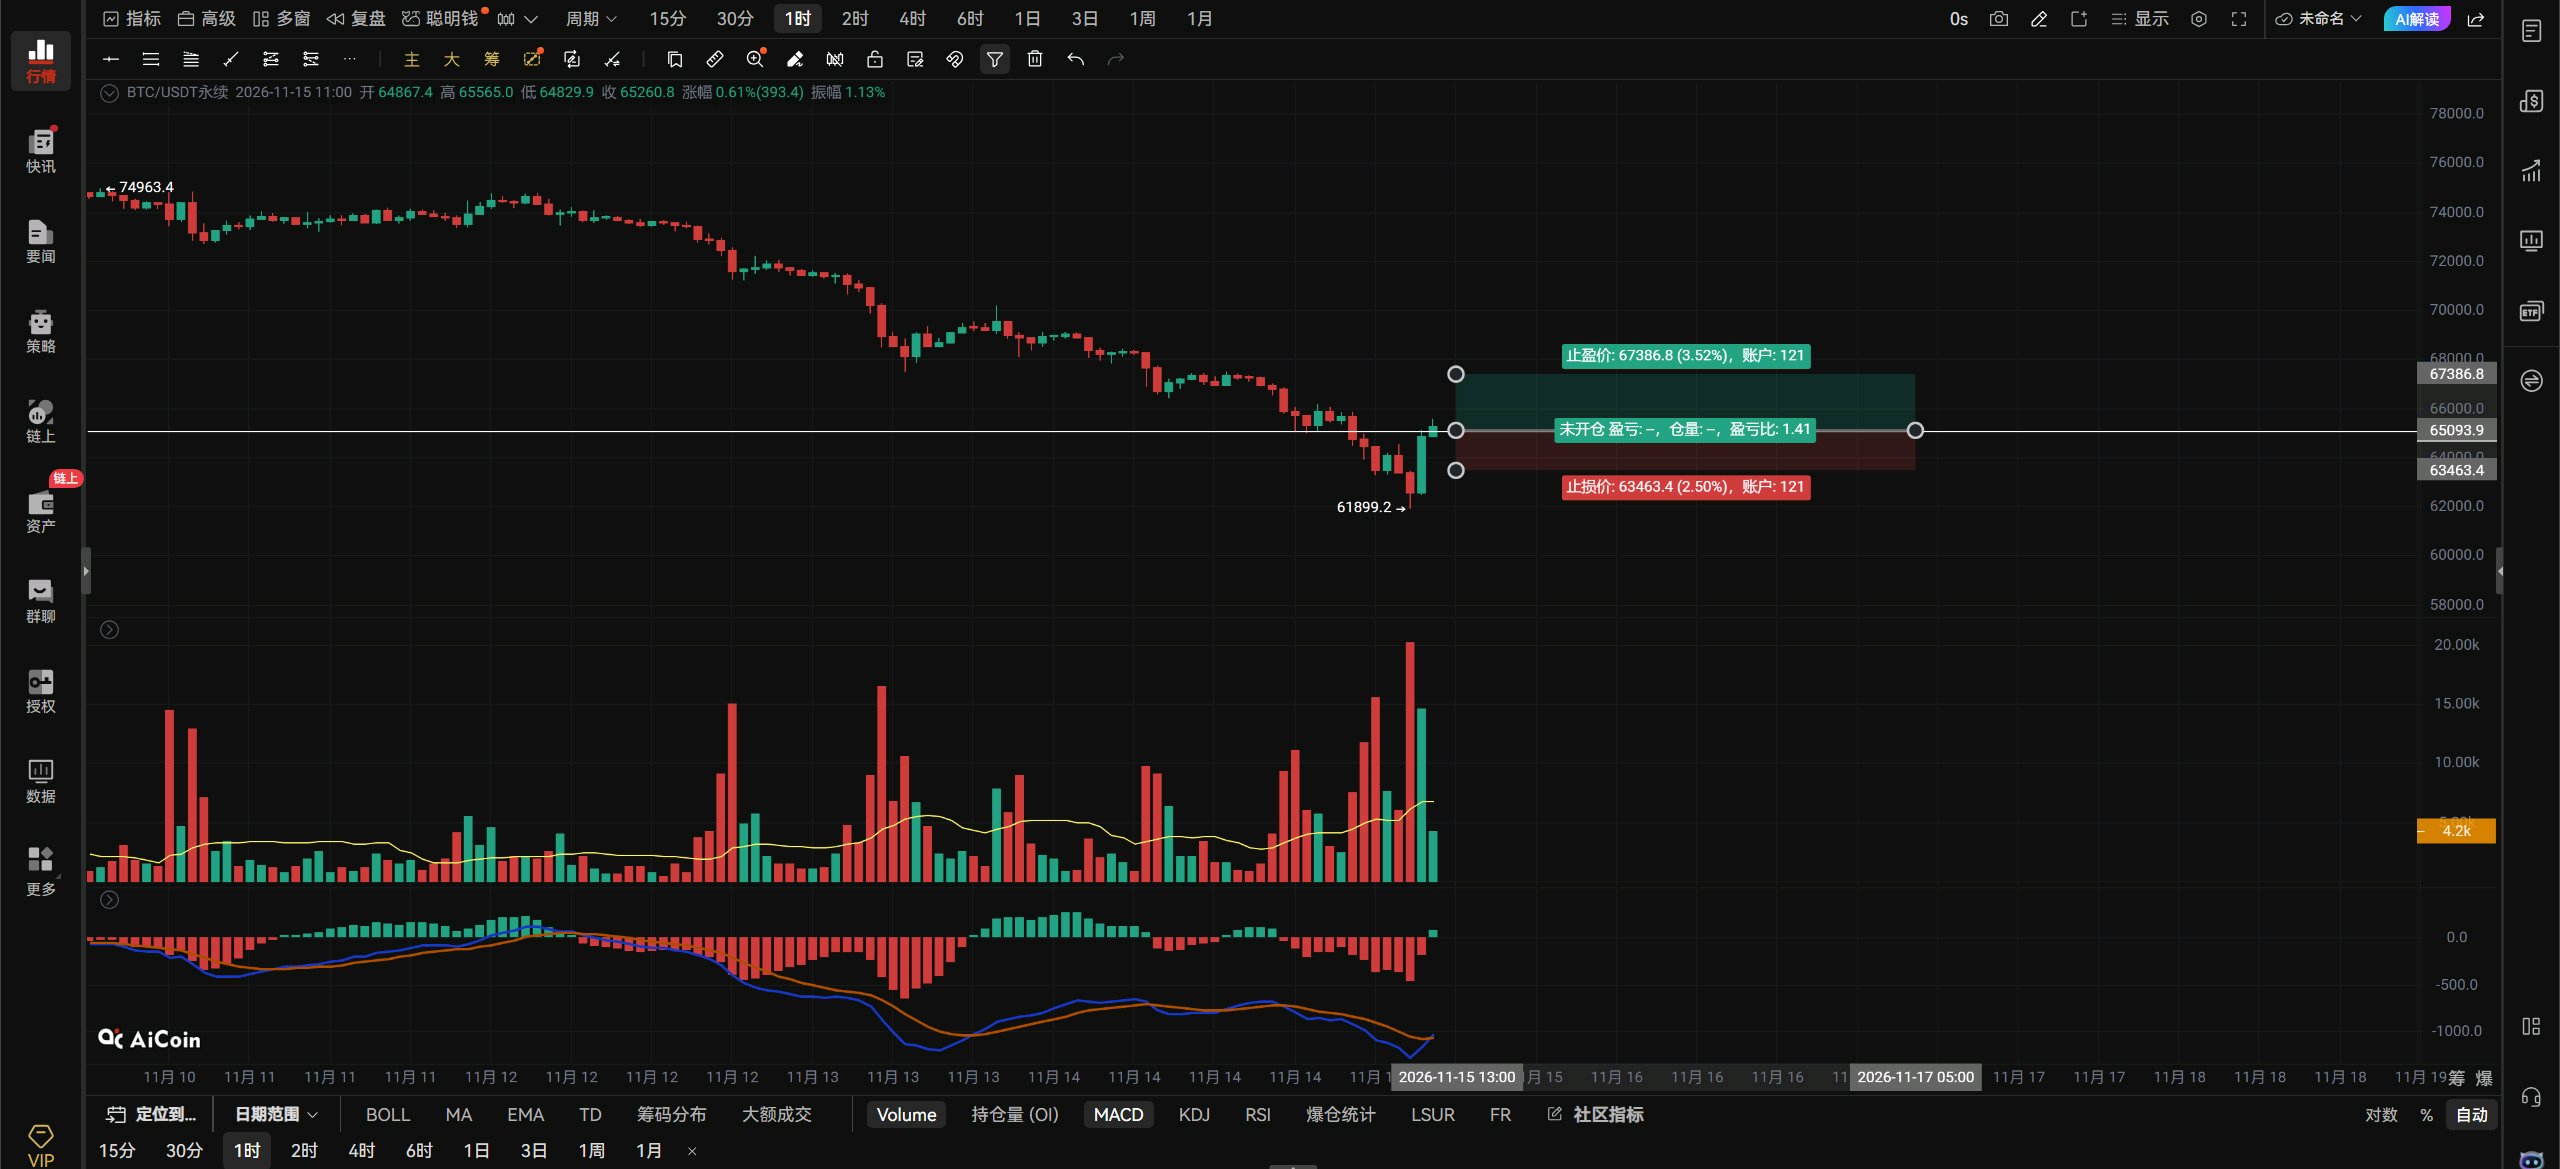
$BTCUSDT Evening Outlook: Nov. 15. Bitcoin has started to rebound and broken through the 65000 resistance, but it has now run into a new resistance at 66000. Bitcoin needs to hold above 65000 on the hourly timeframe to stop falling. To extend the rebound, it must break through 66000; then it could continue upward toward 67400. Next, we’ll see whether Bitcoin can stay above 65000. If it can’t hold above 65000, it will definitely retest the 63500–62500 area. The red arrow below points to the only test of support at 62000 so far. For a genuine uptrend to form, a second retest is inevitable. Only if that second retest forms a double bottom without breaking below the previous low can a healthy upward trend take shape. Bitcoin has fallen so much—do you think it can suddenly shoot straight to the moon? If that’s what you’re thinking, go to sleep! Anything can happen in your dreams. So if you don’t have a long position yet, don’t rush. Bitcoin has now broken through the 65000 resistance, and the 65000–62500 consolidation range has made a higher high and shown a structural break. Just patiently wait for Bitcoin to retest 63500–62500 and show a bottoming signal, then go long. Also, the US stock market is closed for the weekend, and we don’t know what will happen when it opens tomorrow. It could be another deceptive false breakout. If you rush in and go long, then it pulls back, you’ll be stuck in a losing position again. If Bitcoin breaks above 65906 with volume, aggressive traders can go long on the right-hand side. If it breaks below 64922 with volume and the rebound fails to reclaim that level, go short on the right-hand side. Use a stop-loss. On the hourly timeframe, if Bitcoin breaks above and holds 65906, the next targets are 67400–68562. If it can’t get above 65906, those targets are irrelevant. On the 4-hour timeframe, a break below 64922 would put 63500–62500 in view. Bitcoin briefly broke below 62,500 on the daily chart, but has now climbed back above it. Whether it can hold above 62,500 on the daily chart remains to be seen, since the daily close won't be confirmed until 8 a.m. tomorrow. It needs to close above 62,500 then for the daily downtrend to stabilize. For the daily chart to turn upward, it needs to break above 67,000—the upper boundary of the range. Only after breaking above 67,000 can we say the daily downtrend has temporarily ended, opening the door to filling the daily bearish FVG gap in the 68,600–71,100 range. If tomorrow's daily candle doesn't close above 62,500, there's a real chance price will retest 58,000, the lower boundary of the range. On the daily chart, 60,000 and 58,000 are the strongest support levels. If price reaches 60,000, it wouldn't hurt to go another 2,000 lower and test 58,000. Until Bitcoin breaks above 67,000 on the daily chart, the downside risk hasn't gone away. Don't let the current rebound fool you: price fell 25,000 points from 87,000 to 62,000, so a 10,000-point bounce is perfectly reasonable. Who'd stick around if it only ever went down? That's all for now. #ByXIMPACT
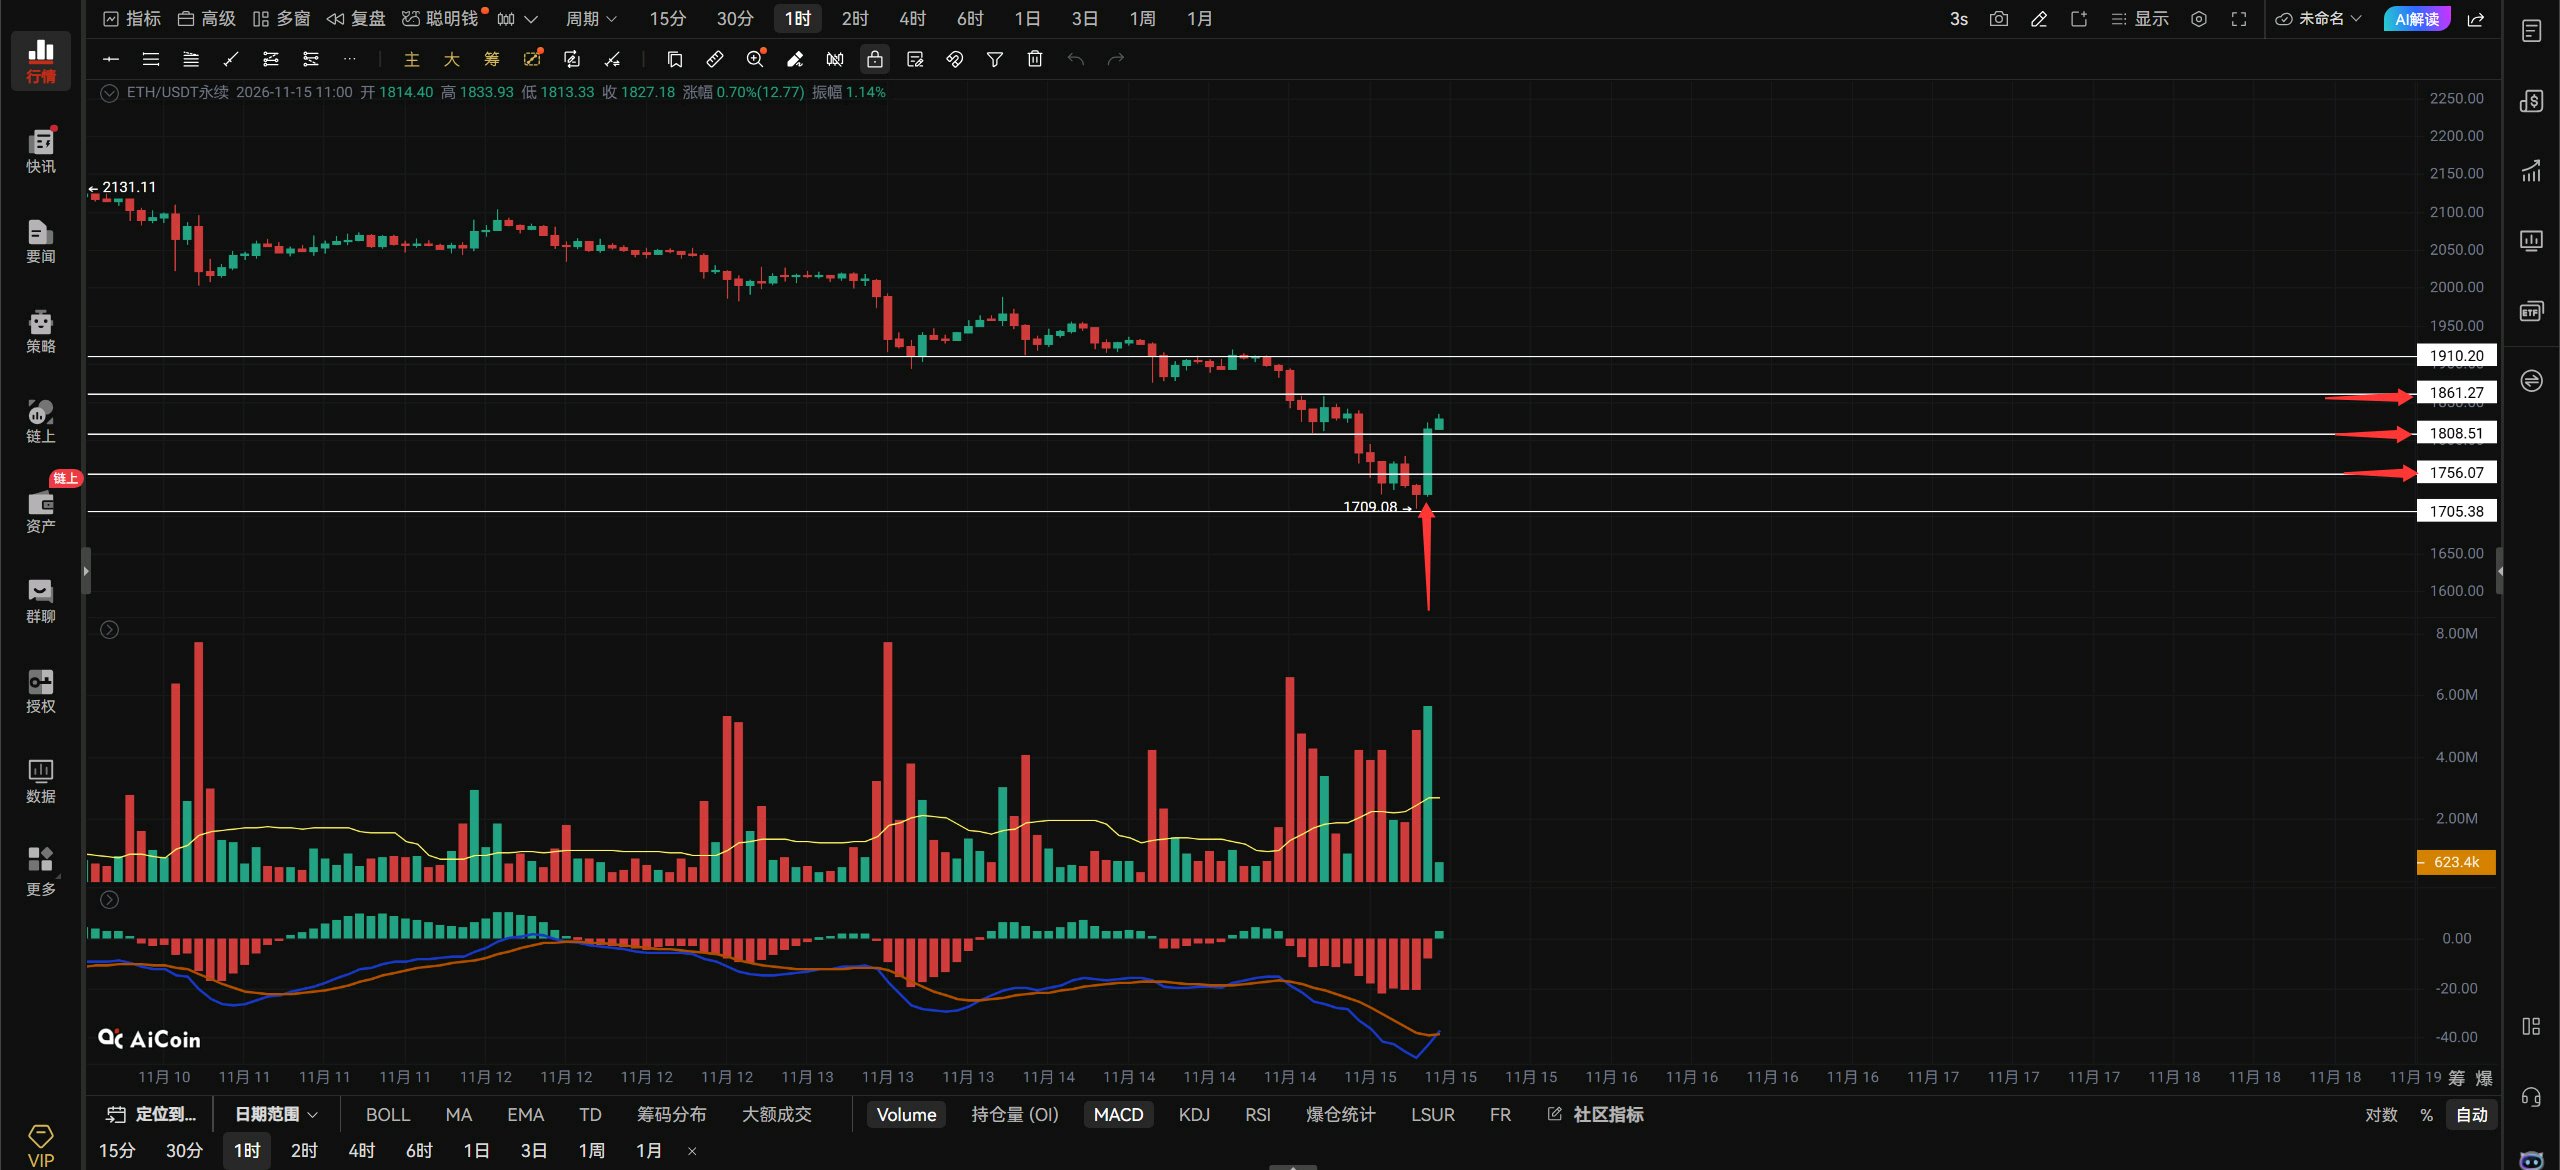
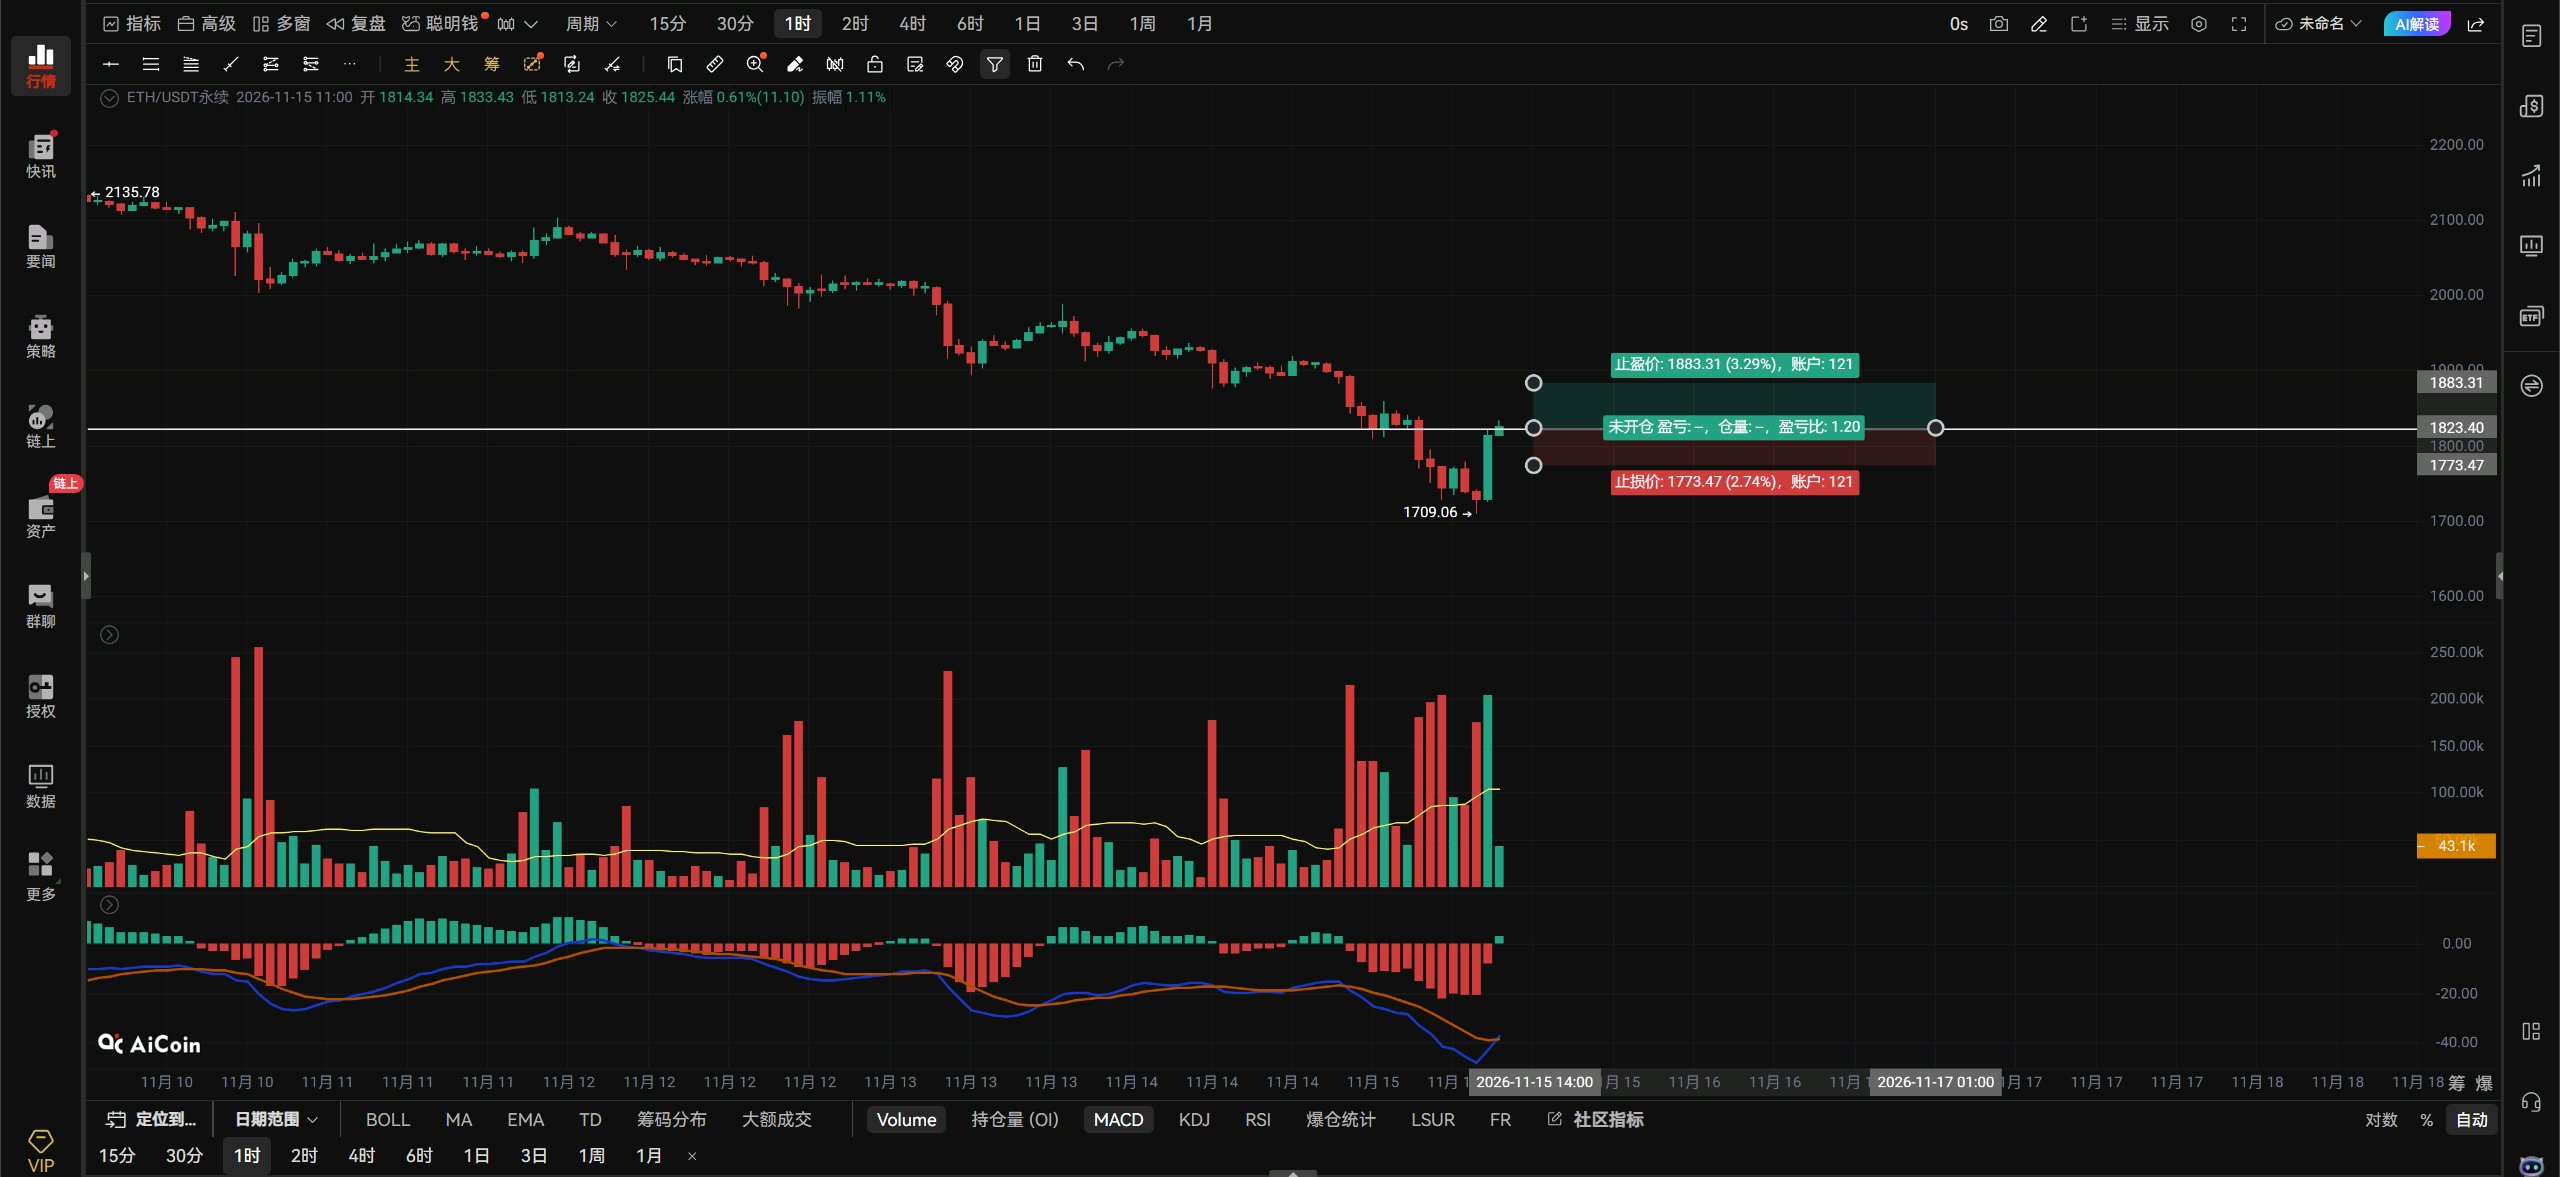
$ETHUSDT $ETH outlook: If ETH breaks above 1821 with strong volume, enter long on the breakout and set a stop-loss. If it breaks below 1784 with strong volume, enter short on the breakdown and set a stop-loss. If a pullback confirms 1740 as support, add one unit to the long position. Stop out if it breaks below 1709. If ETH holds above 1821 on the hourly chart, look for 1861–1910. Watch for a short entry of one unit at 1861. Stop out if it breaks above 1910. Countertrend wick-entry orders: long at 1680; stop out if it breaks below 1648. Resistance above: 1821–1861–1910 Support below: 1784–1740–1709 A 4-hour close below 1784 points to 1740–1709. Below ETH, where the red arrow points, a single bullish candle has pierced through several bearish candles. This shows ETH is currently strong. However, for ETH to continue rebounding, it needs to hold above 1800; only then can it keep moving up toward 1861. If it can't stay above 1800, it should at least pull back to 1756 and consolidate in the 1756–1800 range before choosing a direction. If you want to go long on ETH, it's best to wait for a pullback—don't rush to chase. That's all.#ByXIMPACT
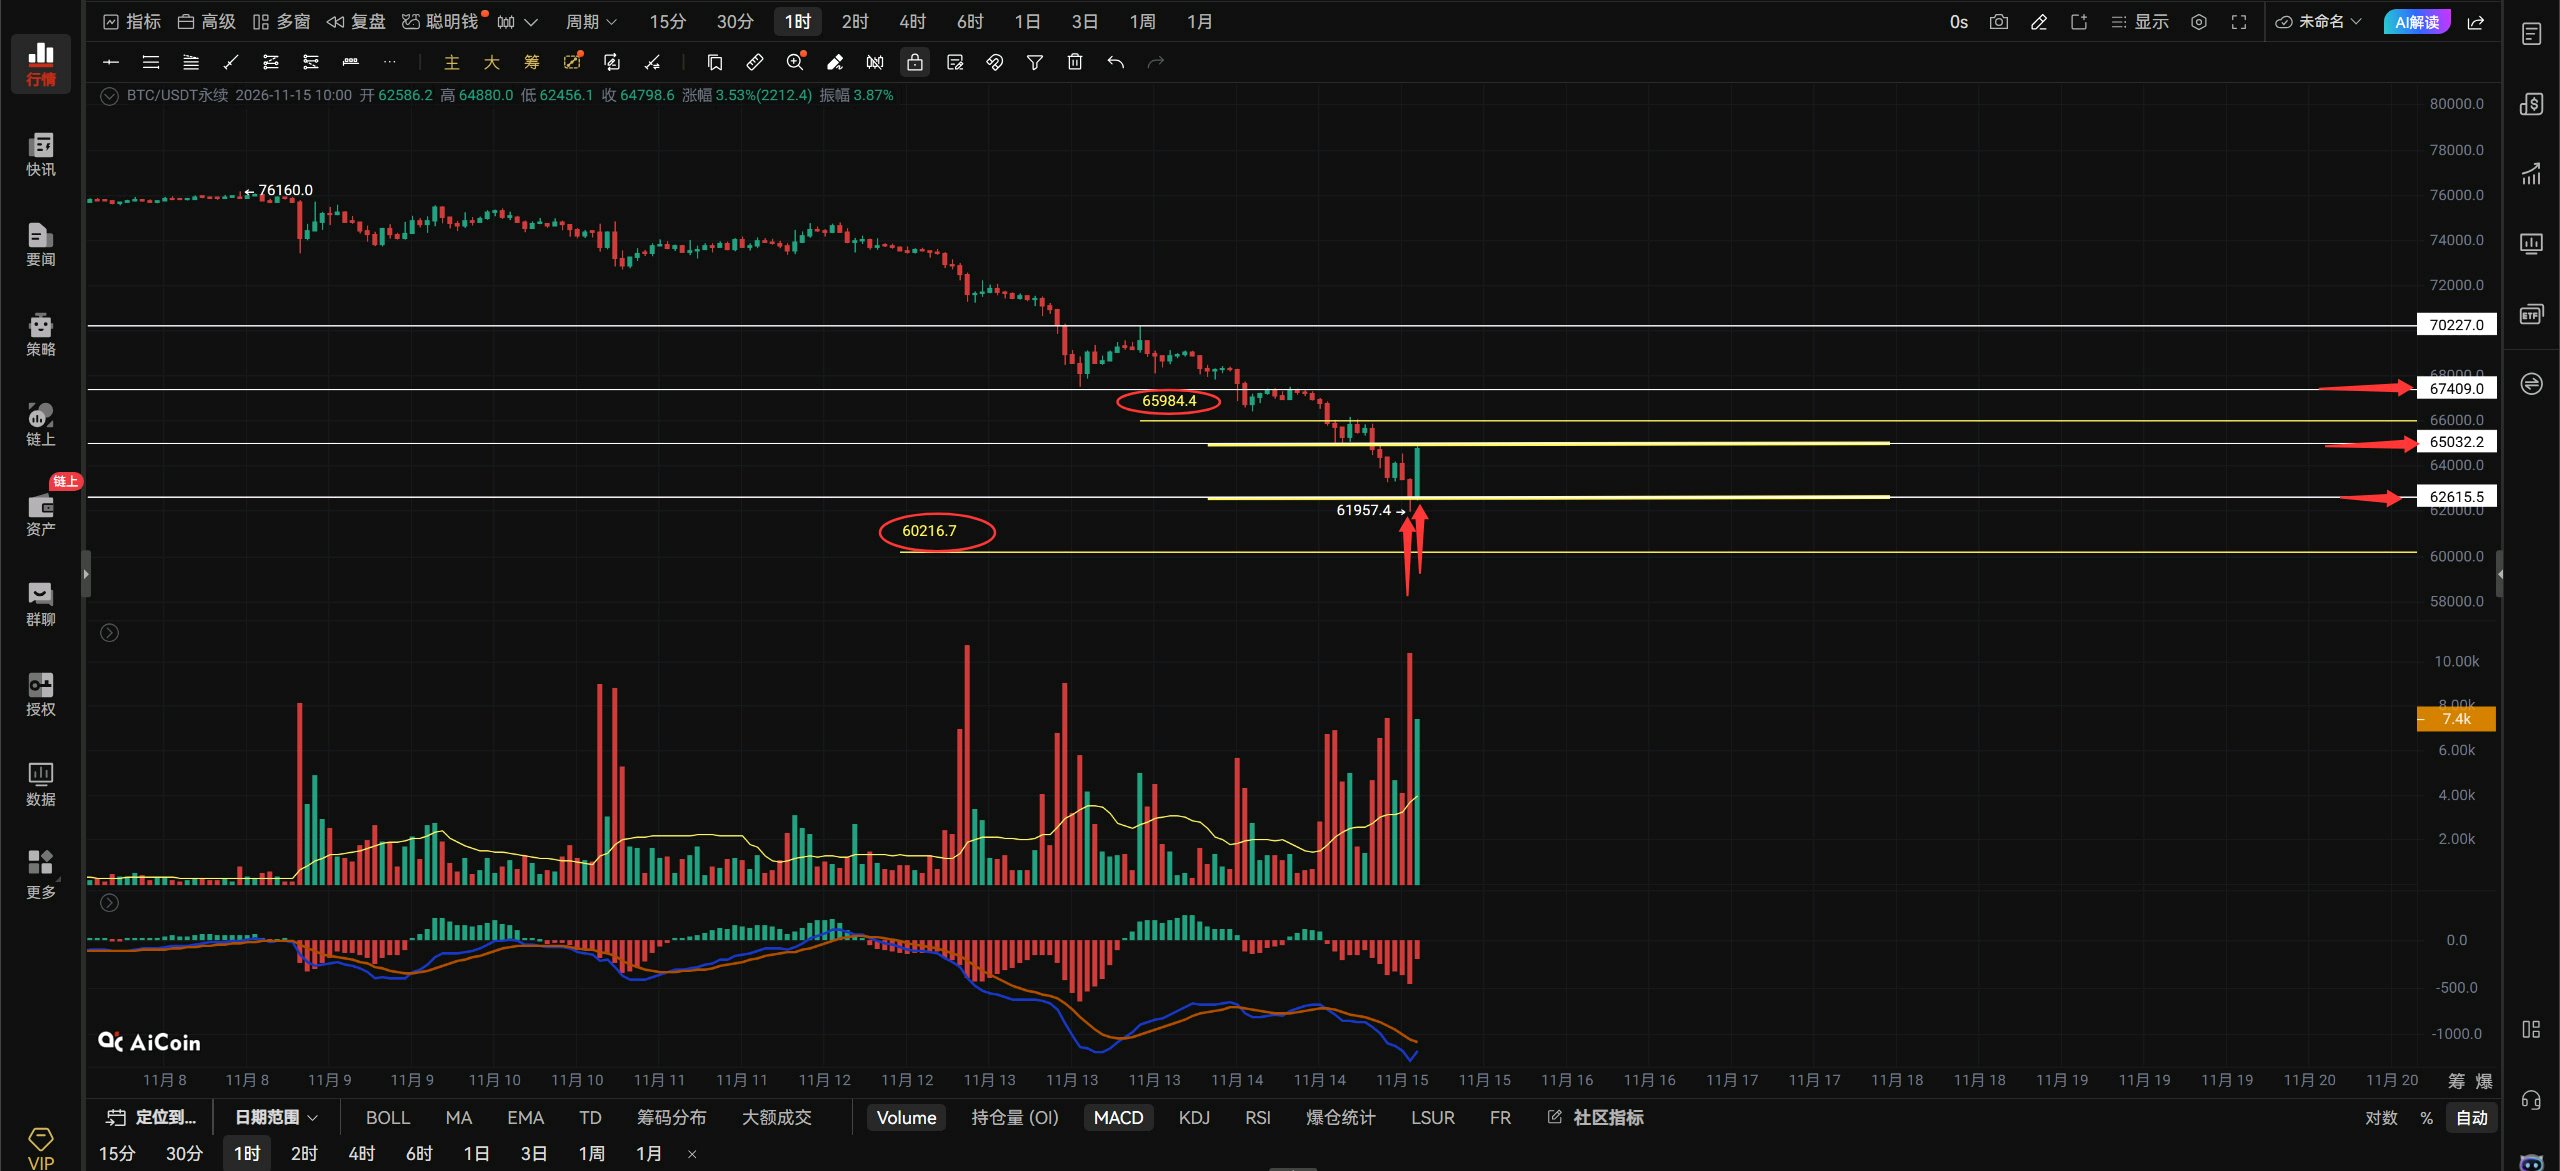
$BTCUSDT 11.15 Midday Market Outlook.🌿 $BTC Viewpoint: The weekend was wild too! I originally thought we’d see a recovery after the weekend’s decline, but I didn’t expect the weekend to be this brutal. In this market, even the world’s top traders would see their capital shrink, let alone us small retail investors. This drop has left me completely speechless; the bulls are desperate. After Bitcoin fell below 67400, it tried to rebound and reclaim 67400, but failed. Then it plunged straight to 65000. It barely paused at 65000 before continuing to fall. When I woke up this morning, I saw Bitcoin had broken below the support levels at 65000 and 62615, dropping straight to a low of 61957. A new low every time you wake up these past few days—who can take that? Bitcoin is now trading in the 65032–62615 range. Has it bottomed out? Bitcoin needs to reclaim 65000 to stop falling and rebound, with 65984–67400 as the upside targets. If it can’t get back above 65000, it may retest the previous low. The red arrow below points to a very nice bullish engulfing pattern, which suggests a rebound is likely on the hourly timeframe. But the rebound must break through the 65000 resistance; otherwise, it won’t be able to continue. Why did such a big rebound occur after the price hit around 62000? Because reaching 62000 activated buying interest around that level. Institutional bulls felt 62000 was worth buying, which is why the reaction was so strong. Next, we’ll see whether 65000 can be broken. If it breaks through, the rebound will continue; if not, wait for a second retest. If 62000 holds on the second retest, this decline will basically have run its course. If 62000 fails to hold, a new low at 60216 could appear before you know it. If you want to go long now, it’s best to wait for a bottoming signal near 62000 after a pullback. Chasing the price directly is a bit risky.#ByXIMPACT
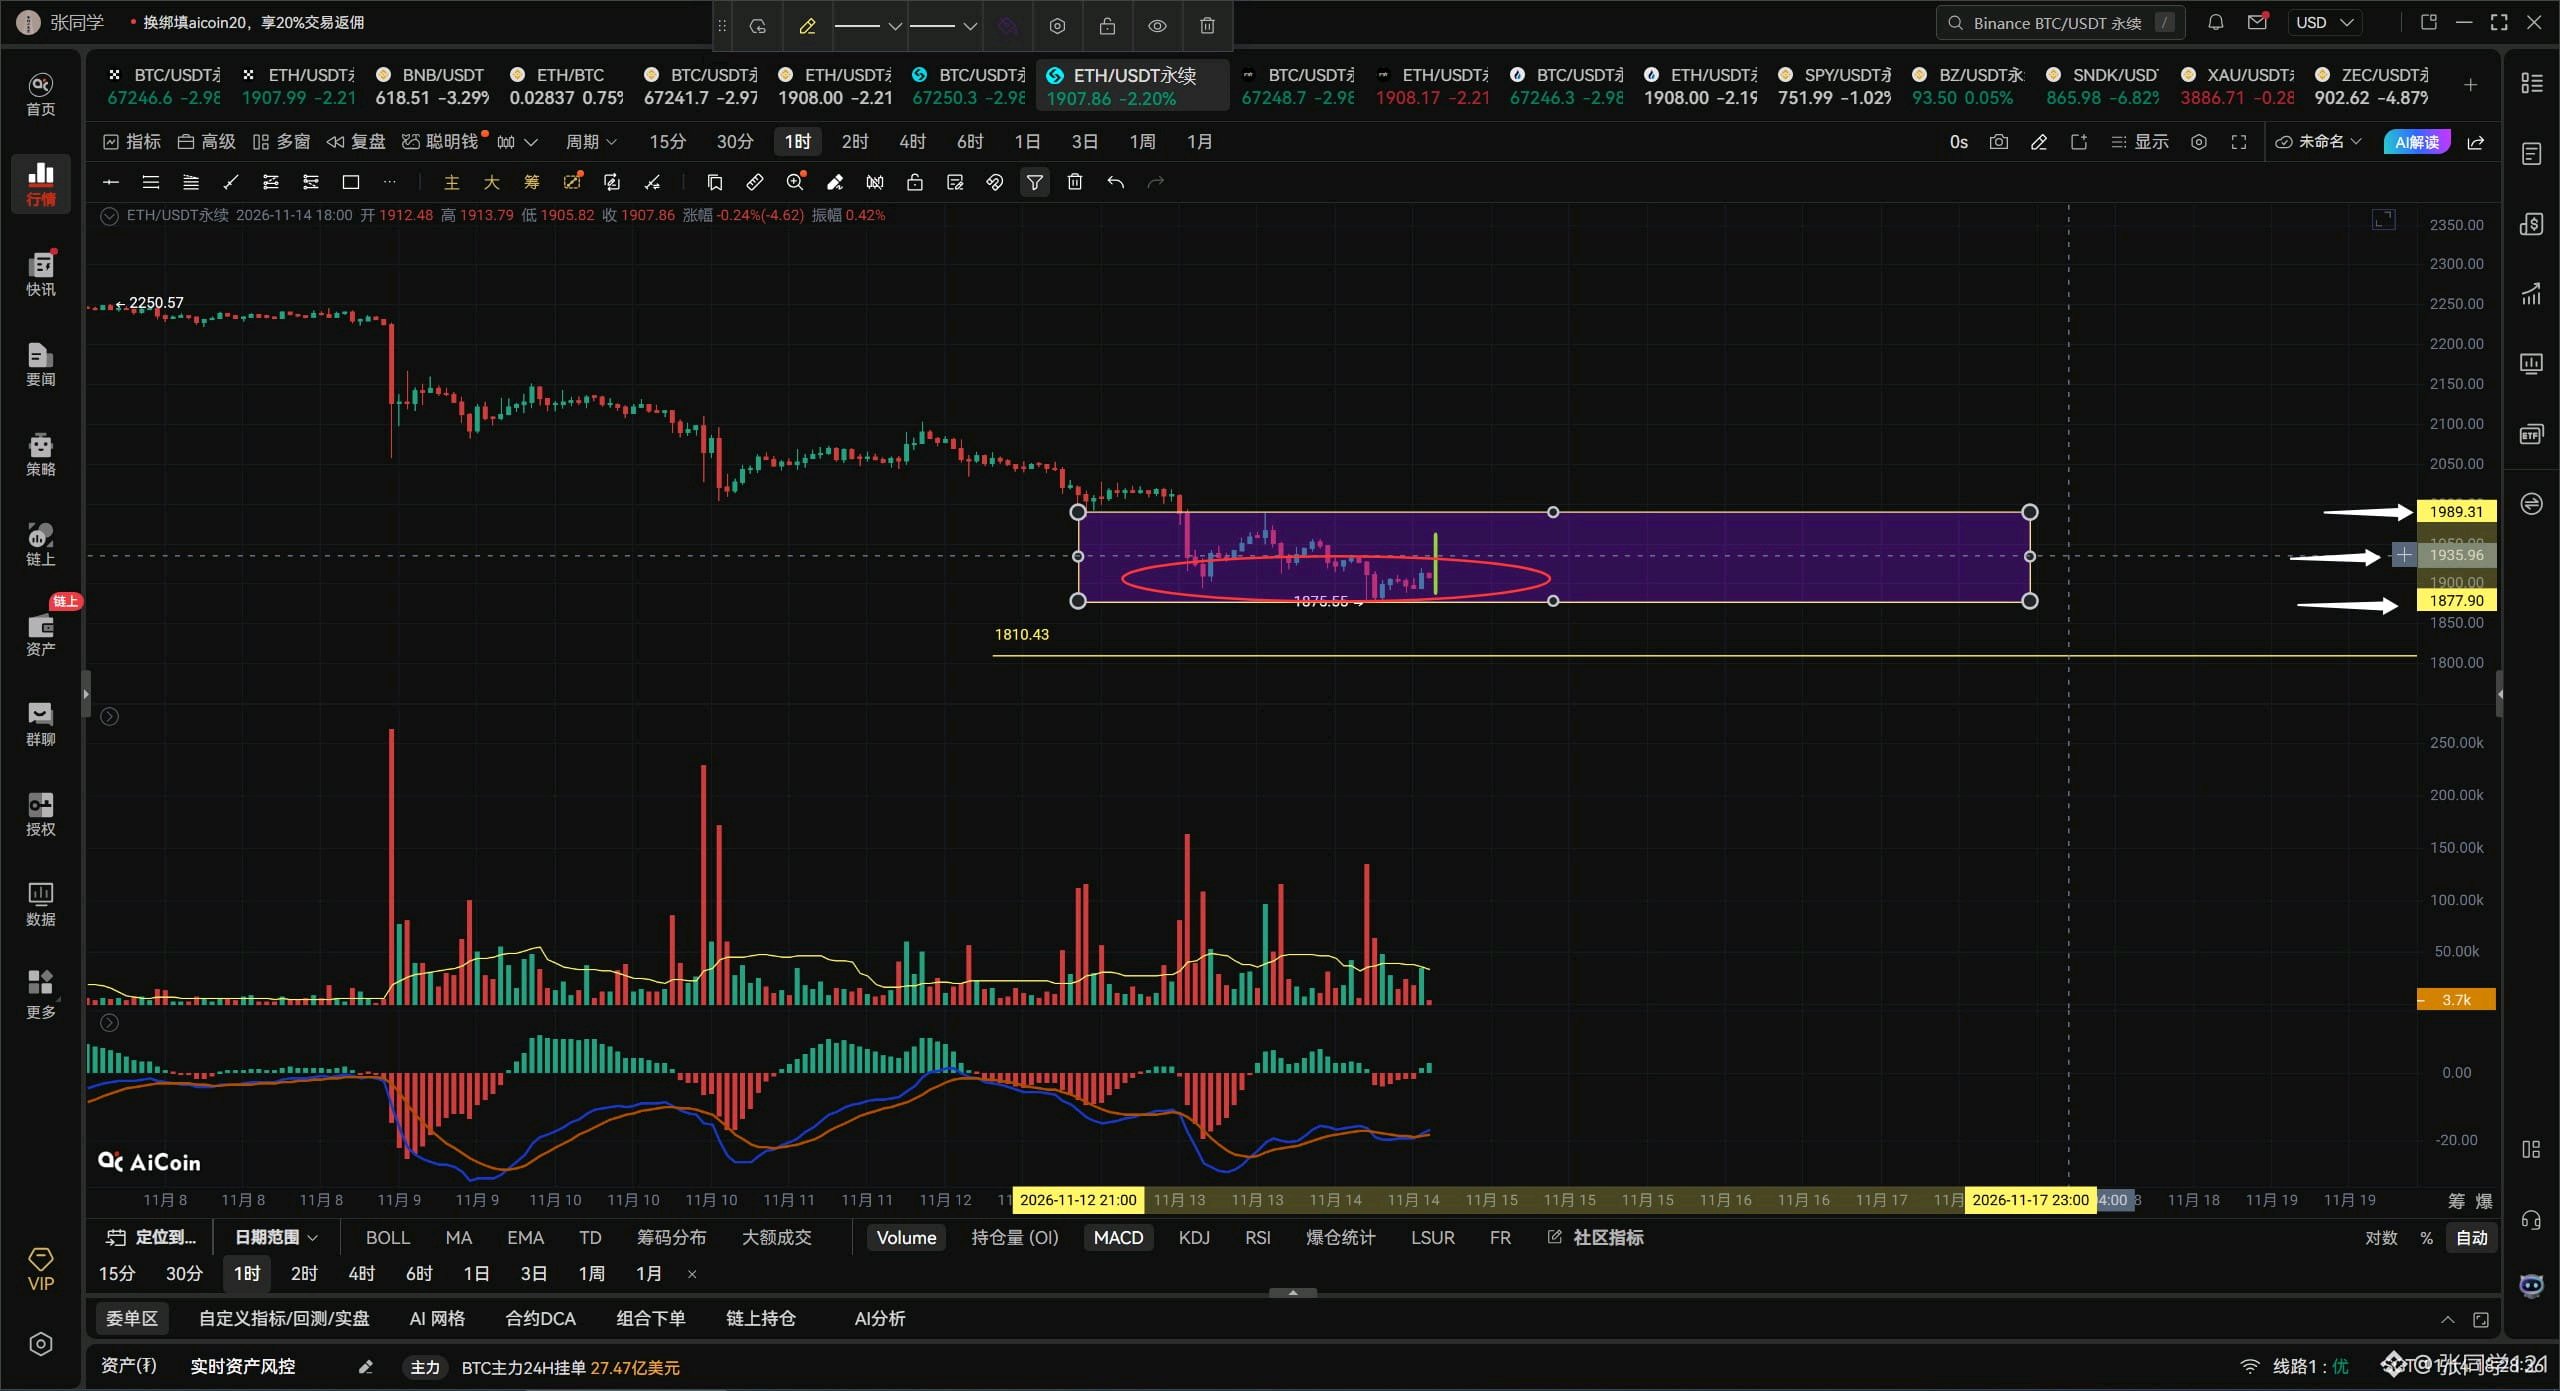
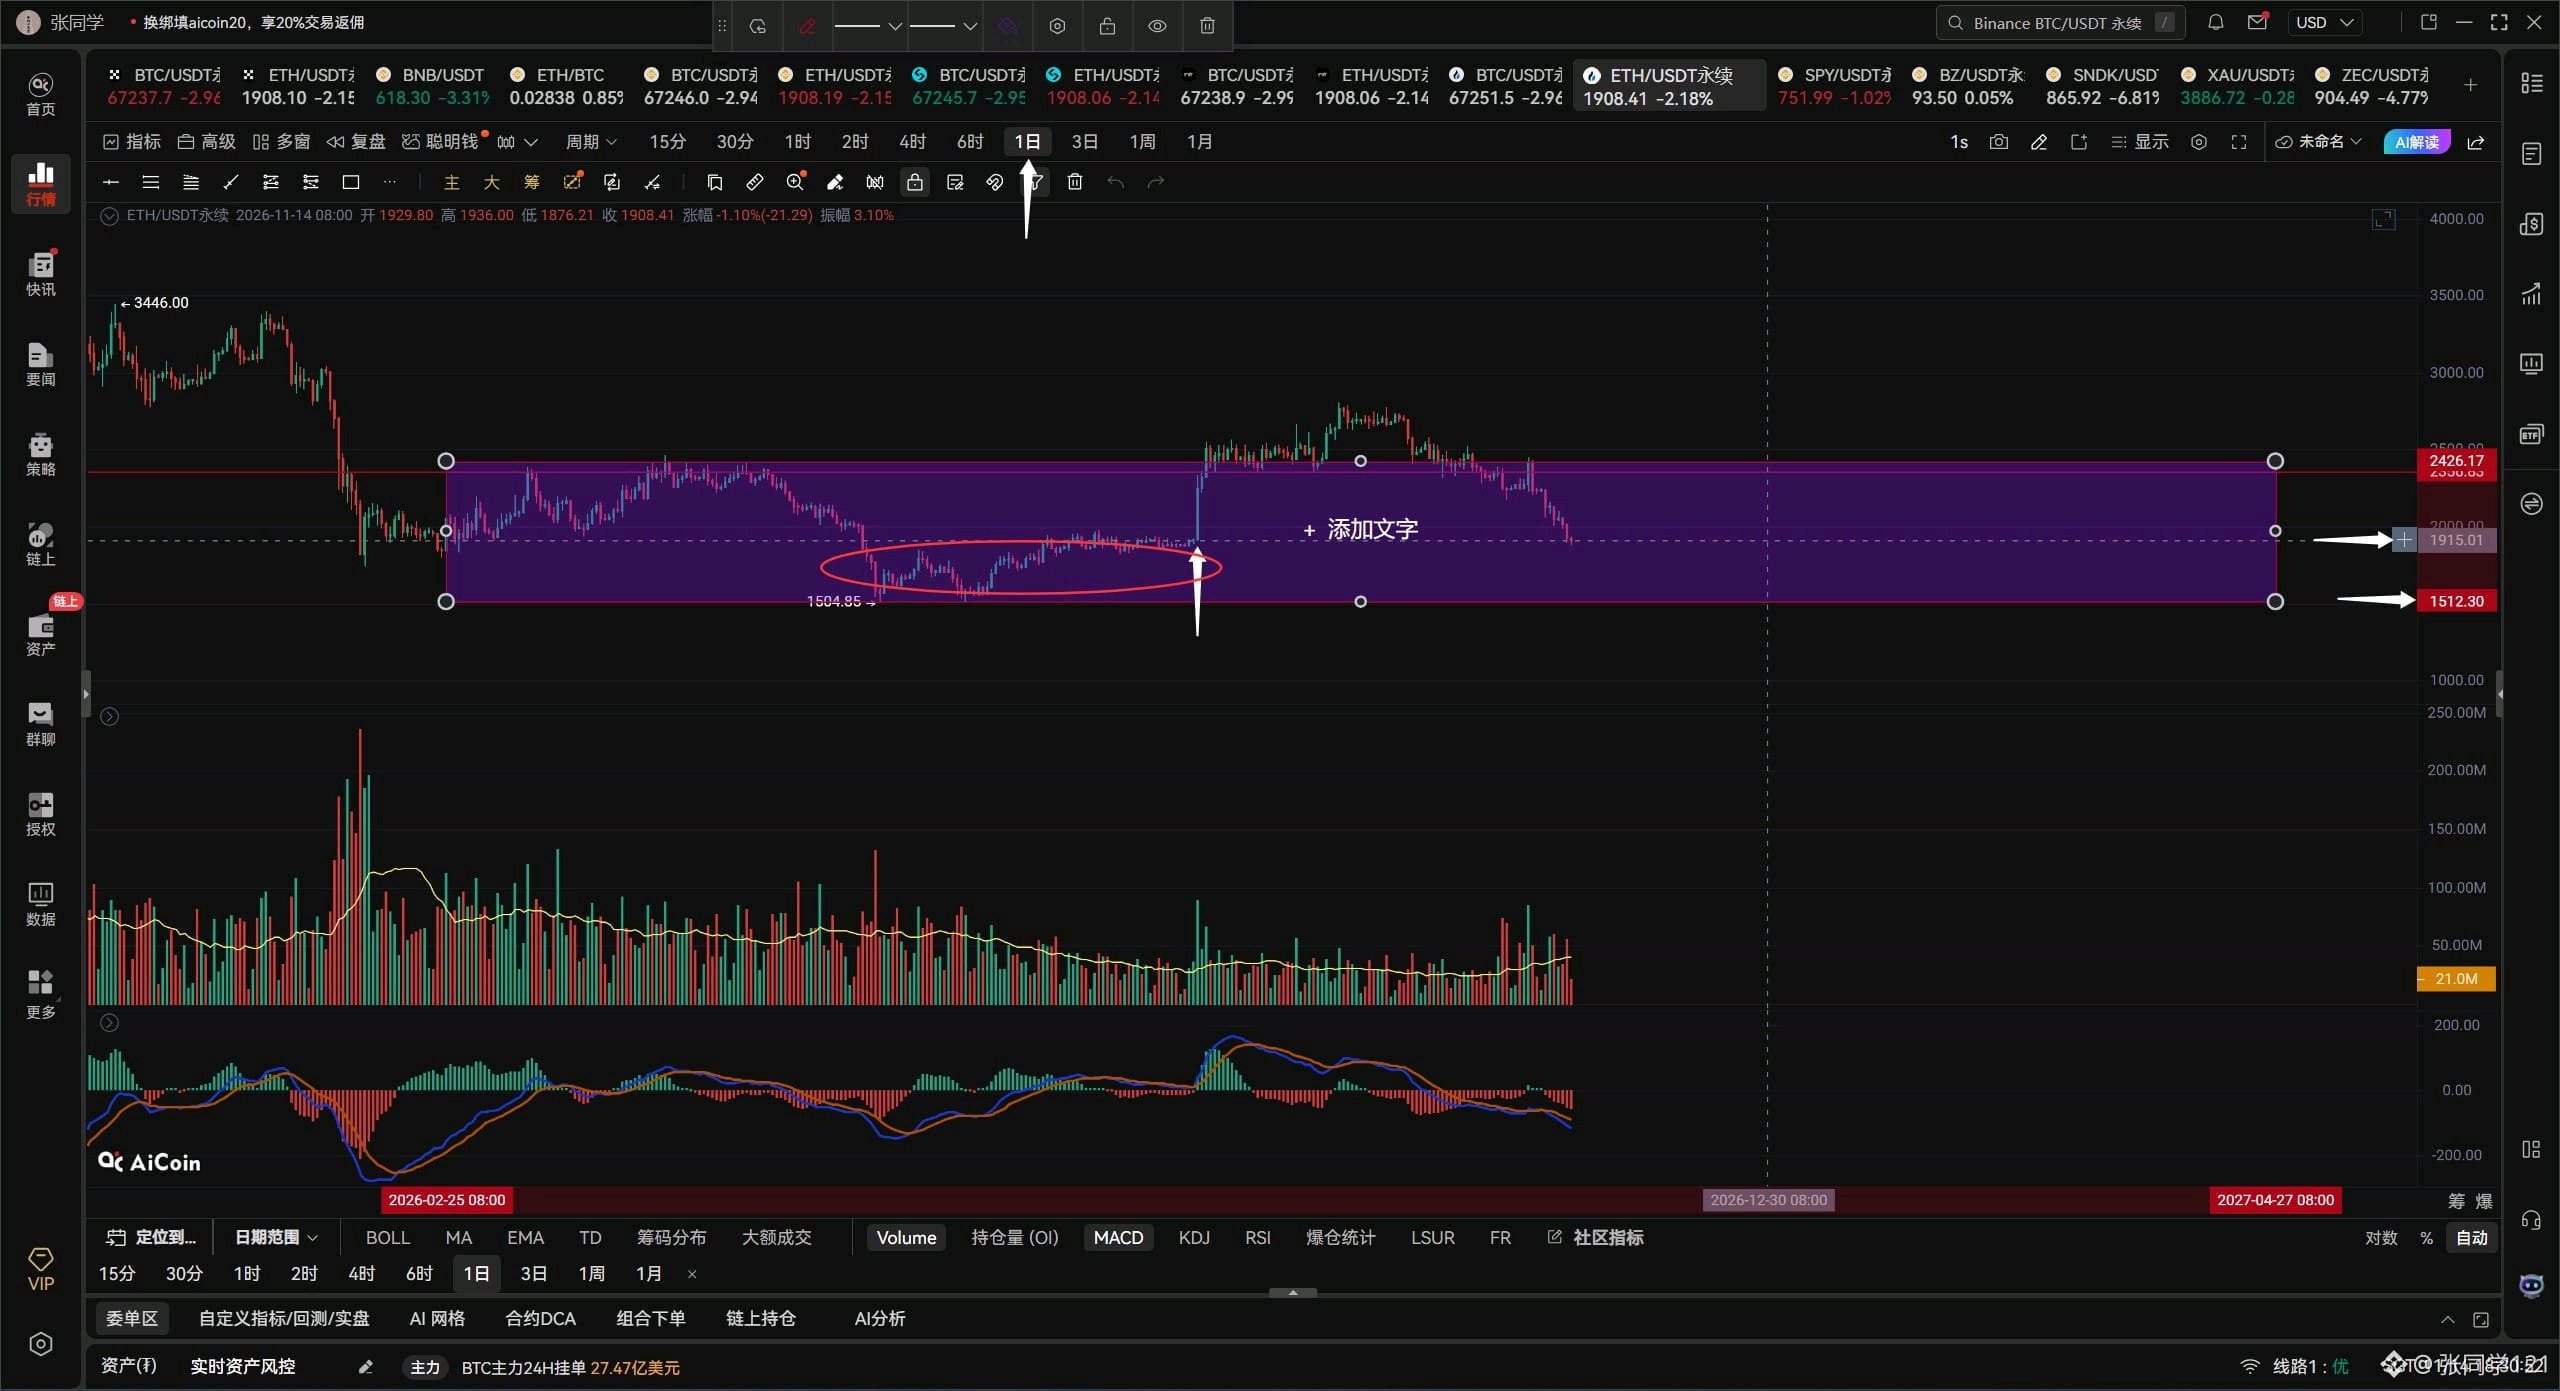
$ETHUSDT $ETH Evening outlook: Nov. 14. ETH is currently consolidating between 1989 and 1877. For ETH to rise, it must break above the midpoint of the range and hold there to stop falling and begin a rebound. That price is around 1935, because only a break above the small consolidation zone marked by the red box at 1935 can produce a higher high and extend the rebound toward the upper boundary of the range at 1989. If it cannot break above 1935, it can only continue choppy, narrow-range trading between 1935 and 1877. And since it has been trading below the midpoint of the range, the risk of breaking below the previous low is high. So, to reduce the risk of further declines, ETH must get back above 1935 and hold there. If ETH breaks above 1912 on volume, consider entering long; if it breaks below 1893 on volume, consider entering short. Watch for changes in volume and use stop-losses. If ETH holds above 1912 on the hourly chart, look toward 1935–1989. If it breaks below 1893 on the 4-hour chart, look toward 1861–1809. On ETH’s daily chart, the large bullish candle indicated by the white arrow below has already been broken. If tomorrow’s daily close cannot get back inside that candle, price may move into the consolidation zone marked by the red box below. I can’t say for sure whether it will reach 1500! In any case, ETH is in serious trouble if it can’t stay above 1900. That’s all.#ByXIMPACT
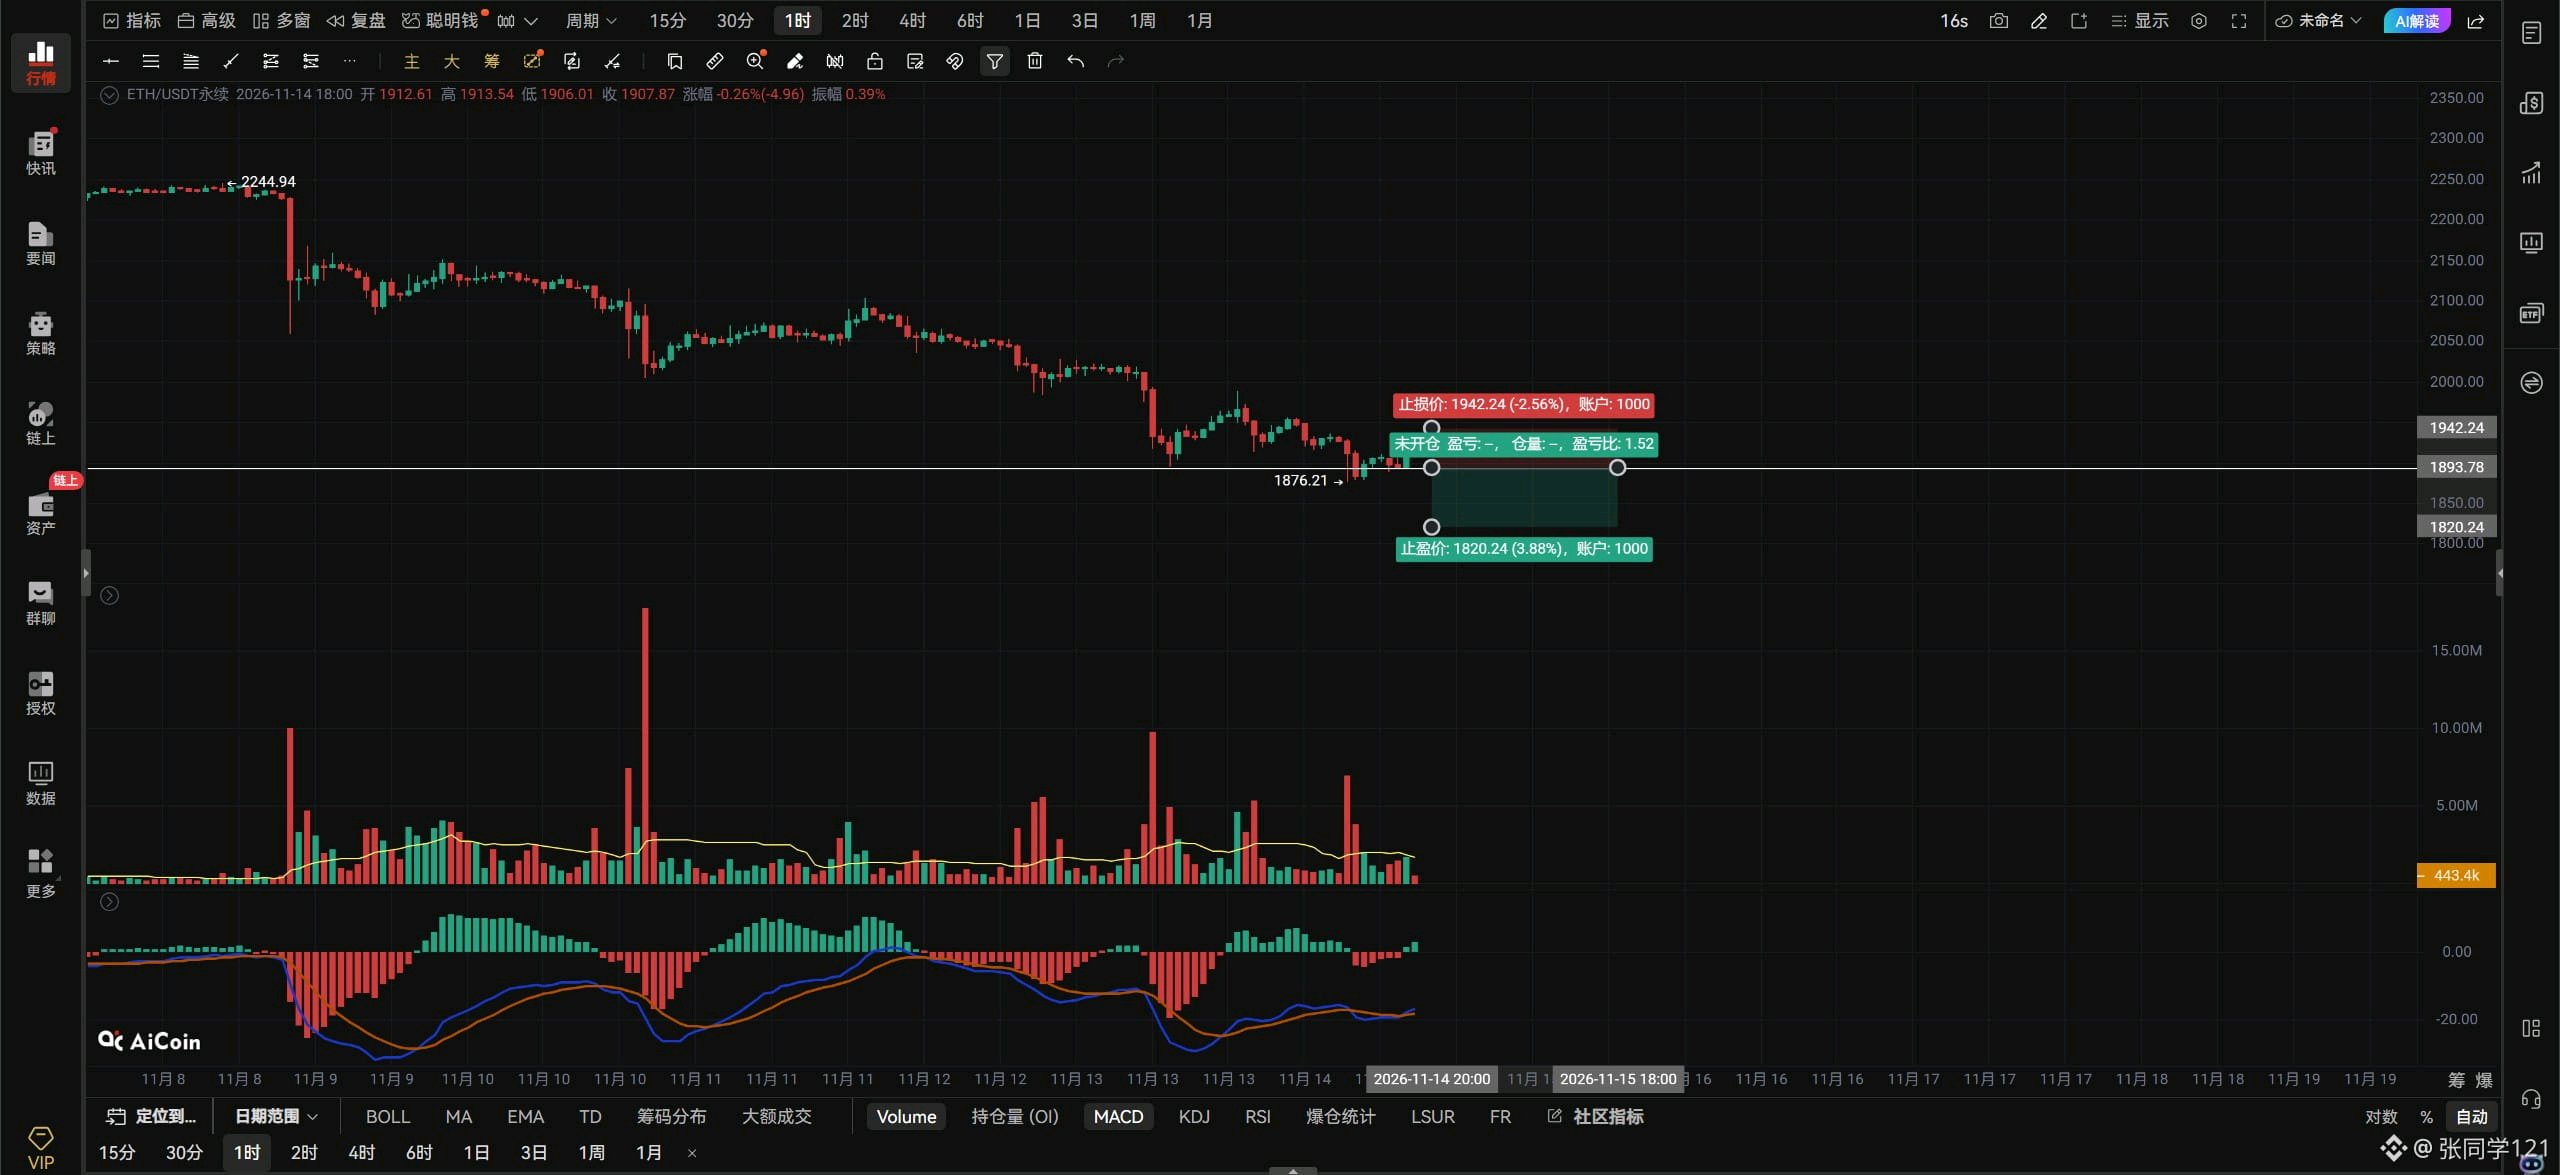
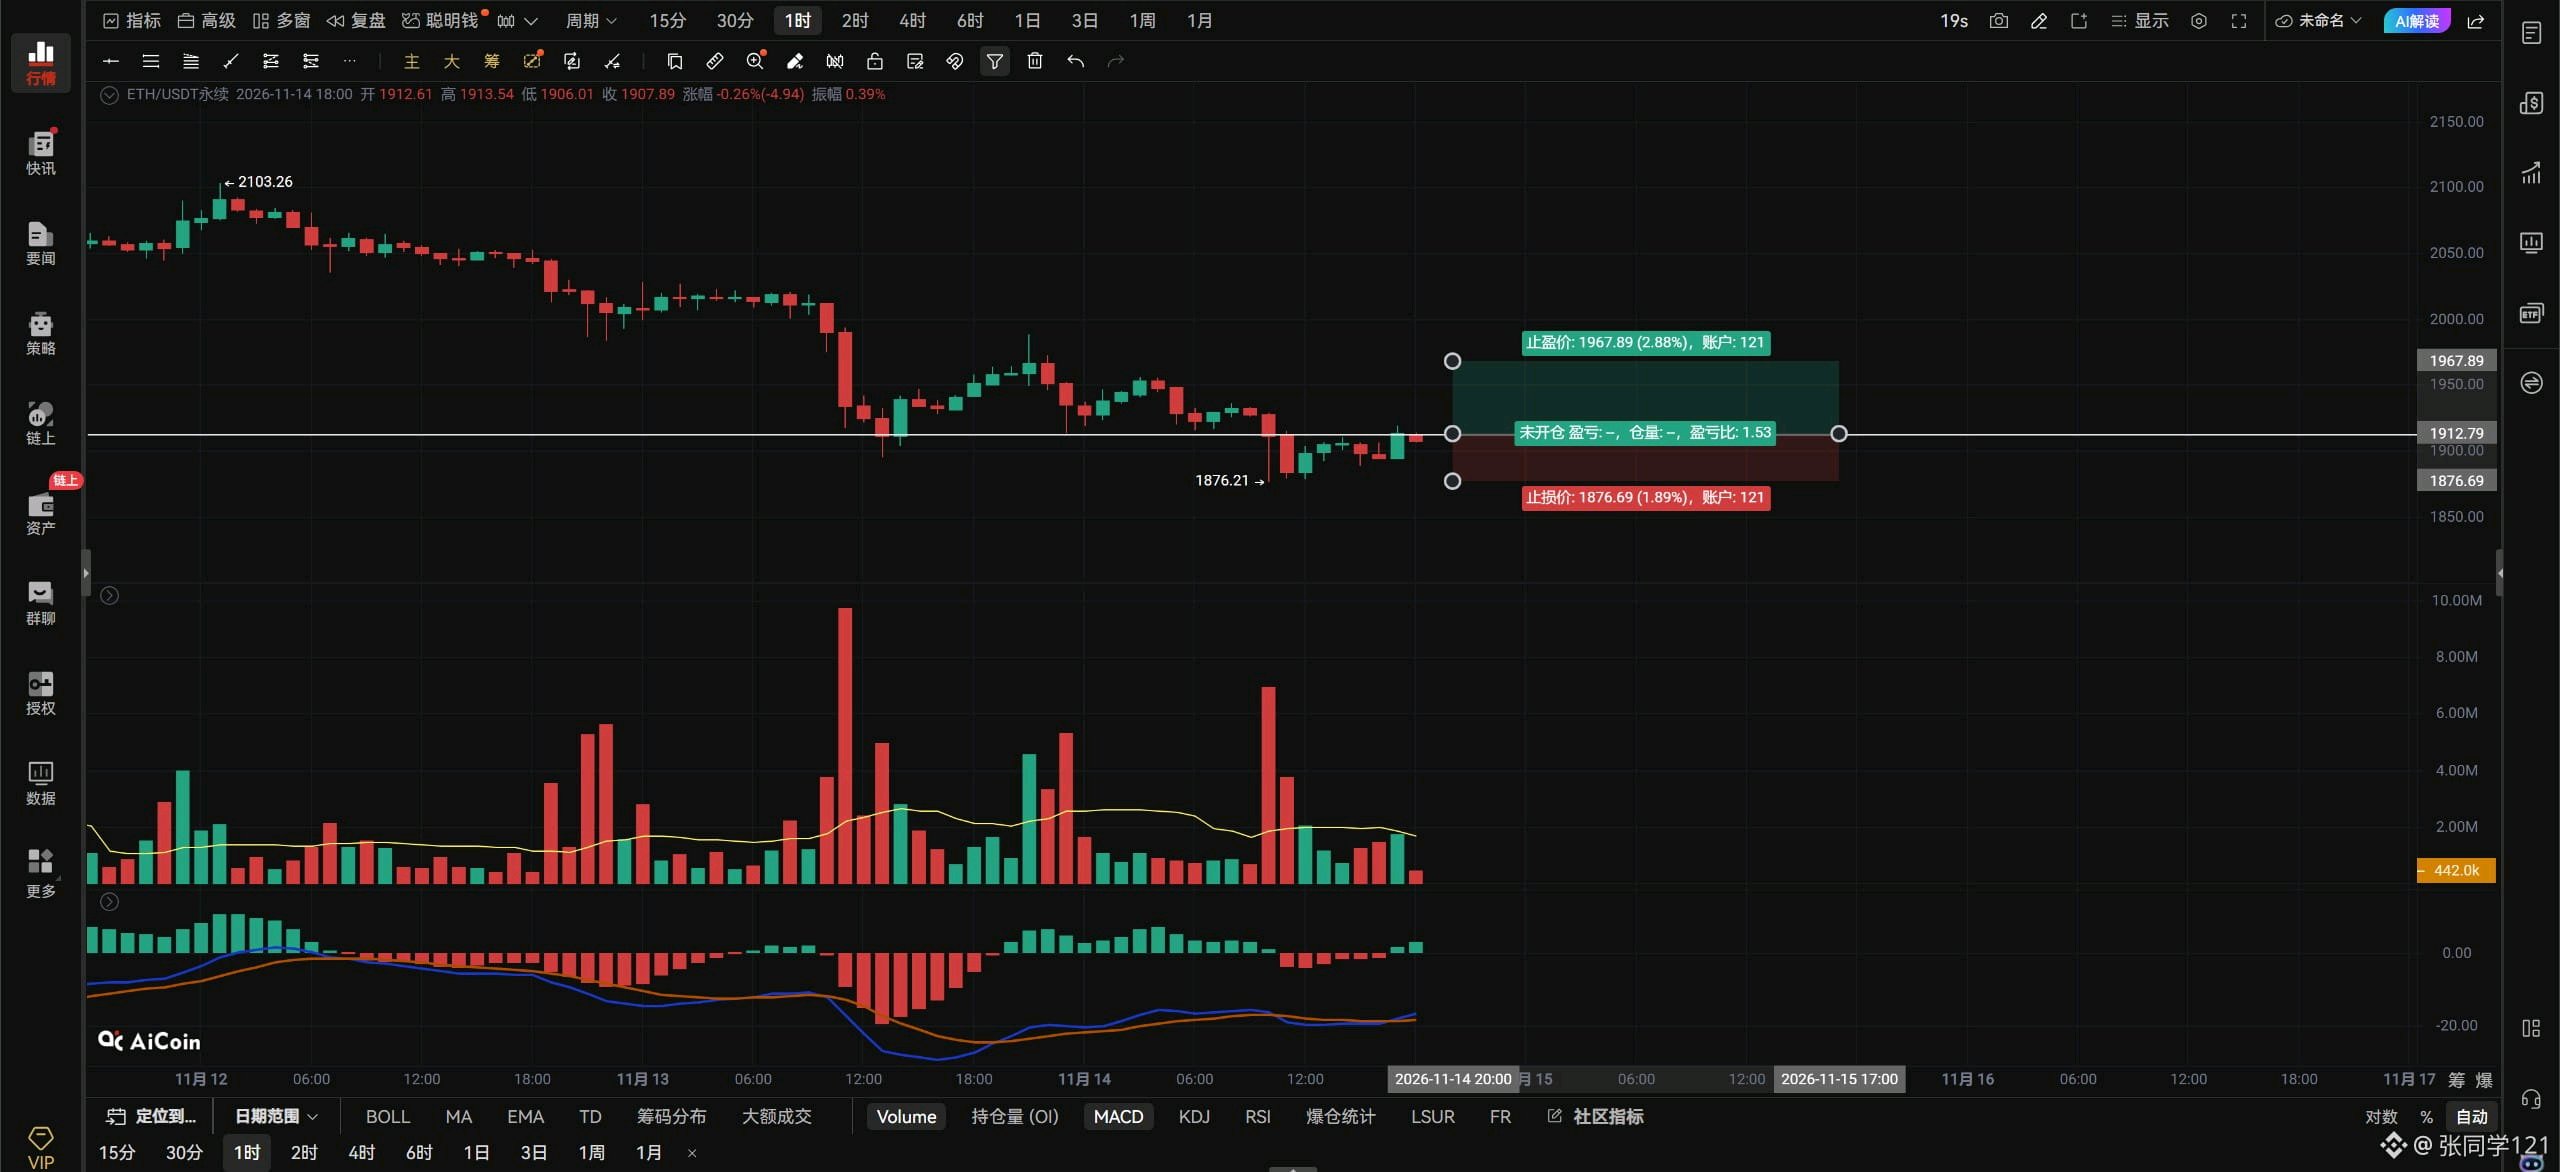
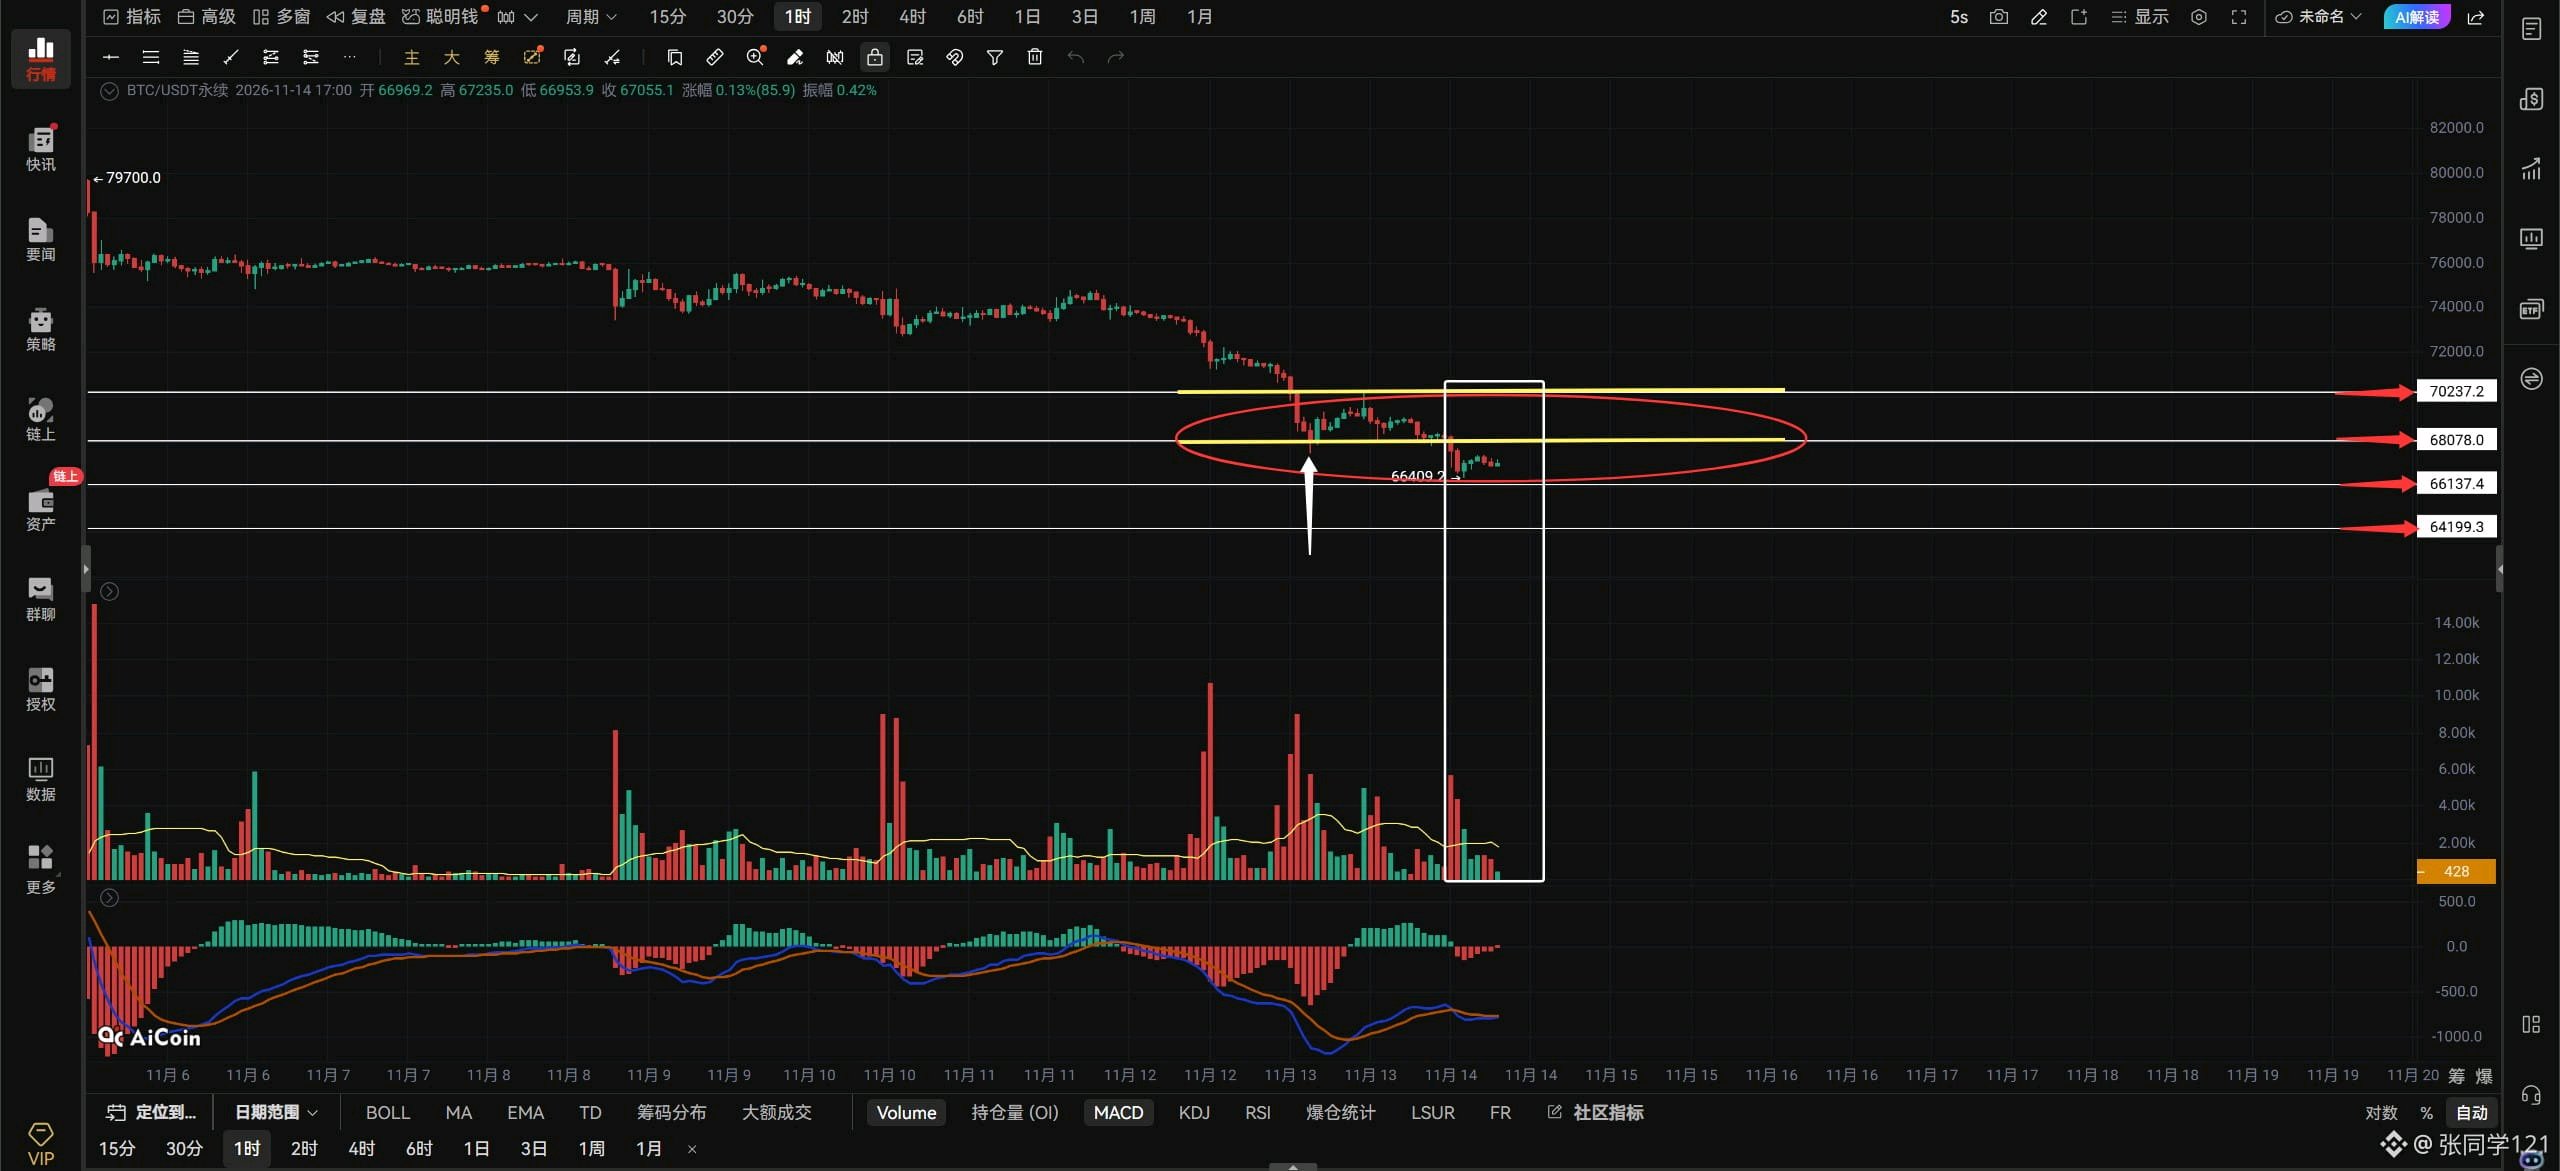
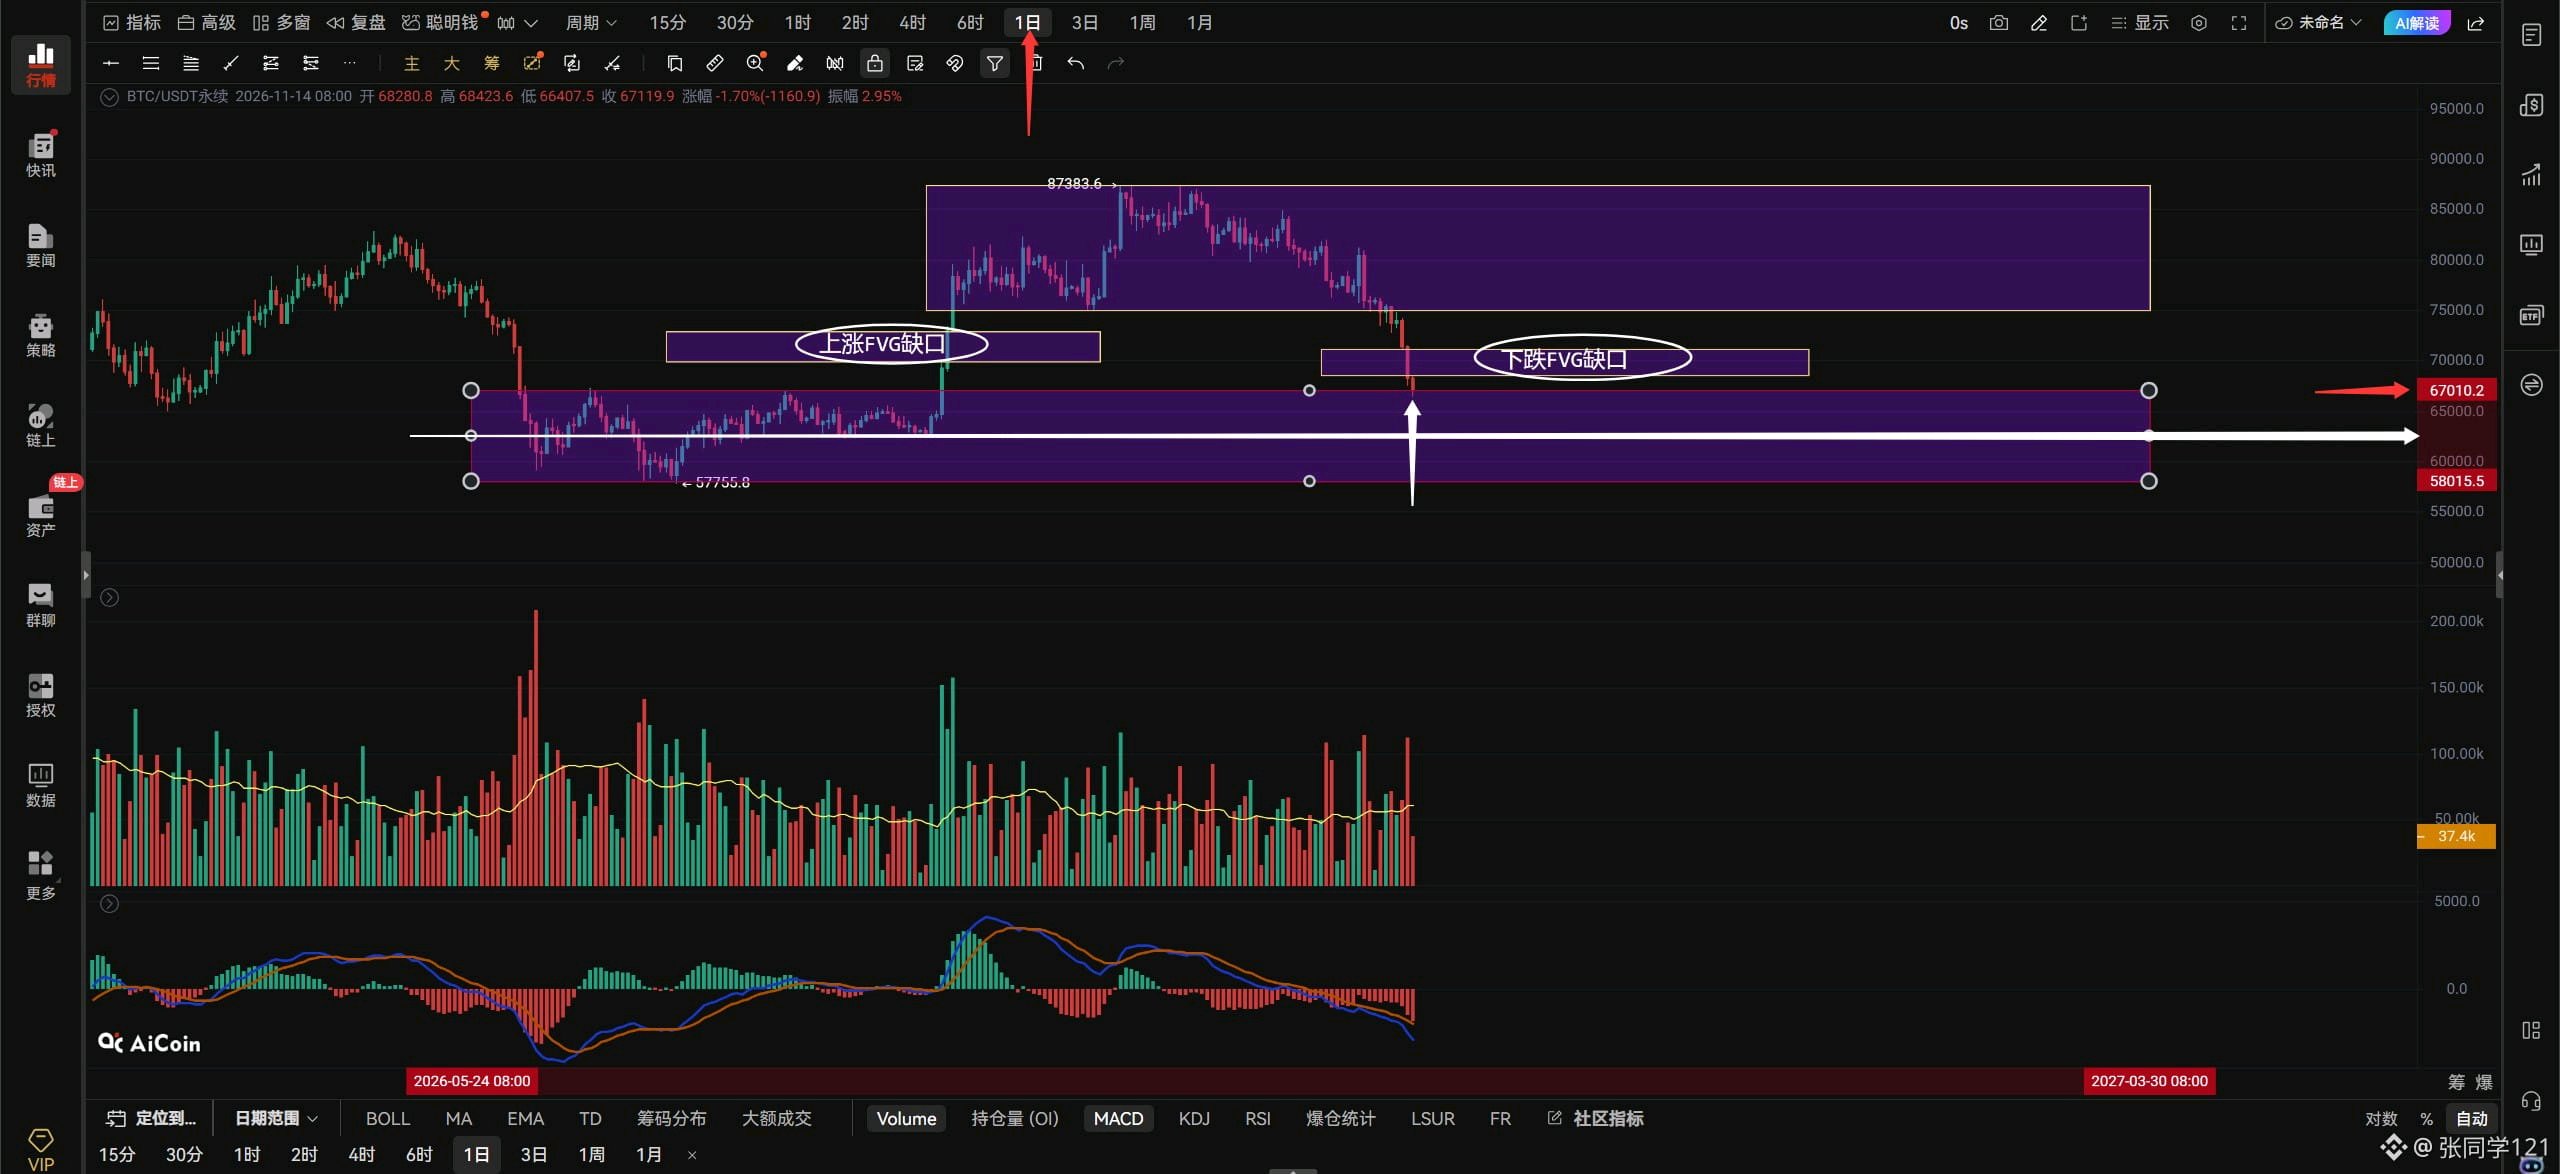
$BTCUSDT $BTC Evening outlook: 11/14. Bitcoin’s price action is heartbreaking 💔! It keeps making new lows—what is going on? Right now, Bitcoin is moving within the consolidation range marked by the red box, around 70237–66137. You can divide this range into two consolidation zones: the upper zone is 70237–68078, and the lower zone is 68078–66137. Bitcoin has now broken below the upper consolidation zone of 70237–68078 and returned to trading in the lower zone. When Bitcoin was consolidating in the upper zone, it meant that bulls at the current level were still operating in a strong range. Now that it’s back in the lower zone, the bulls have returned to a weak range and are moving sideways again. That’s not a good sign. Look at the volume below the candles marked by the white box: there’s volume on the way down, but volume is shrinking on the way up. How can Bitcoin rebound like this? It can’t even reclaim the previous low at 67400, indicated by the white arrow. To stop falling and rebound, it needs to get back above the previous low of 67400 and trade there. Only then can it find a bottom and rebound, with 68000–69000–70000 in view. If it can’t reclaim the previous low, simply holding a consolidation range of 66137–68078 would already be good. Just don’t let it fall below 66137; if it does, then 64199 is in sight. There’s no clear signal that it’s found a bottom, and it can’t get a rebound going. You don’t dare chase a short, and there’s no bottom signal for going long—what are you supposed to do? Stay on the sidelines! If you want to go long, wait for Bitcoin to retest the previous low without breaking below it and show a bottoming signal, then take a small short-term long position. Alternatively, wait for Bitcoin to break into the 67400–68000 resistance zone, then cautiously chase a small long on the right-hand side of the chart. If Bitcoin breaks above 67468 with volume, aggressive traders can chase a long on the right-hand side. If it rebounds to 68500, consider a small short on the left-hand side, with a stop-loss in place.Bitcoin breaks above and holds 67468 on the hourly chart, look for 68078–69000. There’s no point if it can’t get above 67468. If it breaks below 66733 on the 4-hour chart, look down to 66137–64199. The bullish FVG gap on the left side of Bitcoin’s daily chart has been completely filled, but there’s no sign of a bottom—instead, another bearish FVG gap has appeared on the right. The bearish FVG spans 68602–71190. Next, we’ll see whether tomorrow’s daily close can stay within that gap. If Bitcoin can get back inside it, the daily downtrend should stop. If it can’t close back inside, see that large daily consolidation range below, from 67010 to 58015? Price will move back within that range. The current daily candle has already pierced into it, which is dangerous. If tomorrow’s daily close can’t stay above 67000, then based on the range, the strongest support below is around the midpoint at 62000. Scary, huh? If things keep going like this, this market won’t be much fun. Meeting adjourned. #ByXIMPACT
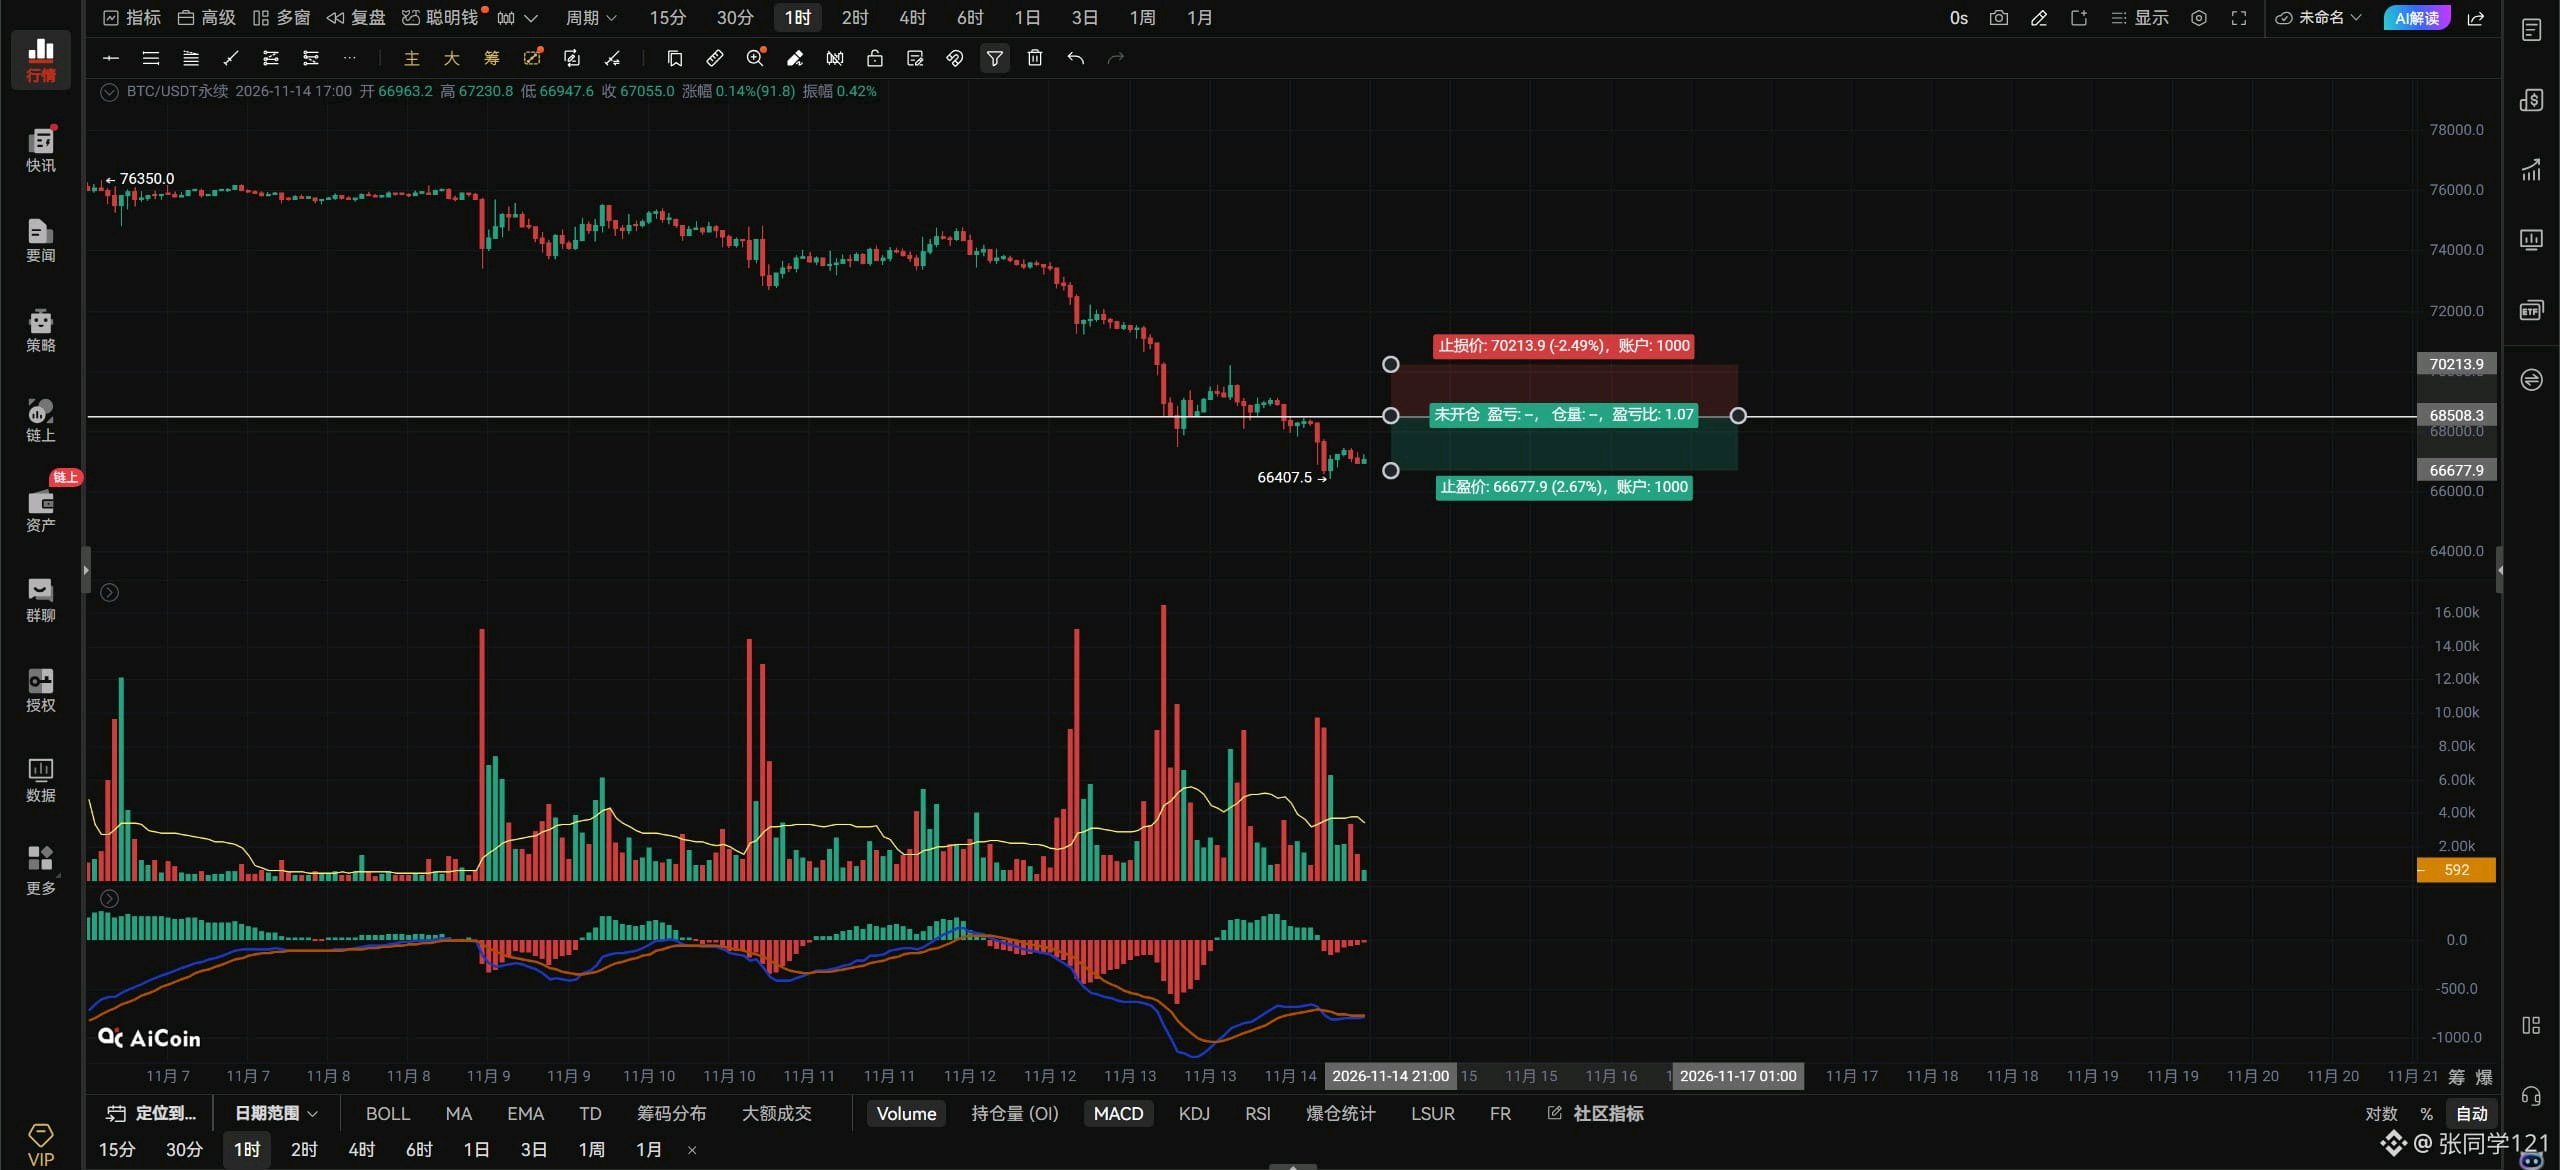
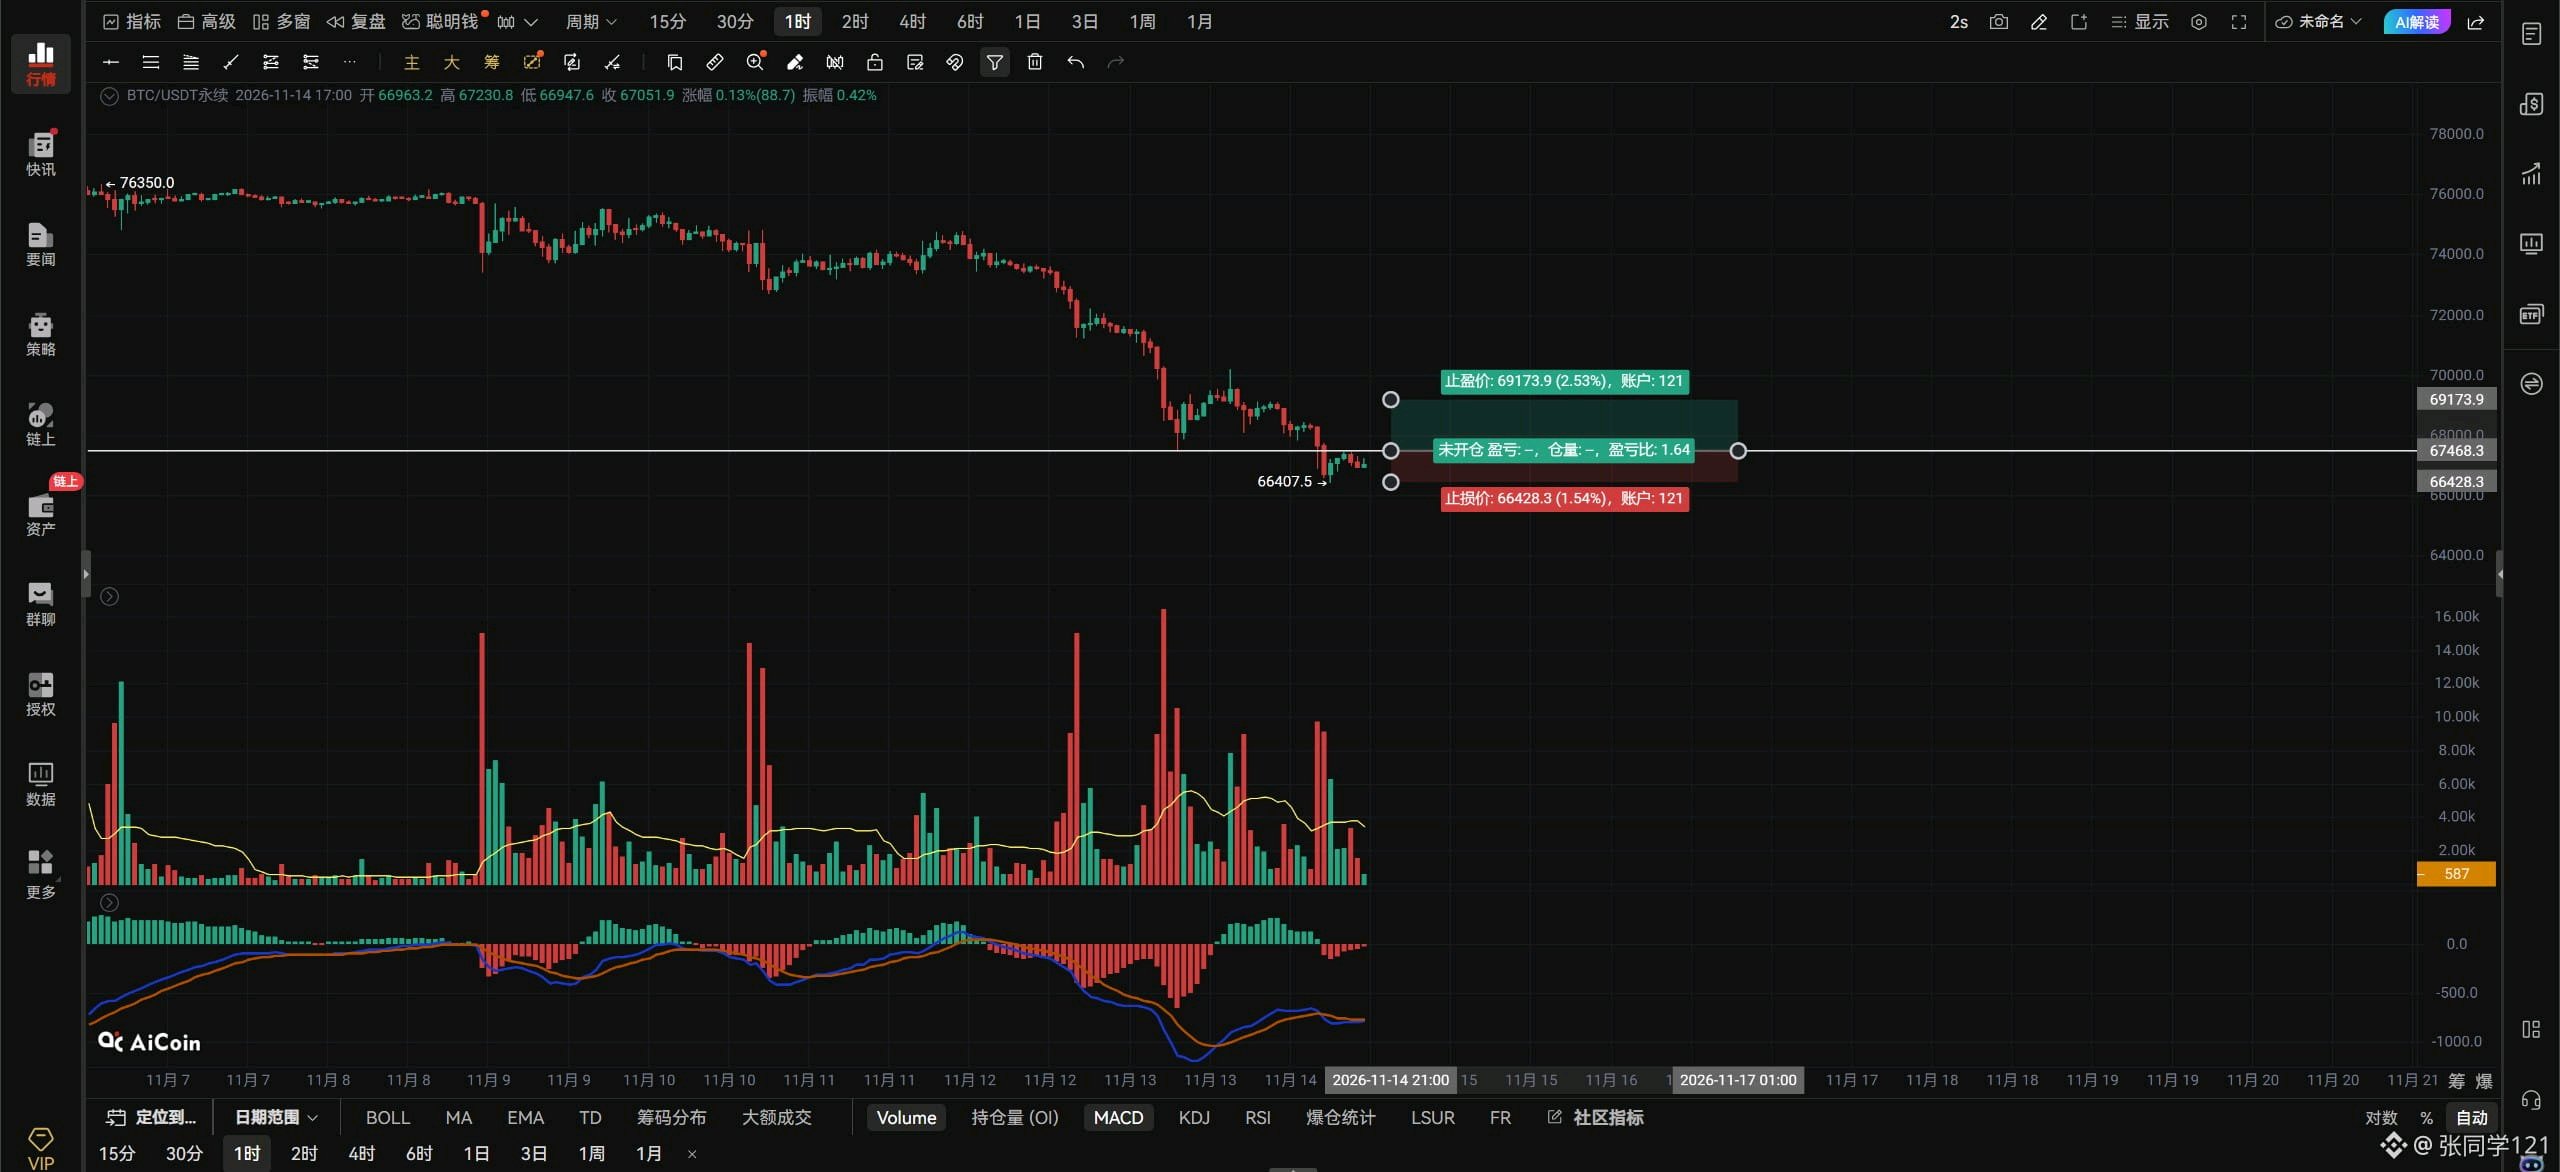
$ETHUSDT Outlook: If ETH breaks above 1933 with volume, chase the long on the right side; move the stop-loss to breakeven. If ETH breaks below 1910 with volume, chase the short on the right side; use a stop-loss. If price pulls back to 1861 and confirms support, take a long. Stop-loss if it breaks below 1821. If ETH holds above 1933 on the hourly chart, look toward 1955–2003. Watch for ETH to reach 2003 and take a short. Stop-loss if it breaks above 2046. Left-side wick orders: long at 1800; stop-loss if it breaks below 1756. Resistance above: 1933–1955–2003 Support below: 1910–1861–1821 On the 4-hour timeframe, a break below 1910 points to 1861–1821. ETH’s triangle has been broken to the downside. The question now is whether ETH can get back inside the triangle. If it does, the consolidation between 1910 and 1956 will continue. If it can’t, then 1800 is the next target. The support at 1861 will most likely be broken. ETH needs to break above 1956 to stop falling and rebound toward 2000; if it can’t get past 1956, it can only keep testing lower levels. Personally, I think we’ll see a decent rebound only once it reaches 1800. Meeting adjourned.#ByXIMPACT
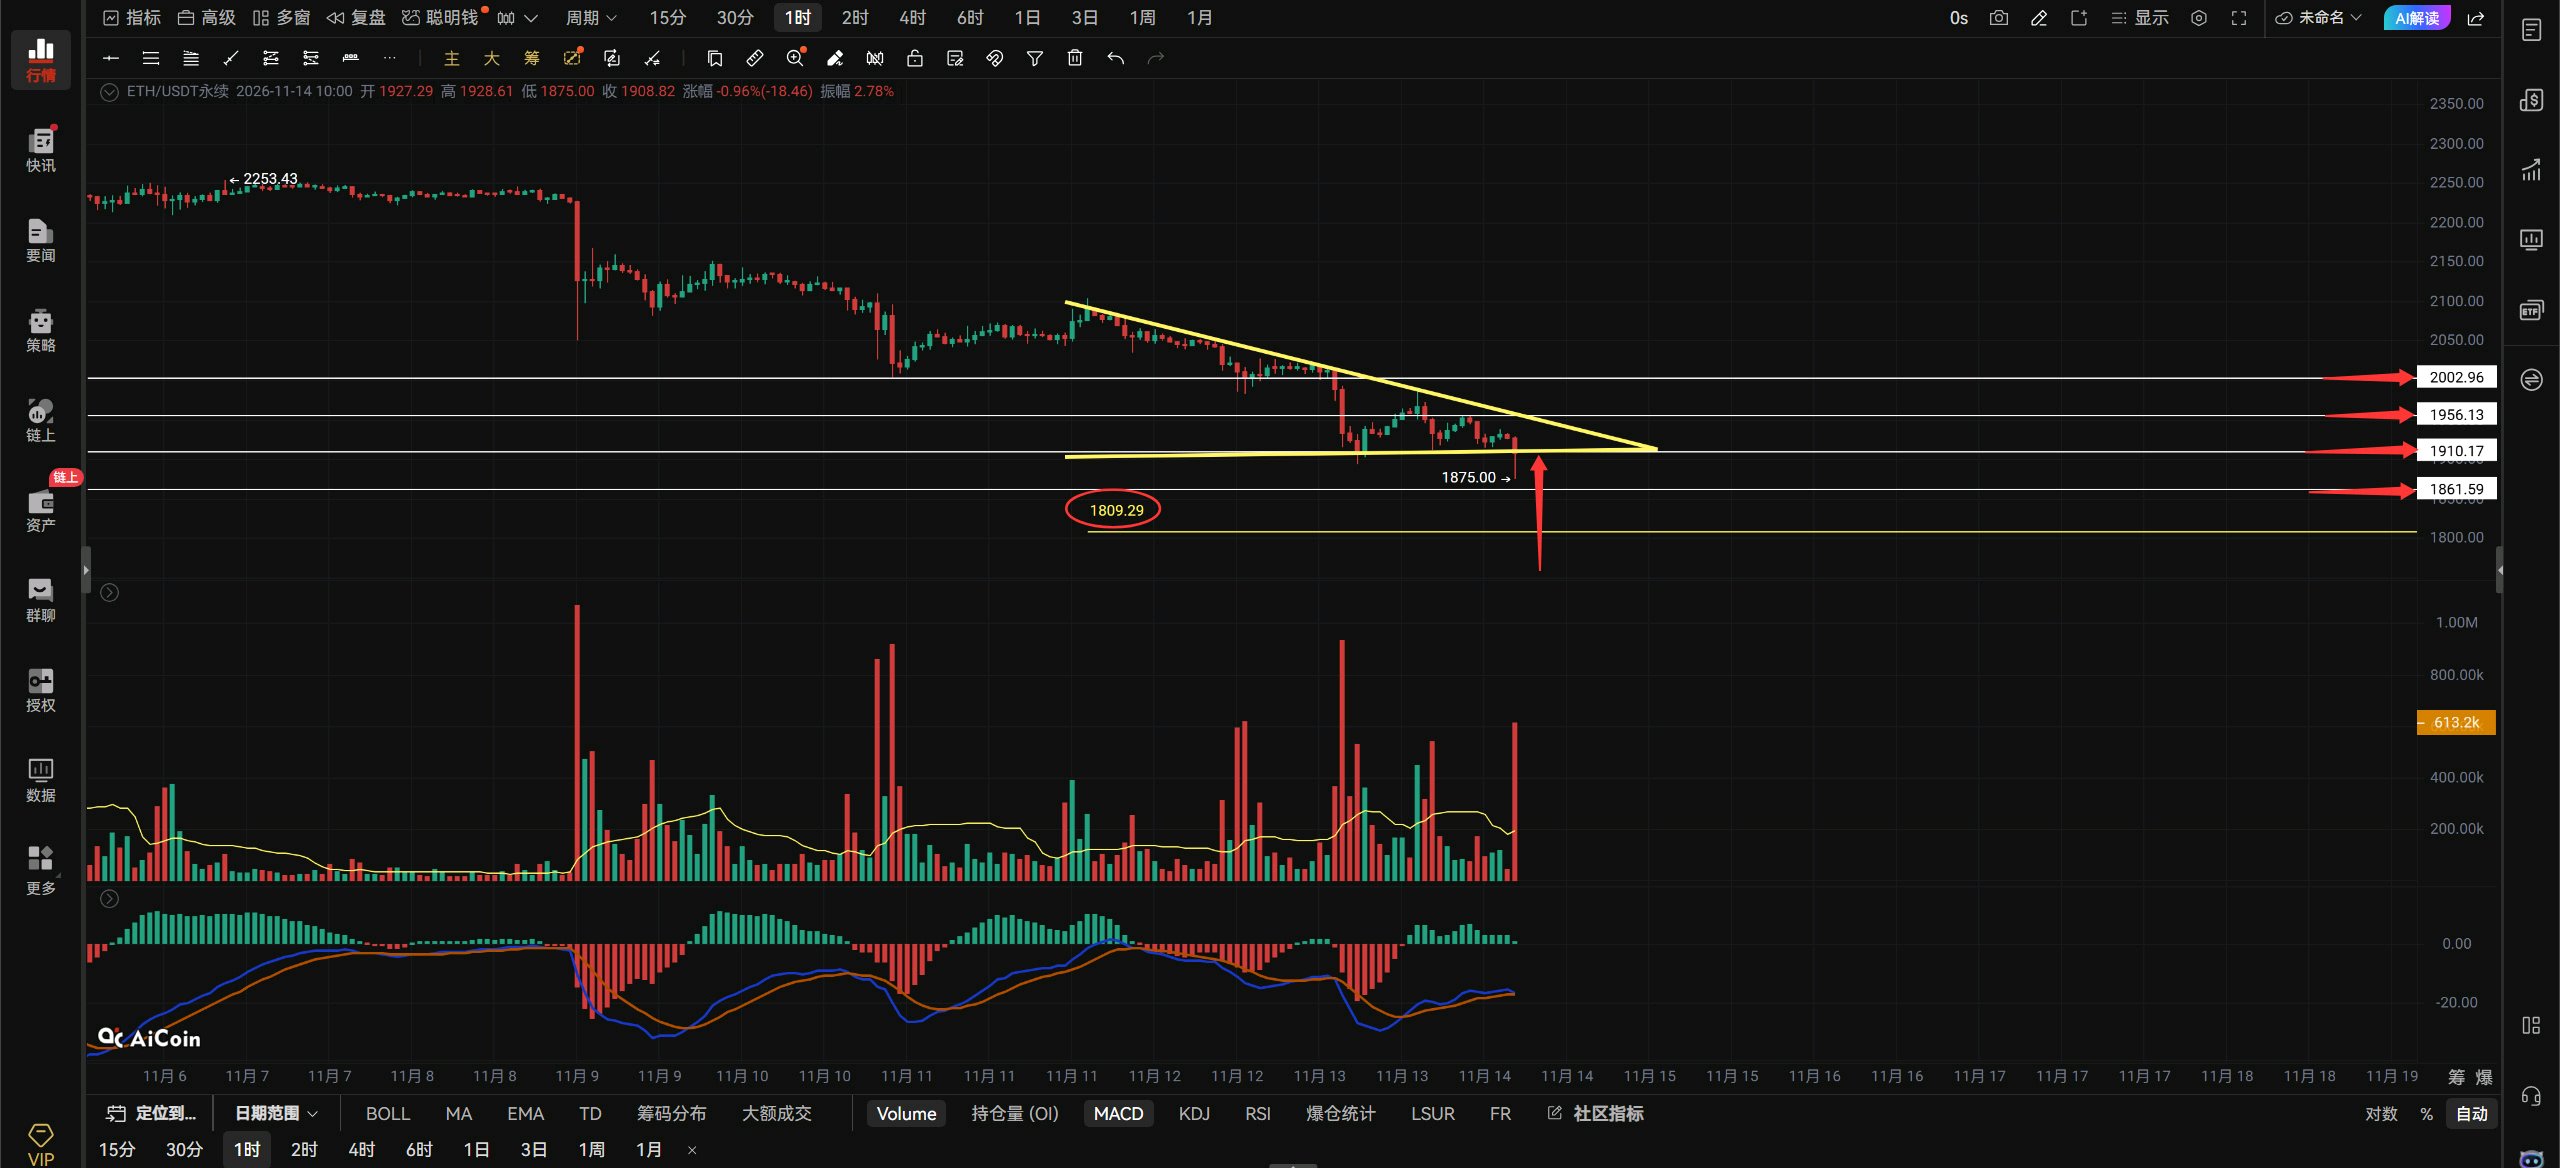
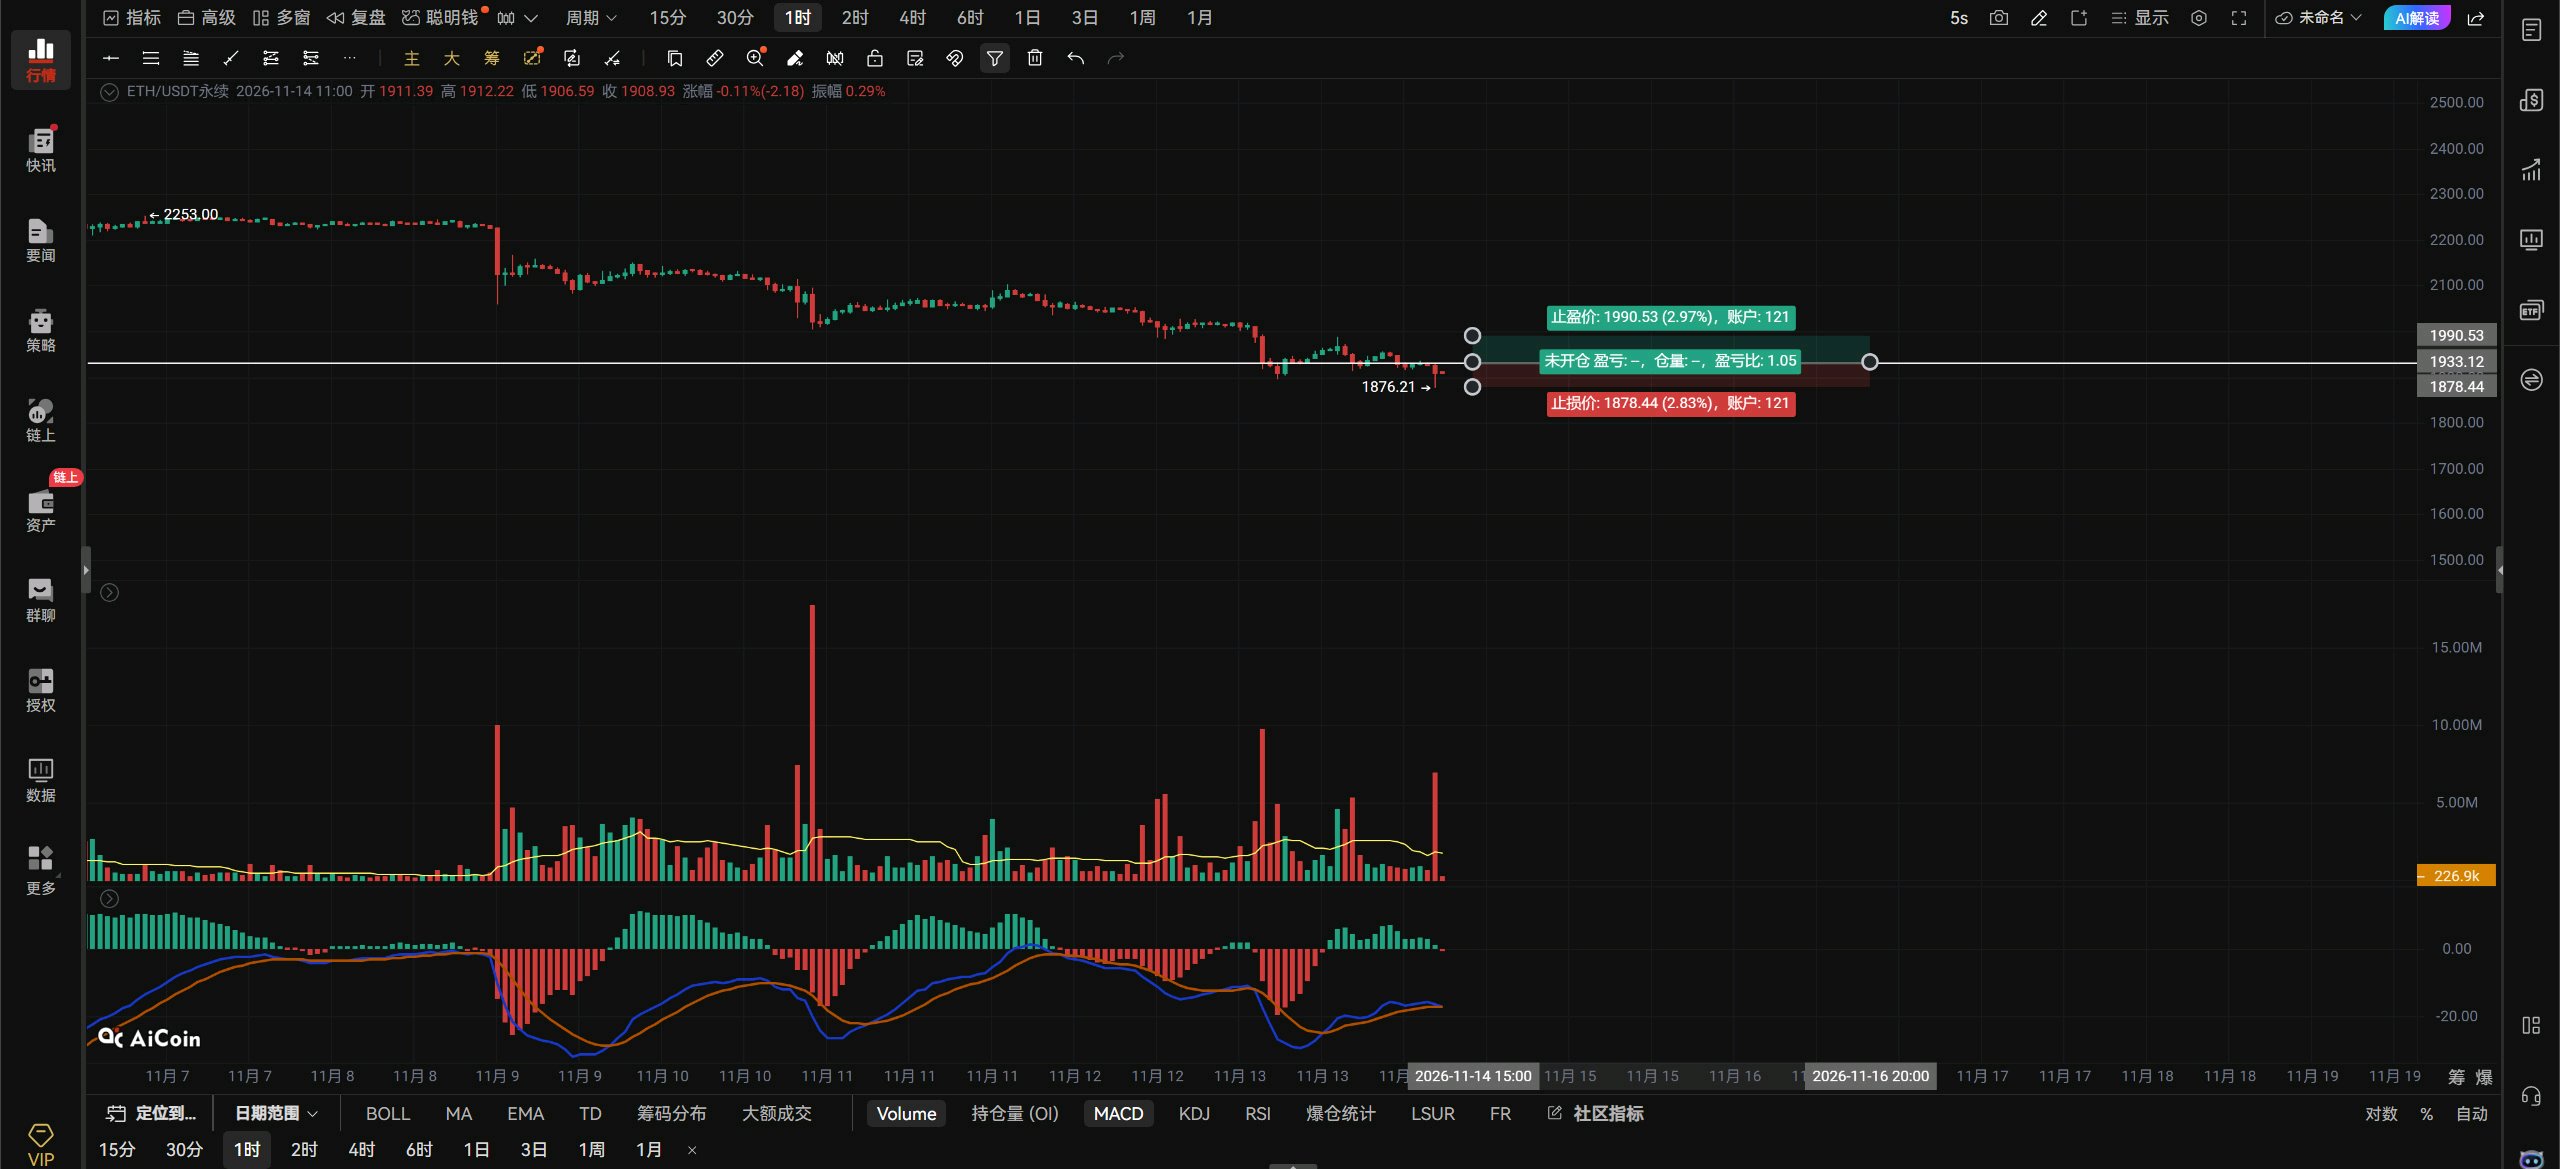
$BTCUSDT 11.14 Midday Market Outlook.🌿 $BTC Outlook: BTC made a low of 67454 yesterday and then started to rebound, filling the FVG gap above. However, the rebound failed to break through the resistance at 70224 or hold above the support at 69058. You could say this rebound was very weak. It then pulled back, broke below 69058 and the previous low, and just made another new low. That’s a new low every day! Now we’ll see whether BTC made this new low to sweep the liquidity at 67454 or is actually looking to continue falling. A sweep of the liquidity at 67454 would be acceptable; if it’s really heading down, then look to the 65924 support below. How can we tell whether it’s sweeping liquidity at 67454 or genuinely falling? Watch to see whether the hourly bearish candle currently in progress can reclaim and hold above 67454 after making a new low. If it can, that’s a liquidity sweep; if it can’t reclaim 67454, then it could fall further. Hopefully this is BTC’s last drop! If BTC can reclaim and hold above 67454, you can take a long for a rebound. Reclaiming and holding above 67454 would also set up a consolidation range between 67454 and 69058, with a chance to challenge 70224. If it can’t reclaim it, then things are looking pretty bleak. If BTC breaks above 67454 with volume, aggressive traders can chase the long on the right side. If it rebounds to 70224, take a short on the left side; use a stop-loss. If BTC breaks above 67454 and holds there on the hourly chart, look toward 69058–70224. If it can’t get above 67454, that’s no good. If BTC breaks below 67454 on the 4-hour chart, look down toward 65924–64421. Resistance above: 69058–70224–71904 Support below: 67454–65924–64421 #ByXIMPACT
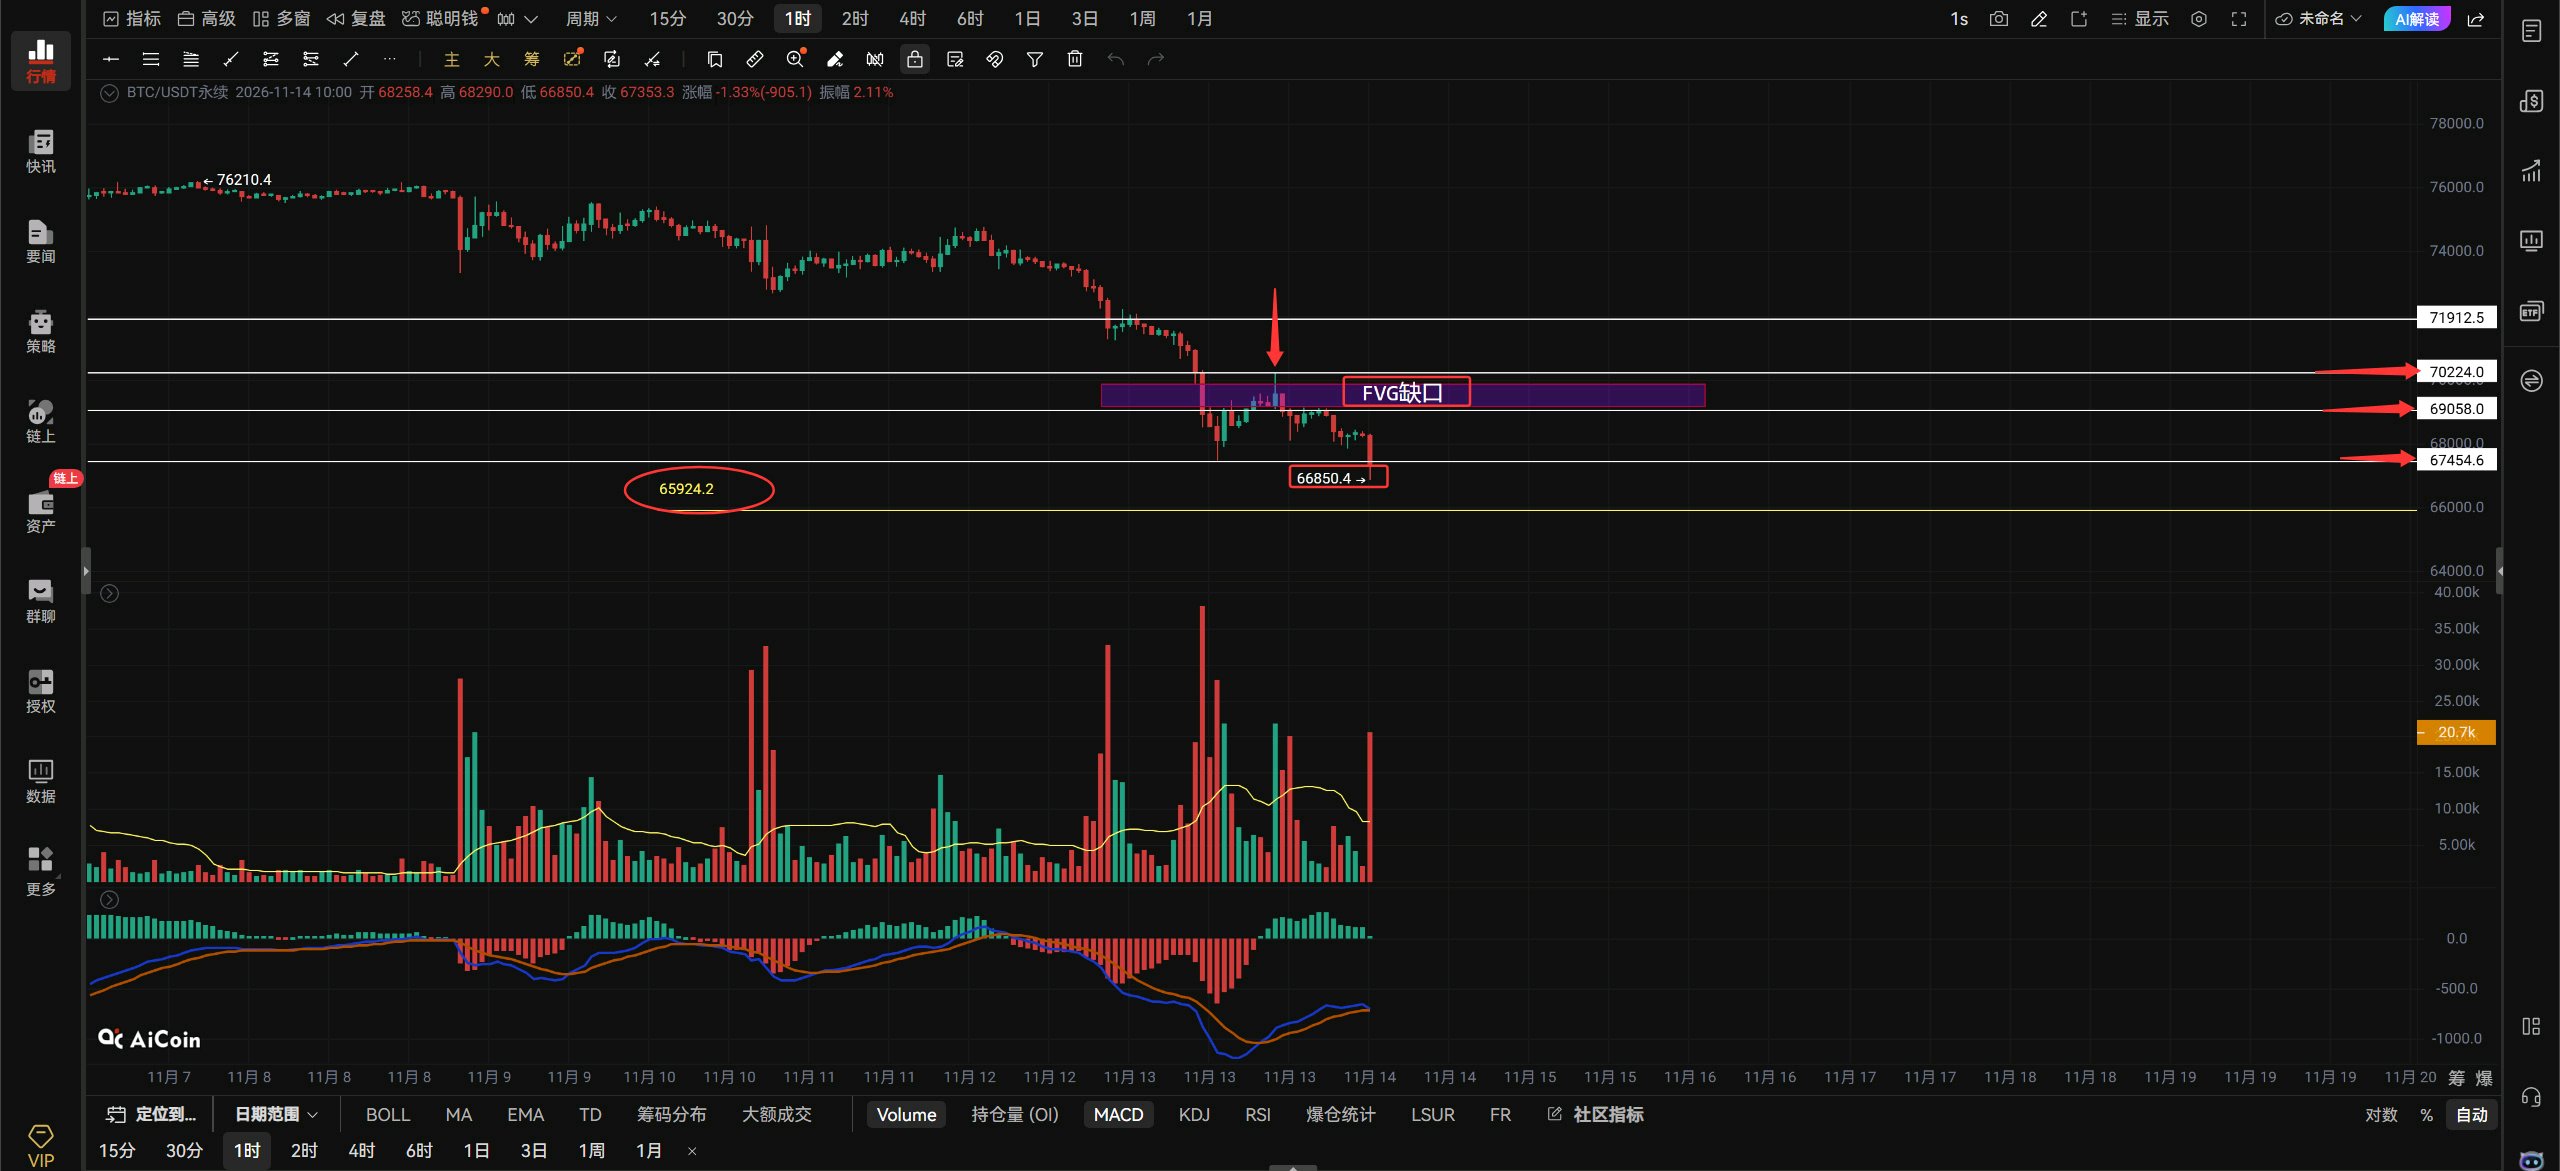
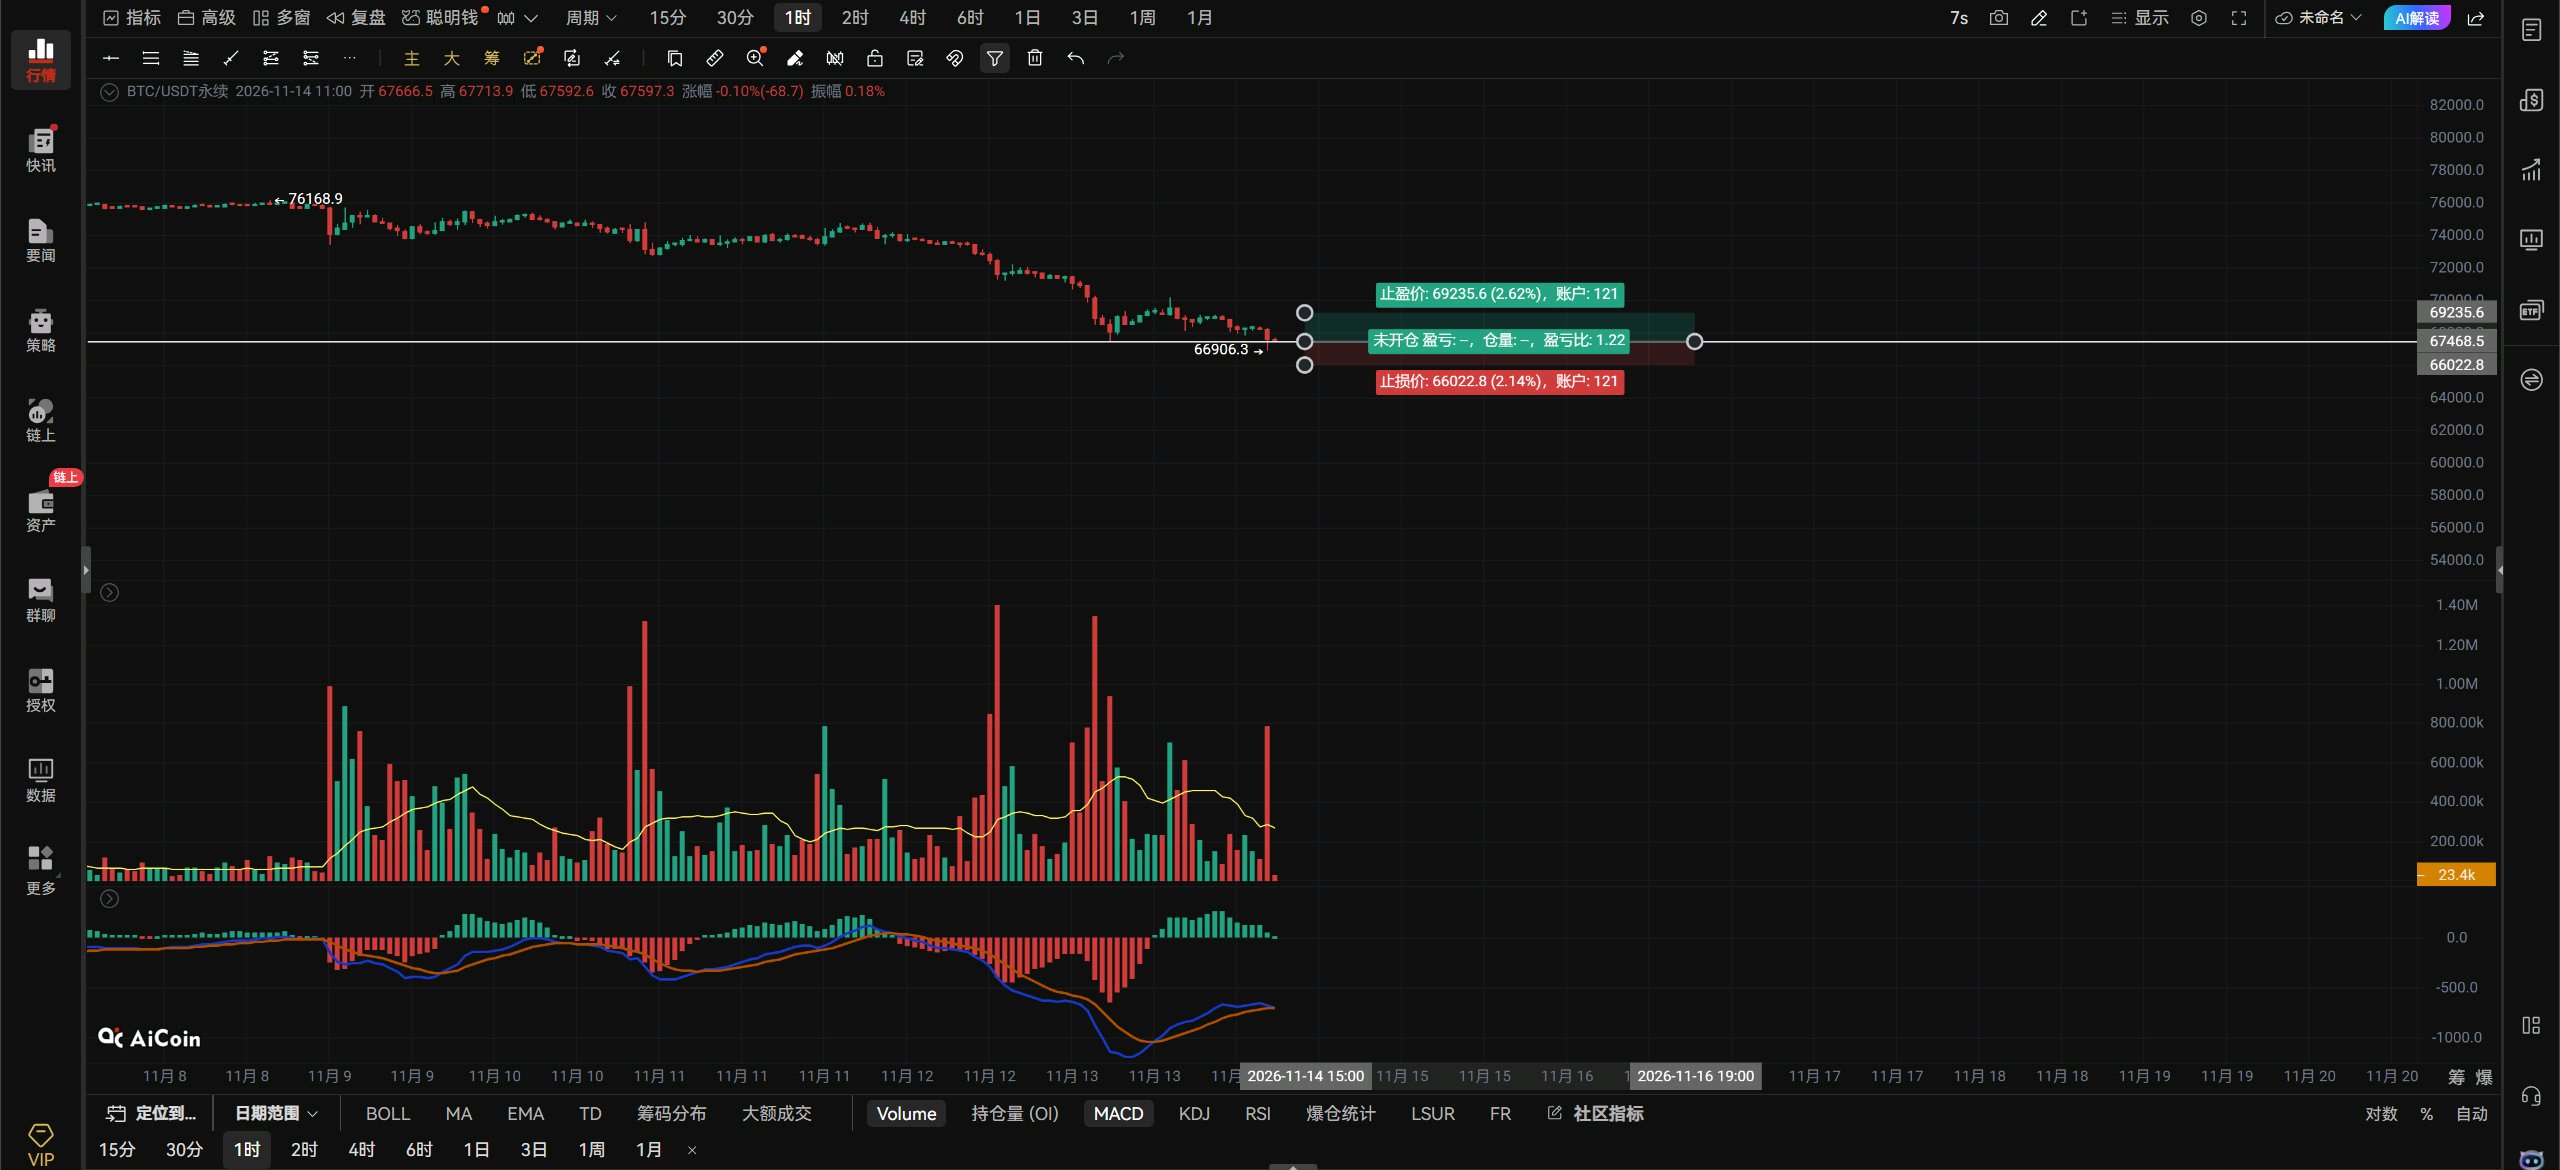
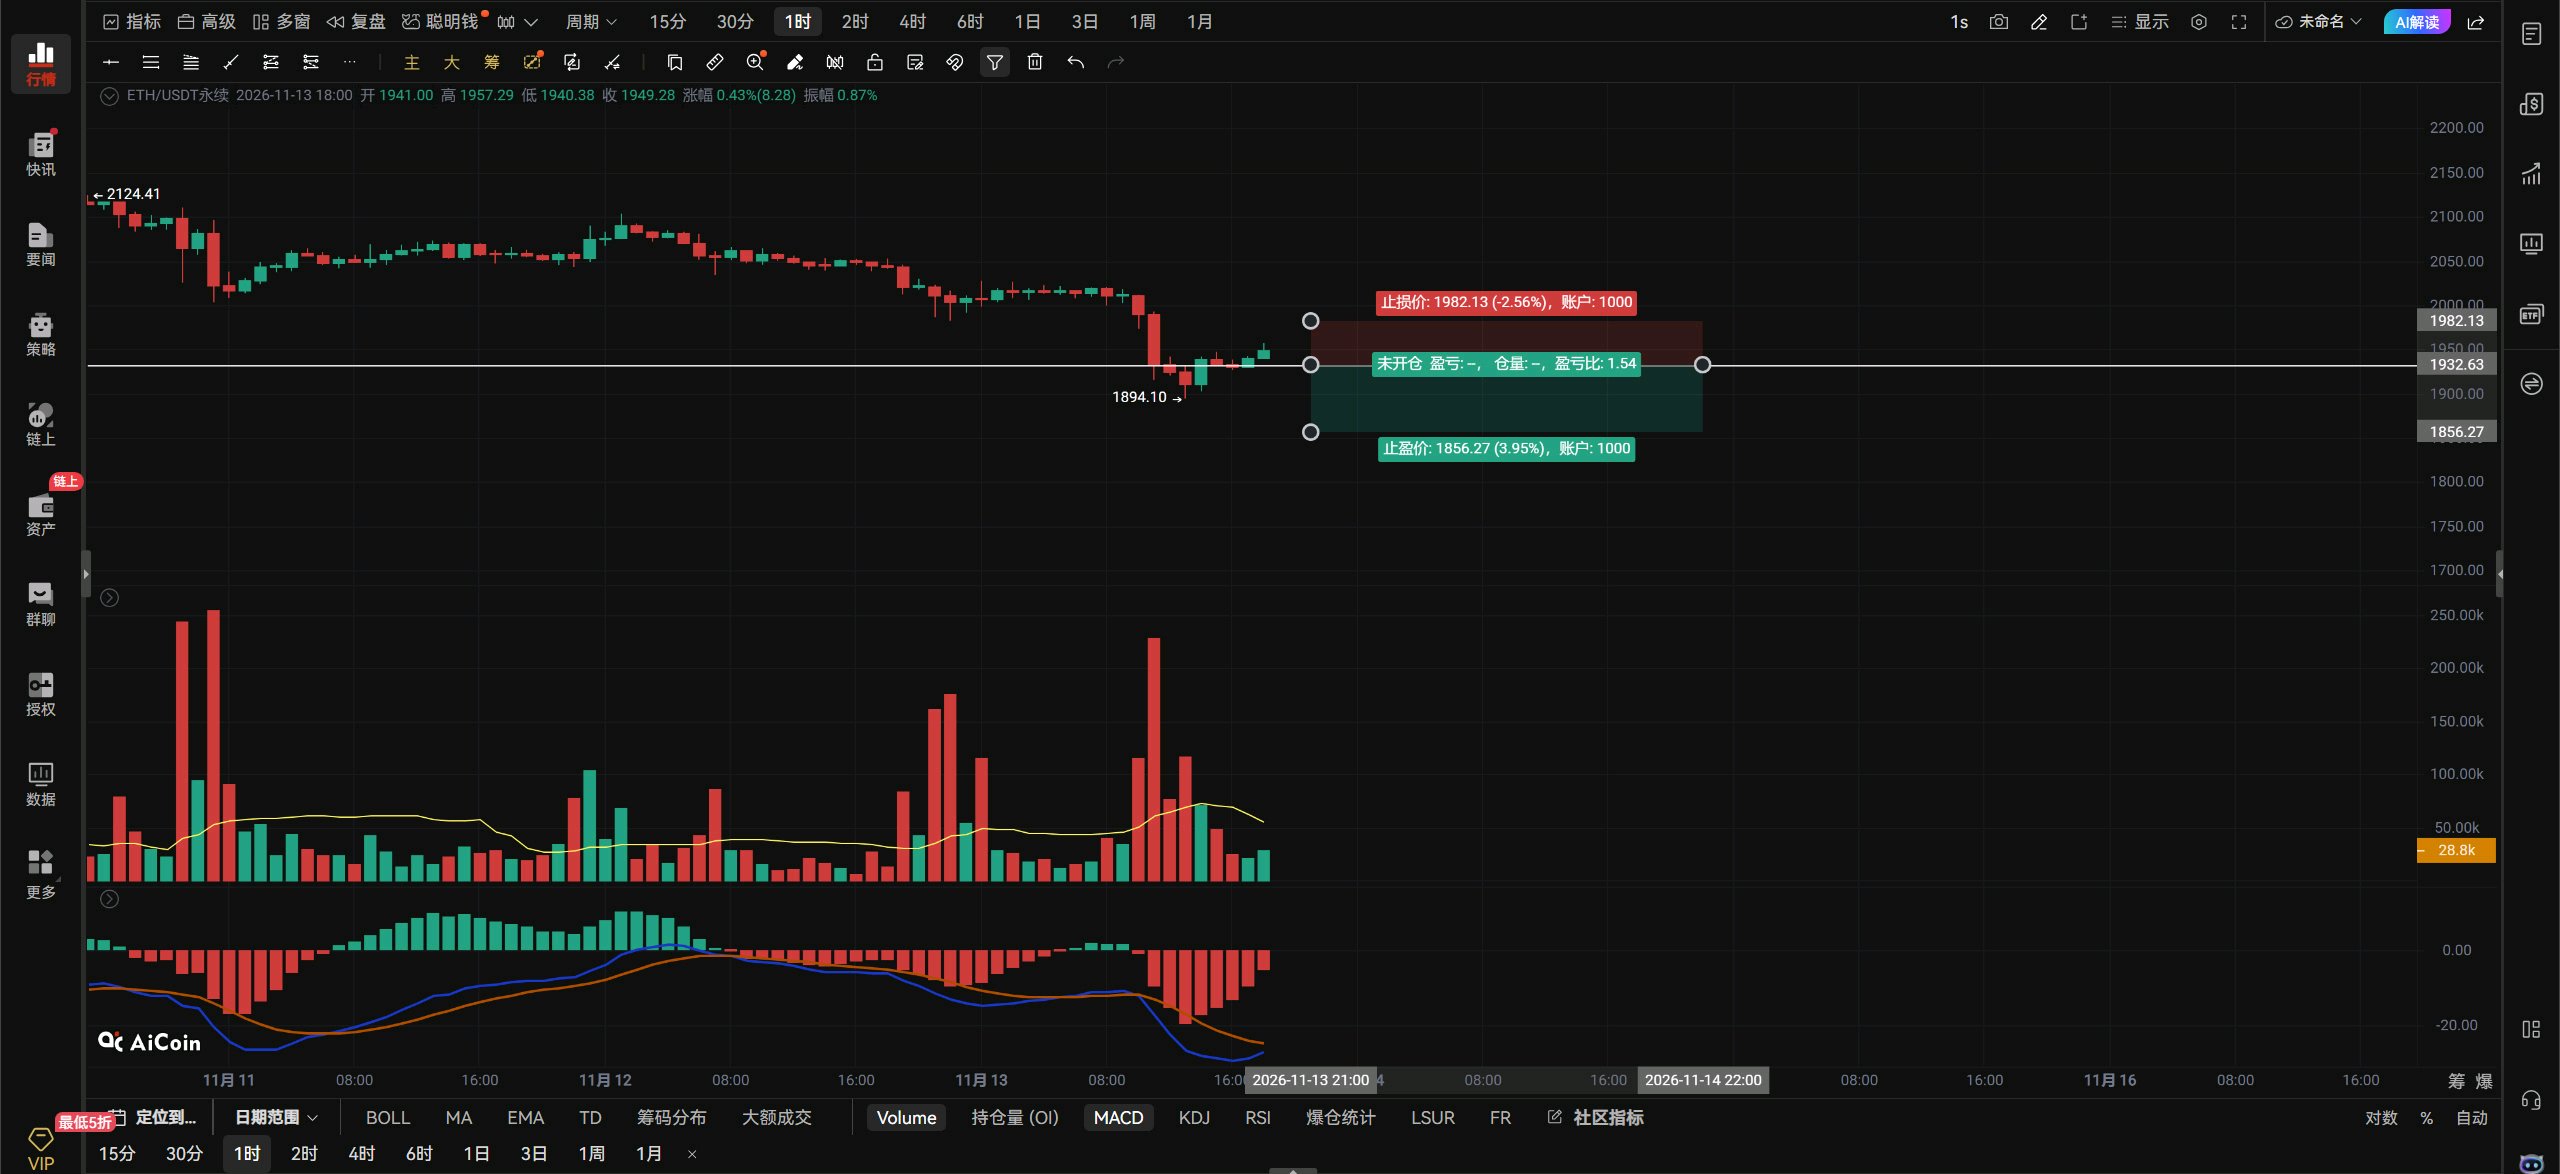
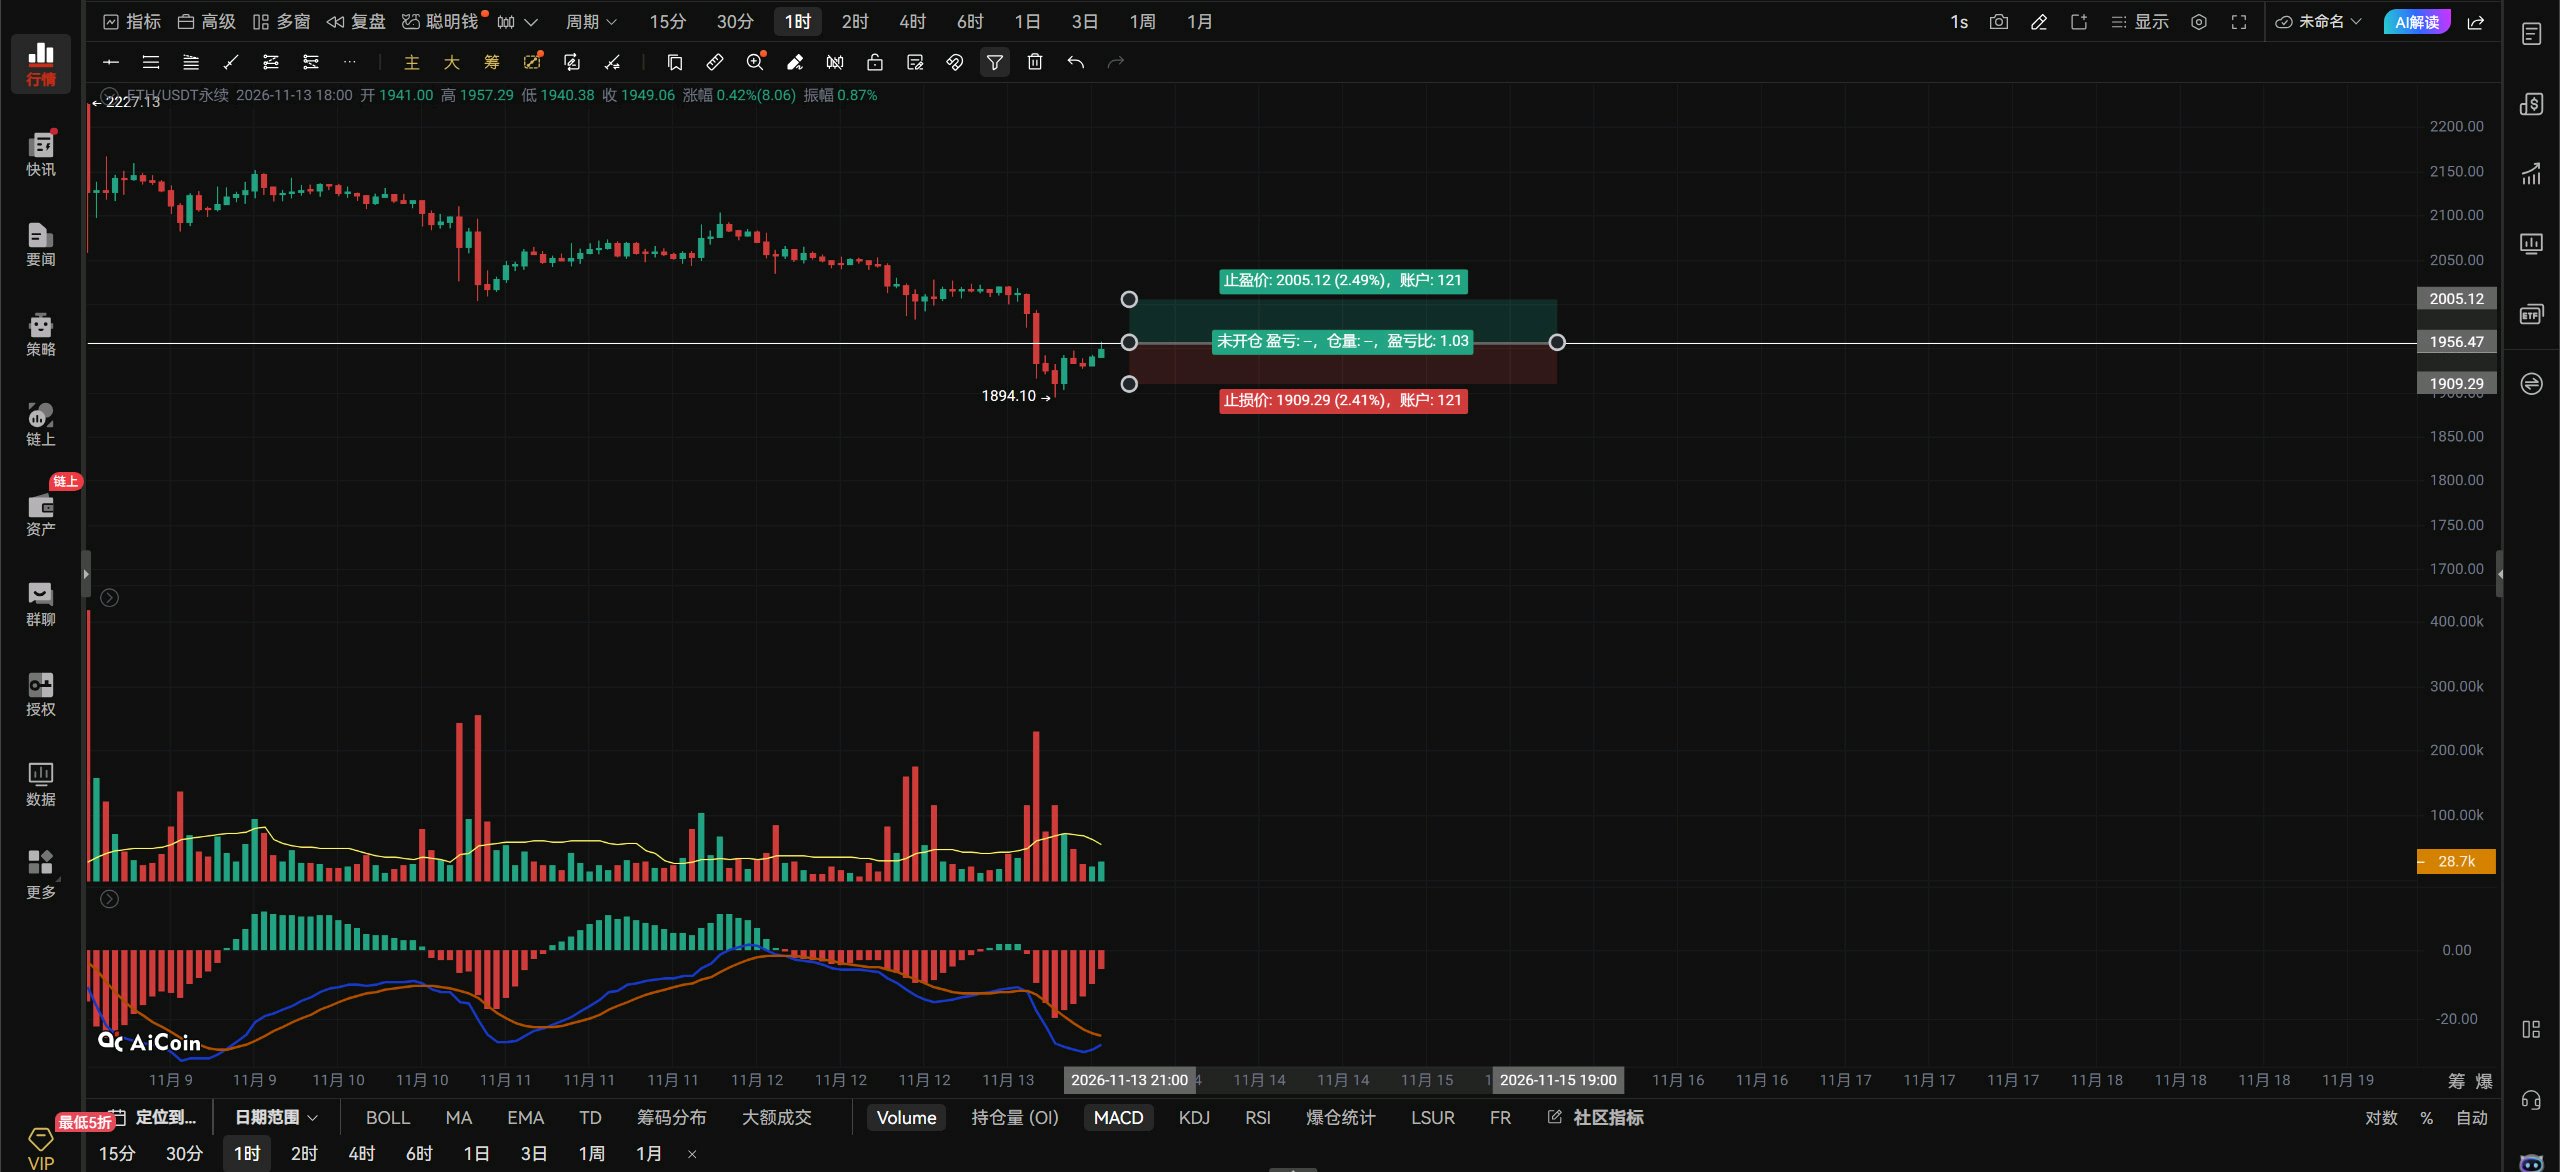
$ETHUSDT 夜の展望:11月13日。 イーサリアムは2000ドルを割り込み、割り込んだ後も全く反発がありませんでした。今の市場がいかに弱いか、買い手が完全に打ちのめされているかがわかります。現時点では、イーサリアムが下落を止め、上方向への反発を開始するには、1955ドルのレジスタンスを突破するしかありません。1時間足で2000ドルを突破して初めて上昇トレンドが開けます。もし1955ドルを突破できなければ、1955~1910ドルのレンジで停滞するのみです。もし1955ドルを突破できず、再び前回の安値を再テストする場合、高確率で割り込み、1861ドルの新安値を付けるでしょう。白枠でマークされた位置を見ると、イーサリアムはいくらか反発しましたが、ビットコインと同様に出来高を伴わない反発に過ぎません。出来高の少ない反発は、燃料がわずかしか残っていない車のようなもので、どれだけ走れるでしょうか?イーサリアムについては、2000ドルという水準を覚えておいてください。2000ドルを突破できて初めて、上昇がスムーズに進みます。2000ドルを突破できなければ、いつでも前回の安値を再テストする可能性があり、その安値も割り込むことになります。 イーサリアムについて、1955ドルを出来高を伴って突破した後に右サイドでロング、1932ドルを出来高を伴って割り込んだ後に右サイドでショートを検討してください。出来高の変化に注意し、損切りを設定してください。 イーサリアムの1時間足では、1955ドル以上を維持すれば、2000~2046ドルを目指す動きとなります。 4時間足では、1932ドルを割り込めば、1894~1861ドルを目指す動きとなります。 イーサリアムの4時間足は現在、チャネル内を下落トレンドで推移しています。4時間足で下落を止めるには、チャネルの上限である2000ドルを上抜ける必要があります。4時間足で2000ドルを突破して初めて下落が止まり、反発を開始できます。2000ドルを突破できなければ、4時間足チャネルの下限である1851ドルで下落が止まるかどうかを見極める必要があります!4時間足が2000ドルのチャネルを上抜ければ、白枠で示された位置でモーニングスター(明けの明星)パターンが形成されます。つまり、4時間足が2000ドルを突破して初めて、イーサリアムは下落を止めて反発できるのです。2000ドルを突破できなければ、4時間足レベルで価格チャネル内での停滞が続くでしょう。米国株式市場の寄り付きが下落をさらに拡大させるかどうかは分かりませんが、下落が続くようなら、もう手を出さない方が賢明です。以上、会議終了。ByXIMPACT
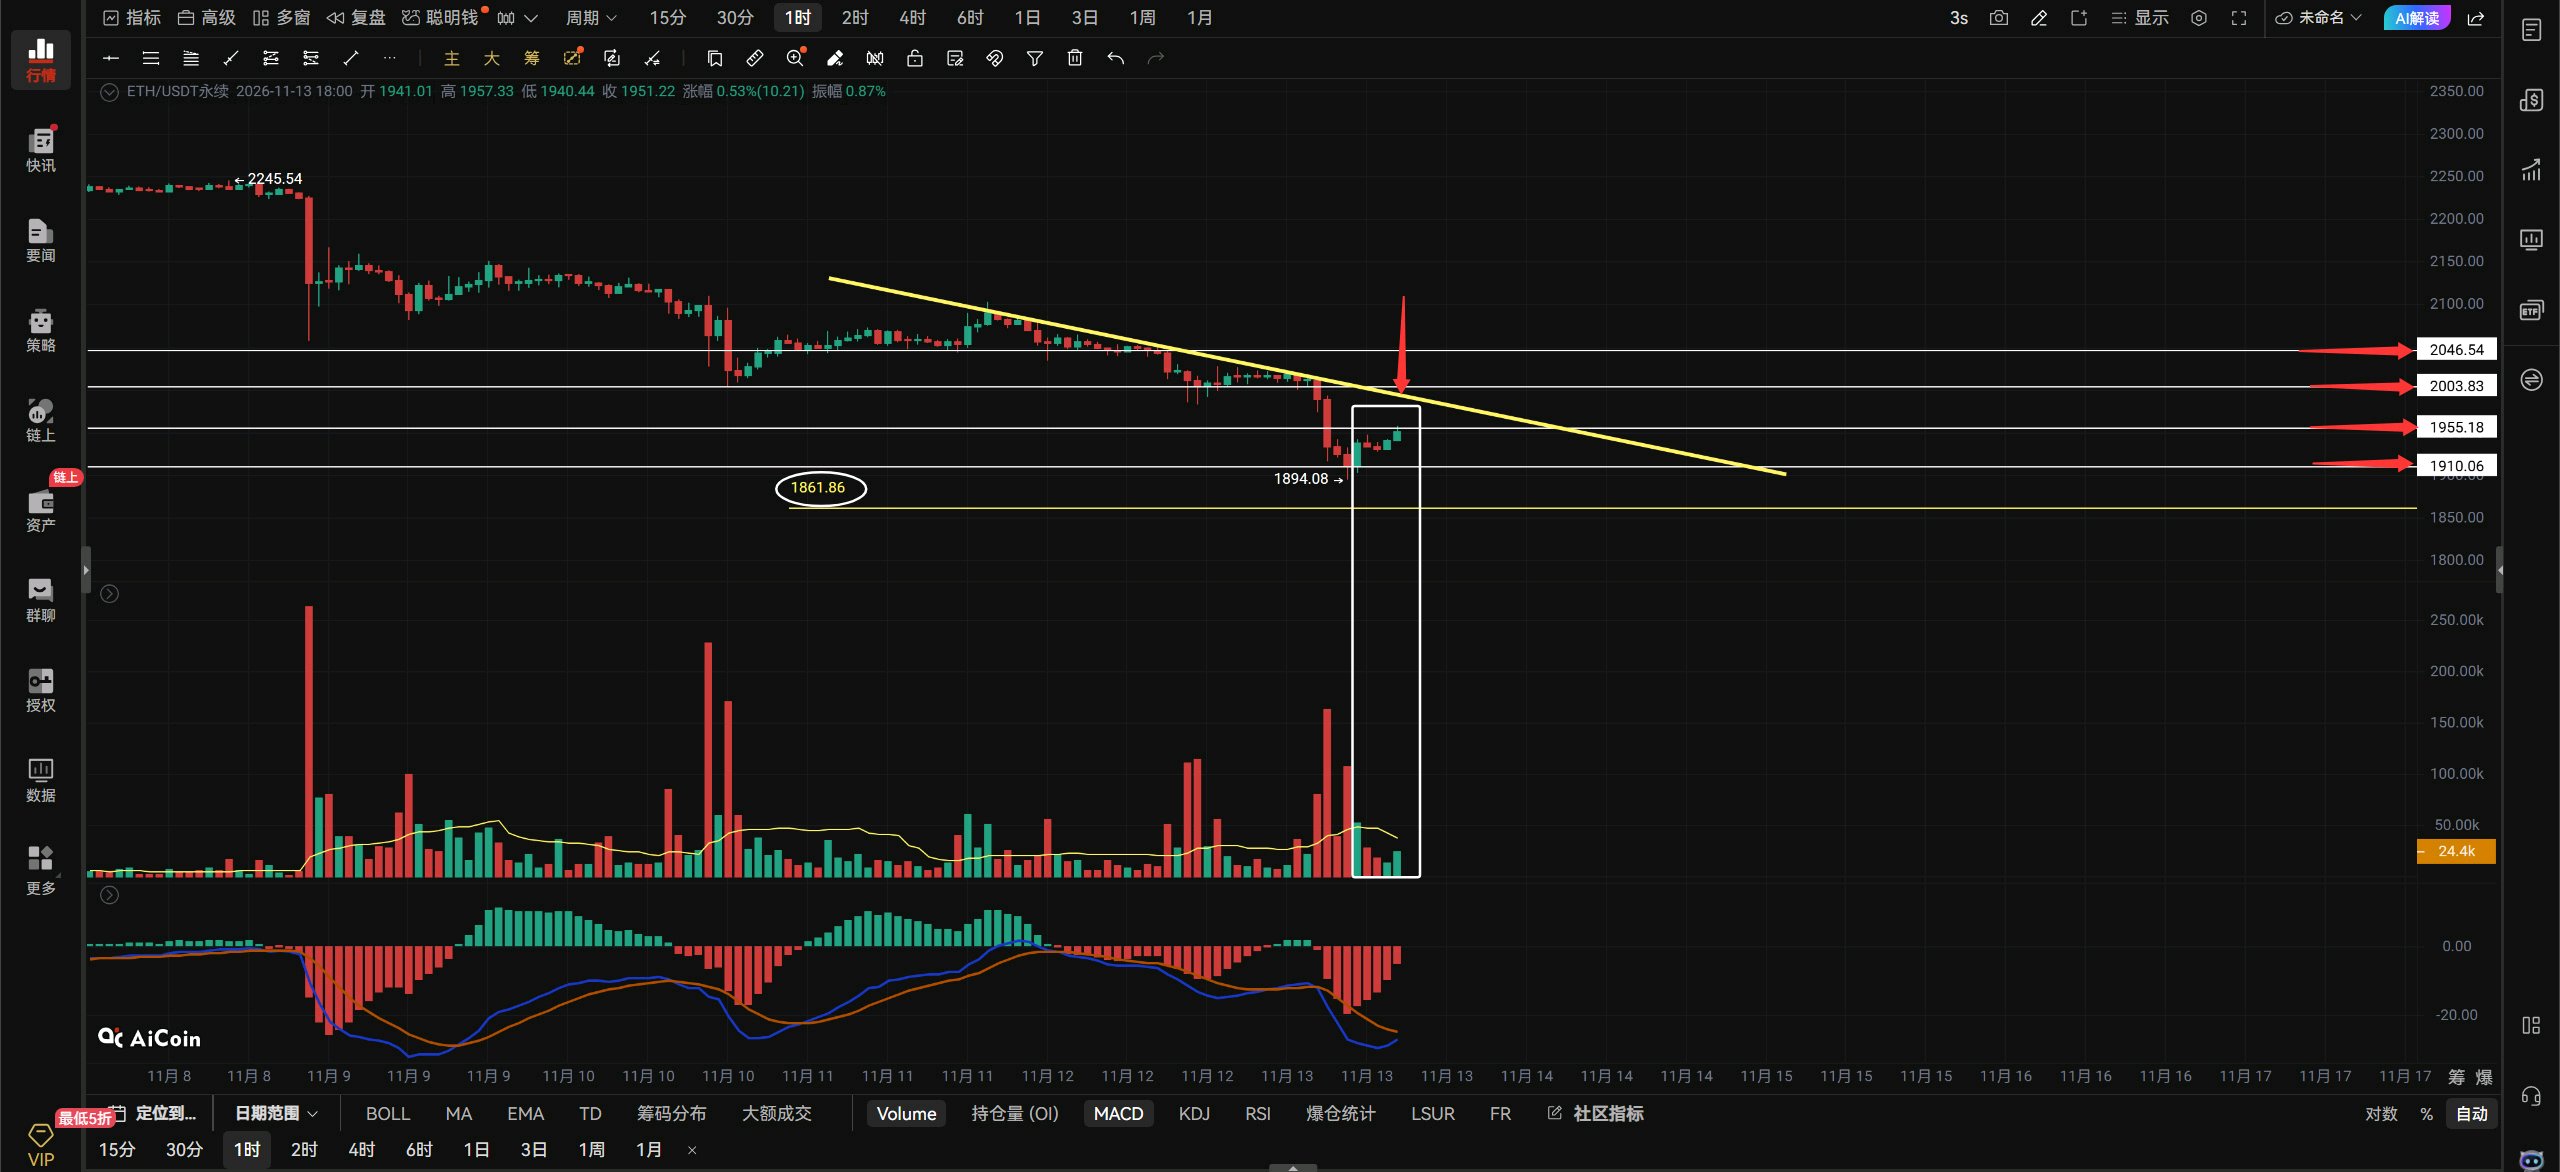
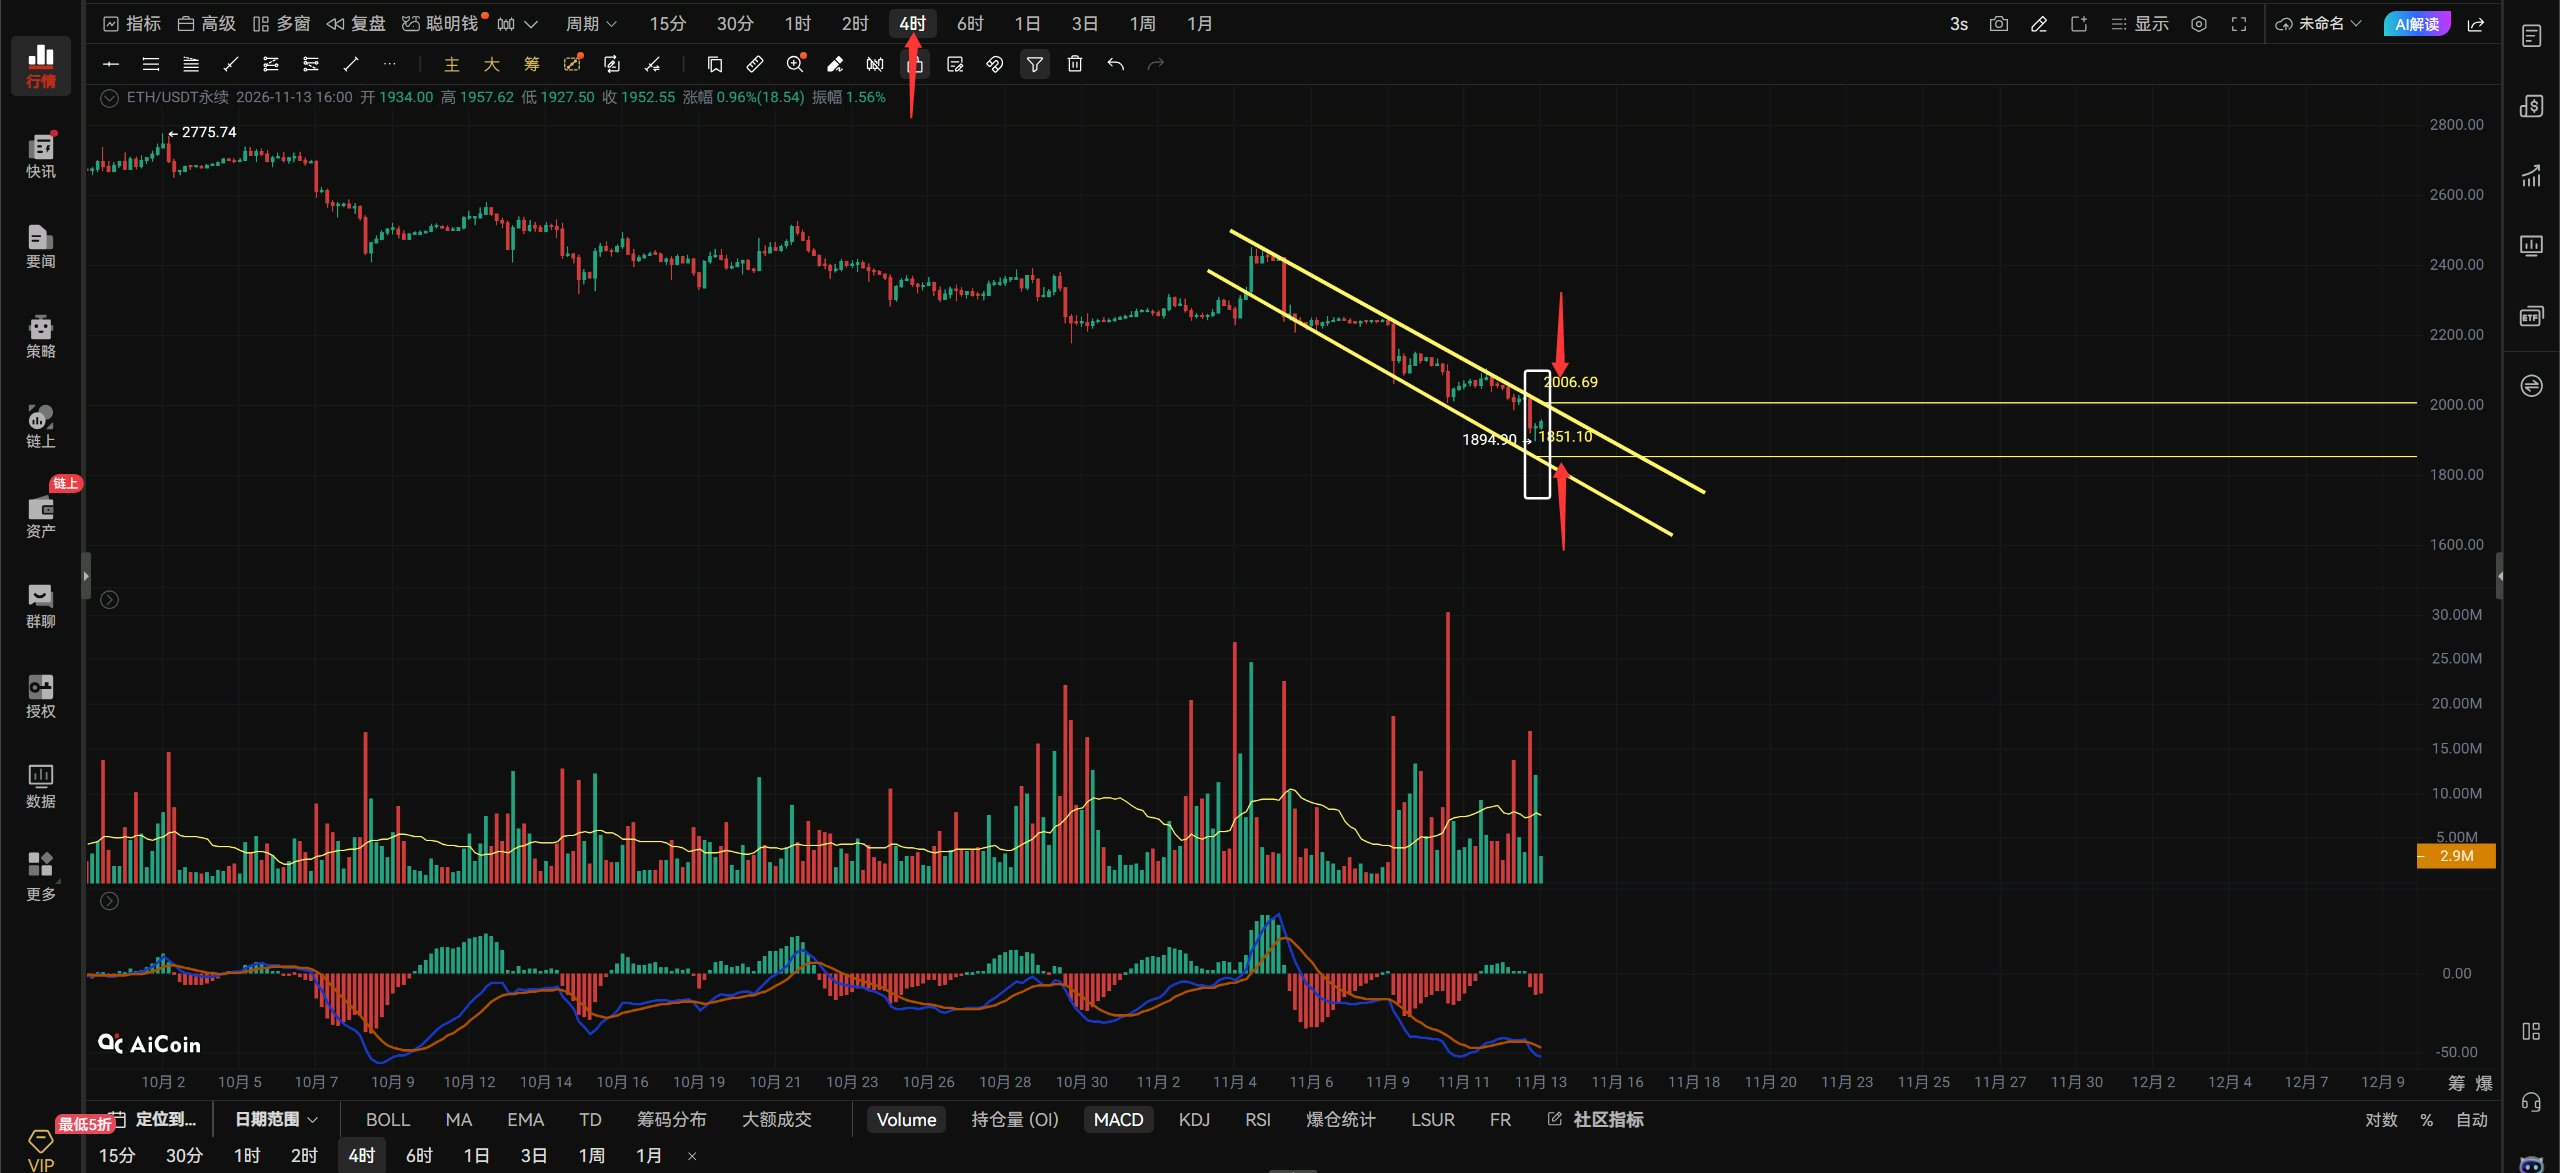
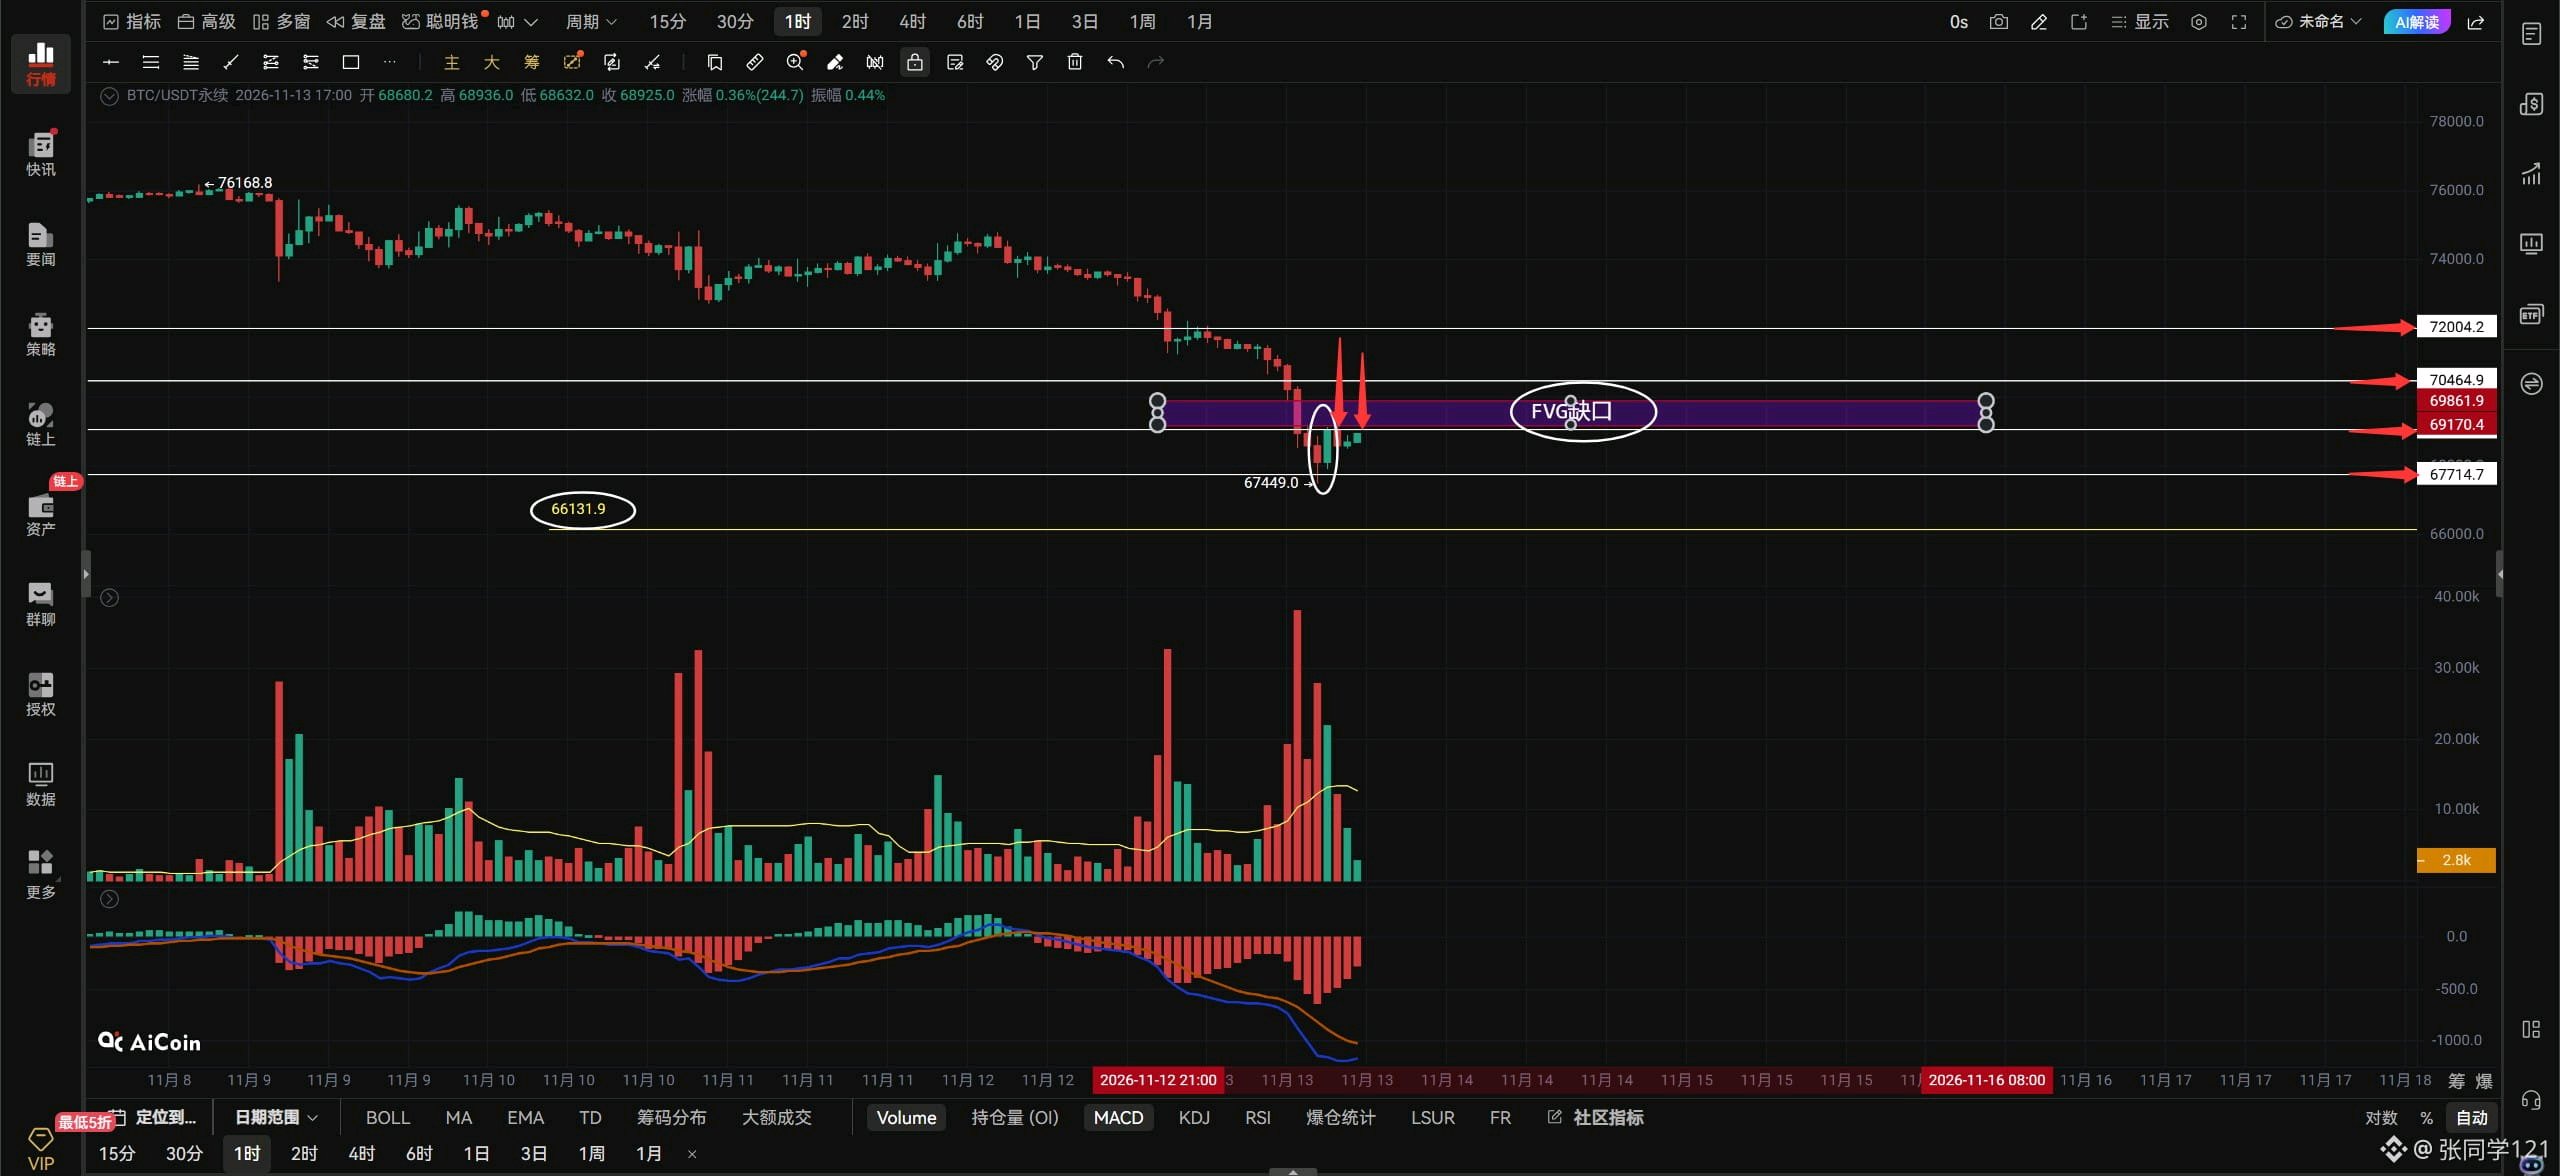
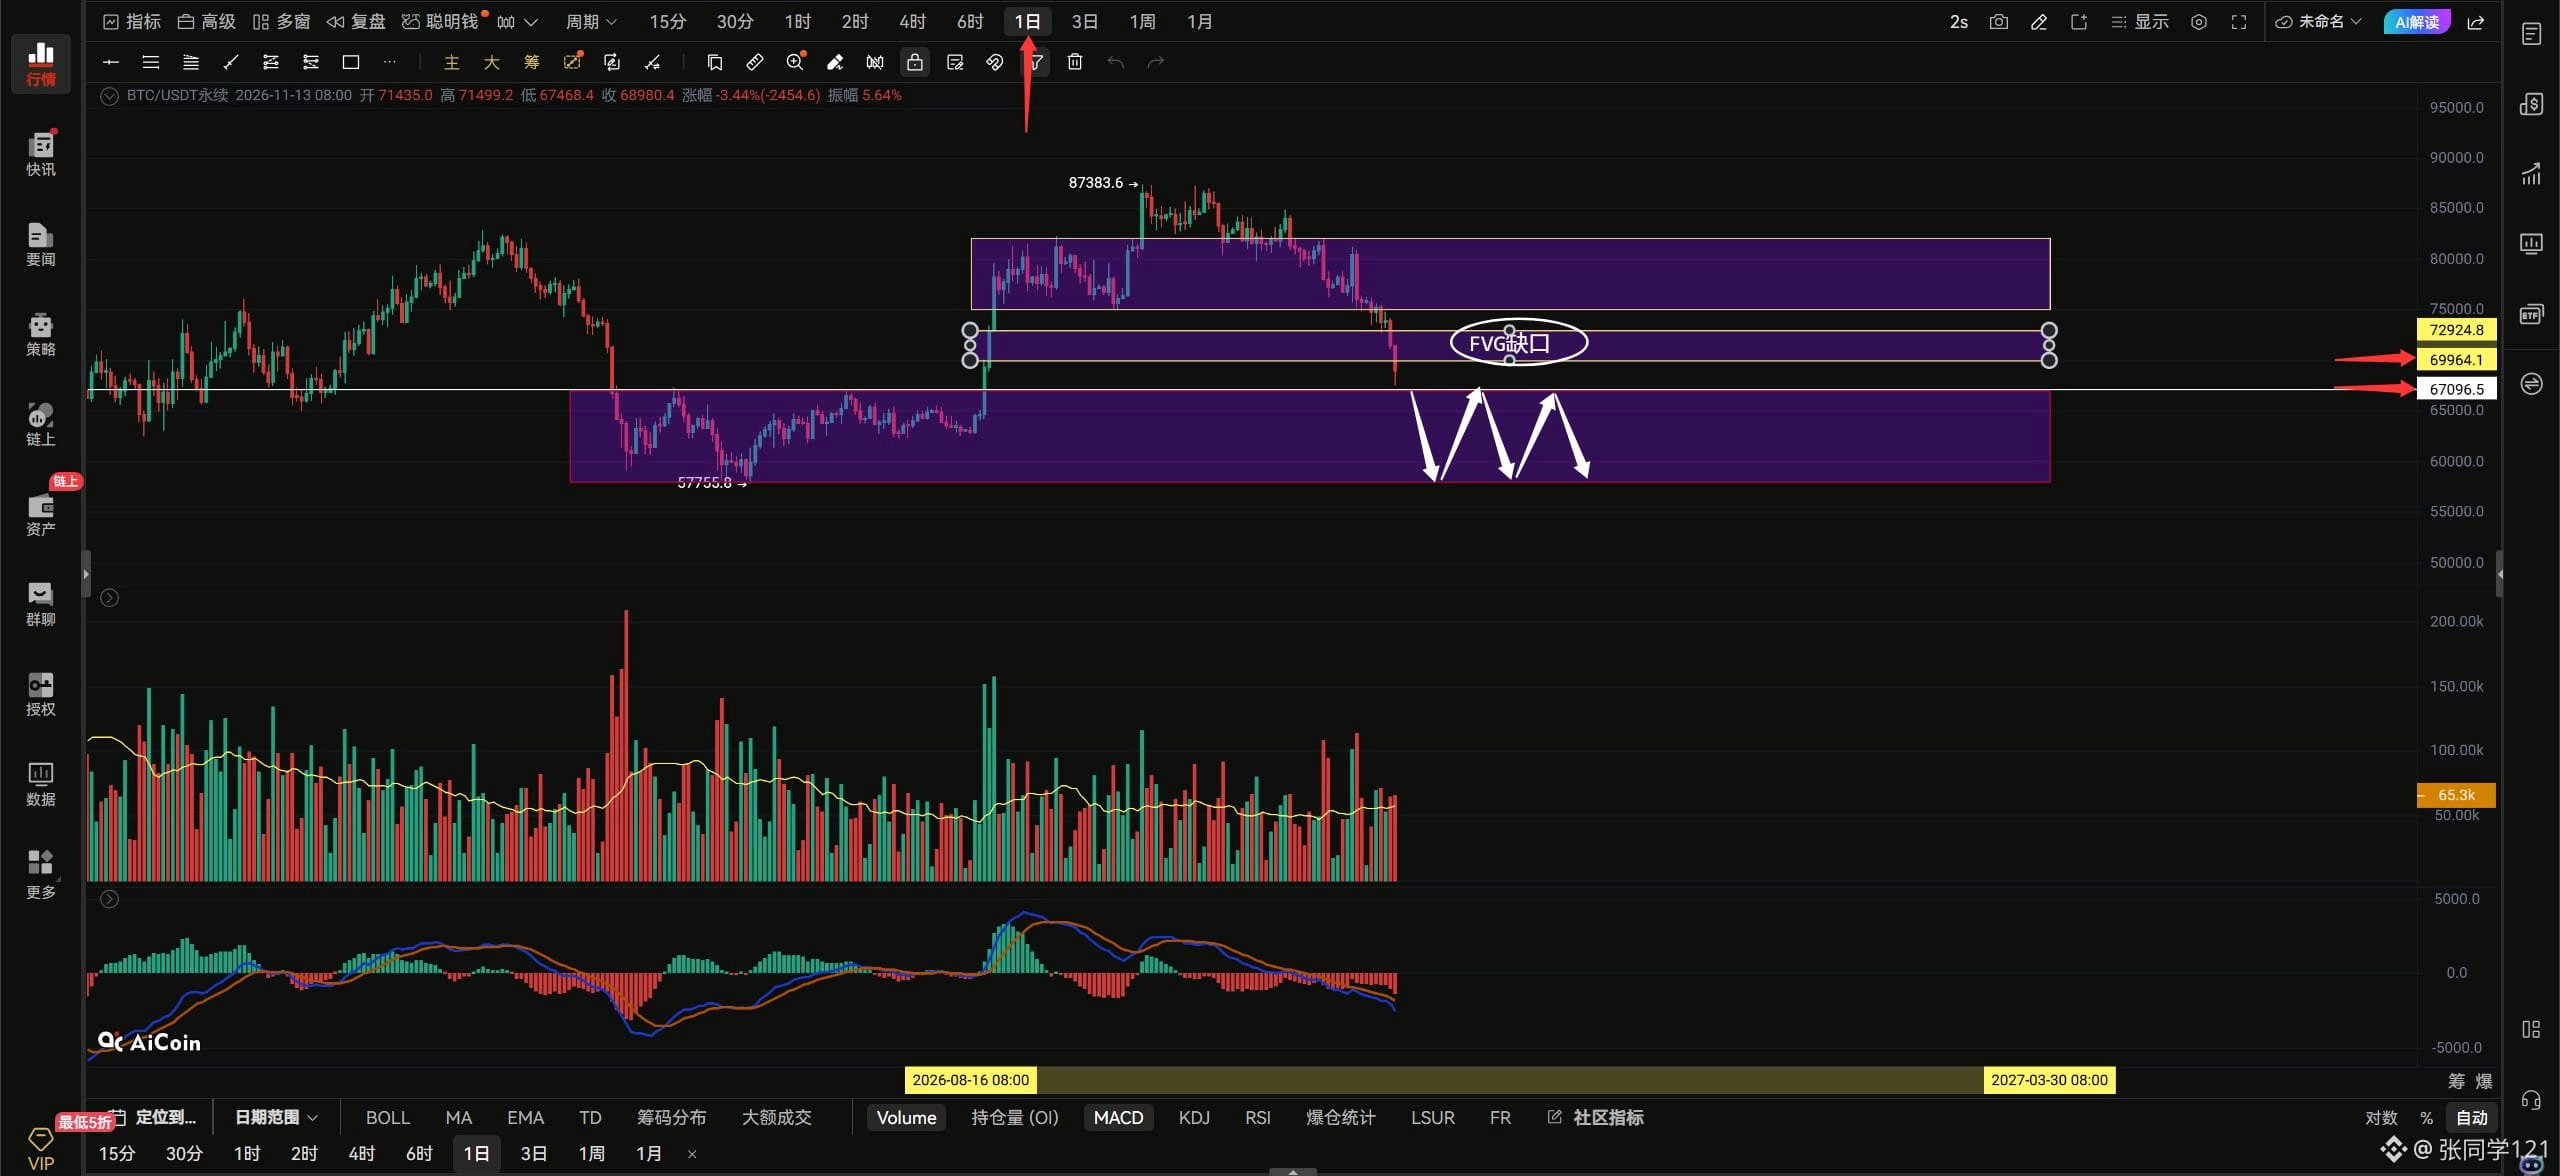
BTCUSDT $BTC 11/13 夕方の見通し。 ビットコインの今回の急落には、誰もが呆然とし、混乱させられましたね。途方に暮れていますか?今はロングを入れるのが怖いですか?弱気にならないで。ビットコインがゼロにならないと信じている限り、分割で現物を買い続けてください。ビットコインはもう底を打ったのでしょうか?下の白枠で囲ったエリアに、最初の底打ちのシグナルが現れました。強気の包み足パターン(bullish engulfing)です。これは、現在のタイムフレームで反発の可能性があることを示唆しています。上の赤い矢印が示すように、すでに2回反発していますが、69,000ドルのレジスタンスラインを突破できていません。つまり、この反発には勢いがなく、大口の買い手が完全には参入していないということです。そのため、この反発は強気相場の到来というよりは、ショート筋の利益確定による自然な戻りとして捉えるべきでしょう。強気の包み足が出たからといって、慌てて飛びつかないように。価格が上のレジスタンスを突破できるか確認してください。69,000ドルを突破して維持できなければ、前回の安値である64,779ドルへの再テストに警戒が必要です。 ビットコインは、時間足レベルのダウントレンドが一時停止したと言えるまで、そして70,464ドルへの反発のチャンスを作るまで、69,000ドルを突破する必要があります。もし69,000ドルを突破できなくても、67,449ドルから69,000ドルのレンジで横ばいを維持し、続落しなければ、それはそれで良い結果と言えます。今回の下落は急激すぎたため、1時間足チャートには新たなFVG(公正価値ギャップ)が生じています。もしビットコインが69,000ドルを回復できれば、その上のFVGギャップ(69,170〜69,861ドル付近)を埋めに行く必要があるでしょう。ビットコインは現在反発していますが、下の出来高は正直期待外れで、出来高を伴わない反発です。忘れないでください。もし69,000ドルを突破できなければ、底打ちとは言えず、反発もできません。私の予測では、ビットコインにはあと一度の下落があると思っています。最終的な下げ幅がどこまでかは分かりませんが、66,000ドルか65,000ドルかもしれません。様子見ですね。個人的な見解としては、ビットコインは下がるだけ下がったと思っています。仮に続落したとしても、せいぜいあと2,000ドル程度でしょう。だから怖がる必要はありません。シグナルが出れば、私はロングで入ります。皆さんもビットコインでロングを狙うなら、前回の安値を再テストし、改めて底打ちシグナルが出たのを確認してから入るのが良いでしょう。 もしビットコインが大きな出来高を伴って69,000ドルを突破したら、強気派のトレーダーは押し目で追随してロングを狙っても良いでしょう。もし大きな出来高を伴って68,541ドルを割り込み、反発してもそこを回復できなければ、右側でショートを追うこと。損切りは忘れずに。 ビットコインが1時間足で69,000ドルを突破して維持できれば、70,464〜72,000ドルを目指す展開になります。69,000ドルを超えられなければ、厳しい状況です。 もし4時間足で67,714ドルを割り込んだら、66,131〜64,753ドル方向への下落を警戒してください。 ビットコインの日足チャートのFVGギャップも完全に埋まりました。ちょっと行き過ぎですね😓。次は、ビットコインが日足のFVGギャップを回復し、その中で推移できるかどうかに注目です。FVGギャップの中に回帰する価格レベルは70,000ドルです。そこまで戻して初めて、ビットコインの日足は底を打ったと言えるでしょう。一方で、日足で続落し、67,000ドルのサポートラインを割り込めば、67,000〜58,000ドルの保ち合いレンジに戻ることになります。正直なところ、どこで底を打つかは分かりません。今予測しても単なる当て推量になってしまいます。ビットコインの動きを待って、確認してから判断する方が賢明です。以上です。 ByXIMPACT
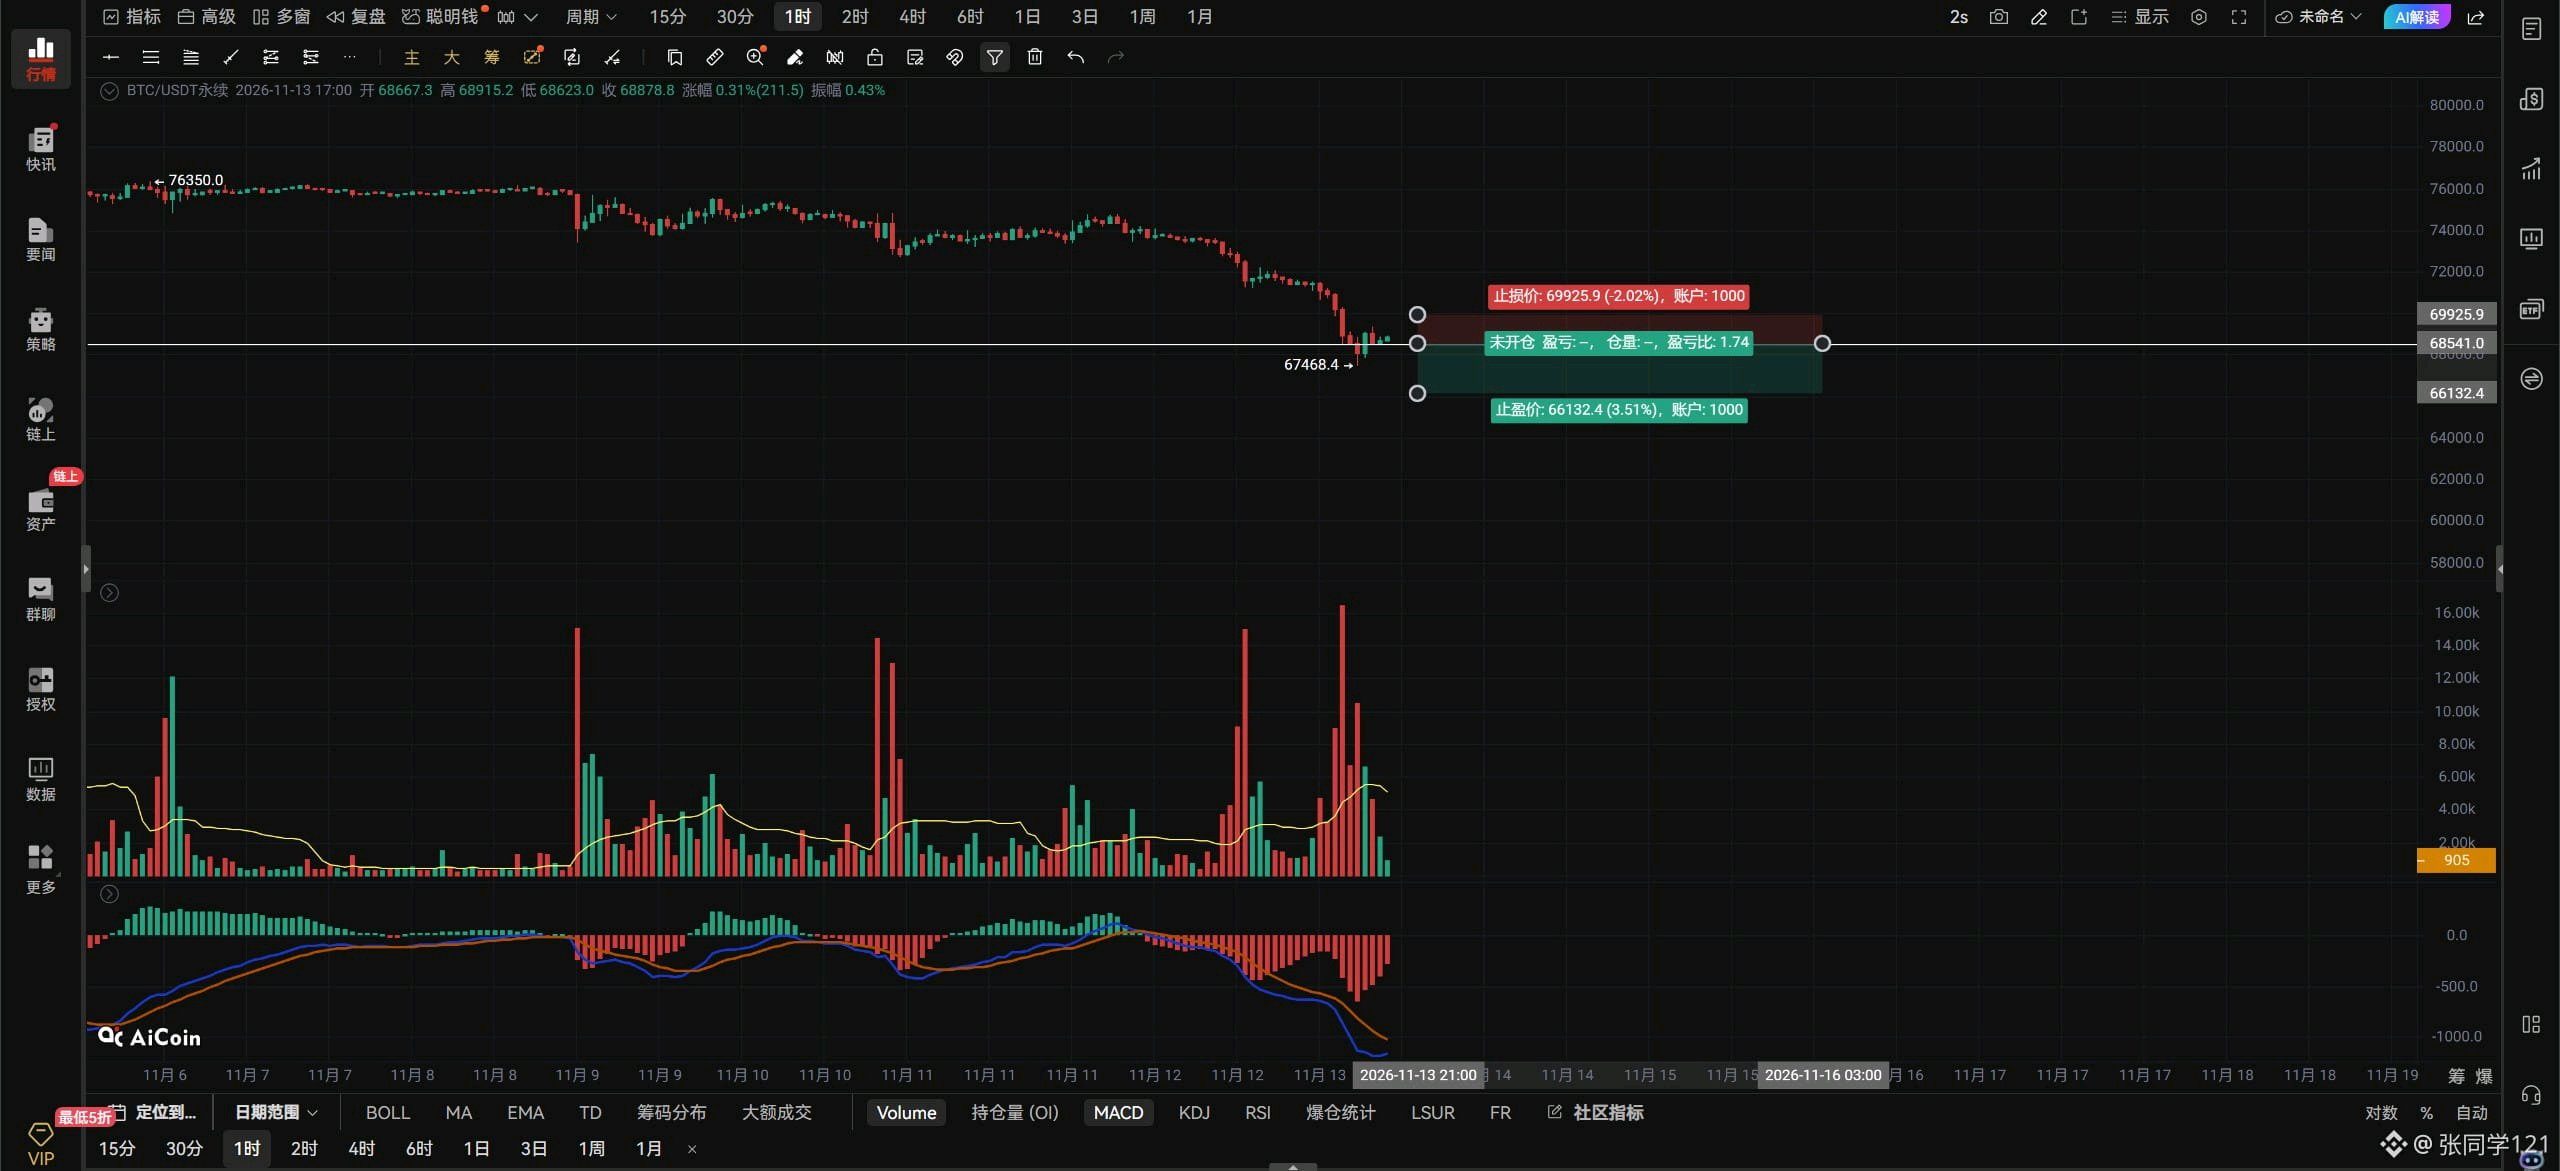
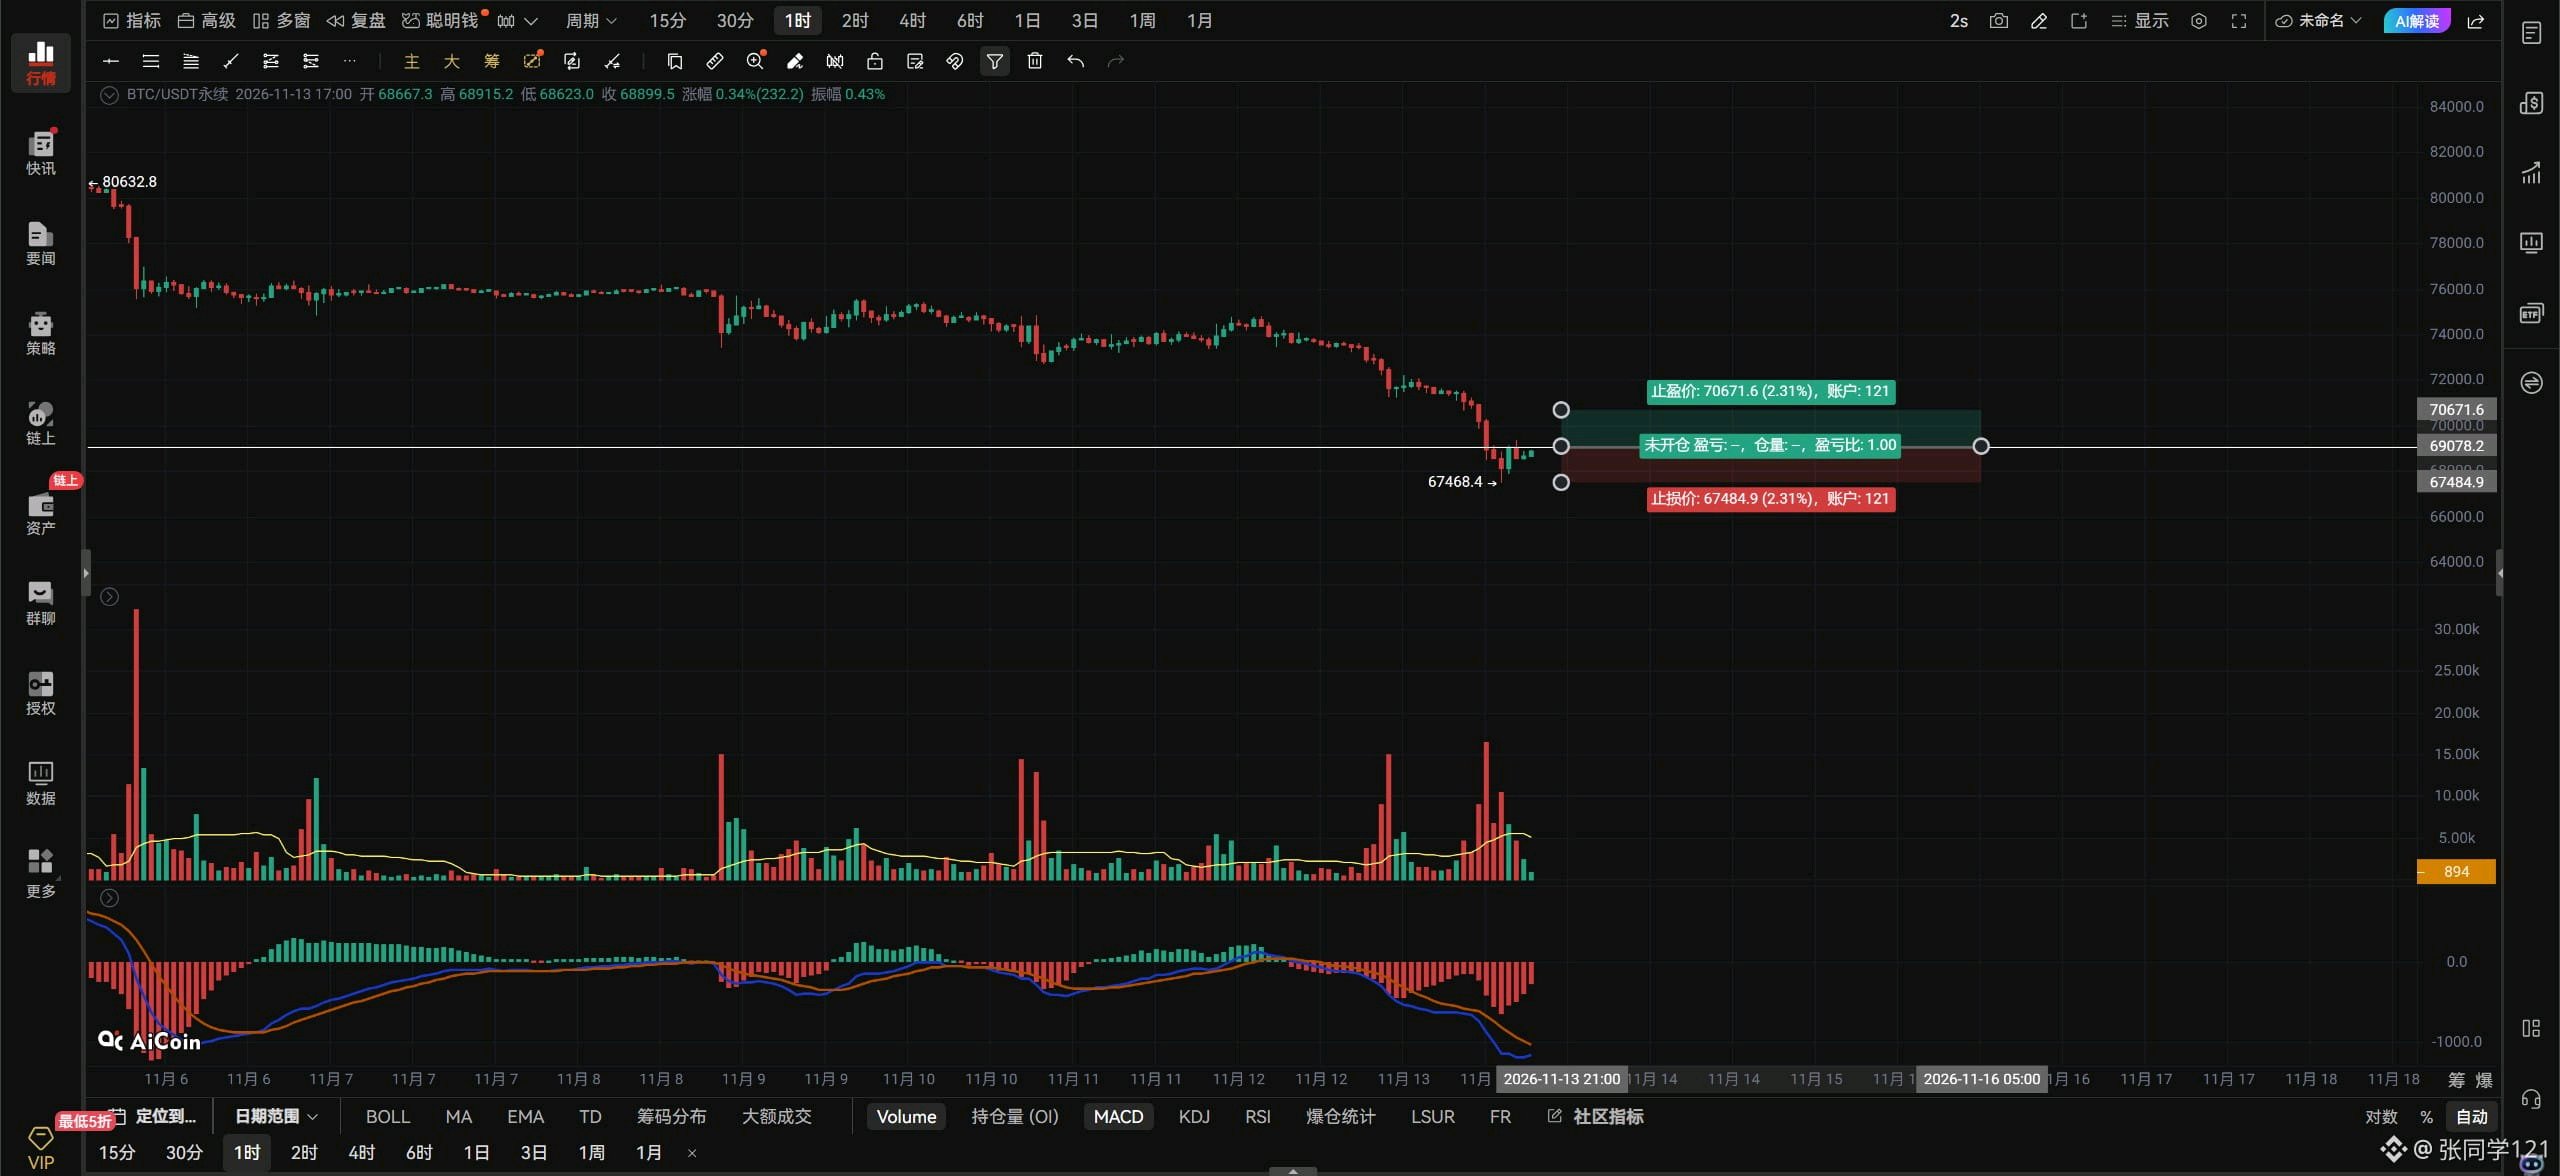
$ETHUSDT $ETH outlook: A high-volume break above 2021: chase the breakout long and use a stop-loss. A high-volume break below 1984: chase the breakdown short and use a stop-loss. If a retest of 1956 confirms support is holding, add one lot to the long position; stop out if it breaks below 1910. If ETH holds above 2021 on the hourly timeframe, look for 2046–2097. Watch for a one-lot short entry around 2046; stop out if it breaks above 2097. Left-side wick order: long at 1900; stop out if it breaks below 1872. Resistance above: 2021–2046–2097 Support below: 1984–1956–1910 On the 4-hour timeframe, a break below 1984 points down to 1956–1910. ETH is currently below the 2000 support. Wait for this hourly candle to close: if it can reclaim 2000, no big deal; if not, look for 1955–1910 next! ETH needs to reclaim 2000 to stop falling. If it can’t, ETH is basically done. That’s all.#ByXIMPACT
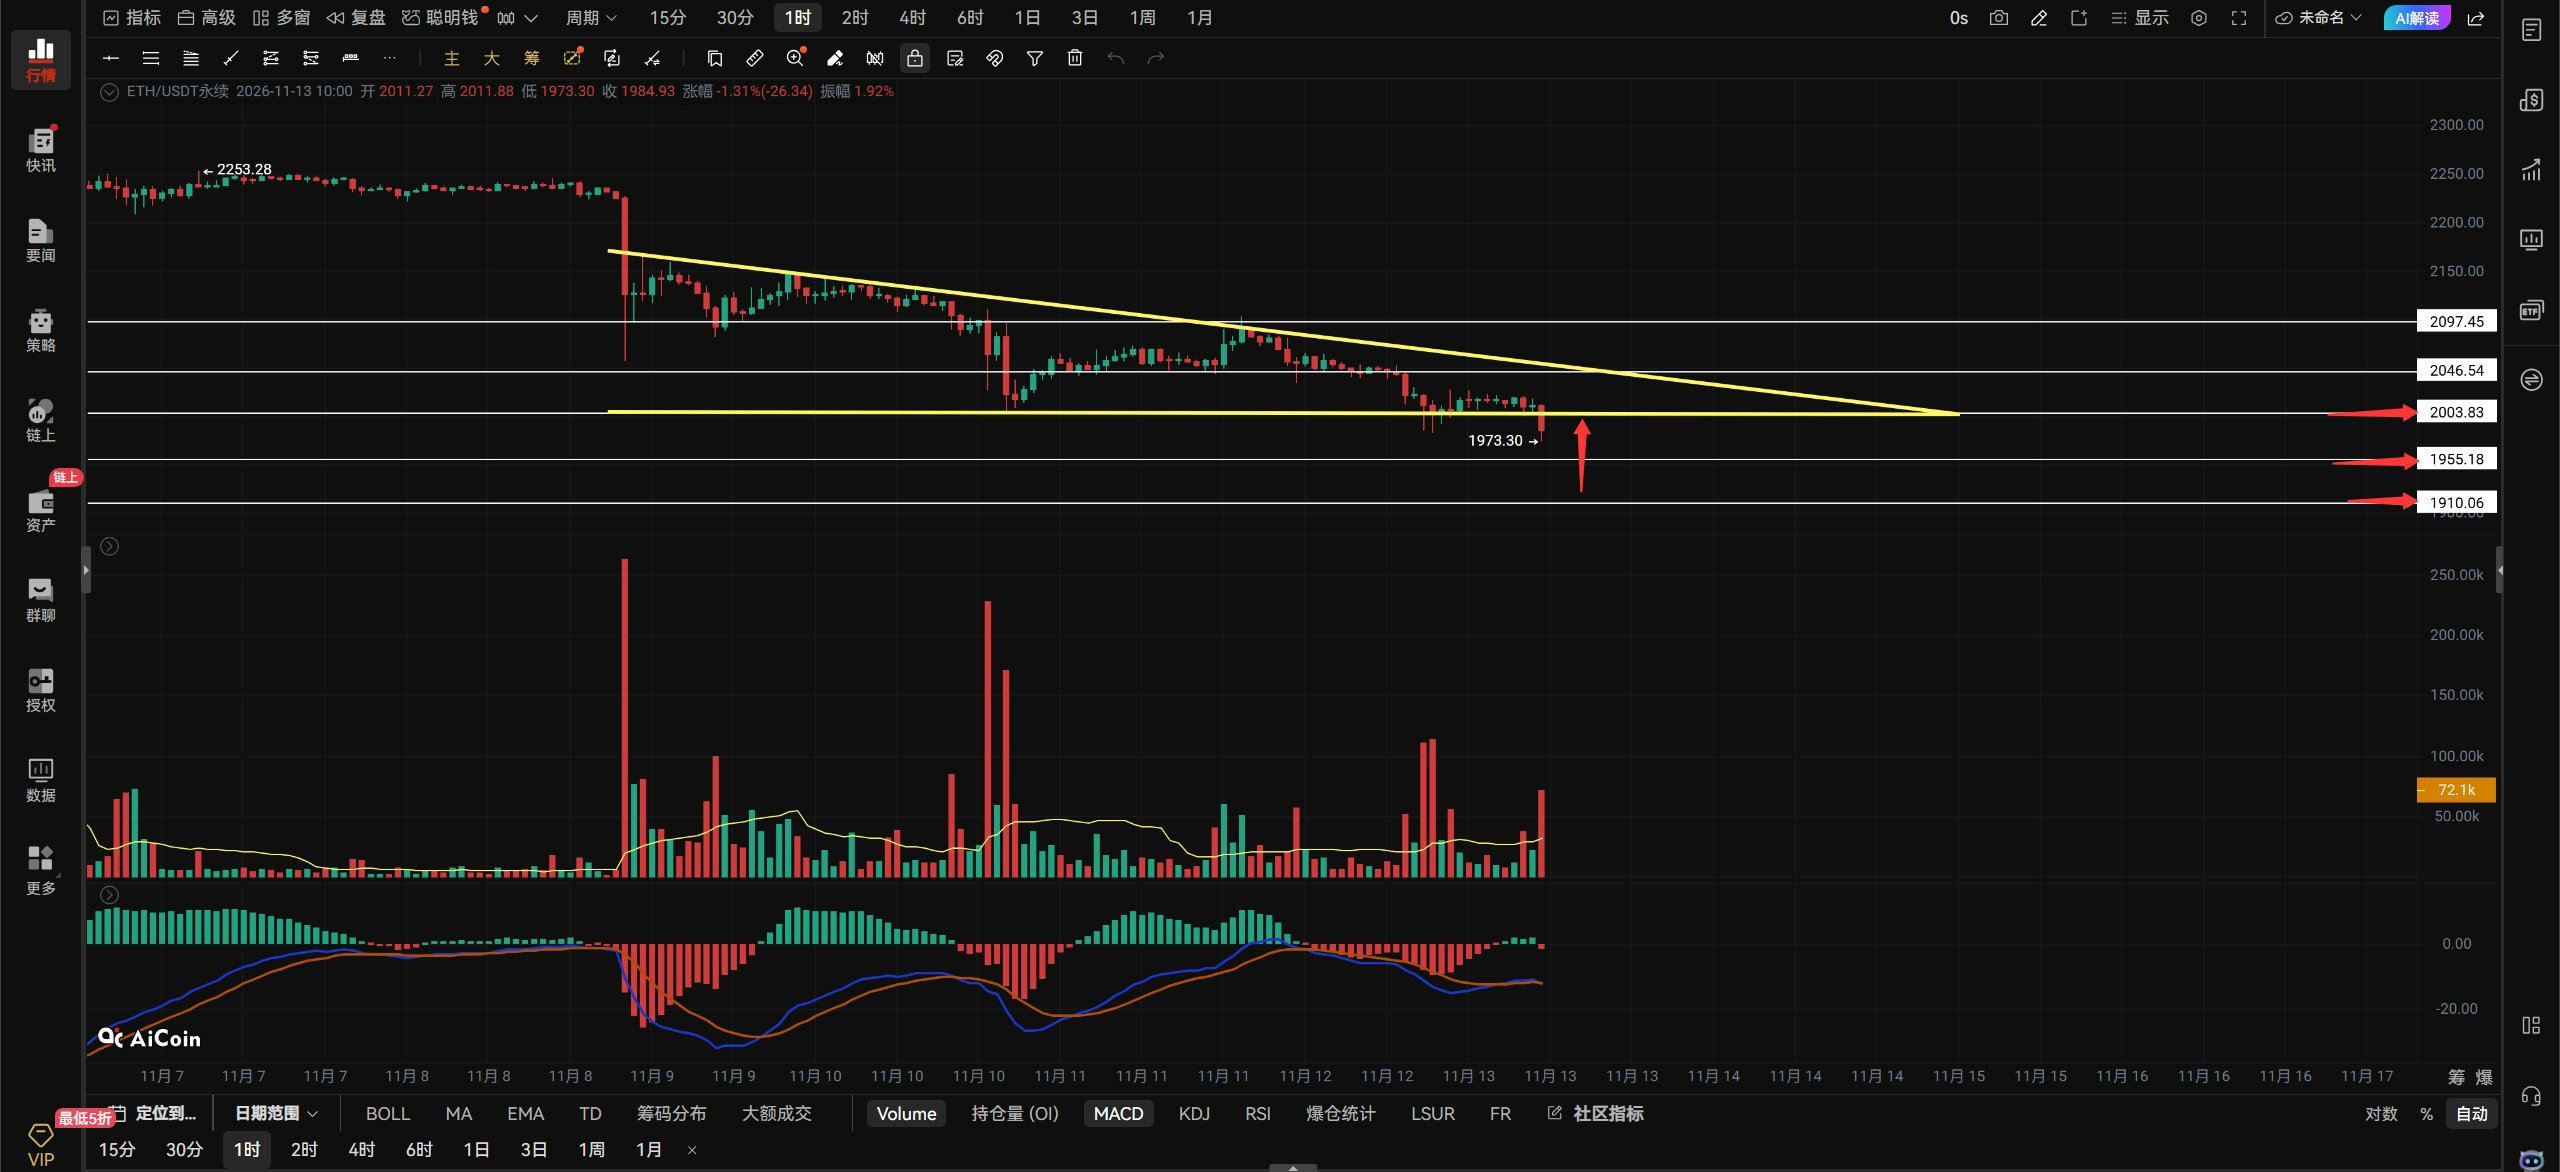
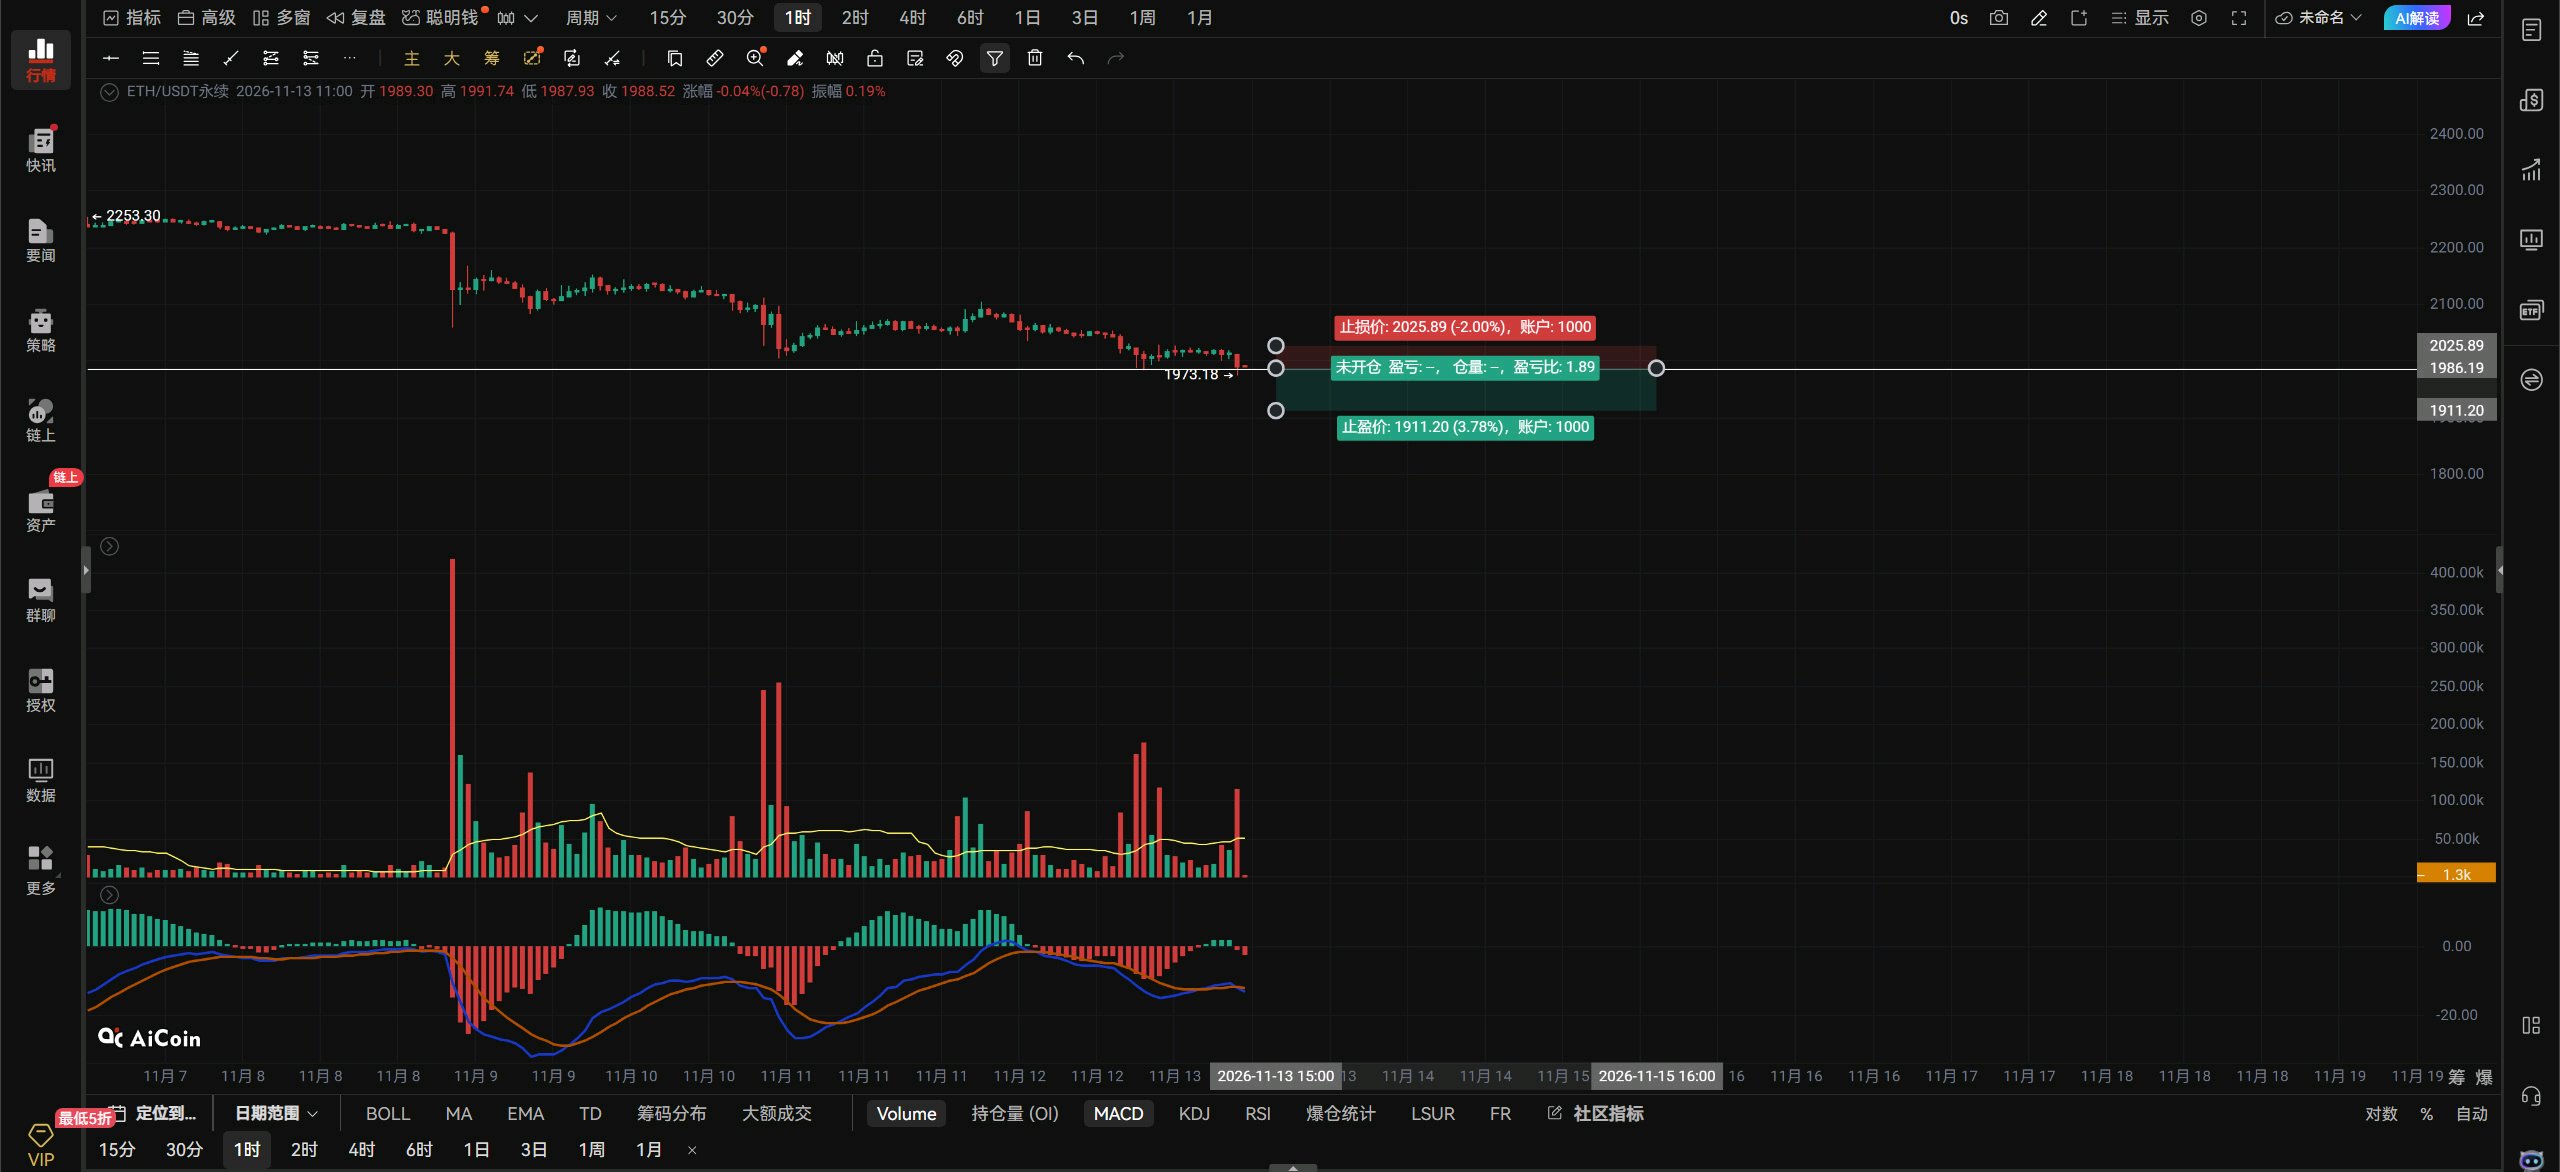
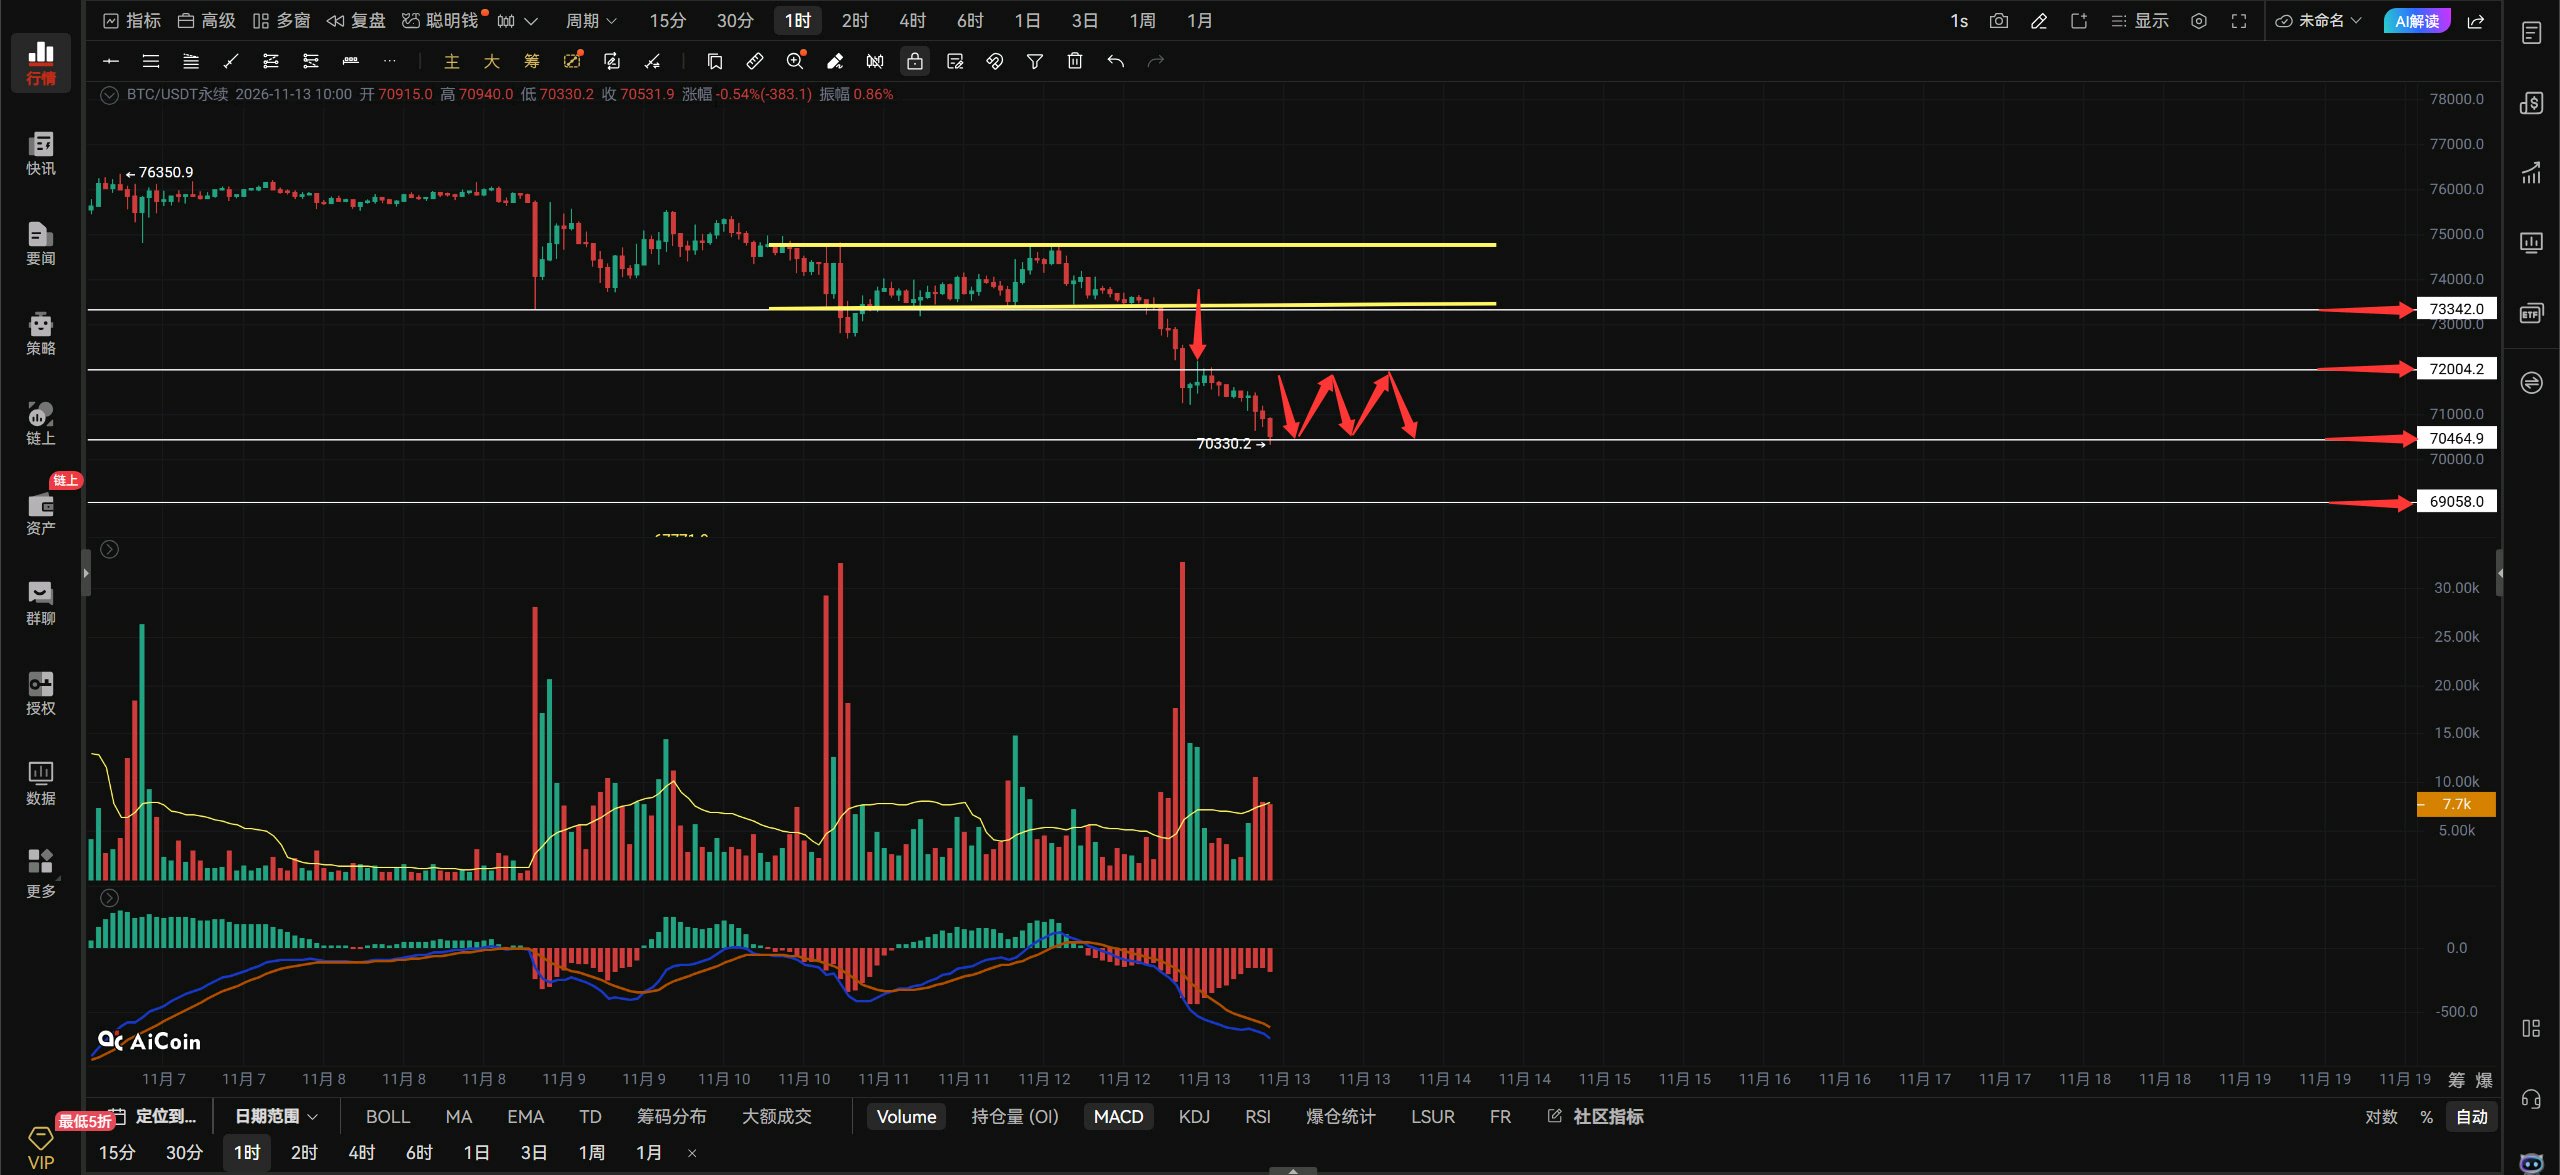
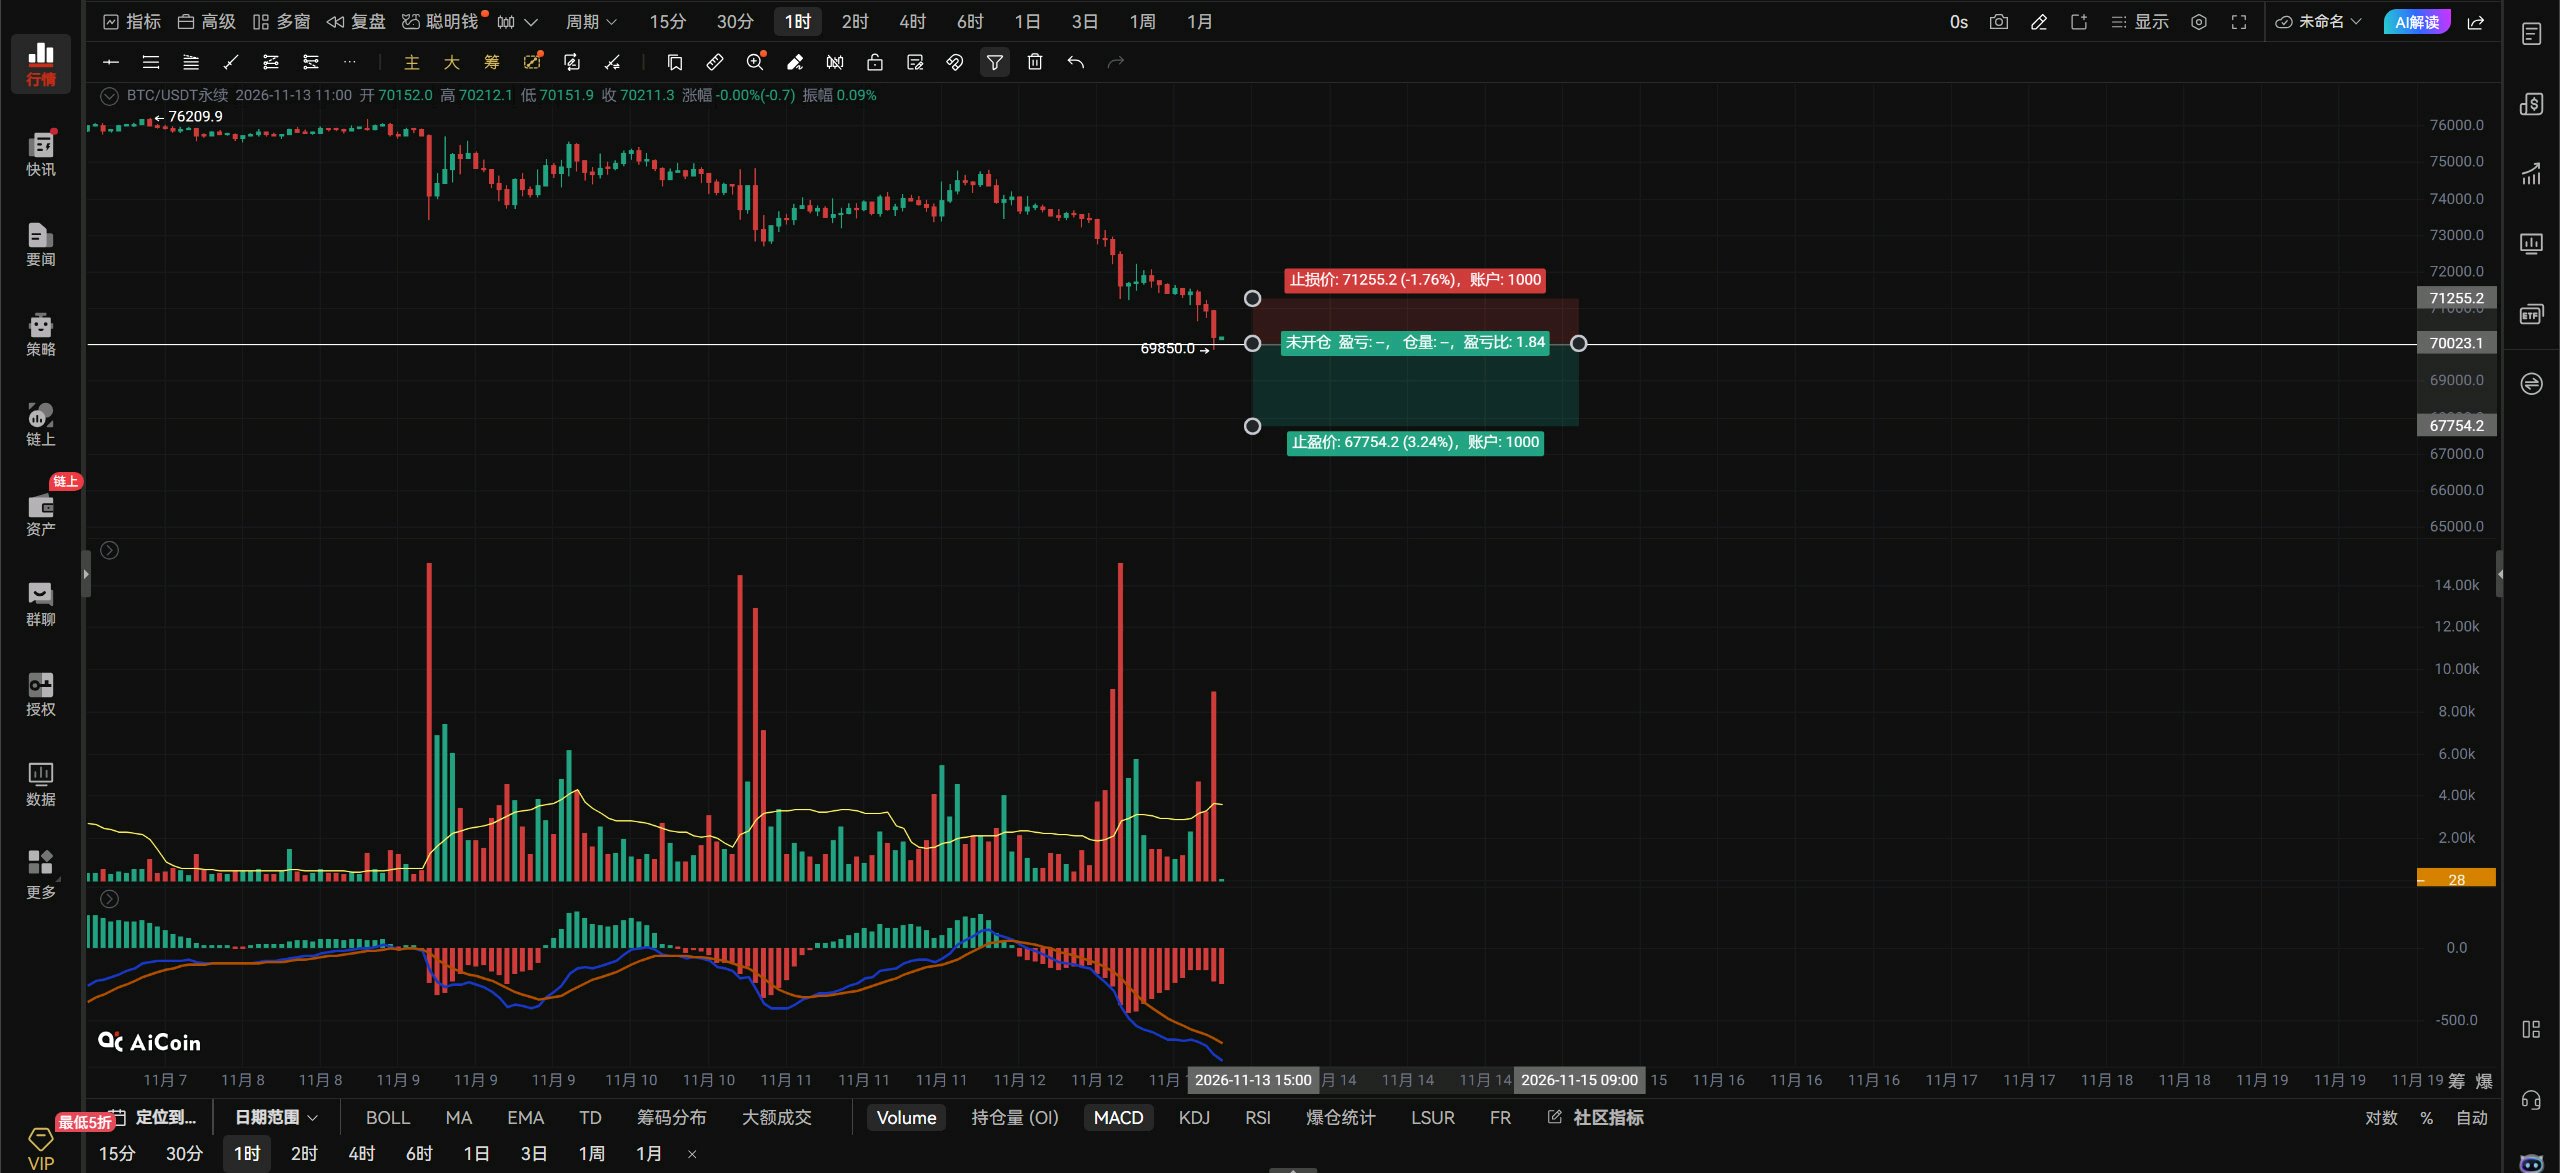
$BTCUSDT 11月13日 中午の相場見通し🌿 $BTC の見解: ビットコインは下落の一途をたどっており、今のところ底が見えません。どこが底なのか誰にも分かりませんが、下ヒゲが出ていないため、まだ底打ちの兆候は見られないと言えます。底打ちのシグナルは、急落を伴う下ヒゲが出て初めて現れるものです。ロング・ショート比率は依然として3.0と高く、これはロングポジションを持つ個人投資家が増え続けていることを示しています。この緩やかな下落は個人投資家のロング勢にとって大きな痛みとはならず、まるで鈍いナイフで切られるような痛みではありますが、強気派はまだ耐えられています。強気派を恐怖に陥れ、ロング・ショート比率を押し下げるには、連続的な急落が必要です。比率が低下し、ロング勢が減って初めて、価格は押し上げられることになります。ビットコインは73,342ドルのサポートを割り込んだ後、そこに留まることなく、72,000ドルのサポートもそのまま突き抜けました。72,000ドルを割り込んだ後、上の赤い矢印が示すように反発してその水準を奪還しようとしましたが、残念ながら72,000ドルを上回ることはできませんでした。これを取り戻せなければ、下落は続きます!ビットコインは現在70,464ドルのサポートを試しています。もし70,464ドルが維持できなければ、70,000ドルも失われるでしょう。70,000ドルを割り込めばパニック売りを誘発する可能性があり、一度パニック売りが始まればどこまで下がるか分かりません。今は一歩ずつ確認していくしかありません。パニック売りが発生して初めて、強気派が恐怖を感じ、ロング・ショート比率が下がることになるでしょう。現時点で、ビットコインの1時間足における下値サポートは69,058ドル付近です。このペースだと、空売り勢は強気派を全滅させるまで手を緩めないようです。もしビットコインが70,464ドルを割り込まず、70,464ドルから72,000ドルの間で持ち直すことができれば、反発のチャンスはまだあります。しかし、70,464ドルを割り込んでしまえば、反発は期待できません。今ロングを狙うならどうすべきか?70,000ドルを一時的に割り込んでからすぐに回復するかどうかを見極めてください。もし回復するなら少額のロングポジションを取るのもありですが、そのまま突き抜けるようなら手を出さない方が賢明です。 ビットコインが力強い出来高を伴って70,464ドルを上抜けたら、積極的なトレーダーは順張りでロングを追っても良いでしょう。もし力強い出来高を伴って70,000ドルを下抜けし、その後の戻りで奪還に失敗したら、順張りでショートを追いましょう。損切りは必ず設定してください。 1時間足では、ビットコインが70,464ドルを上抜けて維持できれば、72,000ドル〜73,342ドルを目指す動きになります。70,464ドルを超えられなければ、意味がありません。 4時間足で70,000ドルを割り込むと、69,058ドル〜67,771ドルまで下落する可能性があります。 上値抵抗線:70,464–72,000–73,342 下値支持線:70,000–69,058–67,771#ByXIMPACT
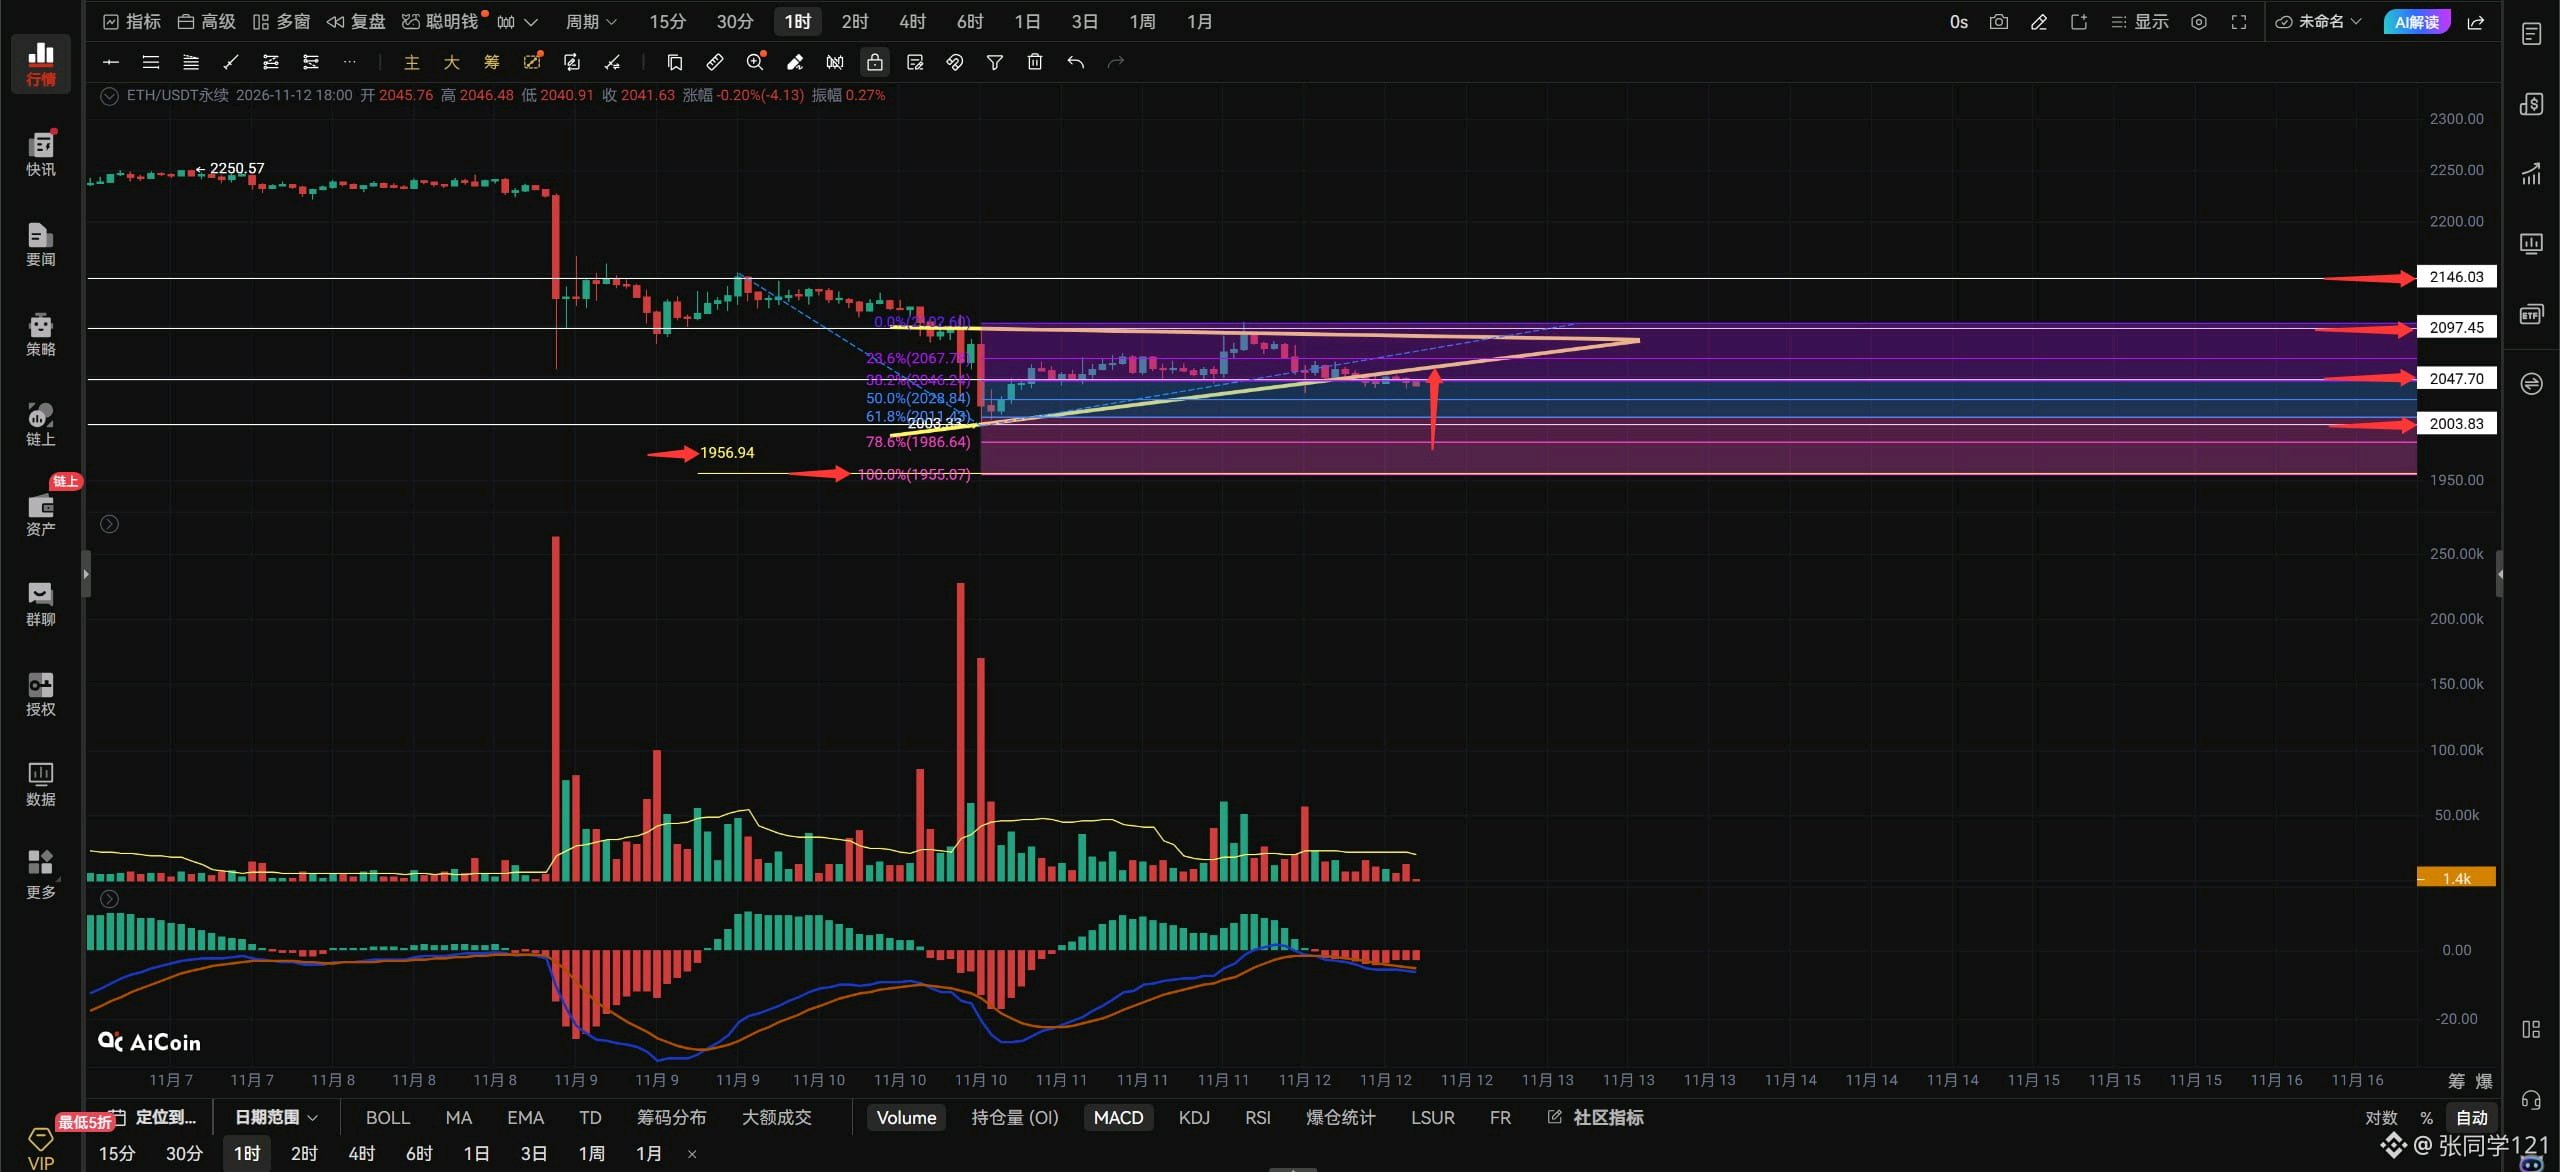
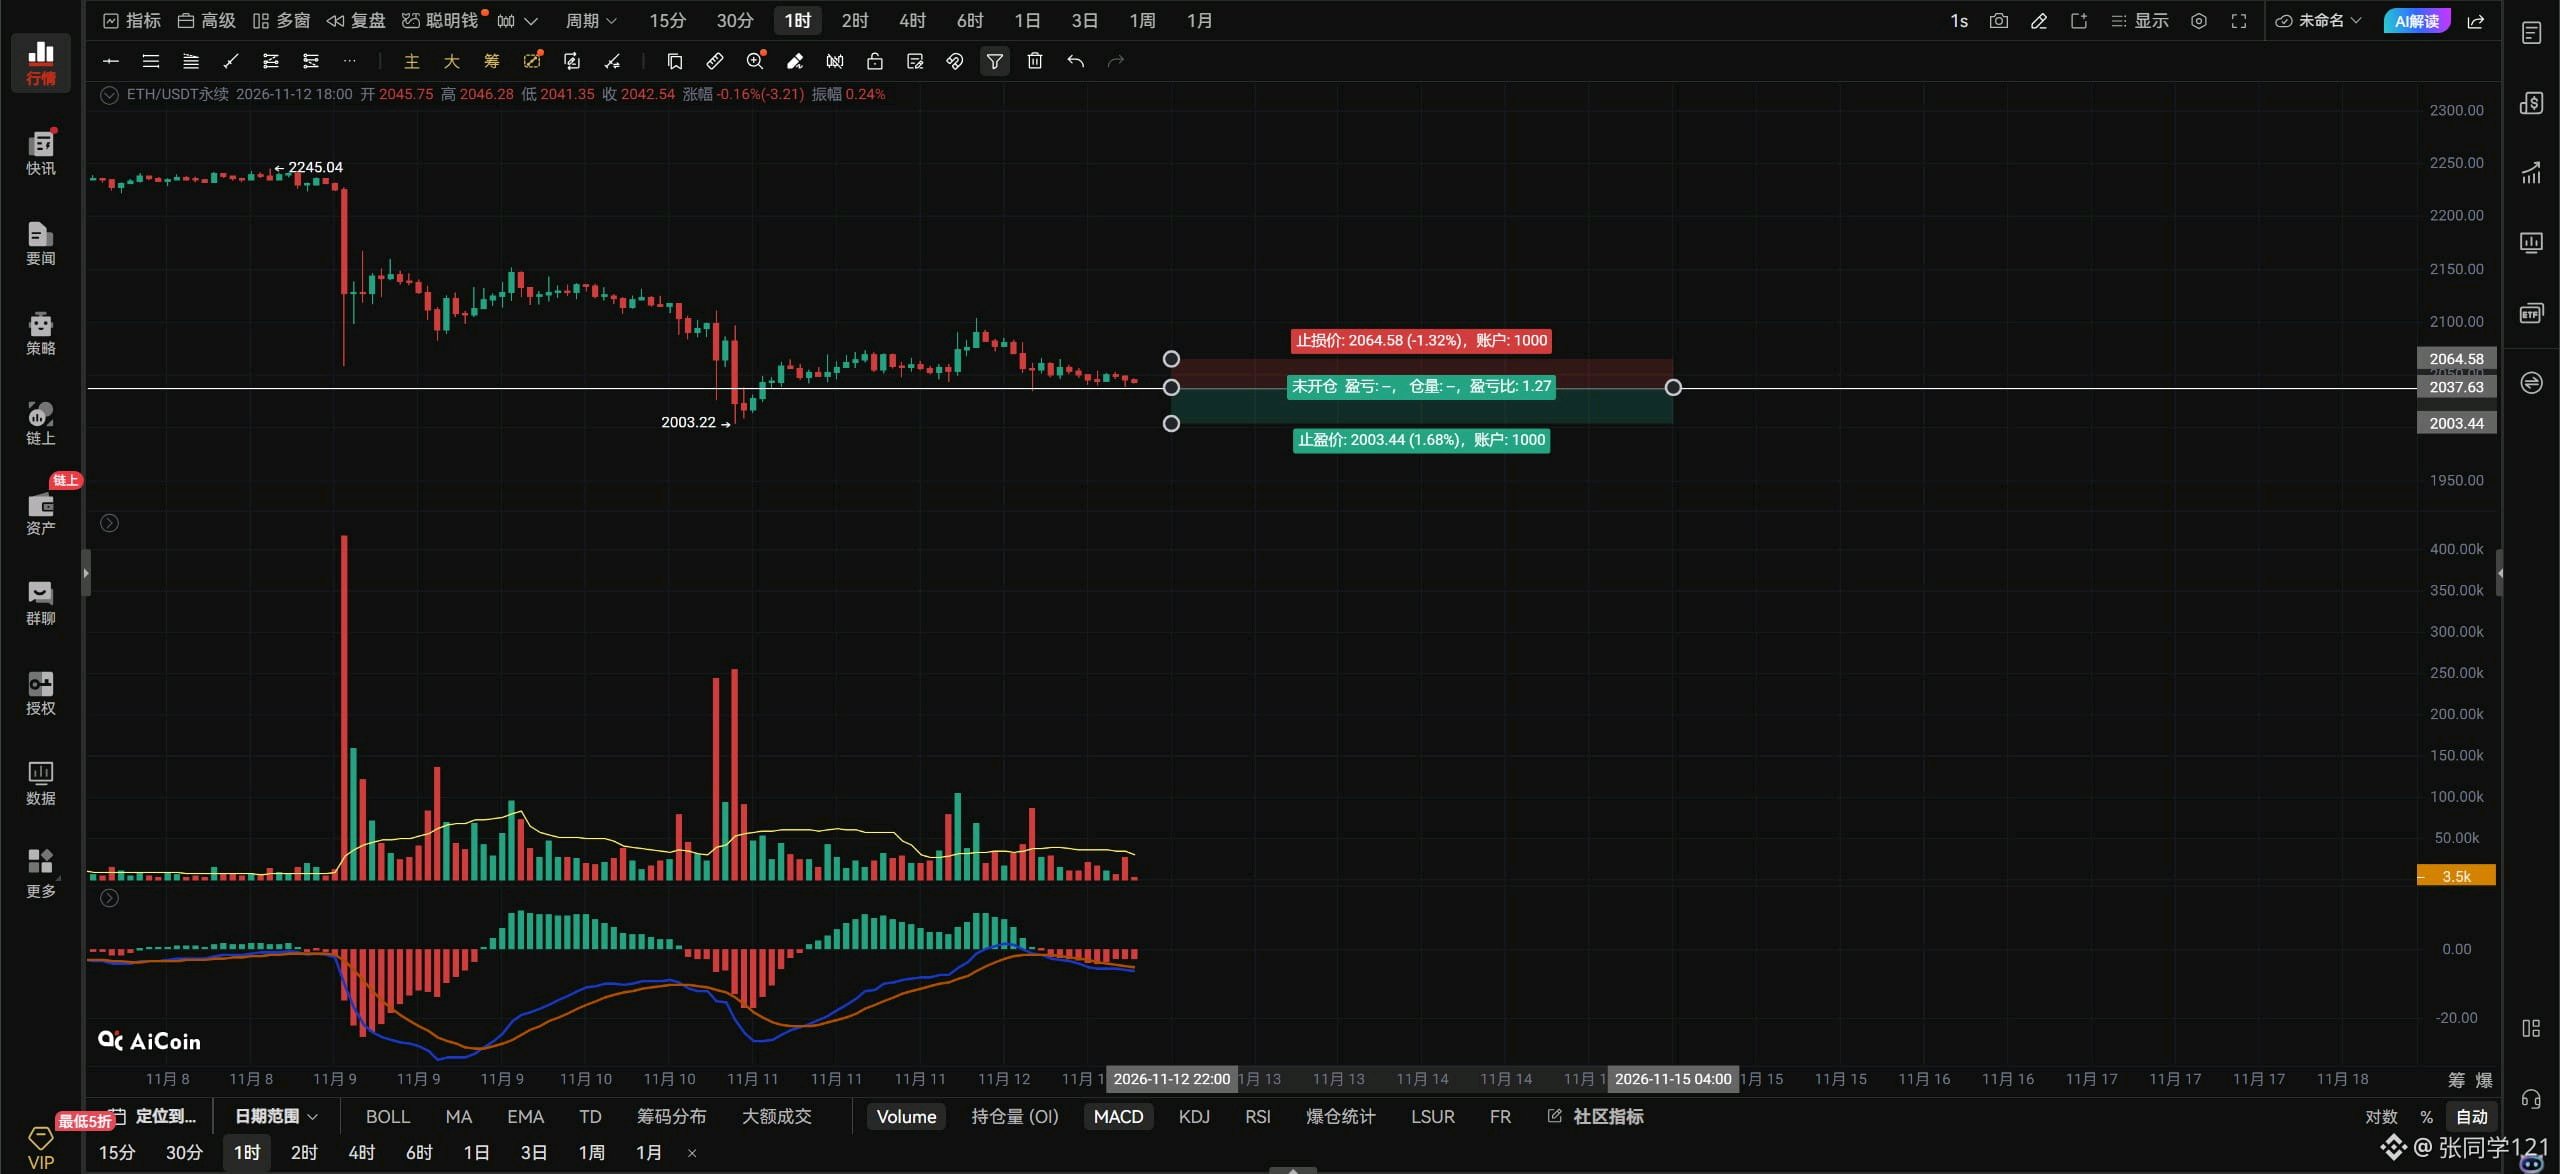
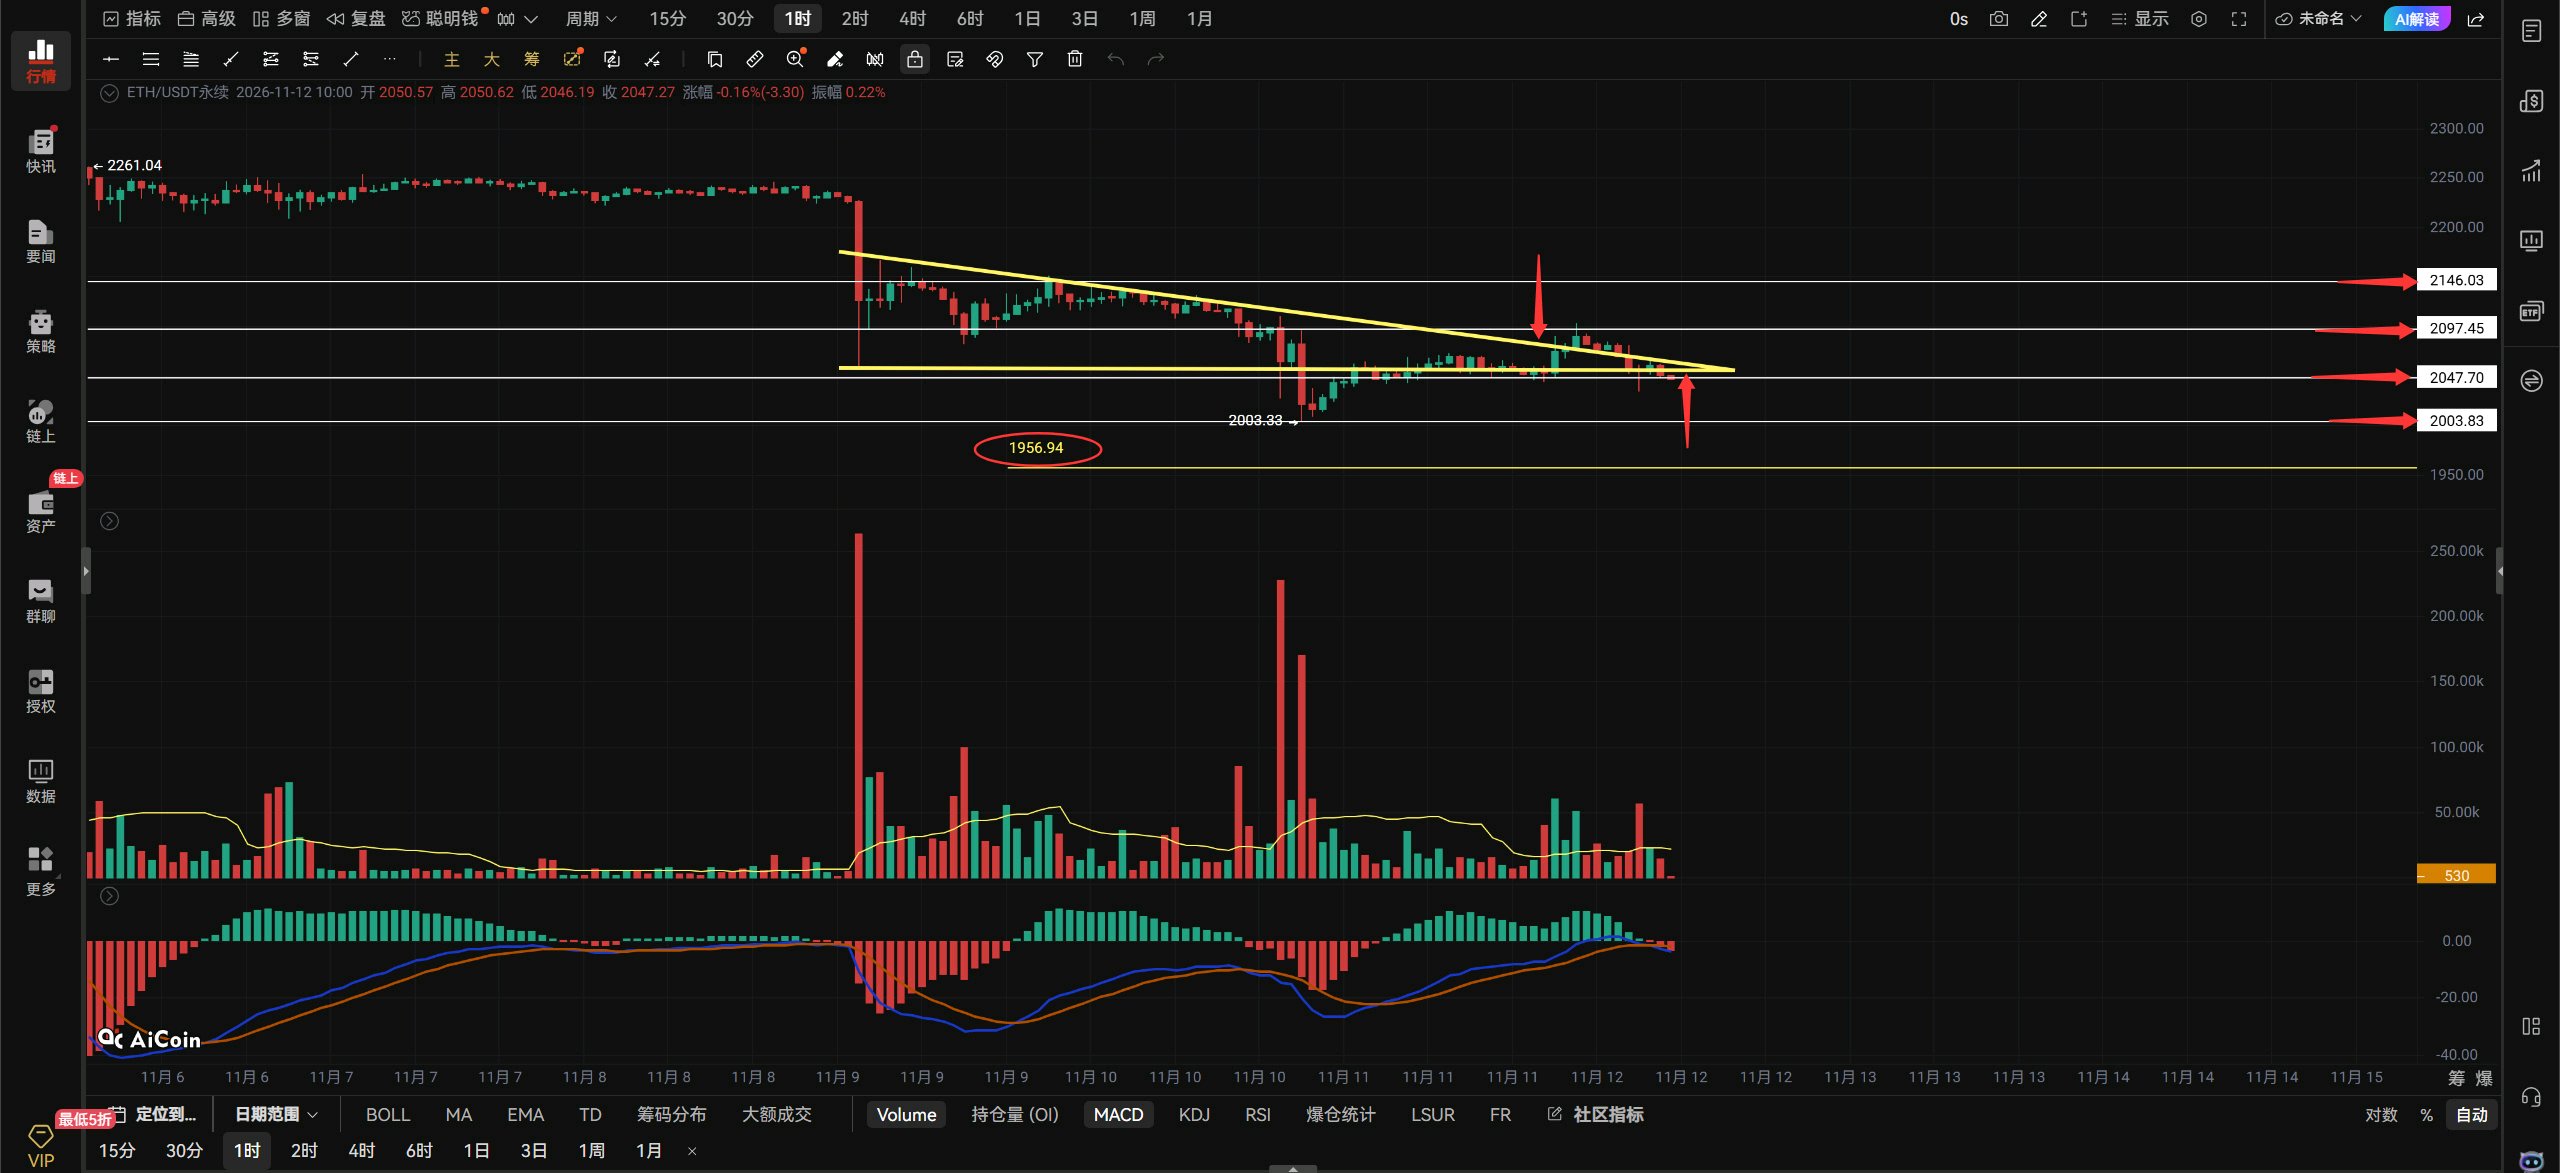
$ETHUSDT Evening outlook: Nov. 12. ETH’s triangle has broken down, and it has also fallen below the 2047 support. If it can’t reclaim 2047, it’s headed for 2000. This price action over the past few days has been really frustrating: it can’t go up, but it can’t go down much either. We don’t know what BTC and ETH are waiting for—or what other news is yet to come. ETH needs to get back above 2047 to stop falling. A break above 2097 could kick off an hourly rebound. If you’re looking to go long on ETH, you can wait for it to retest around 2000 and look for a bottoming signal, or wait for it to break above 2047 and go long on the right side. ETH must hold 2000; if it breaks below that level, Fibonacci levels point to around 1956. For this hourly downswing in ETH to rebound, it needs to break above 2146. Only then can the hourly downtrend shift from its current bearish trend to a bullish one. If ETH breaks above 2058 with strong volume, aggressive traders can go long on the right side. If it breaks below 2037 with strong volume, go short on the right side. Keep an eye on volume and use stop-losses. If ETH holds above 2058 on the hourly chart, look for 2097–2146. If it breaks below 2047 on the 4-hour chart, look for 2000–1956. There’s not much else to say about the other timeframes, since the market has been consolidating for the past few days. ETH spot around 2000 is worth buying, so go ahead and buy spot! Don’t hesitate—you might miss the move up if you’re not paying attention. Don’t assume there’s much further to fall and keep waiting for a lower price to buy spot; constantly chasing lower prices is also a form of greed. That’s all for now. $ETH #ByXIMPACT
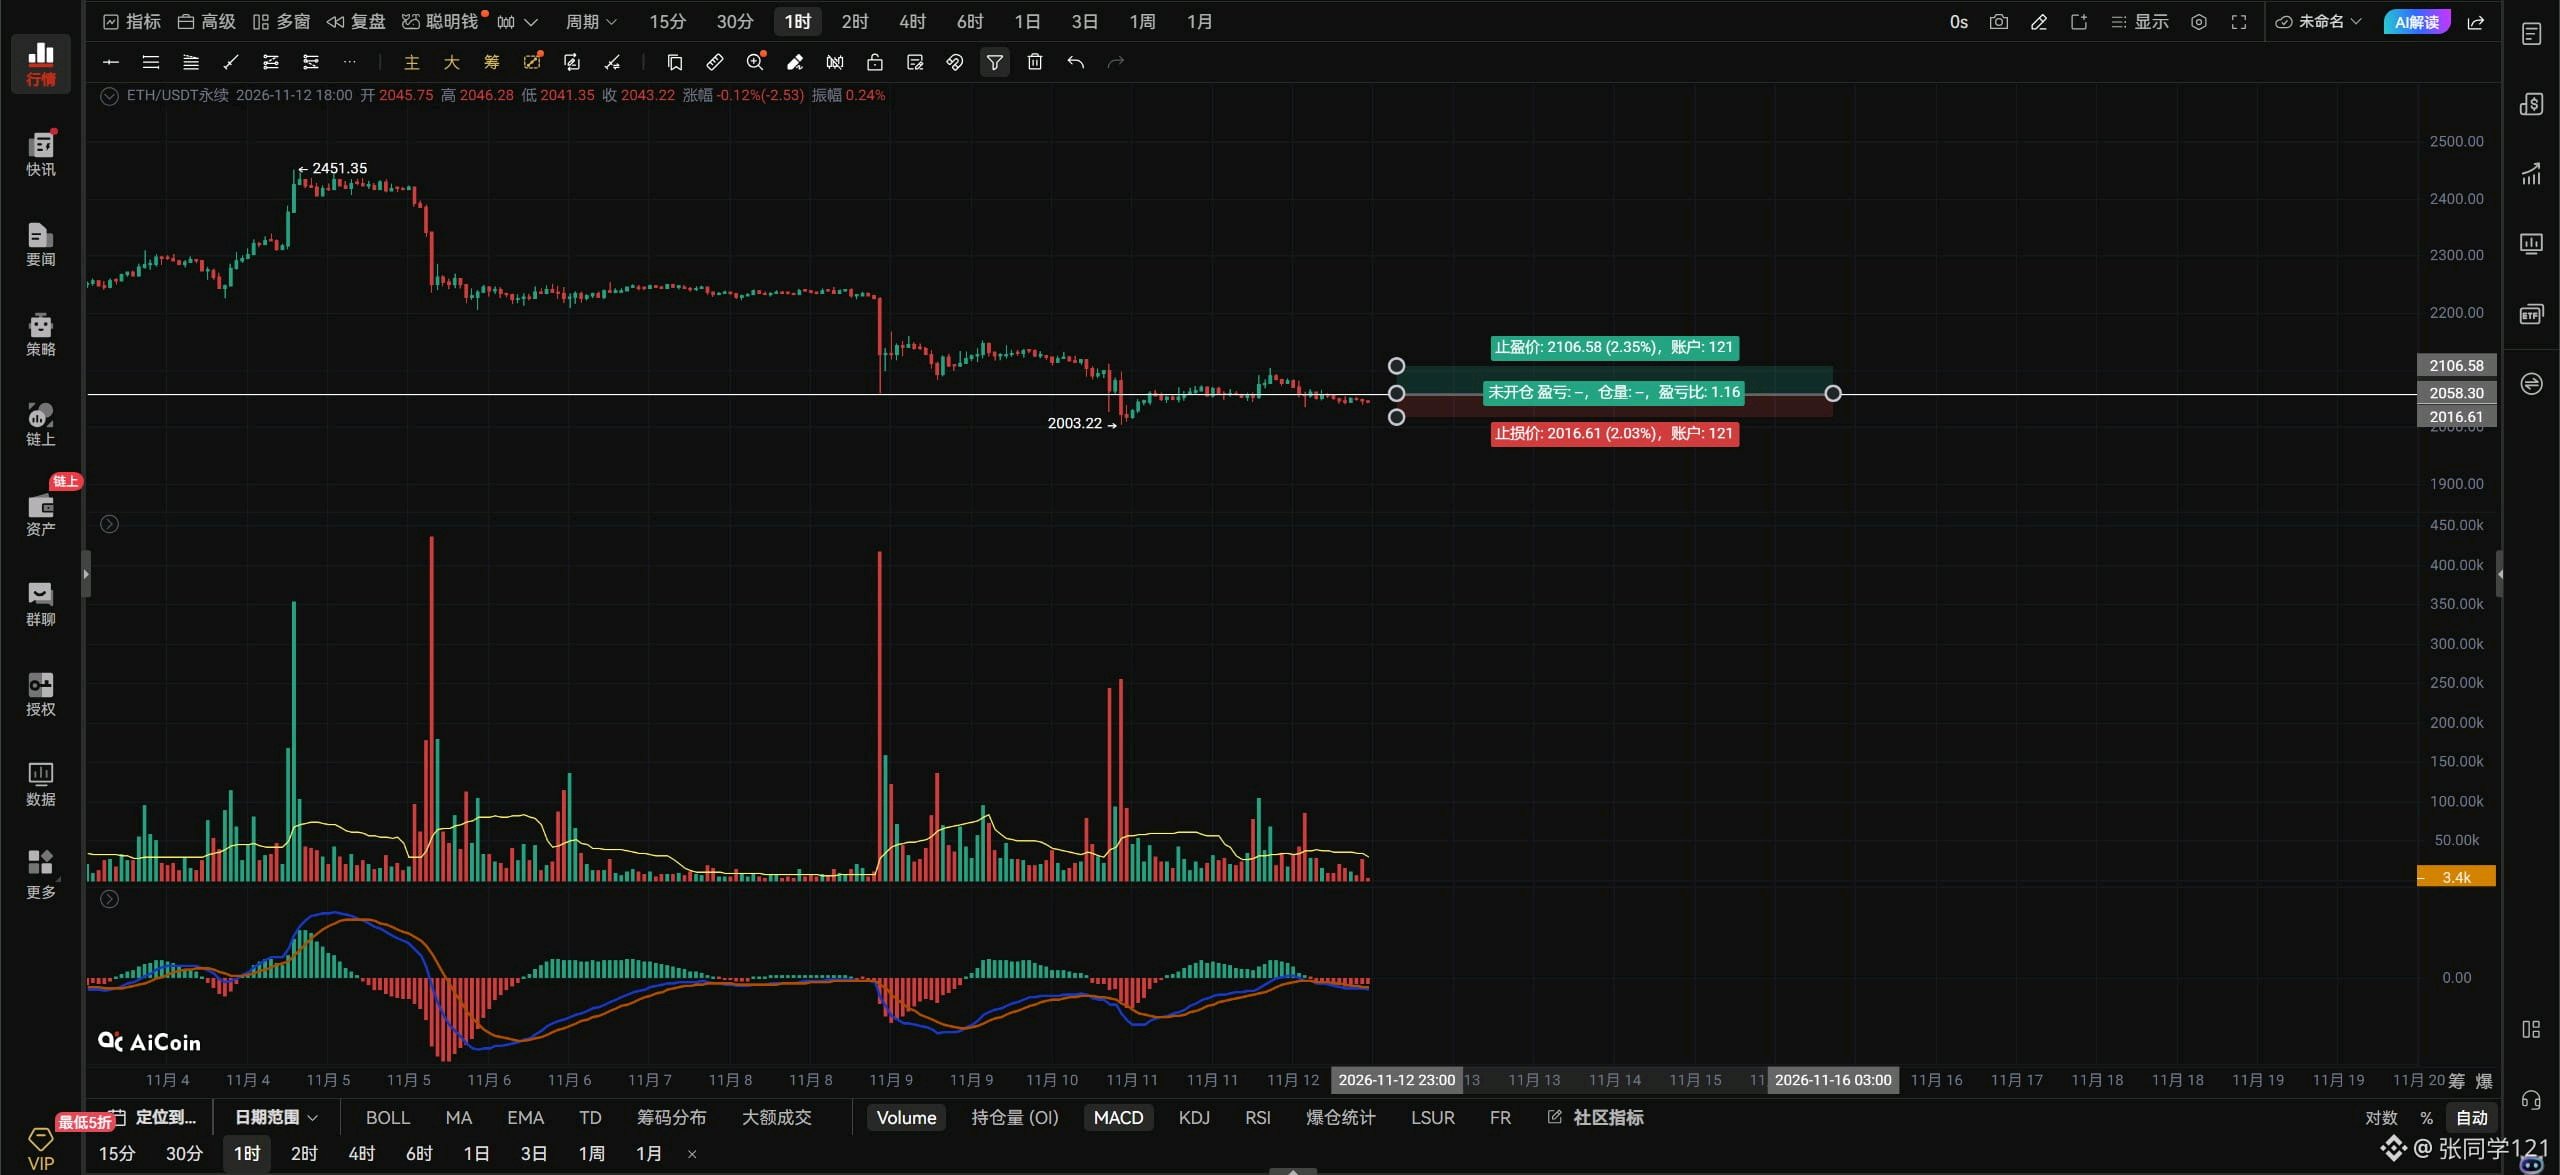
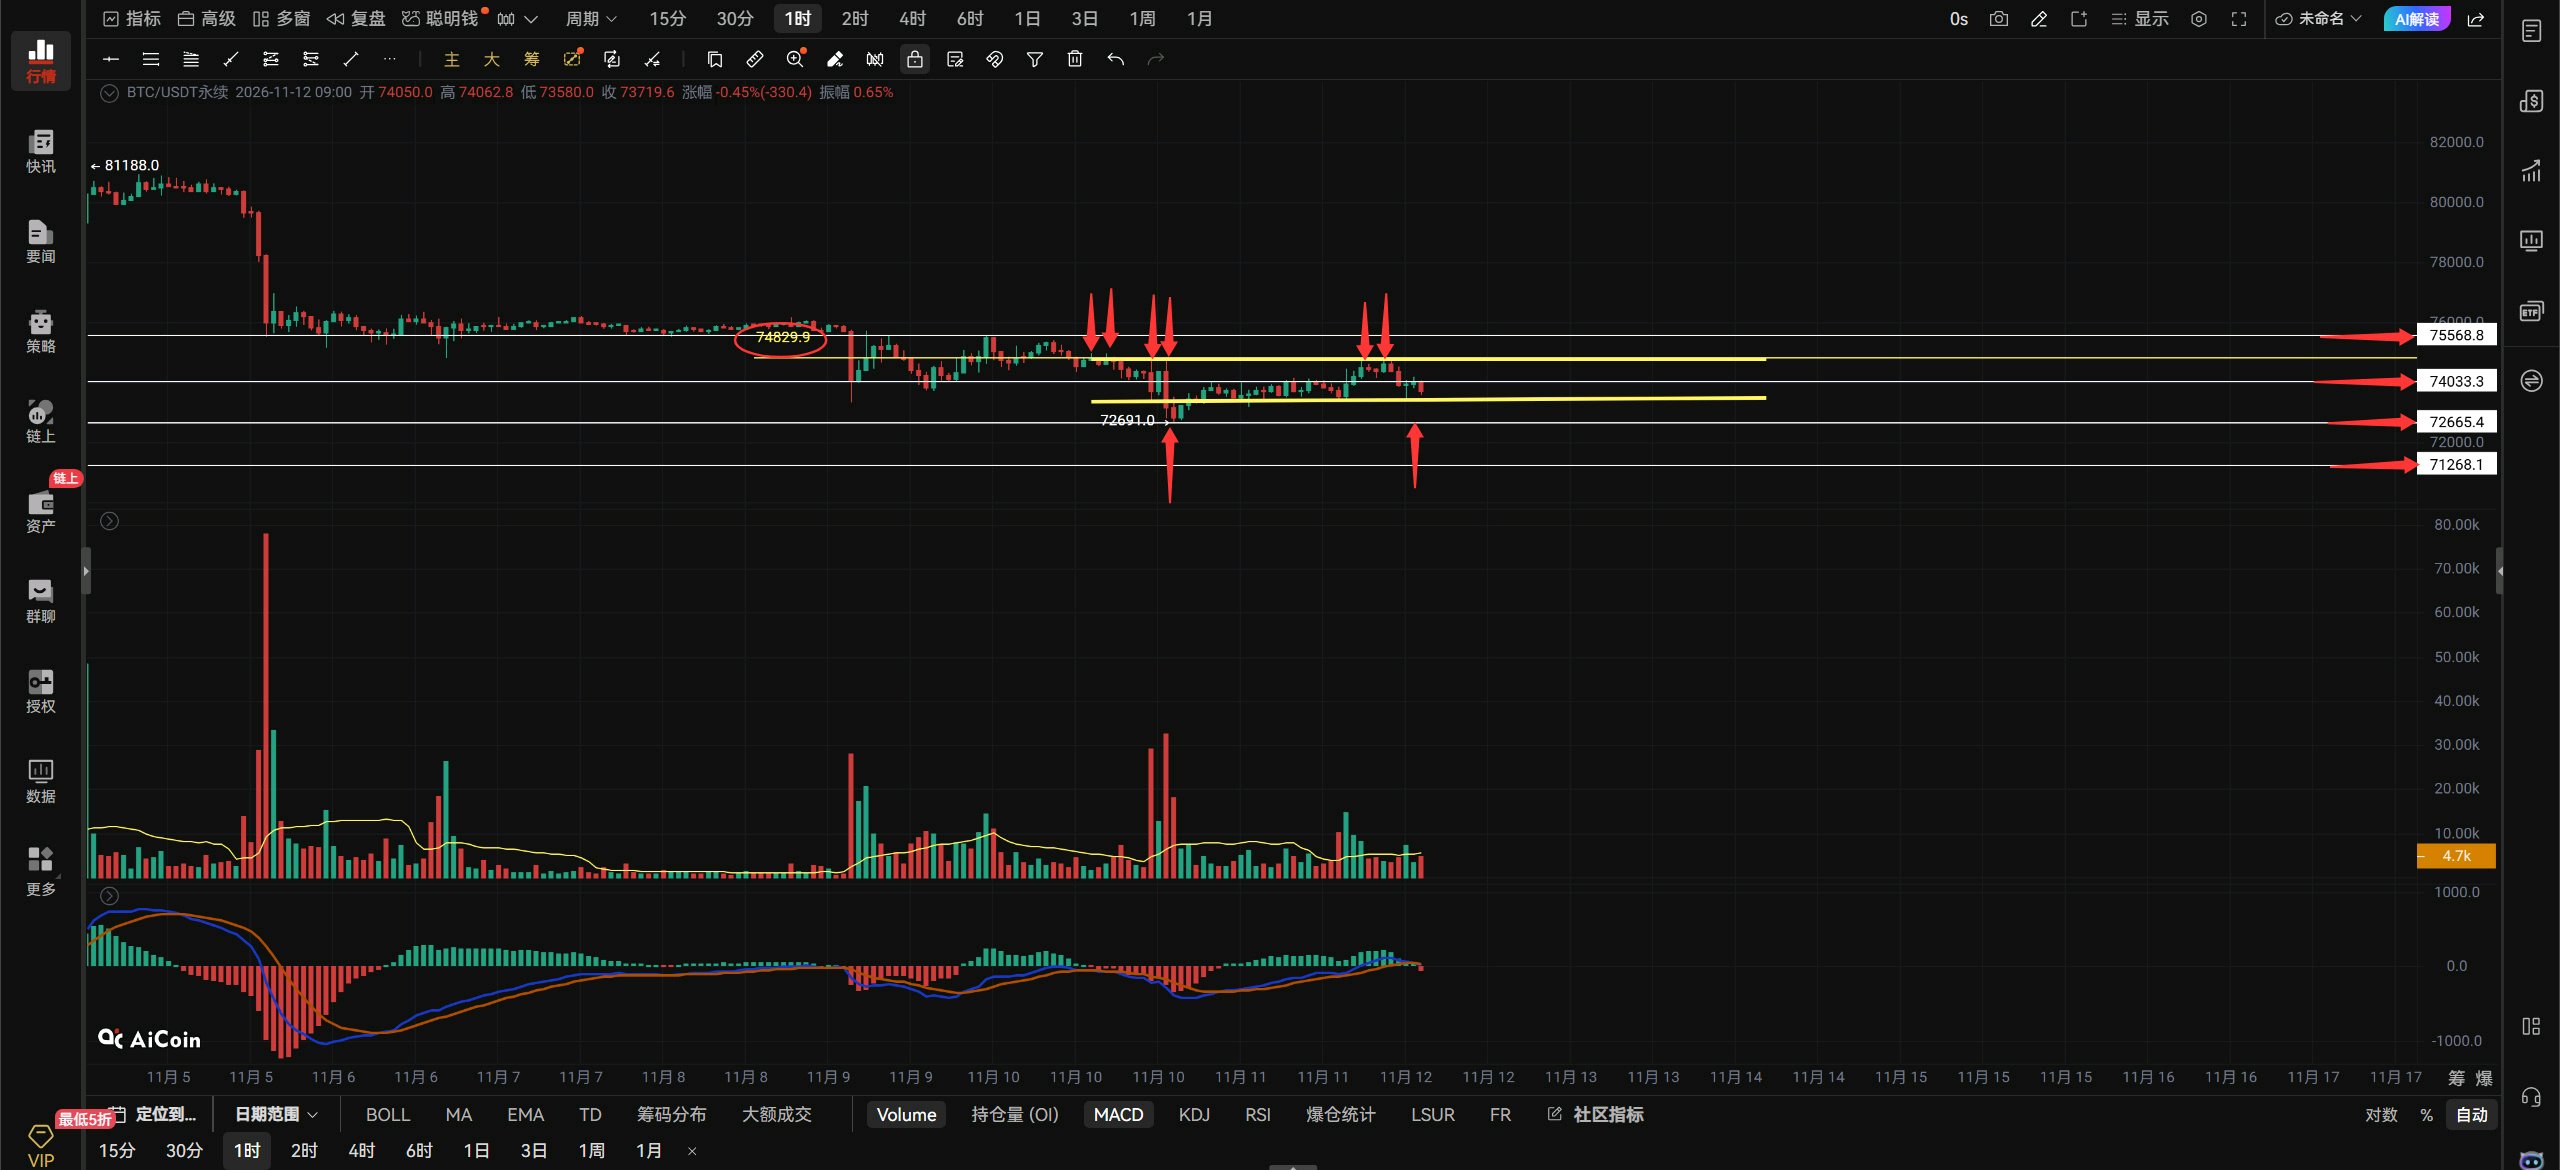
$BTCUSDT Evening market outlook: 11.12. Crude oil is down and Bitcoin is down. Crude oil is up and Bitcoin is still down. U.S. stocks are up and Bitcoin isn't rising either. Will this sell-off ever end? If you keep falling, the bulls won't enter. With no opposing buyers, you bears might as well go play in the mud by yourselves! We've fallen quite a bit; this should be about enough. We’ve dropped this much even without any clear catalyst from bad news—imagine how much further we'd fall if a major shock hit. Bitcoin must not break below the 73333 support. Once 73333 is broken, a second retest of the previous low is on the cards. It would be okay if the previous low holds on the second retest, forming a potential hourly double bottom. If price consolidates between 73333 and 72691, there will still be a chance to challenge the 74000 resistance. If the previous low fails to hold and is cleanly broken, 71268 will be right in front of you. For Bitcoin to stop falling on the hourly chart, it must get back above 74000 and hold there. If it can't reclaim 74000, the slow decline will continue. To extend the rebound, it must break through the 74800 resistance; only then can it continue higher toward 75568. If it can't get past these two levels, Bitcoin will keep fluctuating and ranging. If Bitcoin breaks above 73426 with strong volume, aggressive traders can chase longs on the breakout. If it rebounds to 74833, consider a small, anticipatory short. Be sure to set a stop-loss. If Bitcoin breaks above and holds 73426 on the hourly chart, look for 74000–74800. If it can't get above 73426, there's no point. If it breaks below 73333 on the 4-hour chart, look lower toward 72691–71268. On Bitcoin's daily chart, I hope the bearish candle currently forming—the one indicated by the red arrow below—closes as a bullish candle tomorrow. It doesn't need to be a large one; it just needs to engulf the previous bearish candle. That would form a daily Morning Star pattern. If tomorrow's daily candle doesn't close bullish, then get ready for Bitcoin to fill the FVG gap below! I hope my prediction comes true. That's all for now.#ByXIMPACT
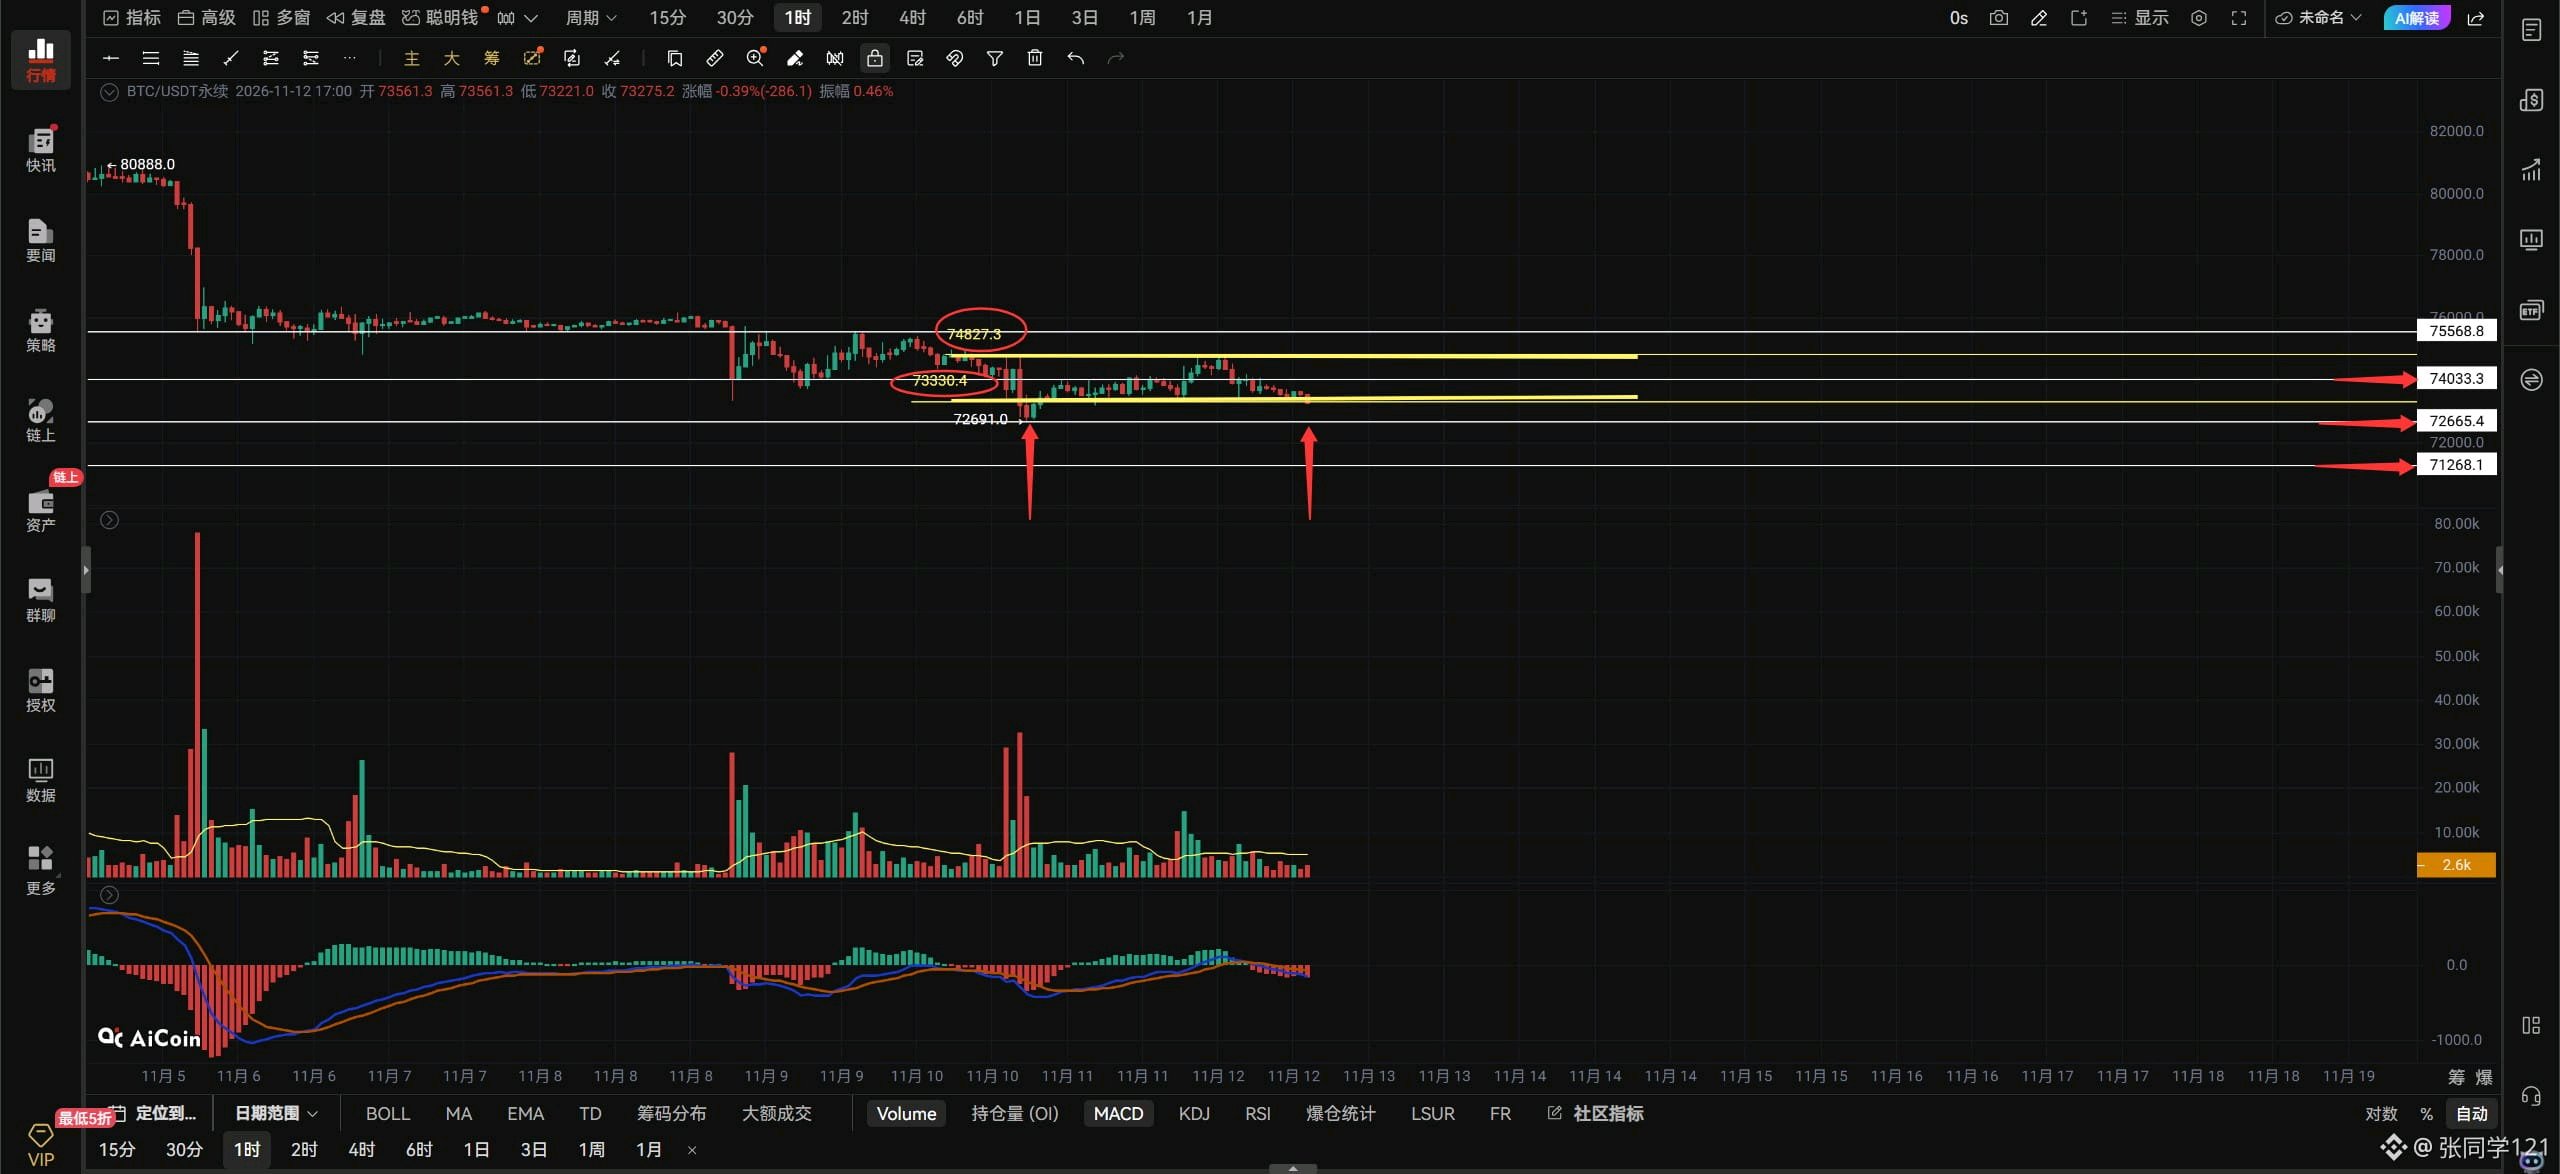
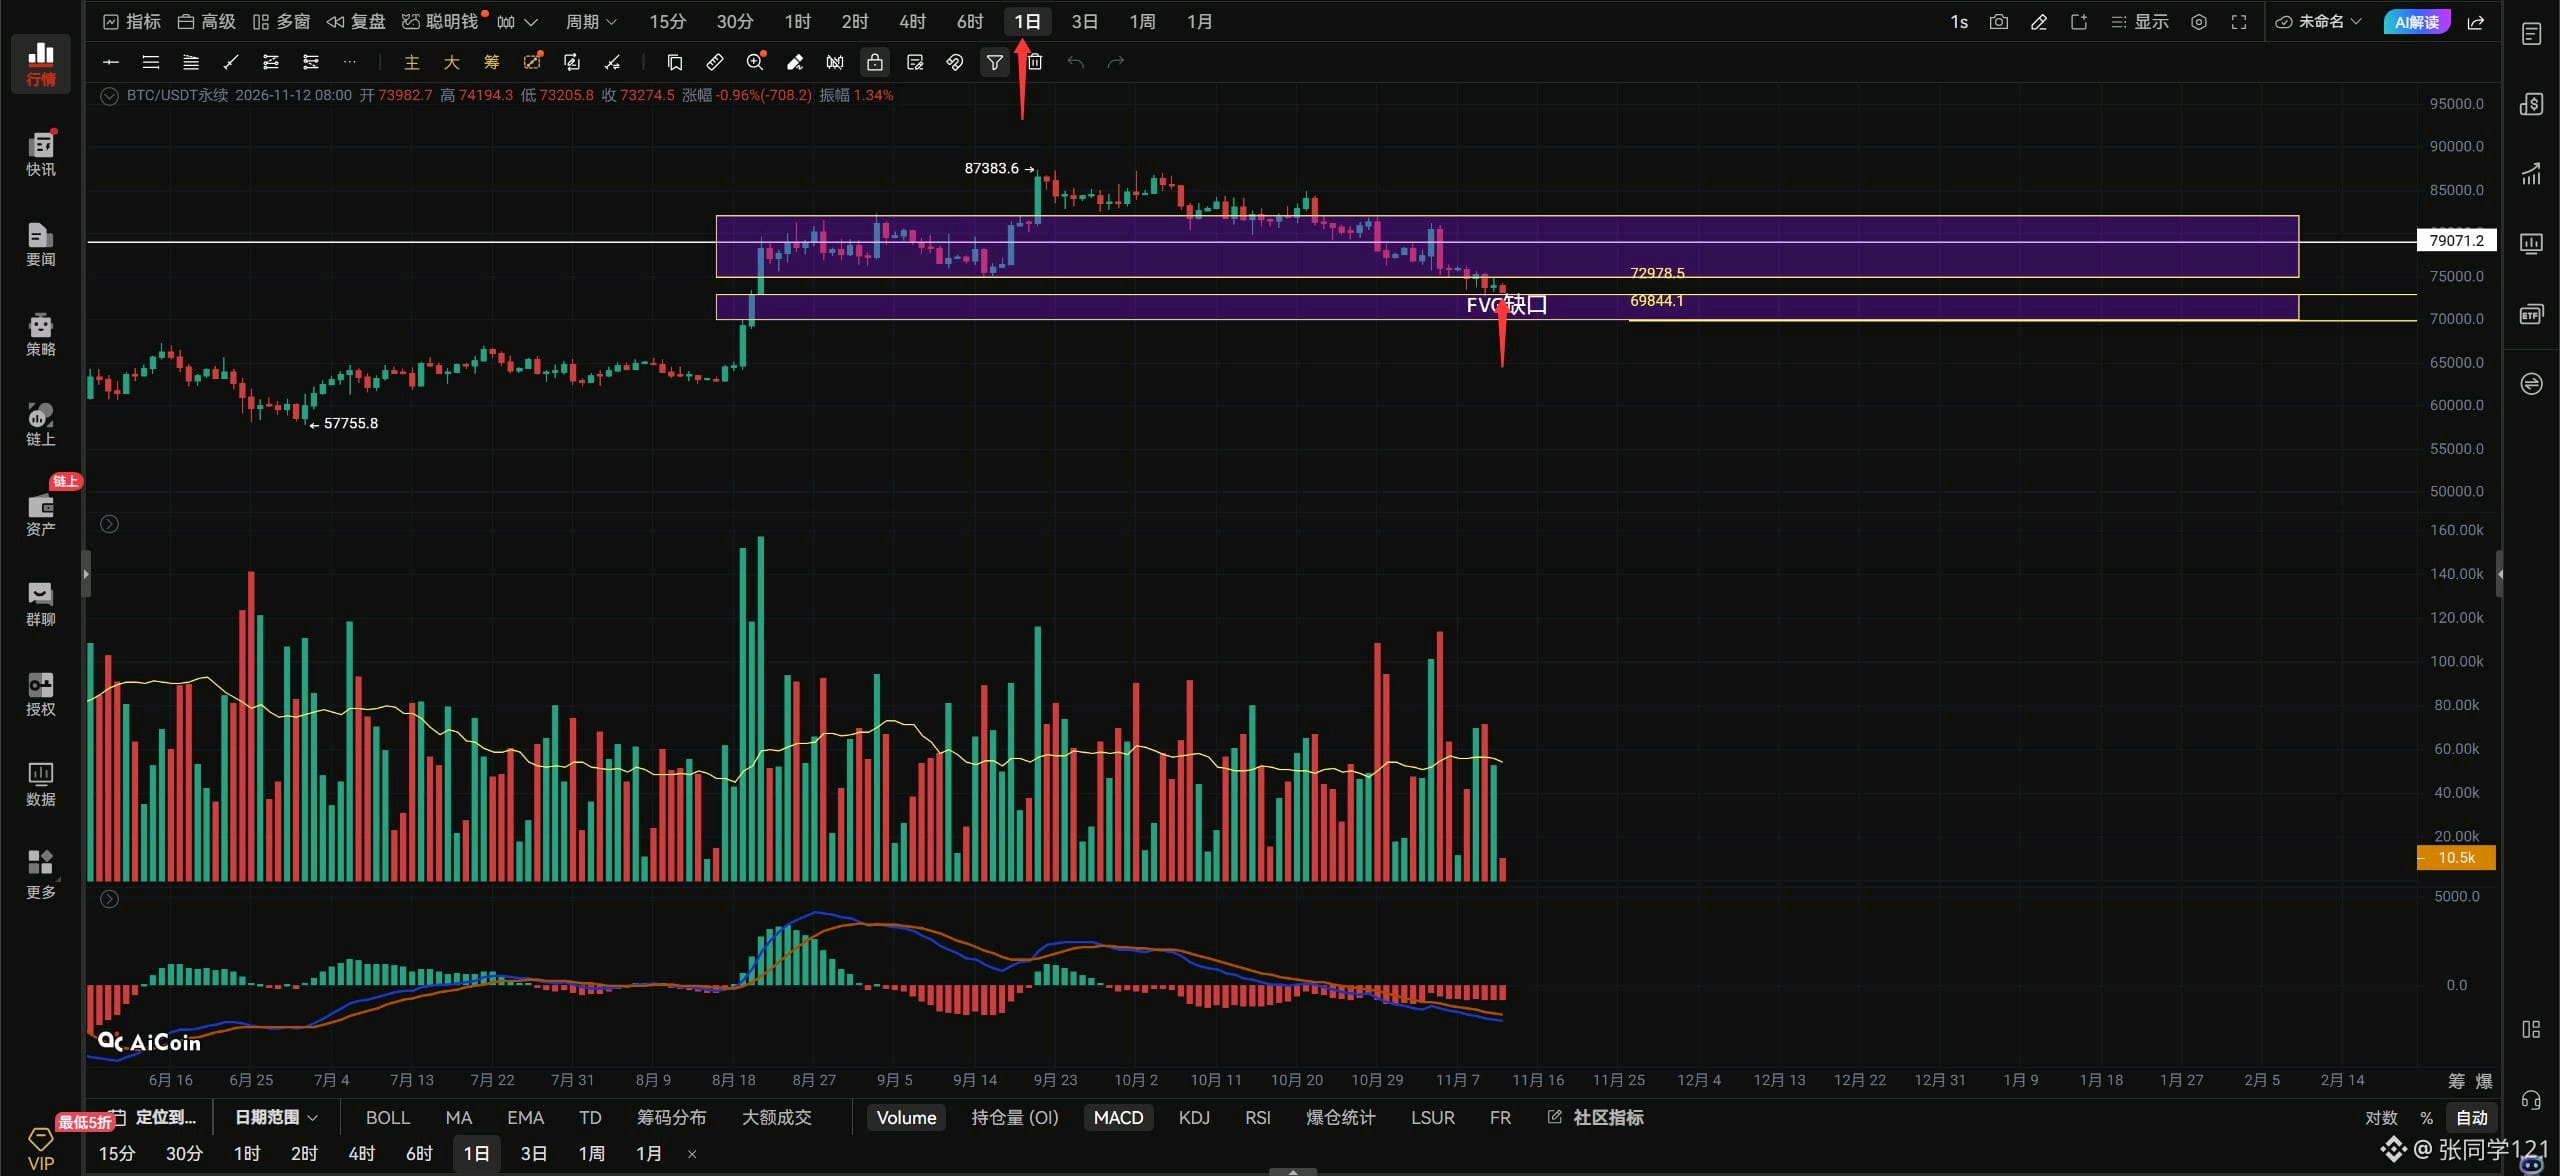
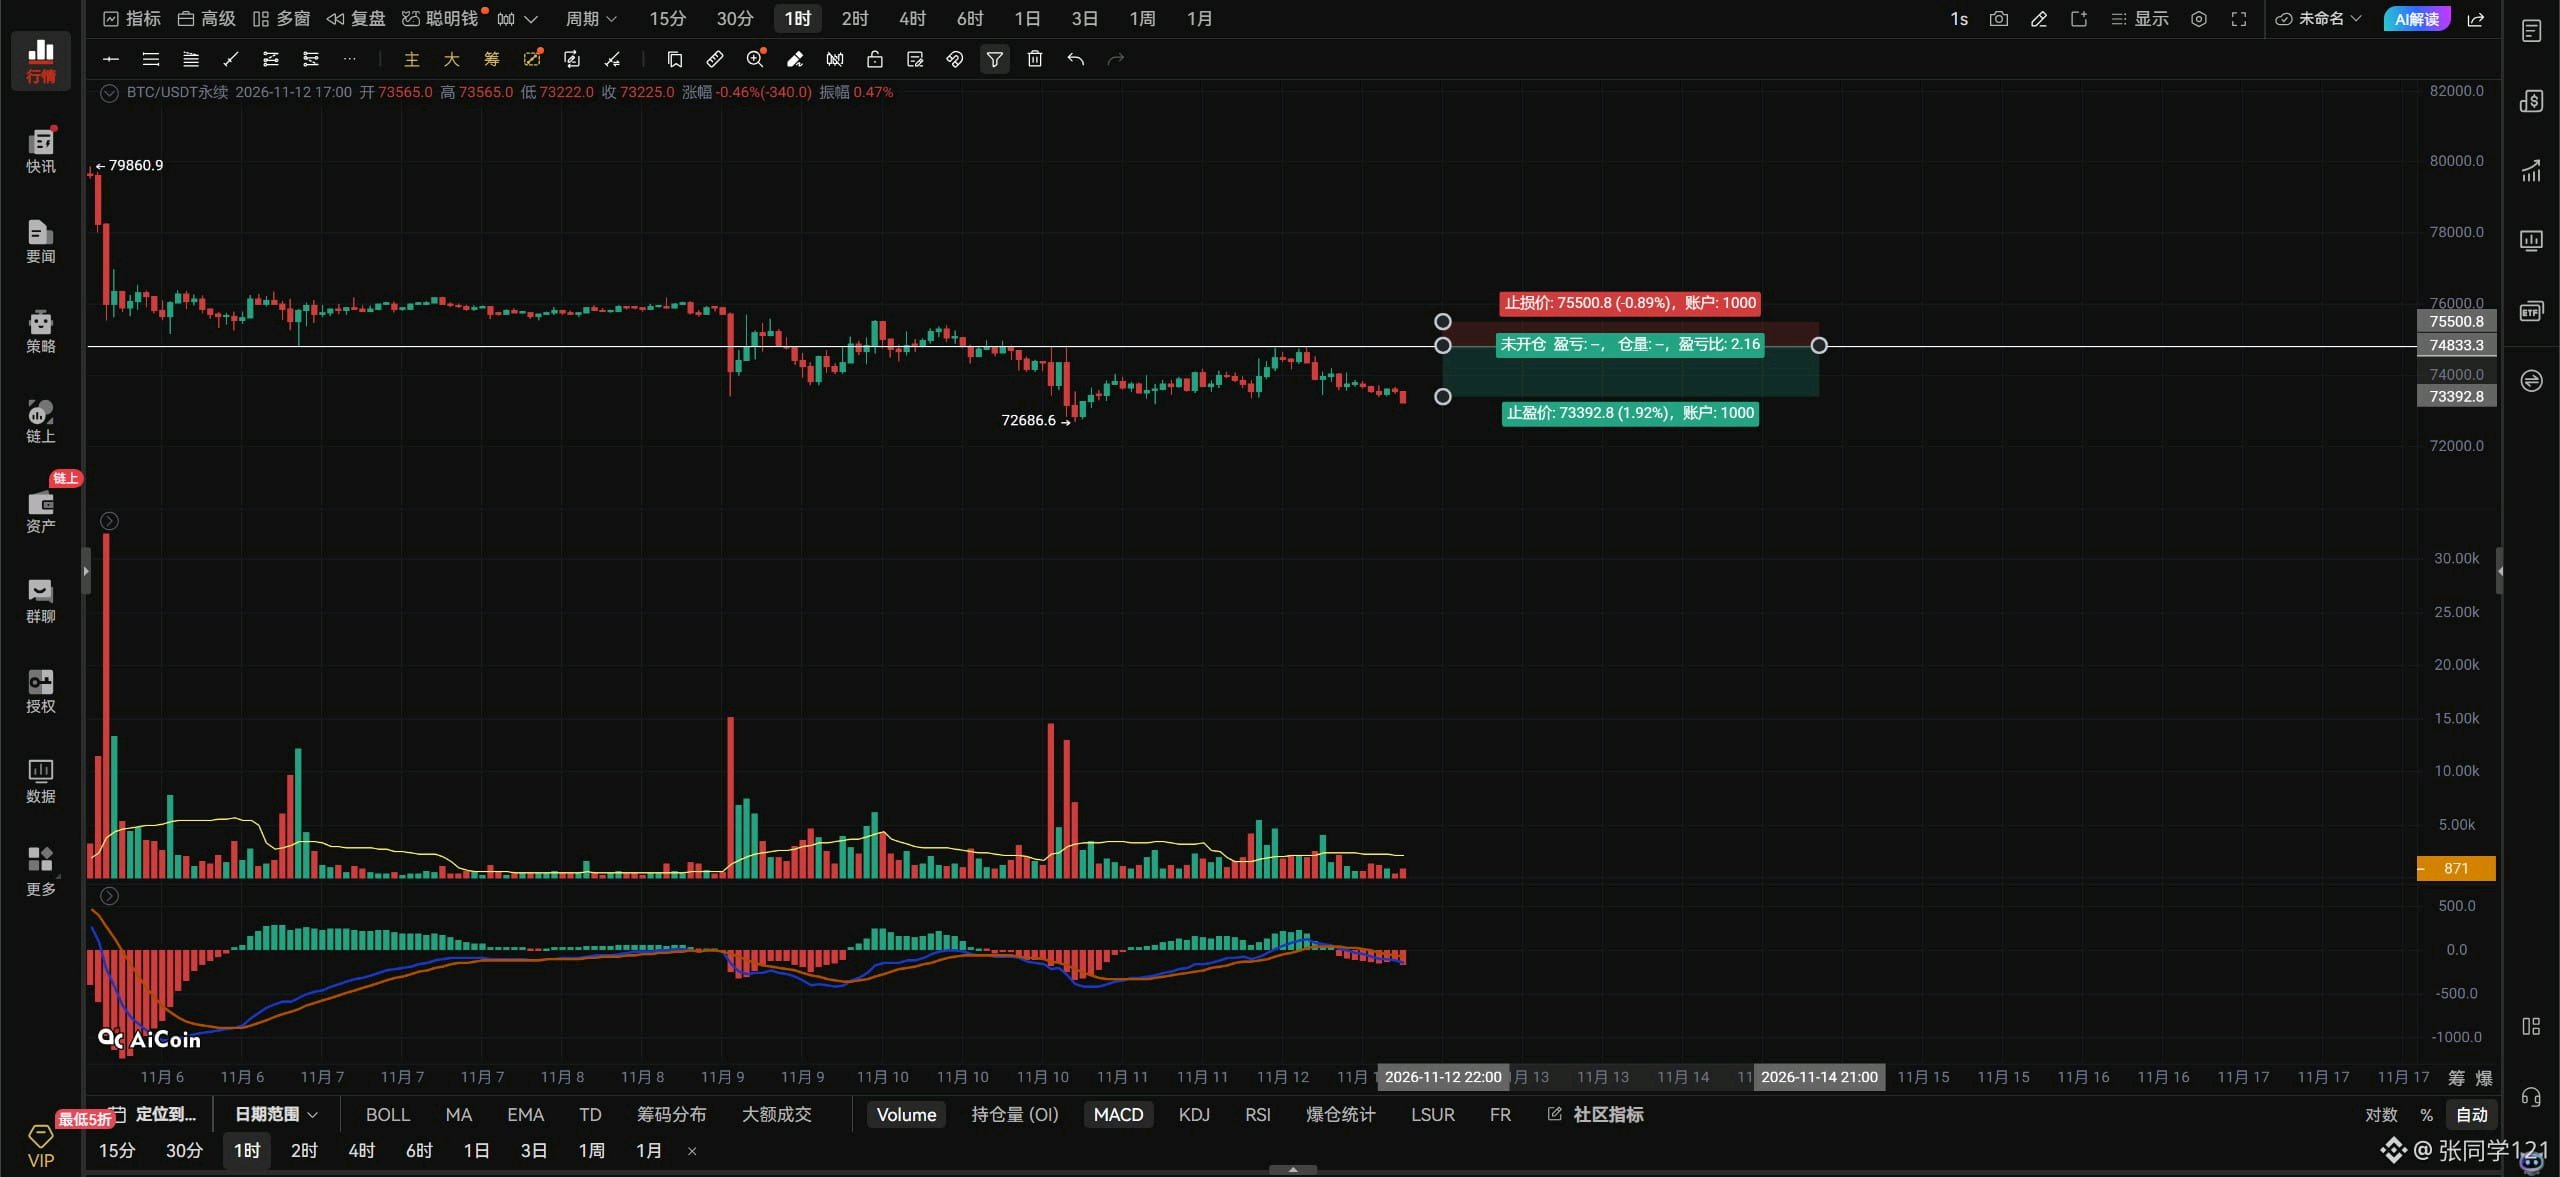
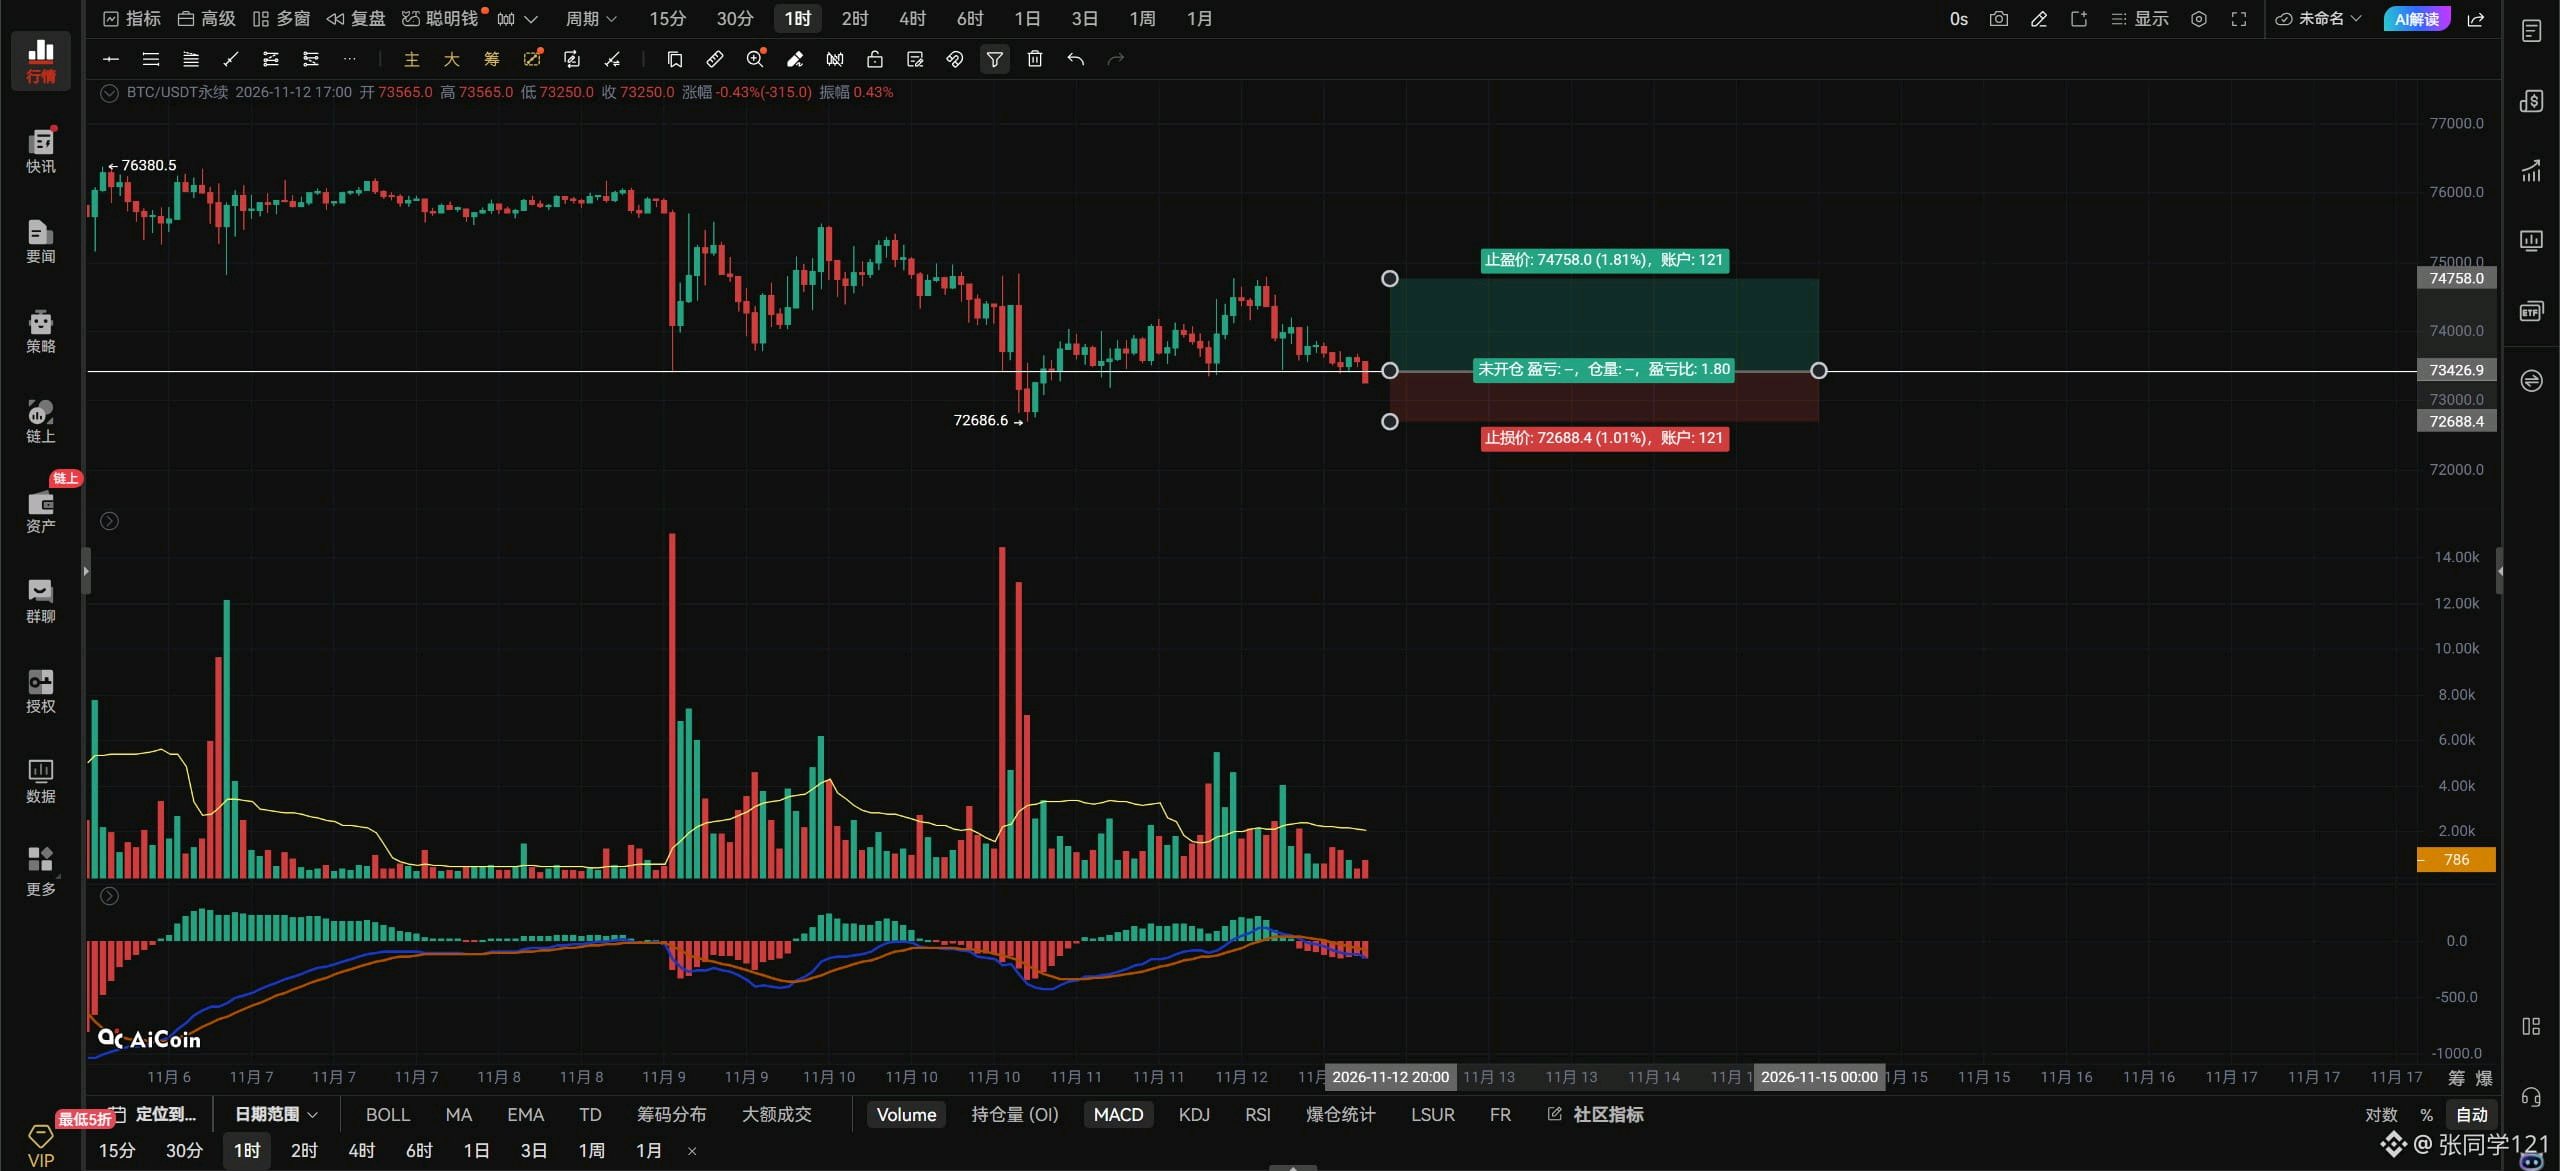
$ETHUSDT 今後の見通し: ETHについて:出来高を伴って2058を上抜けた場合は、右側でロング(買い)。必ずストップロスを設定すること。 出来高を伴って2047を下抜けた場合は、右側でショート(売り)。ストップロスを設定すること。 2003までリテストし、サポートが維持されていることが確認できたら、1ユニットでロングエントリー。 1956を割り込んだらストップロス。 1時間足チャートにおいて、ETHが2058以上を維持できれば、2097~2146を視野に入れる。 ETHの上方にある2097は、1ユニットでショートするポイントとして注視。 2146を上抜けた場合はストップロス。 左側の指値注文:1956でロング。1900を割り込んだらストップロス。 上値抵抗線: 2058–2097–2146 下値支持線: 2047–2003–1956 4時間足で2047を下抜けると、2003~1956が視野に入る。トライアングルからのダマシ上げの後、ETHは2097を突き抜けて維持することに失敗した。ETHが下落を止め、レジスタンスである2146に向けた反発を拡大するには、1時間足で2097をブレイクする必要がある。2097を上抜けることができず、現在は2047のサポートを割り込む準備ができているように見える。2047を割り込めば、前回の安値である2003をリテストするだろう。前回の安値まで戻し、そこで踏みとどまれば、ボトムシグナルが現れ、ロングの好機となる可能性がある。あるいは、一時的に前回の安値を下回った後に奪還できれば、ETHは買い場となるだろう。もし前回の安値を割り込んで回復できなければ、ロングは避けること。その場合、次の安値である1956がターゲットとなる。理想としては、ETHが2047以上を維持することだ。そこで持ちこたえられれば、2047と2097の間でレンジ相場となるだろう。もし2047を割り込んでしまえば、ETHはまたしても終わりだ。以上。#ByXIMPACT
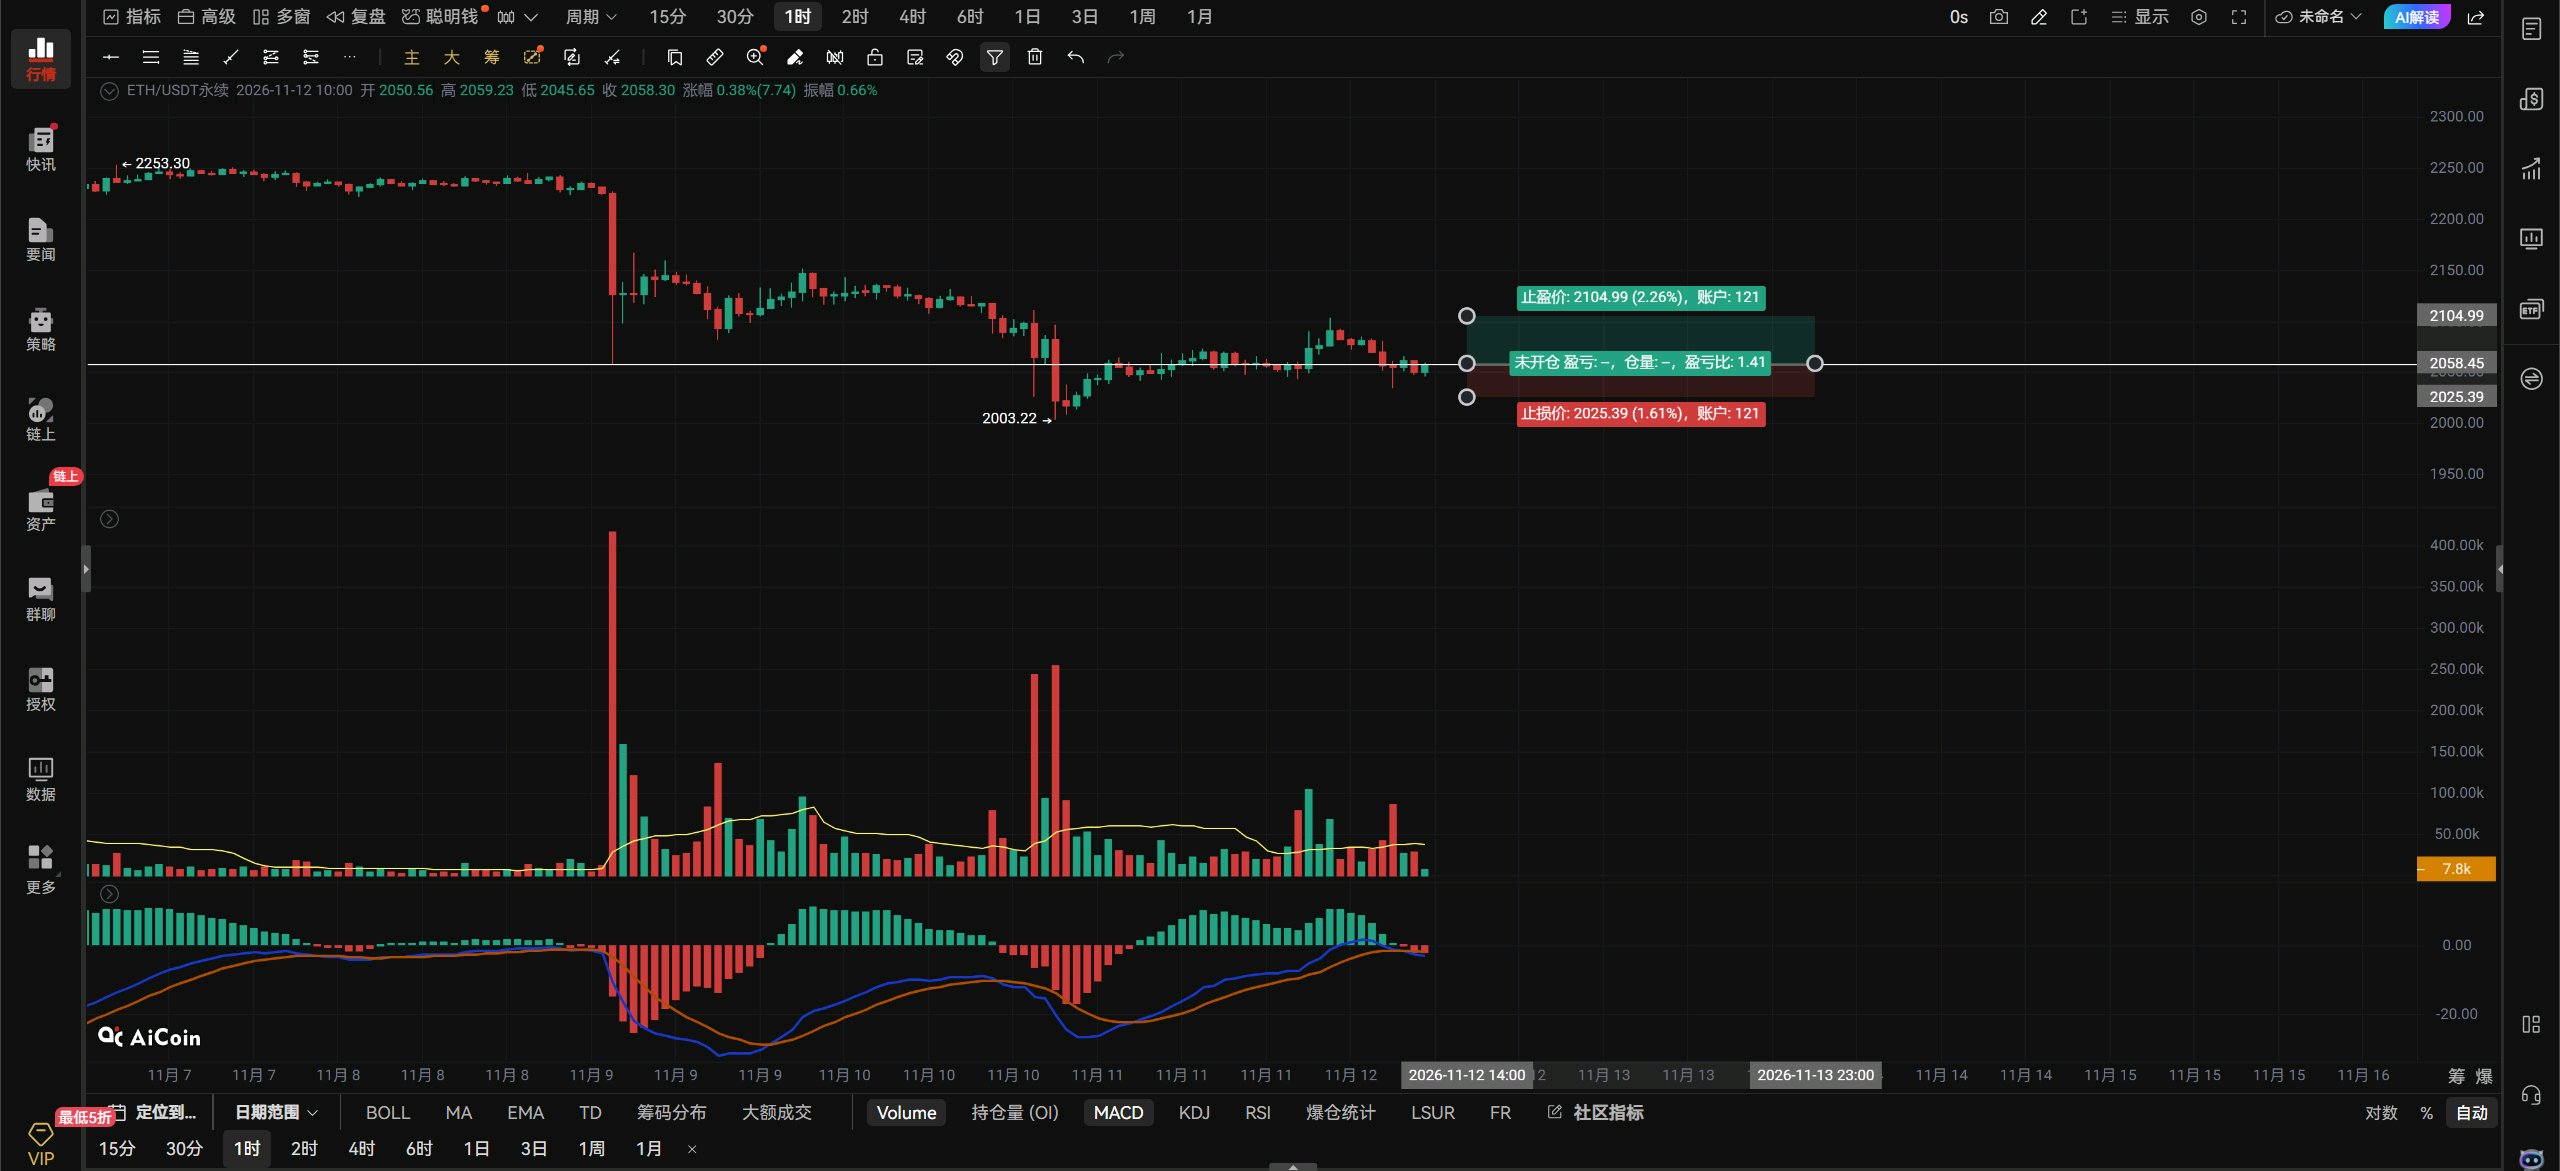
$BTCUSDT 11月12日正午の市場見通し🫏 $BTC 見通し: ビットコインの価格アクションは本当にひどいもので、少し上昇しても全く追随の動きがありません。BTCは反発して74000ドルを突破しましたが、74800ドルの抵抗線でブロックされ、反発を伸ばすことができませんでした。現在は引き戻されています。皆さん、上の赤い矢印を見てください。74800ドルが何回テストされたか数え切れないほどです。BTCが74800ドルを突破できなければ、反発を伸ばすことはできません。BTCを具体的に支えるポジティブなニュースもなく、無力で孤立し、方向性を見失っているように見えます。抵抗レベルが突破できずに何度もテストされた場合、BTCが自力で突破することは非常に困難です。外部からのポジティブなニュースによる後押しが必要です。さもなければ引き戻すしかありません。BTCは現在再び74000ドルを下回って取引されています。次は74000ドルを奪還できるかどうかに注目です。奪還できれば、74800ドルの抵抗線に再び挑戦するチャンスがあります。74000ドルを奪還できなければ、前回の安値である72691ドルの2回目の再テストを覚悟しましょう!もし前回の安値を再テストして持ちこたえれば、ダブルボトムが形成される可能性があります。BTCのロングを狙う人は、前回の安値72691ドルでの底打ちシグナルを待つか、BTCが74000ドルを突破した後に、74000ドルを割り込まずに再テストするのを確認してからロングを入れるのが良いでしょう。BTCが74800ドルを上抜けることも、72691ドルを下回ることもなければ、今日の相場はレンジ内での調整となるでしょう!荒れた相場が戻ってきました。 積極的なトレーダーは、BTCが強い出来高を伴って74000ドルを上抜けた場合に右側(順張り)でロングを狙えます。強い出来高を伴って73360ドルを下抜け、その反発で同レベルを奪還できなければ、右側でショートを入れましょう。ストップロスをお忘れなく。 1時間足チャートでは、BTCが74000ドルを上抜け、それを維持できれば74800〜75568ドルを目指す展開となります。74000ドルを超えられなければ、意味がありません。 4時間足チャートでは、73360ドルを下抜ければ72691〜71268ドルを目指す展開となります。 上の抵抗線: 74000-74800-75568 下のサポート線: 73360-72691-71268 #ByXIMPACT
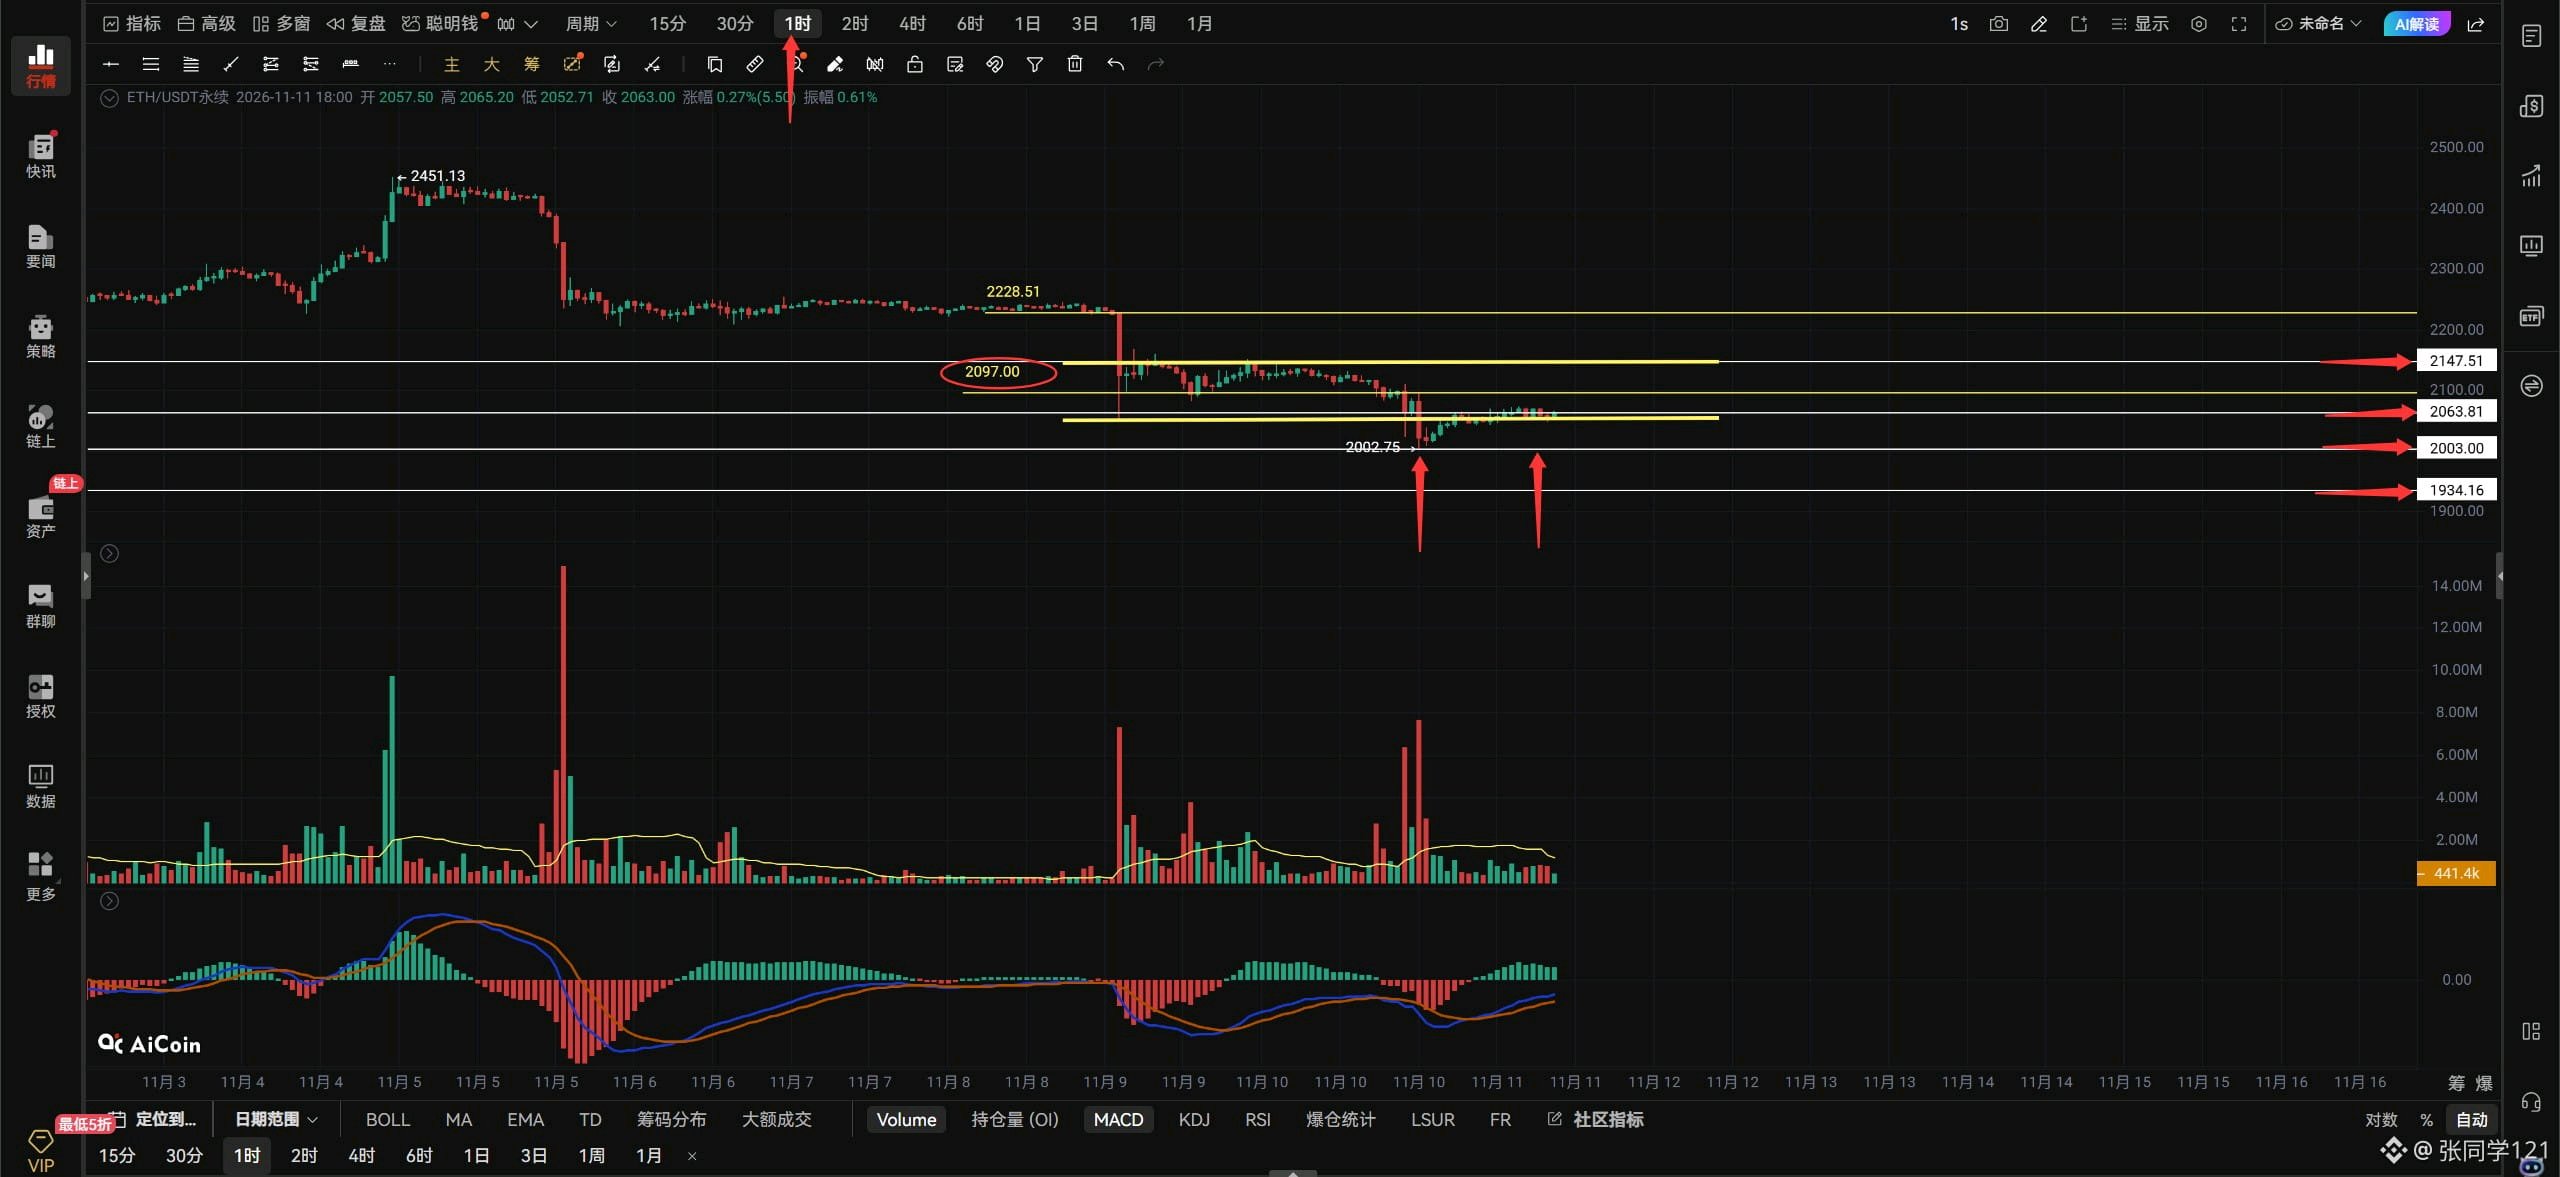
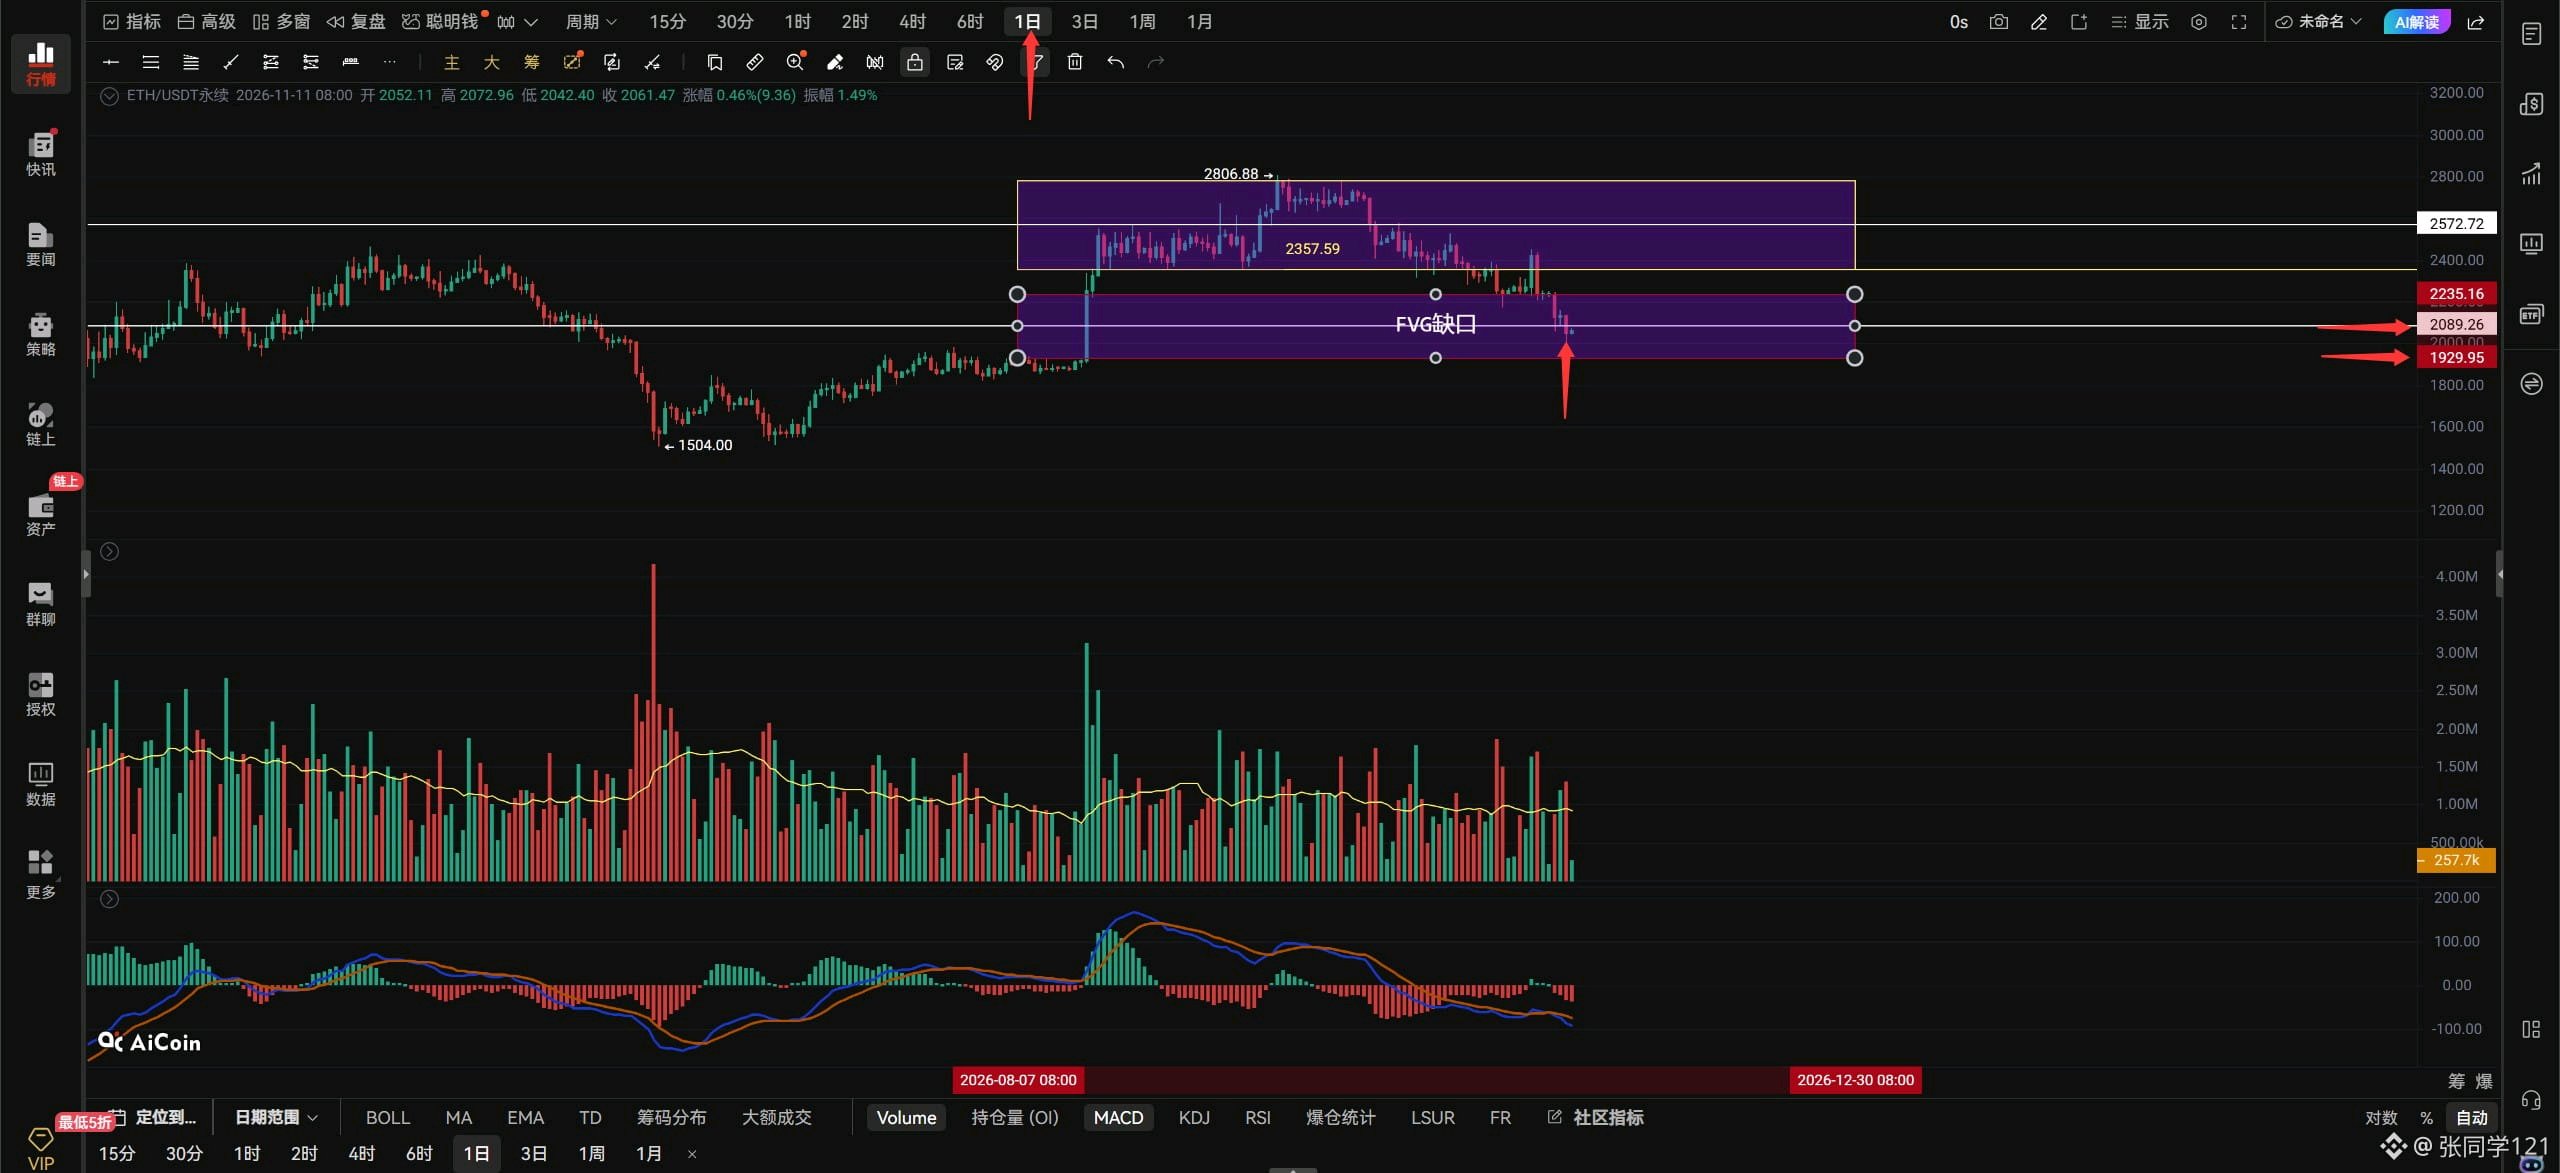
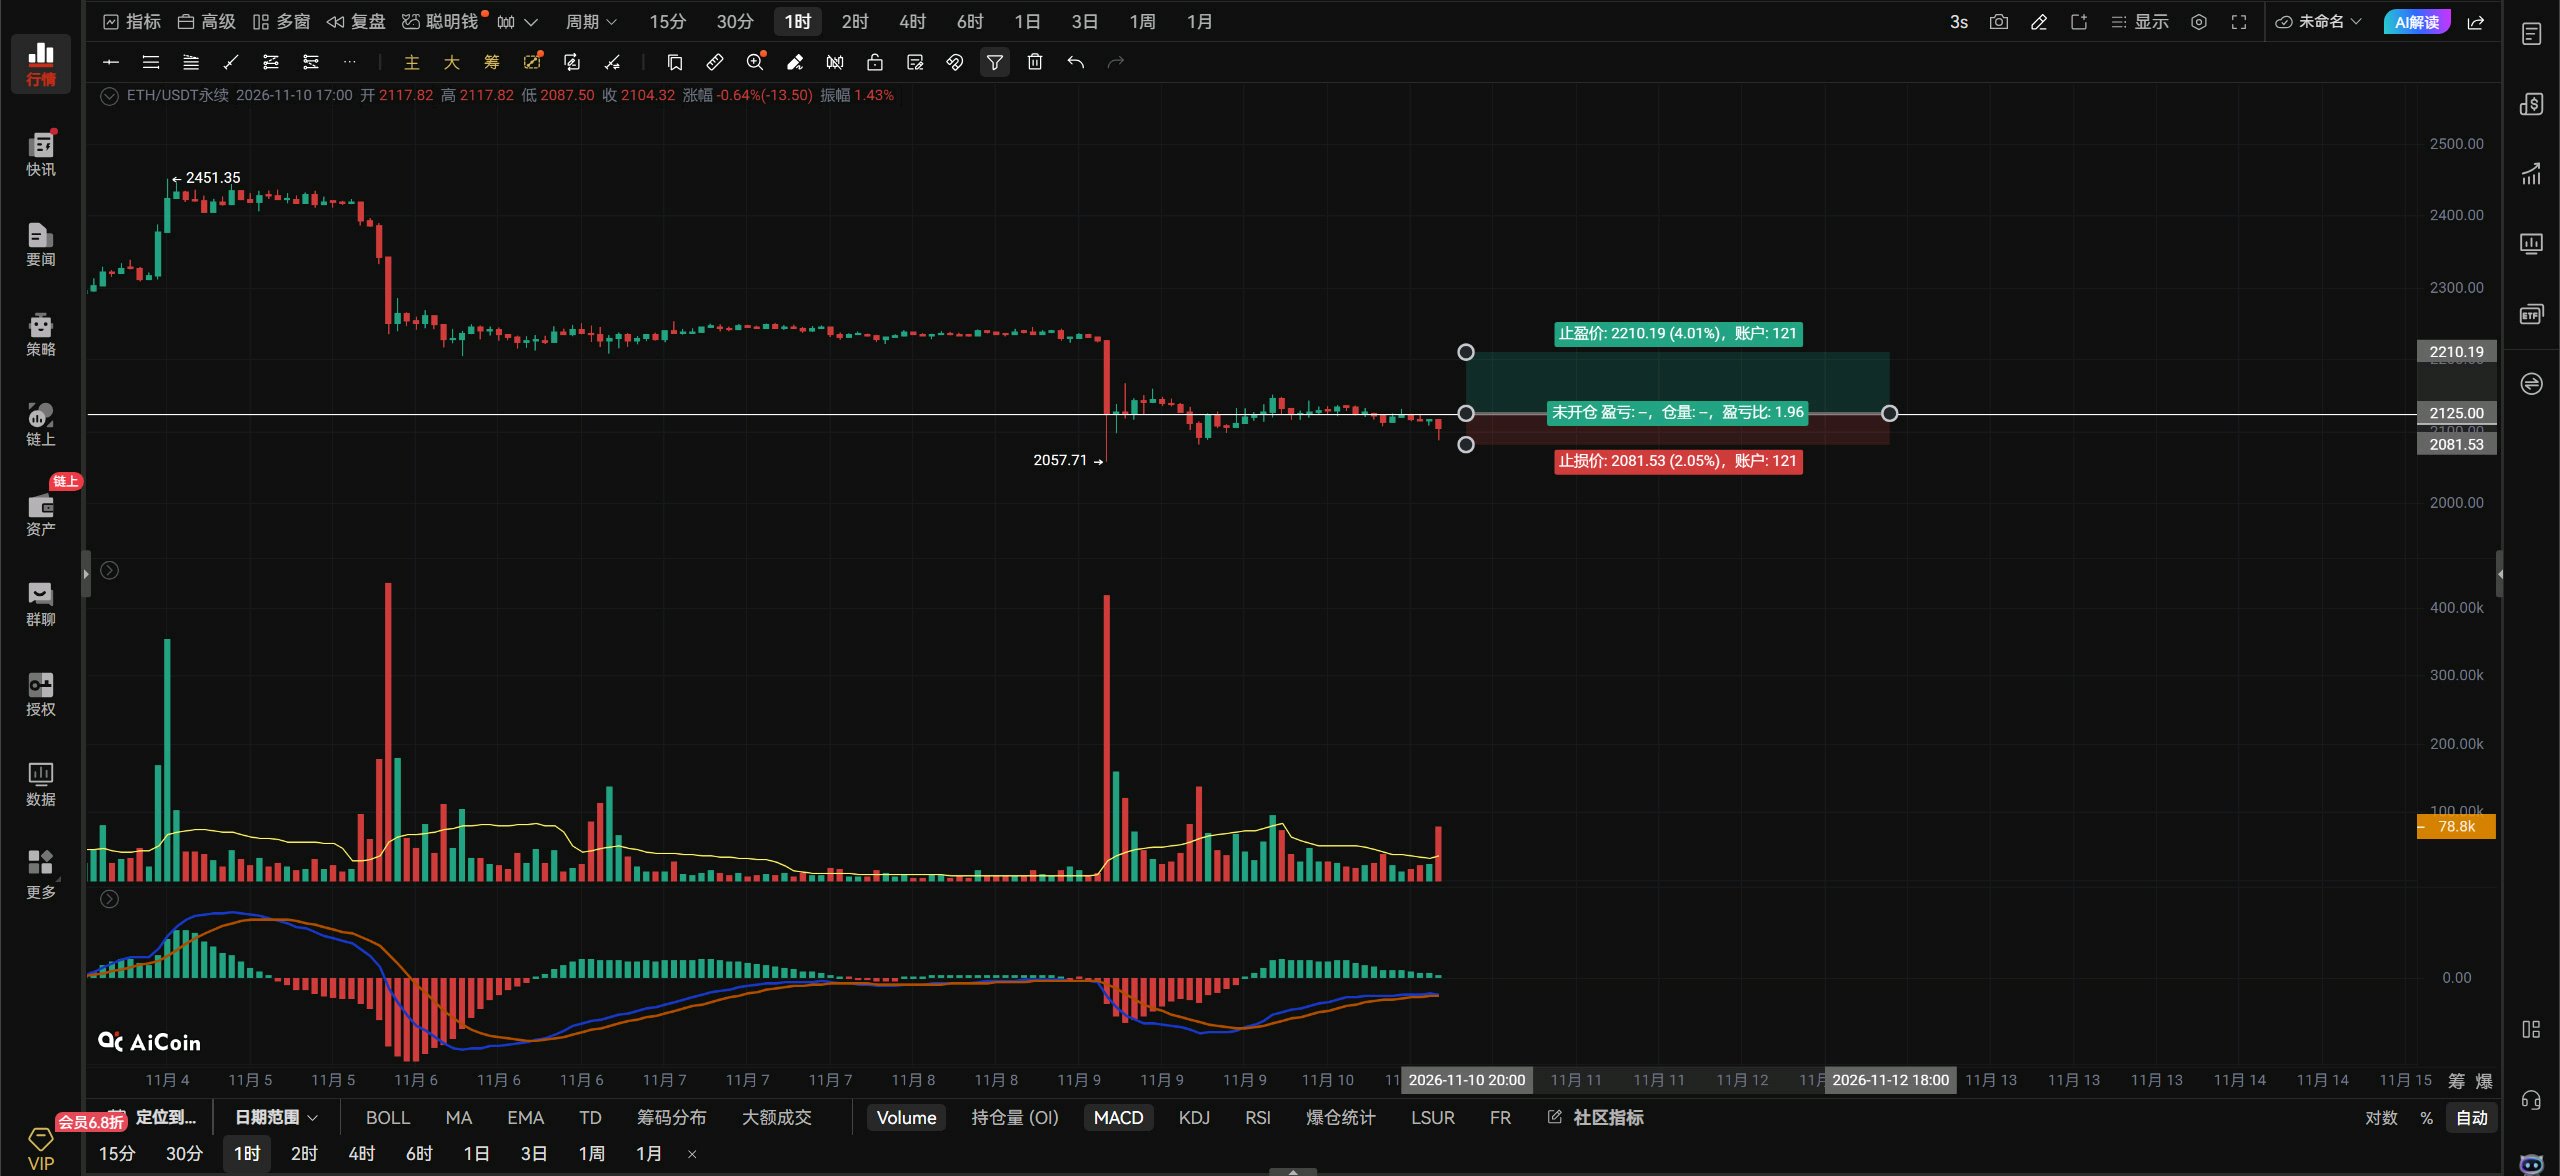
$ETHUSDT Evening outlook: 11/11. Ethereum made a false break below the 2147–2063 consolidation range, but has now moved back above 2063. It must stay above 2063 to find a bottom and rebound, with 2097–2147 as the upside target. Only a break above 2147 would restart the hourly uptrend. If Ethereum pulls back and breaks below 2063, it likely won’t hold the previous low at 2002. 2000 is major support for Ethereum, and this is the first retest of that level. If the first retest of major support at 2000 can’t produce even a $150 rebound, that suggests buyers around 2000 haven’t stepped in—people just aren’t interested. Everyone may have reached the same conclusion: Ethereum is bound to break below 2000. So if Ethereum’s first rebound from 2000 can’t get back above 2147, a second retest of 2000 will certainly break below it. Ethereum will only be temporarily out of danger if it can get back above 2147. If 2000 breaks, watch 1934! If you want to go long on Ethereum, keep an eye on major support at 2000; go long if the retest holds and a long signal appears. If it breaks straight through, wait and see. Go long on Ethereum if it breaks above 2070 with volume; go short if it breaks below 2048 with volume. Watch for changes in volume and use stop-losses. If Ethereum holds above 2070 on the hourly chart, look for 2097–2147. If it breaks below 2048 on the 4-hour chart, look down to 2000–1934. Ethereum’s daily candle ultimately closed below 2089. Ethereum is pretty much cooked; now we’ll see whether 2000 can hold and trigger a strong rebound. If Ethereum can’t get back above 2089 on the daily chart, the next downside target is around 1929. A move to 1929 would completely fill the daily gap. Once the gap is filled, we’ll have to see how much further it can fall. For now, focus mainly on shorting rebounds, with longs as a secondary strategy to catch bounces. Ethereum is already at 2000—are you still not buying spot? Waiting for 1500–1300? If it gets down to 1500–1300, you can add to your position then! But what if it never gets there—won’t you miss out on spot? Buy Ethereum spot in batches! Don’t end up slapping your thigh when it takes off. Meeting adjourned. #ByXIMPACT
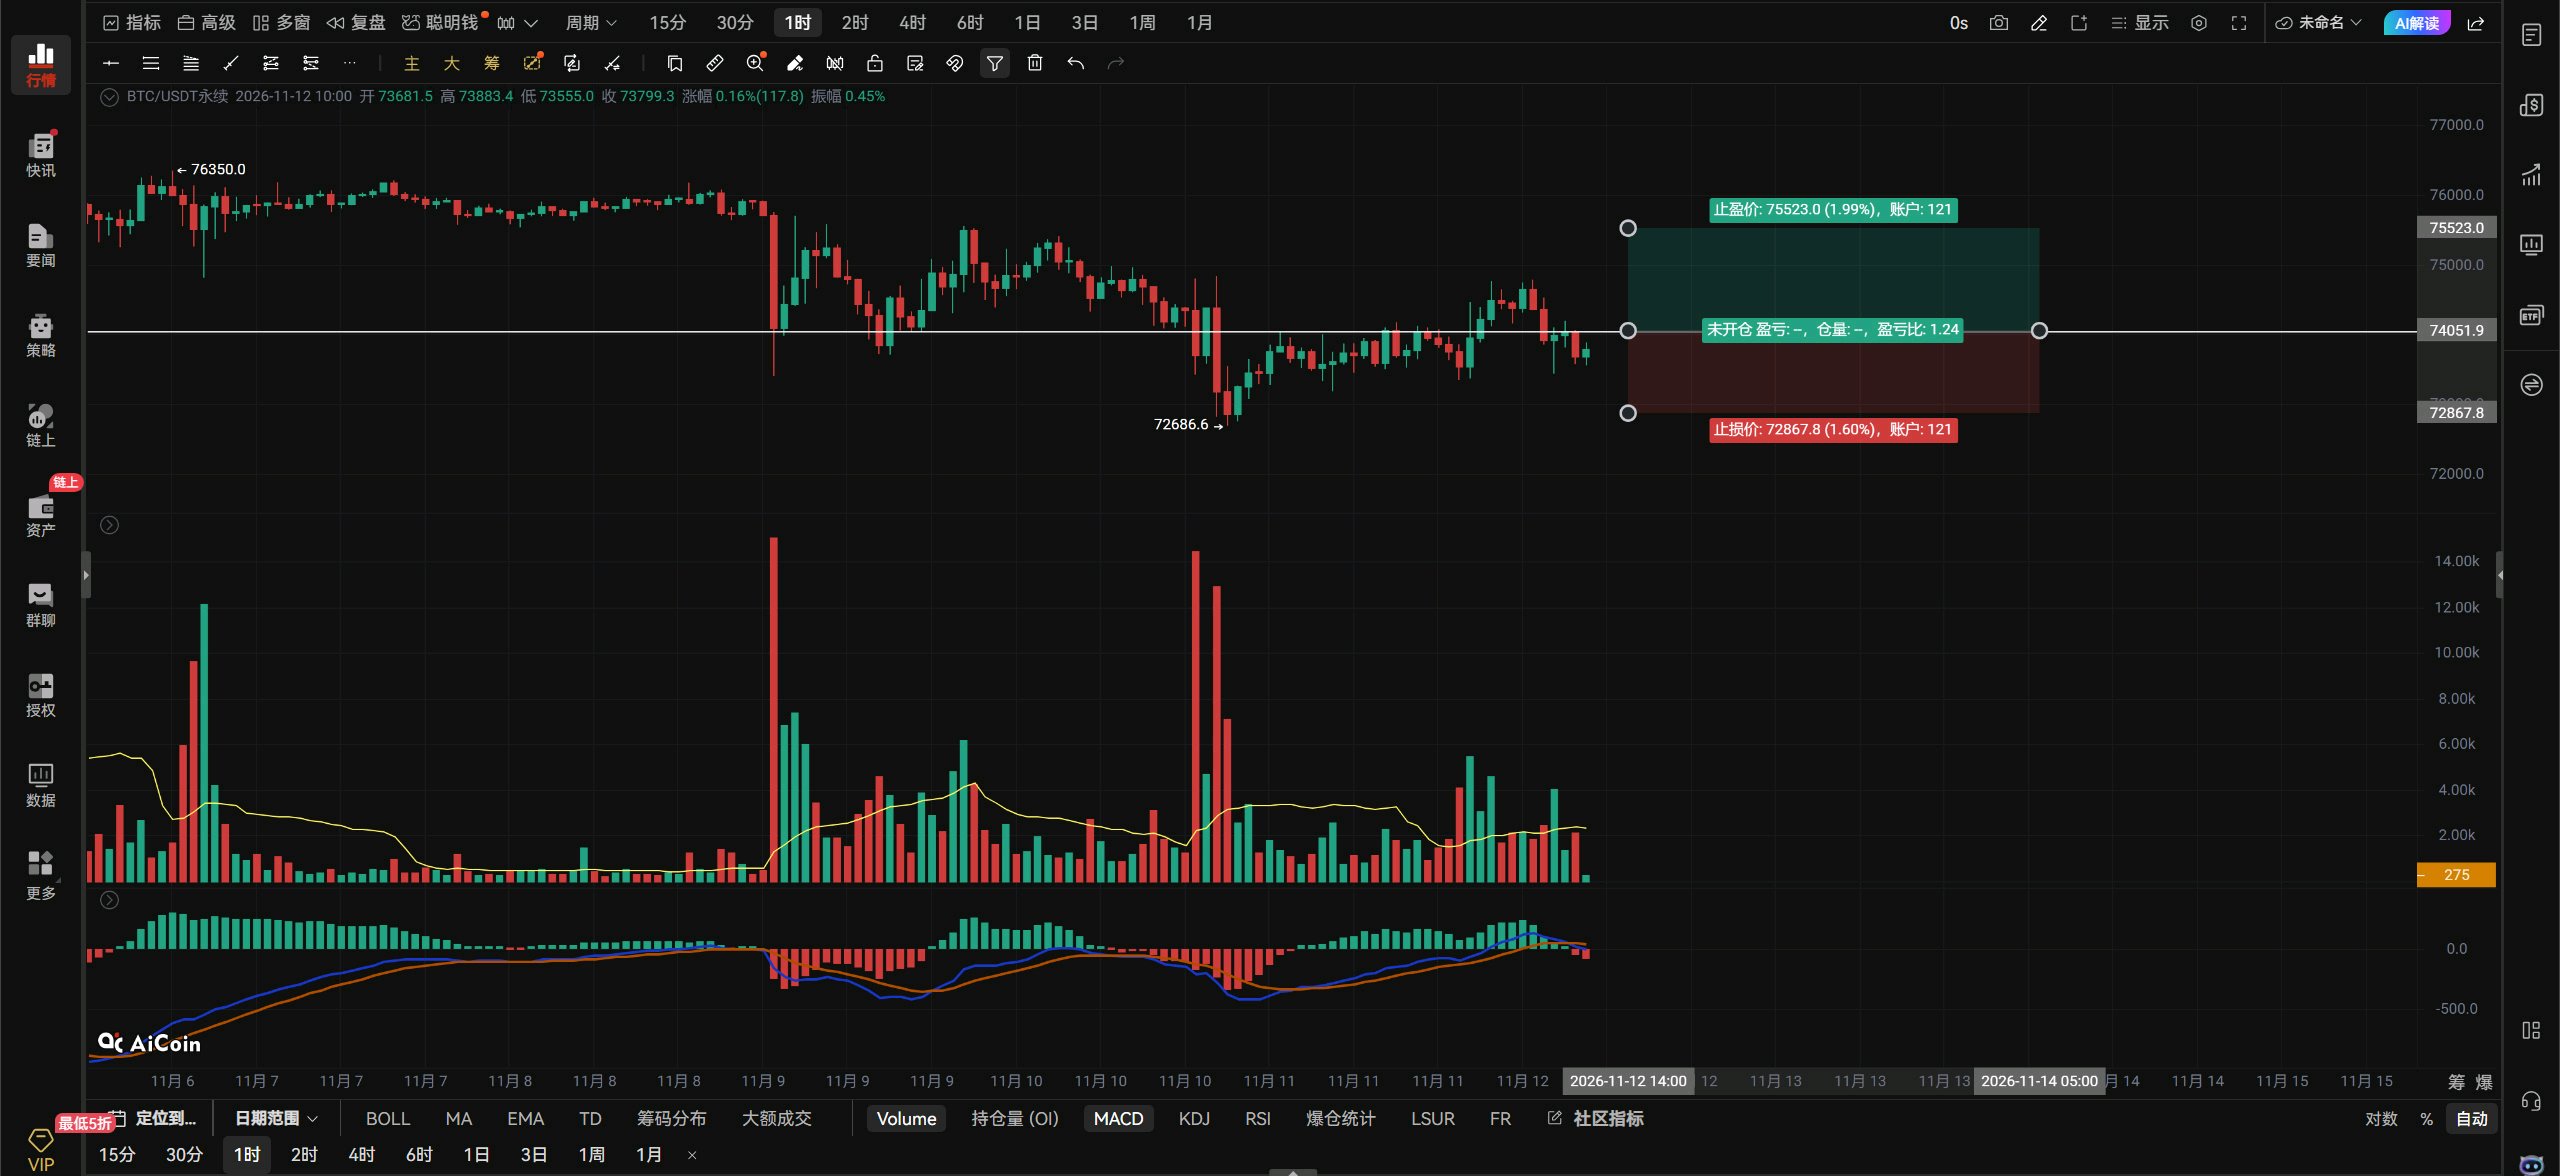
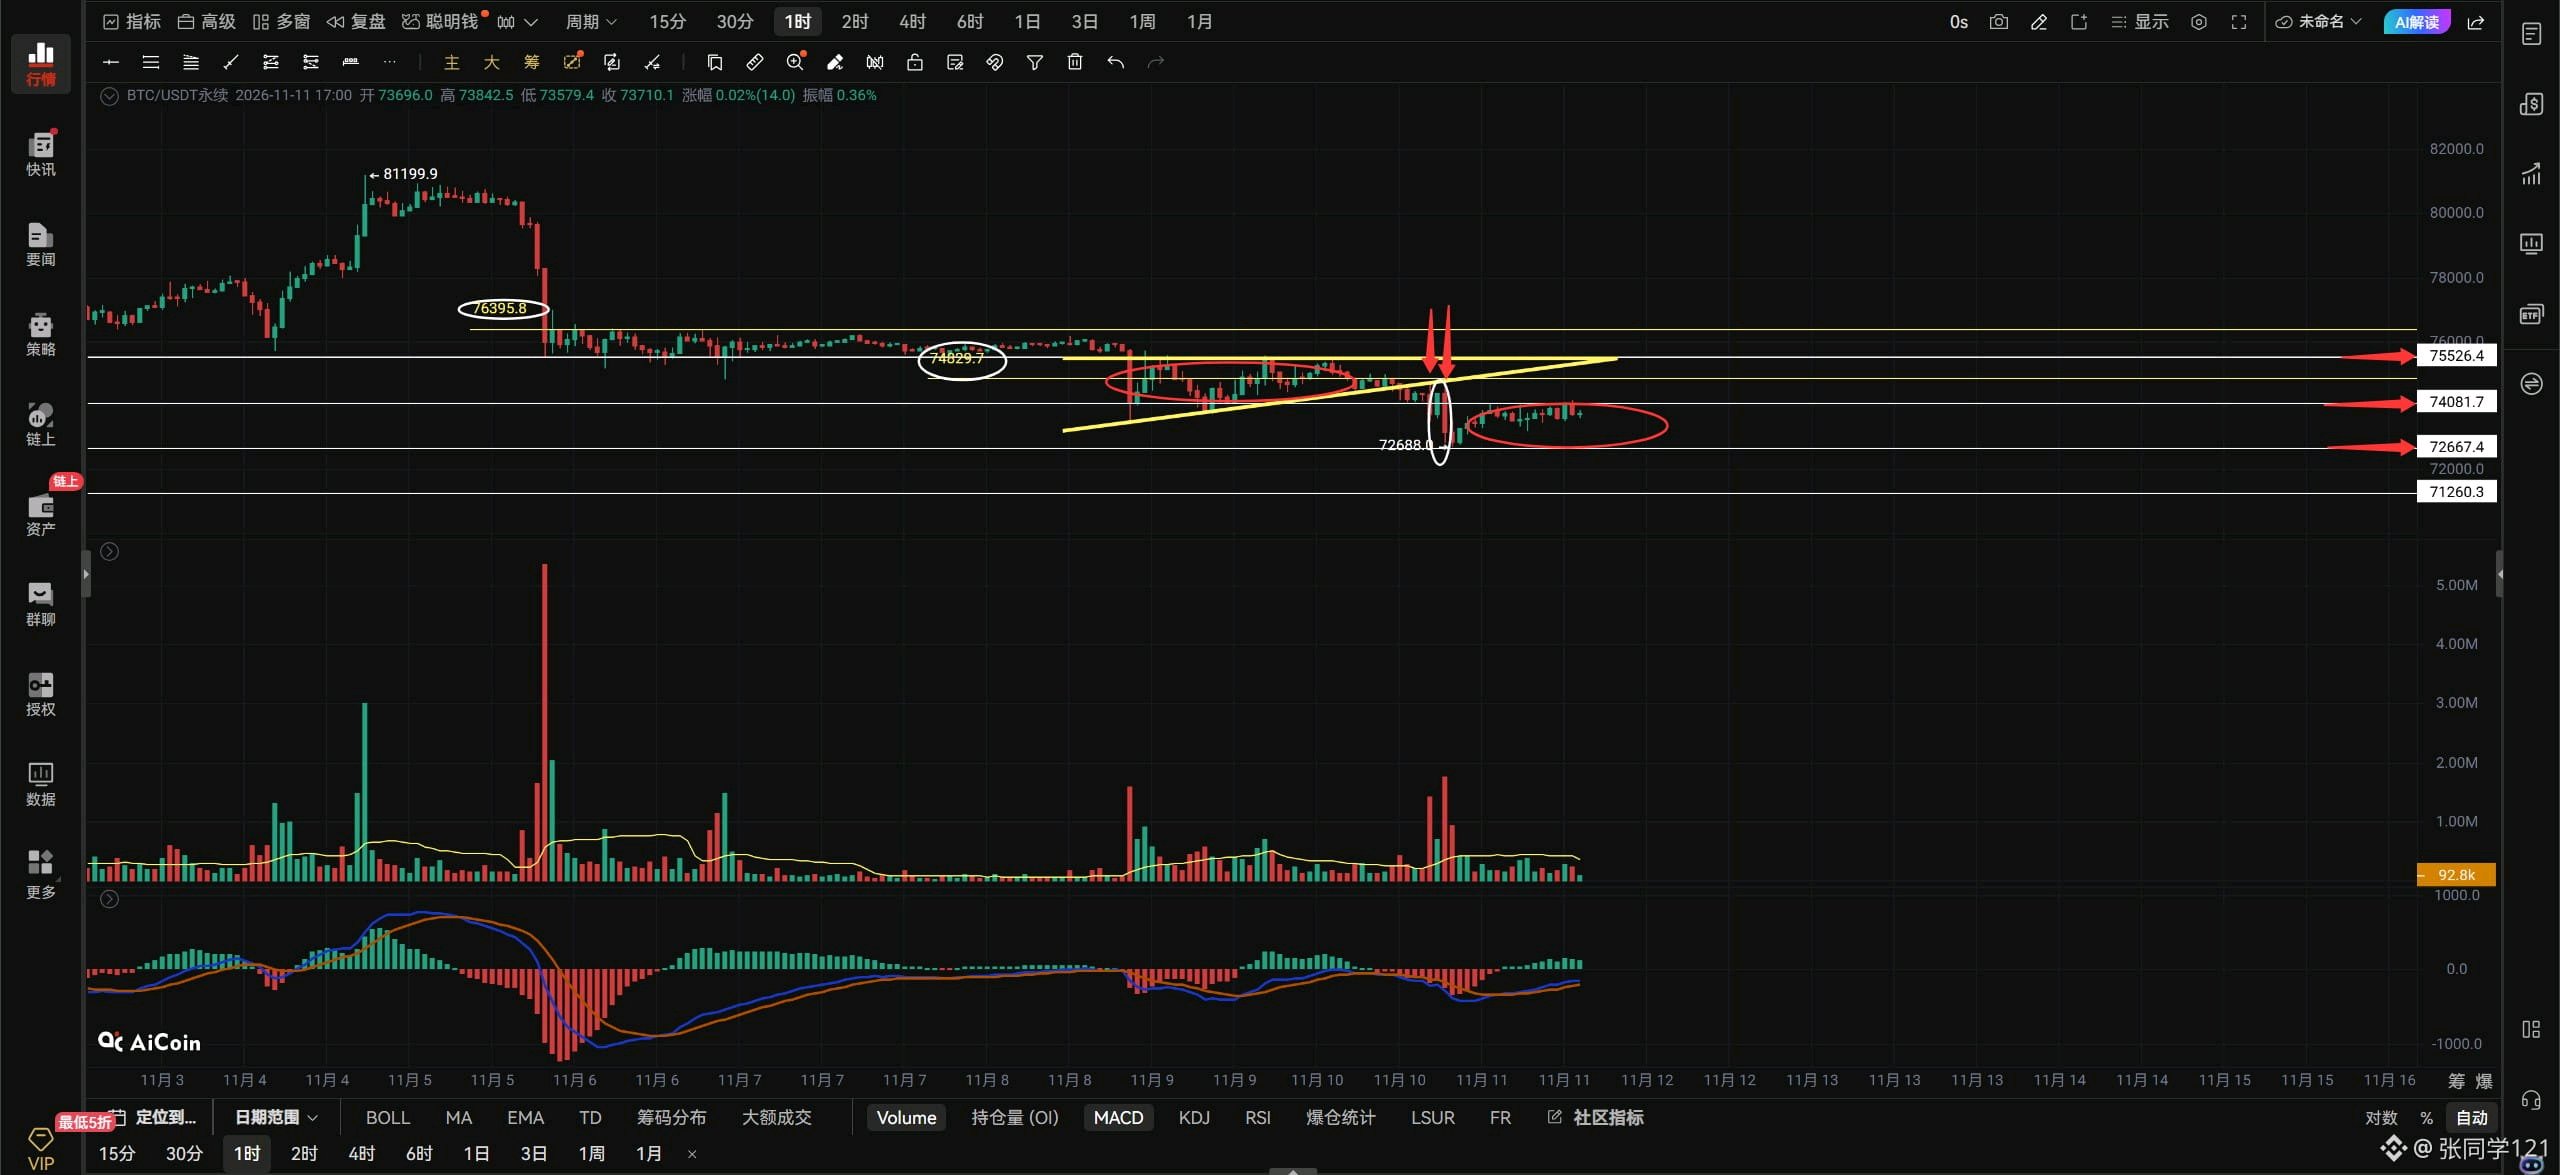
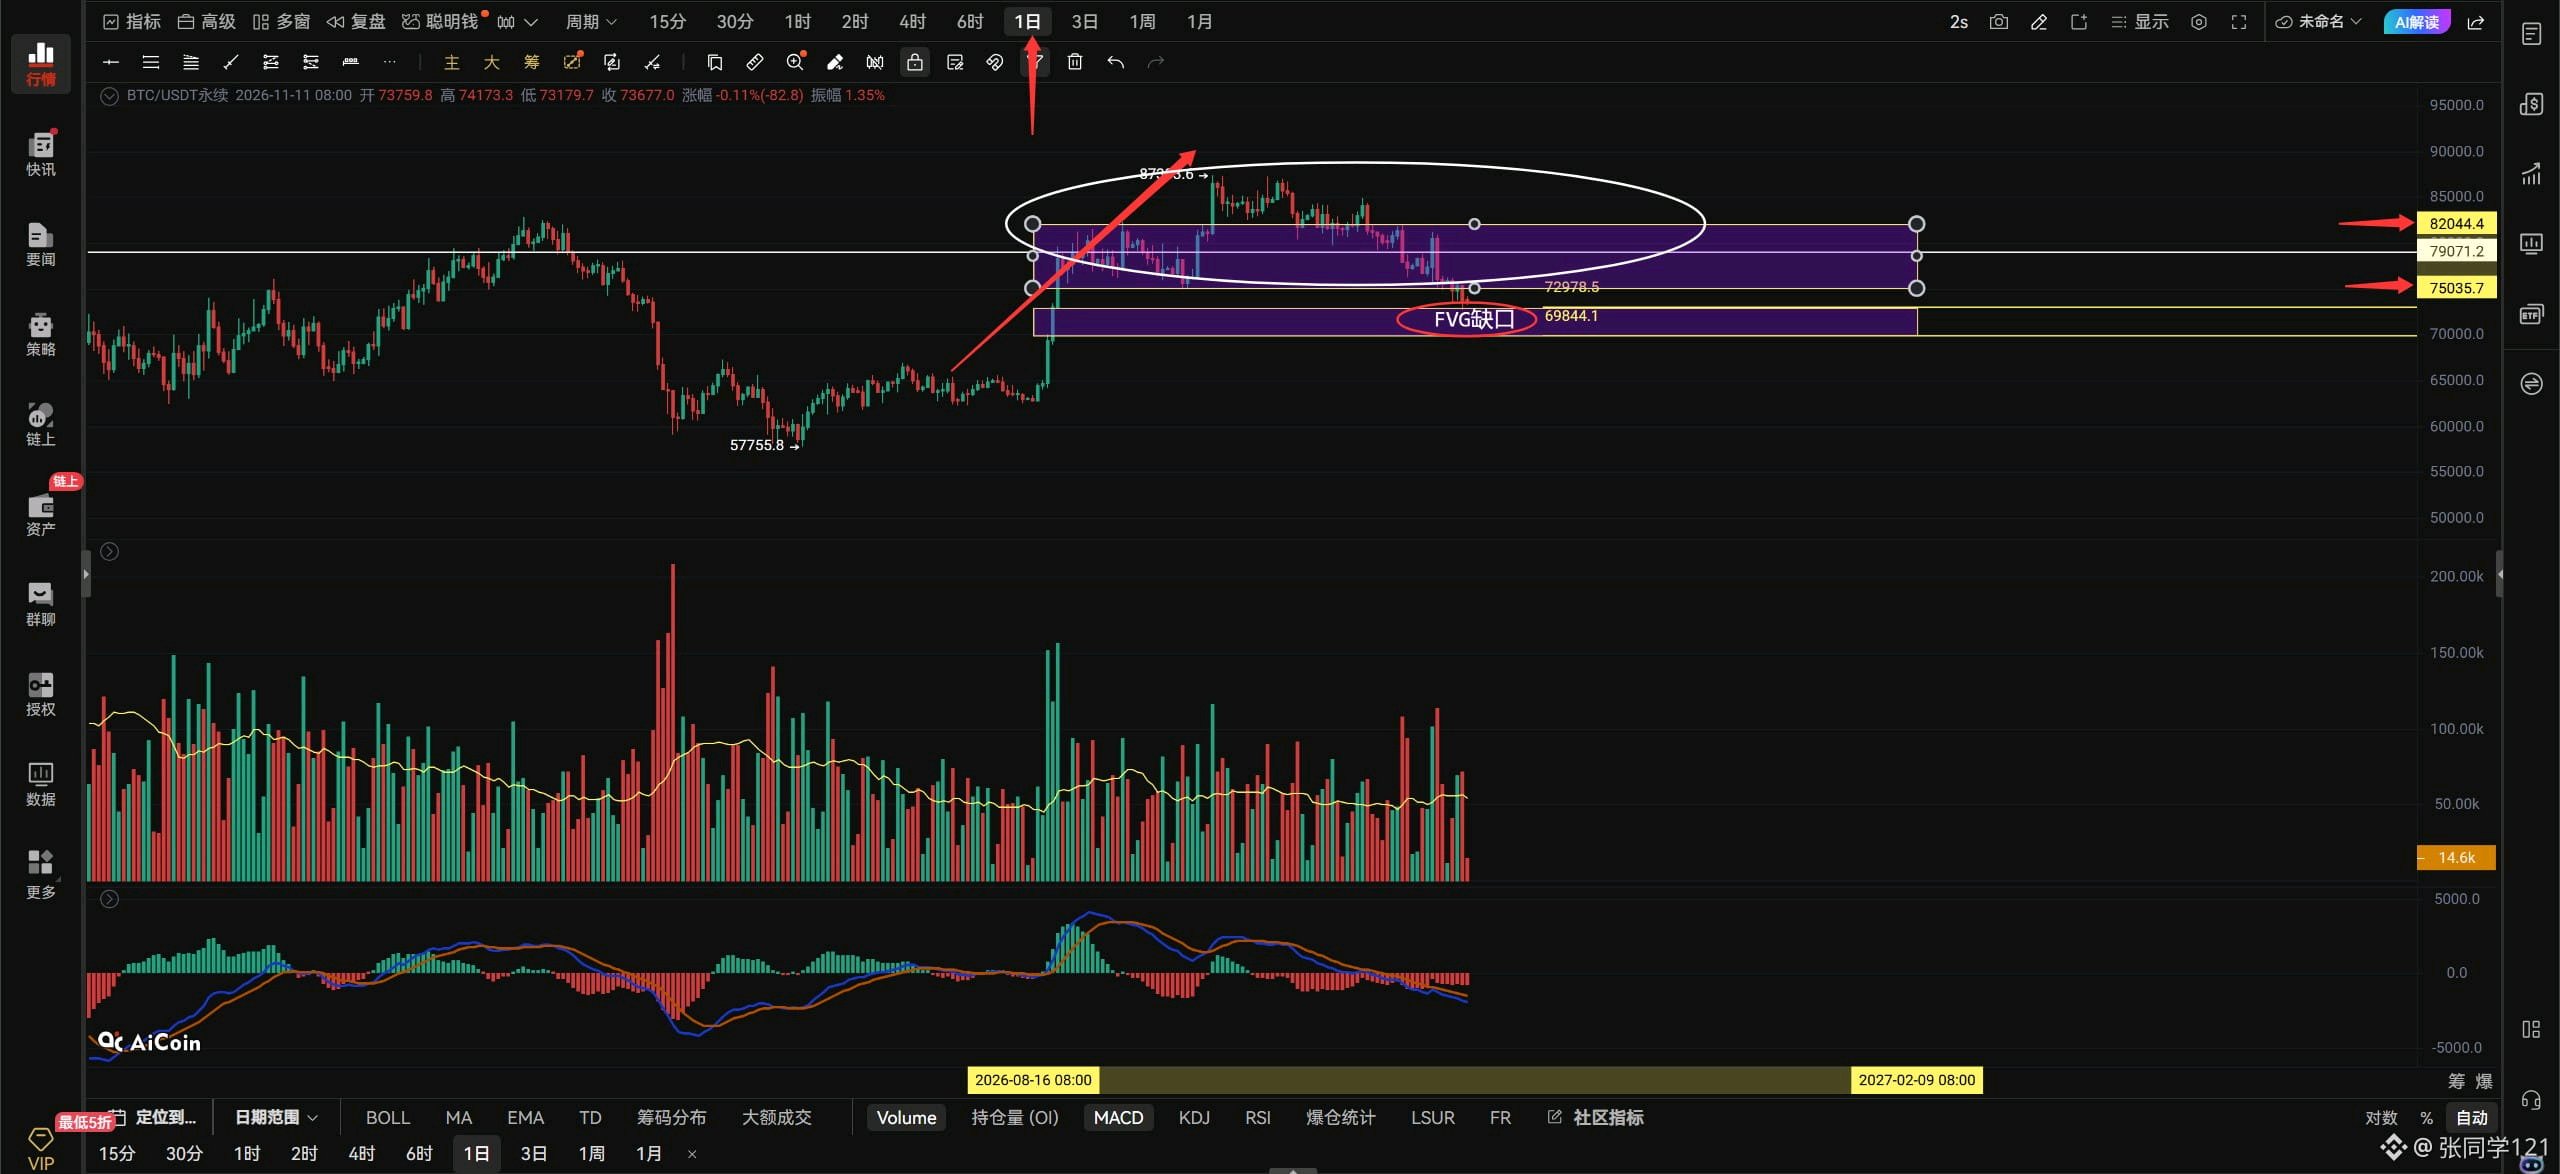
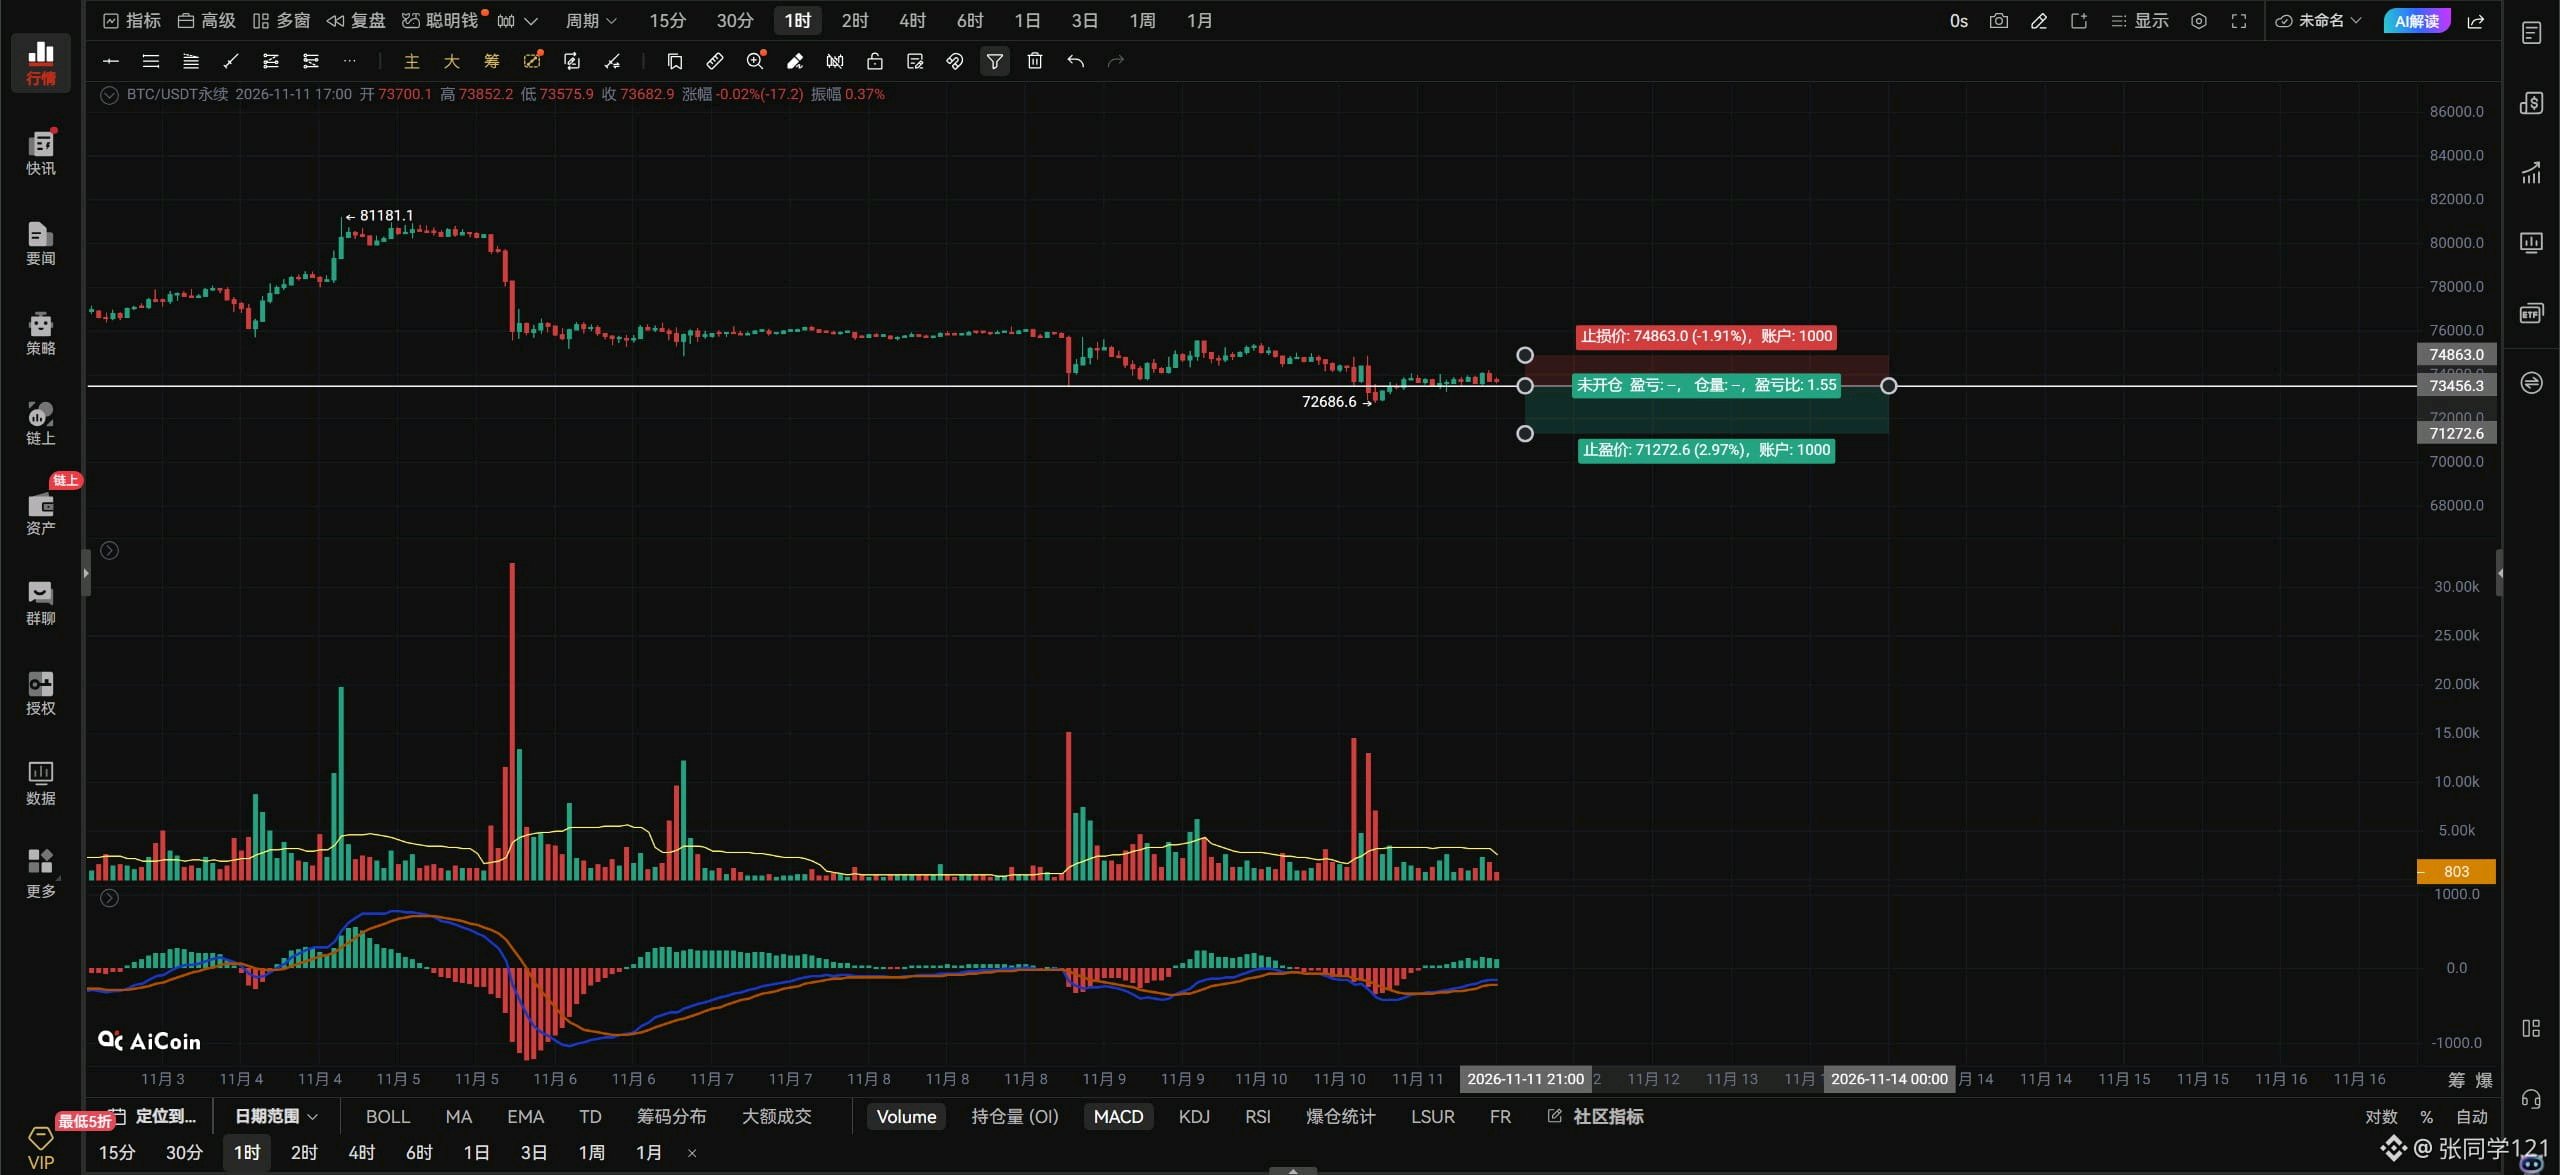
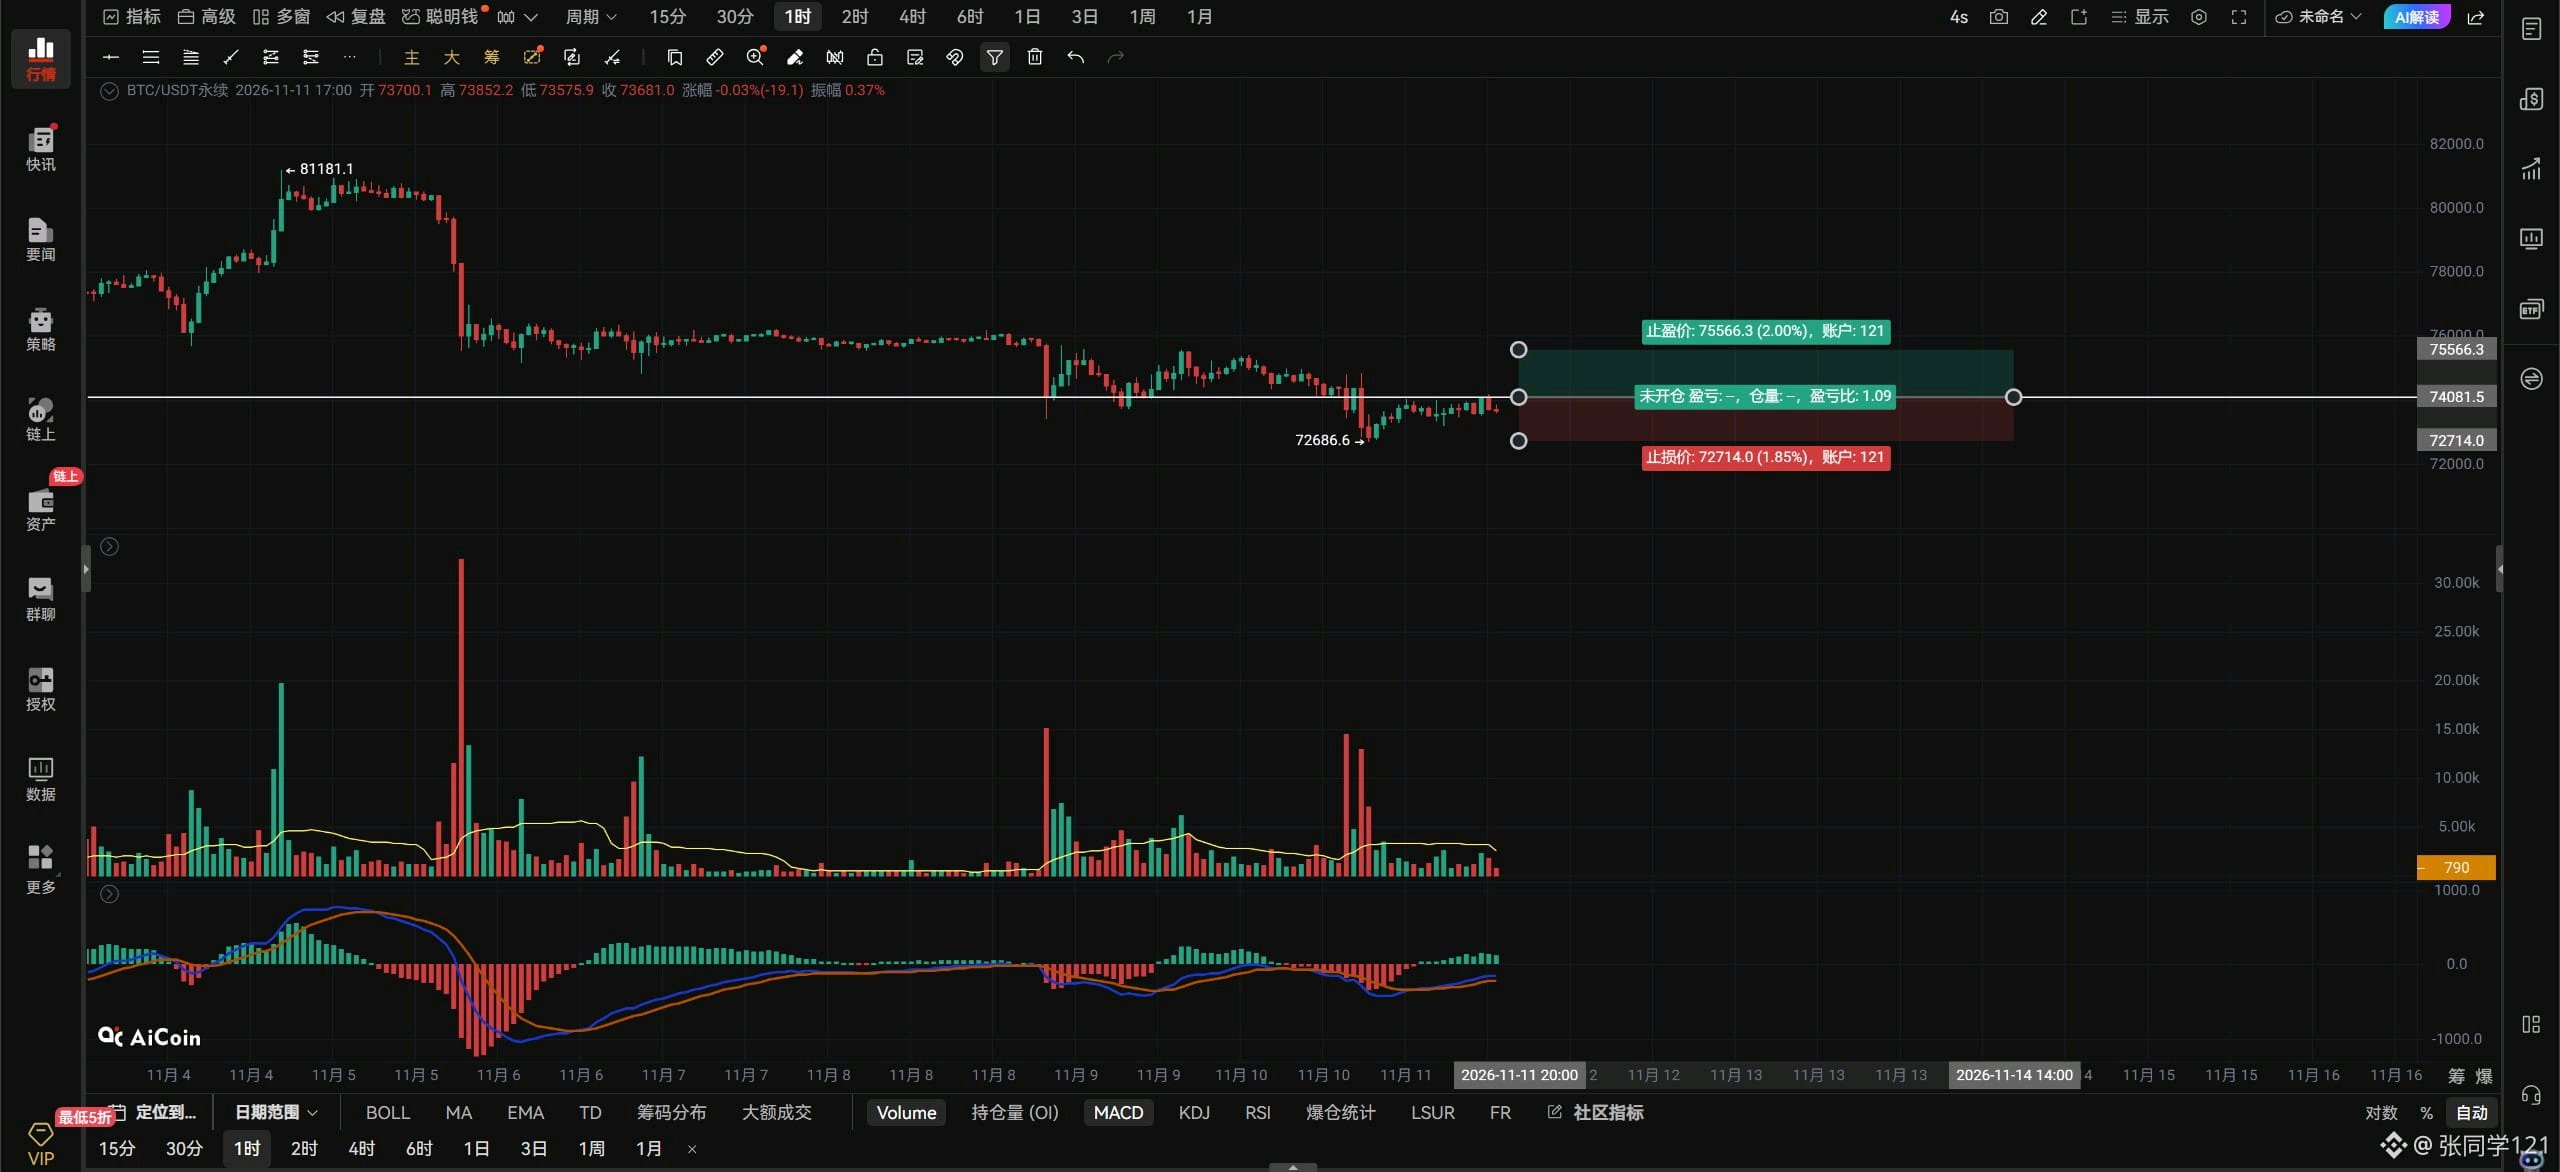
$BTCUSDT 夜の展望: 11月11日。 ビットコインは三角形を下回った後、上の赤い矢印で示されているように、内部に戻って取引しようと2回試みました。残念ながら、三角形の中に戻ることはできませんでした。その後、白い枠で囲まれたエリアで弱気の包み足(ベアッシュ・エングルフィング)が発生し、価格が押し下げられ、72688という新たな安値をつけました。ビットコインは今、何をしているのでしょうか?72688から74081の間で揉み合っており、再び方向性を探っています。このレンジを上抜けるか下抜けるかしない限り、明確な方向性はなく、このレンジ内での揉み合いが続くでしょう。ビットコインが下落を止めて反発するには、74081を突破する必要があります。そうして初めて上昇に転じることができ、ターゲットは74829、75526、76395となります。74081を超えられない場合、これらの3つのレベルに到達することはありません。 なぜ反発のために74081を突破しなければならないのでしょうか?それは74081〜72688が揉み合いゾーンだからです。上昇しようとするなら、下の赤い枠でマークされた揉み合いゾーンを上抜ける必要があると思いませんか?その下の揉み合いゾーンで高値を切り上げなければ、上の赤い枠のゾーンでの取引に戻ることはできませんよね?下の揉み合いゾーンすら抜けていないのに、どうやってビットコインが上昇すると期待できるのでしょうか?一歩一歩進まなければなりませんよね? あなたは11階に住んでいます。一歩で直接寝室に入れますか?飛べますか?😃!逆に、74081〜72688のレンジを下抜けた場合、71260という新たな安値が視野に入ってきます。ビットコインがレンジ相場で取引されているときは、手を出さないのが一番です。レンジ中にエントリーしても、価格はエントリー価格付近をうろうろするだけです。様子見をするのが賢明ですよね?今ビットコインでロングを狙うなら、すべきことは以下の通りです。ビットコインが以前の安値である72688を再テストするのを待ち、反転のシグナルが出るか確認してから反発狙いでロングする。あるいは、74081を突破し、そのレベルを再テストで維持するのを待ってからロングする。最も安全なショートの方法は、ビットコインが75526〜76395のレジスタンスゾーンまで反発し、トップパターンを形成するのを待ってからショートすることです。そうでなければ、軽率に行動しないのが一番です。 もしビットコインが強力な出来高を伴って74081を上抜けた場合、積極的なトレーダーは右側でロングを追撃できます。もし強力な出来高を伴って73456を下抜け、反発しても回復できない場合は、右側でショートを追撃してください。必ずストップロスを入れてください。 1時間足チャートでは、ビットコインが74081を上抜けて維持できれば、74829〜75526を目指します。74081を超えられない場合、これらのターゲットは無意味です。 4時間足チャートでは、73456を下抜けた場合、72688〜71260まで下落する可能性があります。 ビットコインの75035から82044にかけての日足揉み合いゾーンは下方にブレイクしました。このブレイクダウンは、日足チャートの大きな赤い矢印で示された上昇トレンドが終了したことを意味します。なぜなら、大きな白い枠で囲まれた揉み合いゾーンの構造が破壊されたからです。今後、日足チャートで75000を回復できない限り、72978〜69844付近の日足FVGギャップを埋めに行く必要があります。そして75000を回復するまで、日足ではさらなる急落が待っています。ビットコインは75000の上に戻ることでしか、日足の下落が悪化するのを止めることはできません。もし3日以内に75000を回復できなければ、奈落の底があなたと私を呼んでいますよ🫳🏻 さあ、さあ、一緒に遊びましょう!ここはひんやりしていて気持ちいいですよ。会議終了。#ByXIMPACT
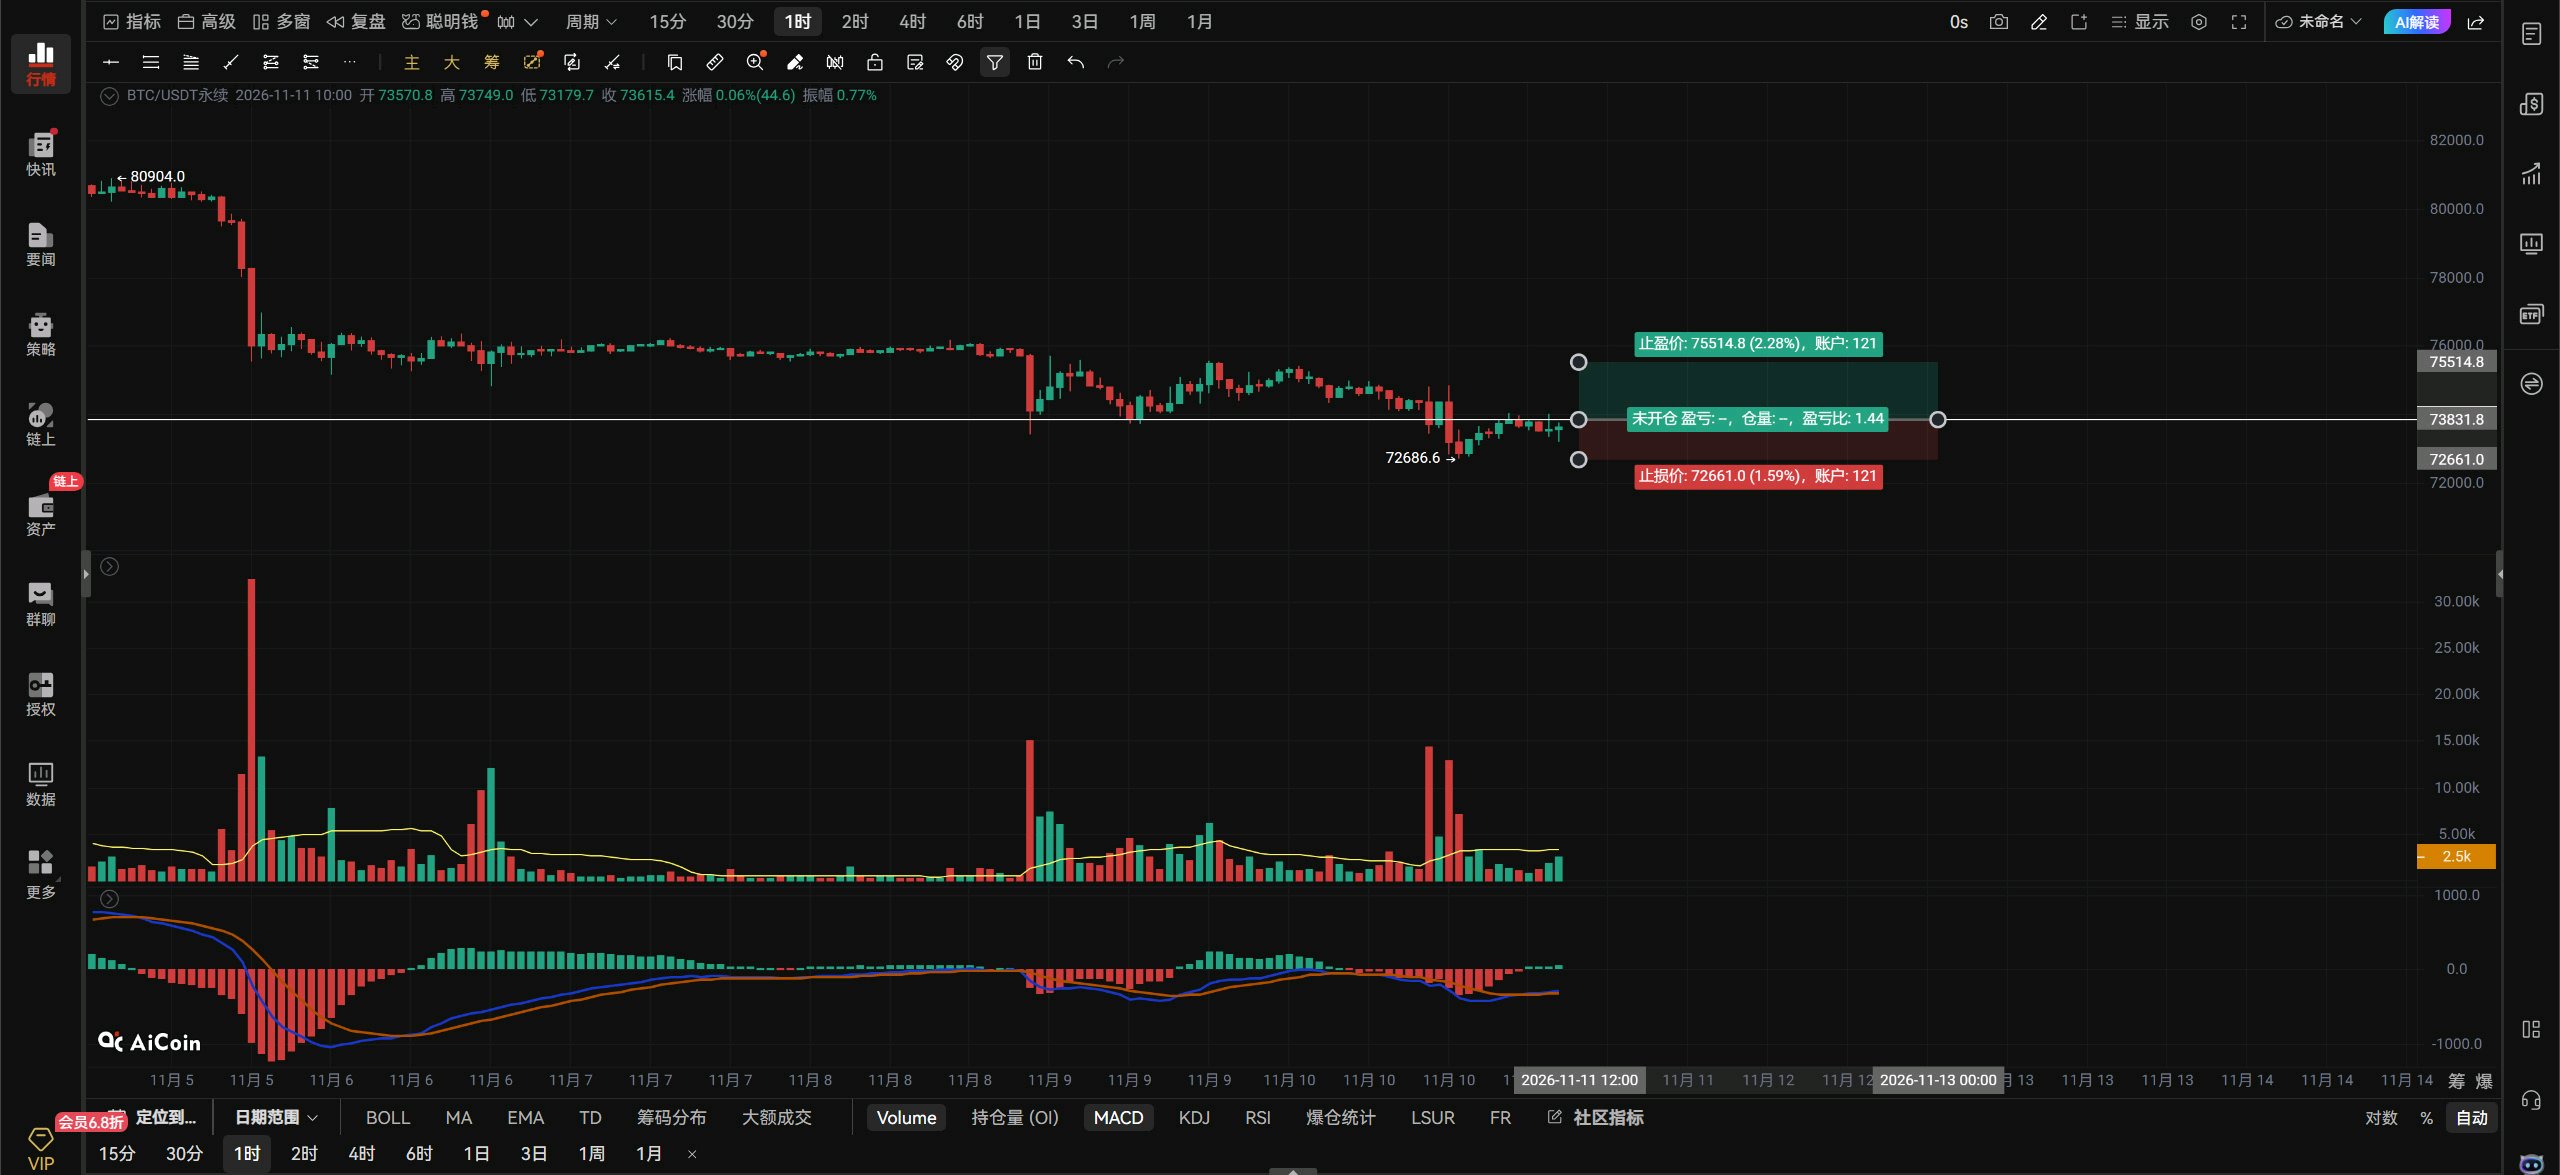
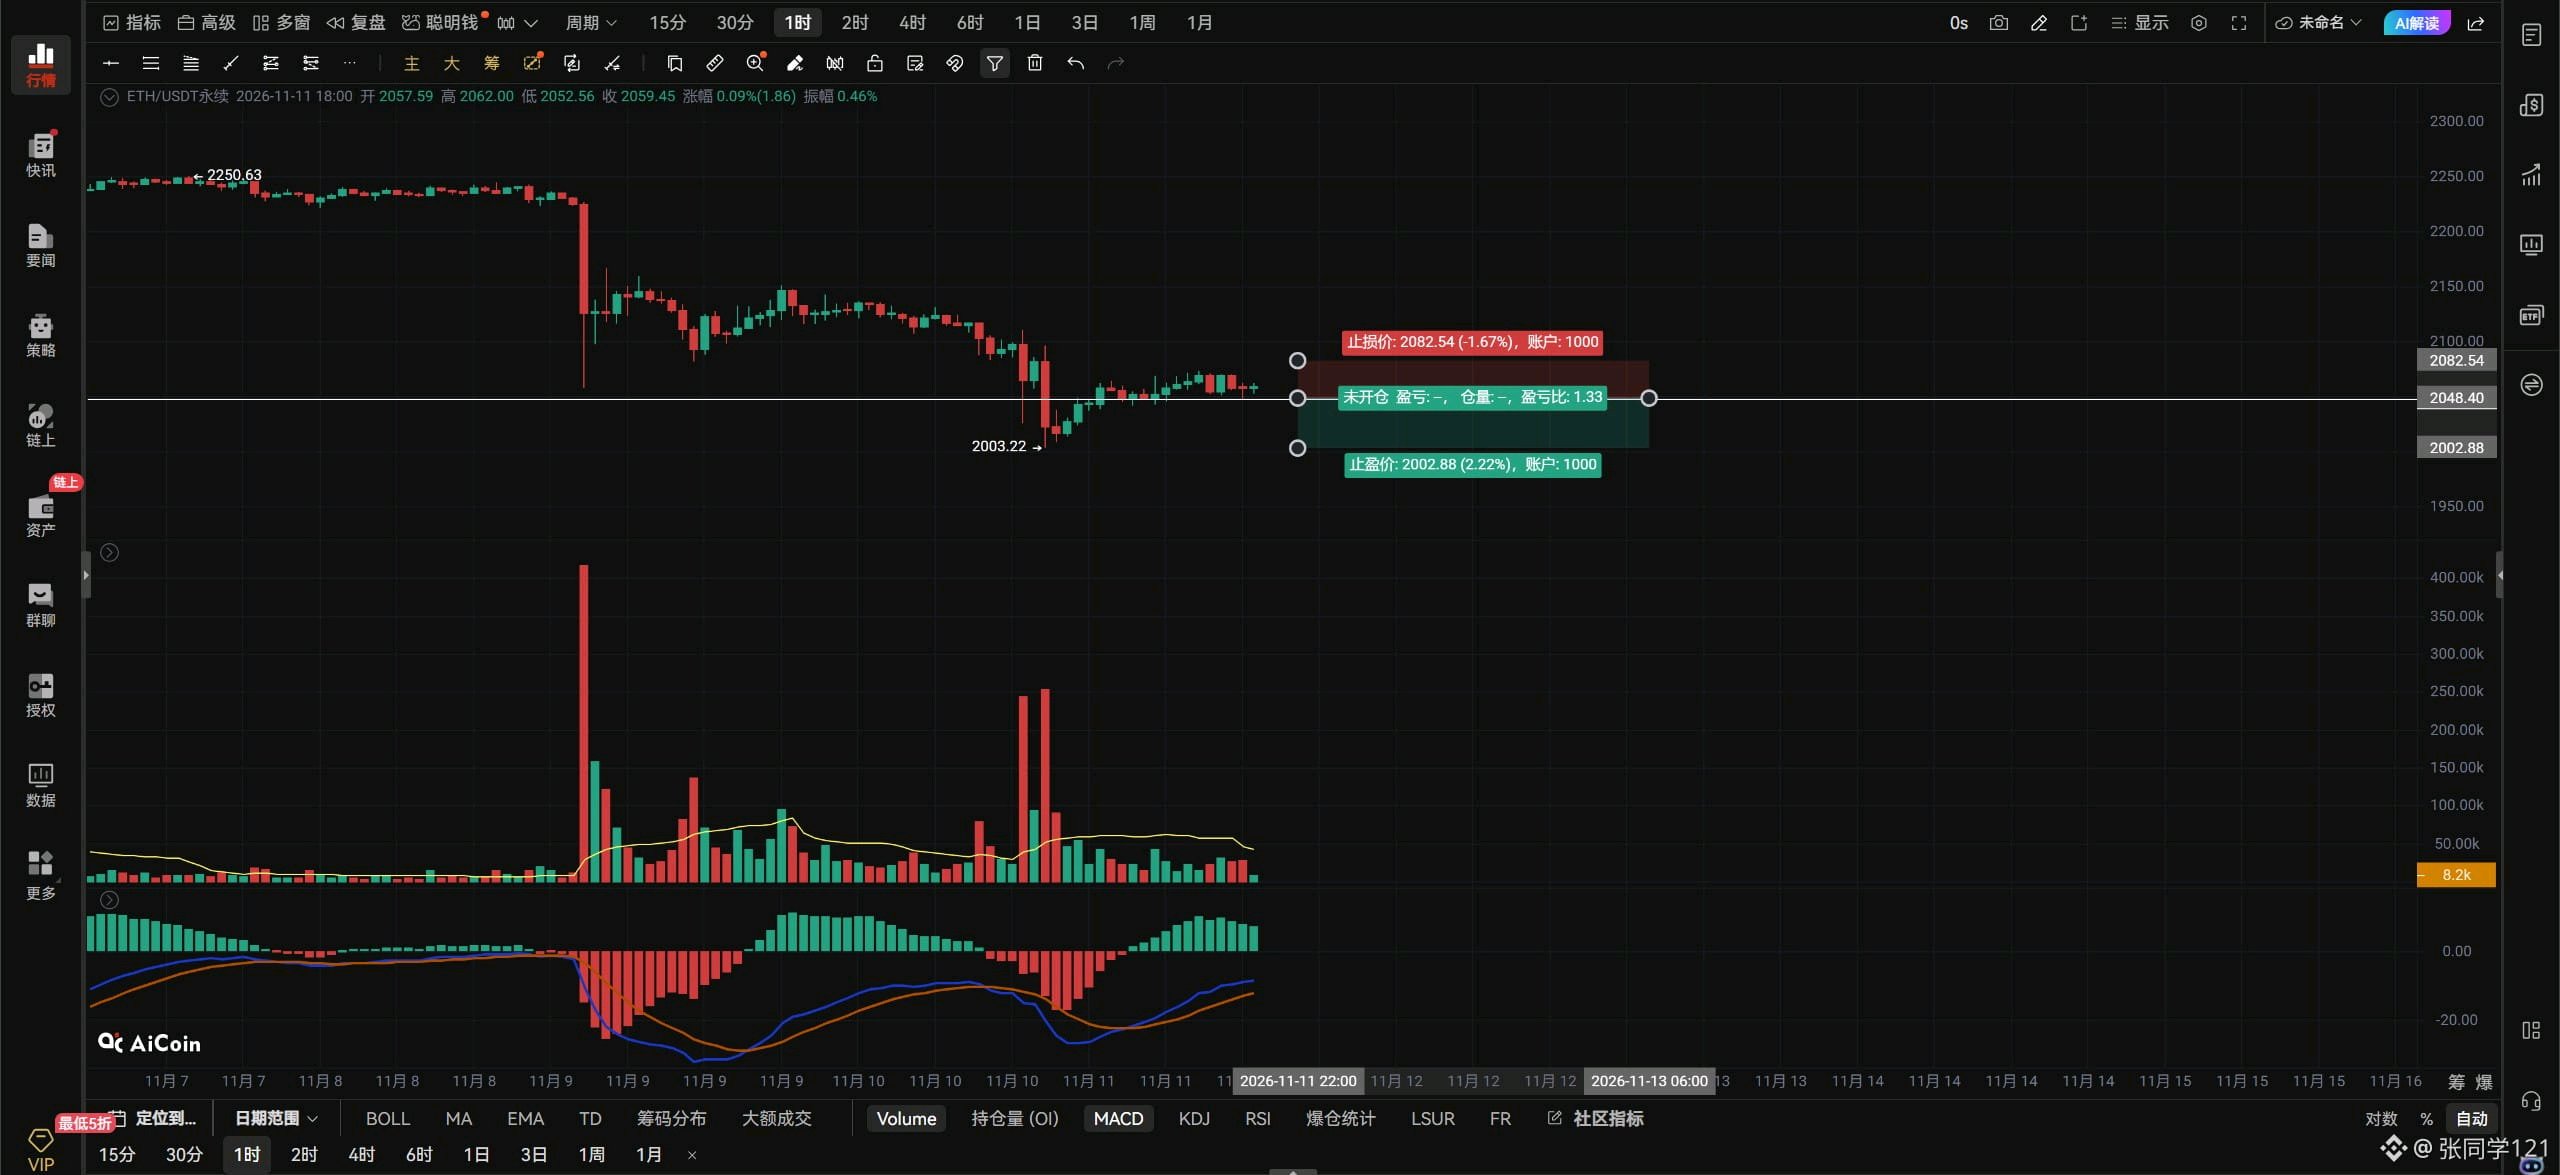
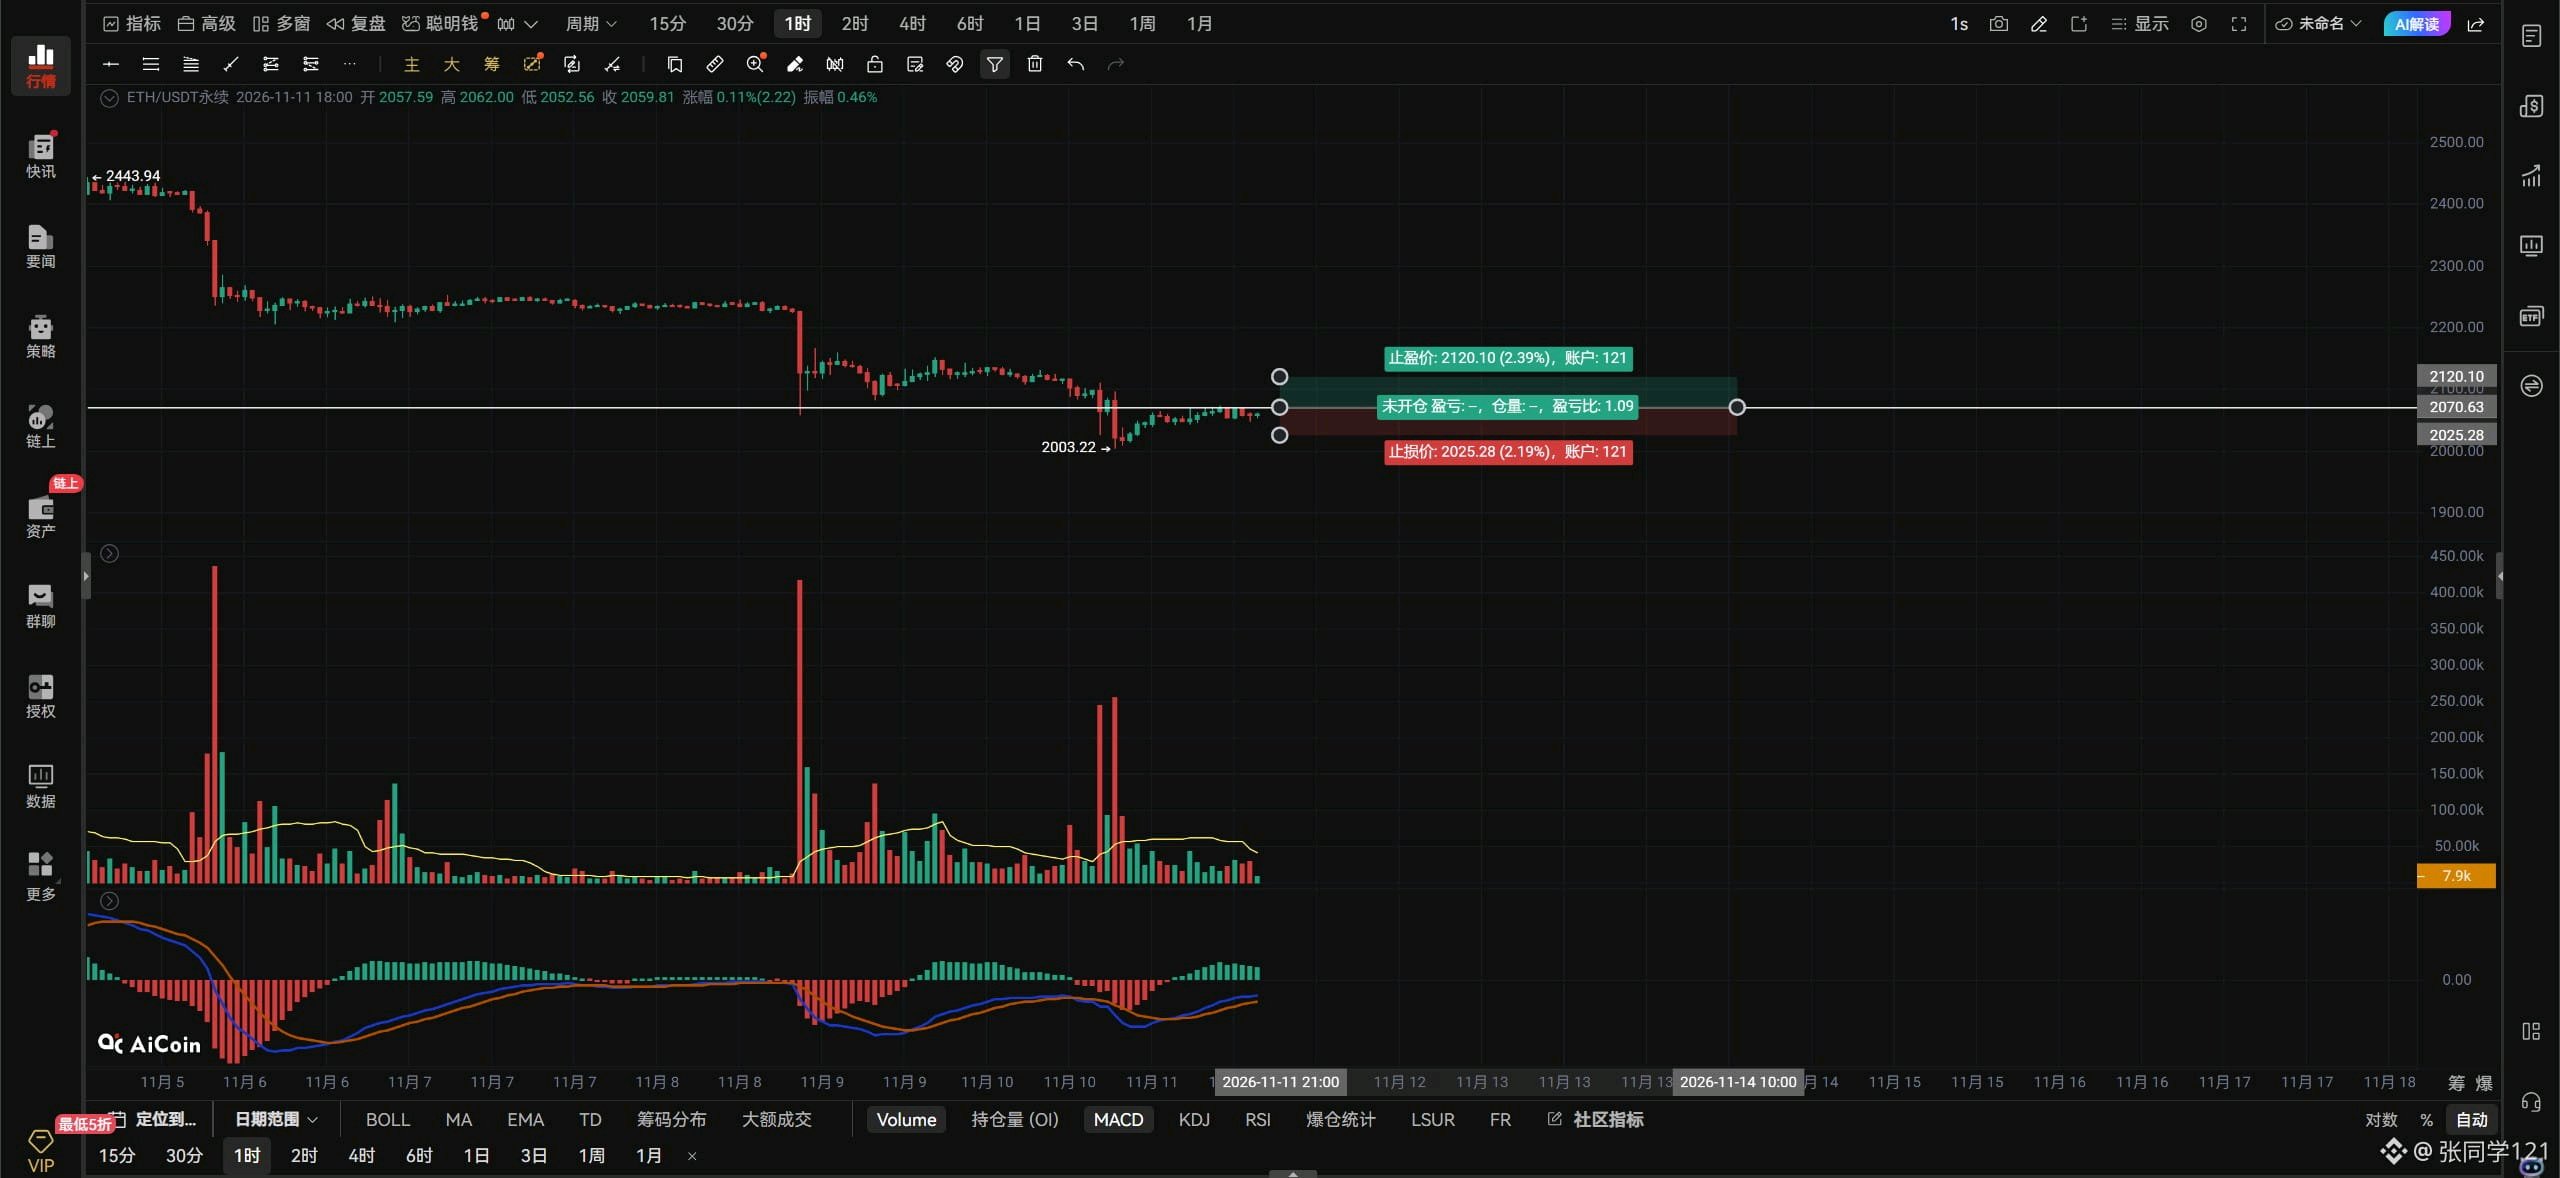
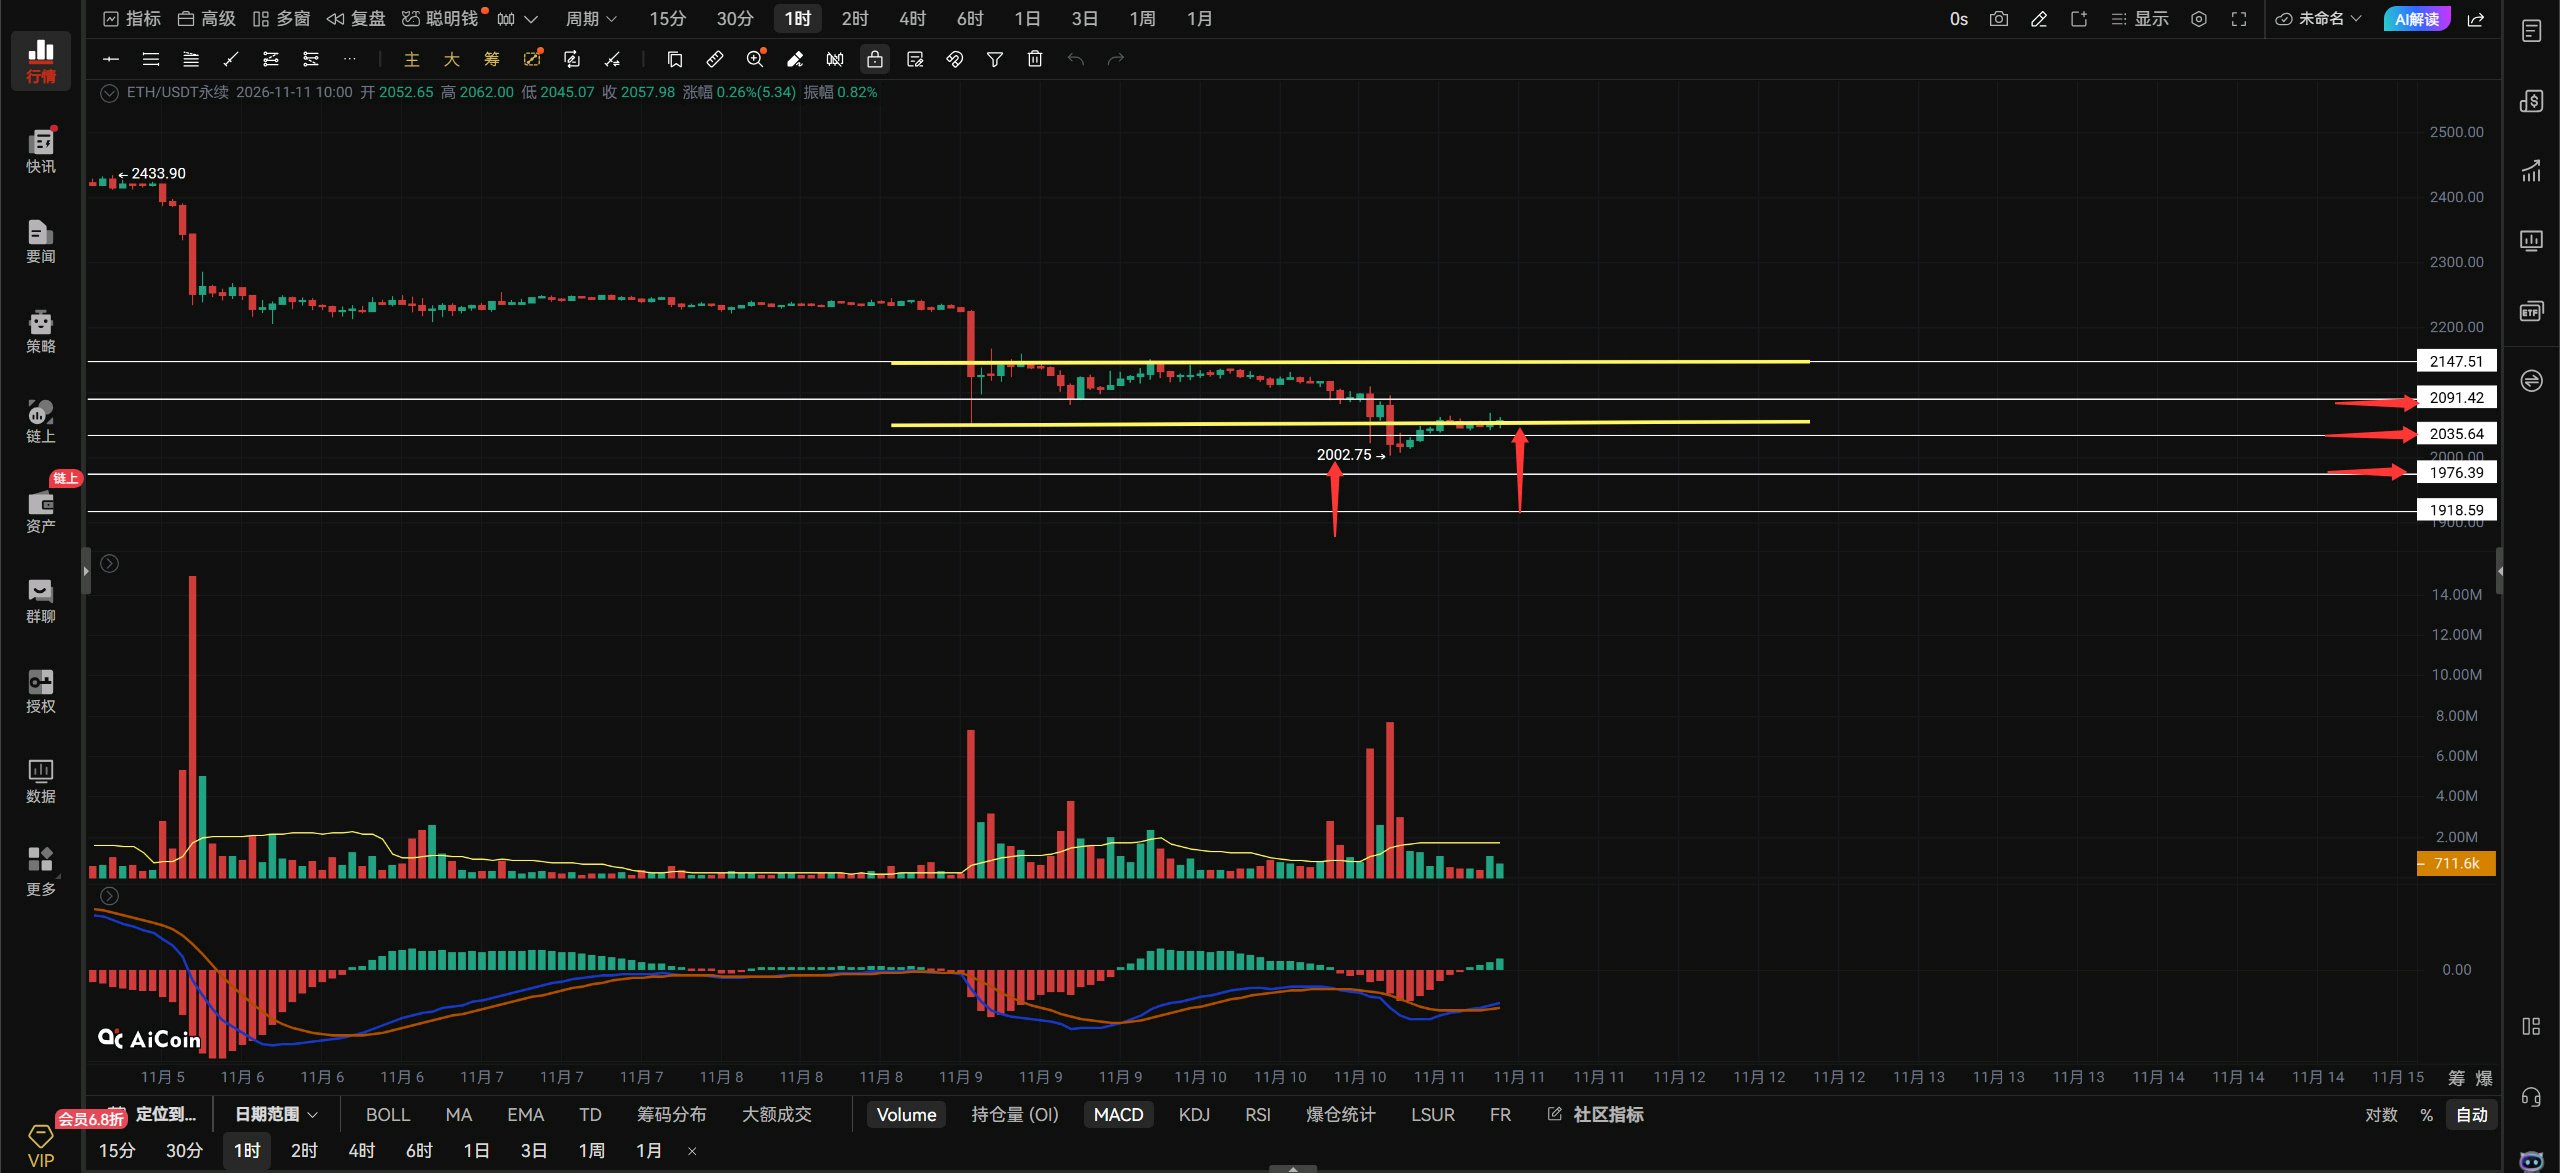
ETHUSDTの見解: 出来高を伴ってETHが2063を上にブレイクしたら、順張りでロングを追いかける。その際、必ずストップロスを設定すること。 出来高を伴って2052を下にブレイクしたら、順張りでショートを追いかける。その際、必ずストップロスを設定すること。 2003へのリテストでサポートが固いことが確認できれば、ロングを1単位追加。 価格が1976を割り込んだら損切り。 1時間足で、ETHが2063を維持できれば、2092〜2147を視野に入れる。 ETHが2092に到達したらショートを狙う。2147を上にブレイクしたら損切り。 逆張りの指値:1976でロング。1938を割り込んだら損切り。 上のレジスタンス:2063-2092-2147 下のサポート:2052-2035-2003 4時間足では、2052を割り込むと2035-2003を目指す展開。ETHは重要なサポートである2000をリテストし、これを維持した。今の焦点は、ETHが2035をキープできるかどうか。もし維持できれば、下落は一旦止まり、2091を試すチャンスがある。2091をブレイクできなければ、2000の再リテストでは確実に割り込むだろう。ETHが2000を割り込めば、下落が制御不能になる可能性がある。以上。 WSOT2026 ByXIMPACT
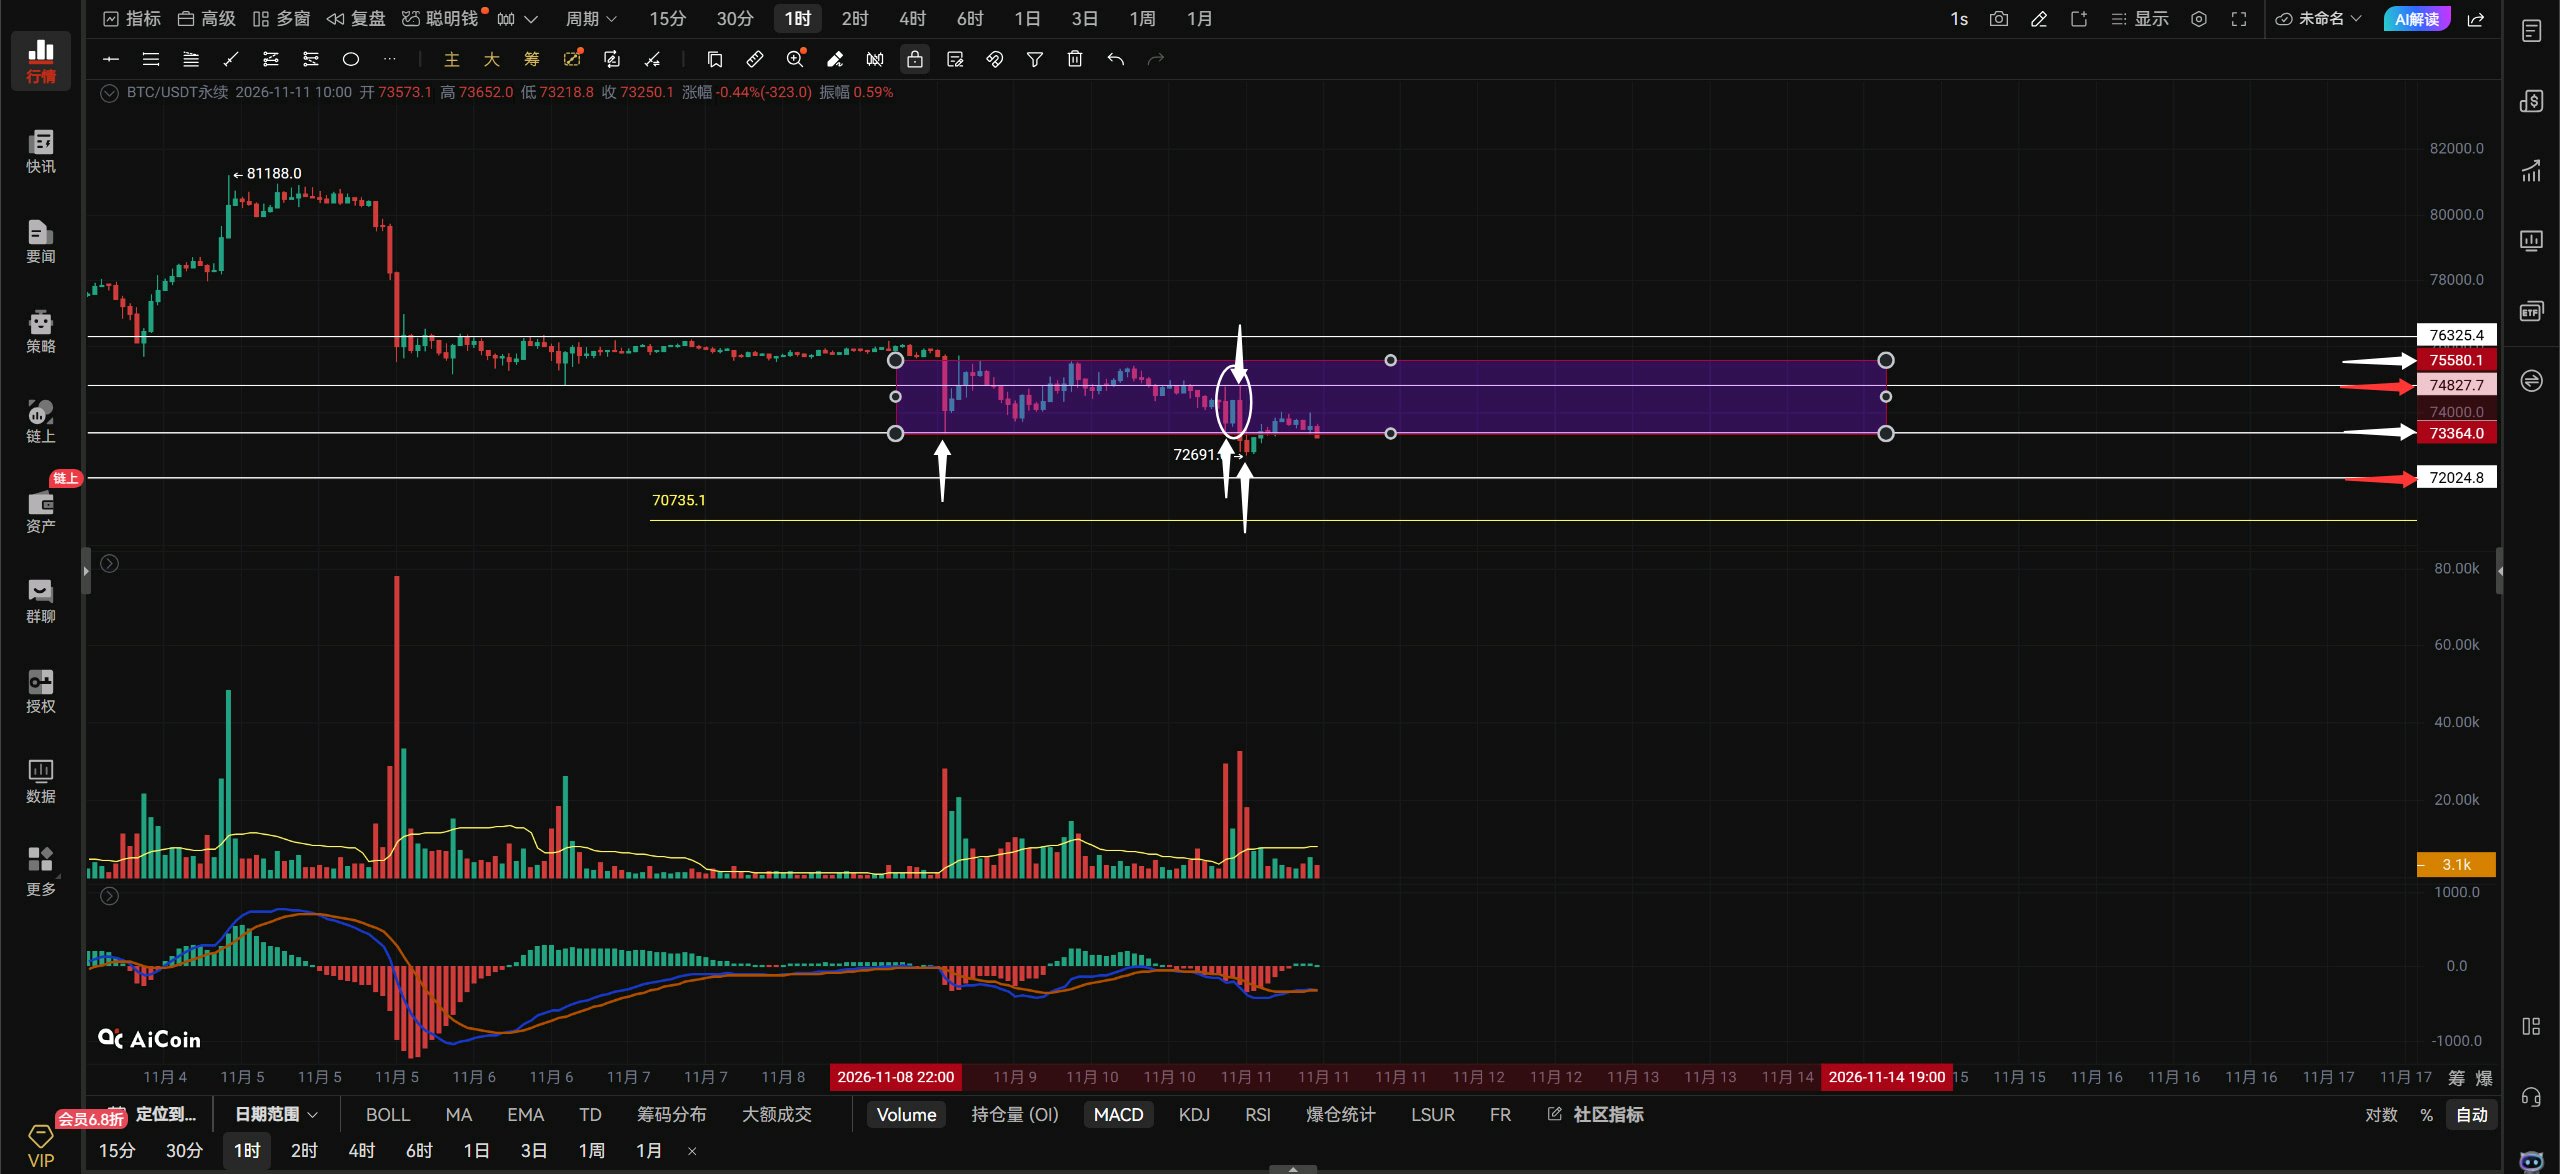
$BTCUSDT 🌿11.11 正午の市場見通し🌿 $BTC の見方: ビットコインは11.11にまたしても大きく割り引かれました。今、はっきりと言えることがあります。どのタイムフレームにおいても強気トレンドは存在しません。価格が75000を回復して維持するまでは、あらゆる反発がショートの機会です。ビットコインの75580〜73364の統合レンジは崩れました。次は、ビットコインが73364を維持できるかどうかに注目してください。維持できればまだ上昇の余地はありますが、73364を維持できなければ、72024のテストを待つことになります!当初、以前の安値は割られないと思っていました(下の白い矢印がそれを示しています)。悪いニュースがあまりなく、白い枠で囲ったエリアに底打ちのシグナルが現れていたからです。しかし、反発は74827のレジスタンスを突破できず、その後、一本の大きな弱気ローソク足が以前の安値を突き抜け、さらに安値を更新しました。ビットコインは安値を更新しましたが、ロング・ショート比率は下がっておらず、2.9と高いままです。皆の押し目買い意欲は衰えていないようです!誰もが押し目買いを狙っており、私もそうですが、現在の相場を見ると、底すら見えていません!価格は順調に上昇していたのに、突然投げ売りされました。ビットコインが上昇するためには、74827〜75580のレジスタンスゾーンを突破して反発を開始する必要があります。このゾーンを突破できなければ意味がありません。ロングを狙う人は、ビットコインが以前の安値を再テストし、底打ちシグナルが現れるのを確認してからエントリーしてください。そうでなければ、74827〜75580のゾーンでのショートを待ちましょう! ビットコインがボリュームを伴って73875を上抜ければ、積極的なトレーダーはライトサイドでロングを追っても良いでしょう。75539までリバウンドすれば、損切りラインを置いた上で、軽くショートを入れてください。 1時間足では、ビットコインが73875を上抜けて維持すれば、74827〜75539を狙います。73875を超えられないのであれば意味がありません。 4時間足では、価格が73384を下回れば、72691〜72024を目指します。 上値レジスタンス:73875–74827–75539 下値サポート:73384–72691–72024 #ByXIMPACT