AMBTC
3435いいね0シェア187ファン231フォロー
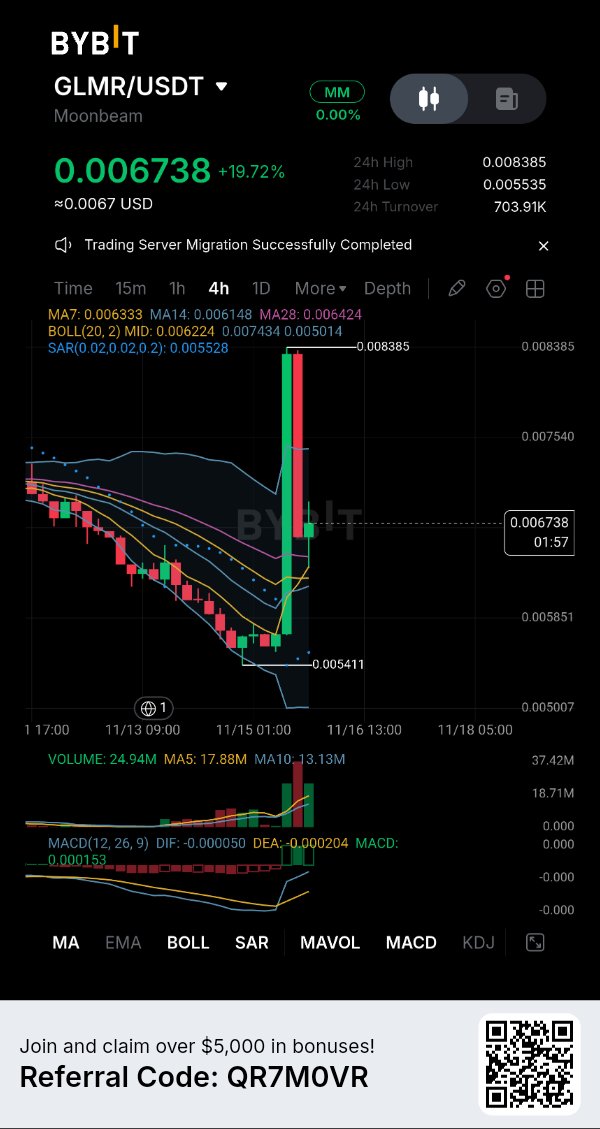
GLMR: レンジの58%を戻し、現在0.006738
GLMRUSDT — 価格は0.008385まで急騰した後、ボリンジャーバンドの上限である0.007434を9.4%下回っています。 24時間レンジ(0.005535〜0.008385)に注目してください。価格はその値幅の約58%を戻しており、出来高は依然として5本平均の1.4倍です。 未解決の疑問:これは大きな値動きの中での調整(押し目)なのか、それとも急騰による巻き戻しなのか? 大きな調整後も出来高が高止まりしています。これは買い手が参入しているのか、それとも売り手が撤退しているのか? 4時間足、BybitのGLMR/USDT、0.006738、24時間比+19.72%。 マクロメモ 2026年11月14日:米国の現物ビットコインETFが2週連続で合計23.5億ドルの純流出を記録(Cointelegraph)。これは背景情報であり、今回の値動きの直接的な理由ではありません。 チャートが示すもの 価格は数日間下落し、24時間安値の0.005535を付けました。その後0.008385まで上昇し、安値から51.5%の変動を見せた後、0.006738まで押し戻されています。急騰時の高値は現在の価格より24%上です。 出来高は顕著です。現在の足の出来高は2494万で、5本平均の1788万の1.4倍、10本平均の1313万の1.9倍です。最も出来高が多かった約3700万の足は急騰時に記録されました。つまり、この押しは沈静化によるものではなく、活発な出来高を伴っています。 価格はMA7(0.006333)、MA14(0.006148)、MA28(0.006424)の上にあります。MACDはゴールデンクロスを示しており、DIF(-0.000050)がDEA(-0.000204)を上回っていますが、両方とも依然としてゼロ以下です。SARは0.005528で、価格の下にあります。これらは短期的なモメンタムを裏付けていますが、トレンド転換を証明するものではありません。これらは過去の価格から算出されており、MA7は依然としてMA28の下にあり、たった一度の急騰ですべての数値が引き上げられたに過ぎません。 重要レベル サポート:0.006333(MA7)、次に0.006224(ボリンジャーバンド中央線)。24時間安値は0.005535。 レジスタンス:0.007434(ボリンジャーバンド上限)、次に0.008385(24時間高値)。 強気要因となる条件 価格は上限バンドの9.4%下にあり、まだブレイクアウトは期待していません。まずは0.006333と0.006224の上で4時間足が確定すること。その次に、出来高が1788万平均を超えた状態で、0.007434を超える4時間足確定を待ちます。押し目で0.006224より上で高値を切り上げればなお良いでしょう。 懸念点 4時間足が0.006224を下回って確定すれば、価格はバンド中央線の下に戻り、この上昇は打ち消されます。急騰時の高値0.008385は拒絶され、価格はそのレンジの58%を戻してしまいました。どちらも慎重になるべき理由です。 見方を変える条件 4時間足が0.006224を下回って確定した場合。 教訓 急騰は価格がどこまで行けるかを示し、確定値(終値)はどこに留まれるかを示す。 私の見解 今のところ反発は維持されているため、GLMRが4時間足で0.006224以上を維持する限り、やや強気な姿勢です。私の判断が間違っている可能性もあり、4時間足が0.006224を下回ればそれが間違いを証明することになります。私の意見ではなく、レベルを参考にしてください。これはシナリオであり、予測ではありません。投稿時点での分析であり、保証ではありません。 あなたにとって、0.006224でのサポート維持と、0.007434を超える終値、どちらがより重要ですか? ByXIMPACT
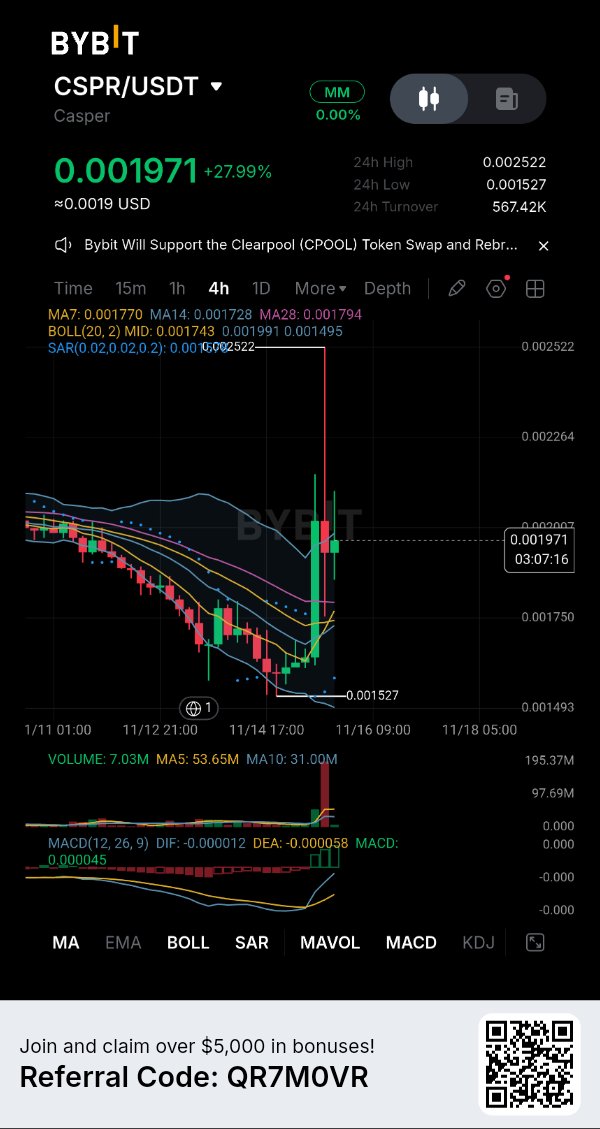
CSPR:0.002522まで急騰し、現在は0.001971
$CSPRUSDT — 価格はボリンジャーバンドの上限を1%下回る0.001991で推移しており、上限を大幅に上回る急騰を見せた後です。 過去24時間のレンジは0.001527から0.002522まで。価格はそのレンジの約55%をすでに吐き出しました。 まだ決着がつかない問題:0.001991は天井からサポートに変わるのか? 巨大な出来高バーと28%の上昇幅。このような急騰を信頼するなら、何が必要でしょうか?リテスト、終値の確定、あるいはさらなる出来高でしょうか? 4時間足、$CSPRUSDT(Bybit)、0.001971、24時間比で+27.99%。 マクロ的な状況 2026年11月15日:ビットコインは7月以来の安値水準である約62,081まで下落しましたが、その後65,000以上に反発しました(Cointelegraph)。これは背景情報であり、今回の動きの直接的な理由ではありません。 チャートの分析 価格は数日間下落し、24時間安値の0.001527まで落ち込みました。その後、1本のローソク足でその安値から約65%高い0.002522まで急騰し、現在は0.001971まで押し戻されています。 24時間のレンジ幅は0.000995で、価格はその約55%を失いました。急騰の高値は現在の価格より28%高い位置にあります。 出来高は明確です。急騰時のバーは約1億9500万(目視)で、10本平均の3100万の6倍以上です。現在のバーは5365万の5本平均に対して703万ですが、このローソク足はまだ約22%しか進行していない(残り3時間7分)ため、現時点での比較は公平ではありません。 テクニカル指標は反発を示唆していますが、これらは価格から算出されるため、独立した証拠ではありません。価格はMA7(0.001770)、MA14(0.001728)、MA28(0.001794)を上回っています。MACDはゴールデンクロスしており、DIF(-0.000012)がDEA(-0.000058)の上にありますが、どちらも依然としてゼロラインより下にあります。これは短期的なモメンタムをサポートするものの、トレンド転換を証明するものではありません。MA7は依然としてMA28の下にあり、1本の急騰ローソク足だけでこれらすべてのラインを上に引っ張り上げることができてしまうからです。 主要な水準 サポート:約0.00186(現時点でのこのローソク足の安値)、次いで0.001743(ボリンジャーバンド中央線)。24時間安値は0.001527。 レジスタンス:0.001991(ボリンジャーバンド上限)、次いで0.002522(24時間高値)。 強気材料 価格は0.001991を下回っているため、これはブレイクではなくテストの段階です。タッチしただけでは証明になりません。4時間足の終値が0.001991を超え、その後サポートとして機能するリテストが行われることを望みます。0.00186を超えて高値を切り上げればなお良いでしょう。出来高が5365万の平均を十分に上回った状態でバンドを終値で超えれば、本物の参加が示されたと言えます。 懸念点 4時間足の終値が0.001743を下回ると、価格はバンドの中央線を割り込み、この反発のほとんどが打ち消されることになります。価格は0.002522で拒否され、それ以来レンジの55%を失っています。 考えを変える条件 4時間足の終値が0.001991を上回ること。 教訓 派手なローソク足1本でトレンドは作られません。トレンドとは、直近の終値を上回り続ける終値の連続です。 個人的見解 私の読み:これは鋭い急騰の後の調整局面であり、まだ底固めとは言えないため、CSPRが4時間足で0.001991を下回っている間は慎重な姿勢を維持します。間違っている可能性もあり、4時間足の終値が0.001991を超えれば、私の予測は否定されたことになります。私の見解ではなく、水準(レベル)を参考にしてください。これはシナリオであり、予測ではありません。投稿時点での解釈であり、保証ではありません。 あなたは、出来高バーと押し戻しのどちらをより重視しますか? #ByXIMPACT #WSOT2026 #WSOTあなたのAI取引を見せて10USDTを獲得 #ジェンスン・ファン、NvidiaのAIリーダーシップを試す出口戦略
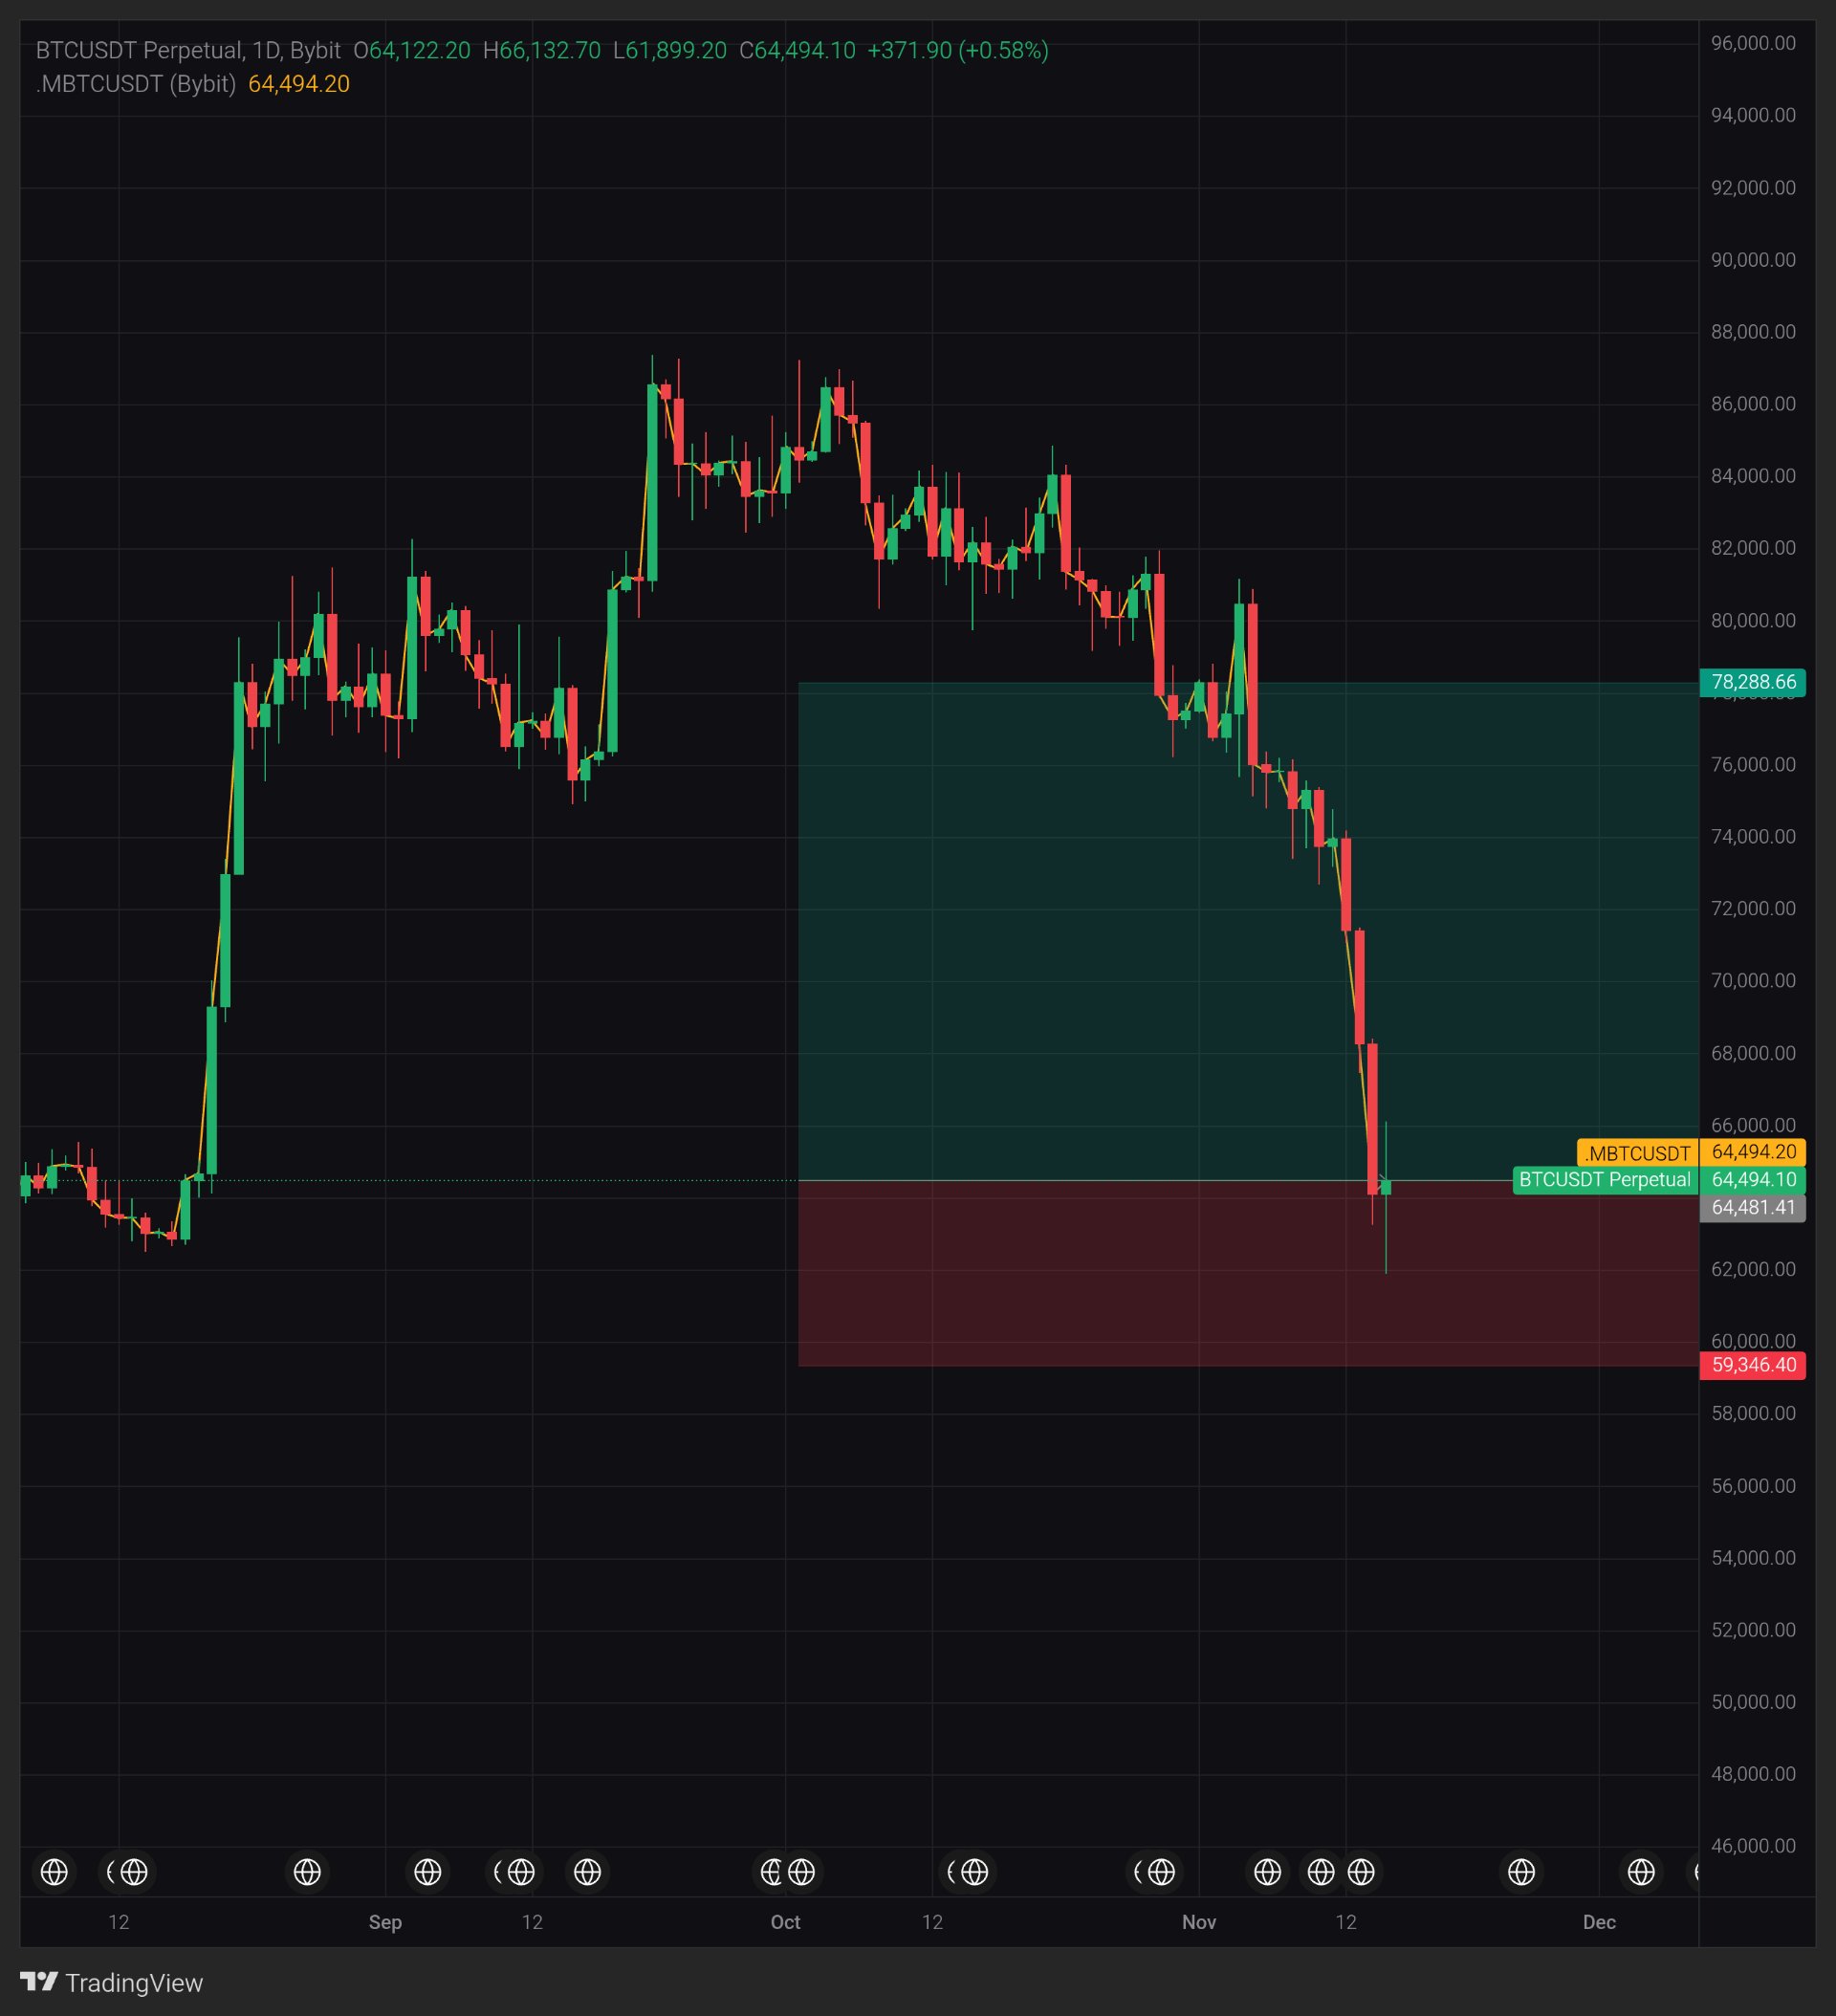
BTC 1D: Back at the August Base, 64,481
$BTCUSDT — price is back inside the August base, sitting on 64,481.41, the line between my two boxes. Look at today's daily candle. It dipped 2,223 under its open, then recovered, and its body is under a tenth of yesterday's. Still unresolved: does today close above 64,481.41, or is this just a pause? After three red days in a row, what does one small green candle prove? 1D, $BTCUSDT Perpetual on Bybit, 64,494.10, +0.58% on the current candle. Macro note Nov 14, 2026: US spot Bitcoin ETFs posted $2.35 billion in net outflows over two consecutive weeks (Cointelegraph). Background only, not the reason for this move. What the chart shows Price is about 29% below the September high near 87,300. Three red daily candles in a row, each bigger than the last (roughly 3.4%, 4.4% and 6.1%), took it from about 73,940 to 64,060, around 13%. Zoom out: before the rally, the August base sat near 62,500 to 65,500. Price is back inside it. Today's low of 61,899.20 went about 1% under that base, then price recovered to 64,494.10. Today's candle: open 64,122.20, high 66,132.70, low 61,899.20, close 64,494.10. The range is 4,233.50, about 6.6% of the open. The lower wick is 2,223, about 6 times the 371.90 body. Price is up 4.2% from the low. The yellow line is the Bybit index (.MBTCUSDT) at 64,494.20, just 0.10 from the perpetual. It follows price, so it is not independent proof. No volume panel is shown, so I can't compare today's volume with its average. This is a price-action reading. Key levels Support: 61,899.20 (low of today's candle), then 59,346.40 (bottom of my red box). Resistance: 66,132.70 (high of today's candle), then about 68,250 (where yesterday's big red candle started). The top of my green box is 78,288.66. What would strengthen it Price is only 12.69 above the 64,481.41 line, so nothing is settled. I want a 1D close above 64,481.41 first, then a 1D close above 66,132.70. A higher low above 61,899.20 on a retest would show the August base is working. Concern A 1D close below 61,899.20 would mean the August base failed on a close, with 59,346.40 as the next reference. Three red days in a row, each bigger than the last, show sellers had control until today. What changes my mind A 1D close above about 68,250. The lesson One daily candle is one vote. Today's wick is six times its body. That is a signal, not a trend. My view My read: this looks like a first sign of buyers after a sharp fall, not a confirmed bottom, so I lean cautious while BTC stays under about 68,250 on 1D closes. I could be wrong, and a 1D close above about 68,250 would prove me wrong. Take the levels, not my lean. This is a scenario, not a prediction. A reading at posting time, not a guarantee. Which matters more to you here, the 2,223 wick or the 371.90 body? #ByXIMPACT
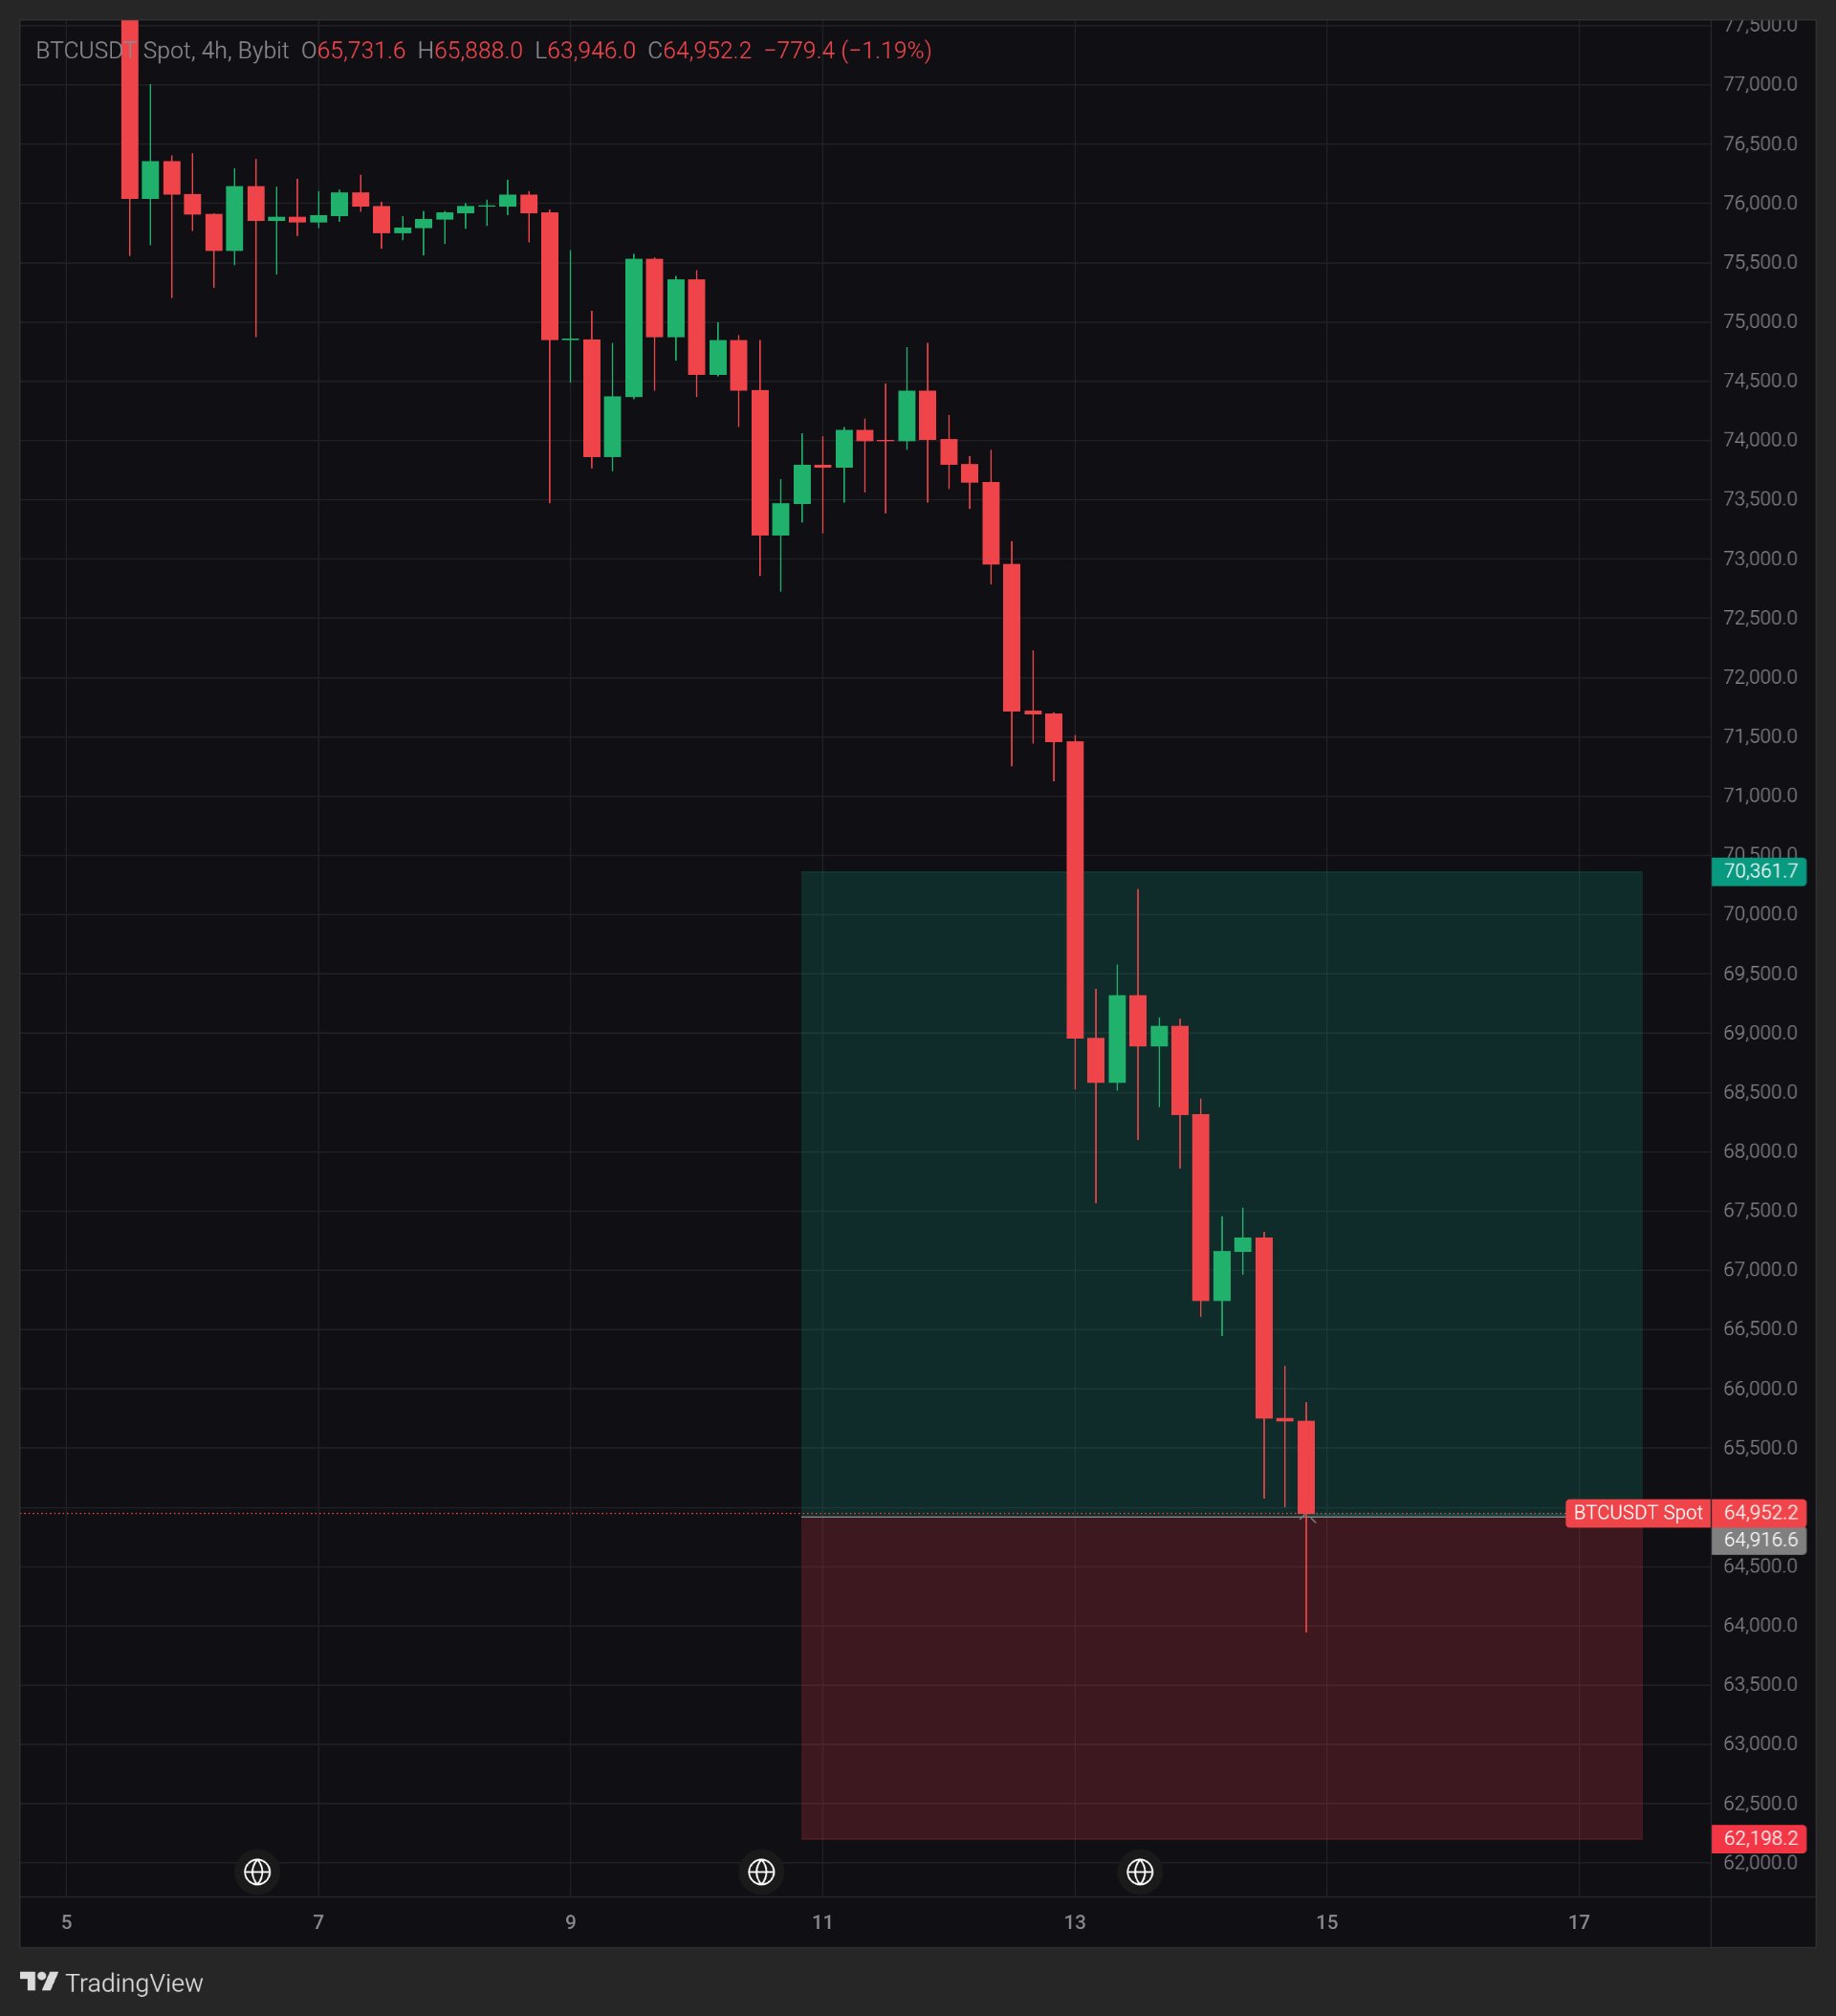
BTCは63,946までの下ヒゲをつけた後、64,917で推移している
$BTCUSDT — 全体の課題は64,916.6であり、価格はまさにその地点に位置しています。 現在のローソク足を見てください。始値から1,786下落しましたが、安値から1,006値を戻しました。 未解決なのは、このヒゲが「底」なのか、それとも下落途中で見られた「一時停止の価格」に過ぎないのかという点です。 この下落相場でのすべての安値は、形成された当初は底のように見えました。今回がこれまでと違うとすれば、一体何なのでしょうか? 4時間足、BTCUSDT Bybit現物、64,952.2、現在足は-1.19%。 マクロのメモ 2026年11月13日:米国債利回りが上昇し、FRBのタカ派政策への賭けが継続した(Kitco)。これは背景情報であり、今回の値動きの直接的な理由ではありません。 チャートが示すもの 価格は11日の高値74,800付近から64,952まで、3日間で約13.2%下落しました。スイングロー(押し安値)は切り下がっており、概ね67,566、66,445、65,029、そして現在は63,946となっています。 今日のようなヒゲは以前にも現れました。13日には、ローソク足が約67,566まで下落し、安値から約1,000戻して引けました。しかし数本後の足で、その安値を割り込みました。 現在のローソク足:始値65,731.6、高値65,888.0、安値63,946.0、終値64,952.2。レンジは1,942で約3%。下ヒゲは1,006.2で、実体の779.4の約1.3倍です。終値はレンジの中間に位置し、私のボックスの境界である64,916.6から35.6上にあります。 このチャートには出来高は表示されていません。インジケーターもないため、これはプライスアクションの読み取りです。 主要レベル サポート:63,946(現在のローソク足の安値)、次に62,198.2(私の赤色ボックスの下限)。 レジスタンス:65,888(現在のローソク足の高値)、次に約67,270(前回の大きな陰線が始まった地点)。私の緑色ボックスの上限は70,361.7です。 強気材料 価格は瀬戸際にあるため、現時点では「タッチ」しただけであり、「維持」はしていません。まず4時間足の終値が64,916.6を上回る必要があり、次に65,888を超える必要があります。再テストで63,946より上で安値を切り上げれば、ヒゲに買いが入っていることが示されます。約67,270を超える終値が出れば、パターンを打破する最初の大きな動きとなるでしょう。 懸念点 4時間足が63,946を下回って引ければ、ヒゲの安値は失敗したことになり、次の参照先は62,198.2となります。今回のようなヒゲは、これまでも下抜けされることがありました。 見方を変える基準 約67,270を上回る4時間足の確定。 教訓 下落階段は、高値切り下げと安値切り下げで構成されます。底を打つには、最初の「高値切り上げ(安値の切り上げ)」と、それを証明する終値が必要です。 私の見解 私の読み:これは下落階段のように見え、このヒゲは終値で確定していないため、BTCが4時間足で約67,270以下に留まる限り、慎重な姿勢を維持します。私が間違っている可能性もあり、その場合は約67,270を上回る4時間足の確定が証明してくれるでしょう。私の意見ではなく、レベル(水準)を参考にしてください。これは予測ではなくシナリオです。投稿時点の分析であり、保証ではありません。 あなたには何が見えますか?底ですか、それともさらなる一段下げでしょうか? #ByXIMPACT #米中間選挙後、ビットコインが2か月ぶりの安値を記録 #AITechSelloffErases2Point5TrillionFromNasdaq100
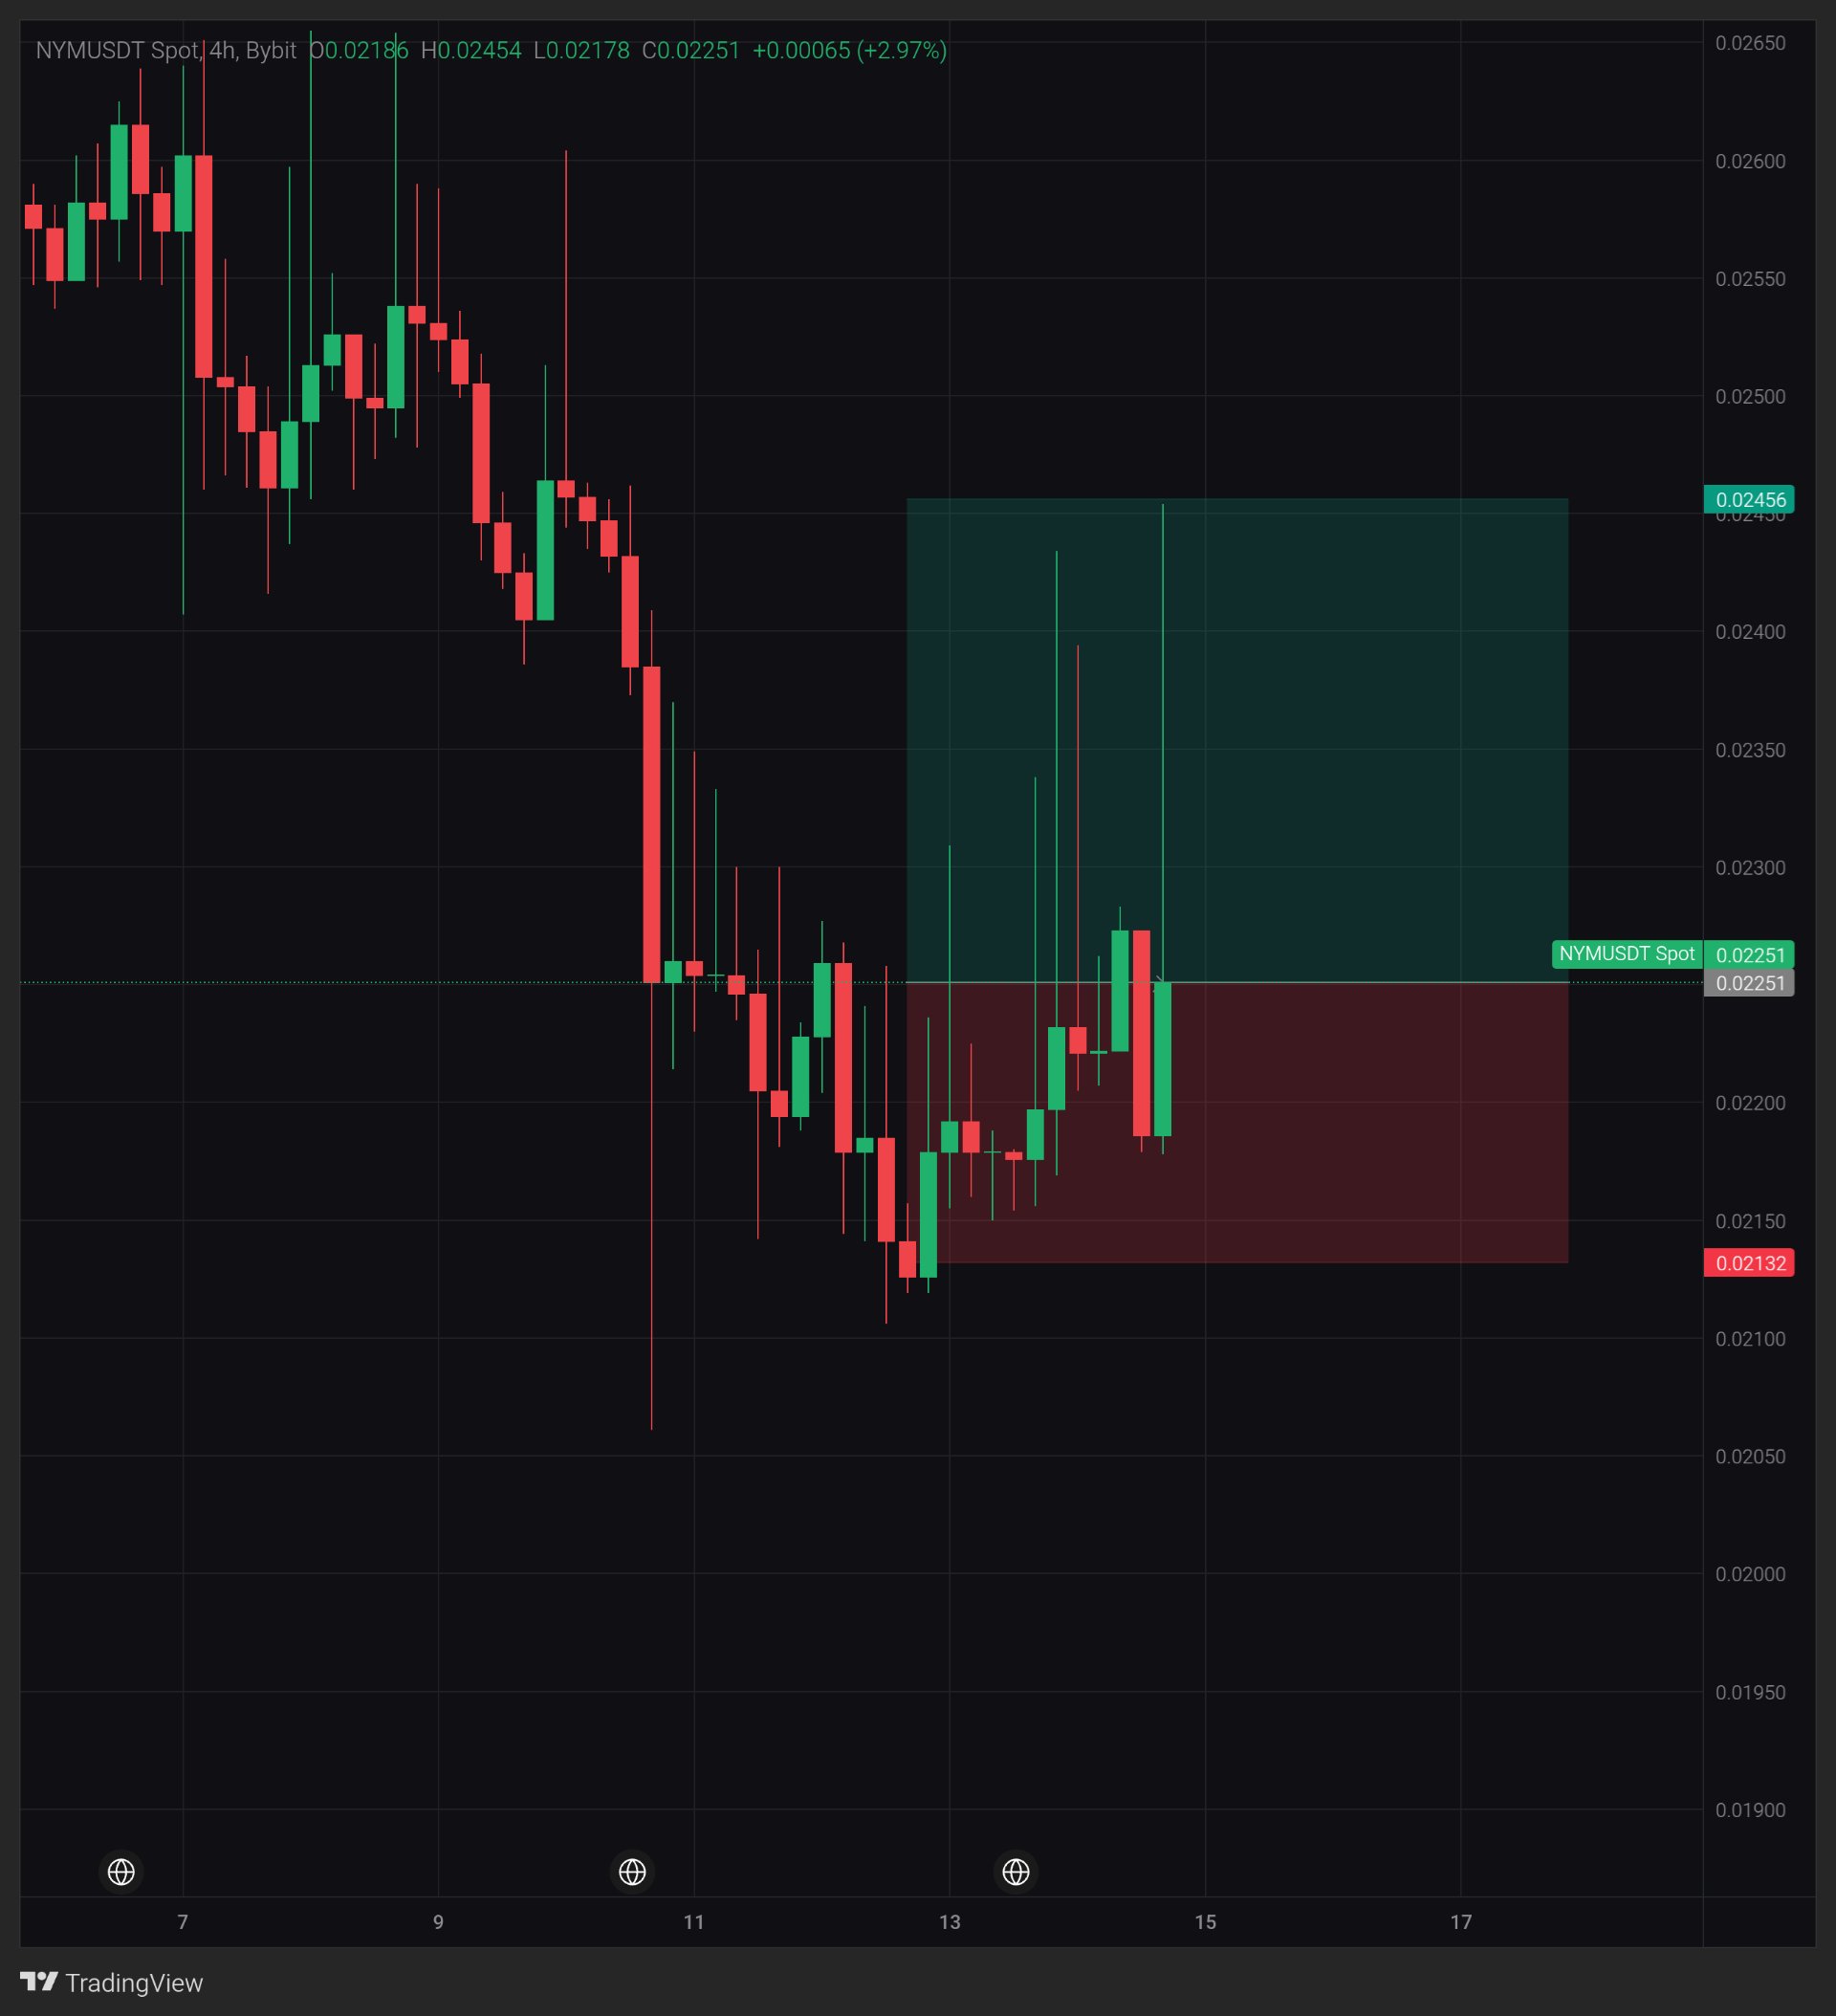
NYM: 0.02454までヒゲを伸ばし、現在は0.02251
$NYMUSDT — 価格は再び0.02251付近に戻りました。下落時に大きな陰線が引けた場所です。 現在のローソク足を見てください。始値から12.3%上昇しましたが、その上げ幅の約4分の3を戻しました。 まだ未解決なのは、0.02251が底値なのか、それとも同じ天井の下にある単なるストップなのかという点です。 0.0230の上にヒゲが5回出ていますが、終値は一度もその上に乗せていません。それを変えるには何が必要でしょうか? 4時間足、$NYMUSDT Bybit現物、0.02251、現在のローソク足は+2.97%。 マクロ情勢 2026年11月13日:米生産者物価指数(PPI)は10月、前月比0.3%上昇し、予想の0.4%を下回りました。前年同月比では6.5%で、2022年11月以来の高水準となっています(米労働統計局発表、Kitco経由)。これは背景情報であり、今回の値動きの直接的な理由ではありません。 チャートが示すこと 価格は約20%下落し、0.0265エリアから0.02107付近の安値をつけ、その後反発しています。安値は切り上がっており、概ね0.0212、次に0.0215、現在は0.0218となっています。 ヒゲに注目してください。13日以降、4時間足で5回0.0230を上抜けるヒゲが出ており、最長で0.02454まで到達しました。しかし、今回の反発における最高終値である0.02274を超えて引けたものは一つもありません。 現在のローソク足:始値0.02186、高値0.02454、安値0.02178、終値0.02251。レンジ幅は0.00276で、始値の約12.6%です。上ヒゲは0.00203で、実体0.00065の約3.1倍です。終値はレンジの下位4分の1に位置しています。 0.02107付近の安値からは、この水準で約6.8%の上昇となります。 このチャートには出来高は表示されていません。インジケーターもないため、これはプライスアクションの読み取りです。 重要なレベル サポート:0.02186(このローソク足の始値)、次に0.02132(レッドボックスの下限)。スイングローは0.02107付近。 レジスタンス:約0.02274(今回の反発における最高終値)、次に0.02456(グリーンボックスの上限、0.02454のヒゲでタッチ済み)。 強気転換の条件 0.0230を上回るヒゲは、これまで何一つ終値で確定していないため、カウントされていません。4時間足の終値が0.02274付近を超えて確定するまでは、それらのヒゲは単なるヒゲに過ぎません。0.0230超えの終値が確定して初めて、真の変化となります。再テストで0.02186より高い位置で安値を切り上げられれば、それも助けになります。 懸念点 4時間足の終値が0.02186を下回れば、このローソク足の上昇分はすべて帳消しになります。0.02132を下回って引ければ、この反発のベースを割り込むことになり、次は0.02107がターゲットとなります。0.0230の上では、これまで5回売り戻されています。 考えを変える時 4時間足の終値が0.0230を超えた時。 教訓 ヒゲは問いかけであり、終値がその答えです。5本のヒゲが0.0230について問いかけましたが、まだ答え(終値)は出ていません。 私の見解 私の読み:価格は天井の下でスタックしており、終値が0.0230を下回っている限りは慎重な姿勢を維持します。私の読みが外れる可能性もあり、4時間足の終値が0.0230を超えれば、それが私の間違いを証明することになります。私の見解ではなく、レベルを参考にしてください。これはシナリオであり、予測ではありません。投稿時点での読み取りであり、保証するものではありません。 皆さんは、切り上がる安値と、失敗に終わったヒゲ、どちらをより重視しますか? #IMPACTbyTrade
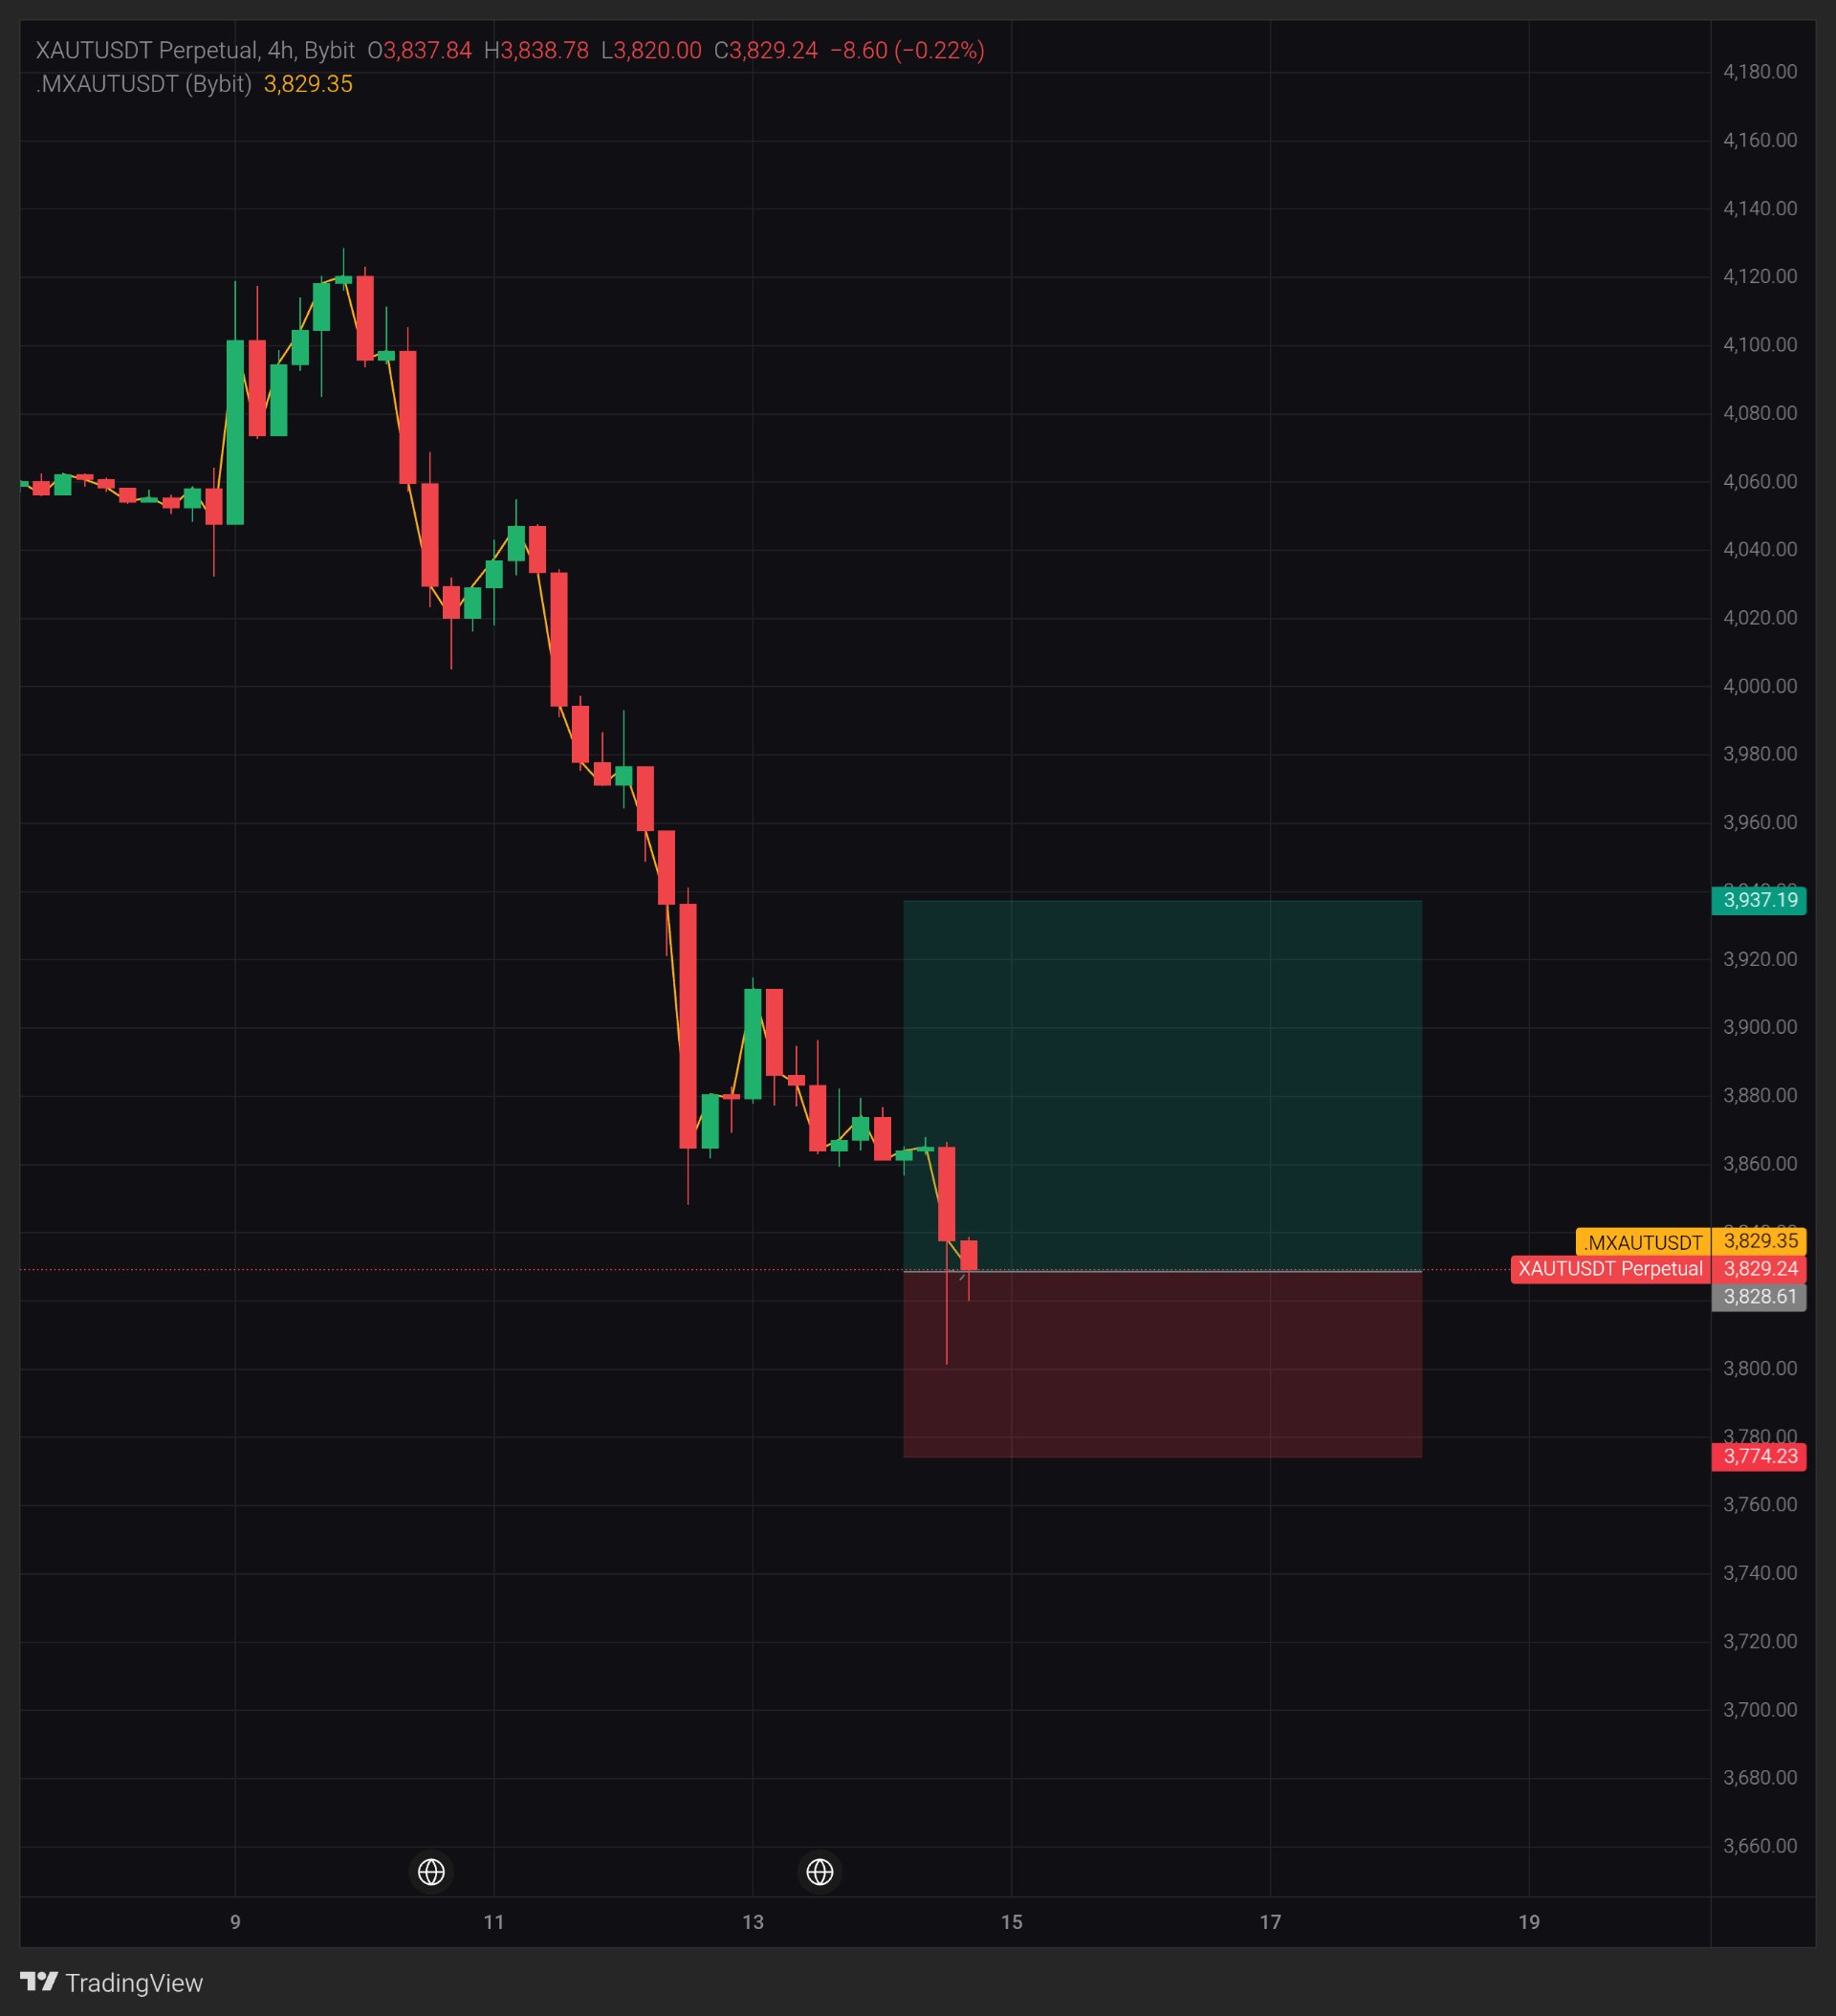
XAUT: Testing 3,828 After a 7% Drop
$XAUTUSDT — price is sitting right on 3,828.61, the line between my two boxes. Look at the current candle. It traded only 0.94 above its open, and 17.84 below it. Still unresolved: can the buyers who showed up on the last long wick hold a close? Who is more patient here, the ones who sold the bounces or the ones who bought the wick? 4H, XAUTUSDT Perpetual on Bybit, 3,829.24, -0.22% on the current candle. Macro note Nov 13, 2026: RoboForex's weekly gold outlook says markets are pricing a possible December Fed rate hike, with the FOMC minutes due Nov 18. Background only, not the reason for this move. What the chart shows Price fell from a high near 4,128 to 3,829, about 7.2%, in roughly five days. Since the old low near 3,848, the rebounds have made four lower highs in a row: about 3,915, 3,896, 3,879 and 3,867. The candle before this one closed at 3,837.84, under that old low. It also wicked down to about 3,801 before closing off its low. The current candle: open 3,837.84, high 3,838.78, low 3,820.00, close 3,829.24. The range is 18.78, about 0.5%. The upper wick is only 0.94 against an 8.60 body, so sellers held price under its open almost the whole time. The lower wick is 9.24, about the size of the body, so buyers did step in at 3,820. The index line ($XAUTUSDT) reads 3,829.35, just 0.11 from the perpetual. Volume is not shown here. The yellow line is the index price, which follows price, so it is not independent proof. This is a price-action reading. Key levels Support: 3,820.00 (low of this candle), then about 3,801 (the last wick low). The bottom of my red box is 3,774.23. Resistance: 3,838.78 (high of this candle), then about 3,848 (the old low, now overhead). The top of my green box is 3,937.19. What would strengthen it Price touched 3,820.00 and bounced, but a touch proves little. I want a 4H close above 3,838.78, then a 4H close above about 3,848 to show the old low is reclaimed. A higher low above 3,820.00 on a retest would help more. Concern A 4H close below 3,820.00 would mean the dip buyers failed. Four lower highs in a row show sellers have had the upper hand on every bounce. A close below about 3,801 would leave 3,774.23 as the next reference. What changes my mind A 4H close above about 3,867. The lesson A long wick shows buyers showed up. It does not show they stayed. Only closes do that. My view My read: this is a downtrend of lower highs, and the long wick below is not yet confirmed by a close, so I lean cautious while XAUT stays under about 3,867 on 4H closes. I could be wrong, and a 4H close above about 3,867 would prove me wrong. Take the levels, not my lean. This is a scenario, not a prediction. A reading at posting time, not a guarantee. Which level are you watching on this one, 3,820 or 3,848? #ByXIMPACT
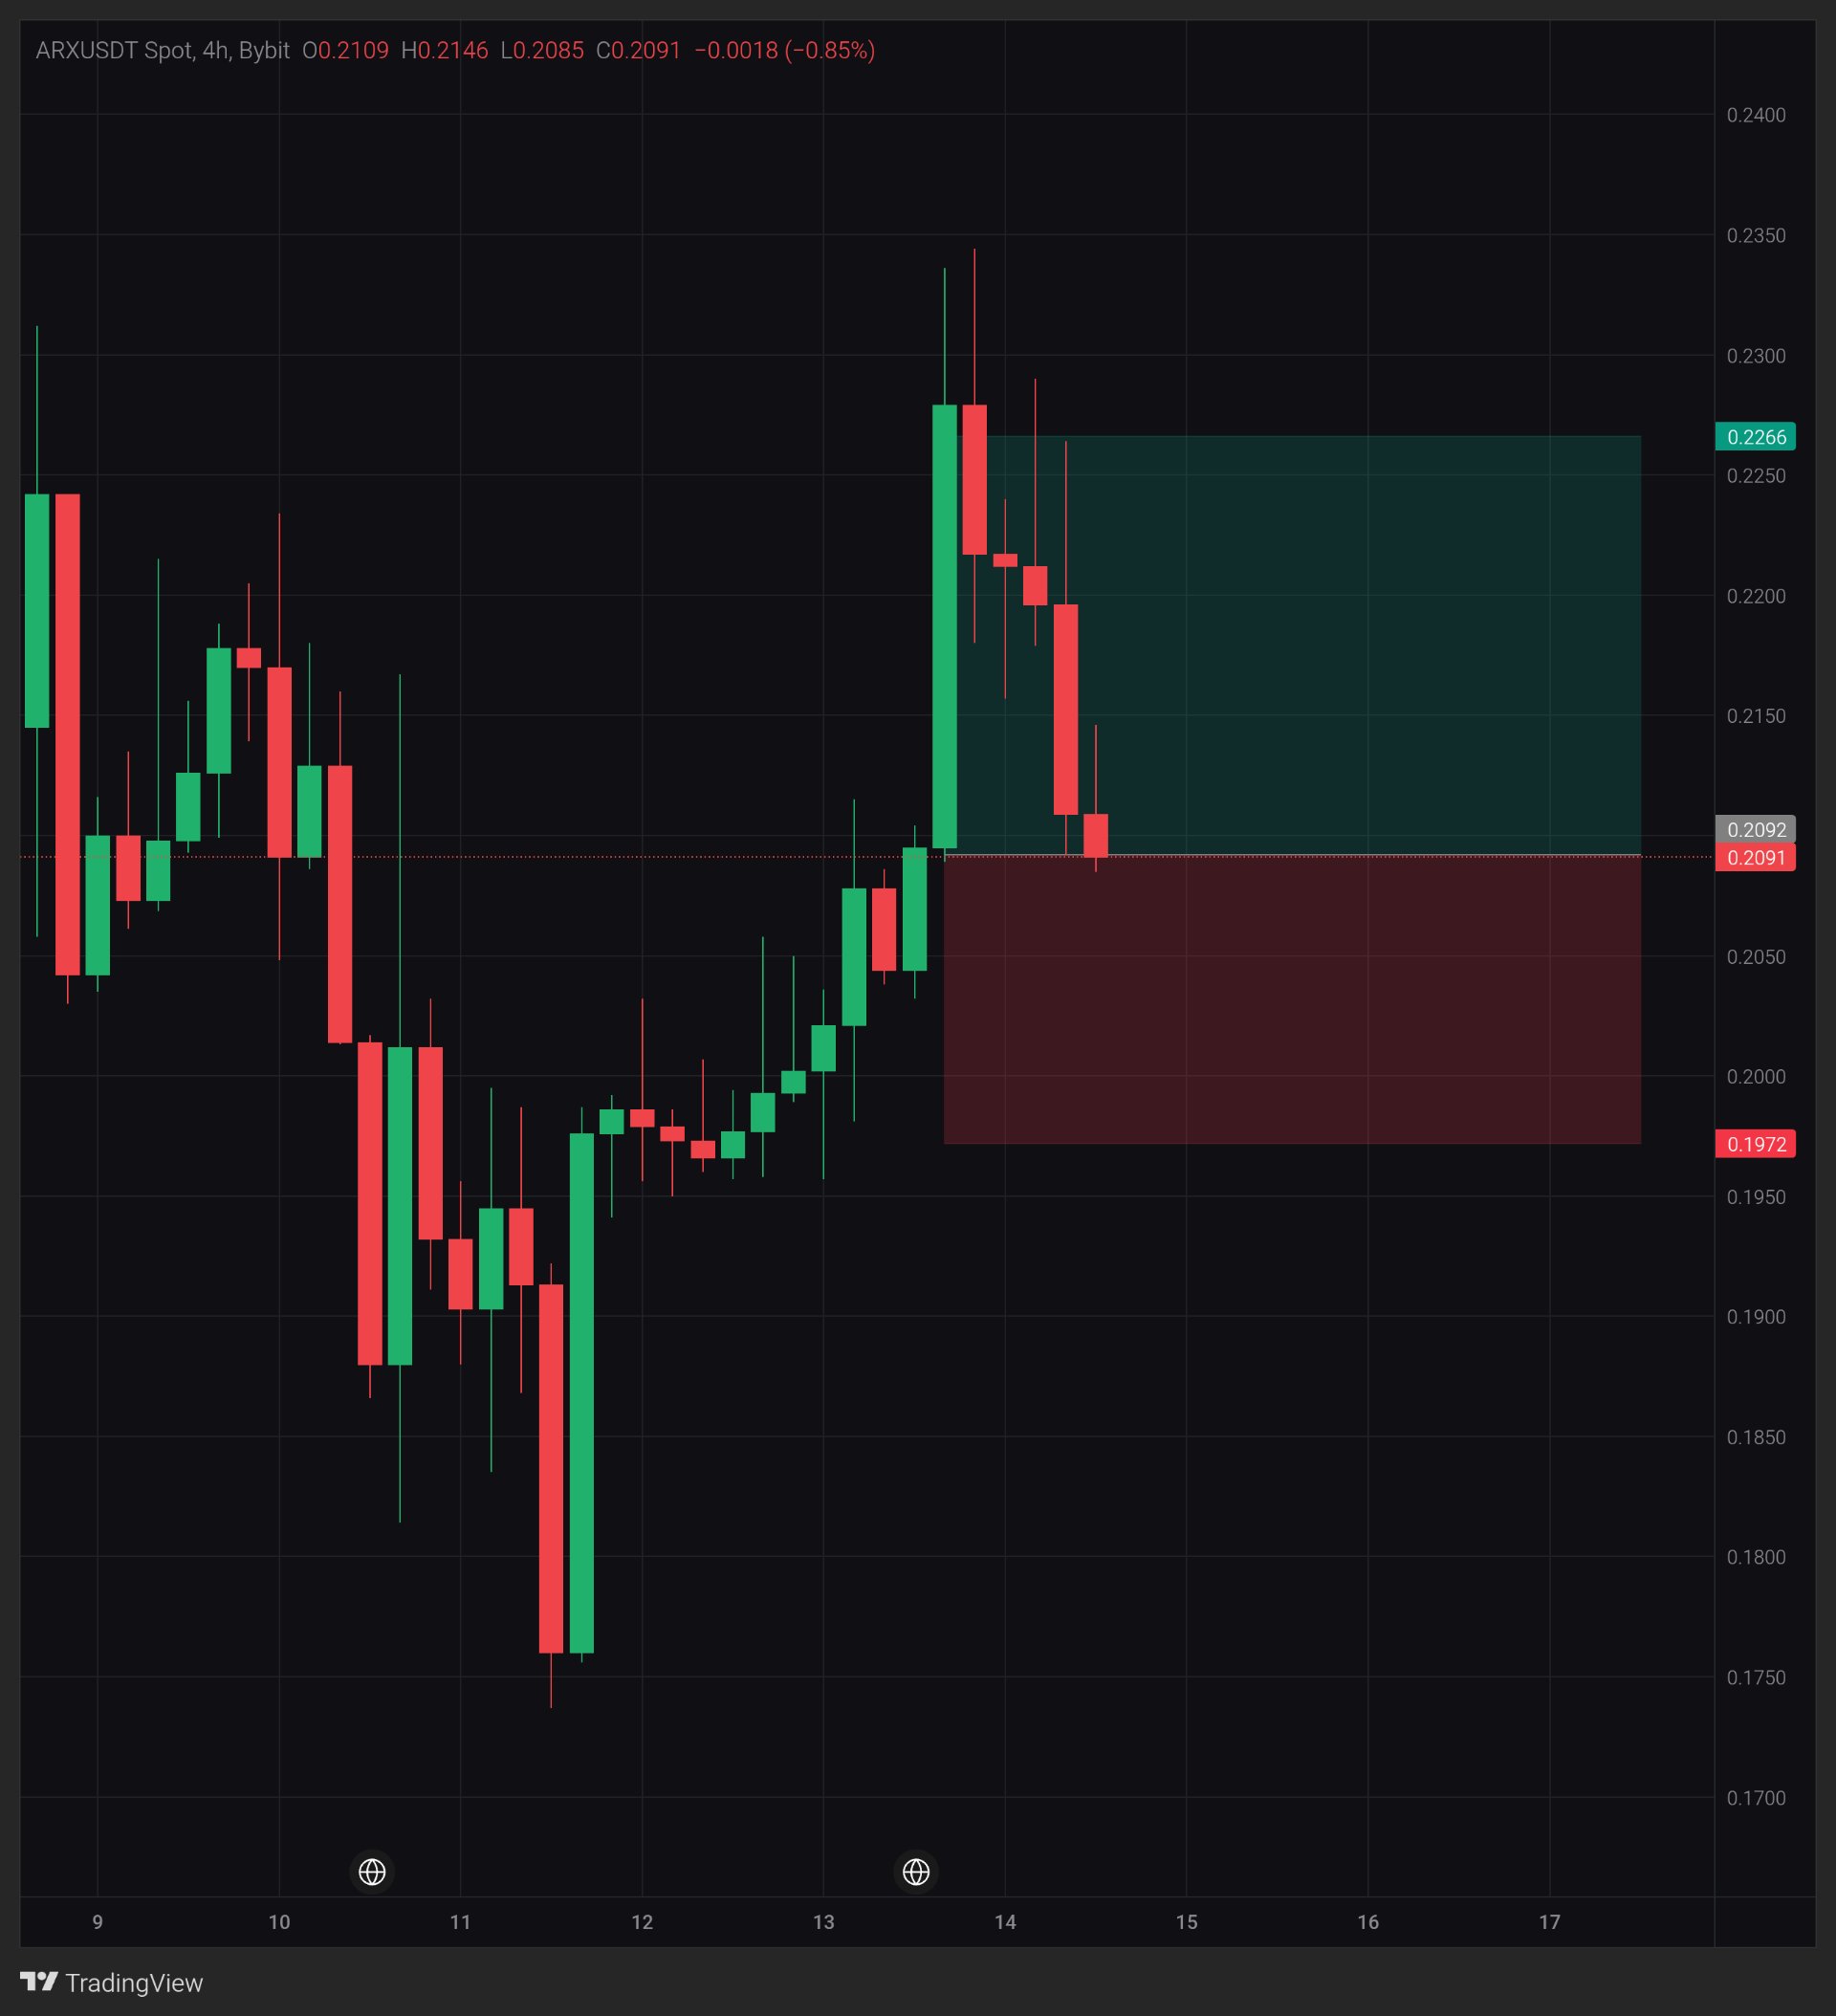
ARX:急騰が始まった0.2092に戻ってきた
$ARXUSDT — 価格は大きな陽線の起点である0.2092に戻ってきました。 直近5本の終値を見てください。あの陽線は約8.8%の上昇をもたらしましたが、5本連続の陰線でその上昇分をすべて打ち消してしまいました。 まだ未解決なのは、0.2092が4時間足の終値でサポートされるのか、それとも下落途中の単なる通過点に過ぎないのかという点です。 押し戻されたという事実が、陽線では読み取れない何を物語っているのでしょうか? 4時間足、BybitでのARXUSDT、0.2091、現在足は-0.85%。 チャートが示すもの 1本の大きな陽線が約0.2095から0.2279付近の終値まで上昇しました。次のローソク足は0.2345付近までヒゲを伸ばしましたが、その後は下落して引けました。それ以降の終値はすべて切り下がっており、0.2217、0.2212、0.2196、0.2108、そして現在は0.2091です。 現在のローソク足を見てみましょう。始値0.2109、高値0.2146、安値0.2085。値幅は約2.9%です。上ヒゲは0.0037で、実体0.0018の約2倍。価格は始値から1.75%上昇しましたが、売り戻されました。 ズームアウトしてみると、約0.1738から0.2345までの上昇は概ね+35%でした。価格はその上昇幅の約42%を吐き出しています。 このチャートには出来高が表示されていないため、この売りにどれだけの重みがあったのかは判断できません。インジケーターもないため、これはプライスアクションのみの読み取りです。 重要な水準 サポート:0.2092(大きな陽線の起点、2つのボックスの境界線)、次は0.1972(赤いボックスの下端)。 レジスタンス:0.2146(現在のローソク足の高値)、次は0.2266(緑のボックスの上端)。 強気転換の条件 価格はすでに0.2092にタッチし、0.2085までディップしているため、タッチしたこと自体はあまり意味を持ちません。私が求めているのは、0.2092を上回る4時間足の終値、その後に0.2146を上回る終値です。リテストで0.2092より高い位置で安値を切り上げられれば、さらに確信が持てます。大きな陽線の実体の中間点、0.2187付近で戻りの動きが吸収され始めると判断できます。 懸念点 4時間足が0.2092を下回って引ければ、急騰の起点が失敗したことを意味します。次の参照水準は、赤いボックスの境界である0.1972です。5本連続の陰線は、これまでのところ売り手が主導権を握っていることを示しています。 考えが変わる条件 0.2187を上回る4時間足の終値。 教訓 水準へのタッチは「訪問」に過ぎません。終値こそが「決定」です。価格は0.2092を訪問しましたが、まだ決定は下していません。 私の見解 私の読み:これは価格が始点に戻ってしまった「失敗したスパイク」のように見えます。そのため、ARXが4時間足で0.2187を下回っている間は慎重な姿勢を保ちます。私が間違っている可能性もあります。0.2187を上回る4時間足の終値が確定すれば、私の間違いが証明されるでしょう。私の見解ではなく、水準を参考にしてください。これは予測ではなく、シナリオです。投稿時点での読み取りであり、保証ではありません。 次は4時間足の終値が0.2092の上か下、どちらで着地してほしいですか?またその理由も教えてください。 #ByXIMPACT #WSOTあなたのAI取引を見せて10USDTを獲得 #ジェンスン・ファン、NvidiaのAIリーダーシップを試す出口戦略

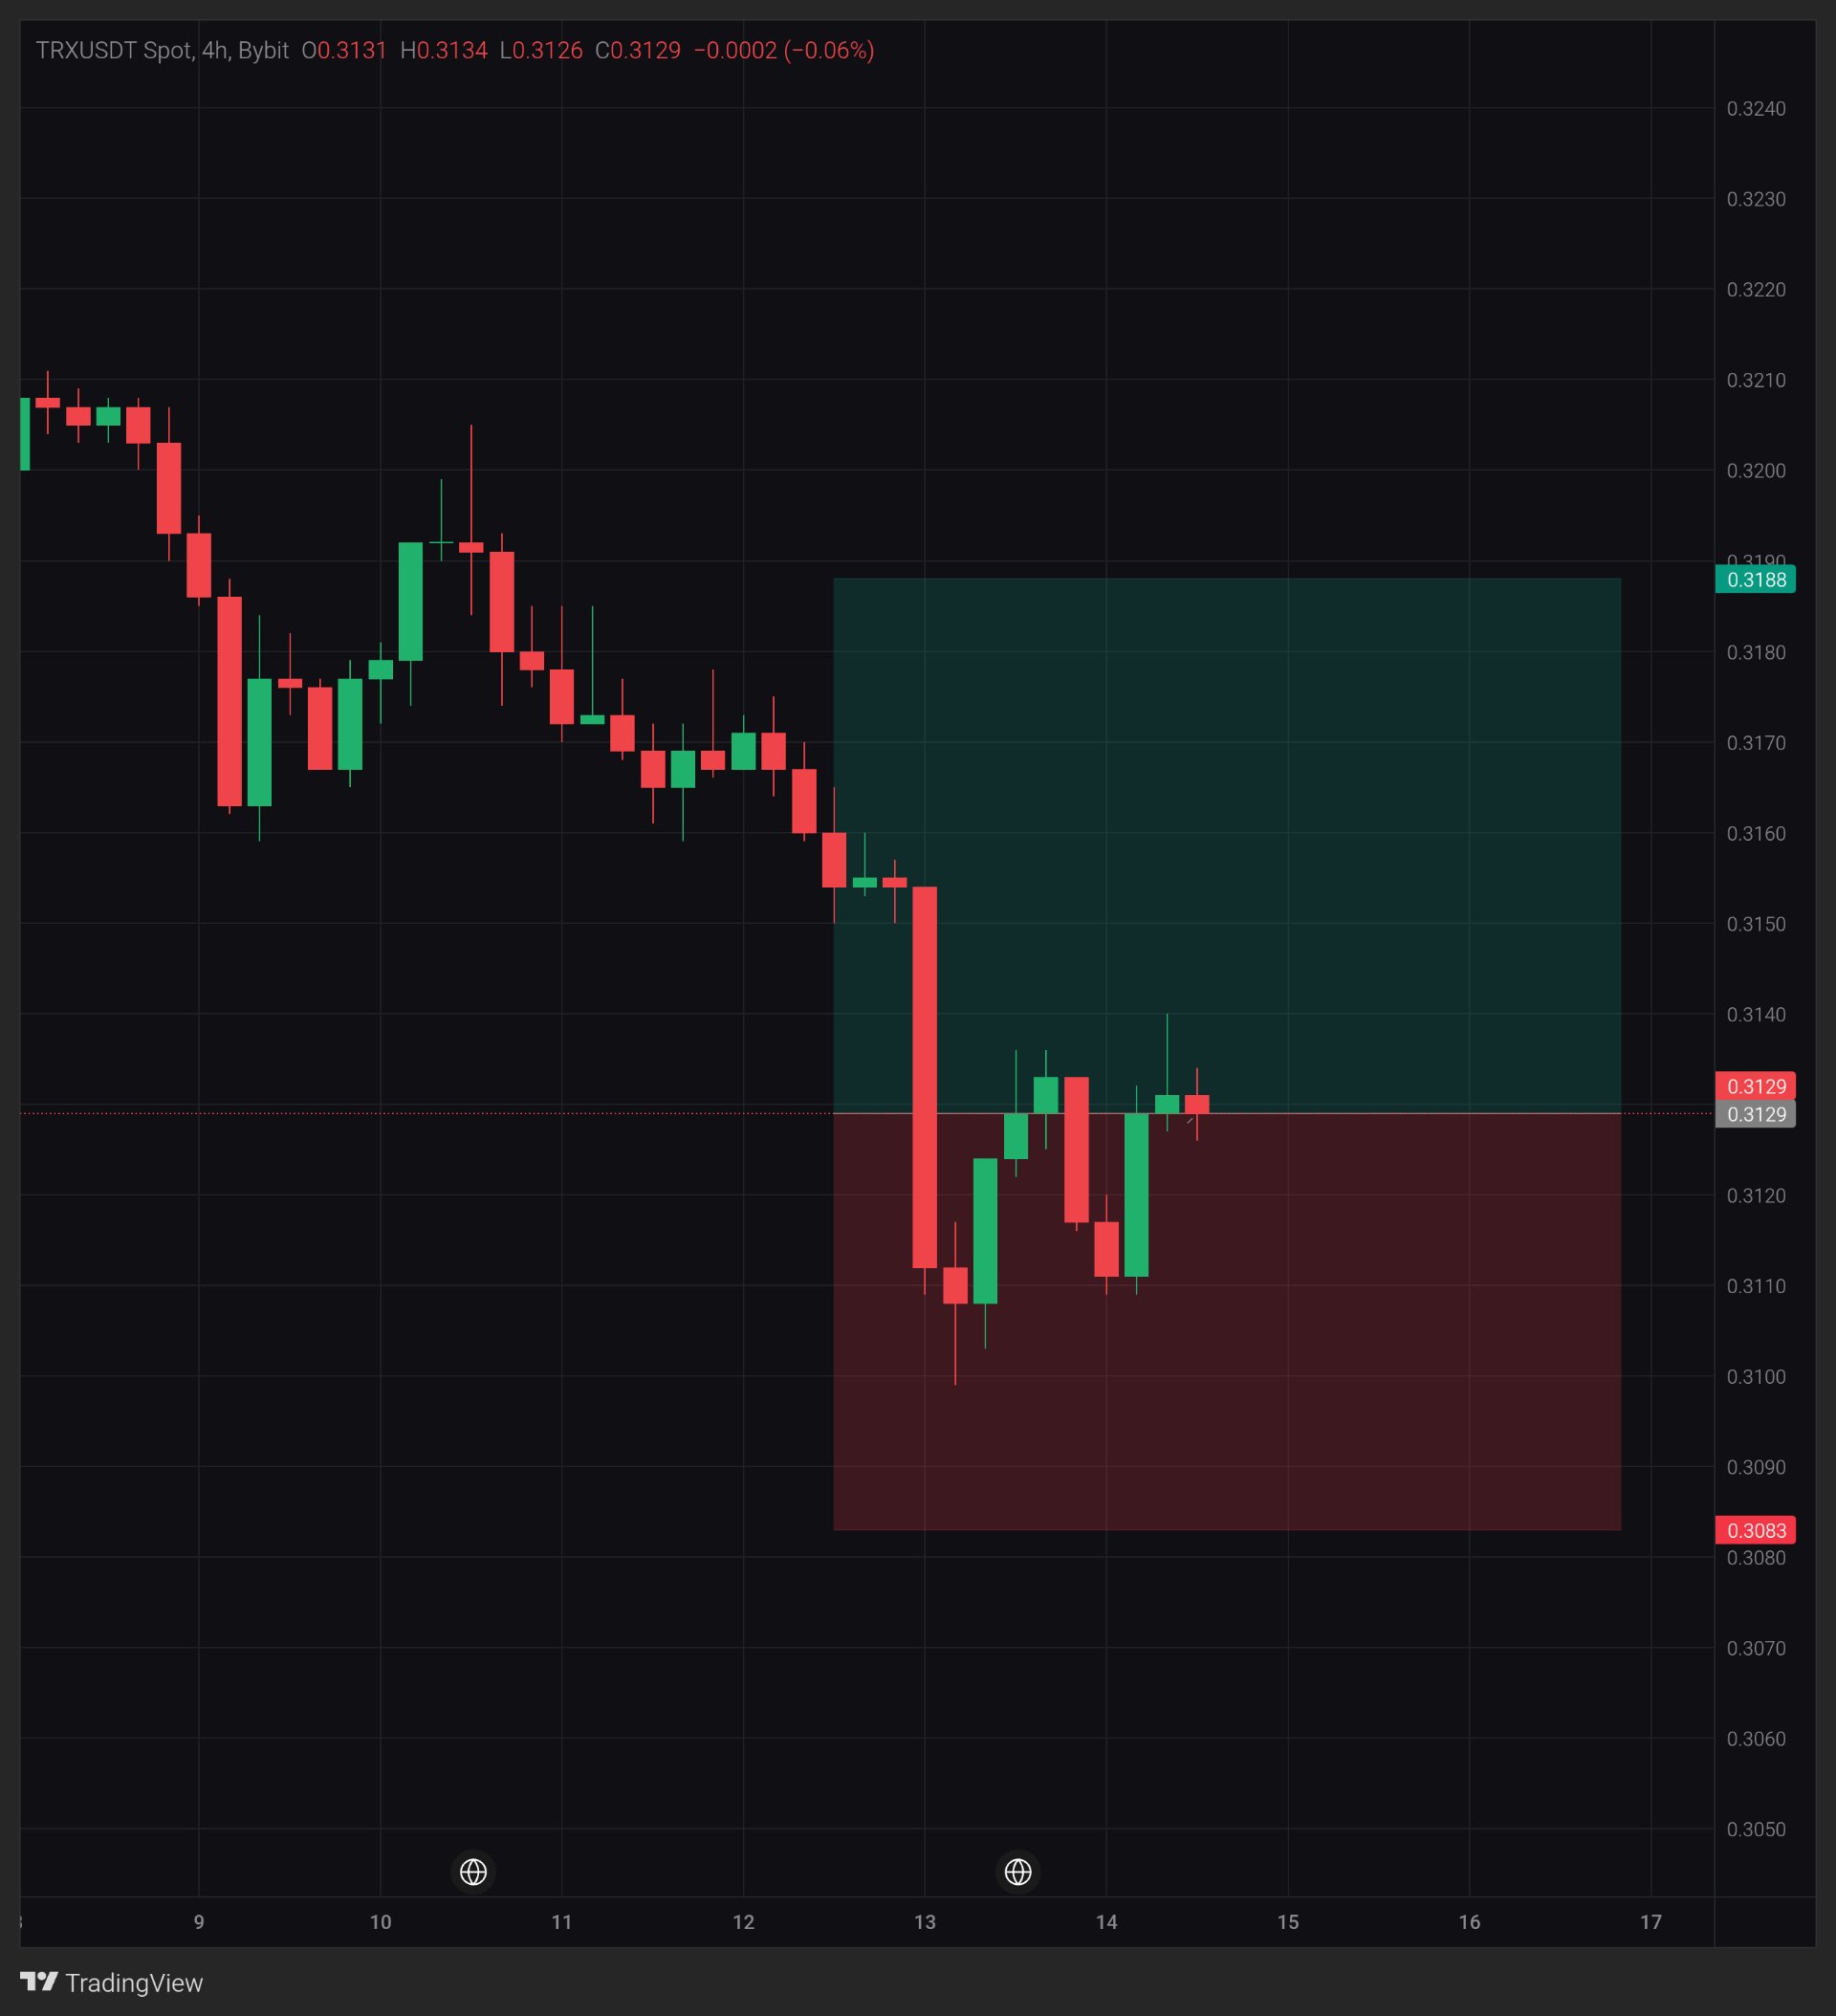
TRX: 0.3133で実体が2つ抑えられている。突き抜けるかな?
$TRXUSDT — 0.3133で直近2本のローソク足の実体が止められています。 レンジを見てみましょう。下落から9本のローソク足が出ていますが、すべて約1.3%の範囲内に収まっています。 その上限は大きな陰線の中心点でもあり、価格はそこで2度失敗しています。 このまま上抜けるのか、それとも0.3110のフロアが先に崩れるのか? 4時間足チャート、$TRXUSDT Bybit現物、価格0.3129(現在のローソク足で-0.06%)。 マクロ関連メモ 11月13日:10月の米生産者物価指数は前年同月比6.5%上昇し、4年ぶりの大きな伸びとなりました(The Standard紙)。背景情報であり、今回の値動きの直接的な理由ではありません。 チャートが示すもの 大きな陰線の4時間足1本で、価格は0.3154から0.3112へと約1.3%下落しました。それ以降、価格は0.3140のヒゲ高値まで反発しましたが、ローソク足の実体は、その陰線のちょうど中間点である0.3133で止まり続けています。安値は0.3109から0.3111の間で推移しています。つまり、価格はフロア(床)とキャップ(天井)の間に挟まれており、レンジ全体がその1本の陰線よりも狭い状態です。このチャートには出来高や指標は表示されていないため、プライスアクションのみの情報となります。 主要レベル サポート:0.3126(現在のローソク足の安値)、次いで0.3109〜0.3111(繰り返される安値)、その次は0.3098(ヒゲの安値)と0.3083(ボックスの下限)。 レジスタンス:0.3133(実体の上限)、次いで0.3136〜0.3140(ヒゲの高値)、その次は0.3154(大きな陰線の始値)と0.3188(ボックスの上限)。 強気材料 0.3140へのタッチは、過去にも到達済みであるため、何も証明しません。まずは4時間足がこの水準を上回って確定することが第一歩となります。なぜなら、これまでのところ0.3133を上回るヒゲは維持できていないからです。 懸念点 4時間足が0.3109を下回って確定すれば、直近の押し目を支えていたフロアが崩れ、次は0.3098を試すことになります。0.3133で再度拒絶されれば、そのキャップはより無視できないものとなるでしょう。 考えが変わる条件 4時間足が0.3154を上回って確定した場合。これは大きな陰線を完全に打ち消すことになります。 教訓 下落後の狭いレンジは「一服」です。どちらが終値で勝つかによって、それがどのような性質の一服だったのかが決まります。 個人的な見解 私の読みでは、これは現時点ではリバーサル(反転)ではなく、下落後の一服に見えます。0.3140での確定を見るまでは慎重な姿勢を維持します。私が間違っている可能性もあり、その場合は4時間足が0.3154を上回って確定した時でしょう。私の見解ではなく、レベル(水準)を参考にしてください。これはシナリオであり、予測ではありません。投稿時点での分析であり、保証するものではありません。 キャップとフロアに注目してください。どちらが先に崩れると思いますか? #ByXIMPACT #AnthropicIPOValuationTest #米中間選挙後、ビットコインが2か月ぶりの安値を記録
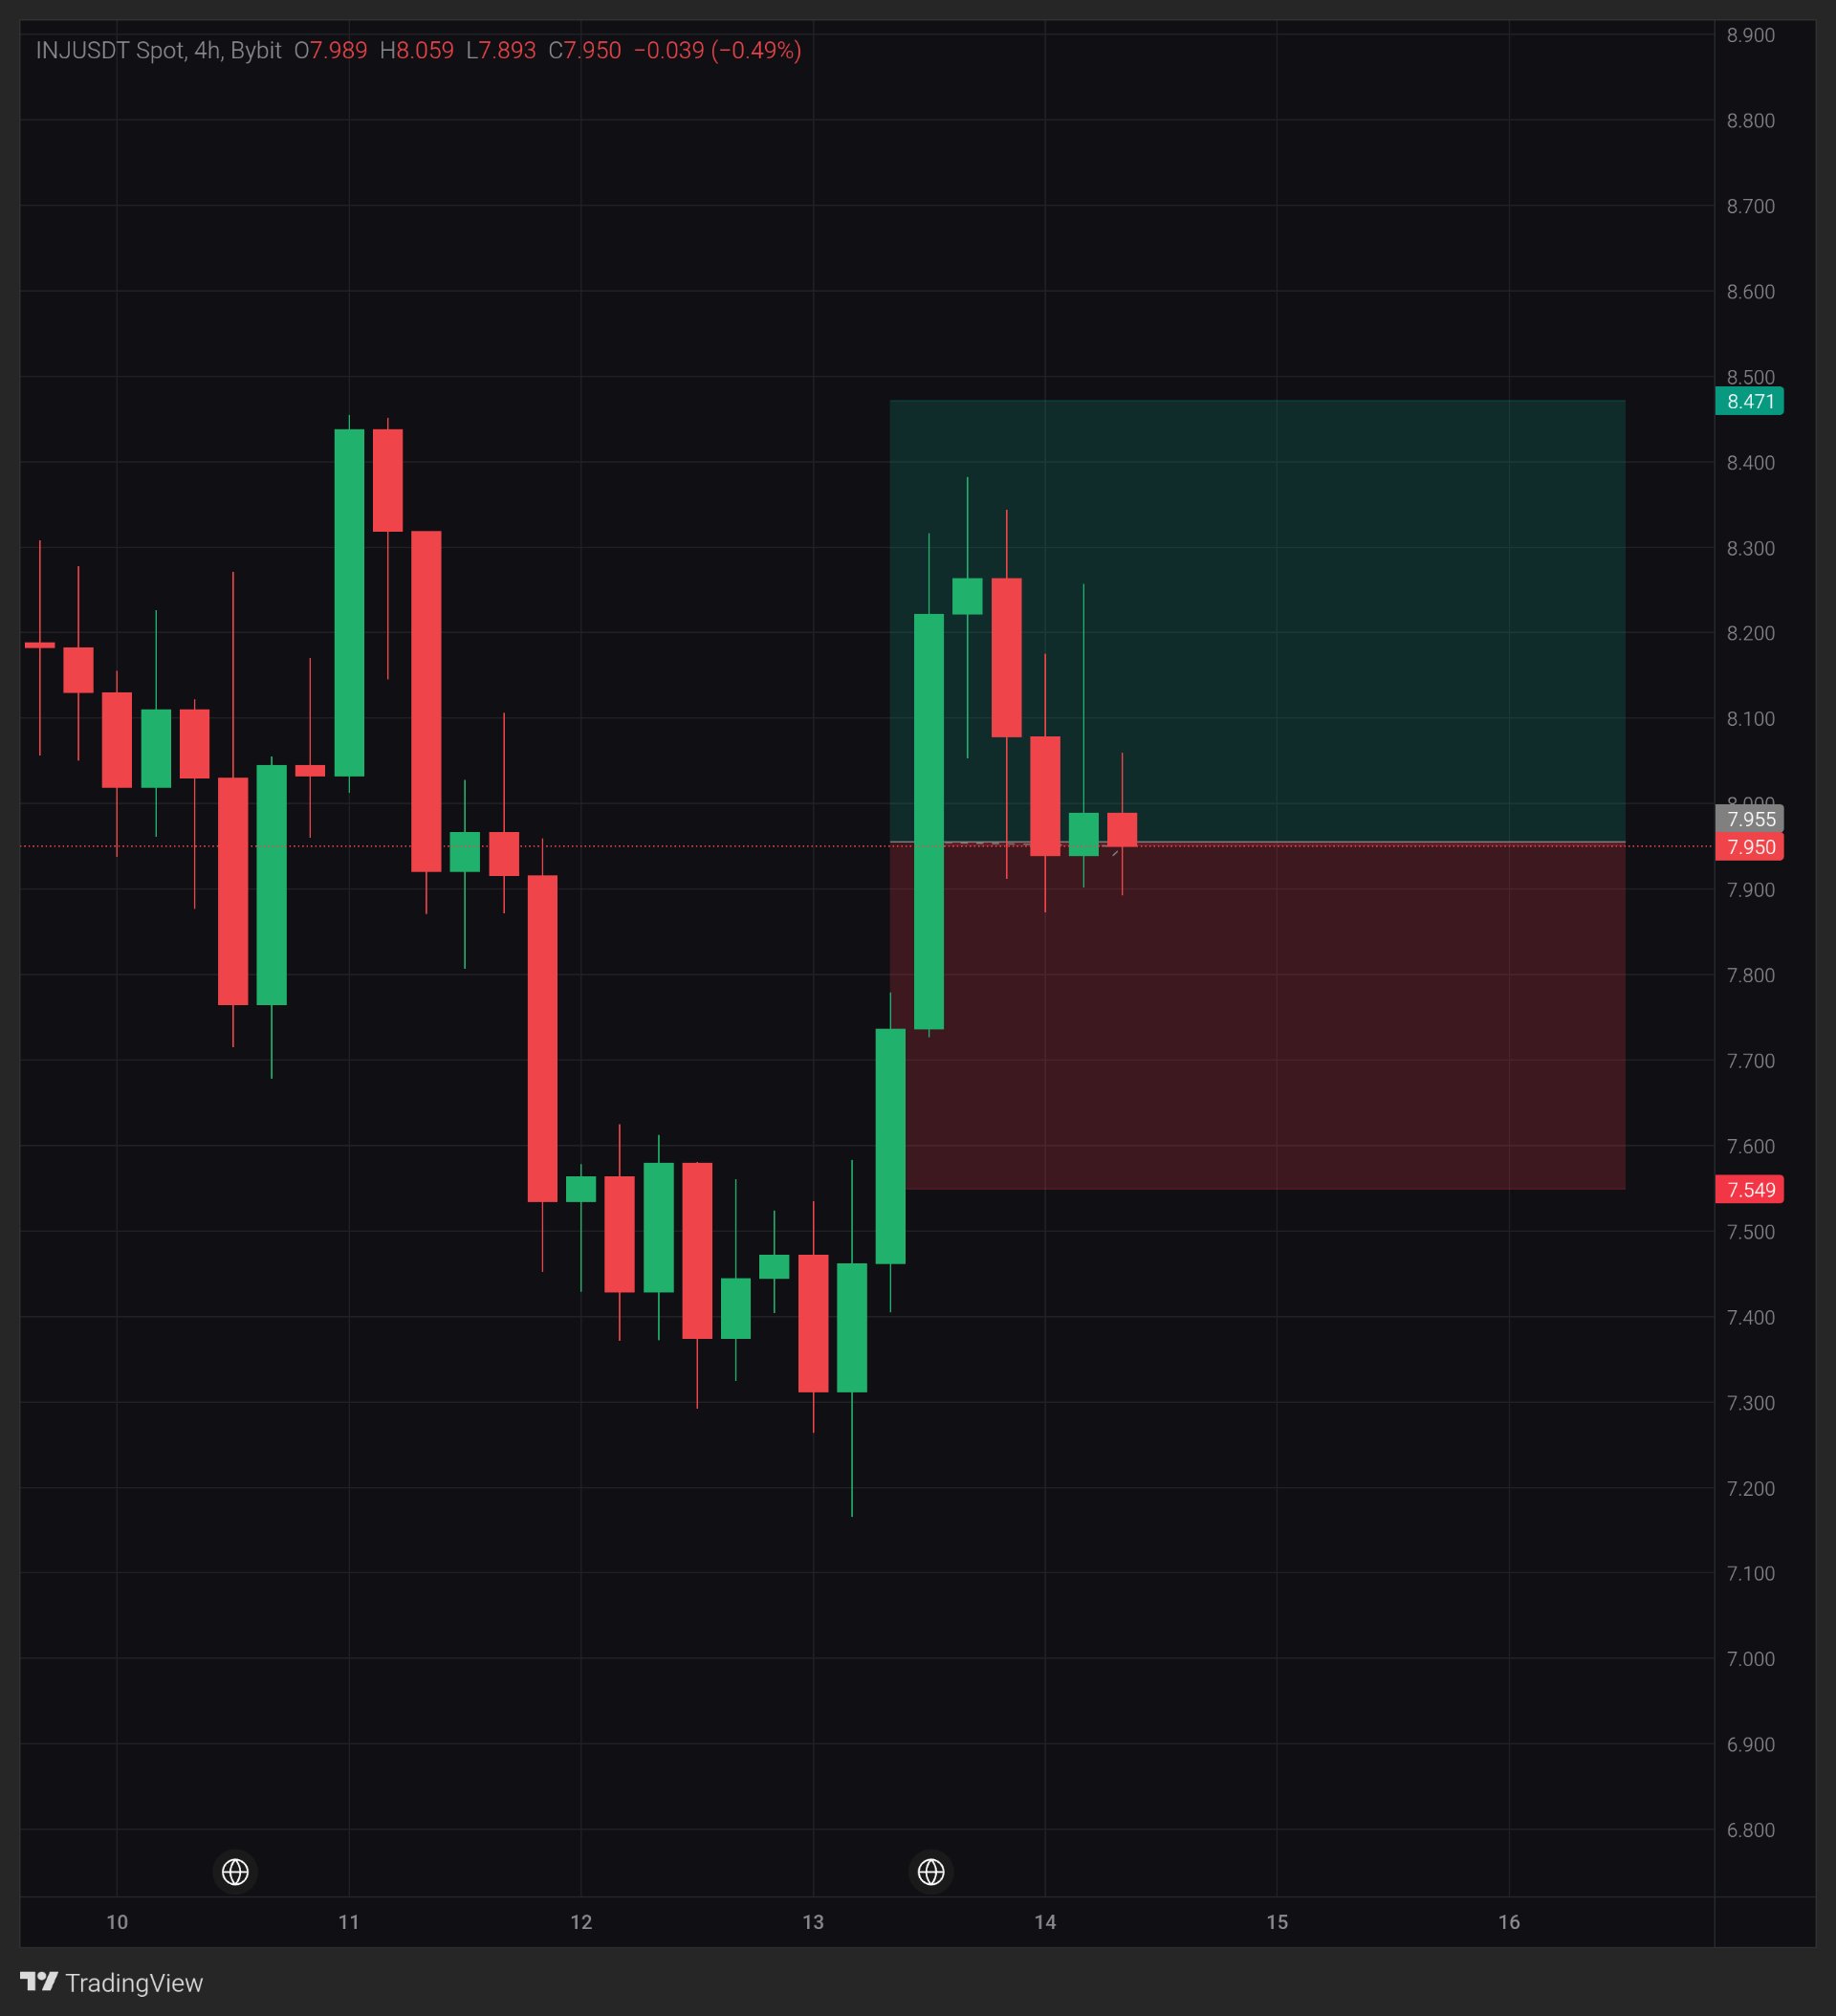
INJ: 7.87 floor, lower highs. Which breaks?
$INJUSDT — 7.87 to 7.90 keeps catching every dip. The highs have faded from 8.385 to 8.059 over five candles. Price is also sitting at the midpoint of a 6% surge candle. Does the floor hold, or does the squeeze break down first? 4H chart, $INJUSDT Spot on Bybit, price 7.950 (-0.49% on the current candle). Macro note Nov 13: US October producer prices rose 6.5% year-on-year, the largest annual gain in four years, adding to expectations of more Fed rate hikes (The Standard). Background only, not the reason for this move. What the chart shows INJ bounced from the 7.17 wick low to the 8.385 high, about 17%, led by one big green candle (7.735 to 8.225, about 6%). Since then price has faded back to 7.95, right at that candle's midpoint, about 7.98. The recent candles keep repeating lows at 7.87 to 7.90 while the highs fade, so price is squeezing between a flat floor and lower highs. A small green candle also left a wick up to about 8.265, where sellers showed up. Volume and indicators are not shown on this chart, so this is price action only. Key levels Support: 7.87 to 7.90 (repeated lows), then 7.735 (base of the surge candle), then 7.549 (bottom of my box). Resistance: 8.06 (current candle high), then 8.18 to 8.27 (wick highs), then 8.385 and 8.471 (top of my box). What would strengthen it Touching 8.06 proves nothing. A 4H close above it would end the lower-high pattern, and a close above 8.27 would clear the last wick high. Holding 7.87 on another dip would also help. Concern A 4H close below 7.87 would break the floor that caught the last dips, with 7.735 next. A bounce that fades back to the midpoint of its own biggest candle is losing strength. What changes my mind A 4H close below 7.735, which would erase the whole surge candle. The lesson A bounce that gives back half of its biggest candle is asking a question. The floor under it decides the answer. My view I'm watching the 7.87 floor and the 8.06 cap. A squeeze like this resolves one way or the other, and a close shows which side won. This is a scenario, not a prediction. A reading at posting time, not a guarantee. Which gives first, the 7.87 floor or the 8.06 cap? #ByXIMPACT

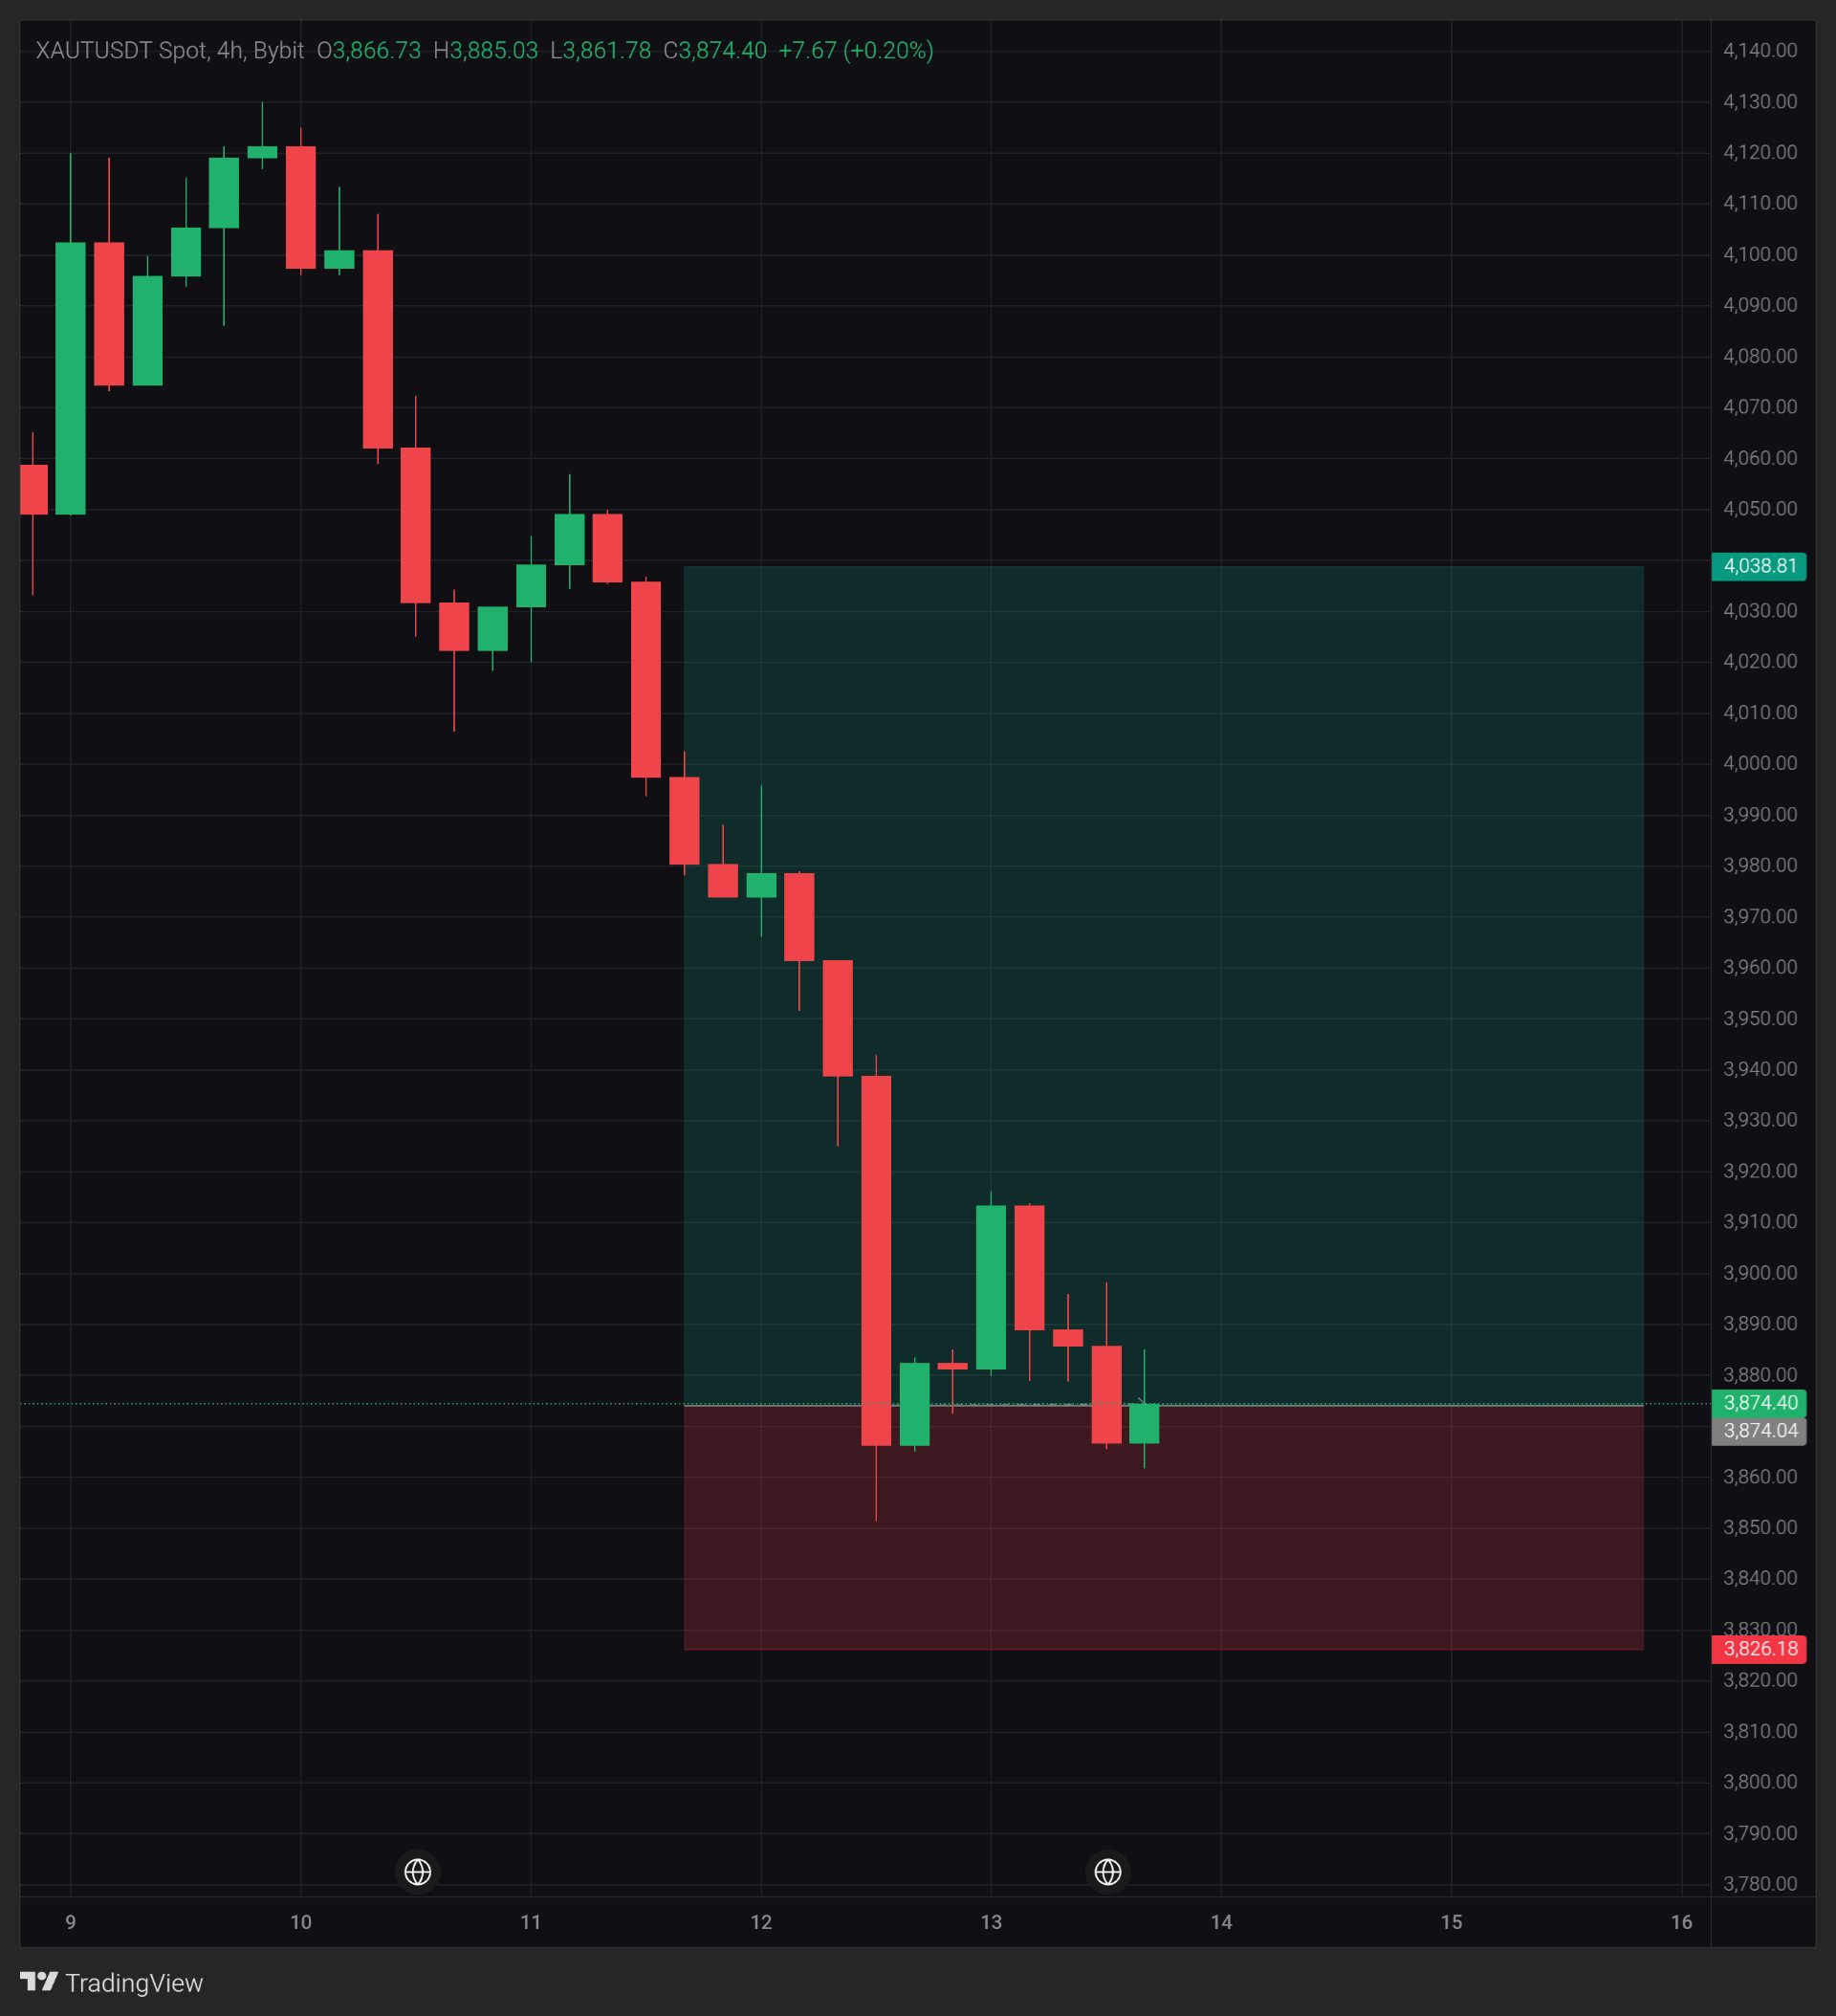
XAUT: 金は回復に向けて準備中か?
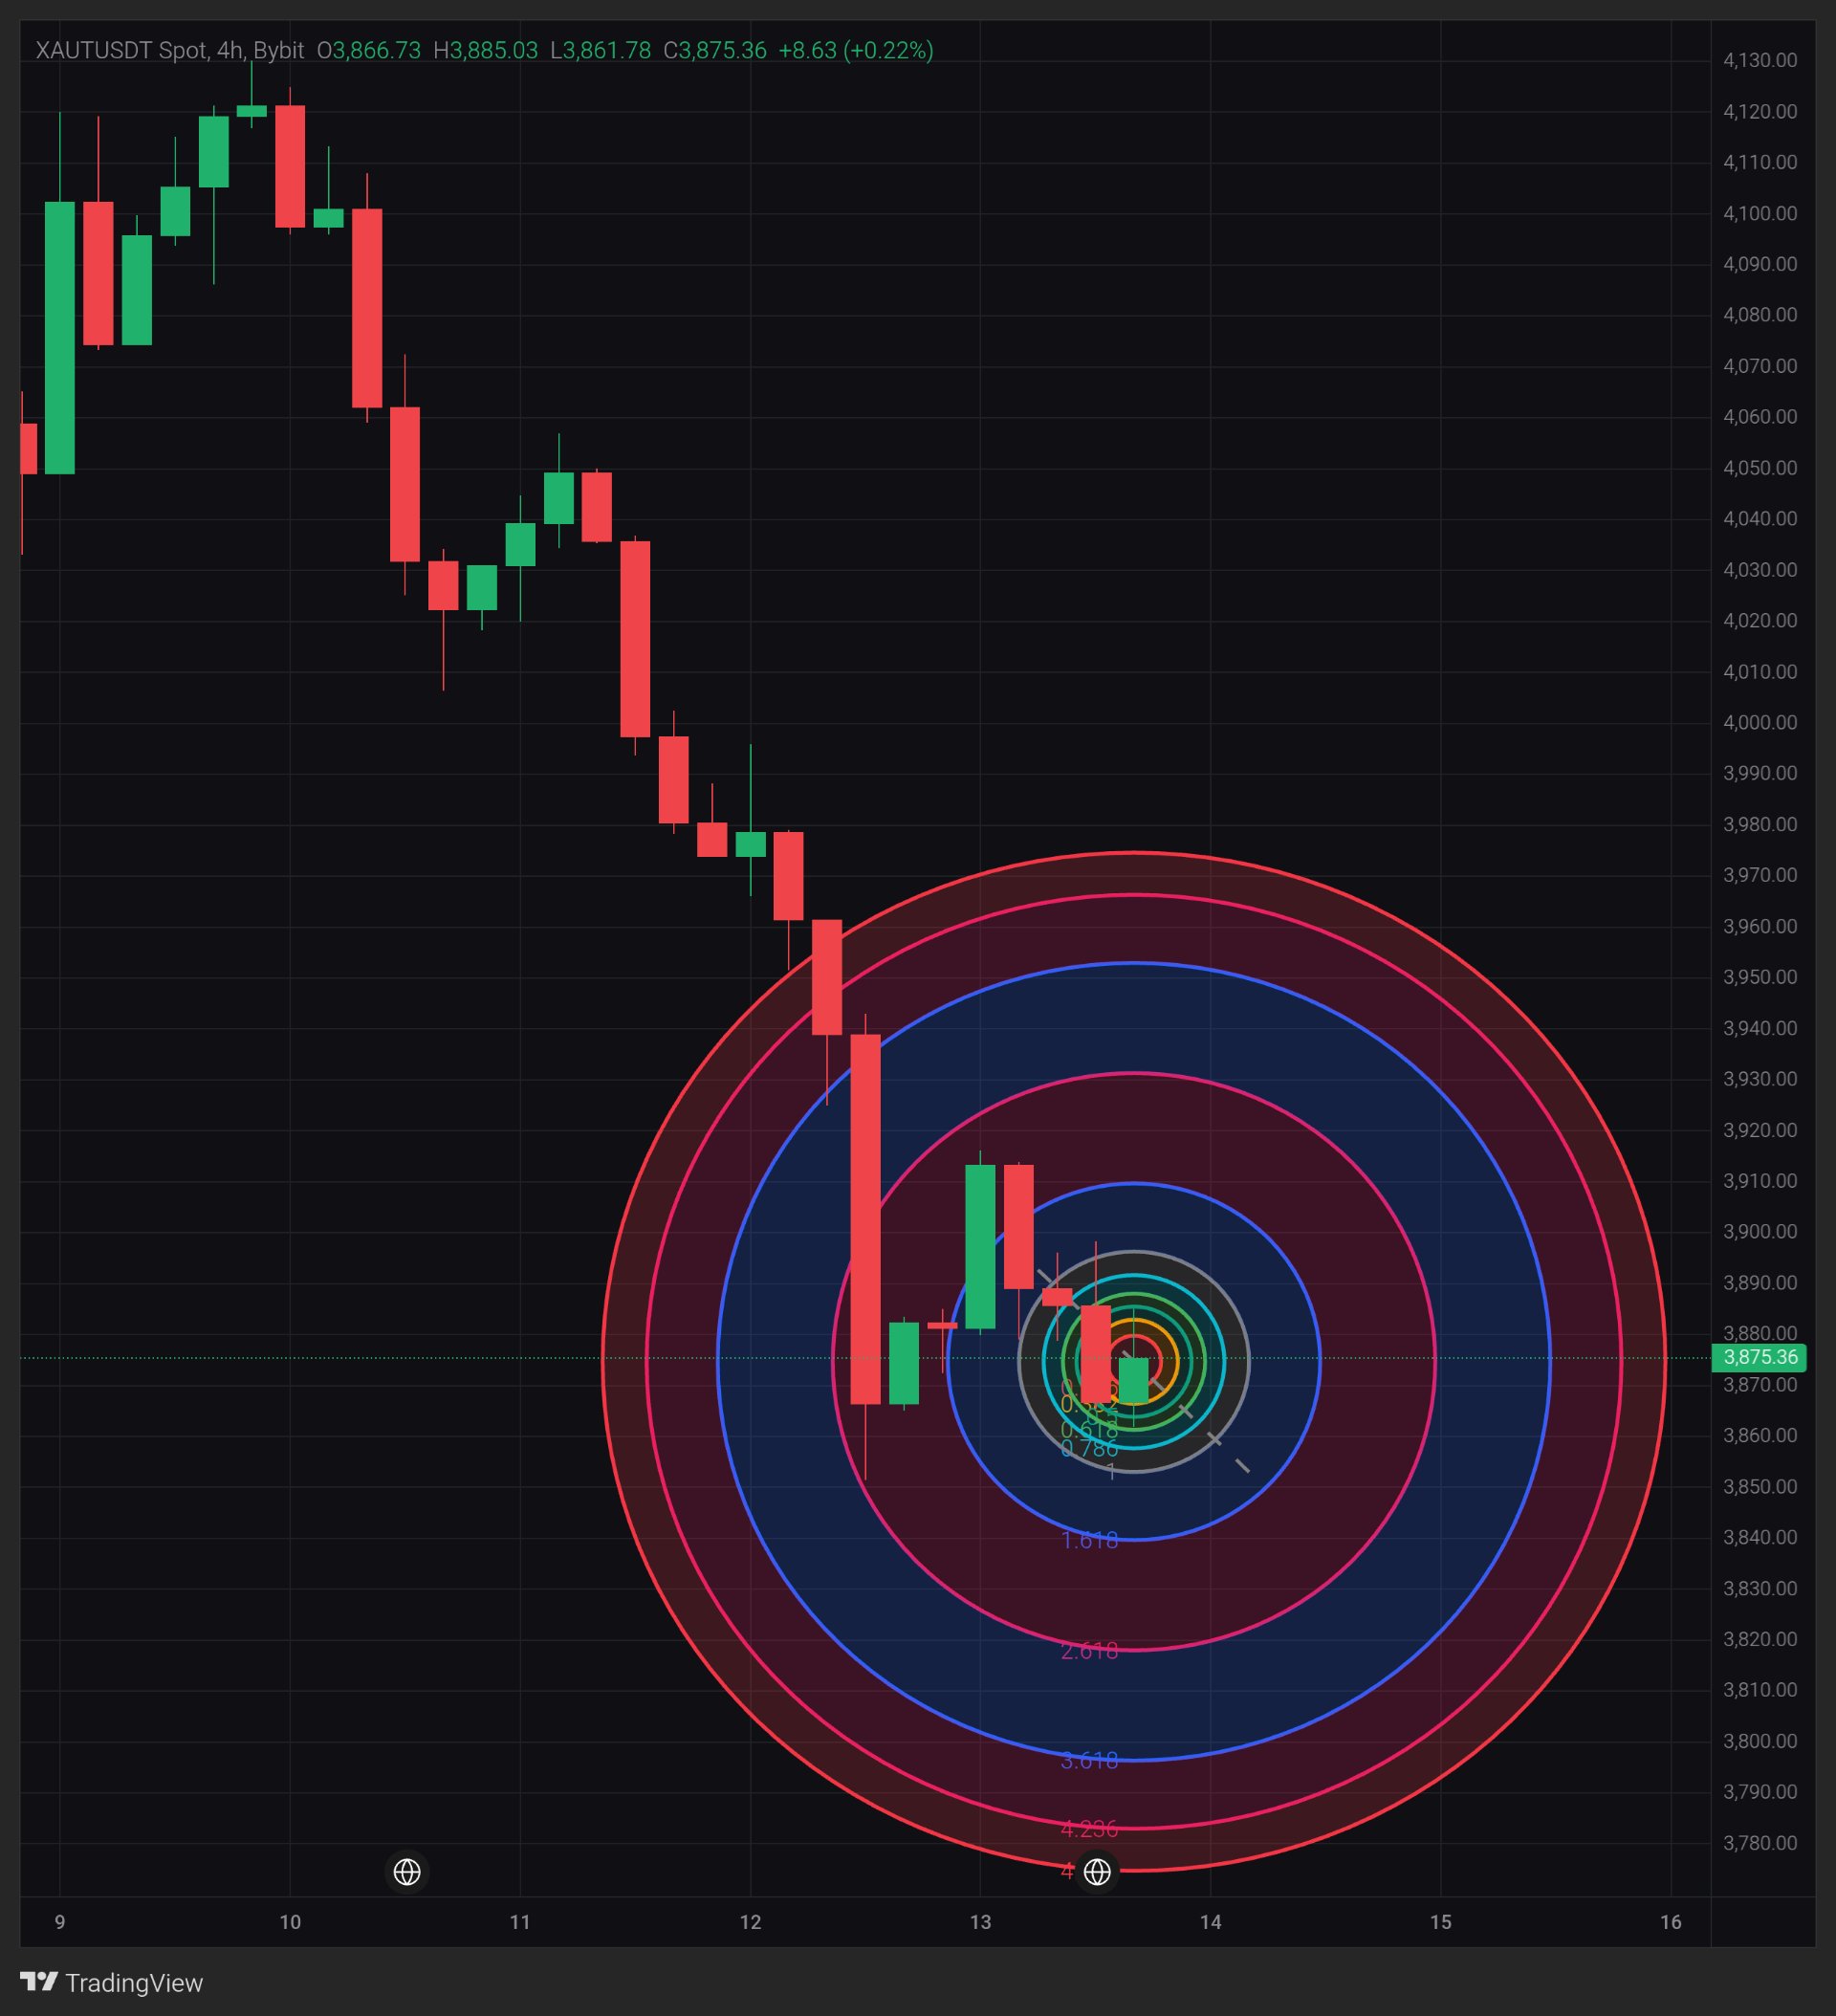
金は急激な売り圧力にさらされていますが、XAUTは現在3,860ドル〜3,875ドル付近の重要なサポートエリアを試しています。 興味深いのは、金がマクロ経済的な圧力に直面している一方で、Tether Goldが透明性の面で重要な進展を見せたことです。買い手が現在の水準を守ろうとする中で、これが市場に異なる物語を生み出す可能性はあるのでしょうか? 私のBybit 4時間足チャートでは、$XAUTUSDTは3,874.40ドルで、現在のローソク足は0.20%上昇しています。価格は3,866.73ドルで始値がつき、3,885.03ドルに達し、3,861.78ドルを試しました。 何が金を動かしているのか? 金は、インフレ懸念の強まり、米ドルの堅調さ、そして米国債利回りの上昇を受けて圧力を受けてきました。これらの要因は連邦準備制度(FRB)の引き締め政策への期待を高めており、一般的に金のような利息を生まない資産の重しとなります。 しかし、金曜日の生産者物価指数(PPI)のデータがいくらかの救いとなりました。10月の米PPIは0.4%の予想を下回る0.3%の上昇にとどまり、金は最近の下落分の一部を回復しました。 XAUTのファンダメンタルズ Tether Gold特有の重要な進展もあります。 11月12日、TetherはKPMG米国がTG Commoditiesの2025年度財務諸表の独立監査を完了したと発表しました。この監査には、XAUTの裏付けとなる金地金の物理的な検査および識別確認が含まれています。 これは、ブロックチェーンを通じて現物の金へのエクスポージャーを提供するよう設計されたトークンにとって、透明性の面で有意義なマイルストーンです。 とはいえ、準備金の透明性が高まったからといって、自動的に市場価格が上昇するわけではありません。XAUTは依然として基礎となる金市場と密接に連動しています。 テクニカル構造 4時間足チャートは引き続き弱気の短期構造を示しており、高値の切り下げと4,130ドル付近からの強い売り圧力が続いています。 価格は現在、3,860ドル〜3,875ドル付近で安定しようとしています。 私が注目している重要なレベル: 短期的なサポート:3,860ドル 二次サポート:3,850ドル 主要サポート:3,826ドル 第一レジスタンス:3,885ドル〜3,900ドル 次のレジスタンス:3,940ドル より高いレジスタンス:3,980ドル 主要な回復ターゲット:4,038ドル 強気シナリオ 買い手が3,860ドルを維持し続け、価格が3,900ドルを奪還できれば、3,940ドルへの上昇を注視します。 3,980ドルを上回る強い回復が見られれば、4,038ドルへの道が開かれる可能性があります。 私のチャート設定では、3,874ドル付近でのエントリーの可能性を示唆しており、ターゲットは4,038.81ドル、ストップロスは3,826.18ドルとしています。 ただし、単にサポート付近だからといってエントリーするのではなく、4時間足での回復を確認してから判断したいと考えています。 弱気シナリオ もしXAUTが4時間足の終値ベースで3,860ドルを割り込んだ場合、回復の試みは失敗に終わる可能性があります。 その場合、次の下値エリアとして3,850ドルと3,826ドルを監視します。 3,826ドルを明確に下抜ければ、チャート上の強気設定は無効となります。 私のトレードプラン 3,860ドル〜3,900ドルのレンジを注視しています。 レジスタンスを上抜けることができれば回復の見通しは改善しますが、再び拒絶されれば下落リスクがさらに高まります。 落下するナイフを掴むよりも、確認が取れるのを待つ方が賢明だと考えます。 私の見解 現在、XAUTが興味深いのは、透明性が向上しているという物語と、裏付けとなる金市場の弱さとの対比です。 KPMGの監査はポジティブなファンダメンタルズの進展ですが、ドルや米国債利回り、FRBの政策期待が依然として重要なドライバーであることに変わりはありません。 私にとって、3,860ドル〜3,900ドル付近での次の4時間足の反応こそが、これが回復の始まりなのか、それとも広範な下落トレンドの中の一時停止に過ぎないのかを見極める鍵となります。 $XAUTUSDT #ByXIMPACT
KOR: Can Buyers Defend $0.00040?
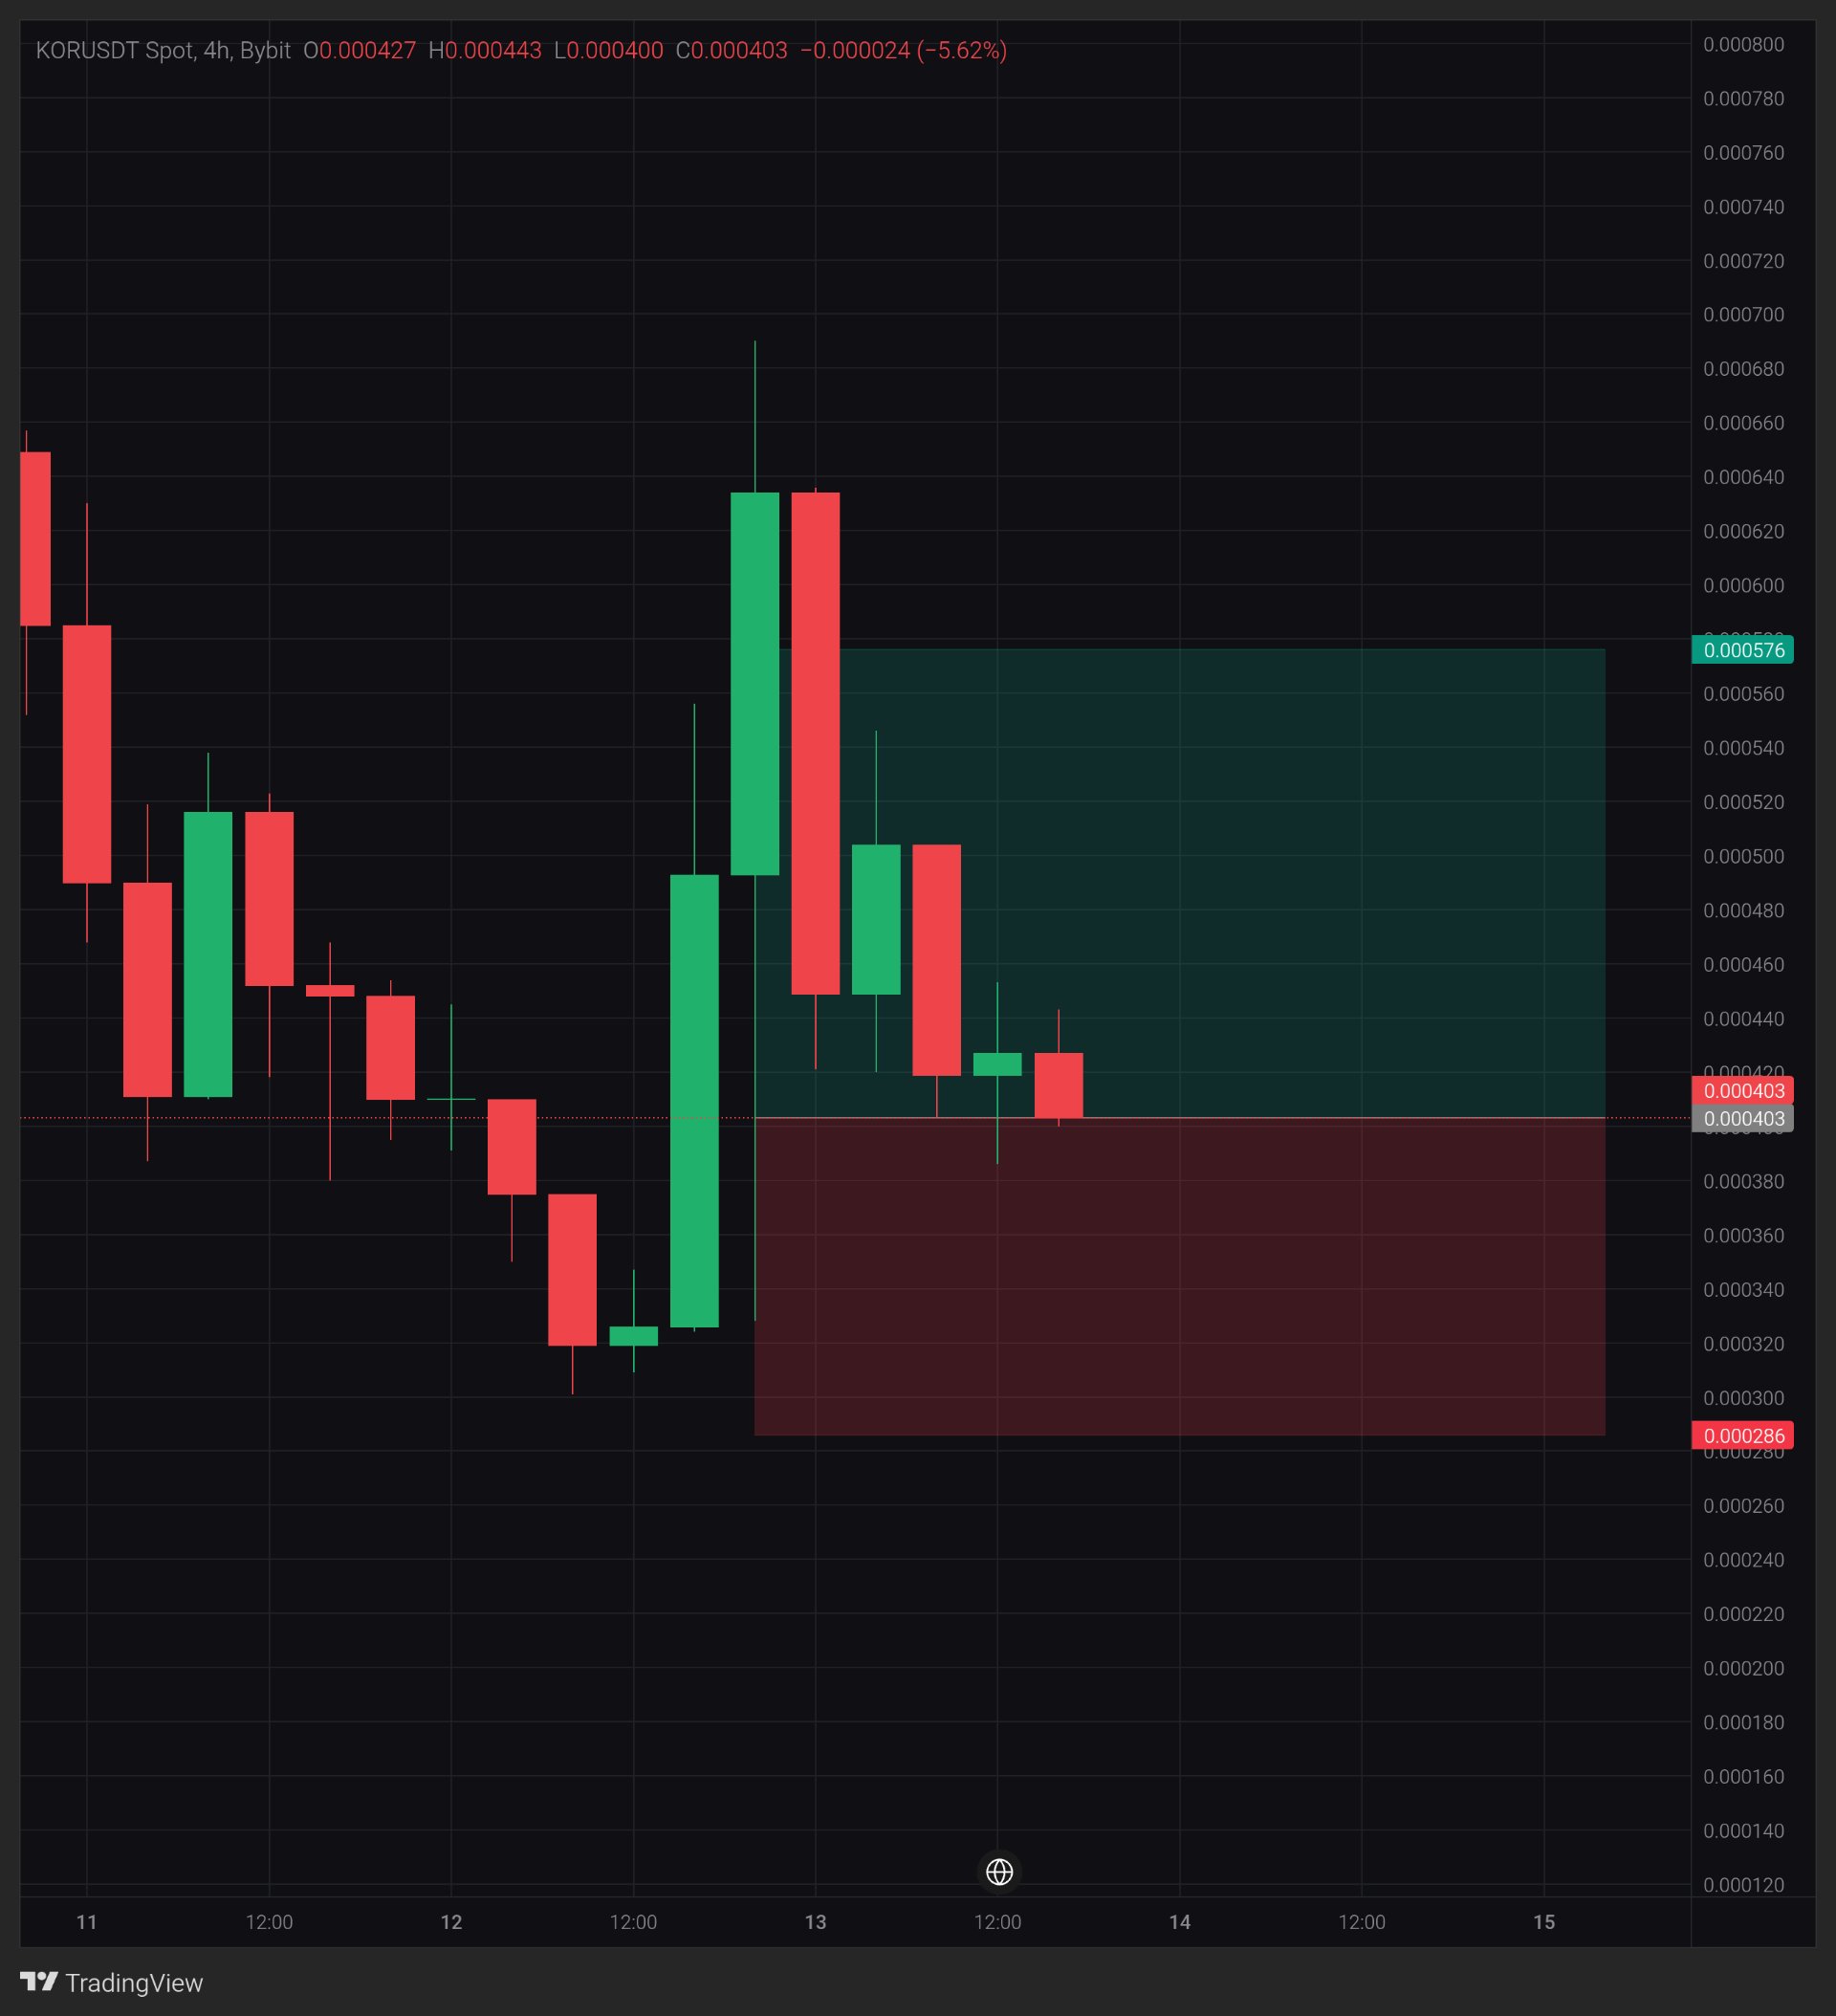
$KORUSDT is approaching a critical level, and the next 4H candles could reveal whether buyers are preparing another recovery or whether sellers still control the market. After a sharp rebound from around $0.00032 toward $0.00063, KOR has lost momentum and returned to the $0.00040 area. This is where I want to see whether buyers can step back in. My Bybit 4H chart shows KORUSDT at $0.000403, down 5.62% on the current candle. The candle opened at $0.000427, reached $0.000443 and tested a low of $0.000400. PROJECT FUNDAMENTALS KOR Protocol is built on Base and focuses on managing creative rights, licensing and payment settlements on-chain. Its goal is to give artists, producers, publishers and intellectual property owners a more transparent way to manage and monetize creative assets. The project recently entered a new exchange-listing phase, with KuCoin and Gate announcing KOR spot trading on November 4. Gate also introduced a Launchpool campaign. This brings additional market exposure, but exchange listings alone do not guarantee sustainable demand or price appreciation. MARKET STRUCTURE The previous rally showed strong buying interest, but the rejection near $0.00063 changed the short-term picture. The $0.00040 area is now the immediate level to watch. Key levels: Support: $0.000400 Secondary support: $0.000380 Major support: $0.000320 Resistance: $0.000443 Higher resistance: $0.000500 Major upside target: $0.000576 BULLISH SCENARIO If buyers defend $0.00040 and KOR reclaims $0.000443 with a convincing 4H close, I would watch for a move toward $0.00050. A stronger continuation could bring $0.000576 into focus. I would prefer confirmation and a successful retest rather than entering simply because the price has fallen. BEARISH SCENARIO If KOR loses $0.00040 on a confirmed 4H close, the next areas I would monitor are $0.000380 and $0.000320. A break below $0.000320 would significantly weaken the recovery structure. The $0.000286 area is an additional downside invalidation reference from my chart setup. MY TRADING PLAN I am watching the reaction around $0.00040 rather than chasing the market. A confirmed reclaim of $0.000443 would improve the bullish case. A breakdown below support would make me reconsider the setup. Because KOR is a newly listed and highly volatile token, position sizing and risk control are especially important. MY INTERPRETATION What interests me here is not simply the percentage decline. It is the fact that price has returned to an area where buyers previously showed interest. The next 4H reaction should tell us more than any prediction. I want confirmation from price action before taking a position. #ByXIMPACT #JensenHuangExitTestsNvidiasAILeadership
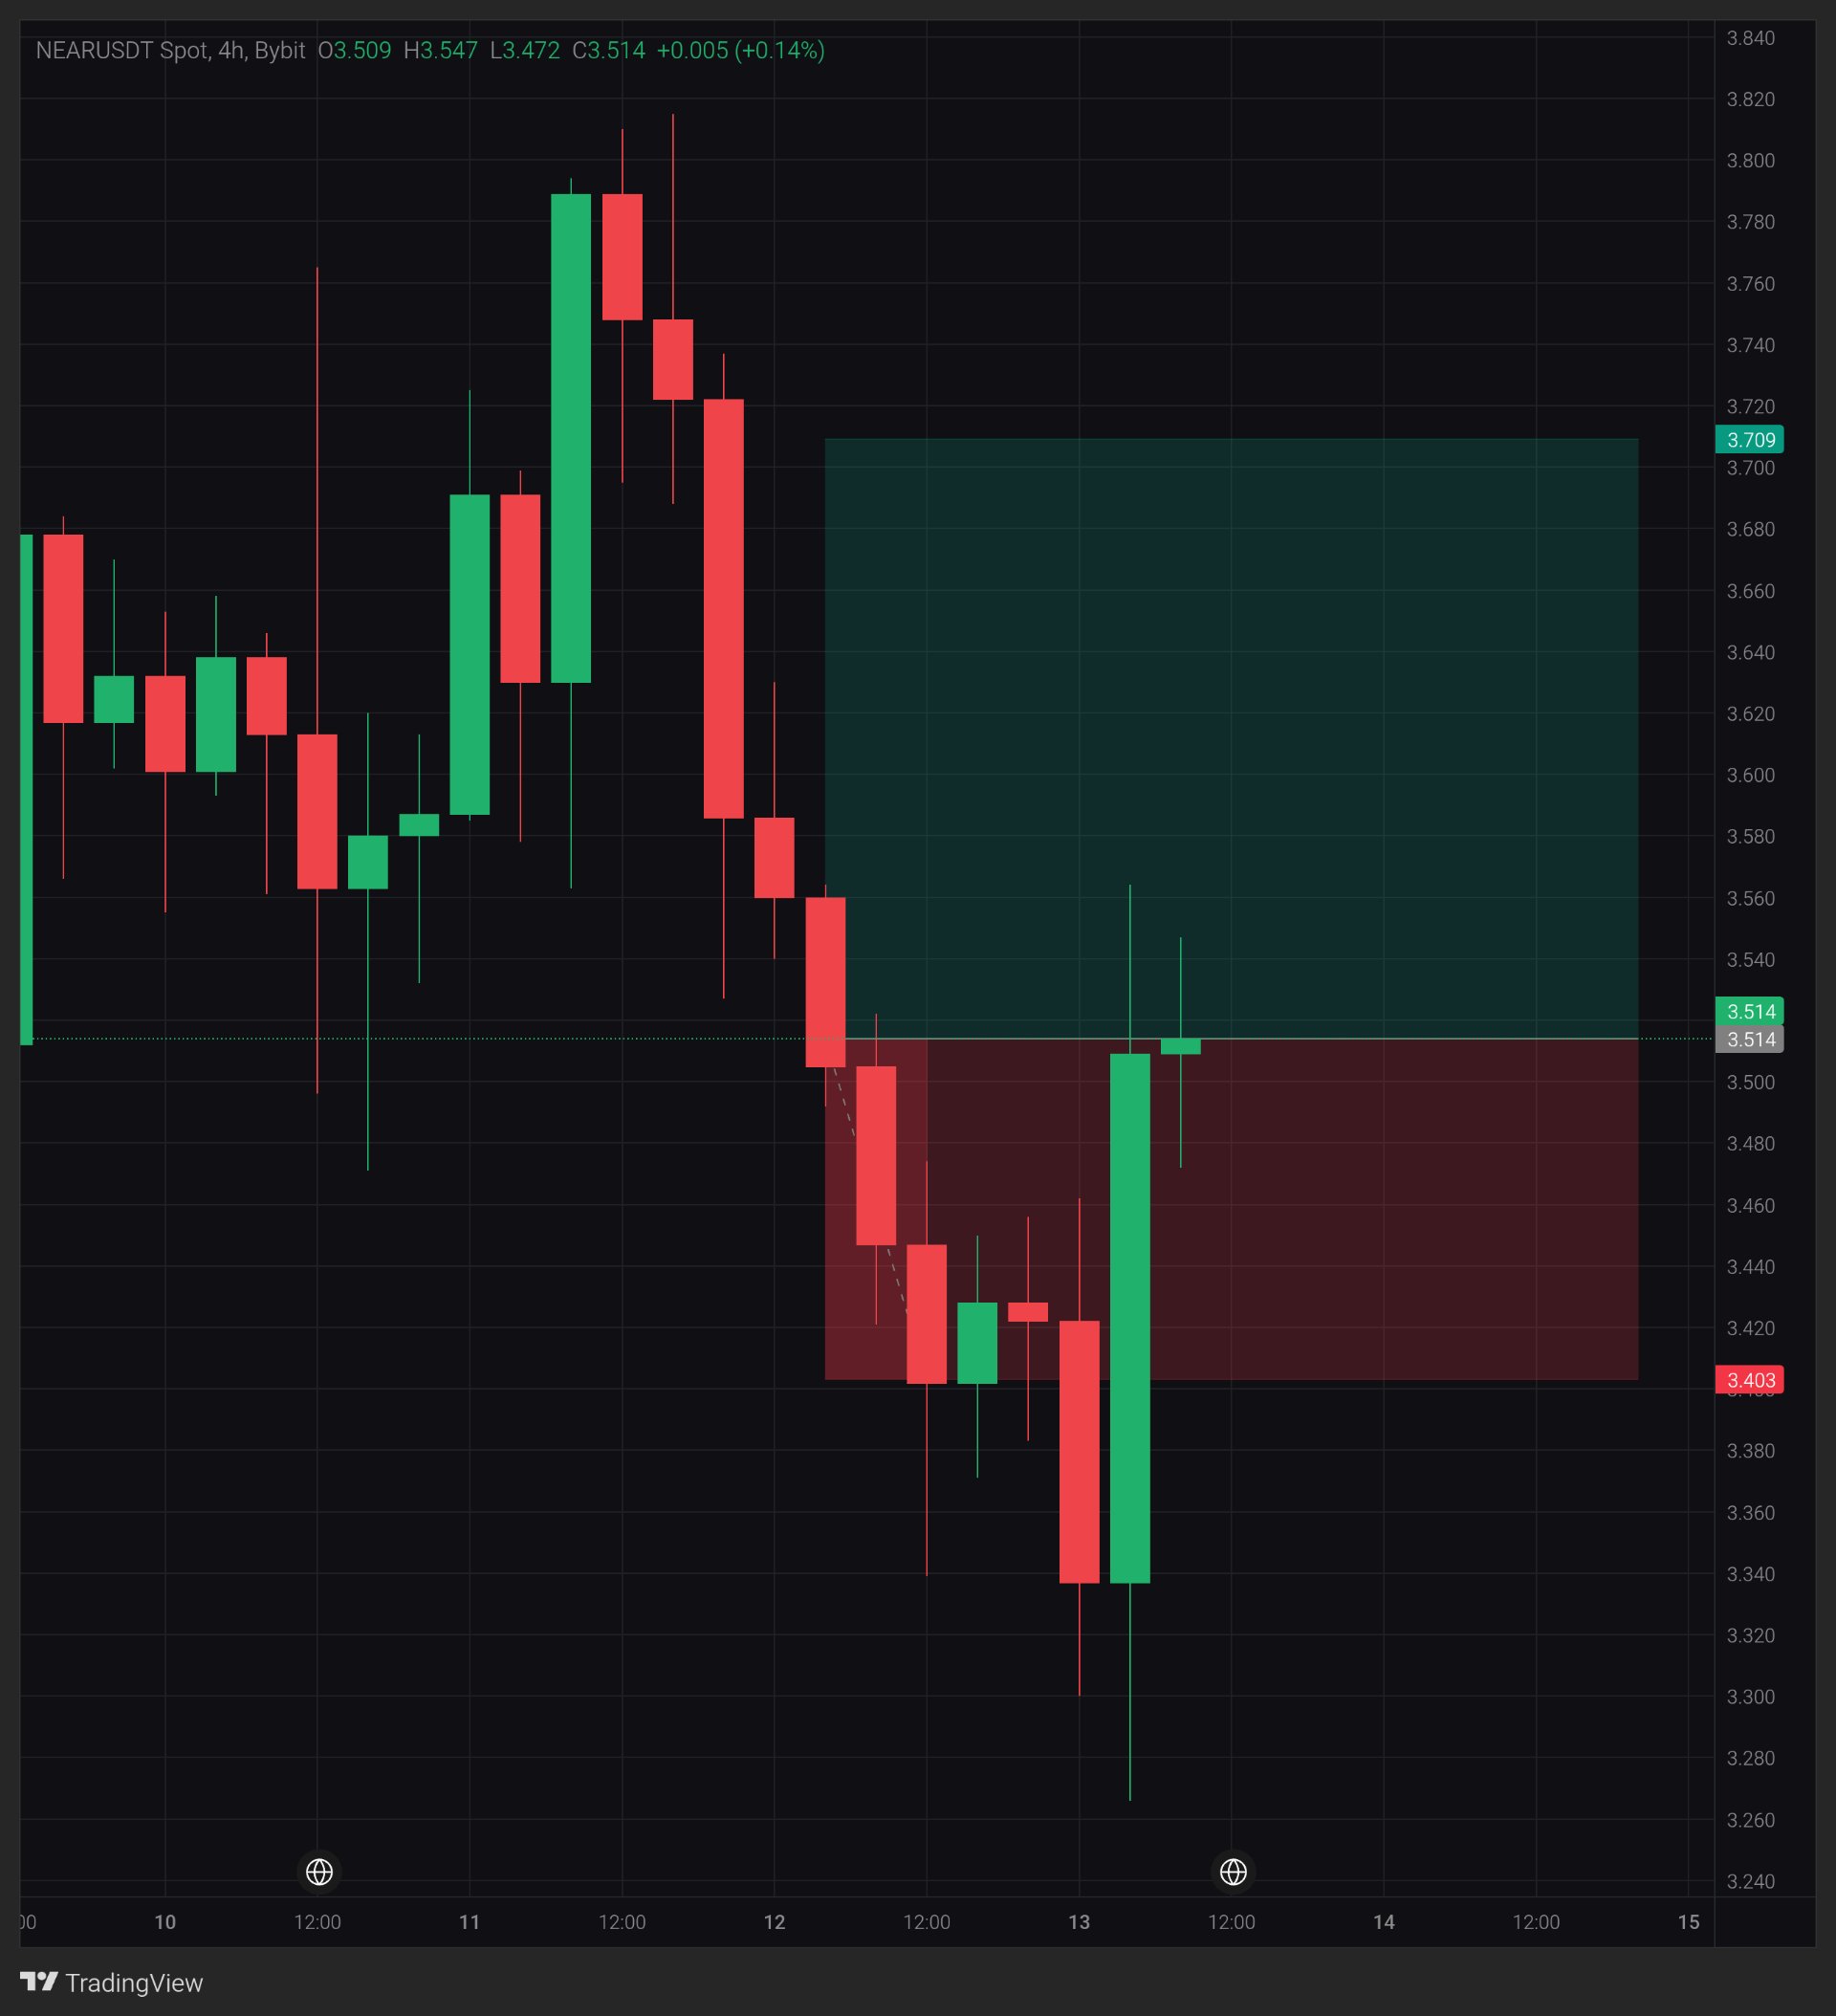
Our expectation was spot on The $NEARUSDT coin has broken through the resistance level, opening up a new path and higher price levels... #WSOT2026 #WSOTShowYourAITradeToEarn10USDT
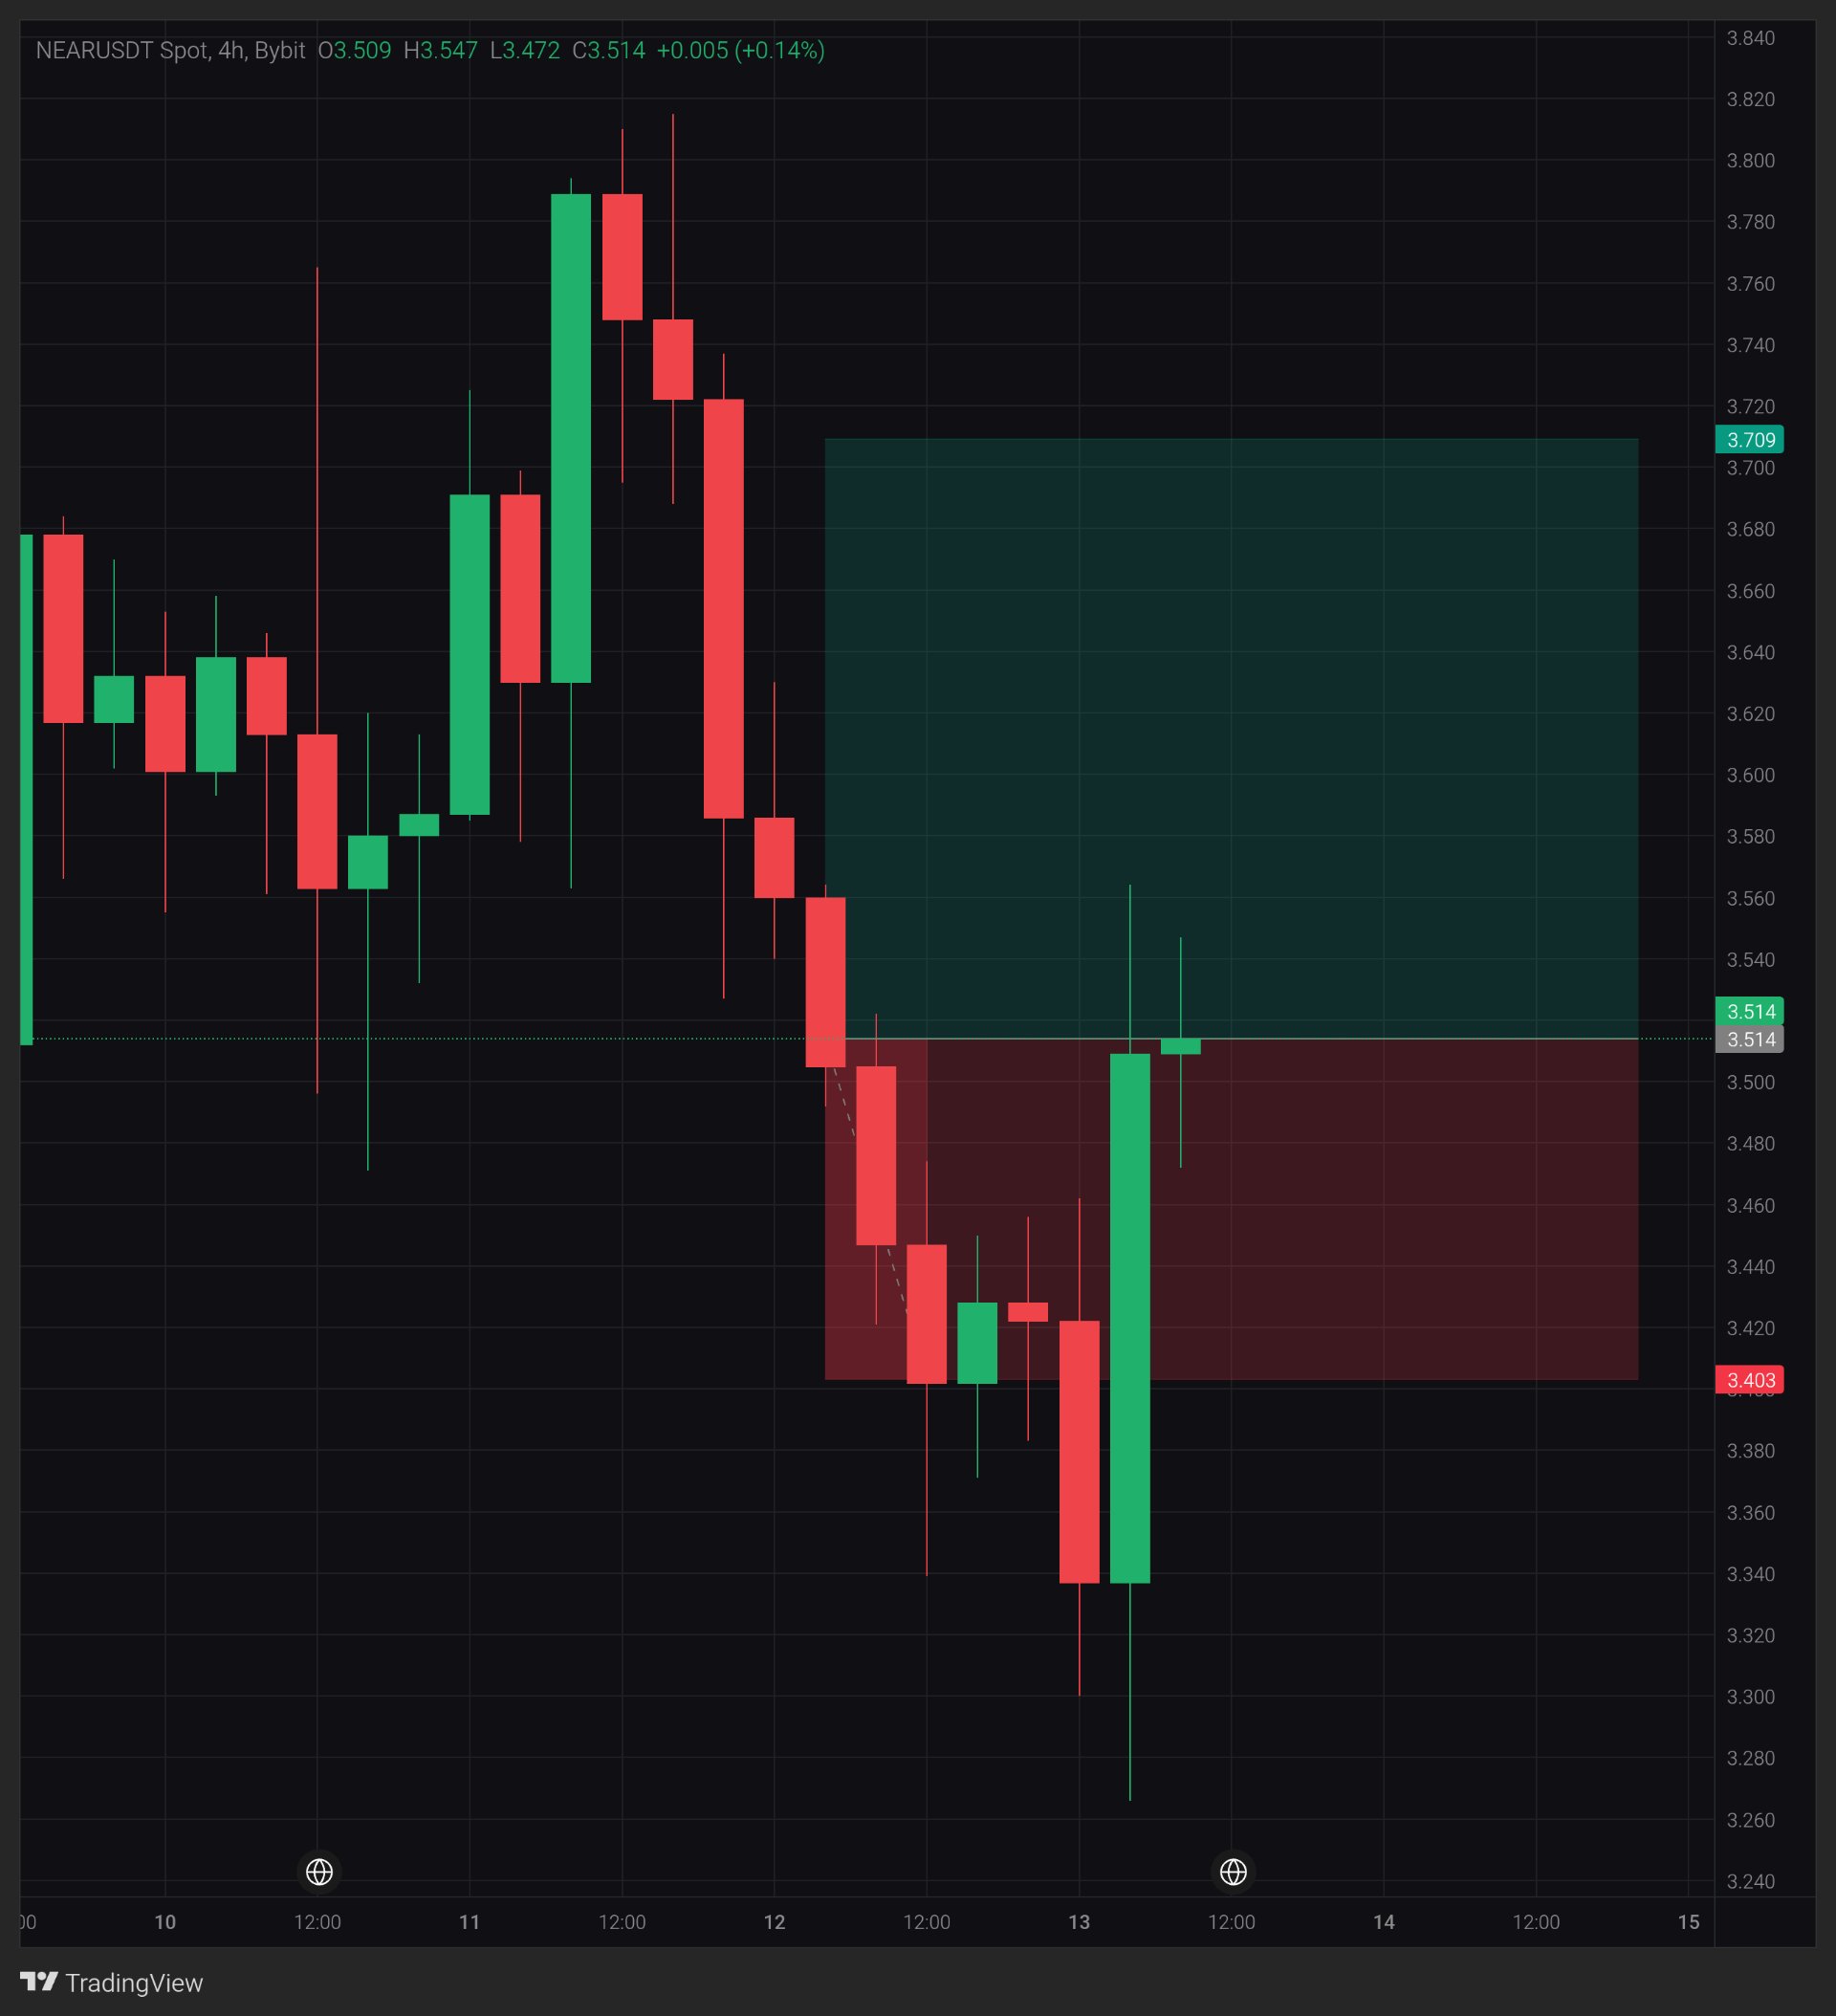
NEAR: Price is back at the 3.514 breakdown
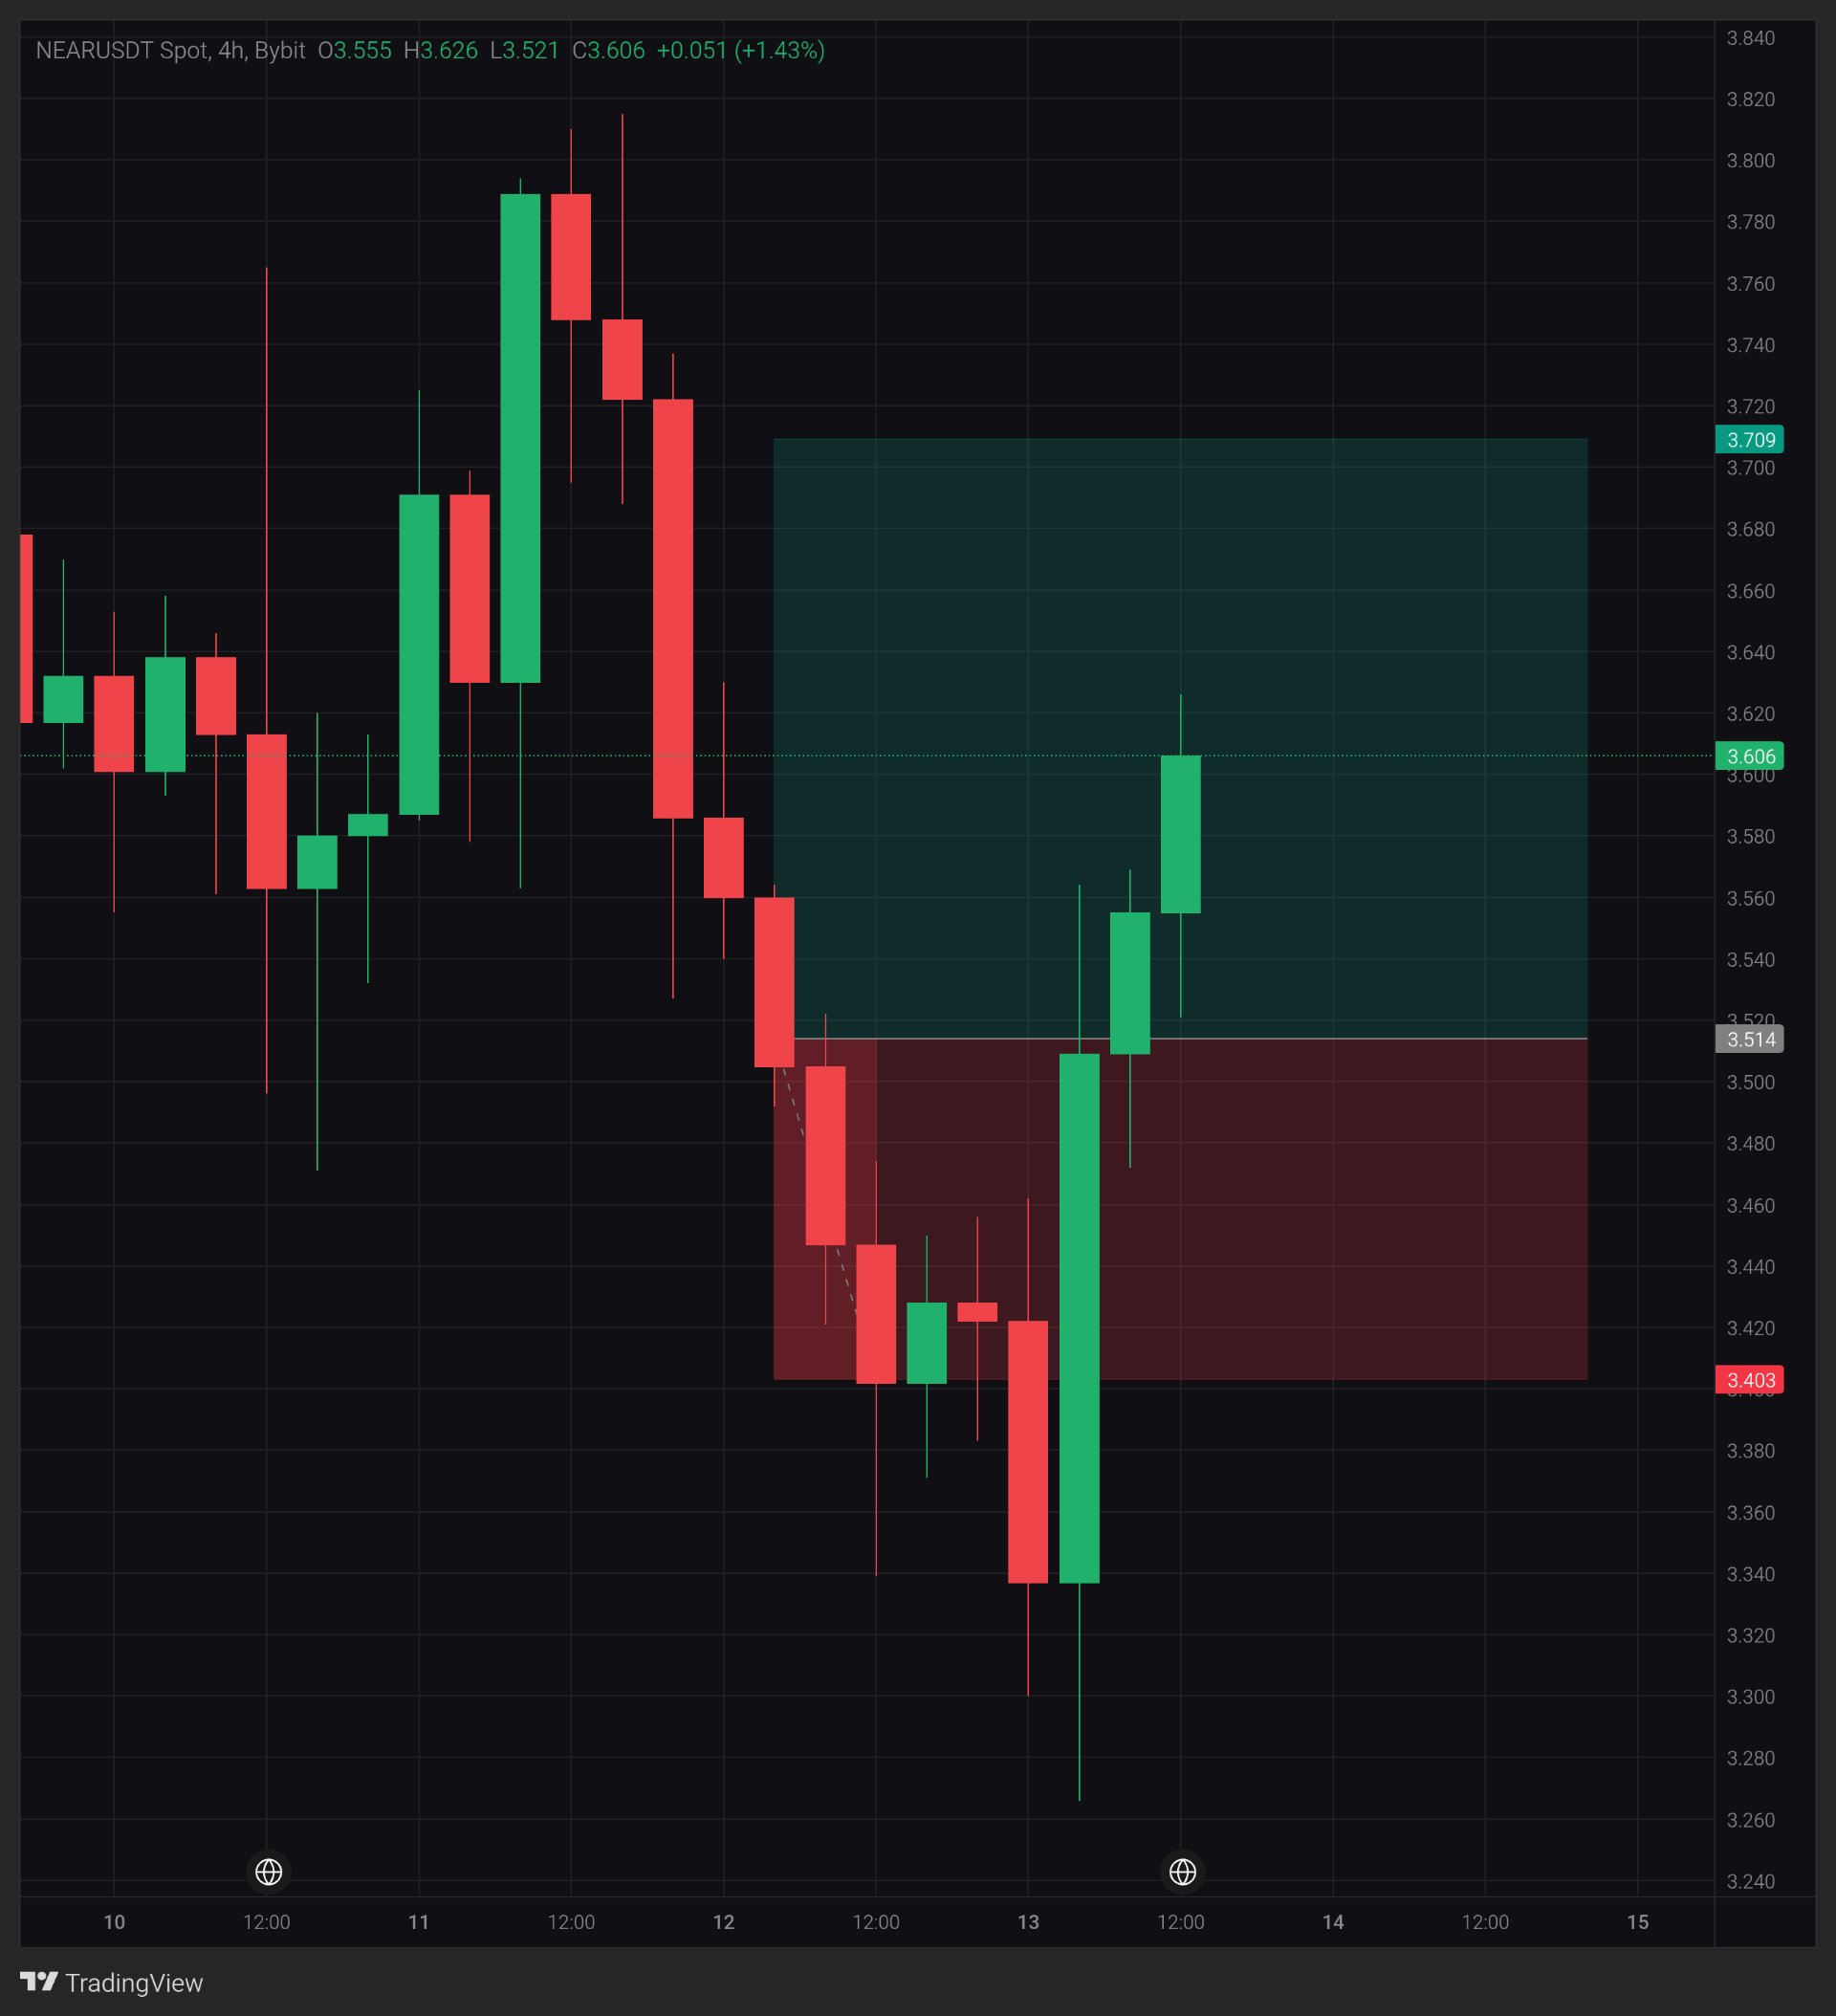
$NEARUSDT — 3.514 is the level price fell through on the way down. One green 4H candle just engulfed the last red one, at about twice its size. Price is back at that line, with a wick down to 3.265 behind it. Is this a real recovery, or just a visit to resistance? 4H chart, $NEARUSDT Spot on Bybit, price 3.514 (+0.14% on the current candle). Macro note Nov 11: after a hot US CPI print, markets leaned further toward a December Fed hike, and 2-year Treasury yields had their biggest jump since April 2025 (Bloomberg). Background only, not the reason for this move. What the chart shows NEAR fell from the 3.82 area to the 3.265 wick low, roughly 15%, then bounced about 9% to the 3.547 high. The big green candle left a long lower wick, so buyers reacted hard at the low. But the current candle is small: its body is 0.005 inside a 0.075 range, under 7% of the range, with wicks on both sides. That is indecision right at the old breakdown area. Volume is not shown on this chart, so this is price action only. Key levels Support: 3.472 (low of the current candle), then 3.403 (bottom of my box), then 3.340 and the 3.265 wick low. Resistance: 3.547 to 3.560 (wick highs), then about 3.585, then 3.709 (top of my box) and the 3.82 area. What would strengthen it Touching 3.560 again proves nothing. A 4H close above it would be the first real step. Holding 3.472 on a pullback would also help. Concern A 4H close below 3.472 would say the bounce is stalling at resistance, with 3.403 next. A bounce that only reaches the breakdown area is still a bounce, not a trend change. What changes my mind A 4H close below 3.403. The lesson A long lower wick shows buyers reacted. It does not show they can hold the next test. My view I'm watching how price behaves around 3.56 before treating this as more than a bounce into resistance. Closes matter more than wicks here. This is a scenario, not a prediction. A reading at posting time, not a guarantee. Which matters more to you here, a close above 3.560 or a hold above 3.472? Not financial advice. Always manage your risk. 📊 #ByXIMPACT
NEAR: Price is back at the 3.514 breakdown
$NEARUSDT — 3.514 is the level price fell through on the way down. One green 4H candle just engulfed the last red one, at about twice its size. Price is back at that line, with a wick down to 3.265 behind it. Is this a real recovery, or just a visit to resistance? 4H chart, $NEARUSDT Spot on Bybit, price 3.514 (+0.14% on the current candle). Macro note Nov 11: after a hot US CPI print, markets leaned further toward a December Fed hike, and 2-year Treasury yields had their biggest jump since April 2025 (Bloomberg). Background only, not the reason for this move. What the chart shows NEAR fell from the 3.82 area to the 3.265 wick low, roughly 15%, then bounced about 9% to the 3.547 high. The big green candle left a long lower wick, so buyers reacted hard at the low. But the current candle is small: its body is 0.005 inside a 0.075 range, under 7% of the range, with wicks on both sides. That is indecision right at the old breakdown area. Volume is not shown on this chart, so this is price action only. Key levels Support: 3.472 (low of the current candle), then 3.403 (bottom of my box), then 3.340 and the 3.265 wick low. Resistance: 3.547 to 3.560 (wick highs), then about 3.585, then 3.709 (top of my box) and the 3.82 area. What would strengthen it Touching 3.560 again proves nothing. A 4H close above it would be the first real step. Holding 3.472 on a pullback would also help. Concern A 4H close below 3.472 would say the bounce is stalling at resistance, with 3.403 next. A bounce that only reaches the breakdown area is still a bounce, not a trend change. What changes my mind A 4H close below 3.403. The lesson A long lower wick shows buyers reacted. It does not show they can hold the next test. My view I'm watching how price behaves around 3.56 before treating this as more than a bounce into resistance. Closes matter more than wicks here. This is a scenario, not a prediction. A reading at posting time, not a guarantee. Which matters more to you here, a close above 3.560 or a hold above 3.472? Not financial advice. Always manage your risk. 📊 #ByXIMPACT
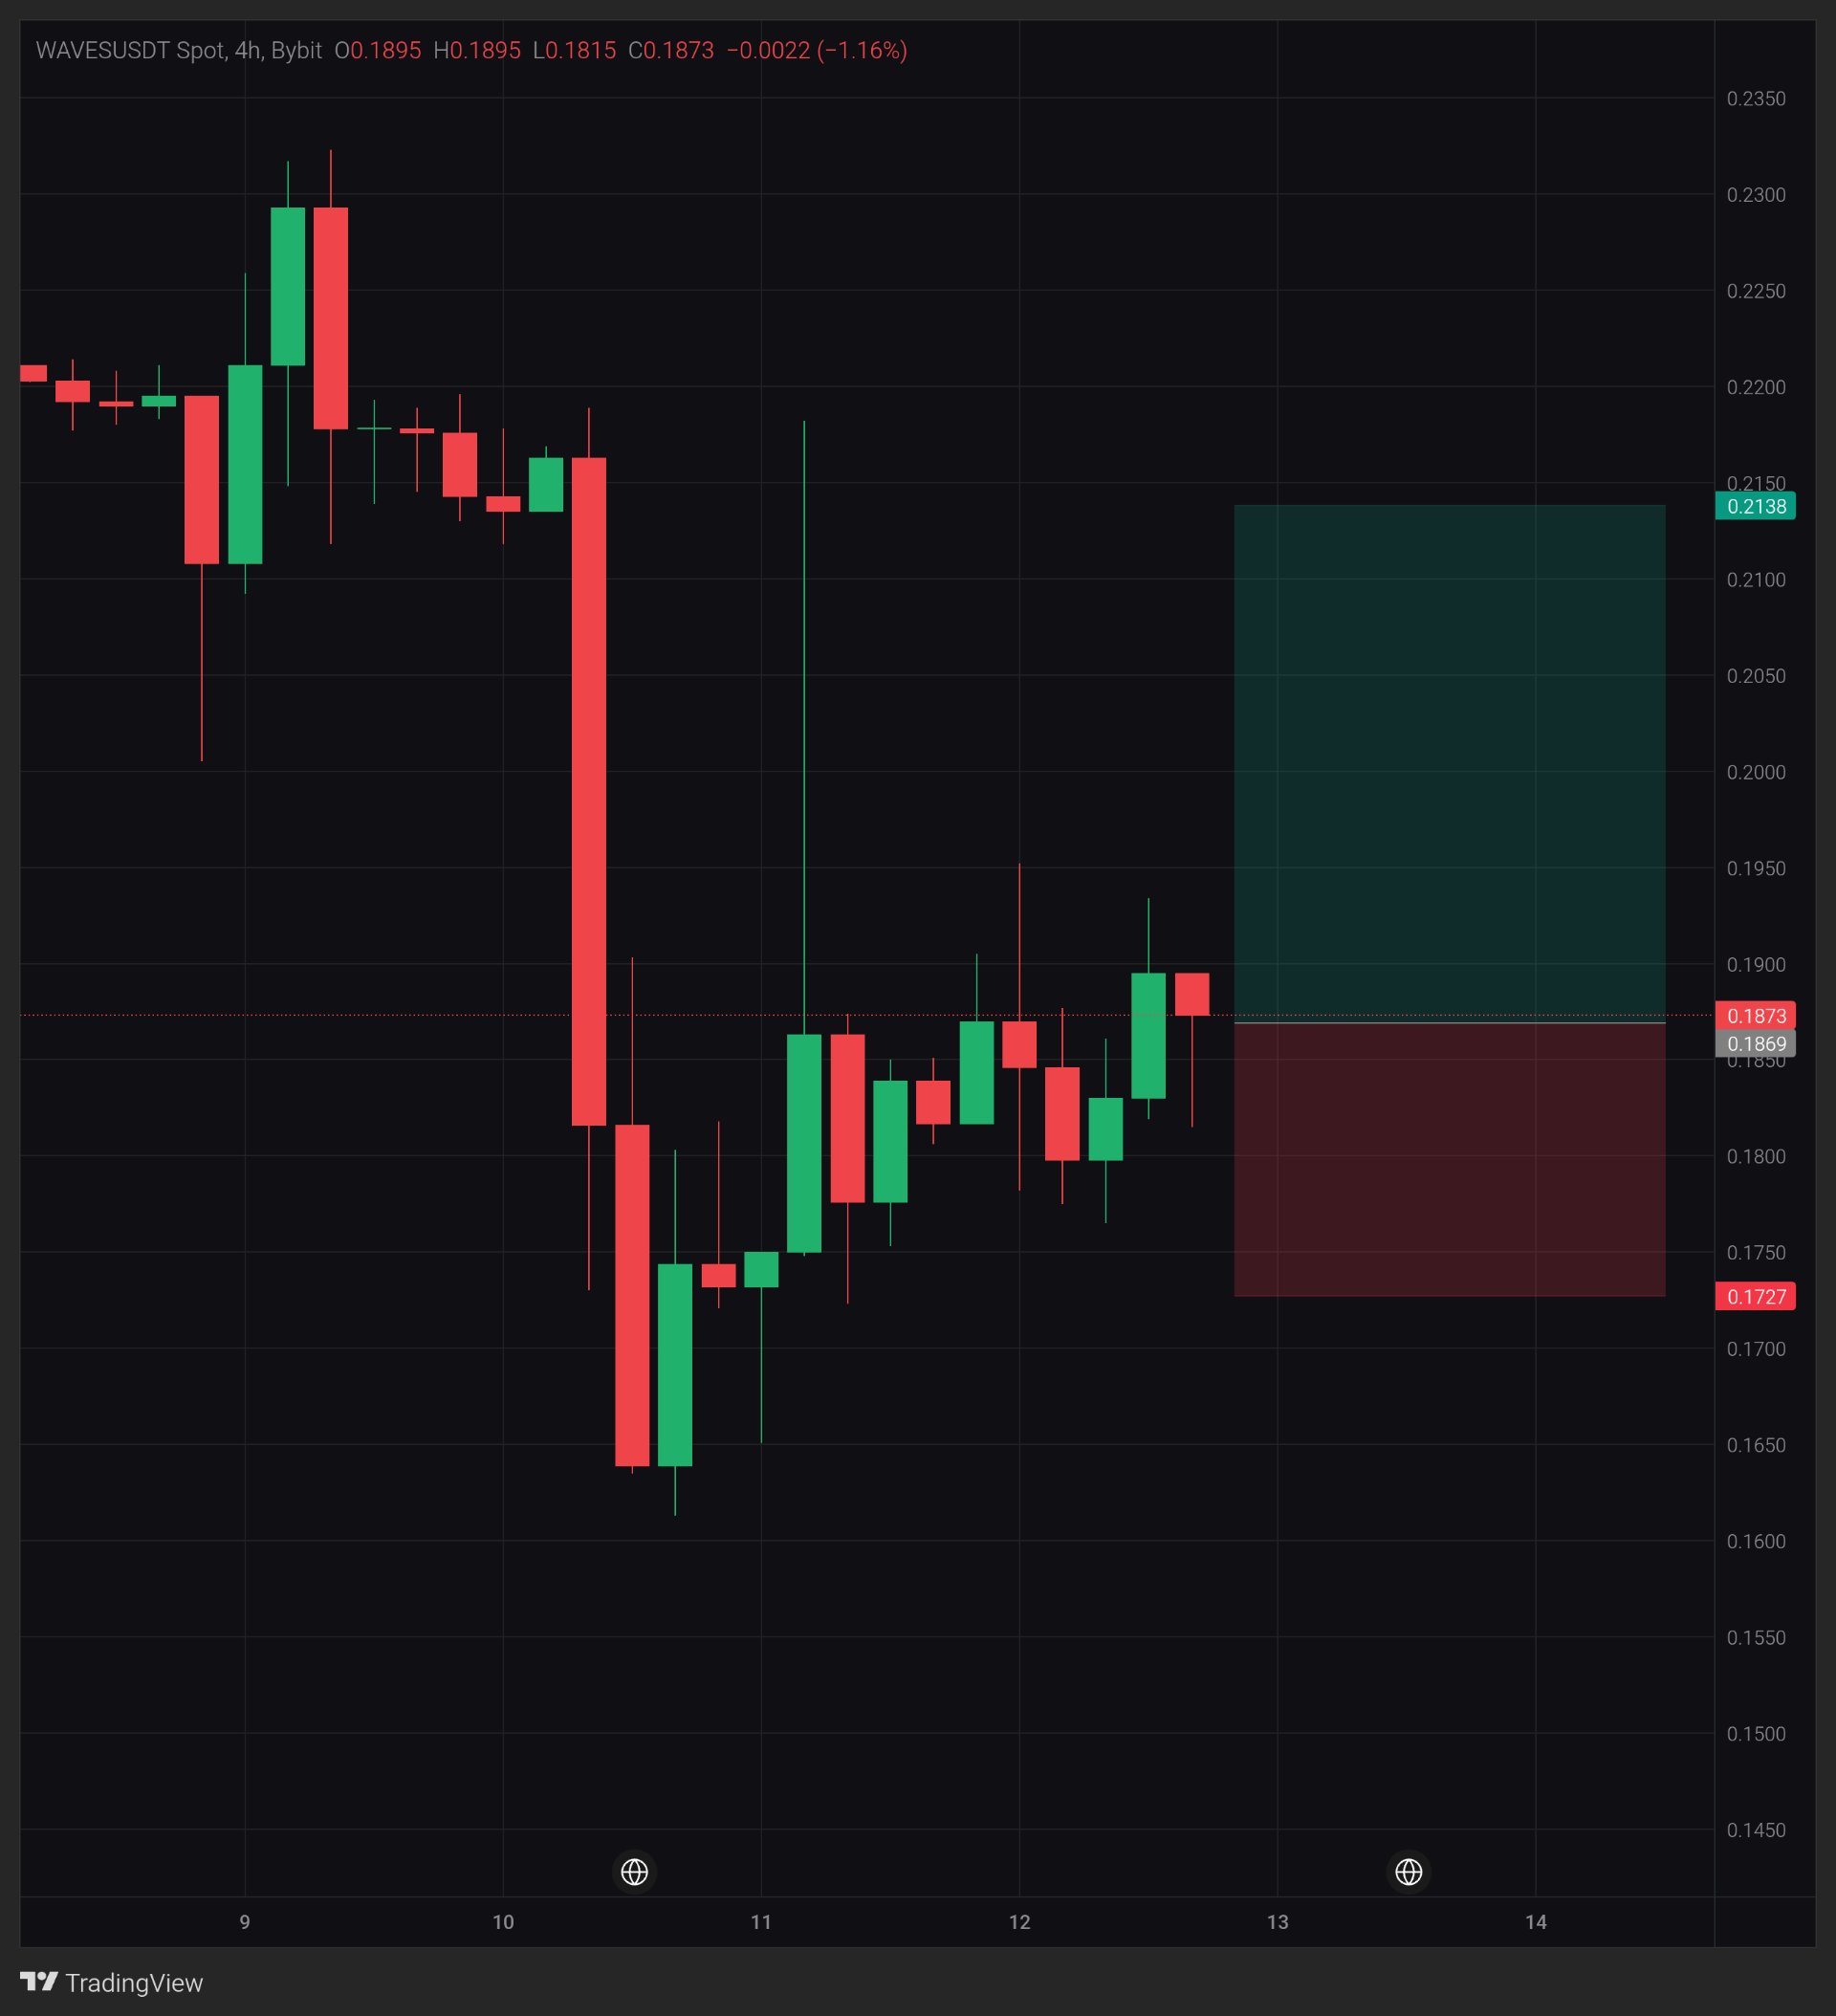
WAVES: 4時間足は0.1895を超えて引けるかな?
$WAVESUSDT — 0.1895で直近のローソク足の実体が2本連続で止められました。 ヒゲはこれより上まで伸びましたが、終値は追随していません。 安値から20%反発しましたが、現在は一本のラインの下で膠着状態です。 これが底固めなのか、それともさらなる下落前の一時停止なのか? 4時間足チャート、$WAVESUSDT Bybit現物、価格0.1873(現在足で-1.16%)。 マクロのメモ 11月10日:米10月CPIは前月比0.4%上昇で予想を上回り、CME FedWatchでは12月のFRB利上げ幅が25bpとなる確率が約89%となりました(BLS; AFP経由のCME FedWatch)。背景情報であり、今回の値動きの直接的な理由ではありません。 チャートが示すこと 大きな4時間足の陰線1本で約16%下落し、0.1615付近まで突っ込みました。その後、価格は約20%反発して0.1935に達しましたが、再び押し戻されています。私が注目しているのは、そのローソク足の終値より約16%も高い0.2180付近まで伸びた長いヒゲで、完全に拒絶されています。これは、そこまで上がったところに売り手が待ち構えていたことを示しています。この視点ではインジケーターや出来高は見ておらず、プライスアクションのみの判断です。 重要なレベル サポート:0.1815(現在の足の安値)、次に約0.1775、続いて0.1727(ボックス圏の下限)。 レジスタンス:0.1895、次に0.1935から0.1950(ヒゲの高値圏)、続いて0.2138(ボックス圏の上限)。 強気材料となるには 0.1895への再タッチだけでは何も証明されません。4時間足の終値がここを上抜けることが最初の真の一歩であり、0.1950超えの終値で直近のヒゲの高値をクリアすることになります。 懸念点 4時間足の終値が0.1815を下回れば、反発力が失われつつあることを意味し、次は0.1775と0.1727がターゲットになります。0.2180のヒゲは、価格が上昇した際の売り手の反応をすでに示しています。 考えを変える条件 4時間足の終値が0.1727を下回った場合。 教訓 ヒゲは価格がどこまで行ったかを示し、終値はどこで受け入れられたかを示します。0.2180までのヒゲは受け入れられませんでした。 私の見解 レジスタンスの下での反発以上の動きとみなす前に、0.1895超えの終値を待っています。これはシナリオであり、予測ではありません。投稿時点での分析であり、保証ではありません。 ここでは、0.1935を超えるヒゲと、0.1895を超える終値、どちらをより信頼しますか? 投資助言ではありません。常にリスク管理を。 #ByXIMPACT #WSOT2026

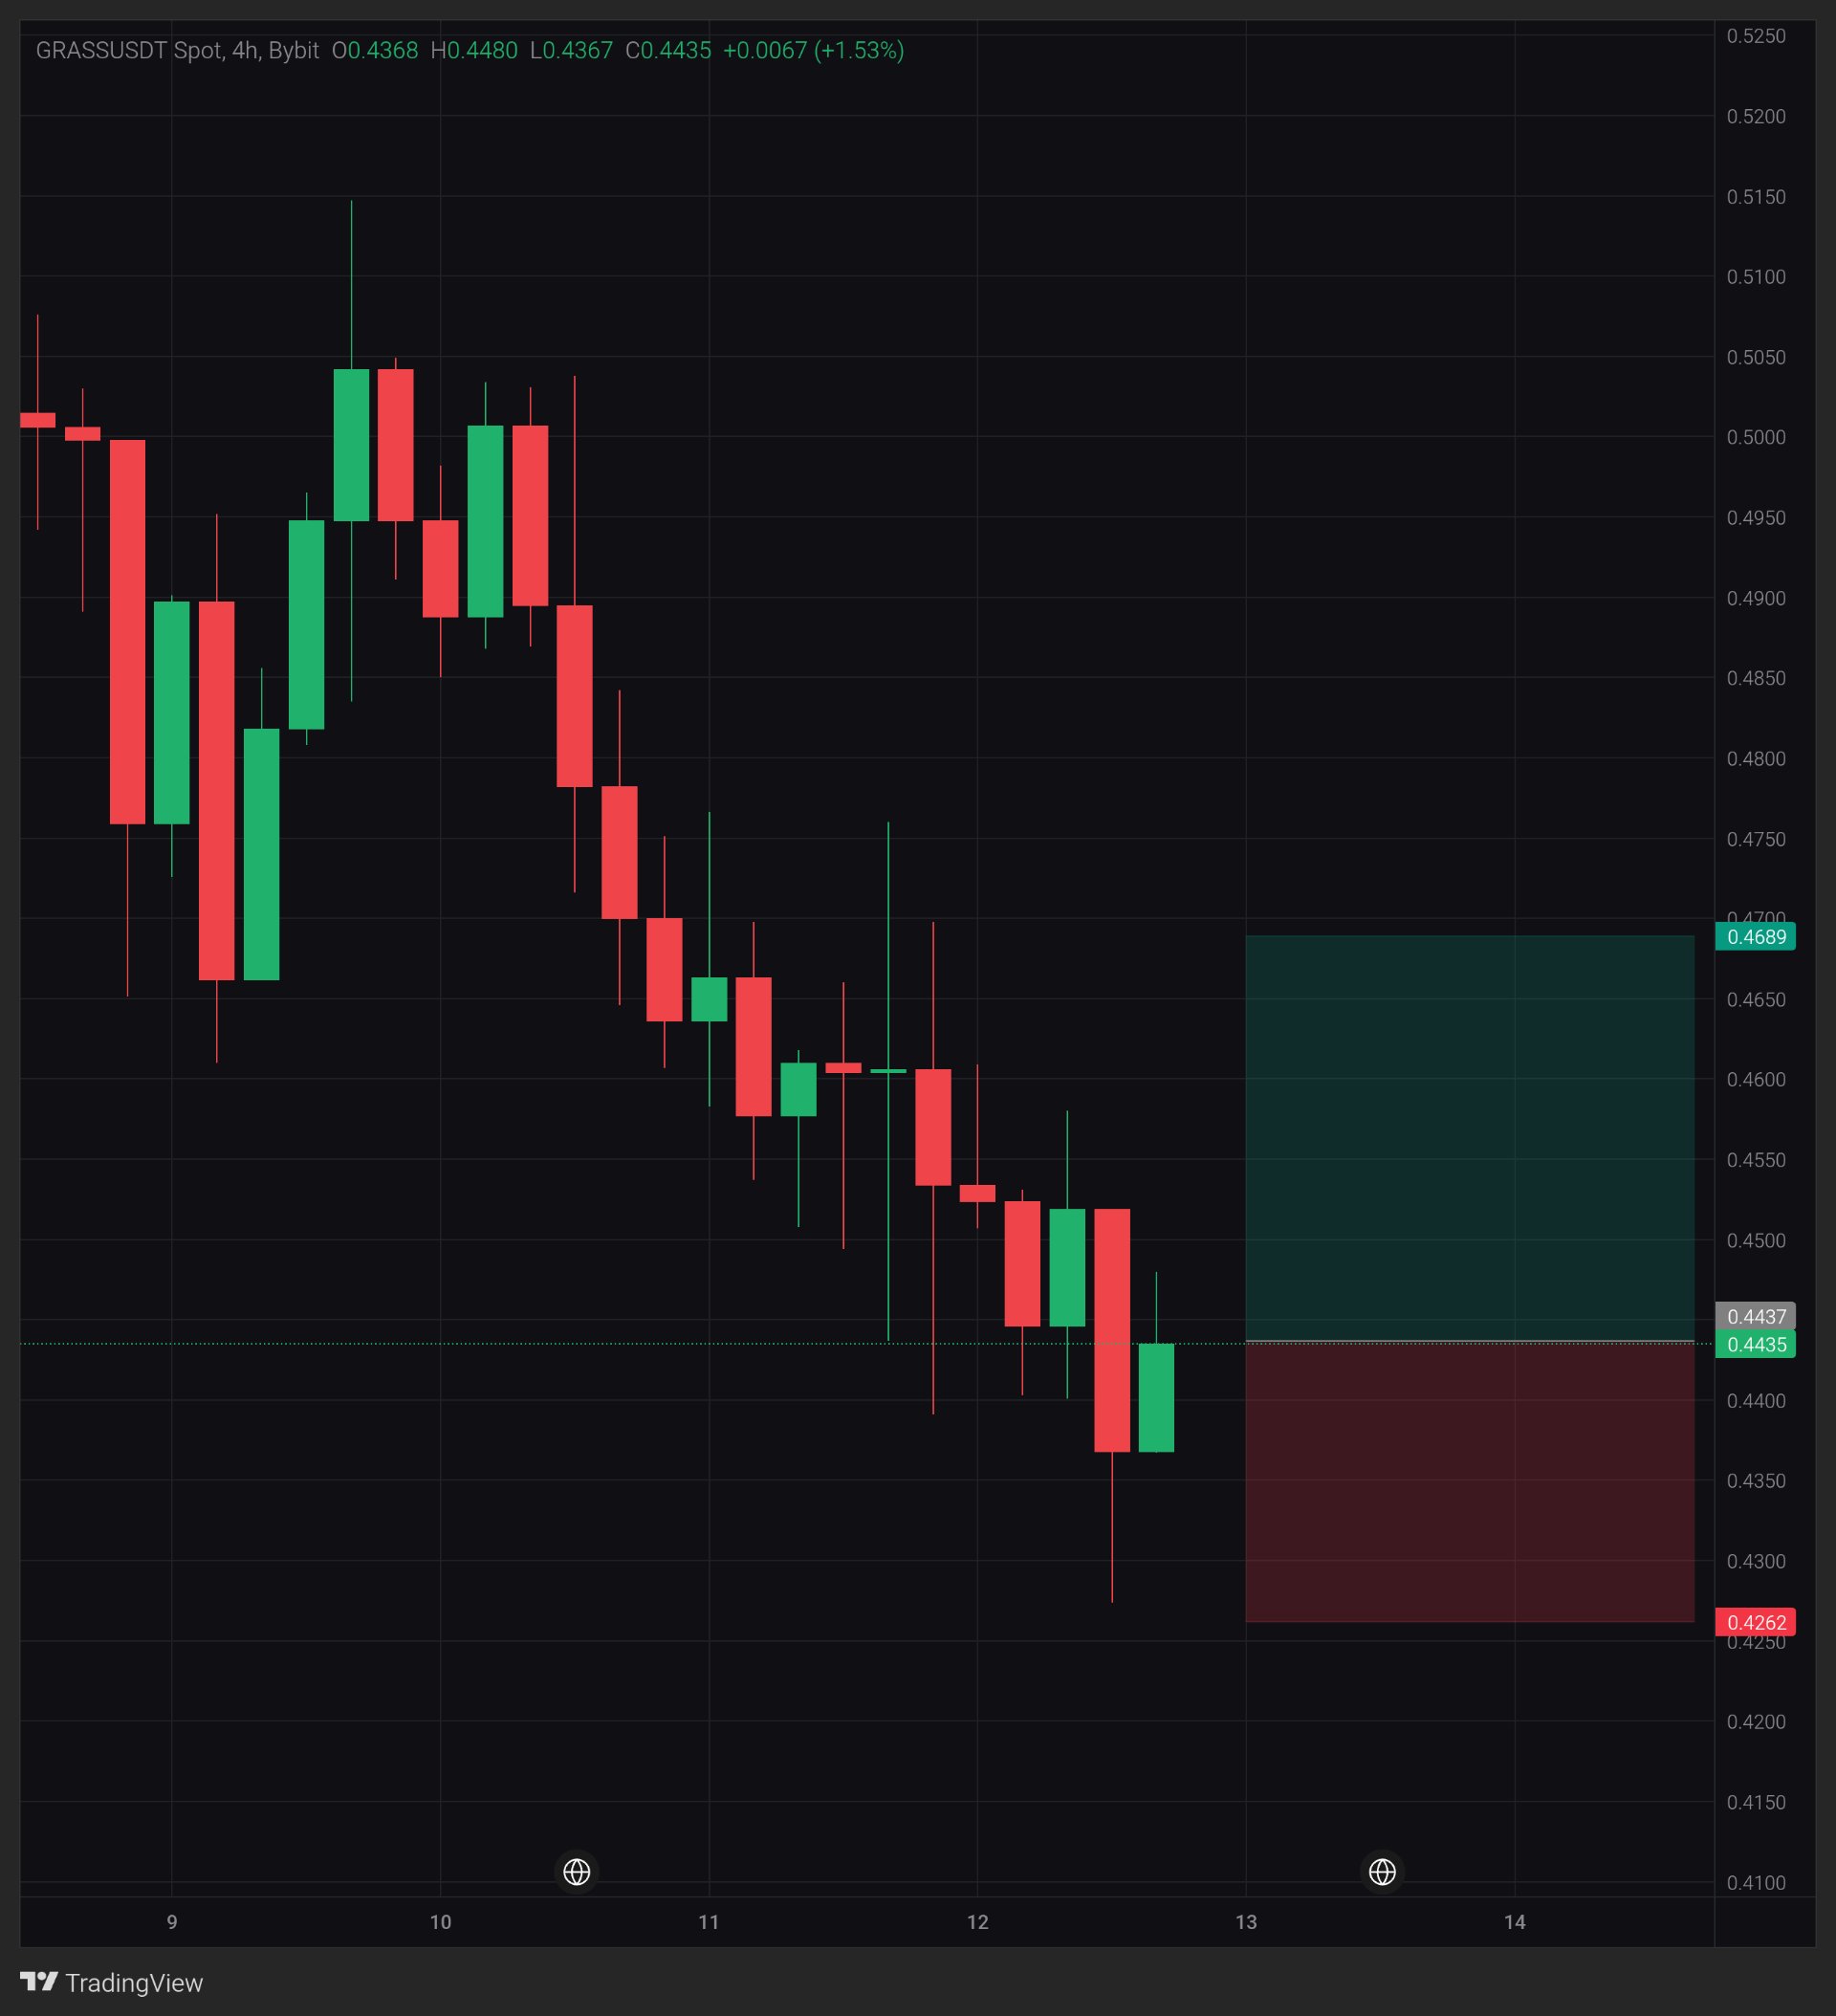
GRASS: Can buyers reverse the 4H downtrend?
$GRASSUSDT — GRASS is showing a small recovery around 0.4435 after another period of selling pressure. What's interesting is that price has fallen from the 0.5000 region, but the latest candle is attempting to recover after testing the 0.4367 area. The short-term structure remains bearish, and one green candle is not enough to confirm a reversal. Is this the first sign of a recovery, or just a temporary bounce? Timeframe: 4H | Pair: $GRASSUSDT Spot, Bybit | Price: 0.4435 | Latest candle: O 0.4368 / H 0.4480 / L 0.4367 / C 0.4435 (+1.53%). Candle close status not confirmed. Macro note November 12, 2026 — Reuters reported that Cleveland Fed President Beth Hammack supports gradual, smaller interest-rate increases to bring inflation back toward the Fed's 2% target. This is broader market background, not the reason for GRASS's price movement. What the chart shows GRASS has been moving through a clear short-term decline, falling from around 0.5050 toward the 0.4300 region. The latest candle has recovered 0.0067 from its open, but its high at 0.4480 shows that price is still facing nearby resistance. The important detail is whether buyers can turn this bounce into a sequence of higher lows. Key levels Support: 0.4367, then approximately 0.4270. Resistance: 0.4480, then 0.4550–0.4600. What would strengthen it A clean break above 0.4480 followed by a confirmed 4H close above that level would be the first positive signal. A successful retest and a higher low would provide additional confirmation. Concern The broader 4H structure still shows lower highs and lower lows. If 0.4367 fails and price closes below it, the current recovery attempt becomes much weaker. What changes my mind A 4H close below 0.4367 would make me more cautious about GRASS's short-term direction. The lesson In a downtrend, a green candle can be only a temporary bounce. A confirmed higher low and a break of the previous lower high provide stronger evidence of a reversal. My view I'm watching the 0.4367–0.4480 range closely. GRASS is showing its first signs of short-term recovery, but the bigger structure still needs confirmation. This is a scenario, not a prediction. A reading at posting time, not a guarantee. Can GRASS reclaim 0.4480 and challenge the current downtrend? Not financial advice. Always manage your risk. 📊 #WSOT2026 #AnthropicIPOTestsTheAIBoom #USInflationRunsHotAndRateHikeBetsRise #BitcoinHitsTwoMonthLowAfterUSMidterms
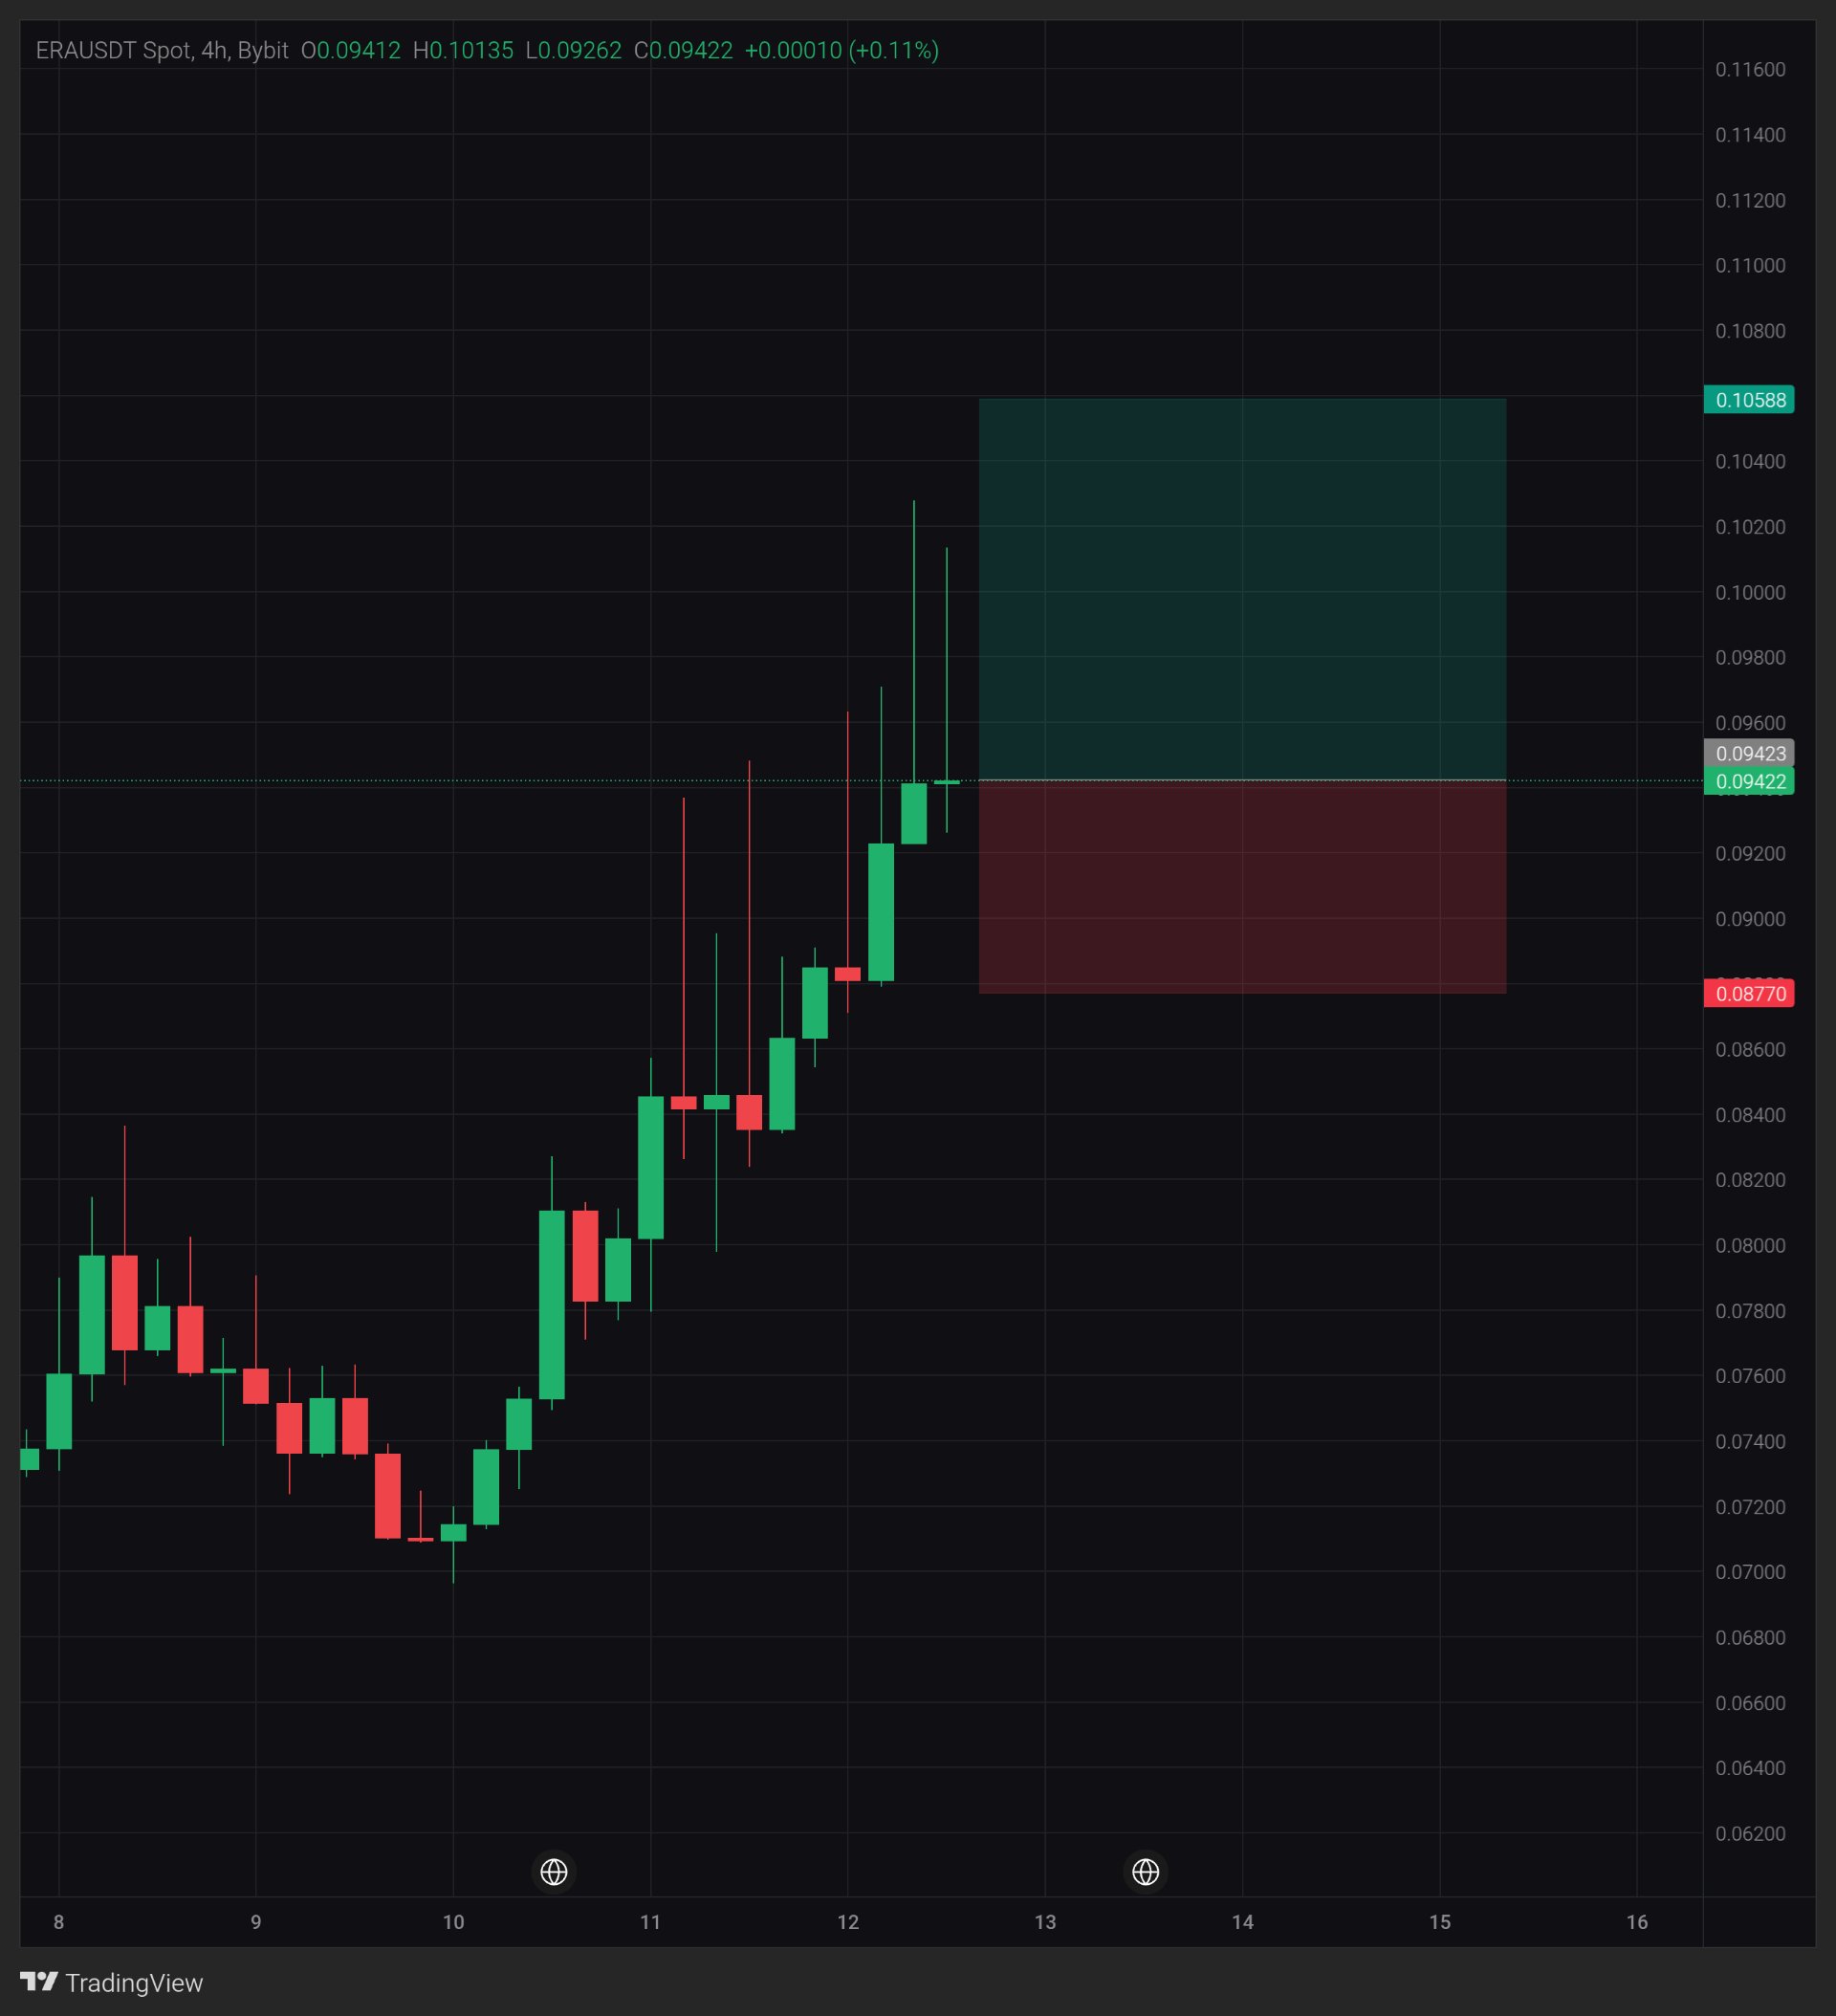
ERA: wicks near 0.10, will 4H close above?
$ERAUSDT — price is at 0.0942, with 0.10 rejected twice by long wicks. The coin is up about 35% since the Nov 10 low, yet the latest candle's upper wick is about 80% of its range. What is still unresolved is whether buyers can close above that wick zone or sellers keep selling into it. Is this a pause before another push, or buyers running out of room? Timeframe: 4H Pair: $ERAUSDT Spot, Bybit Price: 0.09422 Candle: O 0.09412 / H 0.10135 / L 0.09262 / C 0.09422 (+0.11%) Candle close not confirmed. Macro note Nov 12, 2026: the US 10-year Treasury yield is hovering near 5% as big banks raise their Fed rate hike calls after hot October inflation data (TipRanks). Background only, not the reason for the move. What the chart shows ERA climbed from about 0.0700 on Nov 10 to 0.0942, roughly 35%. One detail I noticed: since Nov 11, almost every 4H candle has an upper wick far above its body, reaching about 0.0948, 0.0963, 0.0971, and then 0.1028 and 0.1014. The bodies keep rising, but each push higher has been sold. These wicks show sellers were active at those prices. They do not prove a top, and I can't judge their size without volume. Key levels Support: 0.0900, then 0.0840. Resistance: 0.0970, then 0.1020. Levels are read by eye, so they are approximate. What would strengthen it Touching 0.10 again proves little, since the wicks already did that twice. A 4H close above 0.1020, then a retest that holds as support, would be a better sign. Shorter upper wicks on the next candles would also help. Concern A rise of about 35% in this short time, with long wicks at the top, can unwind fast. A 4H close back under 0.0900 would give up the base of the latest push. What changes my mind A 4H close above 0.1020. The lesson A wick shows where price was rejected, and a close shows who won the candle. My view I'm watching the 0.10 area. Until a 4H candle closes above it, I treat the wicks as a warning, not as a trend change. This is a scenario, not a prediction. A reading at posting time, not a guarantee. Do you give more weight to the candle bodies or the wicks here? Not financial advice. Always manage your risk. 📊 #BitcoinHitsTwoMonthLowAfterUSMidterms

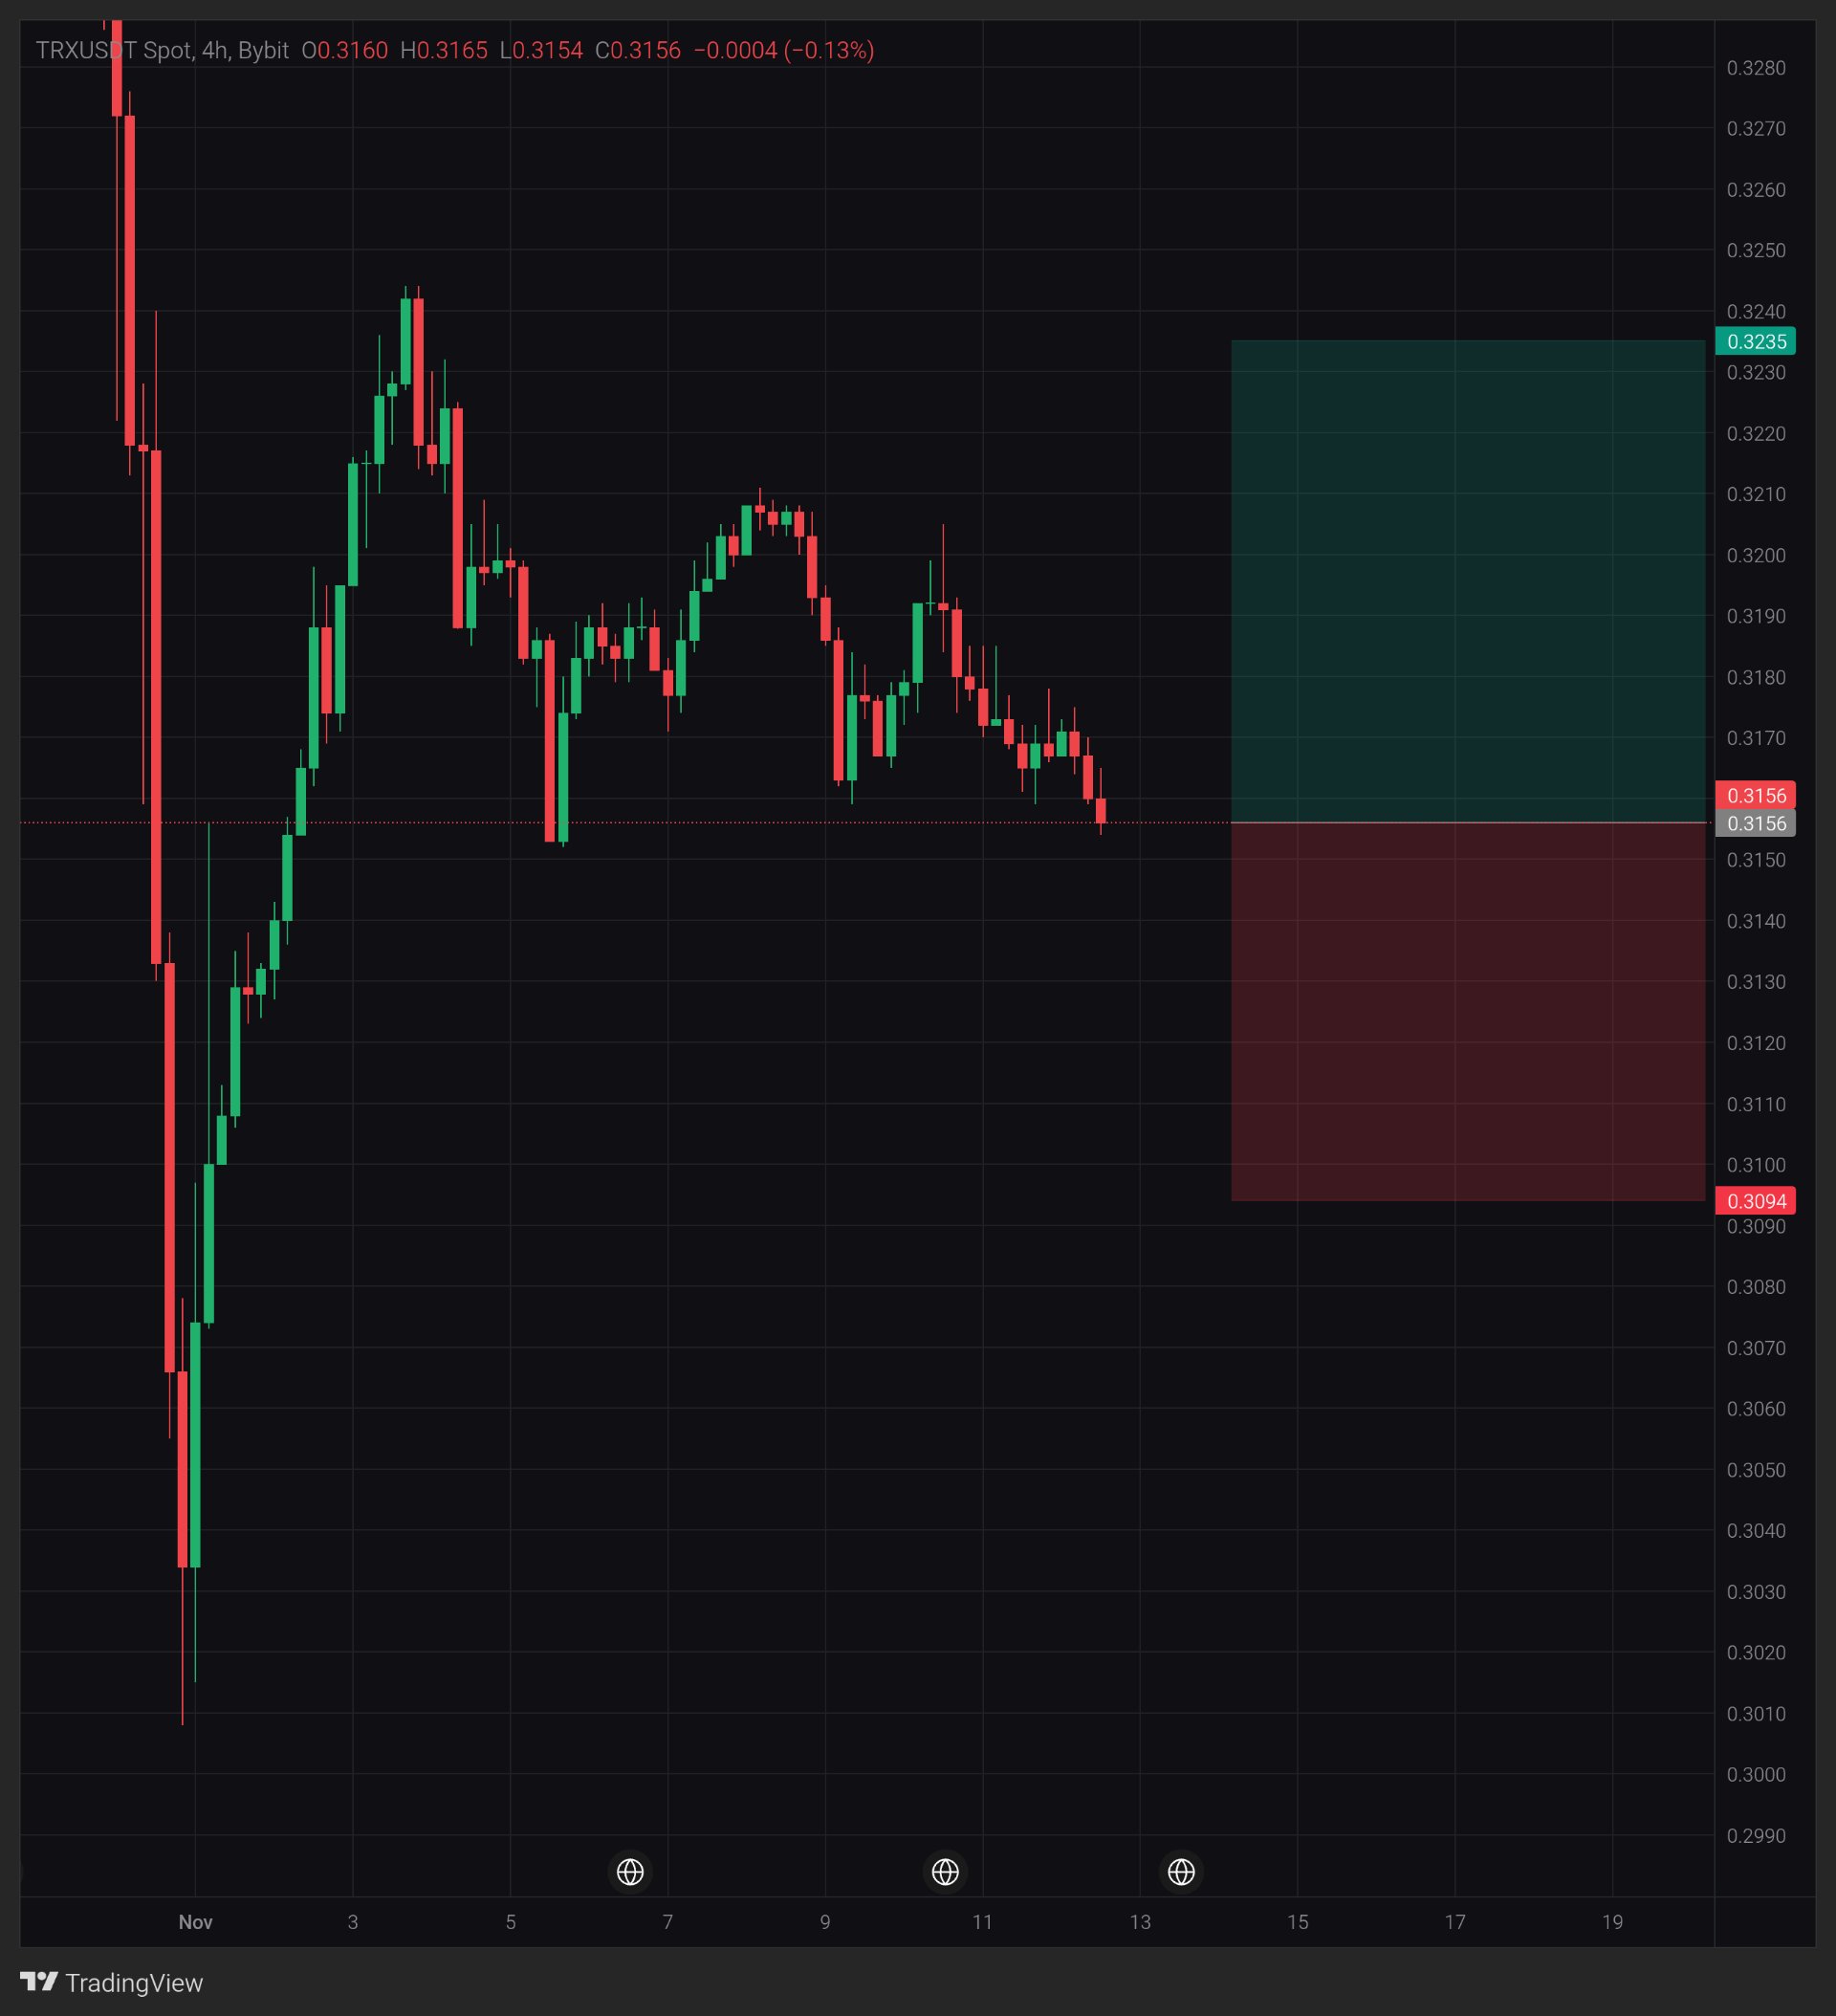
TRX: 0.3155を再びテストしたけど、4時間足は耐えられるかな?
$TRXUSDT — 価格は0.3156付近。11月5日以来維持されているサポートライン(フロア)にぴったり張り付いています。 高値は切り下がっていますが(0.3243、0.3210、そして約0.3205)、安値はほとんど動いていません。 未解決なのは、買い手がこのフロアを守り続けるのか、それとも4時間足の終値がここを割り込むのか、という点です。 レンジがこれほど狭まると、どちらに先に動くのか? タイムフレーム: 4H ペア: $TRXUSDT スポット, Bybit 価格: 0.3156 ローソク足: O 0.3160 / H 0.3165 / L 0.3154 / C 0.3156 (-0.13%) 足確定前。 マクロ情勢 2026年11月10日: 10月の米CPIは予想を上回る0.4%の上昇。発表後、米国債利回りが急騰しました(CNBC)。背景情報であり、値動きの直接的な要因ではありません。 チャートが示すこと TRXは11月初旬の0.3010付近での急激なフラッシュクラッシュから反発し、0.3243付近で天井を付けた後、小さなローソク足で緩やかに下落しています。 一点気づいたこと:約1週間、価格は0.3155〜0.3210の範囲(わずか1.7%程度のレンジ)に留まっています。 フラットなフロアに対して高値が切り下がっているのは「スクイーズ(収束)」です。レンジが狭まっていることは分かりますが、どちらにブレイクするかまでは示していません。 重要な水準 サポート: 0.3150、次に0.3100。 レジスタンス: 0.3175、次に0.3210。 水準は目視での確認のため、概算です。 強気材料 0.3175へのタッチは証明にはならず、上抜けも第一歩に過ぎません。 0.3175、そして0.3210を上抜けて4時間足が確定すれば、より良い兆候となります。 リテストでサポートとして機能するか、0.3154よりも高い位置で安値を切り上げれば、説得力が増します。 懸念点 高値の切り下げが続いており、直近のローソク足はフロアに接近しています。 0.3150を下回って4時間足が確定すれば、フロア崩壊を意味します。 考えが変わる条件 0.3150を下回って4時間足が確定した場合。 教訓 フラットなフロアと切り下がる高値は、レンジの縮小を示していますが、どちらが勝つかは分かりません。 私の見解 0.3150を境界線として見ています。ここが維持されている限り、ブレイクダウンではなくスクイーズと判断します。これはシナリオであり、予測ではありません。投稿時点での分析であり、保証するものではありません。 さて、あなたはこの状況でどちらを信頼しますか:フラットなフロアでしょうか、それとも切り下がる高値でしょうか? 投資助言ではありません。常にリスク管理を。 #IMPACTbyTrade
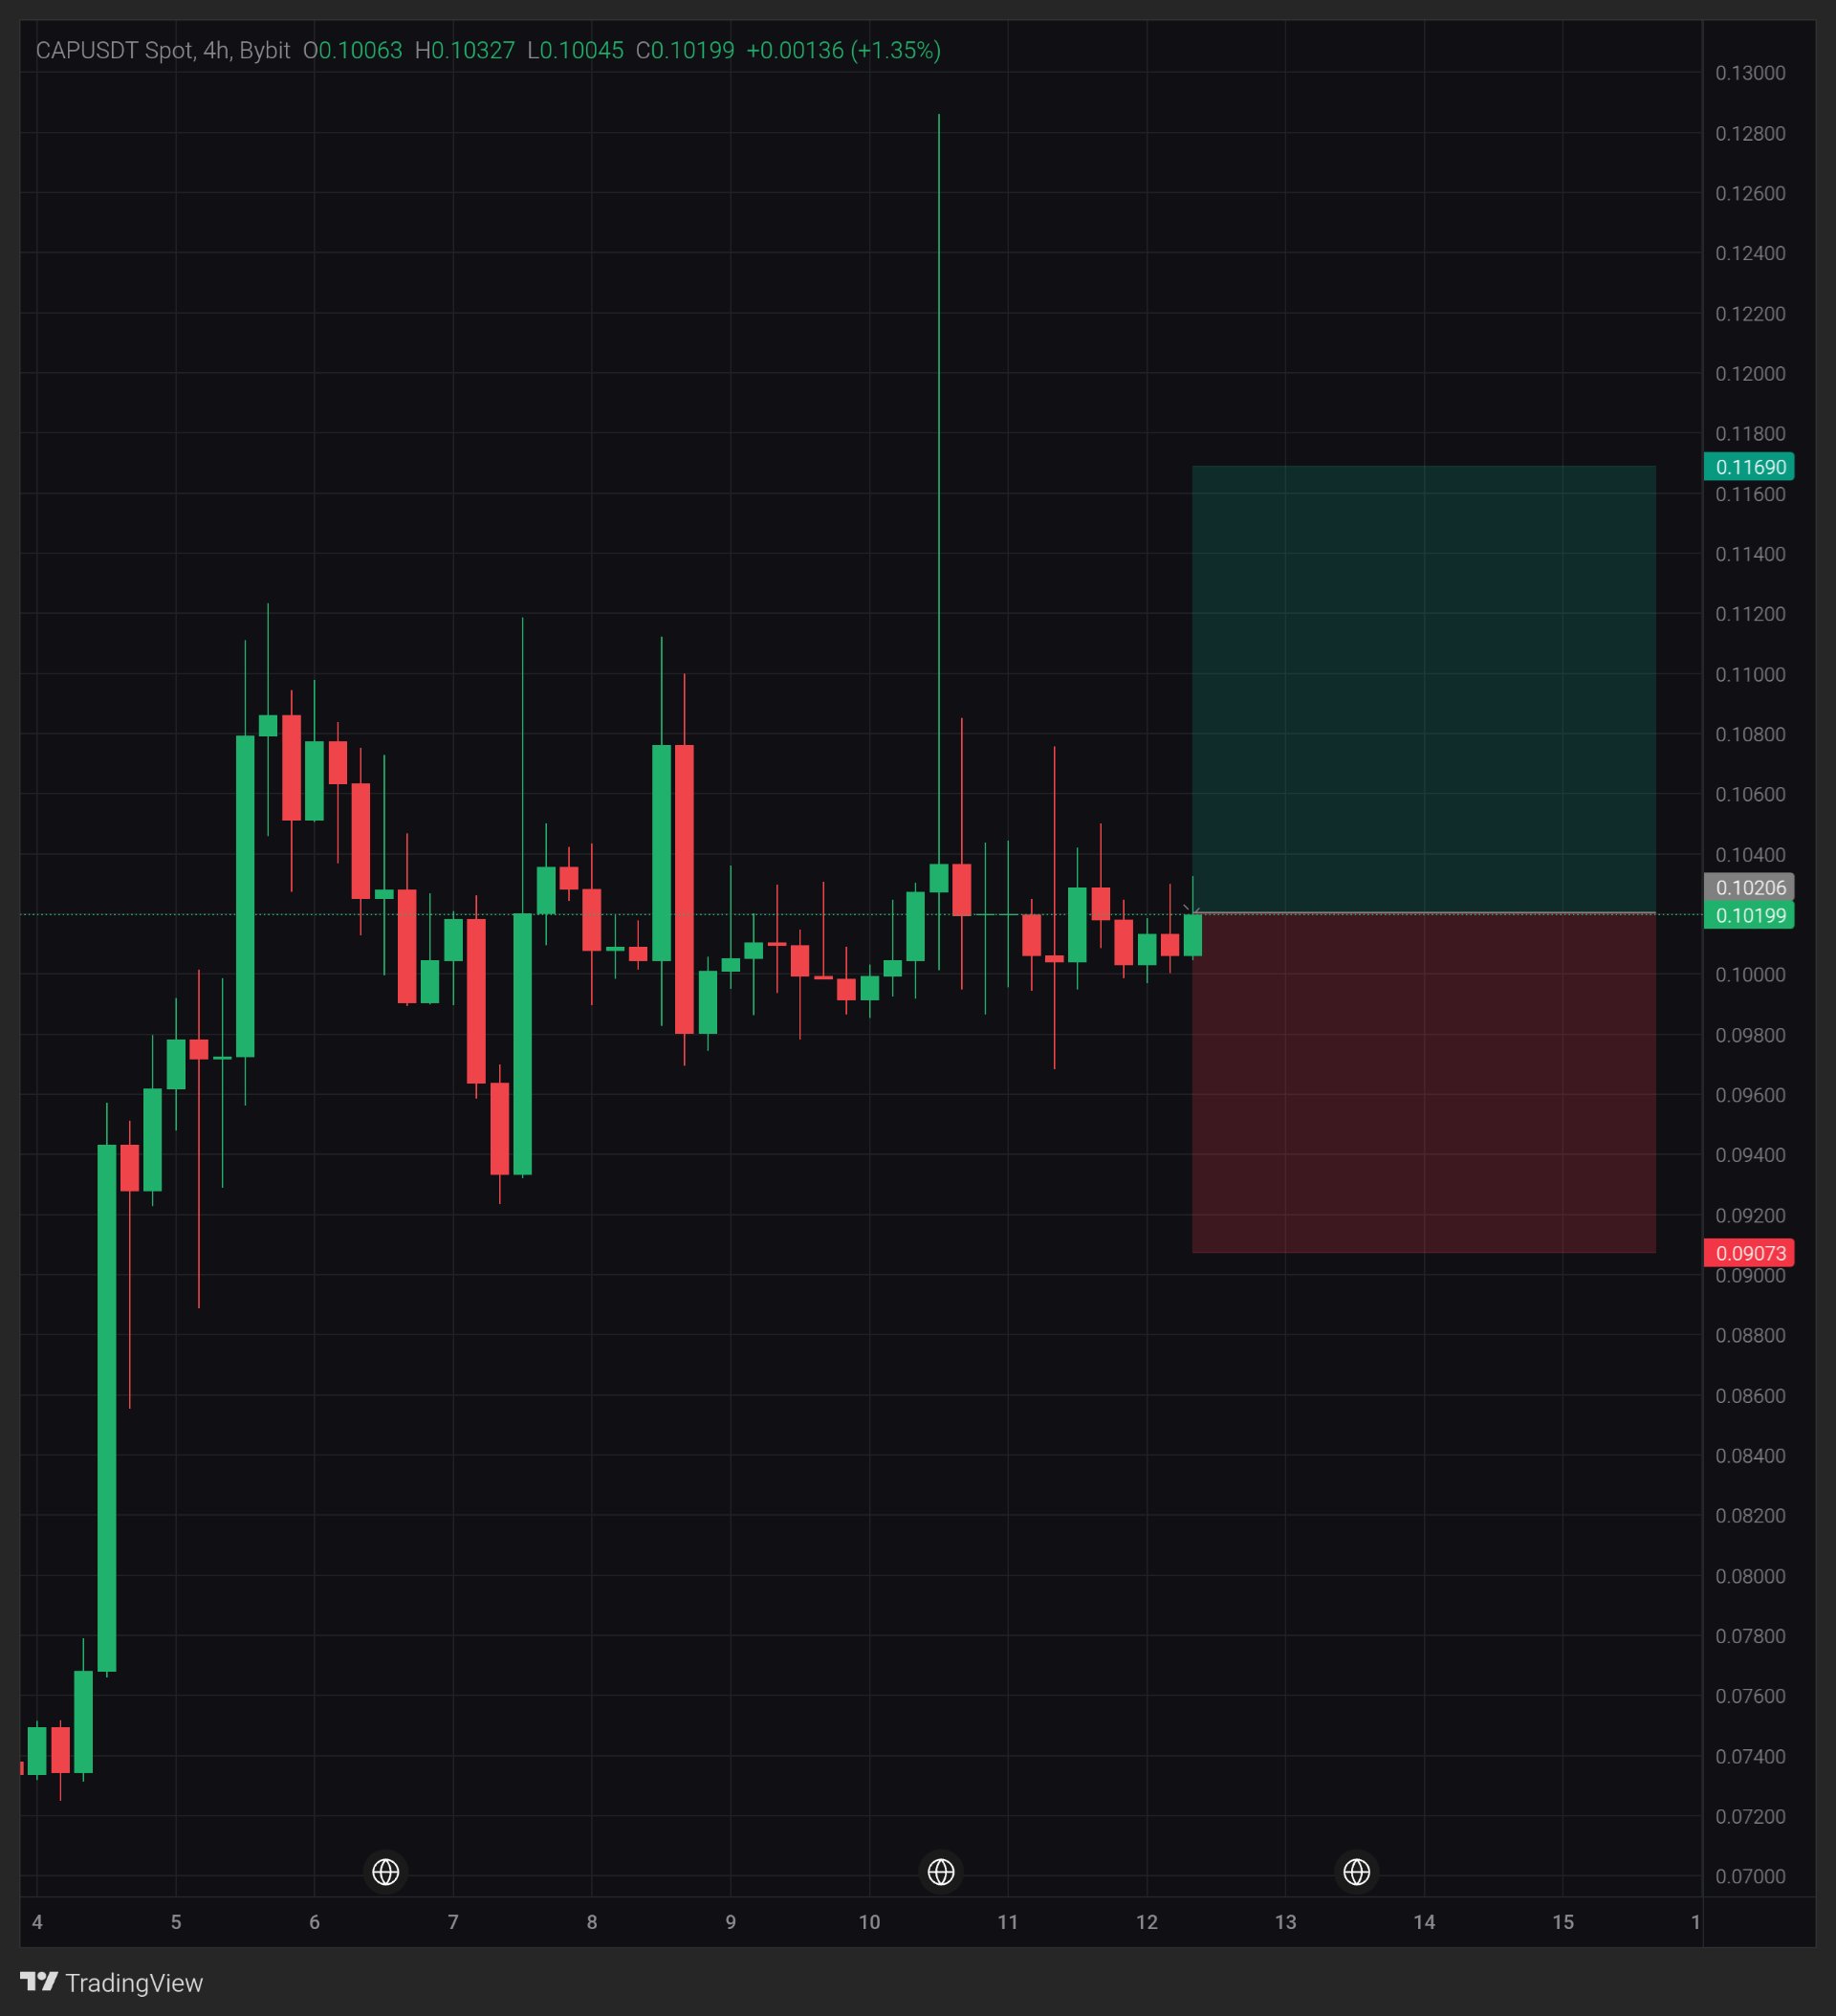
CAP: Can 0.1000 become a solid support?
$CAPUSDT — CAP is holding near 0.1020 after several 4H candles failed to establish a clear direction. What's interesting is the contrast between the earlier explosive rally and the current tight consolidation around 0.1000–0.1040. Buyers have managed to keep price above the recent lower range, but resistance is still limiting the recovery. Is this consolidation building strength for another move, or is momentum starting to fade? Timeframe: 4H | Pair: $CAPUSDT Spot, Bybit | Price: 0.10199 | Latest candle: O 0.10063 / H 0.10327 / L 0.10045 / C 0.10199 (+1.35%). Candle close status not confirmed. Macro note November 11, 2026 — Reuters reported that US October core CPI increased 0.3%, above the 0.2% forecast, while Federal Reserve officials discussed the possibility of larger interest-rate increases. This is broader market background, not the reason for CAP's price movement. What the chart shows CAP previously surged from around 0.0740 toward 0.1080, with an extreme upper wick reaching approximately 0.1285. Since that move, price has settled into a sideways range. The interesting detail is that despite the volatility, recent candles have repeatedly returned to the 0.1000 area rather than establishing a new direction. Key levels Support: 0.1004, then 0.0980–0.0960. Resistance: 0.1033, then 0.1075–0.1085. What would strengthen it Buyers need to push above 0.1033 first. A confirmed 4H close above this level, followed by a successful retest, would strengthen the recovery scenario. A break above 0.1085 would provide further confirmation. Concern The current consolidation has not produced a convincing higher-high structure. Losing 0.1000 and closing below the recent support area would weaken the bullish scenario. What changes my mind A 4H close below 0.0980 would make me more cautious about CAP's short-term direction. The lesson After a sharp rally, consolidation can represent either accumulation or distribution. The eventual breakout and candle close help distinguish between the two. My view I'm watching CAP around 0.1000–0.1033. The price is holding an important area, but I want to see a confirmed breakout before calling this a stronger recovery. This is a scenario, not a prediction. A reading at posting time, not a guarantee. Will CAP break out of this range, or continue moving sideways? Not financial advice. Always manage your risk. 📊 #ByXIMPACT
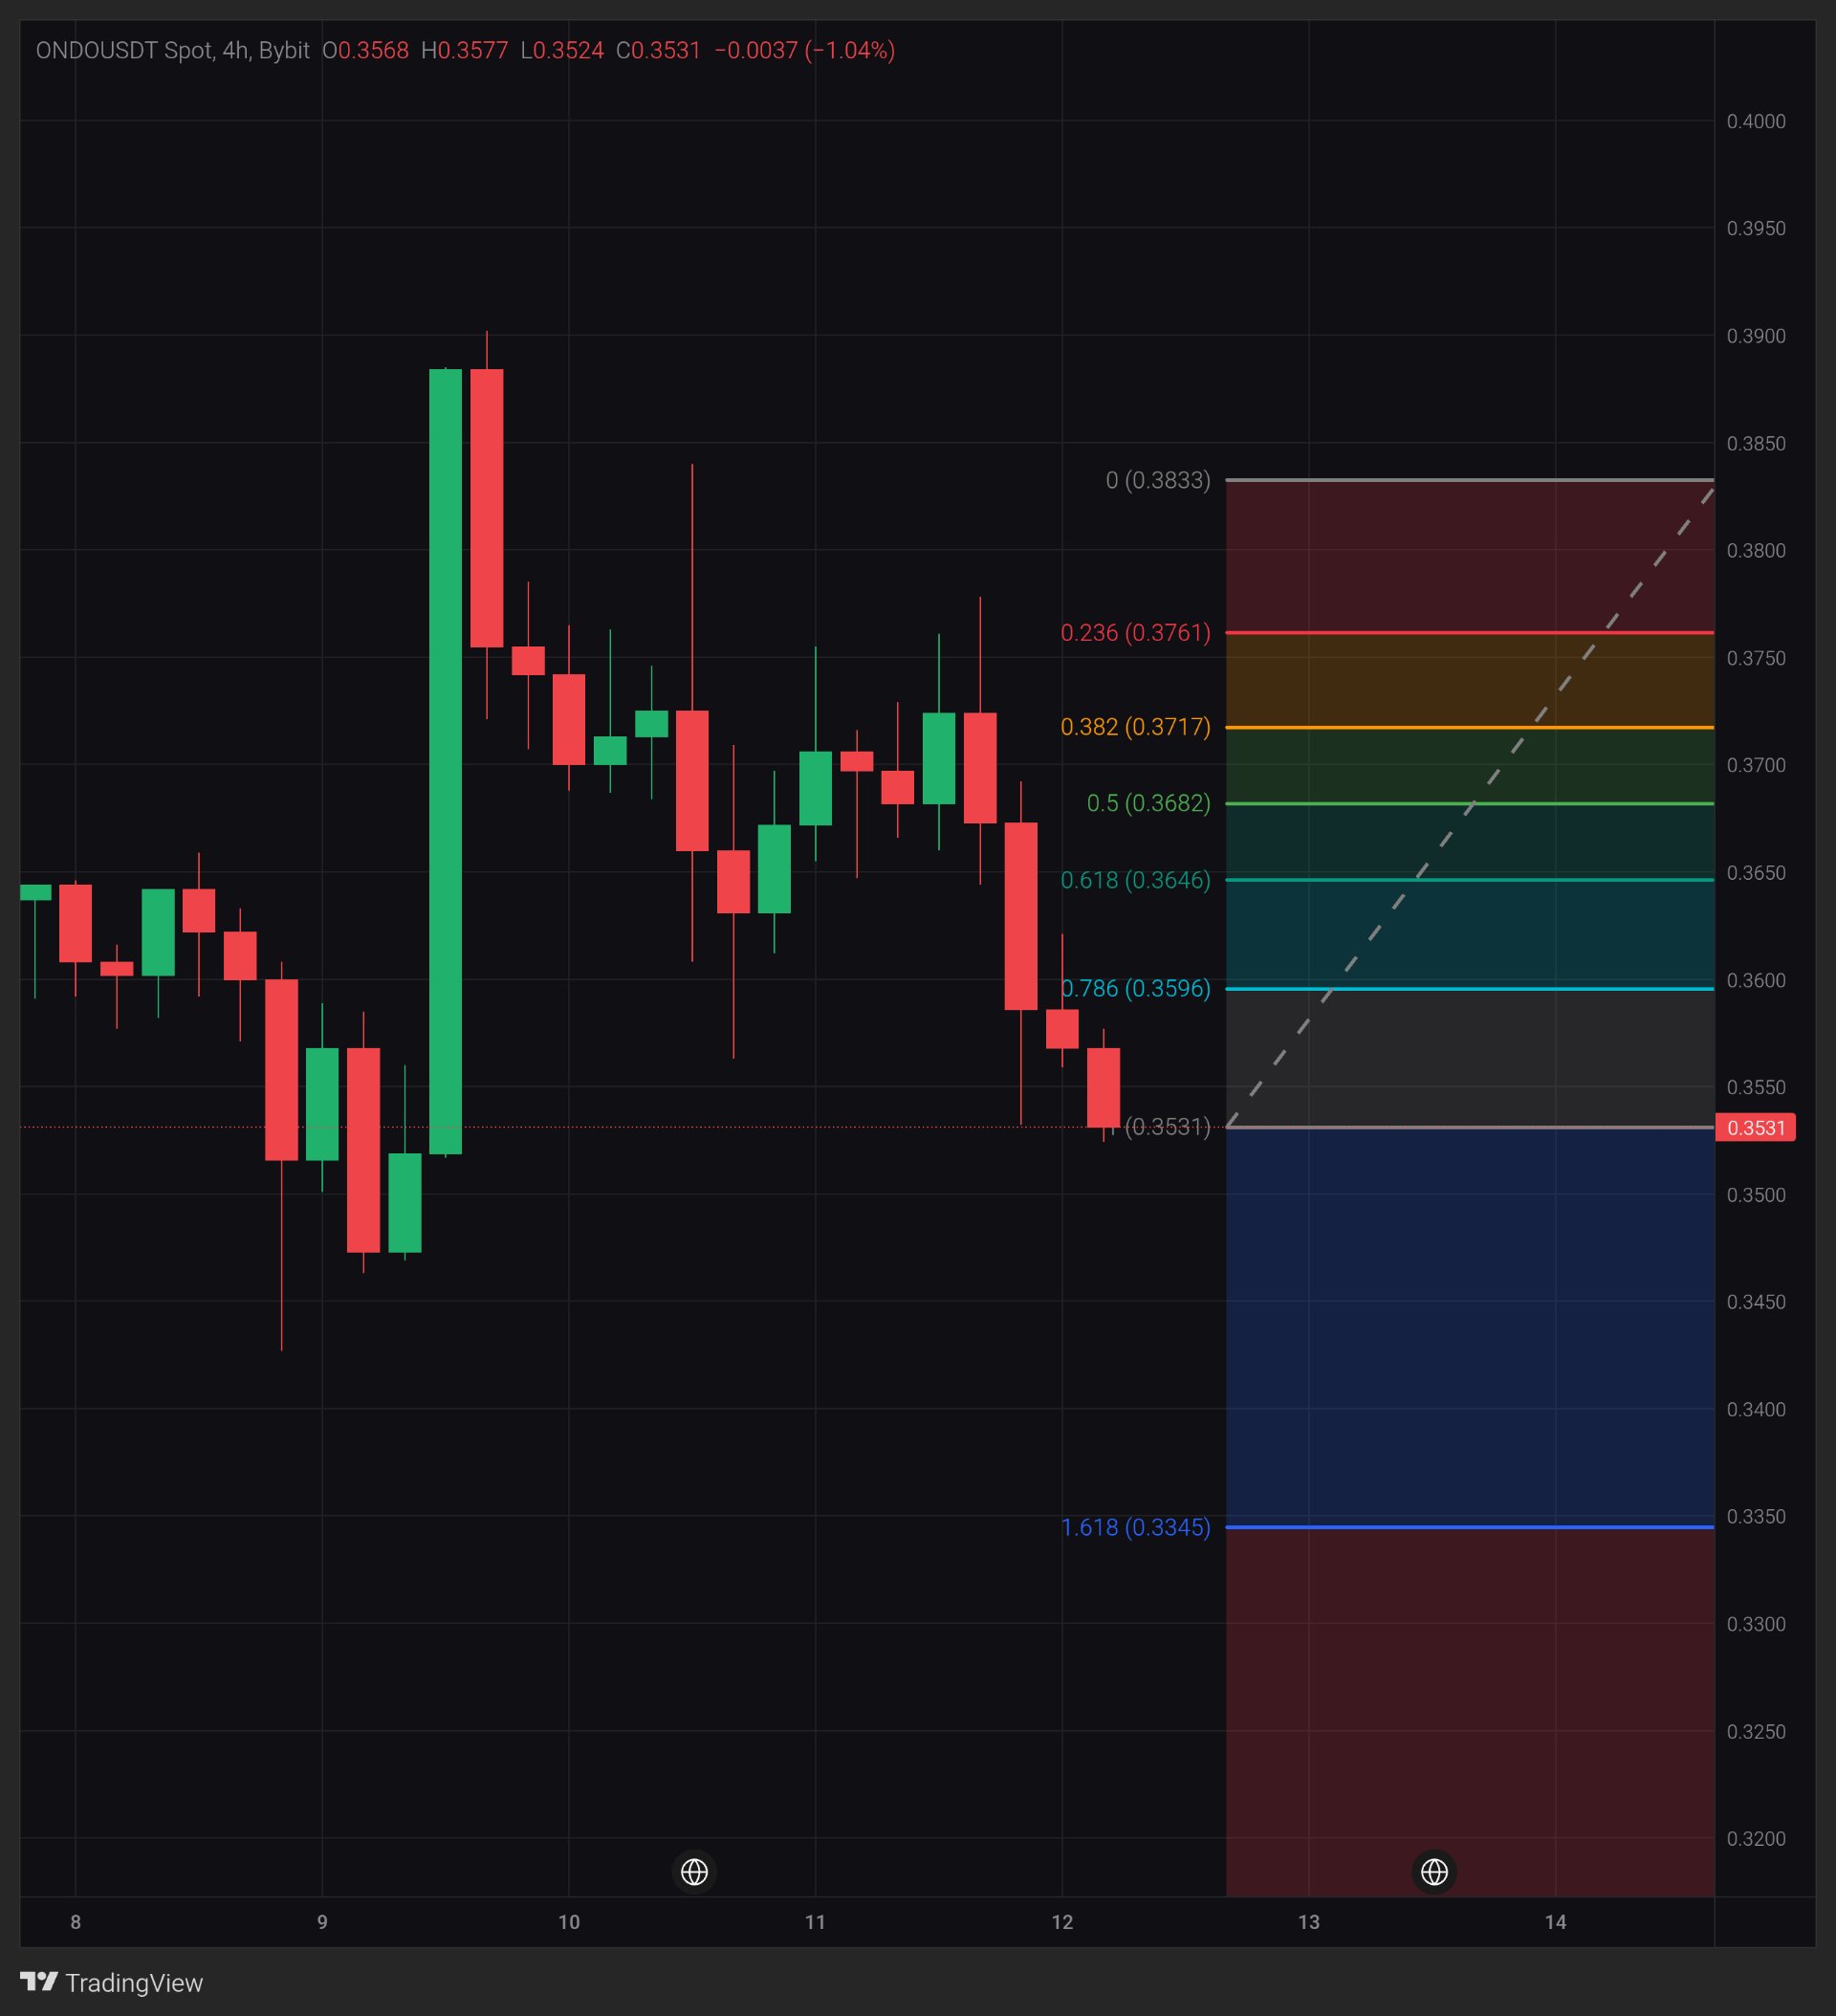
ONDO: Can 0.3530 support stop the decline?
$ONDOUSDT — ONDO is testing the 0.3530 area after several consecutive 4H candles showed increasing selling pressure. What stands out is the failed recovery toward 0.3900, followed by a sequence of lower highs and a gradual loss of momentum. Price is now sitting near an important Fibonacci reference level, while the next support area is becoming increasingly relevant. Will buyers defend this zone, or is ONDO preparing for another leg down? Timeframe: 4H | Pair: ONDOUSDT Spot, Bybit | Price: 0.3531 | Latest candle: O 0.3568 / H 0.3577 / L 0.3524 / C 0.3531 (-1.04%). Candle close status not confirmed. Macro note November 12, 2026 — Reuters reported that the US dollar strengthened to its highest level in months as hotter inflation revived expectations of further Federal Reserve rate increases. This is broader market background, not the reason for ONDO's price movement. What the chart shows ONDO experienced a strong upward move toward 0.3900 before facing a sharp rejection. Since then, the 4H structure has shifted toward lower highs. An important detail is that price has now fallen below the 0.3596 Fibonacci level (0.786), leaving the 0.3531 area as the next important reference. Key levels Support: 0.3524, then 0.3450–0.3425. Resistance: 0.3596, then 0.3646–0.3682. What would strengthen it Buyers need to defend 0.3524 first. A break above 0.3596 followed by a confirmed 4H close above it would be an initial sign of recovery. Holding that level on a retest would strengthen the bullish scenario. Concern The recent sequence of red candles and lower highs suggests that sellers still have control of the short-term structure. A confirmed 4H close below 0.3524 would increase concern about another downward move. What changes my mind A 4H close below 0.3524 would make me more cautious about ONDO's short-term outlook. The lesson Fibonacci levels can help identify important reaction zones, but losing a level on a candle close is different from simply testing it with a wick. My view I'm watching the 0.3524–0.3596 range closely. ONDO needs to show that buyers are willing to defend the current area before a stronger recovery becomes convincing. This is a scenario, not a prediction. A reading at posting time, not a guarantee. Will ONDO reclaim 0.3596, or will sellers push it toward the next support? Not financial advice. Always manage your risk. 📊 #BitcoinHitsTwoMonthLowAfterUSMidterms #USInflationRunsHotAndRateHikeBetsRise
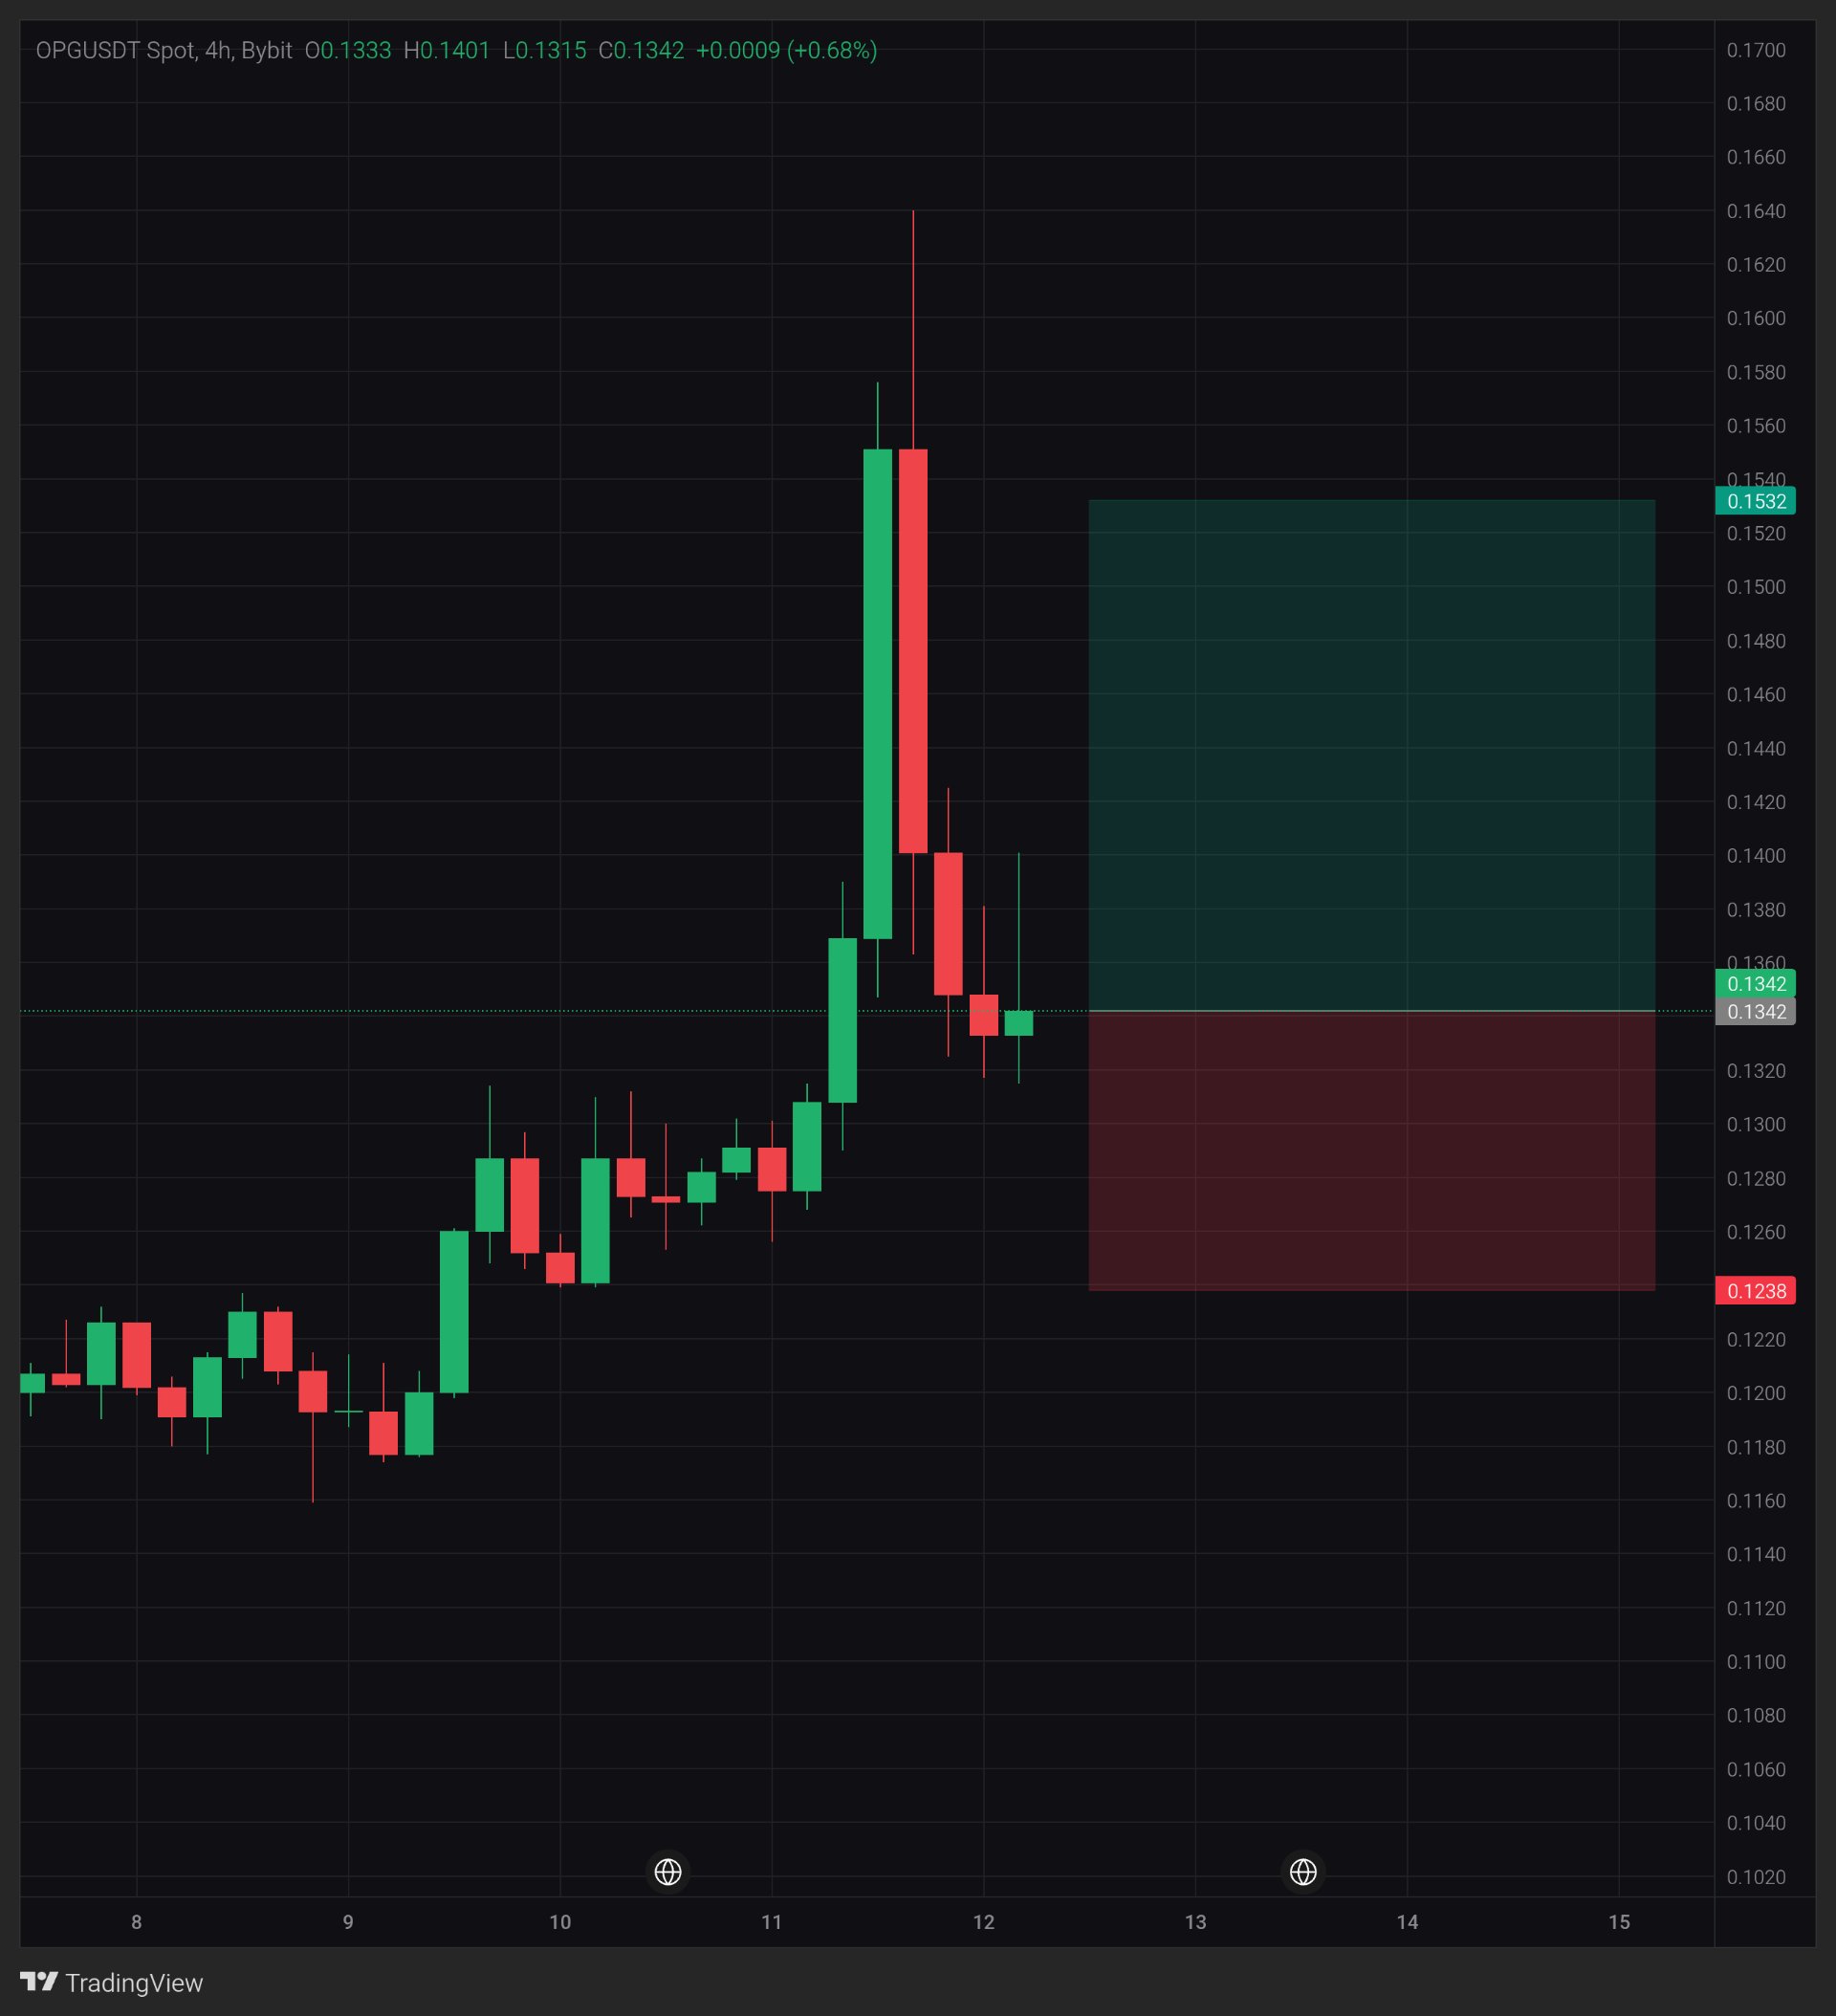
OPG: Can 0.1340 hold after the sharp pullback?
$OPGUSDT — OPG is trying to stabilize around 0.1340 after a powerful rally was followed by an aggressive rejection. What caught my attention is the long upper wick near 0.1640, showing how quickly sellers stepped in after the breakout attempt. Price has now pulled back toward the area where the previous consolidation took place. Is this a healthy correction after the rally, or is the recovery already losing momentum? Timeframe: 4H | Pair: $OPGUSDT Spot, Bybit | Price: 0.1342 | Latest candle: O 0.1333 / H 0.1401 / L 0.1315 / C 0.1342 (+0.68%). Candle close status not confirmed. Macro note November 12, 2026 — Reuters reported that the US dollar reached a 19-month high as stronger-than-expected inflation and hawkish Federal Reserve comments increased expectations of further interest rate hikes. This is broader market background, not the reason for OPG's price movement. What the chart shows OPG climbed from approximately 0.1180 to 0.1550 before a sharp rejection, with an upper wick reaching around 0.1640. The interesting detail is that the pullback has brought price back toward 0.1315–0.1340, an area where buyers may attempt to regain control. Key levels Support: 0.1315, then 0.1280–0.1260. Resistance: 0.1401, then 0.1550–0.1640. What would strengthen it First, buyers need to defend 0.1315. A break above 0.1401 followed by a confirmed 4H close above that level would provide an initial recovery signal. Holding it on a retest would strengthen the case. Concern The rejection from 0.1550 was aggressive, and the long upper wick near 0.1640 highlights significant selling pressure. Losing 0.1315 on a confirmed 4H close would weaken the recovery scenario. What changes my mind A 4H close below 0.1315 would make me more cautious about further downside. The lesson A strong rally does not automatically mean a trend will continue. The reaction after a sharp rejection often tells us more than the rally itself. My view I'm watching the 0.1315–0.1401 range closely. OPG has shown strong upward momentum, but the latest rejection means buyers still need to prove that they can defend the recovery. This is a scenario, not a prediction. A reading at posting time, not a guarantee. Will OPG recover above 0.1401, or will sellers push it lower? Not financial advice. Always manage your risk. 📊 #BitcoinHitsTwoMonthLowAfterUSMidterms