Bao 宝
6406いいね0シェア172ファン253フォロー
$GRAMUSDT just did something rare: every average agrees on the price. After sliding from 1.113 to 1.016 (about 8.7%), GRAM is sitting at 1.049 with the 7, 14 and 28-period MAs stacked at 1.051, 1.049 and 1.049. On the 1h chart, that's a market that has stopped disagreeing with itself. For most of this move, the 28 MA was a ceiling sloping down and every bounce died under it. Now it's flat, and price is sitting on it instead of below it. That's not a reversal. It's the end of the one-way pressure. What bothers me is the volume. The latest bar is 156K against a 5-bar average of 384K. The sell-off came on heavy volume. The recovery from 1.016 came on lighter, fading volume. Buyers stepped in, but they haven't paid for the move yet. The order book shows 91% bids, but I wouldn't lean on that. Bids can be pulled in seconds, and a lopsided book next to shrinking volume often means people are placing orders, not taking price. What I'm watching -Above 1.073: the 24h high and the first higher high since the drop. That's the real signal. - Below 1.016: the low gets swept and the recovery was just a pause. - 1.016–1.073: a range about 5.6% wide, and price is sitting in the middle of it. The part most people will skip Suppose GRAM breaks 1.073 and you chase it, with a stop under 1.016. Risk is about 5.3%. The first logical target, 1.113, is only about 3.7% away. That's roughly 0.7R, which is a bad trade even if you're right about direction. The better version is a reclaim of 1.073, a retest that holds, and a tighter invalidation. Without that, this isn't a setup yet. It's a compression, and a compression on fading volume resolves with a candle, not an opinion. I'm not calling it either way. I need a close above 1.073 with volume well above that 384K average, or a break under 1.016 that fails to bounce. #IMPACTbyTrade
$MNT bounced 4% off the low and walked straight into resistance Mantle has recovered from 0.3631 to 0.3773, and the 1h chart has just run into the 28-period MA near 0.3786. The latest candle is red with an upper wick, so buyers got the touch but couldn't hold it. That matters more than the bounce itself. Price only climbed back above the 7 and 14 MAs (0.3750 and 0.3731) after the slide had already stretched. The 28 MA is still the highest of the three and still sloping down, so the structure hasn't flipped. This is a recovery inside a downtrend until proven otherwise. The volume tells the same story. The selloff printed heavy bars, with several well above the 10-period average of 974K. The bounce has been quieter, and the latest bar is around 795K, below both averages. A real reversal usually has participation behind it. This looks more like the market catching its breath. Don't read too much into the 98% bid in the order book. Resting bids are easy to place and easy to pull. What counts is whether price can close above resistance. Where the bounce stands: - The recovery covers about 35% of the drop from 0.4036 to 0.3631. - The 50% retrace sits near 0.3834, and the 24h high is 0.3940. Both are untouched. - A hold above 0.3786 would be a real change in tone. What I'd need to see - A 1h close above the 28 MA, followed by a retest that holds it as support. - Volume that expands on the push instead of fading. Hypothetical setup, not a live signal: an entry near 0.379 after a confirmed hold, a stop under 0.3725, and a first target at 0.3940 would give roughly 2.3:1. If price loses 0.3731 first, the setup is off and 0.3631 is back in play. A break below that low would suggest the bounce was just a pause. I'm not chasing this into resistance. Right now the market has shown a bounce, not a reversal. The 0.3786 close is what separates the two. Not financial advice. $MNTUSDT #IMPACTbyTrade

$HYPEUSDT HYPE swept $60 and rebounded 13.7%. The volume tells me the easy part is over. HYPE's wick to $60.063 came on the heaviest volume of the whole move. Buyers answered within hours, and price is now back at $68.27, above the 7, 14 and 28 hourly MAs. That is a real reclaim. It also changes the question. The capitulation candle printed the biggest volume bar on the chart. The latest bar is around 9K against a 5-period average above 31K. The sell-off had conviction and the recovery is quiet. Buyers are not leaving, but they are not pressing either. $69 is the ceiling. The 24h high is $69.008, and the last pushes up were rejected with an upper wick. Price is about 1.1% below it and has not cleared it yet. The MAs have also not turned bullish. MA7 is up at $66.90, but MA14 ($65.92) is still under MA28 ($66.14), and the downward slope of the whole leg is only now flattening. Price is also 6.7% below the $72.86 high that started this drop. I would not call a trend reversal until that level is reclaimed. Where the R:R changes These are hypothetical setups, not signals. Chasing a break above $69: with an invalidation near $66.90, risk is about $2.10 and the move to $72.86 is about $3.86. That is roughly 1.8:1. Waiting for a retest of $66.1–66.9: the reward-to-risk is much better, but a stop tucked under $65.9 sits inside normal hourly noise. A wider stop erases most of that edge. I'd rather see a retest hold on lighter selling than buy the breakout. If $66 fails, the sweep low was just the first half of the move. Buyers were fast. Whether they are still willing to pay up is the part nobody has proved yet. #IMPACTbyTrade
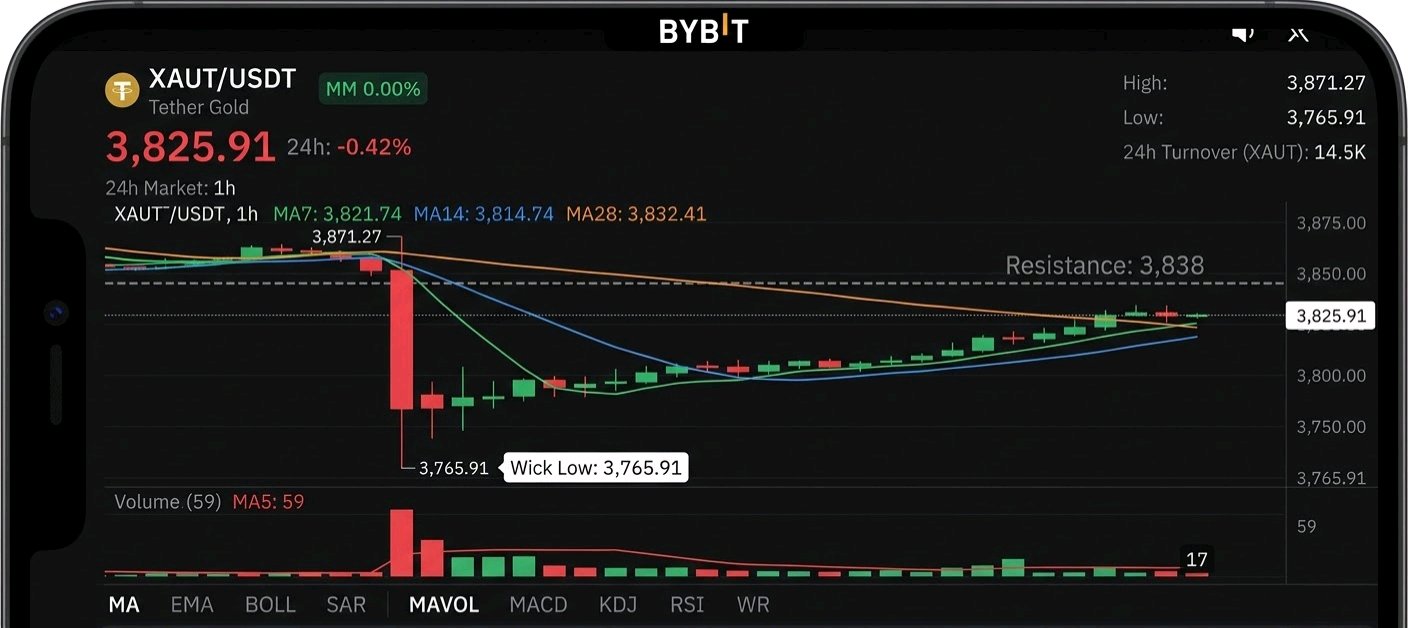
$XAUTUSDT XAUT swept the lows at 3,765.91, but the recovery is running on fading volume The drop was violent. XAUT fell through the 1h moving averages in one heavy-volume leg and wicked down to 3,765.91. The buyers who stepped in there did real work, and price is back at 3,825.91, about 57% of the 24h range. But the volume has gone quiet. The flush came on the biggest bars of the session. The bounce has been built on shrinking participation, and the latest bar shows about 17 against a 5-bar average near 59. A reversal needs buyers to show up with conviction, and so far they haven't. The moving averages show the same split: - MA7 (3,821.74) and MA14 (3,814.74) have been reclaimed. That's the good news. - MA28 (3,832.41) is still above price, sloping down, and only about 6.5 points away. It's the line that separates "bounce" from "trend repair." - The recovery's first rejection came around 3,838, so that's the nearby ceiling to clear. The order book also leans sell at 79%. That's a snapshot and can flip quickly, so I wouldn't build a thesis on it. But the pressure above price matches what the volume is saying. What I need to see A 1h close above MA28 and the ~3,838 rejection high, ideally with volume expanding rather than shrinking. That would turn the sweep into a real higher-low structure and put the 24h high (3,871.27) back in play. What weakens it Losing the MA7/MA14 cluster (3,815–3,822) would turn this into a lower-high retest of the lows. Gold-backed tokens can also whip hard around the sweep zone, so I'm not interested in chasing the bounce under the MA28. I'm not offering an entry or stop here. The chart doesn't confirm one, and I'd rather wait for the reclaim. The sweep is done. What's still unproven is whether anyone wants to buy the recovery. #IMPACTbyTrade
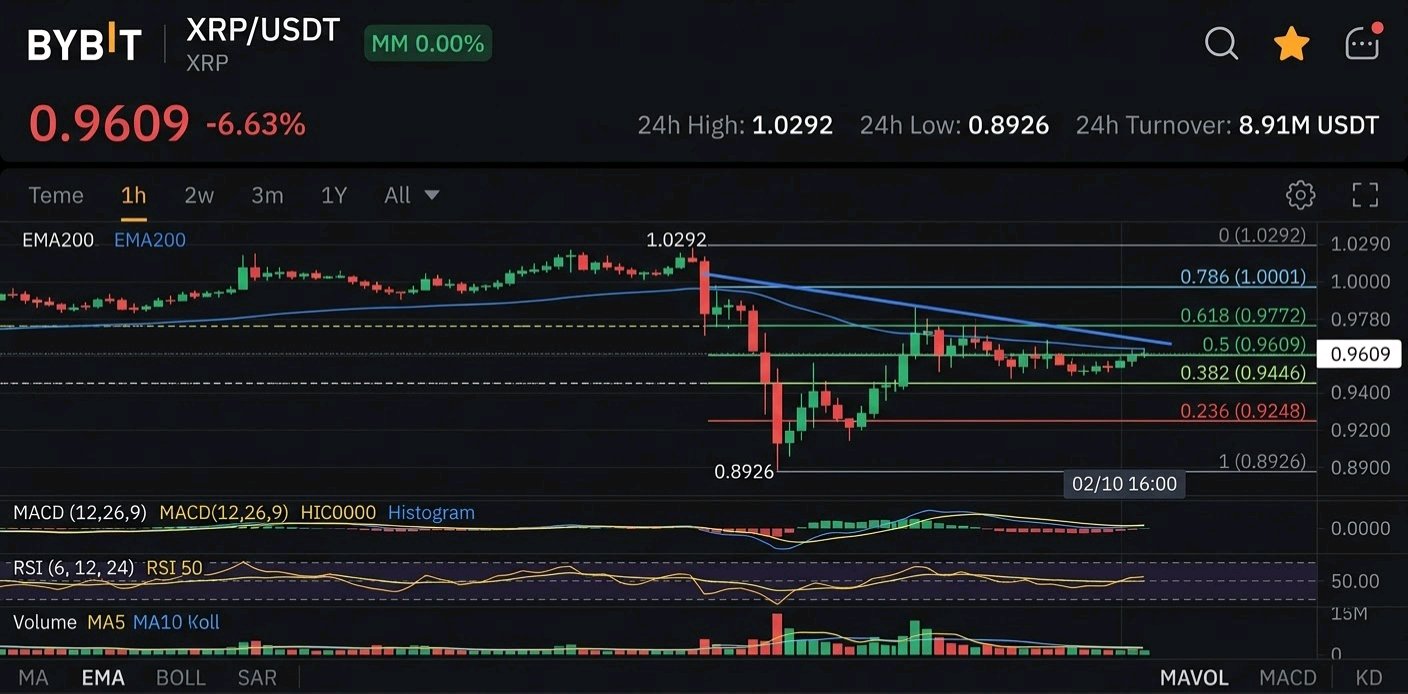
XRP just sold off 13%, bounced 8%, and is now sitting on the exact midpoint of its range XRP dumped from 1.0292 to 0.8926, a 13.3% flush, then recovered to 0.9635. That is a 52% retracement of the entire drop. The 50% level of that range is 0.9609, so price is parked right on equilibrium. Everything else lines up there too. The MA7 (0.9607) and MA28 (0.9590) have collapsed into the same spot, and the 24h high of 0.9977 sits just above. When trend, mean, and midpoint all agree on one price, the market is waiting for someone to break the tie. The recovery itself looks stronger than it is. The bounce topped out around 0.978, below the earlier 0.99+ area, so it is a lower high. Volume on the rebound has also been fading, with the 5-period average now below the 10-period. The big volume came on the flush and the first green recovery candle. Buyers showed up at the low, but they haven't followed through. One caveat: the current candle is only a few minutes old, so its 38.59K volume means little. I'm judging the trend of the volume average, not that bar. What I need to see - A 1h close above ~0.978 would take out the recovery high, and the 0.995 to 1.00 zone becomes the next test. - A rejection here followed by a close below the MA14 (0.9397) would suggest the bounce was just relief, with 0.8926 back in play. The order book shows 59% bids, but a single snapshot is easy to fake, so I wouldn't lean on it. I don't see a clean entry yet. Chasing a bounce into its own midpoint isn't edge. The decision comes at 0.978 or 0.94, and I'd rather let the market pick the side first. $XRPUSDT #IMPACTbyTrade
PEPEは安値から7%反発したが、テクニカル的にはまだトレードする局面ではない。 PEPEは0.000003697の安値をスイープ(一時的な割り込み)し、1時間足で7日・14日移動平均線を回復して、現在は0.000003956にある。回復しているように見えるが、まだ確信は持てない。 売り圧力は厚い出来高を伴っていたが、今回の反発は目に見えて出来高が少ない。売り手は確信を持って価格を押し下げたのに対し、買い手は価格をじわじわと押し上げているに過ぎない。 現在のローソク足もまだ確定しておらず、終了まで30分ほど残っている。まずはMA14(0.000003903)の上で確定することが大前提だ。MA14を上ヒゲでタッチして拒否されるようではカウントできない。 より重要な水準は、価格の約3.5%上で右肩下がりに推移しているMA28(0.000004096)だ。PEPEは昨日もこの反発を試みたが、その近辺で拒否されている。今回は同じテストであり、まだその水準をクリアできていない。 なぜ飛びつかないのか 現在の価格でエントリーし、0.000003697の安値のすぐ下(例えば0.00000369)にストップを置くと仮定する: - リスクは約0.000000266。 - MA28をターゲットにしてもリスクリワード(R)は約0.53。 - 24時間高値の0.000004320をターゲットにしてもRは約1.37だが、それは価格がまずMA28をクリアした場合に限られる。 今の水準で買うということは、最初の明確なレジスタンスまで1:1未満の期待値に対し、安値を割り込むリスクを負うことを意味する。これはあくまで仮定の計算であり、シグナルではない。 考えを変える条件 - MA14またはMA7をサポートとして再テストし、静かなプルバック(押し目)が確認できれば、より良いエントリーとタイトなリスク管理が可能になる。 - 1時間足が0.000004096を超えて確定し、その後の再テストでサポートされれば、トレンドの構造が変わる。 - 0.000003697を再び下回れば、反発は無効となり、下落トレンドが再開する。 安値のスイープは確かにあったが、スイープ単体では反転とは言えない。市場がMA28を売りの時と同等の出来高で奪還し、実力を証明する必要がある。 $PEPEUSDT #IMPACTbyTrade

DOT's 15% flush is down to one question: where are the buyers? is down 15.4% to 0.6877 on DOT/USDC, and the big red candle is no longer the part I'm watching. The damage came in one hourly candle that sliced through MA7 on the heaviest volume of the whole move. That was real selling. Since then, price wicked to 0.6811, bounced once, and slipped back to about 1% above that low. Volume has faded sharply from the flush, though the current candle is still open, so I'd judge it at the close. The order book shows 87% bids, yet price won't lift off the low. Bids are sitting there, but nobody is paying up. A resting bid is a stated intention, and it can be pulled in seconds. Context I found no DOT-specific catalyst. The wider market is risk-off: fear & greed was 26 as of Nov 11, and total market cap was down about 5.8% on the week. It's also Sunday, and this pair's 24h turnover is only 17.34K. I'd cross-check the move against DOT/USDT before reading too much into the 15%. What I need to see Price is below all three MAs, and they're stacked bearishly: MA7 at 0.7066, MA14 at 0.7346, MA28 at 0.7655. The first real sign of life is a reclaim of MA7 on rising volume. A touch of 0.6811 isn't a reversal, and neither is a bounce. Hypothetical setup, not a signal: a reclaim of 0.7066 with a stop under 0.6811 risks about 0.0255. - MA14 at 0.7346 pays only about 1.1R. - MA28 at 0.7655 pays about 2.3R. - Falling MAs mean those targets shrink every hour. A reclaim of MA7 alone doesn't give an attractive trade. It needs follow-through to MA28 to justify the risk. Invalidation: a clean break below 0.6811 on volume. At that point the 87% bids stop mattering. The sellers have shown their hand. The buyers haven't yet. $DOTUSDT #IMPACTbyTrade

SOL is sitting on its low with 81% bids and no buyers The order book says buyers. The chart says nobody is buying. SOL/USDC is at 75.49, down 7.37% on the day, and only 0.71 above the 24h low of 74.78. About 81% of the visible order book is on the bid side, which looks bullish. But look at what price did with it. After tagging 74.78, SOL bounced into a tight, overlapping range. The candles are small and the wicks are short, with no follow-through. Heavy resting bids and a price that won't lift usually mean passive demand is absorbing sells while real buyers stay on the sidelines. That is a bid wall, not a trend change. The trend is still down - MA28 is at 77.84 and sloping down. - MA14 is at 75.84, still above price. - MA7 is at 75.56, flat and hugging price. Price is wrapped around the fast average while the slower ones keep pressing down from above. Every bounce since the 82.32 high has topped out lower than the one before. Volume tells both sides of it Current hourly volume is 1.45K against a MA5 of 1.70K and a MA10 of 1.81K. The selling that drove the leg down has dried up. That is a real change, since the market is no longer being pushed lower. But the bounce has no volume behind it either. A base with no volume is a pause, not a reversal. What I need to see - Reclaim: an hourly close back above 75.84 (MA14). A wick through it doesn't count. - **Real confirmation:** a hold above 77.84 (MA28). Until then, any move up is a bounce inside a downtrend. - Invalidation: an hourly close below 74.78. That level has already been tested once, and a second test with weaker volume rarely holds. Here is the hypothetical setup, not an active trade. If SOL reclaims 75.84 and holds, with a stop below 74.78 and a first target at 77.84, the risk is about 1.06 against a reward of about 2.00. That is roughly 1.9:1. It's acceptable, not exceptional, and it only exists after the reclaim. Buying now means entering below both averages with the stop on the same level that just got tested. I'm not chasing the bid wall. SOL has stopped falling, but stopping isn't the same as turning. The next hourly close above 75.84 will tell us whether those bids were real demand or just a floor waiting to be swept. This is a chart observation, not financial advice. I worked only from the screenshot and didn't check news, funding or derivatives data, so check those before acting. $SOLUSDT #IMPACTbyTrade

HYPEの反発は息切れしている HYPEは71ドル台前半から67.113ドルまで1時間のローソク足一本で急落し、その後の3〜4時間の反発もすでに停滞している。押し目買いは入ったが、反発が続かない。 過去24時間のレンジは75.308ドル〜67.113ドルで、現在の価格は68.85ドル、5.87%の下落。75.3ドルの急騰はローソク足一本だけのヒゲで即座に否定されたため、この売りは弱さからではなく、上昇失敗から始まったものだ。 問題は反発の弱さにある 下落のローソク足はチャート上で最大の出来高(約60K)を記録した。その後の反発のローソク足の出来高は明らかに少なく、現在の1時間は7.76Kで、10期間平均の20.72Kを大きく下回っている。これほどの出来高を伴う急落は強制的な売りを示唆し、その数分の一の出来高での回復は、単なる一時の休息に見える。 移動平均線もそれを裏付けている。価格は7MA、14MA、28MA(それぞれ69.37、69.93、71.48)の下にあり、3本とも下向きだ。反発はMA7付近にタッチして失敗し、高値を切り下げた。今また現在のローソク足は陰線となっている。 注目しているポイント - 67.113ドル:投げ売り(キャピチュレーション)の安値。ここを再テストして出来高を減らしながら耐えられれば前向きな兆候。あっさり割り込めば、あの急落は第一波に過ぎなかったことになる。 - 69.4〜69.9ドル:MA7/MA14の密集地帯。ここを奪還して維持できれば見方は変わる。 - 71.5ドル:MA28であり、下落の起点。ここを奪還しない限り、これは下降トレンドの中の反発としか見なせない。 オーダーブックで売り圧力が70%というのもこの状況と合致するが、これはあくまで一瞬のスナップショットであり秒単位で変わるため、頼りにはしない。 下落中の移動平均線に向かって反発を追いかけるつもりはない。ロングで入るには十分な出来高を伴う69.9ドル付近の奪還が必要で、ショートで入るには再テスト失敗か67.1ドルの割り込みが必要だ。そのどちらかが起こるまではセットアップはなく、市場が方向性を決めている最中だと言える。 急落は騒がしいイベントだった。67.1ドルの再テストで何が起こるかによって、そこが底だったのか、それとも単なる下落の第一波だったのかがわかるだろう。 これは1時間足チャートのみに基づいた分析。この動きの背後にあるニュースや資金調達、フローデータは確認していない。 $HYPEUSDT #IMPACTbyTrade

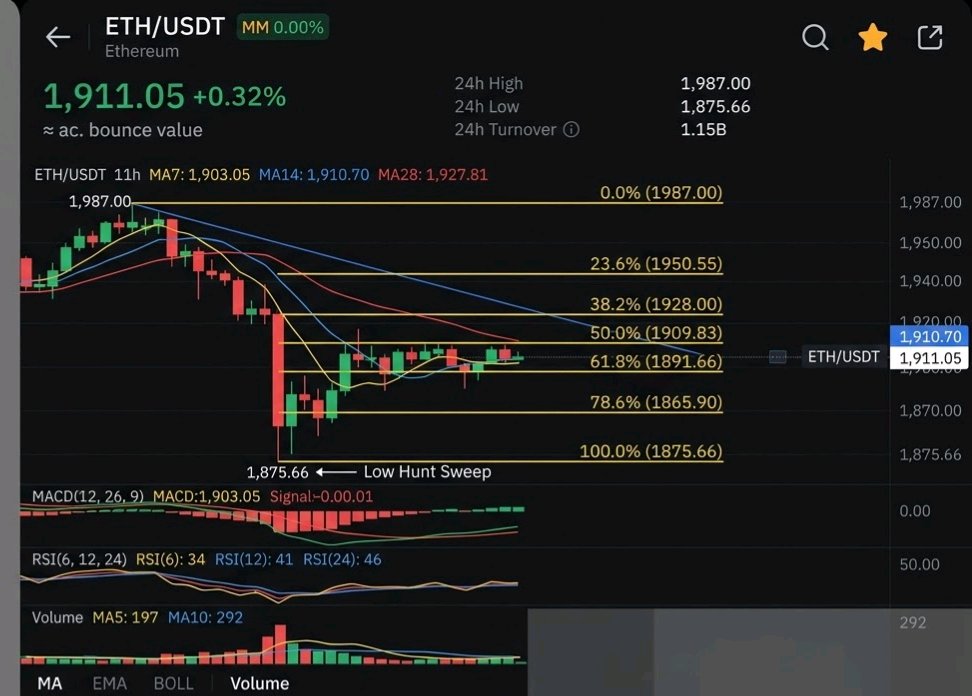
ETH took the low it was hunting. The recovery hasn't followed. The sell-off already swept the downside. ETH wicked to 1,875.66 on the heaviest volume of the session and snapped back. That is usually where I start looking for a reversal. But look at what came after the wick. The bounce has carried price from 1,875 to 1,910, right into the 14-period MA at 1,910.70, on volume that keeps shrinking. The 5-period volume average is about 197 against 292 for the 10-period. A bounce on fading volume is a pause, not a verdict. The structure is the bigger problem. Hourly highs keep stepping down, from the 1,987 24h high to roughly 1,950, and now to around 1,917. The MAs are stacked bearishly with MA28 (1,927.81) above MA14 above MA7 (1,903.05), all sloping down. Price sits in the lower third of the 24h range, about 31% up from the low. What I need to see - An hourly close above 1,927.81. That alone doesn't flip anything, but it's the first sign the bounce has legs. - A push through the roughly 1,950 area. That is the last lower high, and taking it out breaks the lower-high sequence. What kills the idea If ETH loses 1,875.66 again, the sweep stops being a sweep and becomes a support break. Every buyer who stepped in on that wick is then underwater. I'm not chasing this bounce under the MA28. There's no confirmed entry here, only a hypothetical setup waiting on a reclaim. The order book also shows 65% sell-side, but that's a snapshot, not a signal. ETH didn't fail at 1,875. It just hasn't been rewarded for holding it. $ETHUSDT #IMPACTbyTrade
LINKの10.214のブレイクアウトは、維持する機会すらありませんでした。 LINKは1時間足チャートで10.214まで上昇しましたが、その後その上昇分をすべて吐き出しました。長い上ヒゲのローソク足の後に、それを打ち消す実体の大きな陰線が出現しました。これこそが失敗したブレイクアウトの典型的なサインです。買い手が価格をそこまで押し上げたものの、誰もその価格で買いたがらなかったということです。 それ以来、チャートの構造は弱まる一方です。戻り高値は切り下がり続けており、移動平均線の並びも完全に弱気です(MA7が9.615、MA14が9.735、MA28が9.838)。上昇のたびに最も短期の移動平均線付近で失速しており、これは買い手が安値を拾っているのではなく、売り手が上昇局面を利用して手仕舞いしていることを示唆しています。 出来高もそれを裏付けています。チャート上で最も目立つのは陰線の出来高であり、反発時の陽線は明らかに出来高が細っています。誰も本気で買っていない、腰の引けた反発に過ぎません。 現在の価格は9.577で3.25%の下落。24時間の安値である9.510からわずか0.7%しか離れていません。直近のローソク足は9.510までヒゲを伸ばして反発しているため、多少の買い意欲は見られます。しかし、ヒゲが出たからといって即座に底打ちとは限りません。LINKが9.615を明確に上回って引けるまでは、下降トレンドの中の一時的な休止に過ぎないでしょう。 なぜ反発が即座にトレードチャンスとは限らないのか 仮に、MA14(9.735)を上回って1時間足が確定した後にロングし、損切りを9.510の下に置くと想定します: - リスク: 0.225 - MA28(9.838)までのリワード: 0.103(約0.46R) - 10.038までのリワード: 0.303(約1.35R) このように、価格が移動平均線を明確に上回るまでは、仮に回復が成功したとしてもリスクリワード比は悪いです。これはあくまで仮定でありシグナルではありませんが、チャートが明確なエントリーポイントを示していない現状で、無理に飛びつきたくない理由がここにあります。 注目しているポイント - 強気材料: 9.615、次いで9.735を上回って引けること。理想を言えば、出来高の増加を伴うこと。これによって移動平均線が天井からサポートへと転換します。 - 弱気材料: 9.510を割り込んで引けること。このチャート上ではその下に目立ったサポートがないため、そうなれば新たな下落局面が始まり、安値買いのチャンスとは見なせなくなります。 9.510の安値は今のところ維持されていますが、市場は単なるヒゲではなく、出来高を伴った買い手による防衛姿勢を証明する必要があります。 注意:これはスクリーンショットのみに基づく分析であり、ニュースやデリバティブデータ、市場全体の状況は考慮していません。BTCの方向性やLINK固有の材料など、何か追加情報があれば分析を深めることができます。 $LINKUSDT #IMPACTbyTrade

STXは反発分をすべて吐き出し、出来高が警告を発していた 24時間変動率は+2.42%だが、1時間足チャートは異なる物語を語っている。 STXは11月13日に0.2730の安値をスイープ(狩り)した後、1本の大きな陽線で急反発した。この動きはそのまま0.30というラウンドナンバーの直下である0.2996まで直行したが、そこで失速。0.30を明確に試すことはなかった。 私が懸念しているのは出来高だ。0.2996への上昇は、ほとんど出来高を伴っていなかった。拒否されたローソク足とそれに続く売りは、チャート上で最大の出来高バーを記録した。買い手は静かに価格を押し上げたが、そこへ到達すると売り手が大々的に介入してきた。 現在、価格は0.2796に位置しており、ほぼMA7(0.2797)上にあるが、依然としてMA14(0.2869)とMA28(0.2862)を下回っている。これら2つの移動平均線は0.286付近で収束しており、そのゾーンが最初の真の試練となる。0.2730のスイープが維持されたことは救いだが、私はそのクラスターを上抜けるまでは反転とは呼ばない。 あくまで仮定のセットアップとしての計算(ここではエントリーは確定していない): - 0.2796でロング、0.2730割れで損切り。リスクは約2.4%。 - 0.2865のターゲットで利益は約2.5%、おおよそ1:1。これでは割に合わない。 - 0.2996のターゲットで利益は約7.2%、おおよそ3:1。これは機能するが、価格がMAクラスターを突破した場合に限る。 0.287の奪還を待つと、さらに条件は悪化する。同じ損切り幅で計算すると、リスクは約0.0140に対し、0.2996までのアップサイドは0.0126となり、トレードは1:1を下回る。最良のエントリーは安値付近であり、後追いは魅力的ではない。 私は2つの点に注目している。1時間足が0.2870を上回って引けるかどうか、そしてその際に出来高が伴うかどうかだ。もし0.2730を割り込めば、「スイープ&リクレイム(狩り後の奪還)」のシナリオは無効となり、レンジは崩壊する。 一つ注意点として、このペアの売買高は薄い(3.46K)ため、流動性が豊富な銘柄よりも動きが綺麗に見えたり、あるいは汚く見えたりすることがある。 STXに関するニュースや他のカタリストは確認していない。これは純粋にチャートのみの分析だ。もし必要であれば、Stacksの動向を調査して情報を統合することも可能だ。 $STXUSDT #IMPACTbyTrade

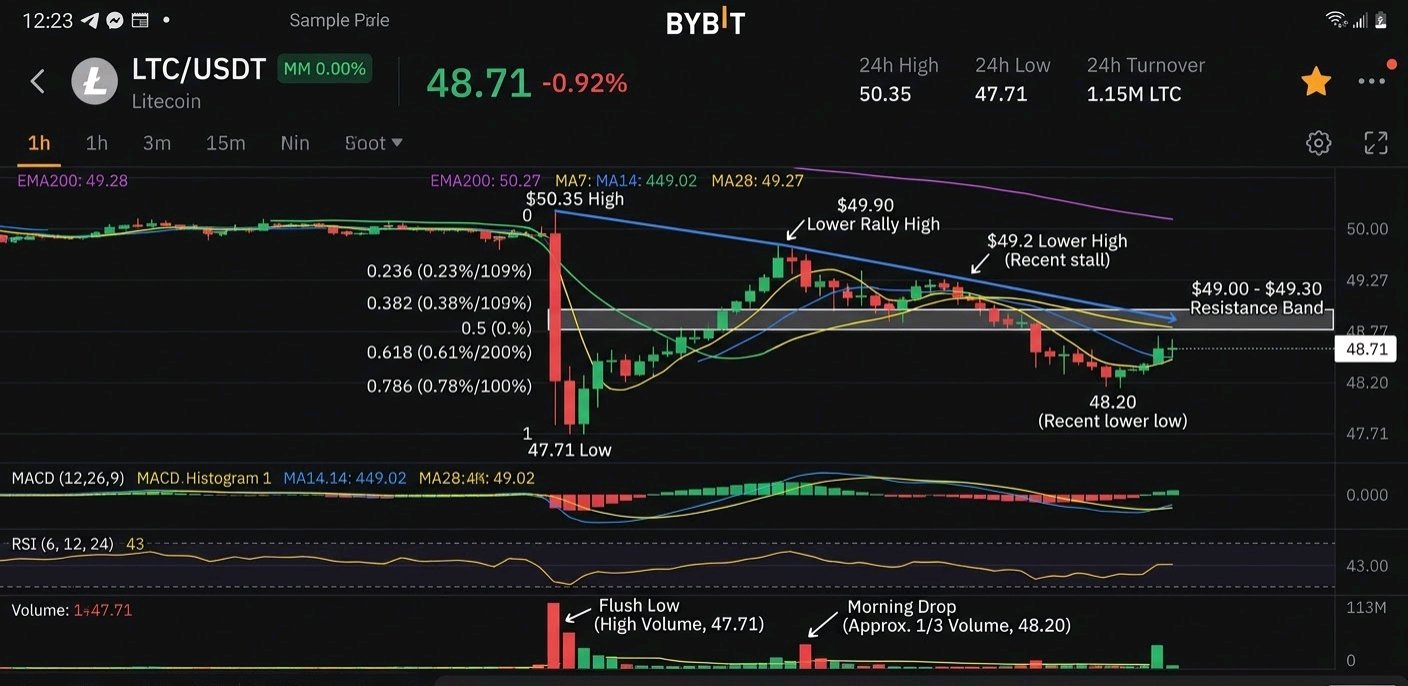
Litecoin's $47.71 low is still standing, but the bounces keep failing below it LTC swept $47.71 in a heavy flush yesterday, then rallied. Every rally since has made a lower high, and the latest sell-off stopped around $48.20, well above that low. Price is now coiling between a floor it hasn't revisited and a ceiling that keeps getting lower. On the 1H chart the high is $50.35, followed by a lower rally high near $49.90. The most recent push stalled around $49.2. Price is at $48.71 and sits under the MA7 ($49.02), MA14 ($49.27) and MA28 ($49.11). Those three are bunched within about 25 cents, so $49.00-$49.30 is one resistance band, not three separate levels. The volume is the interesting part. The first drop to $47.71 was by far the biggest volume bar on the chart, which looks like a real flush. The second drop this morning printed roughly a third of that volume. Sellers pushed price lower again with much less force, and that is why the $47.71 low hasn't been tested again. The bounce isn't convincing either. The current green candle's volume (about 79) is below its 5-bar average (about 91), and the order book shows 66% asks to 34% bids. That's a snapshot and can change in seconds, but it does mean buyers aren't being aggressive here. What would change my mind I'm not interested in buying anything under $49.00. A 1H close above $49.30 that holds on a retest would tell me the lower-high sequence is broken. Until then, this looks like a pause in a weak structure, not a reversal. Risk management Even a confirmed reclaim has a problem. Say a long triggers on a $49.30 retest, with invalidation just under the $47.71 low (about $47.65) and a first target at $50.35. That's about $1.65 of risk for $1.05 of reward, roughly 0.6:1. This is a hypothetical setup, not a signal. The confirmation costs you the reward-to-risk. You'd need either a tighter structural stop, such as under $48.20, or a target beyond $50.35 to make it worth taking. If $47.71 breaks on rising volume, the flush low becomes a failed support and the downside story takes over. Right now neither side has proven anything. The level that matters is $47.71 below and $49.30 above. LTC has to leave that range before there's a trade, and I'd rather wait for it than guess which way it goes. Based only on the 1H chart provided; I didn't research news or derivatives data. Not financial advice. $LTCUSDT #IMPACTbyTrade
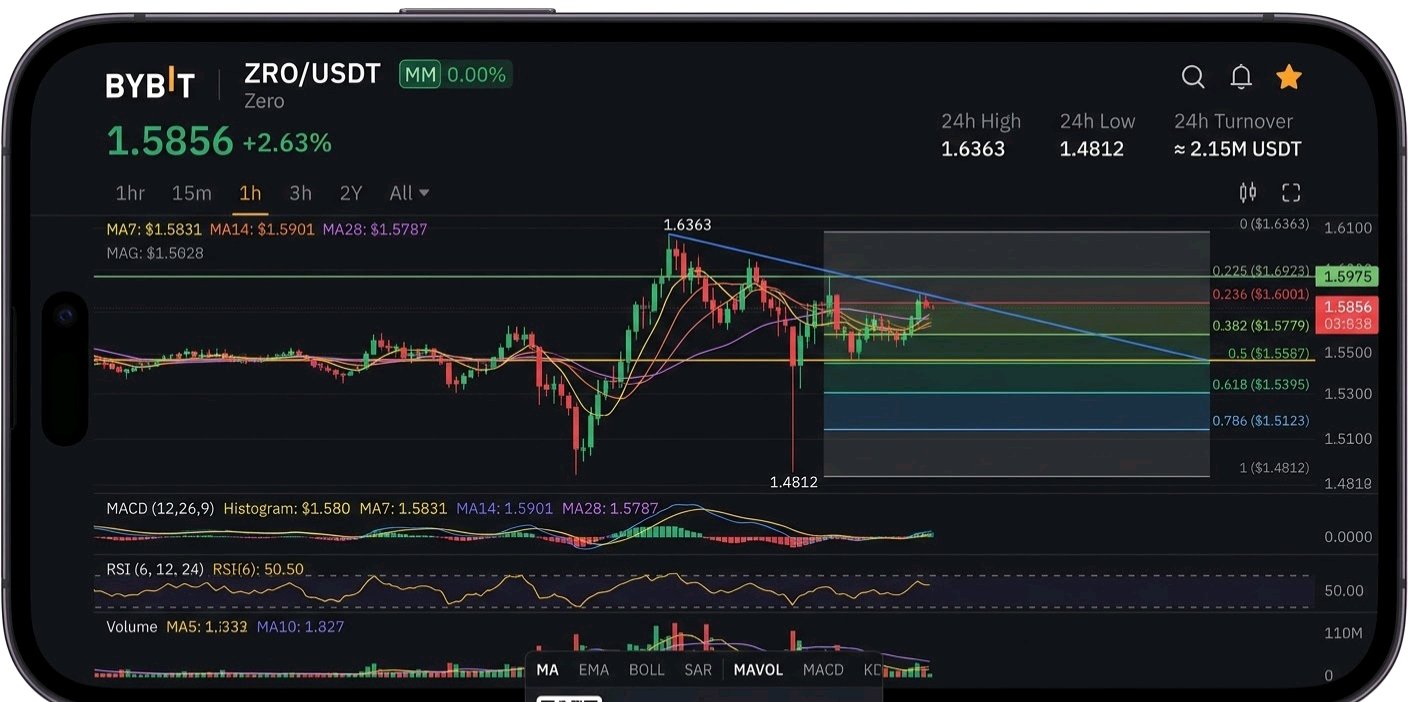
ZROは押し目買いが入った後、静まり返っている。この静けさが重要だ。 ZROは1.4812ドルの安値からV字回復を見せ、1.5856ドル(+2.63%)となっている。1時間足チャートは現在、1.6363ドルの高値の下で狭いレンジに収束している。 回復は力強く見えるが、1.6363ドルでの反落以降の値動きは、高値を切り下げる展開が続いている。直近の押し目では1.55ドル付近を掃う動きもあった。売り手が一時1.52ドル付近まで価格を押し下げたが、長いヒゲをつけて買い手が吸収し、価格は急反発した。これは失敗に終わったリクイディティ(流動性)の取り込みであり、多少なりとも建設的な動きと言える。 しかし、私が確認できていないのはその後の追随だ。現在のローソク足の出来高は約19Kで、5期間移動平均(34K)と10期間移動平均(28K)の双方を大きく下回っている。直近の動きで唯一大きな出来高を伴ったのは陰線であり、その後の反発は薄いものだった。 移動平均線も同様に方向感のなさを表している。MA7(1.5831ドル)、MA14(1.5901ドル)、MA28(1.5787ドル)が約1セントの範囲内に密集しており、価格はその全ての上に位置している。これはトレンドではなく、収束(コンプレッション)だ。板状況を見ると、買い注文45%に対し売り注文55%となっており、わずかな警戒感を示している。これはあくまで瞬間的なスナップショットであり、単独で重きを置くべきではないが、出来高の減少と矛盾するものではない。 今後の注目点: - 強気の確認:5期間移動平均を上回る出来高を伴い、1時間足が1.5975ドルを超えて確定すること。これにより高値切り下げの連続が反転し、次は1.6363ドルの試す展開となる。それを超えて確定すれば、この回復が単なる一時的な反発以上のものだと証明される。 - 警戒サイン:1.5587ドルのラインを再び下回って確定すること。そうなれば、ヒゲによる安値更新は罠に見え、1.52ドルのヒゲ安値が注視すべき水準となる。そこを割れば、1.4812ドルの安値が再び意識されるだろう。 現時点で確定したトレードはない。価格はレンジの中央に位置しており、レジスタンスを突破するか、サポートを再テストするまでは、ロングのエントリーはリスク・リワードが悪くなる。方向性を予測するよりも、レンジが解消されるのを待つ方が賢明だ。 押し目は買われた。今重要なのは、誰かが1.5975ドルを突破するために高値を買ってくるかどうかだ。 投資助言ではない。1時間足チャートのみに基づいた分析であり、ニュースやカタリストは確認していない。 $ZROUSDT #IMPACTbyTrade
SUI just gave back 38% of its rally and stopped exactly where it needed to SUI ran from 0.7646 to 0.8280 in a few hours, a move of about 8.3%. It has since pulled back to 0.8036, which is almost exactly the 38.2% retracement of that leg (about 0.8038). The market is now pausing at the first level that tells you whether the move had real demand behind it. The most interesting candle isn't the spike. It's the large red hourly candle after it. That sell-off drove price down to roughly 0.7985, right into the cluster where MA14 (0.7979) and MA28 (0.7984) sit. It then recovered most of the candle, leaving a long lower wick. Sellers got their flush, and buyers defended the moving-average cluster anyway. Right now that looks like a pullback, not a reversal. But it isn't confirmed. What I'm still not convinced by - Price is below MA7 (0.8087), and the last few candles are red. Short-term momentum has cooled. - The order book is roughly balanced, 48% buy to 52% sell. Nobody is clearly in control at this price. - 0.8087 is the first level that matters. Until SUI reclaims it, this is a bounce attempt, not a trend. The risk/reward problem Suppose I wait for a clean hourly close above 0.8087 and use 0.7975 as invalidation, just under the MA cluster. That's a hypothetical setup, since no entry exists yet. - Target 0.8158: about 0.59R. That is not worth taking. - Target 0.8280: about 1.65R. This is the only target that justifies the risk. So chasing the first pop toward 0.8158 pays poorly. The trade only makes sense if you expect a full retest of the 0.8280 high, and that high still has to be cleared. What invalidates it An hourly close below 0.7979 means the MA support failed, and the 0.7646 low comes back into play. That would turn the wick into a trap instead of a defense. My view: the dip-buyers showed up where they should, but they haven't been tested again yet. The next test is 0.8087. Note: this is based only on the chart in your screenshot (1h, 13 Nov, 21:23). I didn't check news, unlocks or derivatives data, so add any catalyst you know of before posting. This isn't financial advice. $SUIUSDT #IMPACTbyTrade

INJ's rally was one candle, not a trend INJ is up 11% to 8.183, but almost all of that move came from a single hourly candle. Volume shows the same thing: one spike to about 3.29K, while nearly every other bar on the chart is flat. That is how a burst of aggressive buying looks, and it is not yet a sustained trend. Before that, INJ bled lower under all three moving averages until it swept the 7.172 low with a long wick and snapped back. Buyers defended that level immediately. The 1h MA7 (7.943) has now curved up through MA14 (7.659) and MA28 (7.548), and price sits above all of them. That is a real change in short-term structure. I'm not trusting it yet, for three reasons: - Price is already roughly 8% above MA28 after a near-vertical run. The averages haven't caught up, so a pullback toward MA7 would be normal and healthy. - The 8.352 high was rejected, and the candle right after it printed red with a wick. That is a pause at resistance, not a breakout. - The 24h turnover is only 29.66K. On a pair this thin, one large order can create a move like this, and it can disappear just as fast. What I'd need to see - Bullish: a hourly close above 8.352 that holds on a retest. Until then, this is only a touch of resistance. - Weakening: a drop back into the body of the spike candle, roughly the 7.9 area by my read of the chart. That would suggest the move was a one-off squeeze with no follow-through. I wouldn't chase this. No entry or stop has been established, so any trade here is hypothetical until price confirms. The best entries usually come after the first pullback is defended, not at the top of a vertical candle. The question now is whether the volume returns on the next push or stays on that single bar. $INJUSDT #IMPACTbyTrade

SOL took the 77.85 liquidity and snapped back, but the bounce hasn't earned my trust yet The selloff to 77.85 was violent, and the reversal was almost as fast. Solana has now climbed back above its 7, 14 and 28-period MAs on the 1h chart. That is the first time it has closed above the 28 MA (around 80.86) since the drop began. Here's what bothers me. The MA28 had been capping every bounce since the 84.82 high, so reclaiming it matters. But look at the volume. The washout candles printed the heaviest bars on the chart, while the current push shows only 3.51K against a 5-period average of 2.51K. A move up through the average is fine, but the sellers who dumped into 77.85 were far louder than the buyers now lifting price. The price is also sitting at a very specific spot. The 84.82 → 77.85 range is about 6.97 points, and the 61.8% retracement lands near 82.16. The last candle printed 82.04 and stalled right under it. A V-shaped recovery that stops at the golden pocket is where I want to see a clean close above, not a wick. What I'm watching Bullish confirmation: an hourly close above ~82.2 that holds on a retest, with volume expanding. The next resistance is 83.07, then the 84.82 high. Healthy pullback: a retest of the MA28 area (~80.9) that holds. A hypothetical setup there, with invalidation below ~79.6, would give roughly 1.5R to 83.07 and about 2.7R to 84.82. That is a scenario, not a signal, and I haven't established an entry. Failure: a loss of the MA cluster and the 79.6 area would turn this into a sweep followed by a dead-cat bounce. The sweep is done. Whether the recovery is real depends on whether buyers show up when price meets 82.2. $SOLUSDT #IMPACTbyTrade

BNBは安値から17ポイント反発しましたが、この反発はまだ何も証明していません。 BNBは688.15から622.55まで約9.5%急落しました。この売り圧力のローソク足は、チャート上で最大の出来高を伴っていました。それ以降の反発は静かなもので、緑色のローソク足が出るたびに出来高が減少しています。 価格は現在640.12(前日比-3.32%)で、14期間移動平均線(639.76)のちょうど上に位置しています。7期間移動平均線(635.90)は回復しましたが、28期間移動平均線(649.03)は依然としてその上にあり、下向きの傾斜を維持しています。3本の移動平均線はいずれも弱気な順序(パーフェクトオーダーの逆)で並んでいます。買い手は短期の移動平均線を取り戻しましたが、重要な移動平均線にはまだ手をつけていません。 今回の反発は、下落幅全体の約27%を戻したに過ぎません。フィボナッチ・リトレースメントの38.2%水準は647.6付近で、28期間移動平均線とほぼ重なっています。50%水準は655.35です。つまり、最初の正念場は、トレンドのレジスタンスと最初のフィボナッチ・リトレースメントが重なる648〜649付近となります。 私が懸念しているのは出来高です。急落時は出来高が膨らみましたが、回復局面は薄いままです。直近のローソク足の出来高は約202で、5期間平均の537と比べて低水準です。これは安堵の買い戻しであり、確信を持った買いではありません。 オーダーブックは買い注文がわずかに多く、53対47となっています。これは微かなプラス材料ですが、オーダーブックはすぐに変化するため、これを根拠に戦略を立てるべきではありません。 注目すべきポイント - 1時間足の終値で649を上抜けること。理想を言えば、出来高が減少ではなく増加していること。 - 次に655.35、その次に24時間高値の662.39を目指す動き。 - もし価格が7期間移動平均線の635.9を割り込み、ここから反落すれば、安値622.55が再テストされる。 - 622.55を下回って引ければ、回復のシナリオは無効となる。 私は、出来高が減少する中で下落中の移動平均線に頭を抑えられているようなローソク足は追いかけません。ここには確定したエントリーポイントはなく、注視すべき水準があるだけです。BNBが649を超えて引けるまでは、これは下降トレンド内の一時的な反発に過ぎません。 あくまでチャート分析のみです。ニュースや上場関連、デリバティブデータは確認していないので、ファンダメンタルズの観点が必要な場合は各自で加えてください。 $BNBUSDT #IMPACTbyTrade

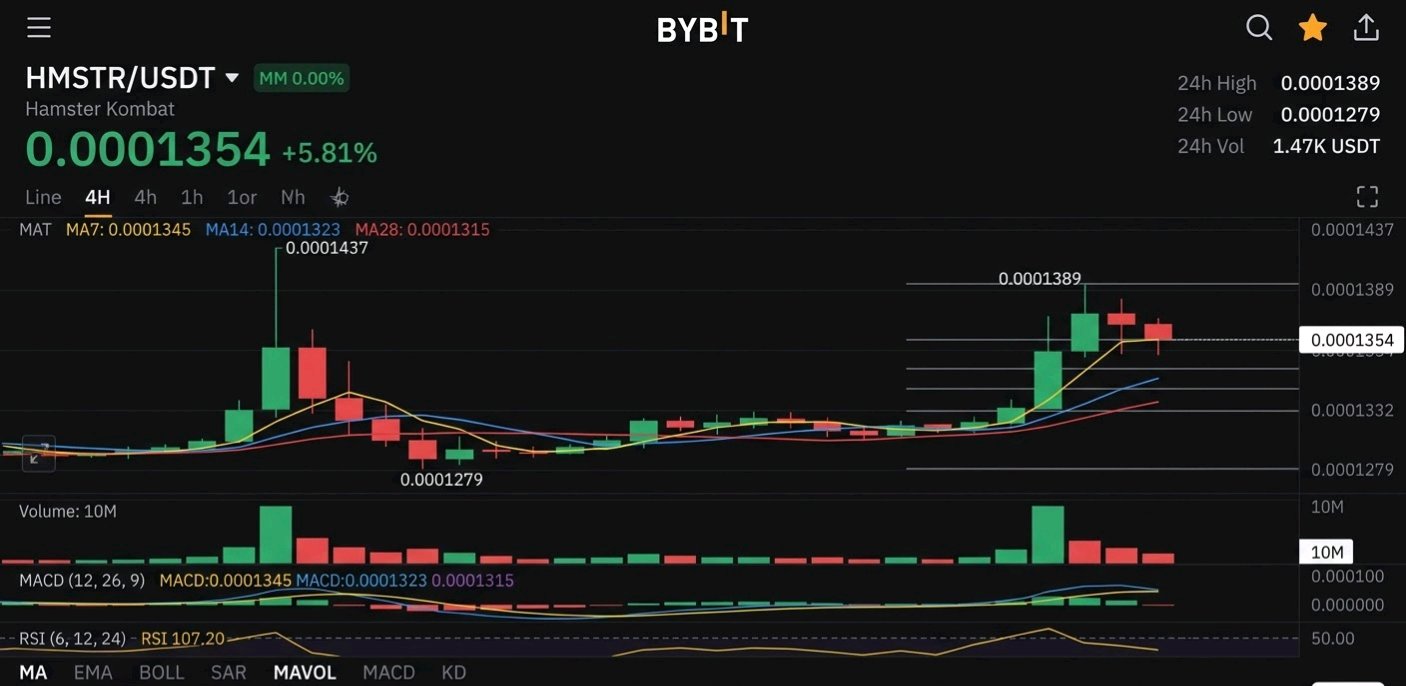
HMSTRは、11月8日の急騰で成し遂げられなかったことを、出来高を伴ってやってのけました。 4時間足チャートでの0.0001437への最初の上昇は、いわゆる「フェード(失速)」でした。買い手が殺到したものの売り手にヒゲを叩かれ、わずか2日で上昇分をすべて吐き出し、0.0001279までタッチしました。あれは追随を伴わない単なるスパイク(急騰)でした。 今回は違います。0.000128から0.000132の間で約2日間の静かなベース形成を経て、ブレイクアウトのローソク足はチャート上で最大となる約10Mの出来高を記録しました。前回のスパイクはこれに遠く及びませんでした。現在価格は0.0001354で、MA7(0.0001345)、MA14(0.0001323)、MA28(0.0001315)を上回っており、短期移動平均線が長期移動平均線の上に積み重なるパーフェクトオーダーの形になっています。このチャートにおいて、これが初めての明確な強気アライメントです。 しかし、まだ確定ではありません。ブレイクアウトは0.0001389で頭を抑えられ、長い上ヒゲを残し、次の4時間足は陰線で引けました。買い手が押し上げ、売り手が応戦し、現在はその中間で推移しています。 今後の注目ポイント - 0.0001389を上抜けて4時間足が確定し、上ヒゲを「奪還」できるか。 - MA14とMA28が密集する0.0001318~0.0001323のゾーンで押し目を形成できるか。0.0001301(24時間安値)を割り込むと、今回のブレイクアウトは無効になります。 純粋に仮説としてのセットアップですが、0.0001354でエントリーし、ストップを0.0001300以下、第一ターゲットを0.0001437に置くと、リスクリワードは約1.5Rとなります。これは許容範囲内ですが、エキサイティングとは言えません。今ここで追随するよりも、0.000132付近へのプルバックを待つ方が、リスクリワード比は大幅に改善されます。 注意点 オーダーブックは買い注文94%、売り注文6%となっており、強気に見えます。しかし、24時間の売買代金は約1.47Kに過ぎないため、板は薄く、簡単に動かされたり、見せ板(スプーフィング)であったりする可能性があります。次の上昇局面でも実質的な出来高が維持されるまでは、確信を持って判断するのは控えるべきでしょう。 セットアップは先週より改善していますが、依然として0.0001389を奪還する必要があります。 投資助言ではありません。 $HMSTRUSDT #IMPACTbyTrade

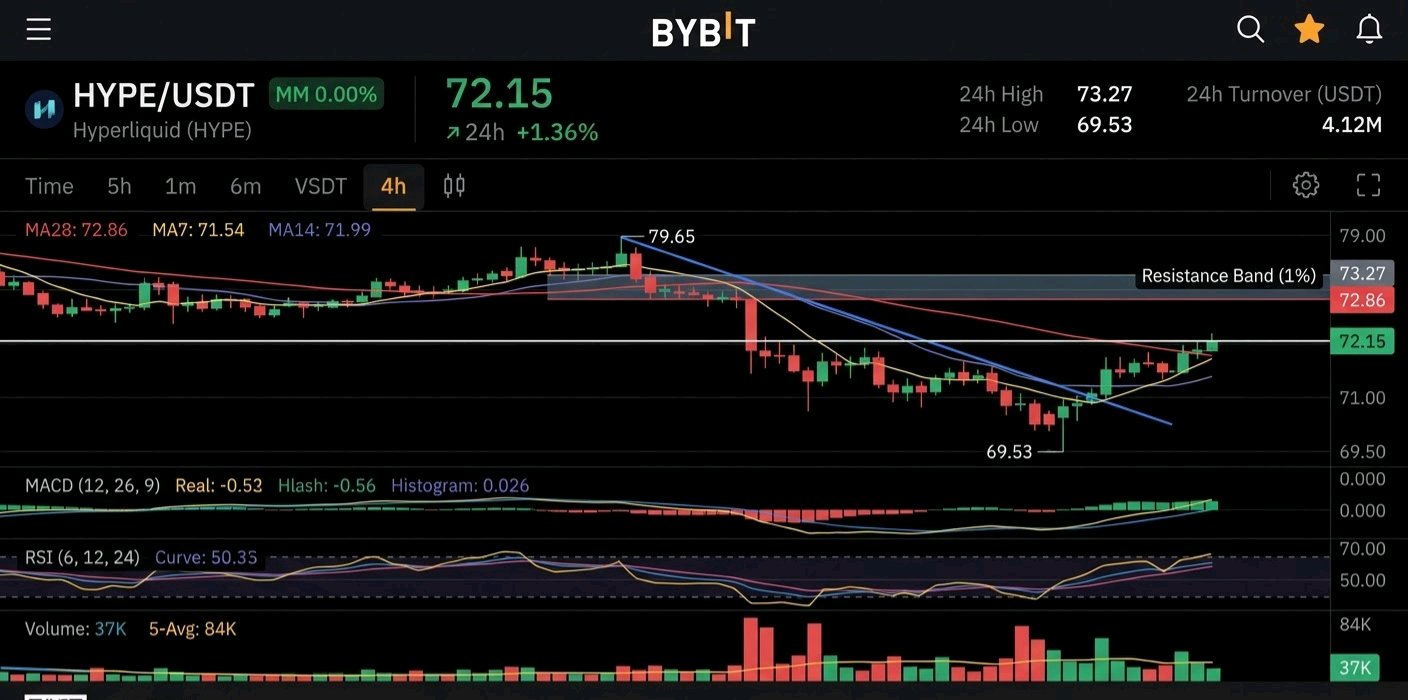
HYPEがついに反発しました。真の試練は、数時間前に拒否されたラインです。 HYPEは79.65のスイングハイから69.53の安値まで約12.7%下落しました。現在は72.15に戻しており、日次で1.36%上昇しています。 反発そのものは興味深い部分ではありません。価格レベルこそが重要です。 4時間足のMA28は72.86に位置しており、前回の拒否はこのエリアから発生しました。24時間高値の73.27はそのすぐ上にあります。つまり、現在の価格の約1%上にレジスタンスバンドがあり、買い手が再びぶつかるまでにはほとんど余裕がありません。 私にとって注目すべき点が2つあります。 買い手が安値を2回守ったことです。69.5から70のゾーンで鋭い下ヒゲが2本形成され、2本目の安値は少し切り上がっています。これは明確な下降トレンド後の吸収の最初の兆候です。 反発にはまだ出来高が伴っていません。高い出来高のバーはすべて売りの中にあります。現在の4時間足の出来高は37Kで、5期間平均の84Kに対して低いです。まだ形成中なので深読みはしませんが、回復には参加が必要です。 MA7(71.54)とMA14(71.99)は現在フラットで価格の下にありますが、MA28は依然として下向きです。価格は短期平均線を取り戻しましたが、トレンドまでは取り戻せていません。 リスク・リワードの問題です。例えば、73.27を上回る4時間足の確定を待つとします。これは仮想的なエントリーであり、シグナルではありません。69.53で無効化する場合、約3.7のリスクを負うことになります。最初のターゲットである75.98付近のリターンは約2.7で、これは約0.7Rに相当します。79.65までの完全なリトレースメントであっても、約1.7Rに過ぎません。確認を待つと値動きの多くを逃すことになり、レジスタンスに向けて追いかけるのが魅力的ではないのと同じ理由です。 私が必要としている確認事項: 73.27を上回る4時間足の確定。理想的には10期間平均を上回る出来高を伴うこと。 そのゾーンの再テストがサポートとして機能すること。 もし69.53を割り込めば、ダブルボトムのアイデアは消滅し、79.65の高値は関連性を失います。 それまでは、これは下落する移動平均線の下でのリリーフラリー(自律反発)に見えます。トレンド転換は確認されていません。 $HYPEUSDT #IMPACTbyTrade