AlphaWhaleX
2452いいね0シェア24ファン29フォロー
🐋 The mindset of a whale... and the vision of a pro! 📈 I read market movements and seek out exceptional opportunities. 🎯 Well-thought-out deals... ambitious goa
🐋 The mindset of a whale... and the vision of a pro! 📈 I read market movements and seek out exceptional opportunities. 🎯 Well-thought-out deals... ambitious goa
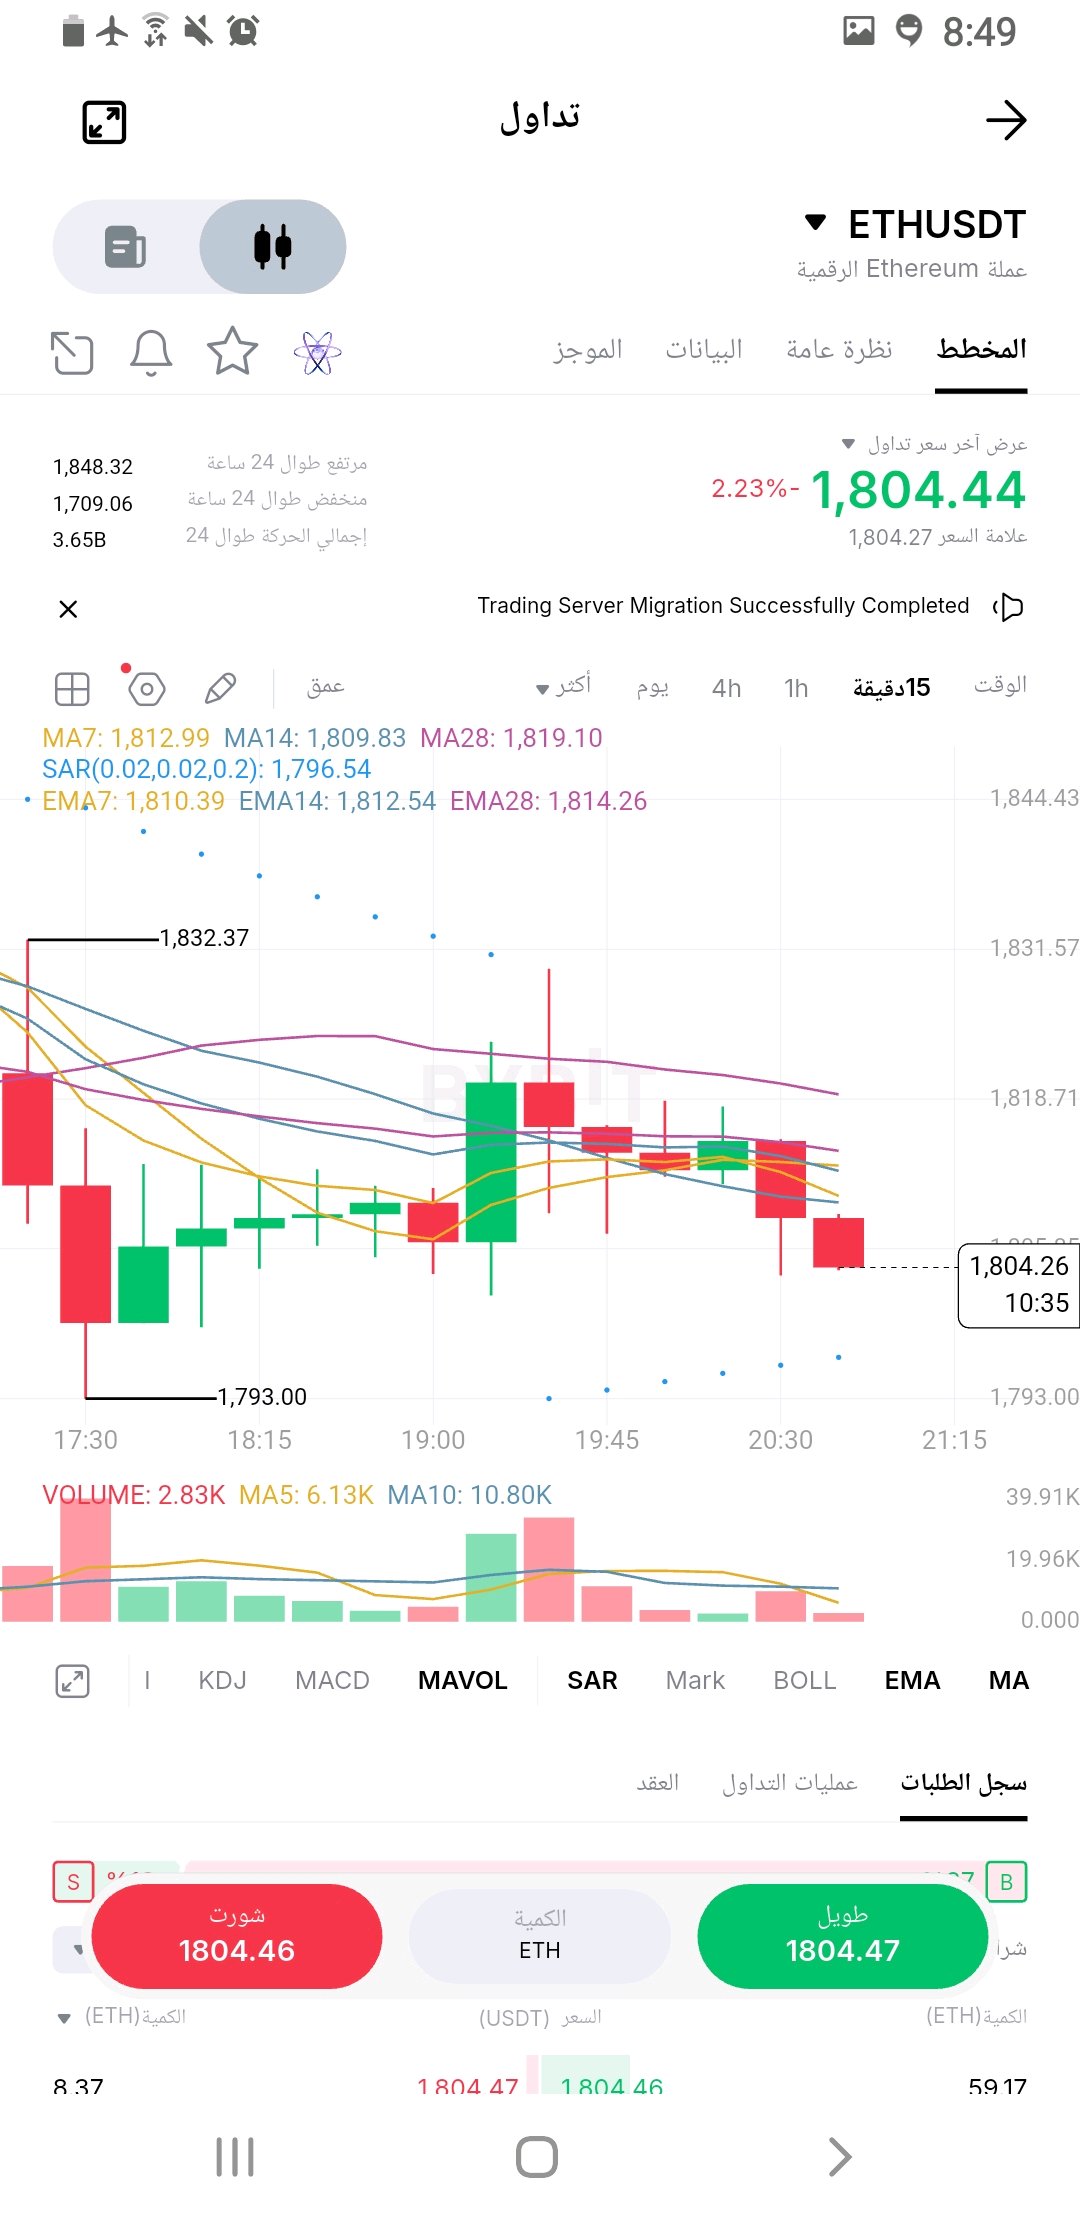
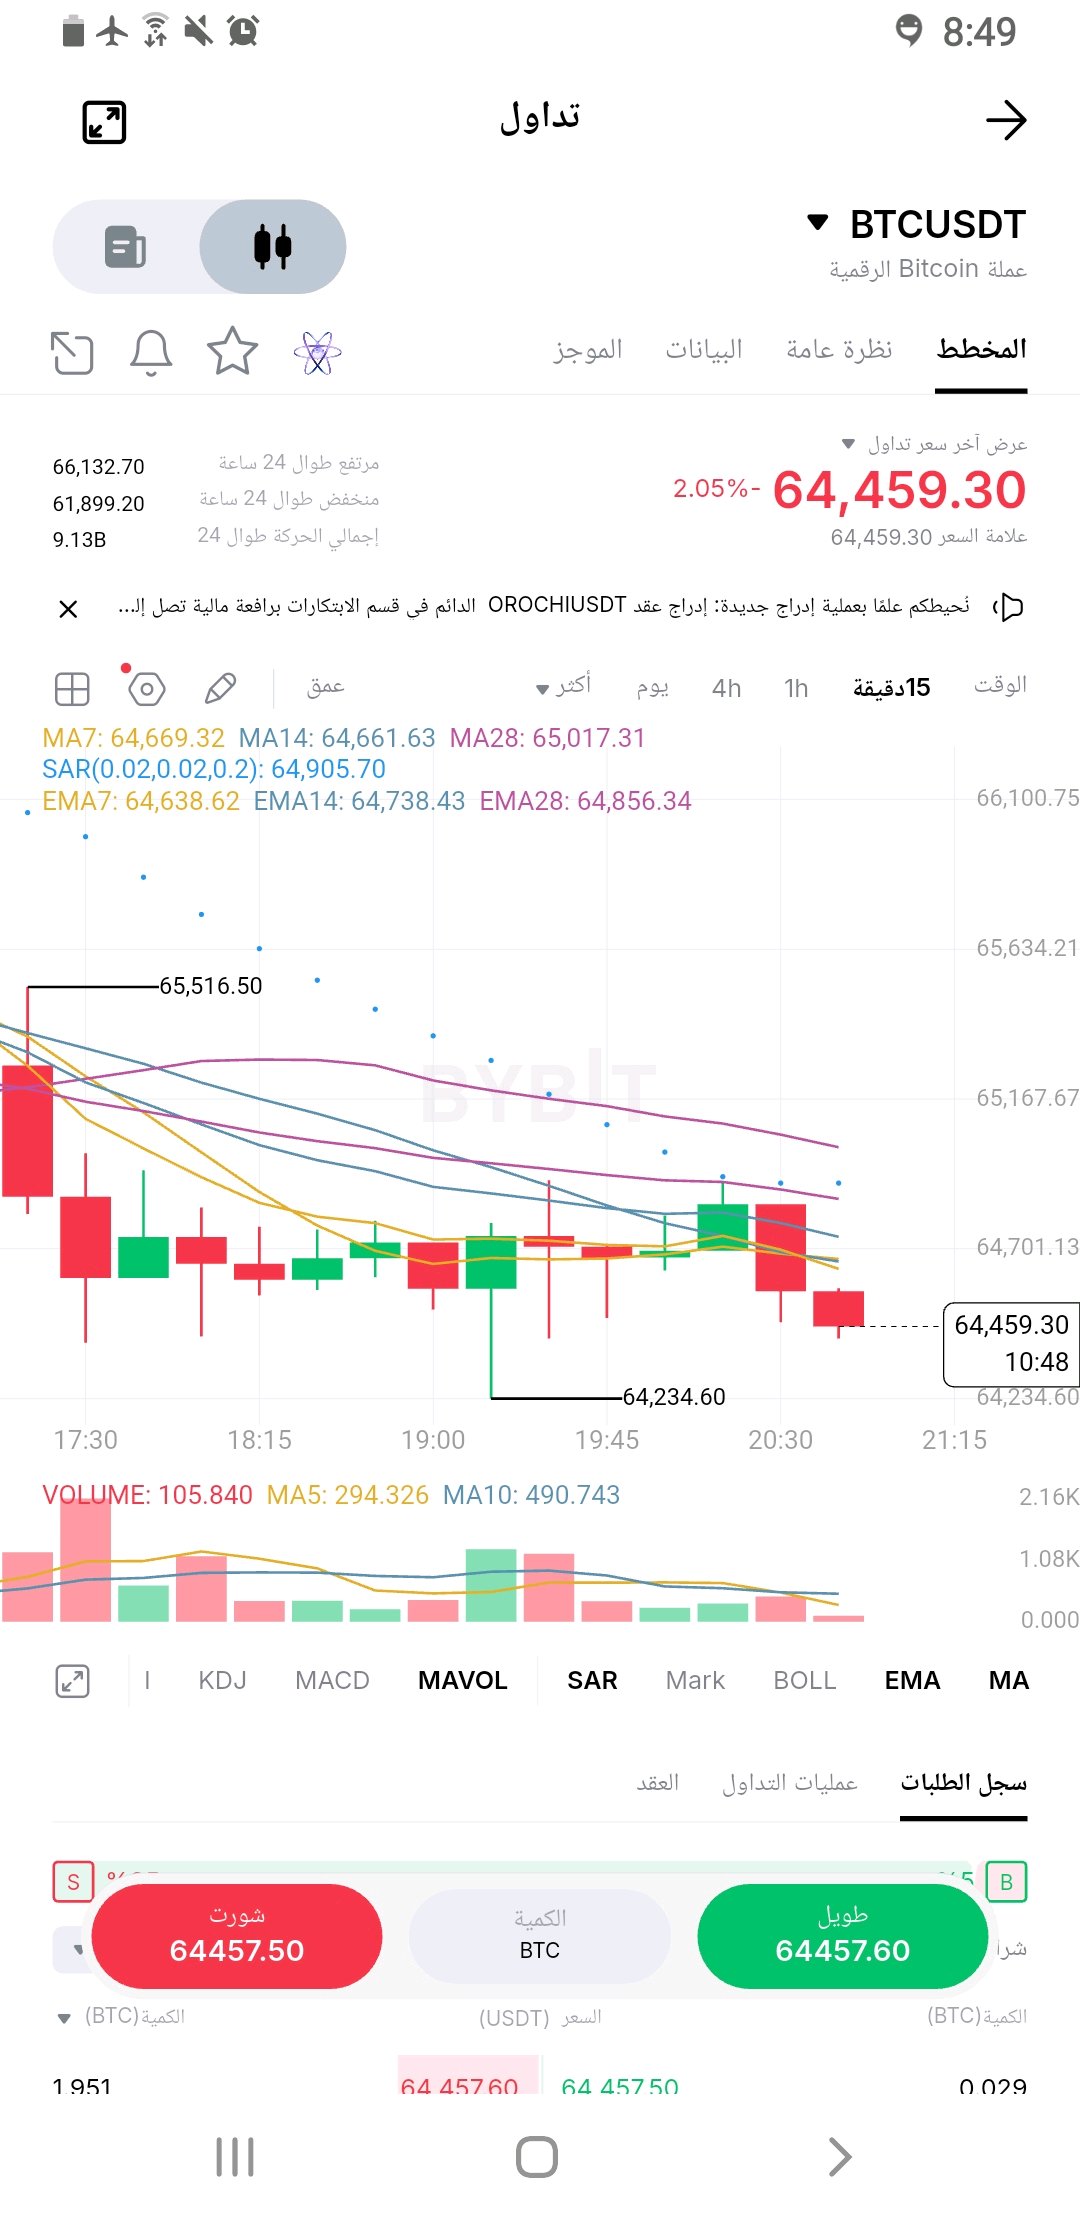
#ByXIMPACT 🚨 Quick Analysis: Will We See a Rebound or Continued Downward Movement? (BTC & ETH) Content: I'm closely monitoring the market on the 15-minute timeframe. Here's what I see right now on the #BTC and #ETH charts: 📉 Bitcoin ($BTC): The price is trading at 64,459, below all short-term moving averages. The SAR (dots) indicator is above the price, increasing the selling pressure. The recent low at 64,234 is the first line of defense. A break below this level would target 64,000, while a return above 64,856 (EMA28) would give a positive signal. 📉 Ethereum ($ETH): The situation is similar. The price is at 1,804, with strong support concentrated at 1,793. The first resistance is the EMA28 at 1,814. If the selling continues, I will be watching 1,793 very closely for a quick buying opportunity. 🎯 My Plan (Risk Management): · I won't enter any trades now until I see confirmation (15-minute candle close). · If BTC breaks the 64,234 level, I will open a short position with a target of 64,000 and a stop loss at 64,400. · If ETH bounces off 1,793, I will buy with a target of 1,814. 💼 My Real Data: (I've attached a screenshot of any real positions you open here, or delete this line if you haven't entered a trade yet). 👉 If you want to follow these trades yourself, you can click on the Trading component below. $BTCUSDT $ETHUSDT #WSOT2026 #USPPITestsTheHigherForLongerTrade
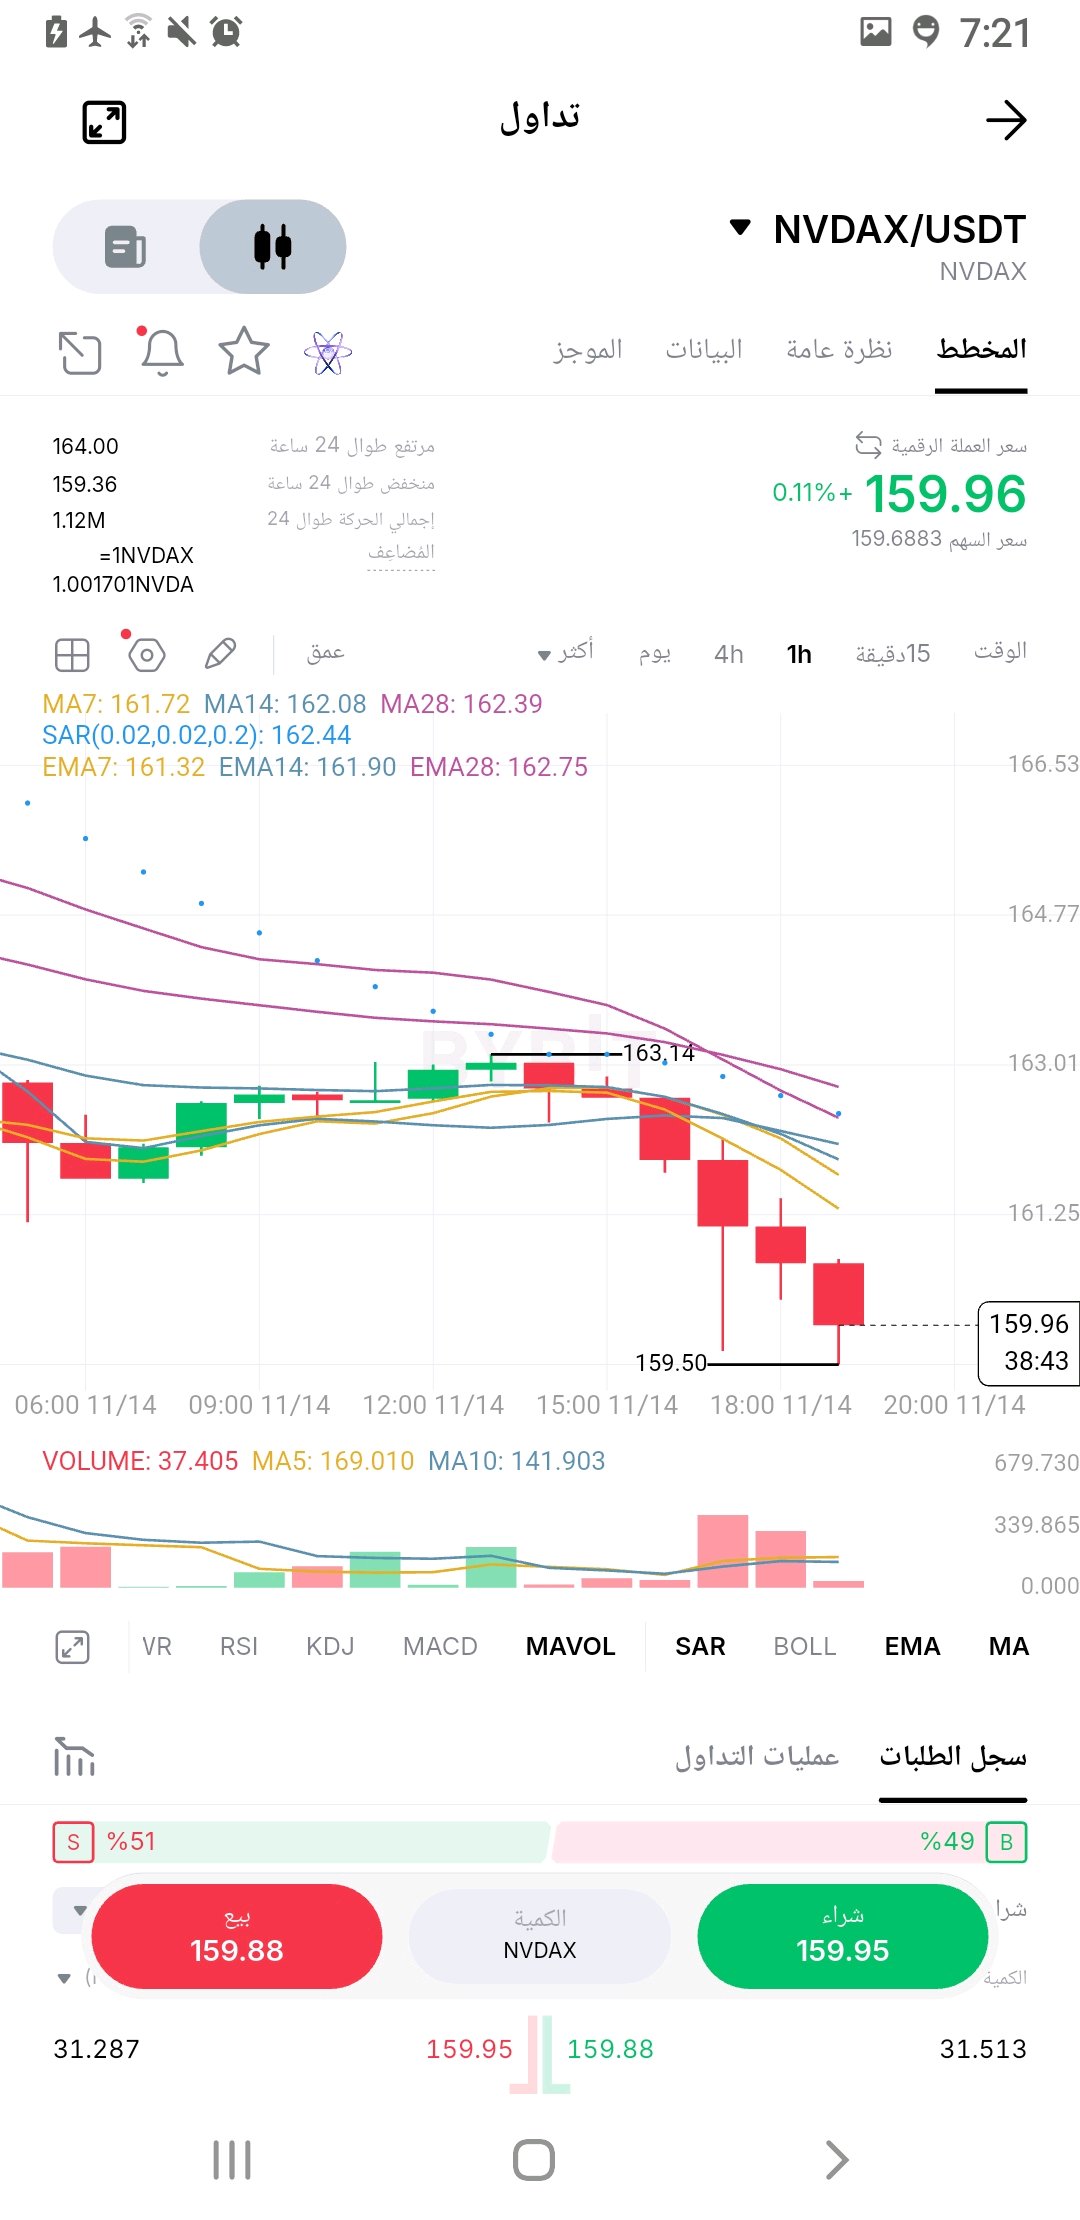
#ByXIMPACT *NVDAX**: # NVDAX Analysis: Rare convergence of Nvidia repricing, leadership shock, and high-stakes earnings 🚨📉 NVDAX is facing a rare combination of circumstances: a sharp repricing of NVIDIA shares, a leadership shock, and a major earnings event just days away. This is no longer just momentum trading in the artificial intelligence sector. Trading near **$162**, NVDAX has fallen roughly 3.2% over 24 hours and 13.9% over seven days. The stock is down about 33% from its October high of $242.89. The recent daily range spans between $158.67 and $171.80. Buyers are defending the floor, but a recovery remains uncertain as long as the price stays below $171.80. The biggest catalyst is NVIDIA's official announcement on November 12: Jensen Huang's resignation as CEO and the appointment of Chief Financial Officer Colette Kress as interim CEO. This marks a critical leadership shift at the heart of the artificial intelligence industry. NVIDIA states that its operations, customer commitments, and product roadmap are expected to continue without interruption, but investors still need proof of execution stability. The next major test will arrive on **November 17**, when NVIDIA reports its financial results for the third quarter of fiscal 2027. Revenue growth, data center demand, future guidance, and management commentary will matter far more than headline earnings alone. Strong results could restore confidence, but any weakness in guidance could reinforce the ongoing repricing process. There is also an important distinction regarding NVDAX itself. It is a tokenized tracking certificate designed to provide economic exposure to NVIDIA shares, backed 1:1 by the underlying securities according to the issuer. It does not grant standard shareholder voting rights. Furthermore, it trades around the clock, whereas the underlying US stock market is subject to specific trading hours, creating potential price gaps and liquidity differences outside those hours. Derivatives show elevated positioning: futures open interest stands at approximately $3.89 million, with funding hovering near **+0.1608%**. Futures trading volume is roughly 2.5 times larger than spot volume. This unusually positive funding indicates that leveraged long positions are paying heavily to maintain their positions, leaving the market vulnerable if the underlying stock weakens further. ### Key Figures * **Price:** ~$162 * **Market Capitalization:** ~$94 million * **24-Hour Change:** -3.2% * **7-Day Change:** -13.9% * **24-Hour Range:** $158.67 - $171.80 * **Distance from All-Time High (ATH):** ~33% * **Futures Open Interest:** ~$3.89 million * **Funding Rate:** +0.1608% * **Next NVIDIA Earnings:** November 17 ### Bullish Confirmation: Reclaiming the **$171.80** level and holding above it will serve as the first meaningful recovery signal. Strong earnings, resilient data center guidance, and the stabilization of NVIDIA shares could support a move toward the **$180** level. ### Bearish Confirmation: A decisive breakdown below **$158.67** will expose the risk of another downward wave. Weak earnings guidance or persistent leadership uncertainty could keep sellers firmly in control. NVDAX ultimately tracks the underlying business of NVIDIA, rather than an independent crypto narrative. The November 17 results are the primary upcoming catalyst. Until then, a bounce without confirmation from the underlying stock is not enough. #NVDAXUSDT #ByXIMPACT$NVDAXUSDT $NEARUSDT #WSOT2026 #WSOT أظهر تداولك بالذكاء الاصطناعي لتربح 10 USDT #USPPITestsTheHigherForLongerTrade #شركة SanDisk تعلن عن تقسيم الأسهم بنسبة 8 مقابل 1
Strong selling pressure
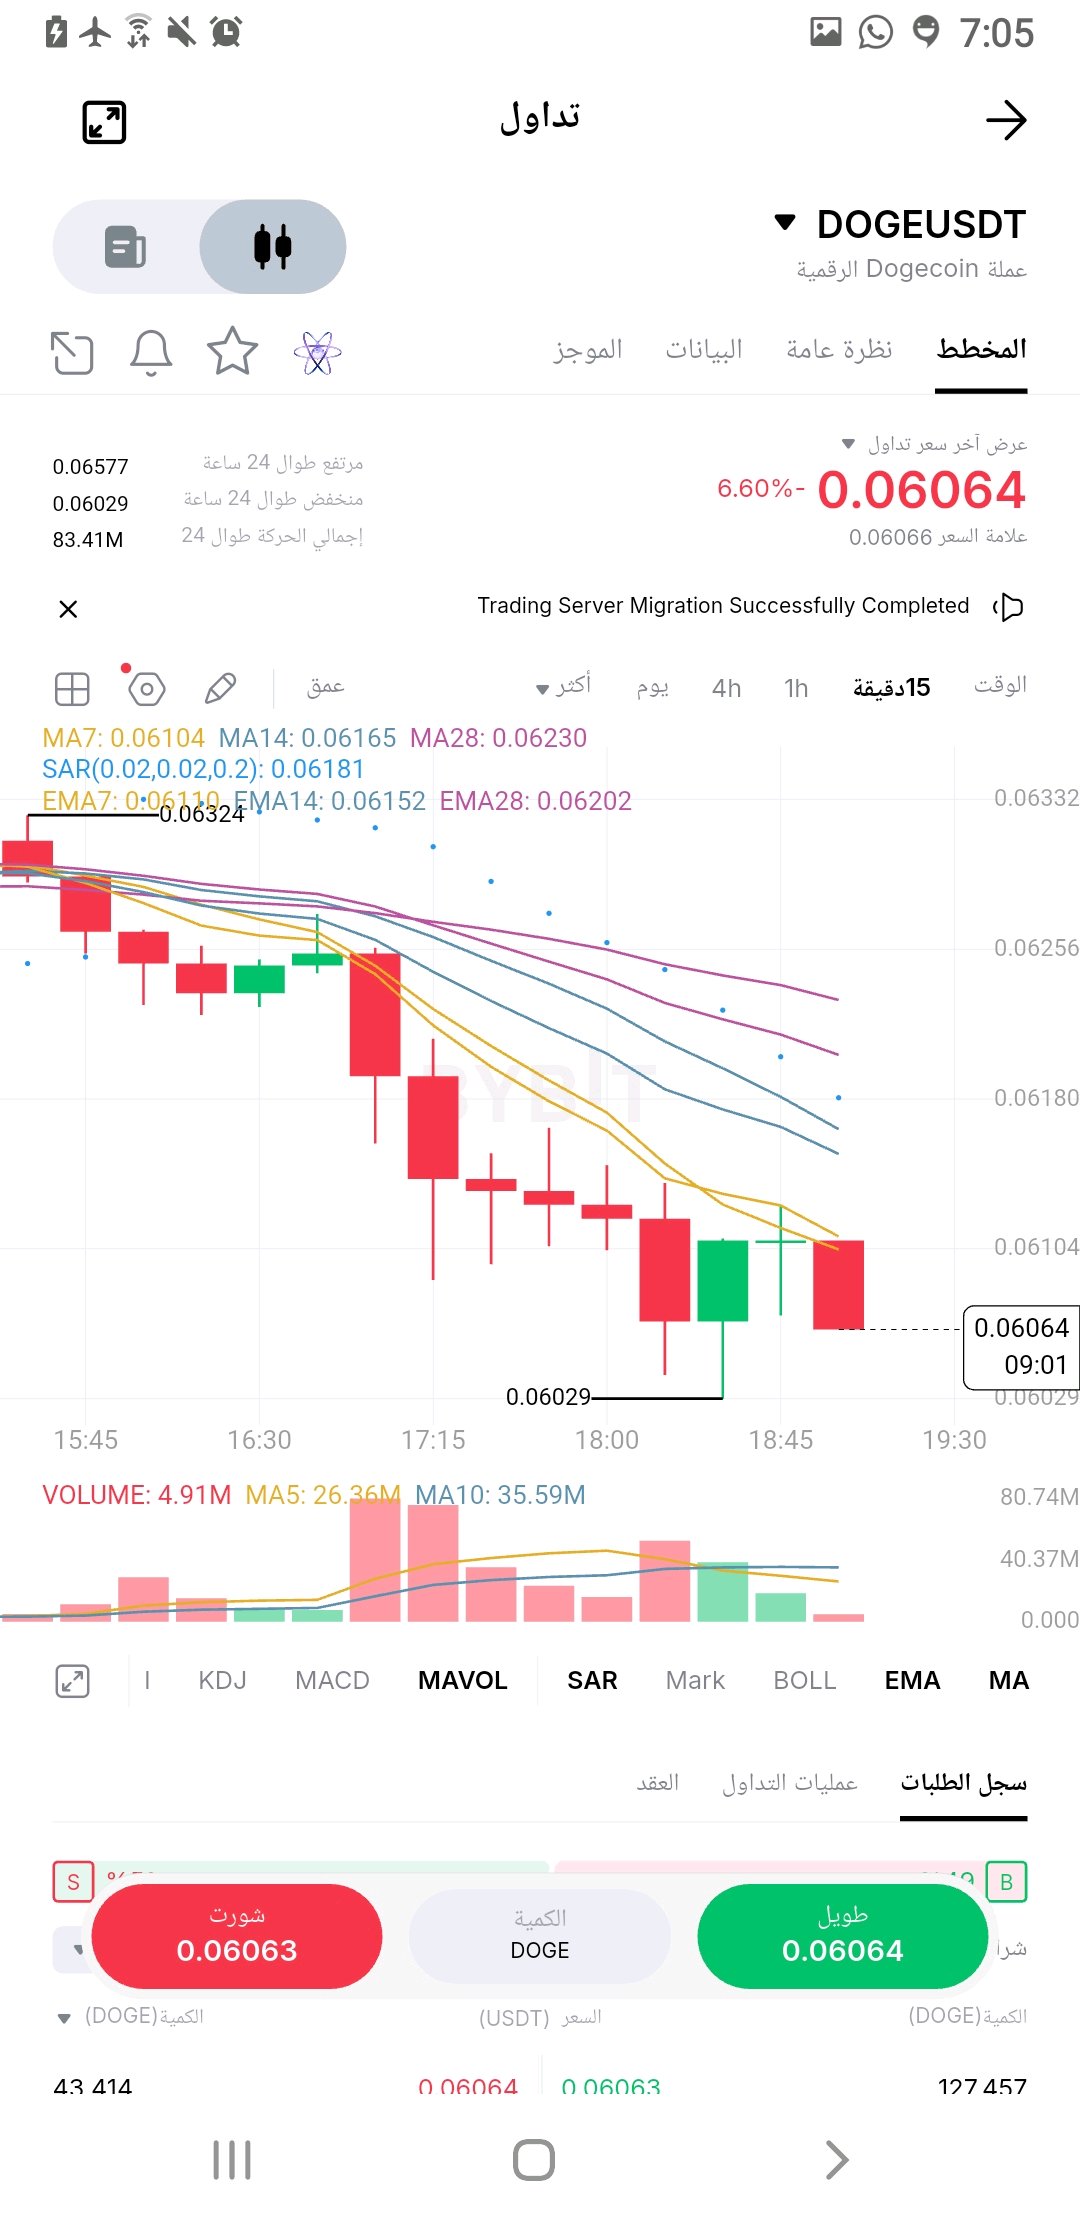
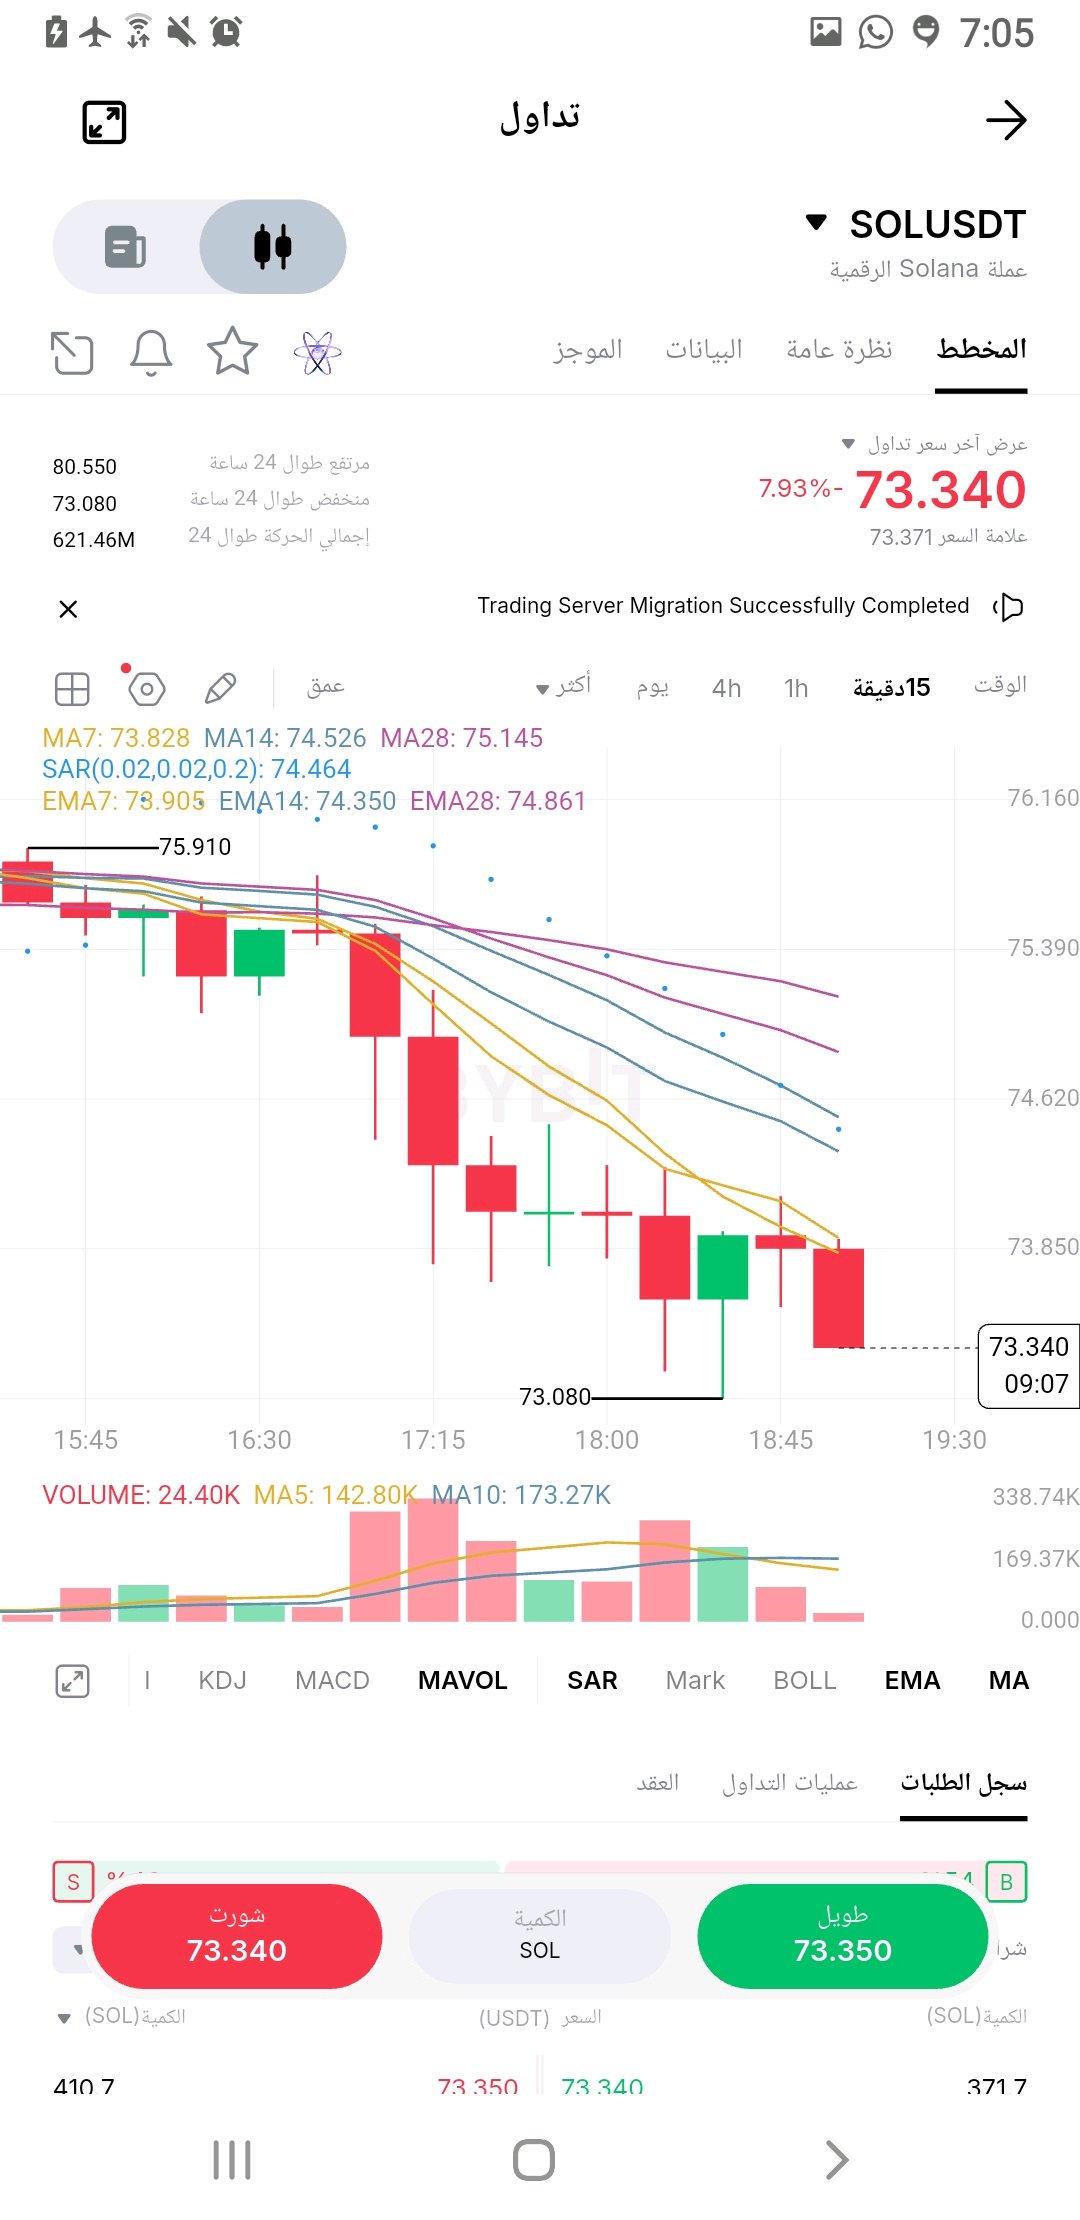
#ByXIMPACT 🚨 Clear collapse in DOGE and SOL... Will the bleeding continue or is a rebound imminent? 🔥 Two cryptocurrencies are under strong selling pressure on the 15-minute timeframe, and moving averages indicate a continuation of the downtrend. 🔴 $DOGE/USDT 💰 Price: $0.06064 📉 Trend: Down. 📍 Key support: $0.06029 🎯 First resistance: $0.06104 🎯 Next resistance: $0.06165 – $0.06230 A break below support could open the door for a further downward wave, while a recapture of $0.06165 could strengthen the chances of a rebound. 🔴 $SOL/USDT 💰 Price: $73.34 📉 Trend: Strongly bearish. 📍 Crucial Support: $73.08 🎯 First Resistance: $73.85 🎯 Next Resistance: $74.52 – $75.14 The price is trading below all major moving averages, and any bounce needs confirmation before the trend can be considered reversed. ⚠️ Message to traders: Don't chase bounces and don't rush to buy during a dip. Watch support and volume and wait for a clear signal. 🐻 Are we seeing new lows or is a bounce imminent? #DOGE #SOL #Crypto #Trading #Bybit #Altcoins DYOR | Risk Management First. ::: #WSOT2026 #WSOT أظهر تداولك بالذكاء الاصطناعي لتربح 10 USDT #USPPITestsTheHigherForLongerTrade #موجة بيع في تقنيات الذكاء الاصطناعي تمحو 2.5 تريليون دولار من مؤشر ناسداك 100 $SOLUSDT $DOGEUSDT
Downward with an attempted rebound
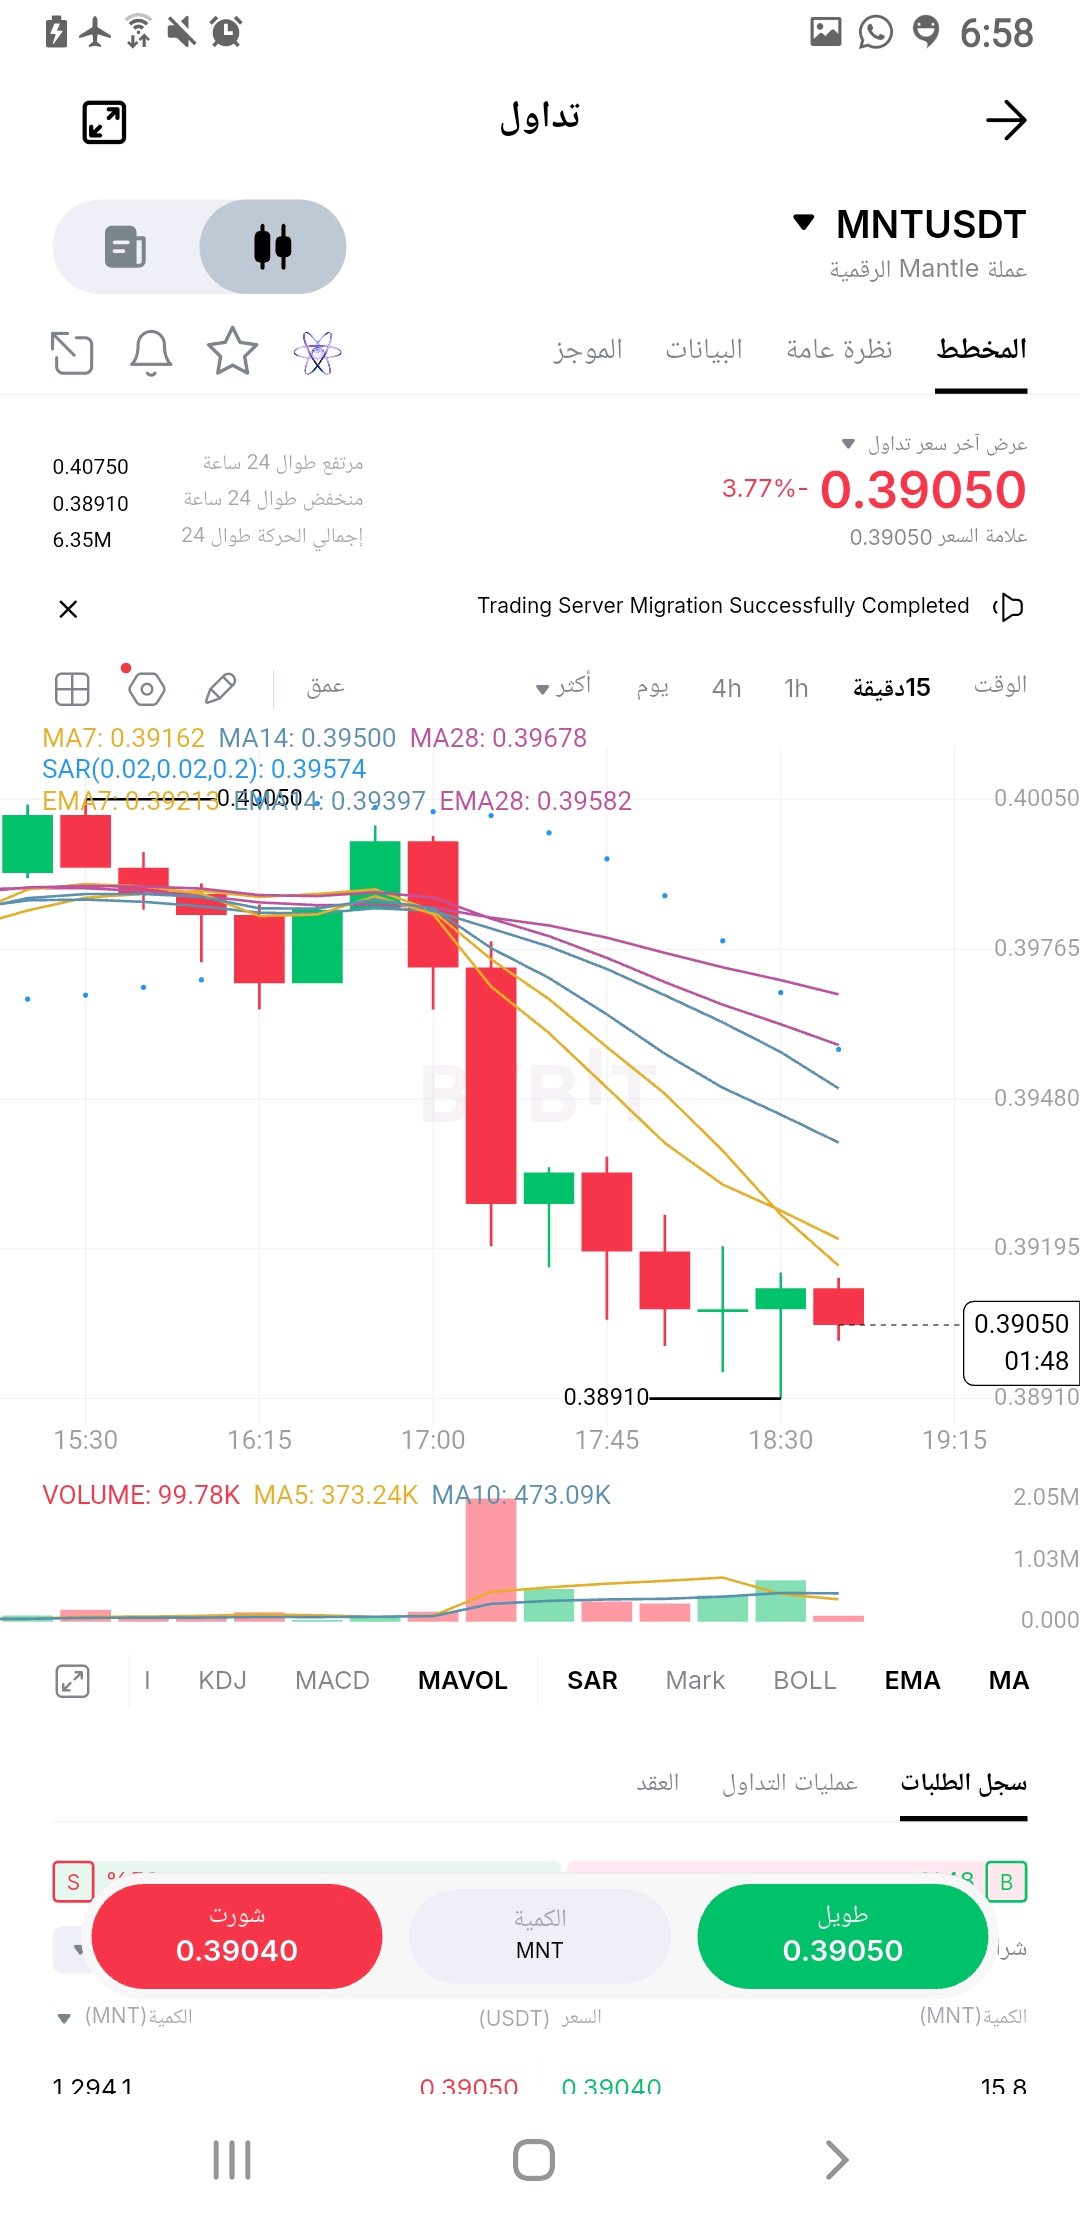
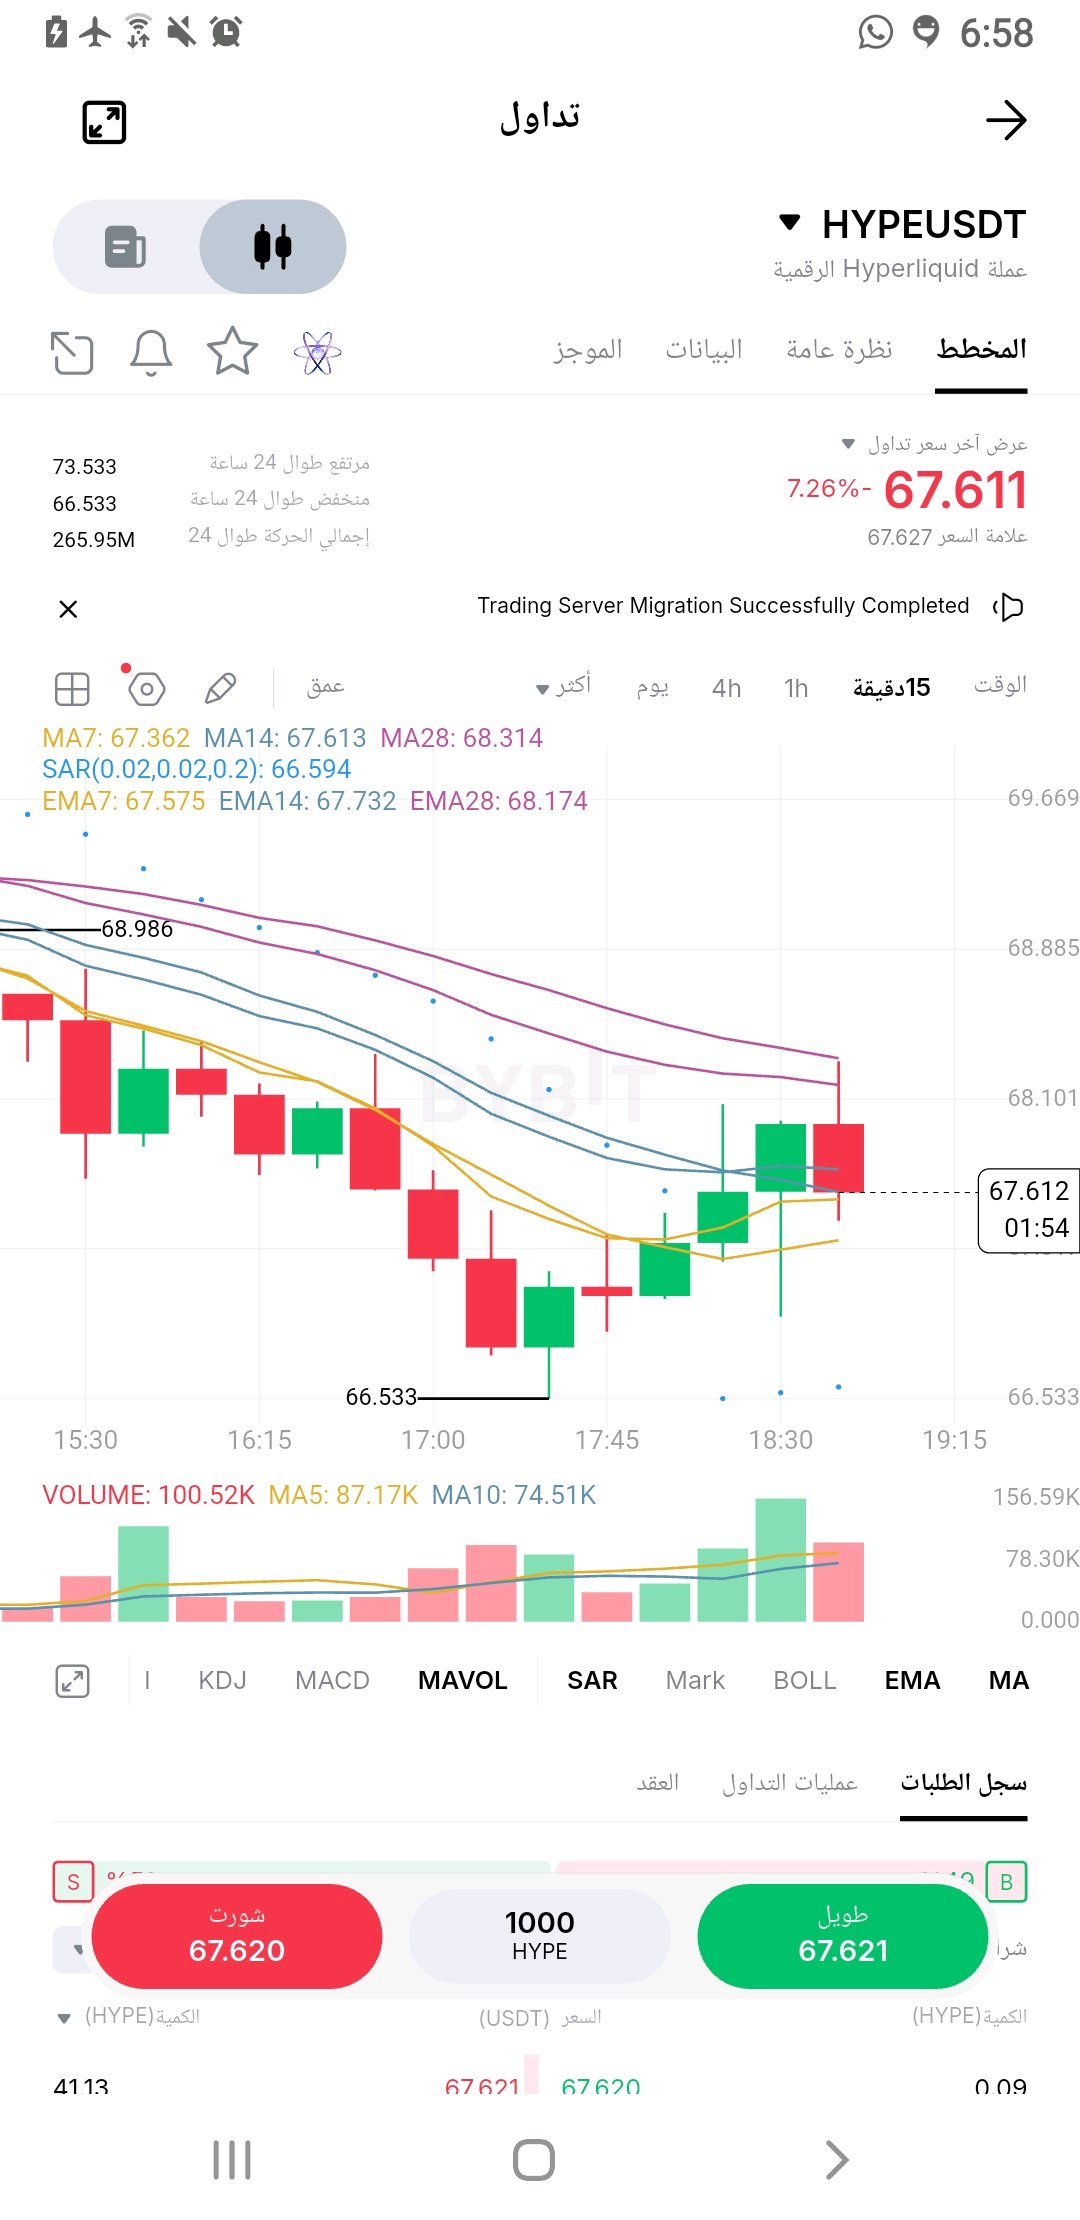
#ByXIMPACT 🚨 Two currencies under selling pressure... Will we witness a new decline or a sudden rebound? 🔥 🔴 $HYPE/USDT 💰 Price: $67.61 📉 Trend: Downward with an attempted rebound. 📍 Support: $66.53 🎯 Resistance: $67.73 – $68.17 A break above resistance and a sustained move above it could strengthen the chances of a recovery, while a break below support opens the door for further declines. 🔴 $MNT/USDT 💰 Price: $0.39050 📉 Trend: Clearly negative. 📍 Support: $0.38910 🎯 Resistance: $0.39200 – $0.39500 The price is below the moving averages, and the rebound remains weak without reclaiming the resistance levels. ⚠️ Conclusion: Don't rush into buying amidst the volatility. Wait for confirmation of the breakout or support breakdown, and monitor trading volume. What's your prediction? A bounce or a new downward wave? 👀 #HYPE #MNT #Crypto #Trading #Bybit DYOR – Not investment advice. #WSOT2026 #WSOT أظهر تداولك بالذكاء الاصطناعي لتربح 10 USDT #USPPITestsTheHigherForLongerTrade #شركة SanDisk تعلن عن تقسيم الأسهم بنسبة 8 مقابل 1 $HYPEUSDT $MNTUSDT
Bitcoin and Ethereum are under selling pressure
#ByXIMPACT 🚨🔥 A crash is putting pressure on Bitcoin and Ethereum! Is a bounce candle approaching, or is the downtrend not over yet? The market is entering a sensitive phase... and all eyes are on the key support and resistance levels! 👀 🟠 $BTC/USDT – Bitcoin | 15-minute timeframe 💰 Price: $65,648.10 📉 Decline: 3.64% Sellers continue to exert pressure, and the price is trading below the moving averages, with a limited bounce from the $65,035 area. 📍 First support: $65,035 🎯 First resistance: $65,753 🎯 Second resistance: $66,266 🎯 Third resistance: $66,739 🐂 A recap of $66,266 could support a recovery attempt towards $66,739. 🐻 A break below $65,035 could open the door for further selling pressure. ━━━━━━━━━━━━━━ 🔵 $ETH/USDT – Ethereum | 15-minute timeframe 💰 Price: $1,835.96 📉 Decline: 5.50% Ethereum is showing clear weakness, continuing to trade below the moving averages and approaching its low of $1,823. 📍 Pivot support: $1,823 🎯 First resistance: $1,845 🎯 Second resistance: $1,868 🎯 Third resistance: $1,887 🐂 A break above $1,868 could give buyers a chance to regain momentum. 🐻 A break below $1,823 could increase the likelihood of further declines. ━━━━━━━━━━━━━━ 🔥 In summary: Bitcoin and Ethereum are under simultaneous selling pressure, and the current rebound has not yet confirmed a trend reversal. 🚨 The most important question: Will we witness a strong rebound that revives the market, or is a new downward wave awaiting traders? 🐂 A bounce from support? 🐻 Or a collapse to lower levels? 💬 Share your predictions! ⚠️ Technical analysis, not a guarantee of profit. Wait for confirmation, and manage risk first. #BTC #ETH #Bitcoin #Ethereum #Crypto #Trading #Bybit ::: $BTCUSDT $ETHUSDT #WSOT2026 #WSOT أظهر تداولك بالذكاء الاصطناعي لتربح 10 USDT #USPPITestsTheHigherForLongerTrade @
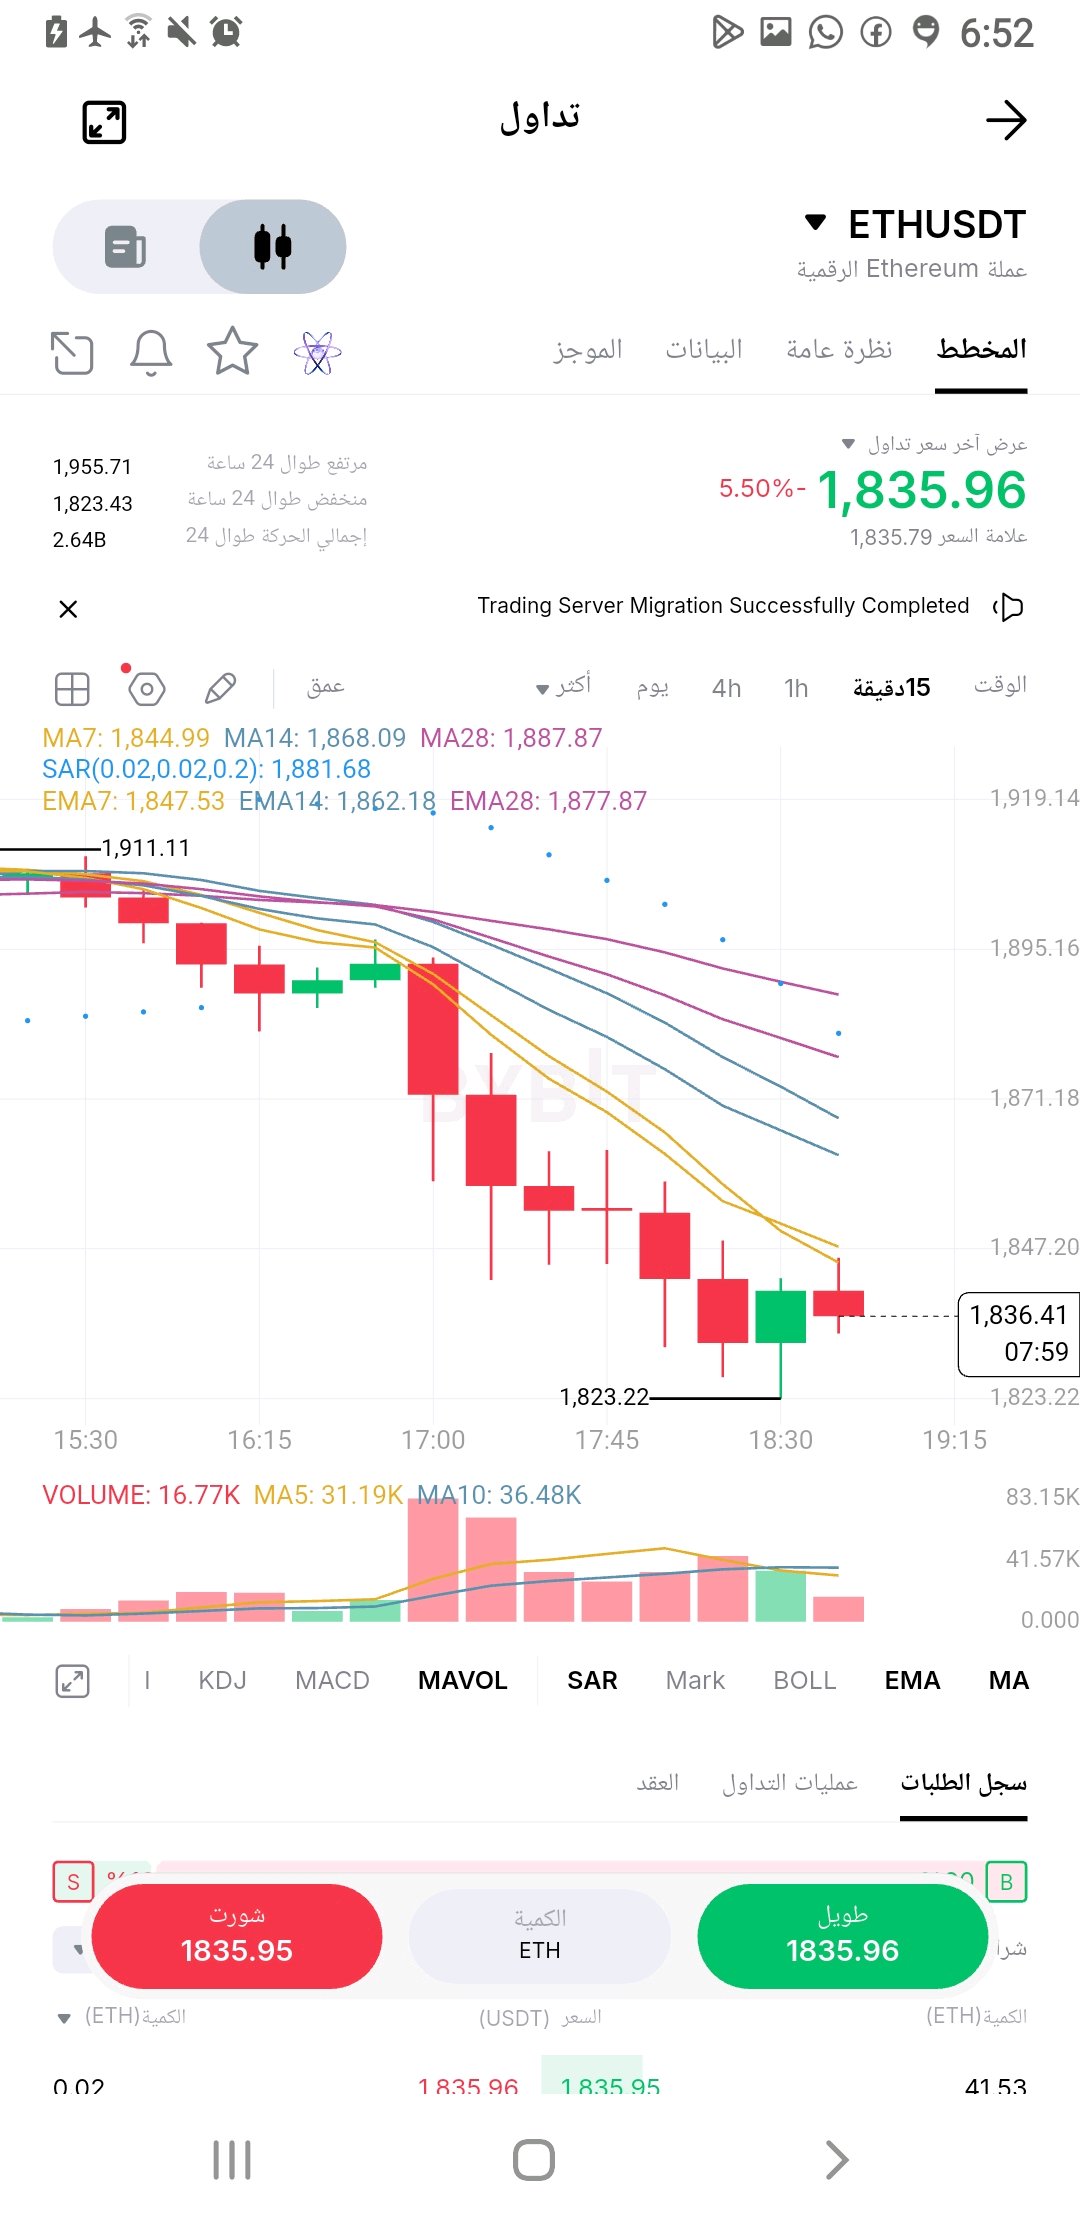
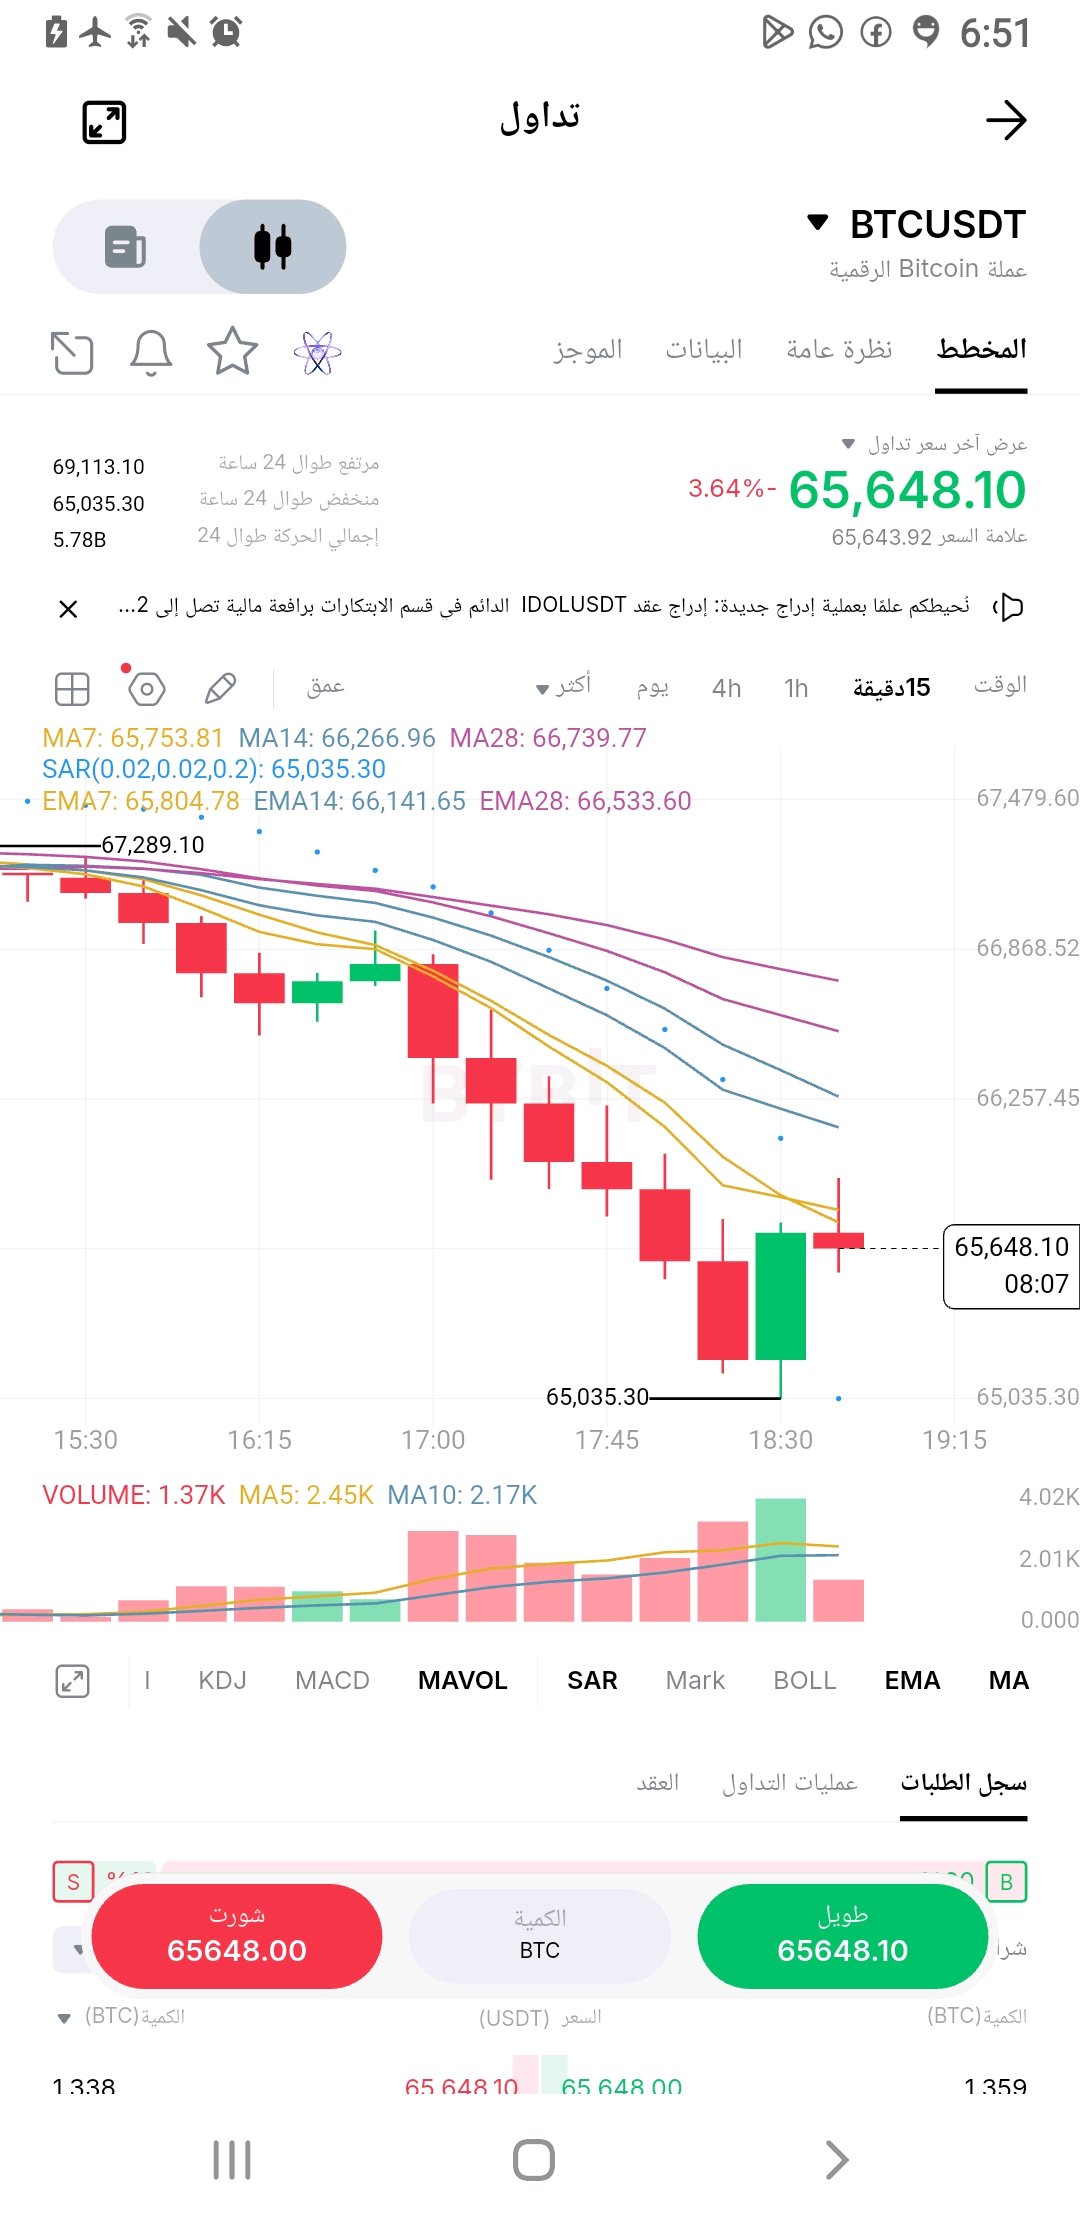
売った奴らが勝つな。
#ByXIMPACT 🚨🔥 市場は強いプレッシャーにさらされています!ビットコインとイーサリアムは重大な局面を迎えています... 反発は近いのか、それともさらなる下落が始まったのか? 📊 BTCおよびETH分析 – 15分足 🟠 $BTC/USDT – ビットコイン 💰 価格: $68,433 📉 下落率: 5.08% 移動平均線を下回って推移しており、売り圧力が継続し、反発の動きも弱いです。 📍 第1サポート: $68,073 📍 次のサポート: $67,468 🎯 第1レジスタンス: $68,619 🎯 第2レジスタンス: $68,975 🎯 重要レジスタンス: $69,112 ⚠️ $68,073を割り込めば下落圧力が強まる可能性があります。一方で、$69,112を回復できれば、買い手が勢いを取り戻すチャンスとなるでしょう。 🔵 $ETH/USDT – イーサリアム 💰 価格: $1,923.45 📉 下落率: 4.40% イーサリアムにも明確な売り圧力がかかっており、移動平均線を下回って推移しています。反発の動きは見られますが、トレンド転換を確認するには至っていません。 📍 第1サポート: $1,912 📍 次のサポート: $1,894 🎯 第1レジスタンス: $1,931 🎯 第2レジスタンス: $1,947 🎯 重要レジスタンス: $1,950 ⚠️ $1,950を上抜け、その水準を維持できれば回復の兆しとなりますが、$1,912を割り込むと、下位サポートの再テストにつながる可能性があります。 🔥 結論: ビットコインとイーサリアムは同時に売り圧力にさらされており、短期足では依然として売り手が優勢です。 👀 急激な反発が見られるのか、それとも最悪の事態はこれからなのか? 💬 あなたの予測を共有してください: 🐂 上昇・反発? 🐻 下落・さらなる調整? ⚠️ テクニカル分析であり、投資助言ではありません。確認を待って、まずはリスク管理を徹底してください。 #BTC #ETH #Bitcoin #Ethereum #Crypto #Trading #WSOT2026 #WSOTあなたのAI取引を見せて10USDTを獲得 #米PPIが「高金利長期化」取引を試す #米国のインフレ率は高止まりし、利上げ観測が高まる $BTCUSDT $ETHUSDT @ByX
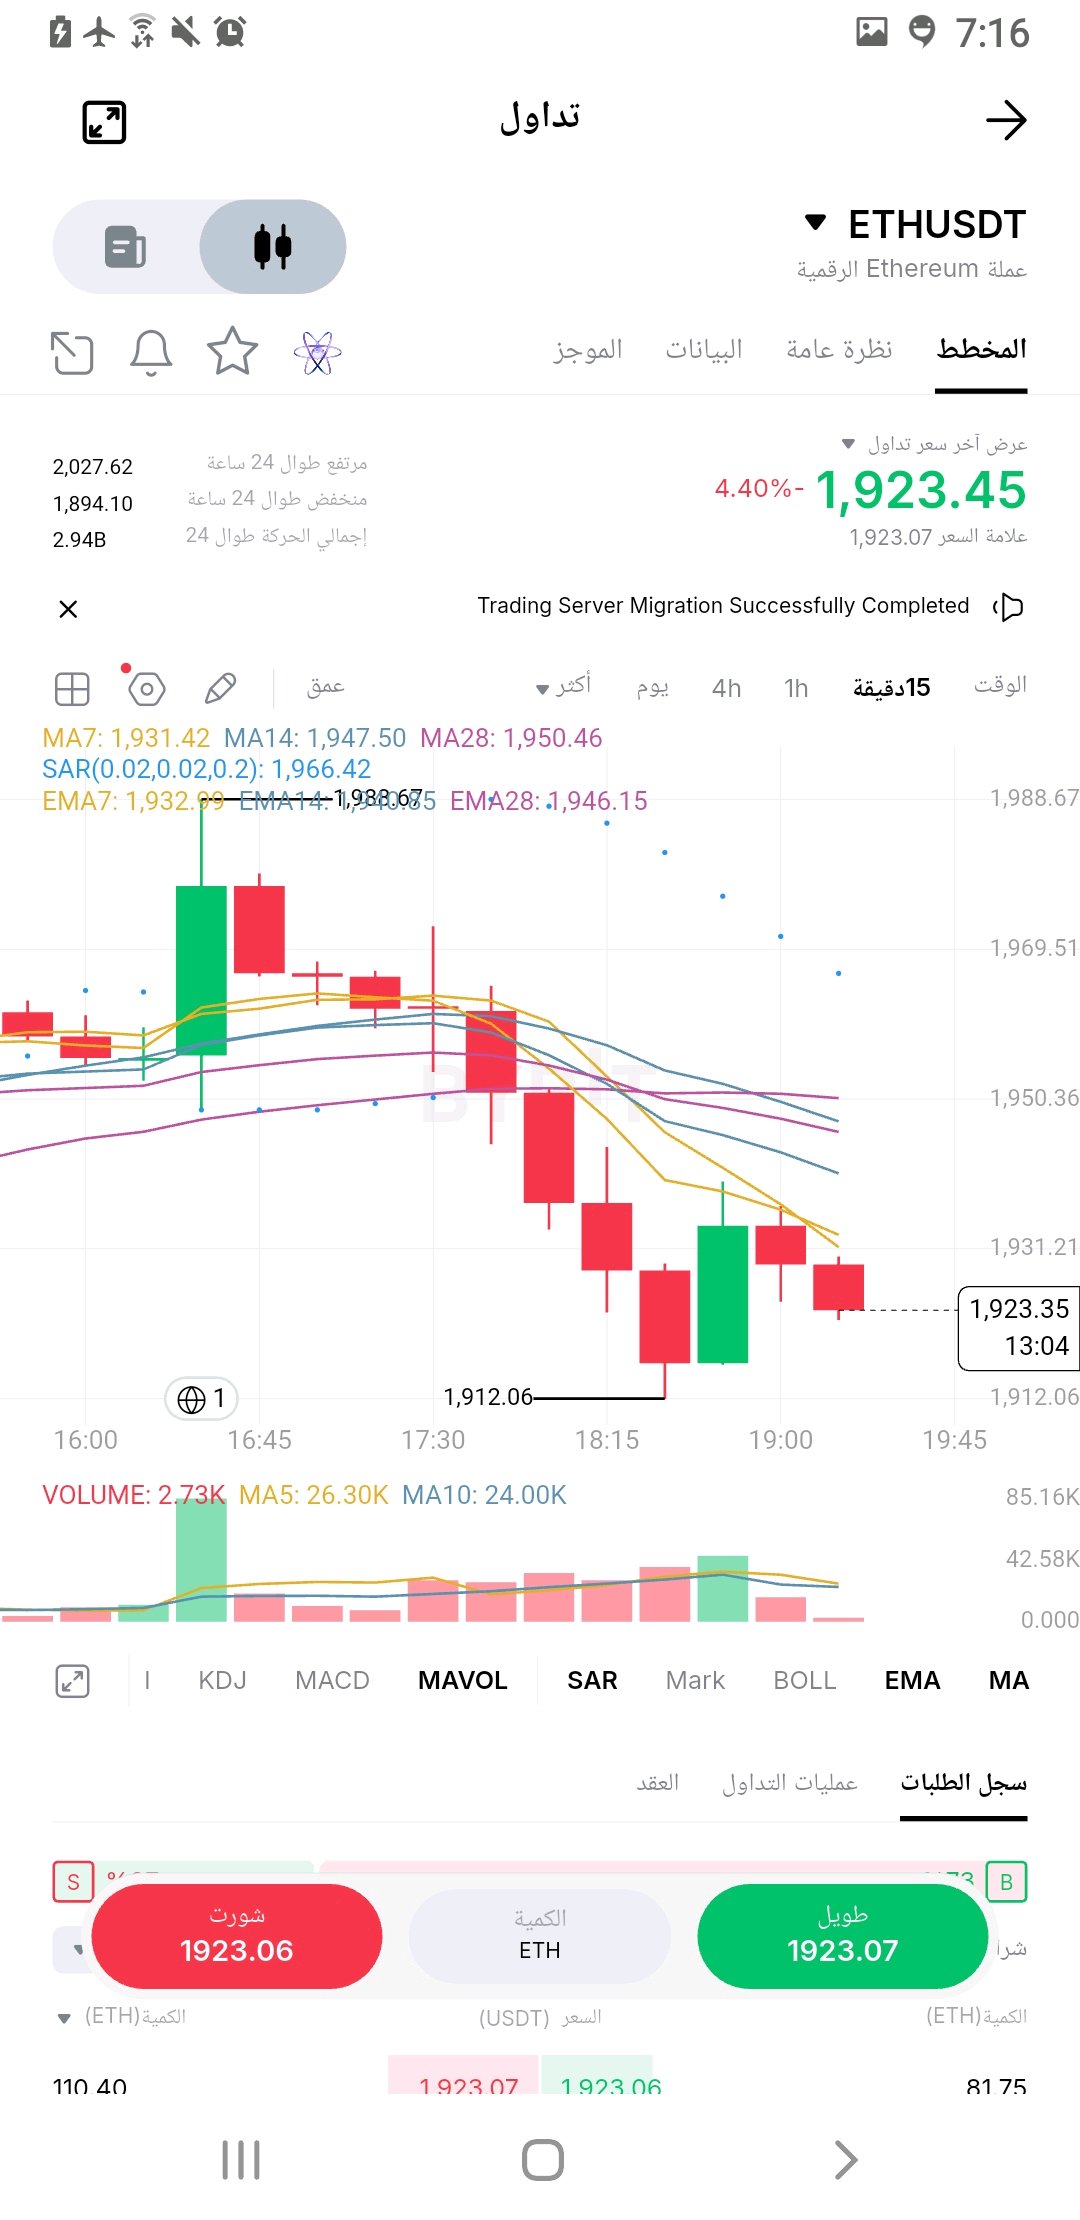
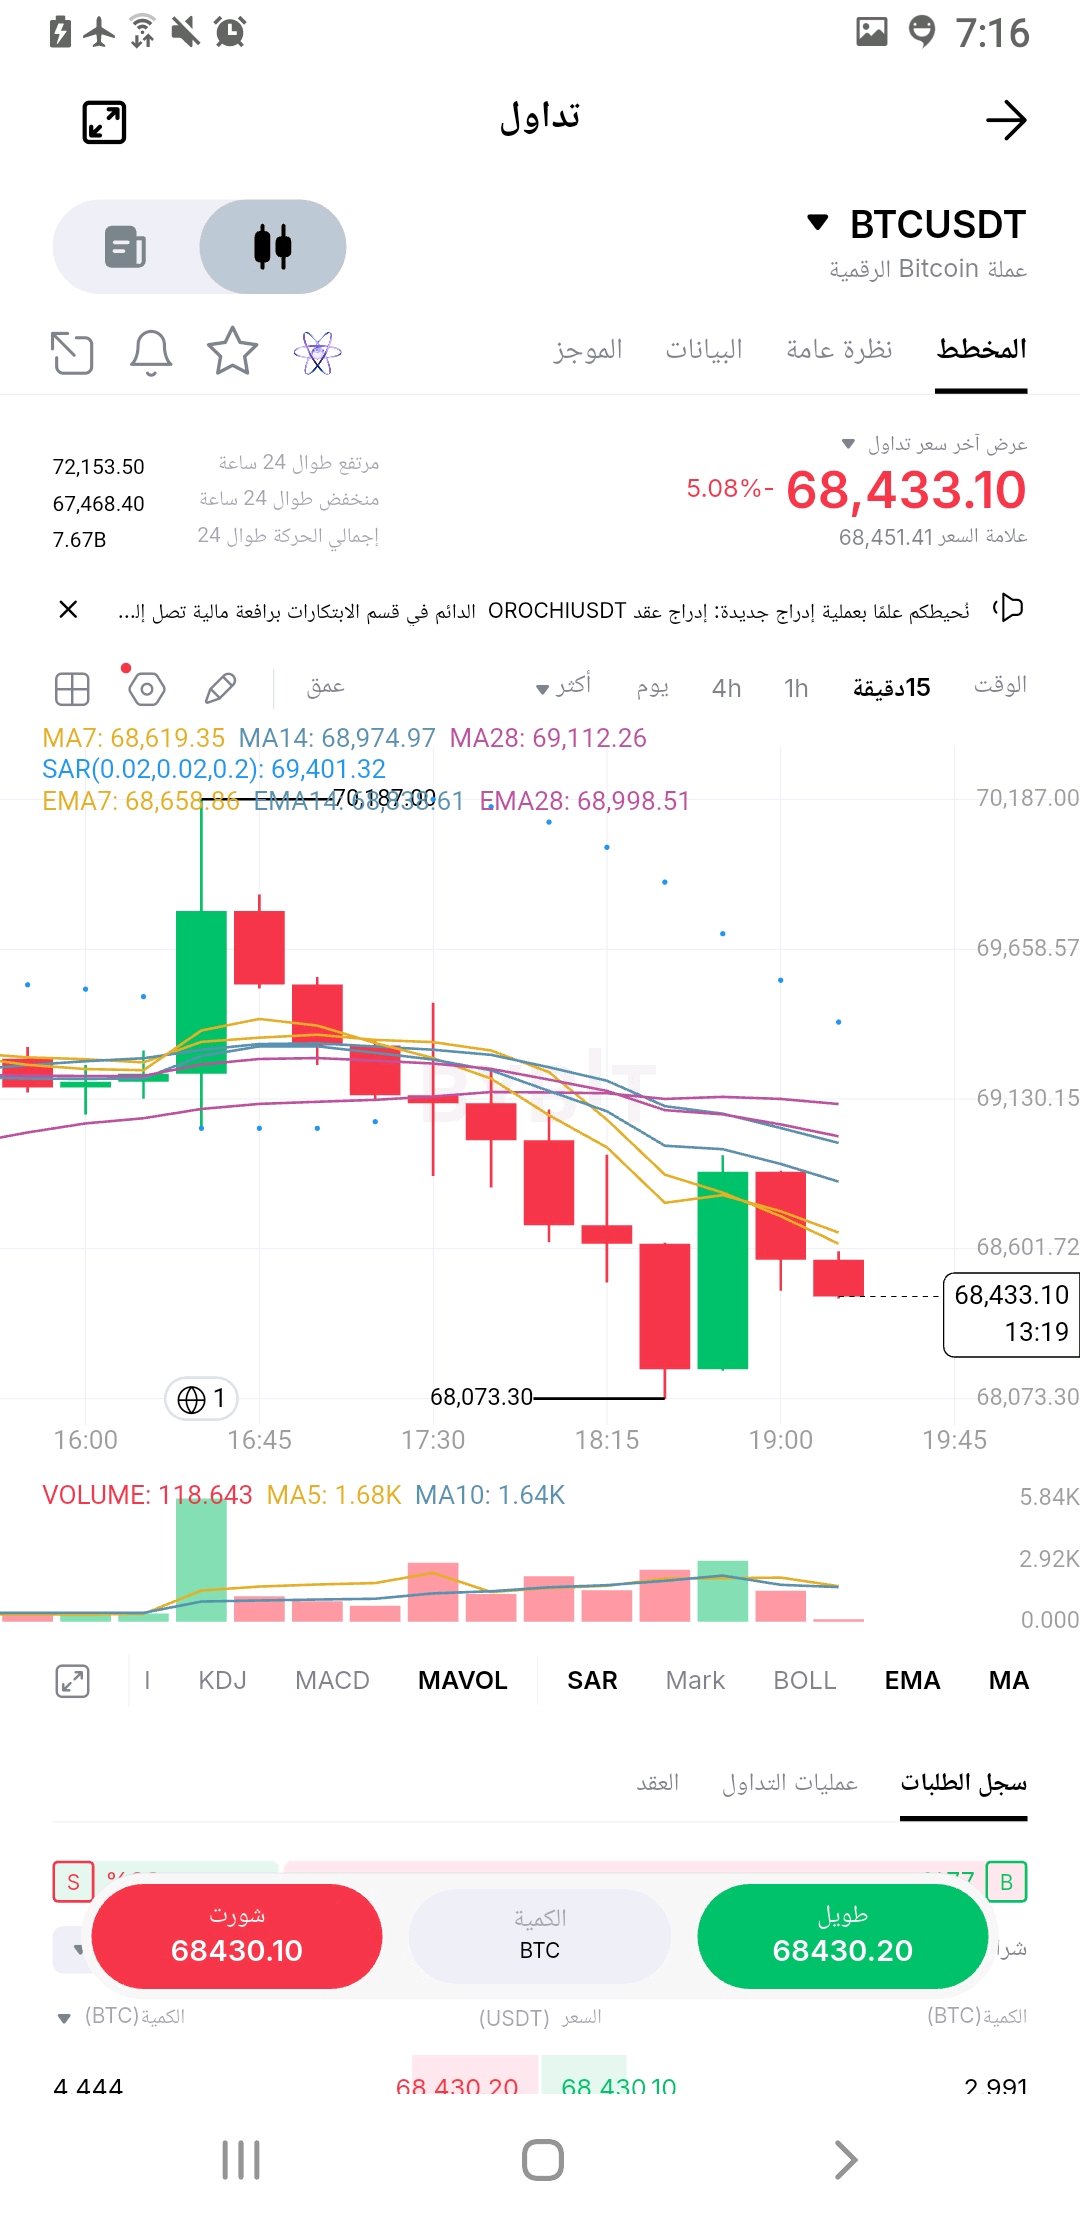
سوف يندمون من قاموا بالشراء
🚨🔥 السوق تحت ضغط قوي! البيتكوين والإيثيريوم أمام اختبار حاسم.. هل اقترب الارتداد أم بدأ هبوط أعمق؟ 📊 تحليل BTC وETH – فريم 15 دقيقة 🟠 $BTC/USDT – البيتكوين 💰 السعر: 68,433$ 📉 التراجع: 5.08% السعر يتحرك أسفل المتوسطات المتحركة، مع استمرار الضغط البيعي وظهور ضعف في محاولات الارتداد. 📍 الدعم الأول: 68,073$ 📍 الدعم التالي: 67,468$ 🎯 المقاومة الأولى: 68,619$ 🎯 المقاومة الثانية: 68,975$ 🎯 المقاومة الأهم: 69,112$ ⚠️ كسر 68,073$ قد يزيد الضغط الهبوطي، بينما استعادة 69,112$ قد تمنح المشترين فرصة لاستعادة الزخم. 🔵 $ETH/USDT – الإيثيريوم 💰 السعر: 1,923.45$ 📉 التراجع: 4.40% الإيثيريوم يسجل ضغطاً بيعياً واضحاً، ويتداول أسفل المتوسطات المتحركة، مع محاولة ارتداد لم تؤكد انعكاس الاتجاه حتى الآن. 📍 الدعم الأول: 1,912$ 📍 الدعم التالي: 1,894$ 🎯 المقاومة الأولى: 1,931$ 🎯 المقاومة الثانية: 1,947$ 🎯 المقاومة الأهم: 1,950$ ⚠️ اختراق 1,950$ والثبات فوقها قد يدعم محاولة التعافي، أما كسر 1,912$ فقد يعيد اختبار الدعم الأدنى. 🔥 الخلاصة: البيتكوين والإيثيريوم تحت ضغط بيعي متزامن، والسيطرة لا تزال للبائعين على الفريم القصير. 👀 هل نشهد ارتداداً مفاجئاً أم أن الأسوأ لم يأتِ بعد؟ 💬 شاركنا توقعك: 🐂 صعود وارتداد؟ 🐻 هبوط وتصحيح أعمق؟ ⚠️ تحليل فني وليس توصية استثمارية. انتظر التأكيد، وإدارة المخاطر أولاً. #BTC #ETH #Bitcoin #Ethereum #Crypto #Trading #WSOT2026 #WSOT أظهر تداولك بالذكاء الاصطناعي لتربح 10 USDT #USPPITestsTheHigherForLongerTrade $BTCUSDT $ETHUSDT
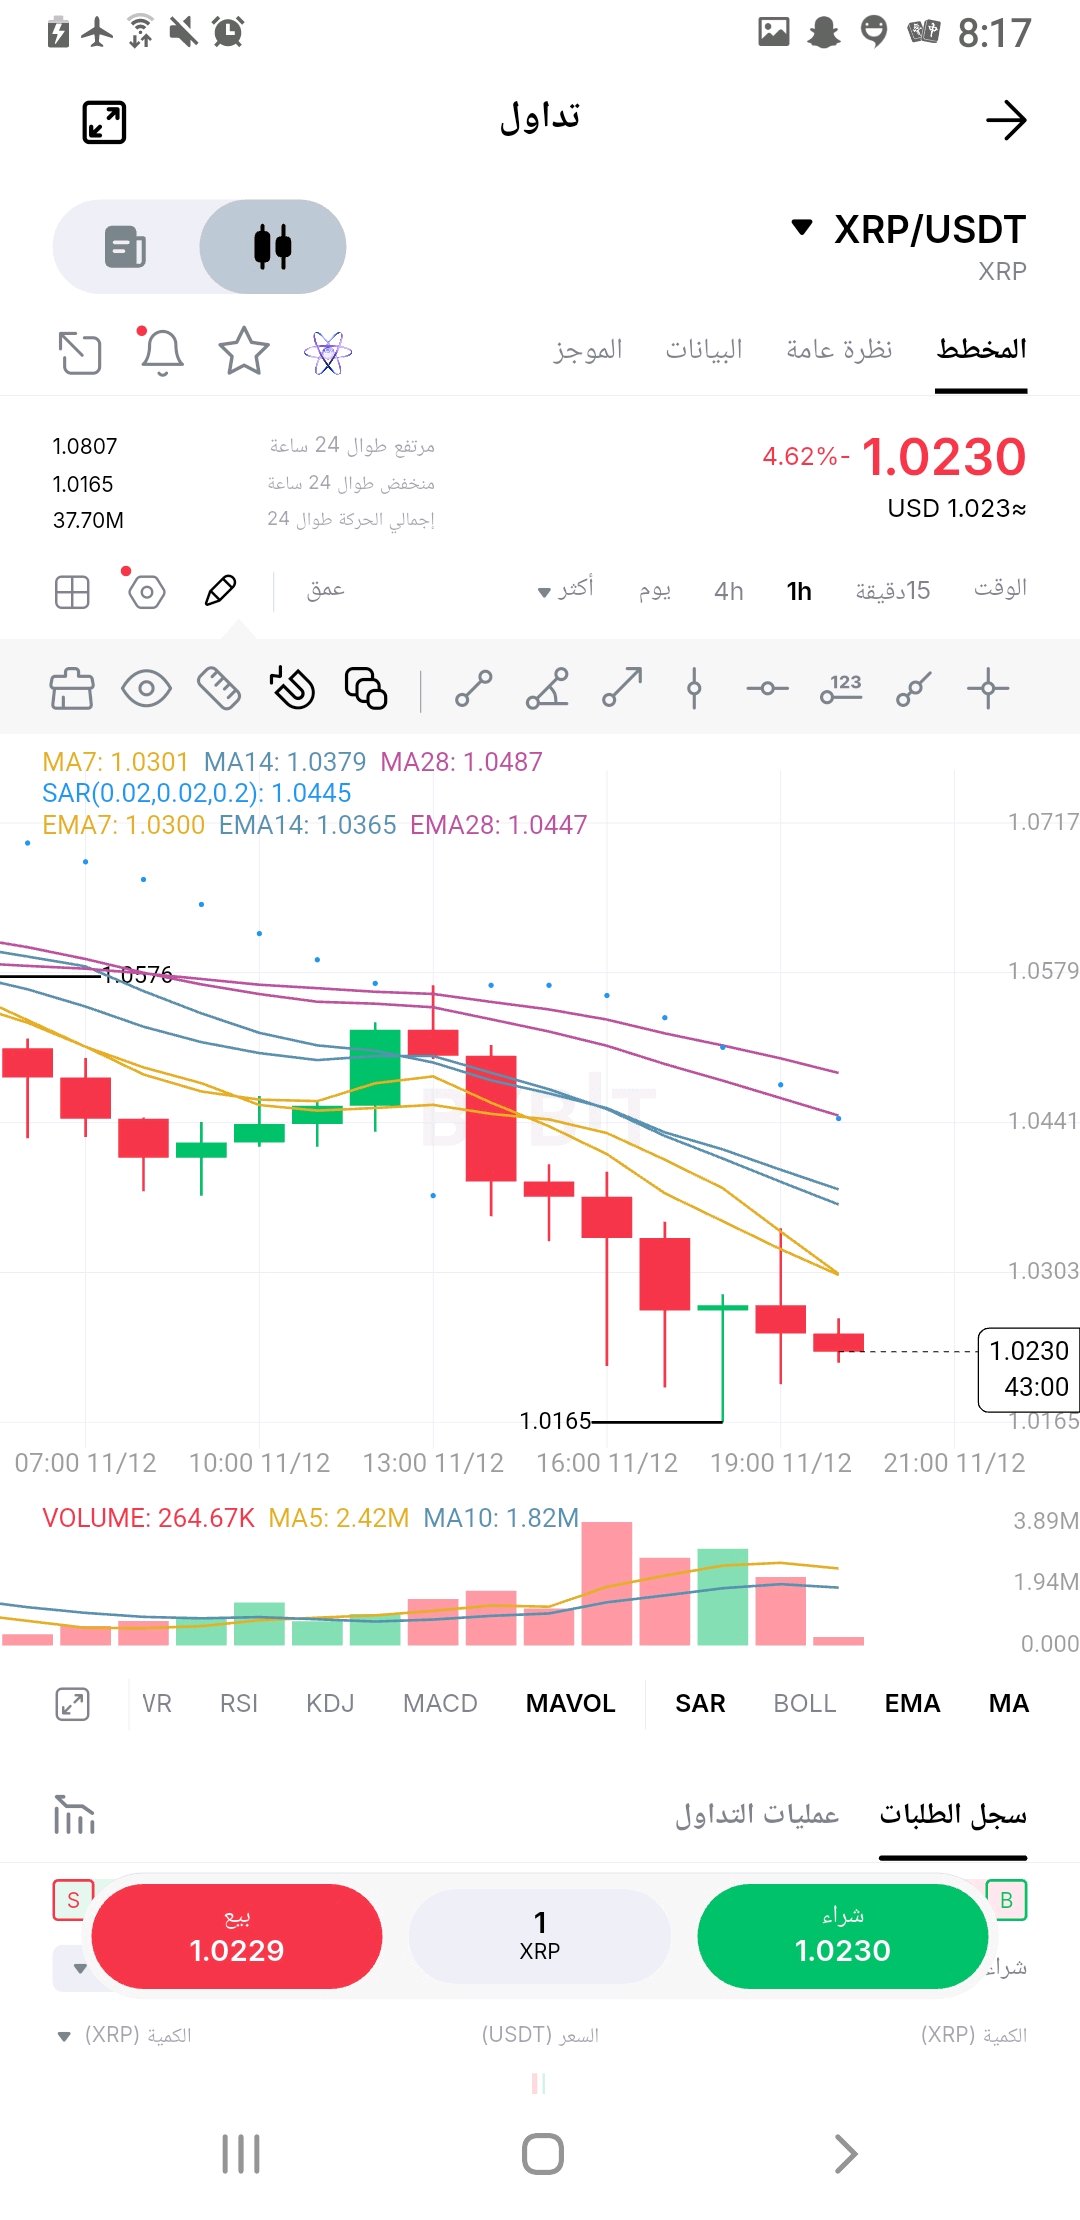
#ByXIMPACT Comprehensive analysis for **XRP/USDT** under the approved trading strategy: ### 📊 Market Overview and Current Price * **Current Price:** ~$1.04 * **Market Capitalization:** ~$66.2 billion * **24-Hour Trading Volume:** ~$511 million * **Weekly Performance:** A decline of ~13.5% with a test of the final support level near **$1.037**. ### 🌐 Fundamentals vs. Price Reality (The Missing Link) The XRPL ecosystem is experiencing notable institutional growth: * Global investment product inflows for XRP reached approximately **$355.3 million** in Q3. * Stablecoin supply on the network expanded to **$1.03 billion**. * Tokenized real-world assets (RWA) approached **$498.7 million**. > **The Core Distinction:** Expansion in stablecoin payments and institutional custody on the network does not automatically translate into immediate buying pressure on the native asset (XRP), explaining the current divergence between ecosystem growth and price suppression. > ### 📉 Derivatives Markets and Leverage * **Open Interest:** Stood at approximately **$2.27 billion** (down 3.18% over 24 hours). * **Funding Rate:** Positive at **+0.0085%** every 8 hours. * **Implication:** A pullback in leverage-driven risk exposure, with bullish positioning remaining cautious. The spot market remains the ultimate decider; a spot-backed recovery will be far more reliable than speculative futures bounces. ### 🎯 Critical Levels and Trading Plan * **Immediate Support:** $1.037 * **Psychological Support:** $1.00 * **Immediate Resistance:** $1.081 #### 🟢 Bullish Confirmation: A successful defense of the **$1.037** level, followed by reclaiming the **$1.081** resistance and holding above it with strong spot liquidity, opens the door to target **$1.10** and subsequently **$1.15**. #### 🔴 Bearish Confirmation: A breakdown below the **$1.037** level will expose the price to a test of the psychological barrier at **$1.00**, and a collapse beneath it will maintain absolute bear dominance. **Summary Outlook:** Institutional interest alone is not enough without concrete evidence of a liquidity shift favoring direct demand in the spot market. Caution remains the priority until the breakout of key resistance levels is confirmed. #XRPUSDT #ByXIMPACT $XRPUSDT $HYPEUSDT #WSOT2026 #ارتفاع التضخم الأمريكي وزيادة الرهانات على رفع أسعار الفائدة #شركة SanDisk تعلن عن تقسيم الأسهم بنسبة 8 مقابل 1 #مراقبة مؤشر أسعار المستهلك الأمريكي لشهر نوفمبر @ByX
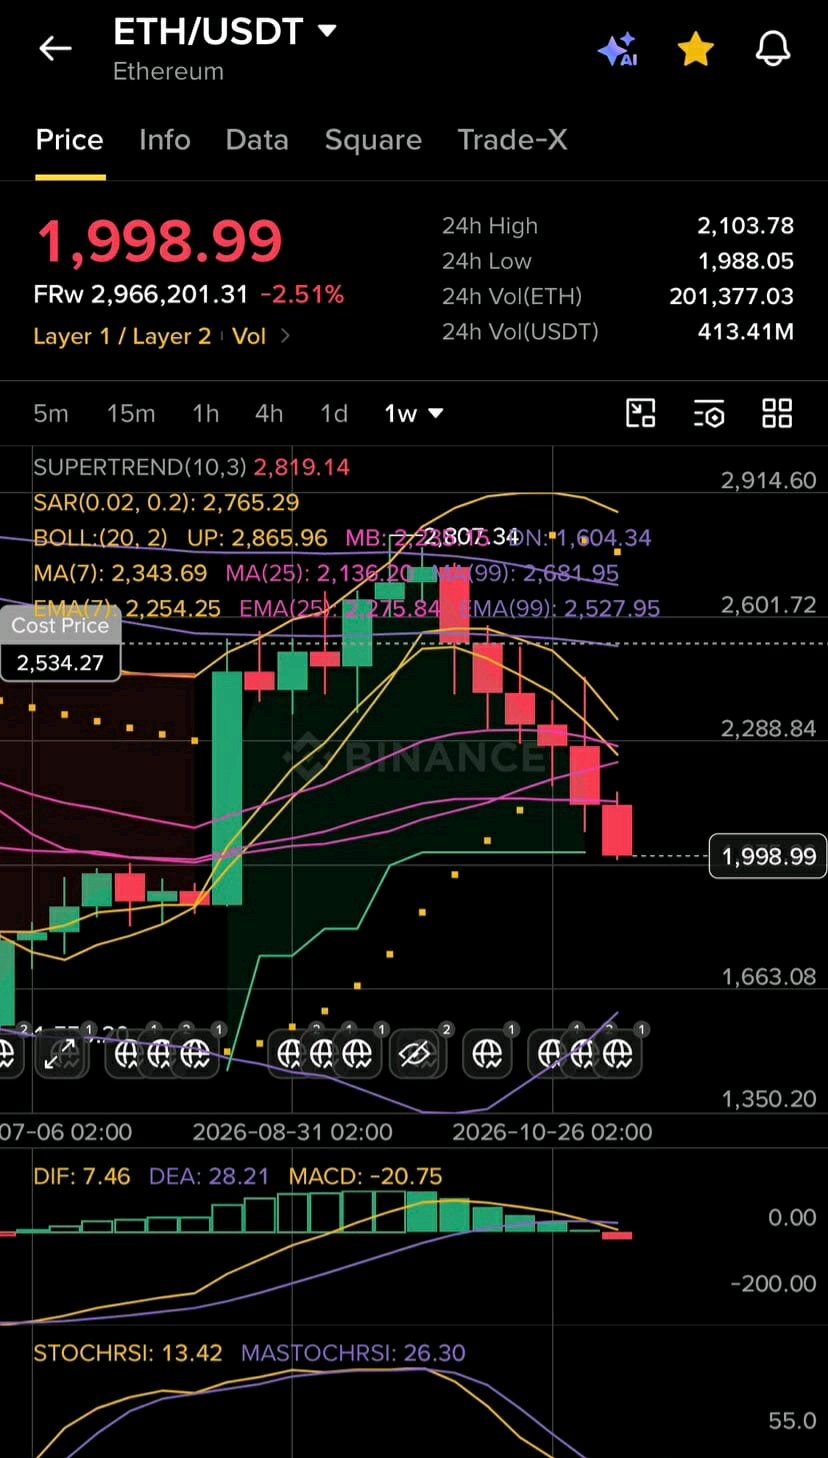
I converted $100 into $1000
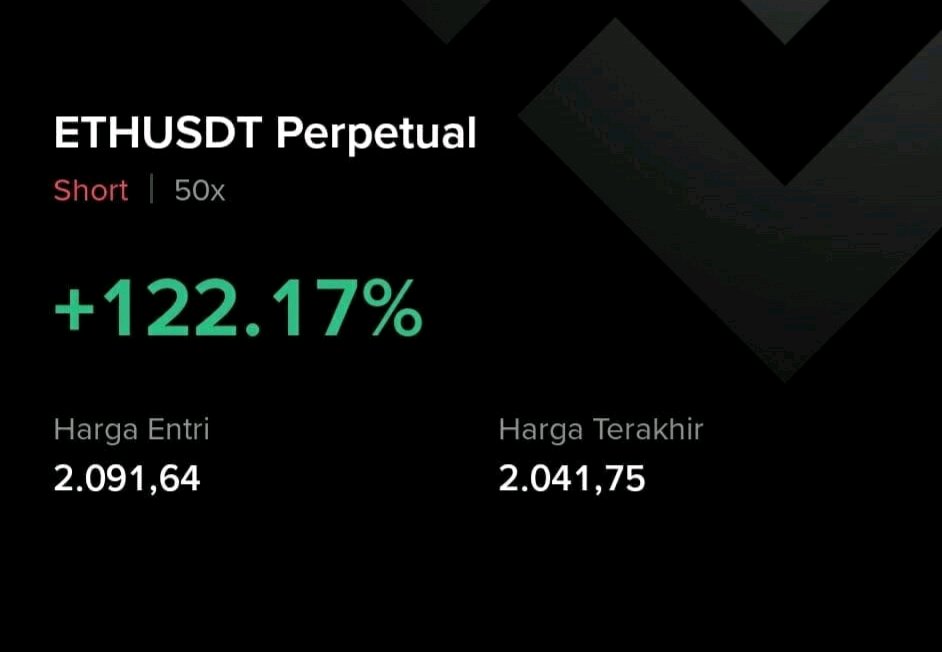
🚨🔥 ETH$ETHUSDT at a crucial point... Will Ethereum regain its strength and return above $2,030? 💎 ETH/USDT | 15-minute timeframe 💰 Current price: $2,006 🟢 Entry zone: $2,000 – $2,006 🚀 Bullish confirmation: Breakout above $2,015 🎯 TP1: $2,020 🎯 TP2: $2,027 🎯 TP3: $2,038 🔥 Extended target: $2,050 🛑 Stop loss: $1,982 📊 Technical analysis: A bounce from $1,982 towards $2,027, but the price is facing resistance at the 28-period EMA near $2,015. A break above this level could strengthen the chances of a continued recovery. 🐂 Is Ethereum poised for a bullish surprise? Eyes on $2,015! #ETH #Ethereum #Crypto #Bybit #Trading ⚠️ Technical analysis only, not a guarantee of profit. Await confirmation and manage your risk first. #WSOT2026 #ارتفاع التضخم الأمريكي وزيادة الرهانات على رفع أسعار الفائدة #شركة SanDisk تعلن عن تقسيم الأسهم بنسبة 8 مقابل 1 #موجة بيع في تقنيات الذكاء الاصطناعي تمحو 2.5 تريليون دولار من مؤشر ناسداك 100 #ByXIMPACT 🚨🐋 $BTC$BTCUSDT faces a crucial bounce zone... Will Bitcoin reclaim the $73,000 level? 💎 BTC/USDT | 15-minute timeframe 💰 Current price: $71,751 🟢 Entry zone: $71,500 – $71,800 🚀 Bullish confirmation: Breakout above $72,000 🎯 TP1: $72,250 🎯 TP2: $72,500 🎯 TP3: $72,730 🔥 Extended target: $73,000 🛑 Stop loss: $71,200 📊 Technical analysis: A bounce from the $71,205 low is underway, with an attempt to recover the short-term averages, but the trend remains cautious. A break above $72,000 could give buyers an opportunity to continue the recovery. 🔥 Bitcoin under scrutiny... Is a recovery beginning? #BTC #Bitcoin #Crypto #Bybit #Trading ⚠️ Technical analysis only, not a guarantee of profit. Wait for confirmation and manage your risk first. @ByX
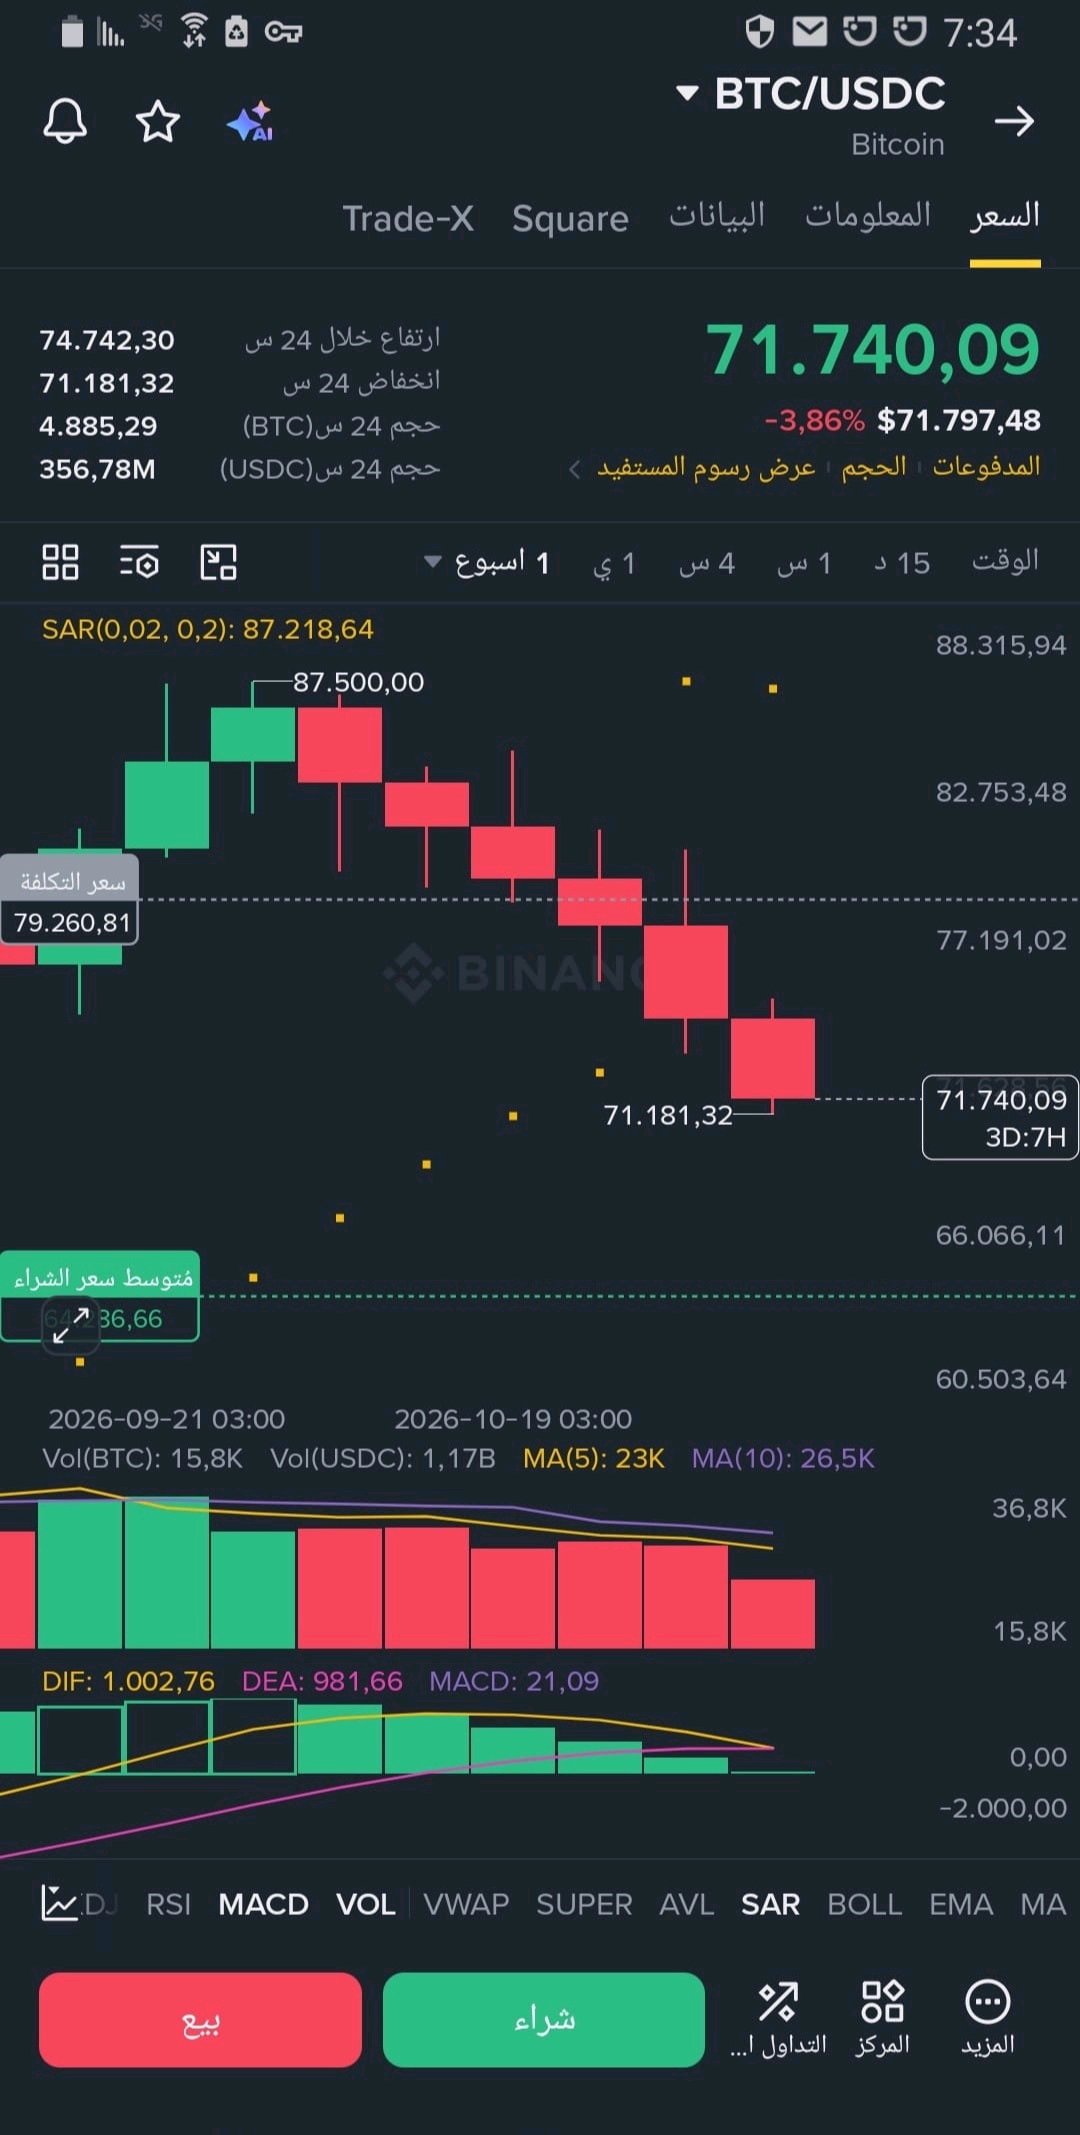
I converted $10 into $100
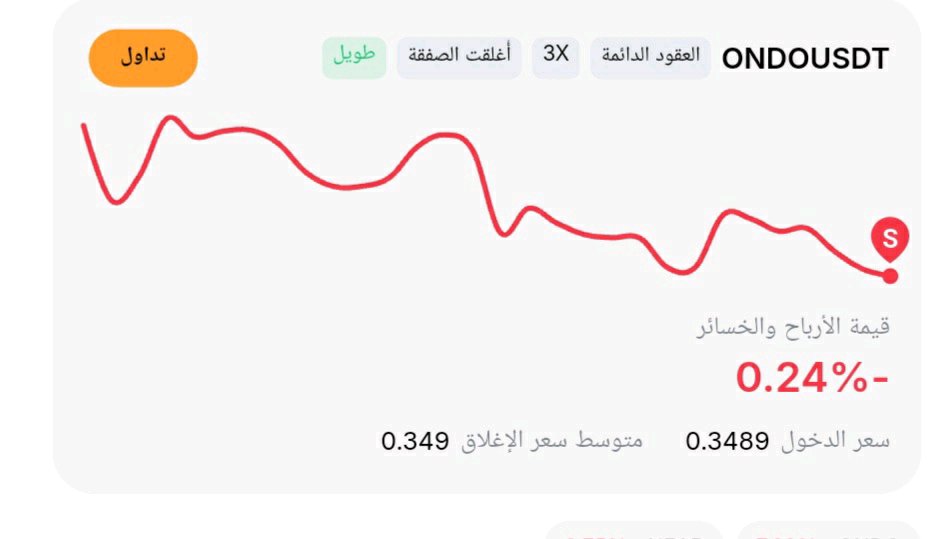
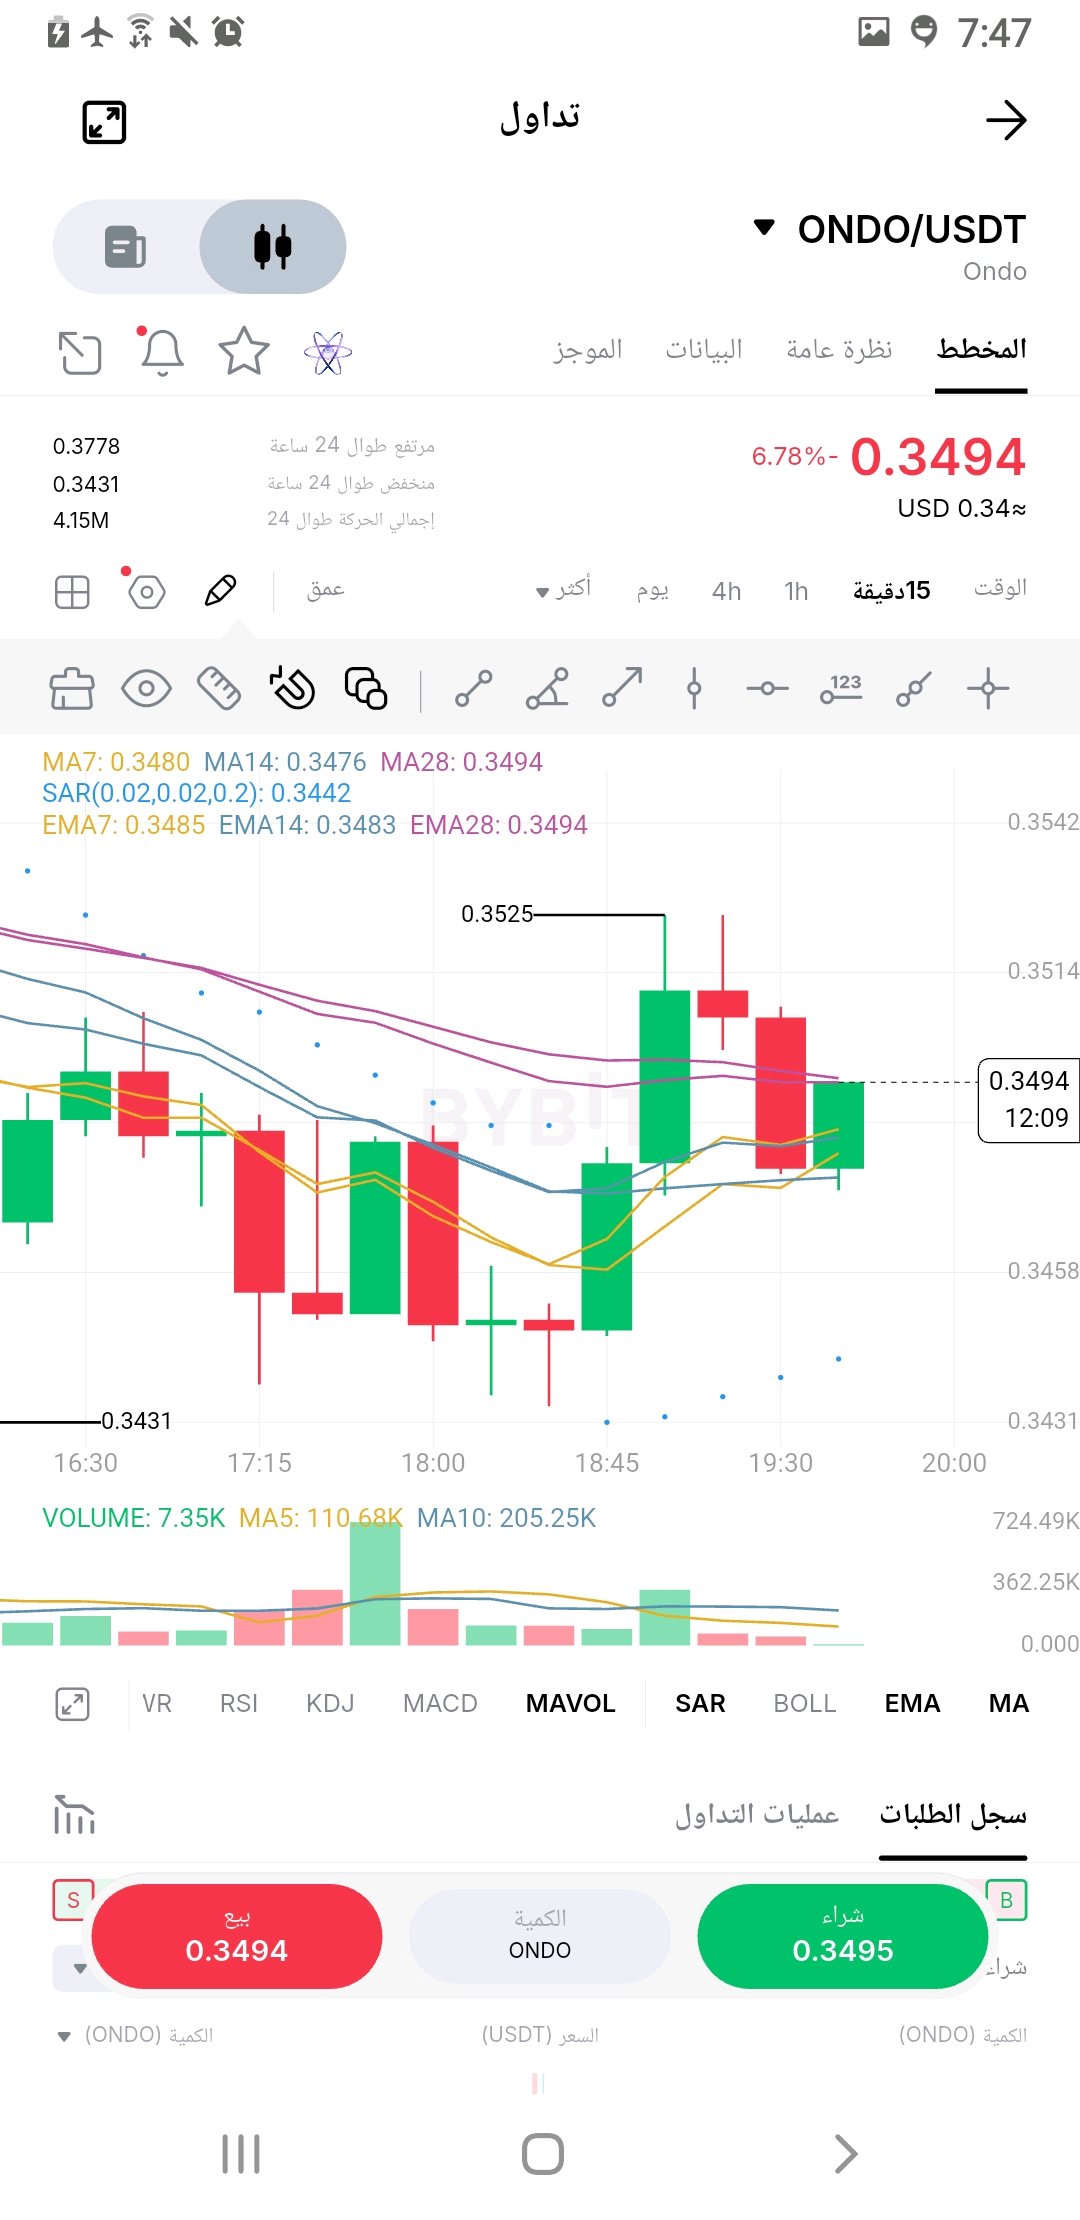
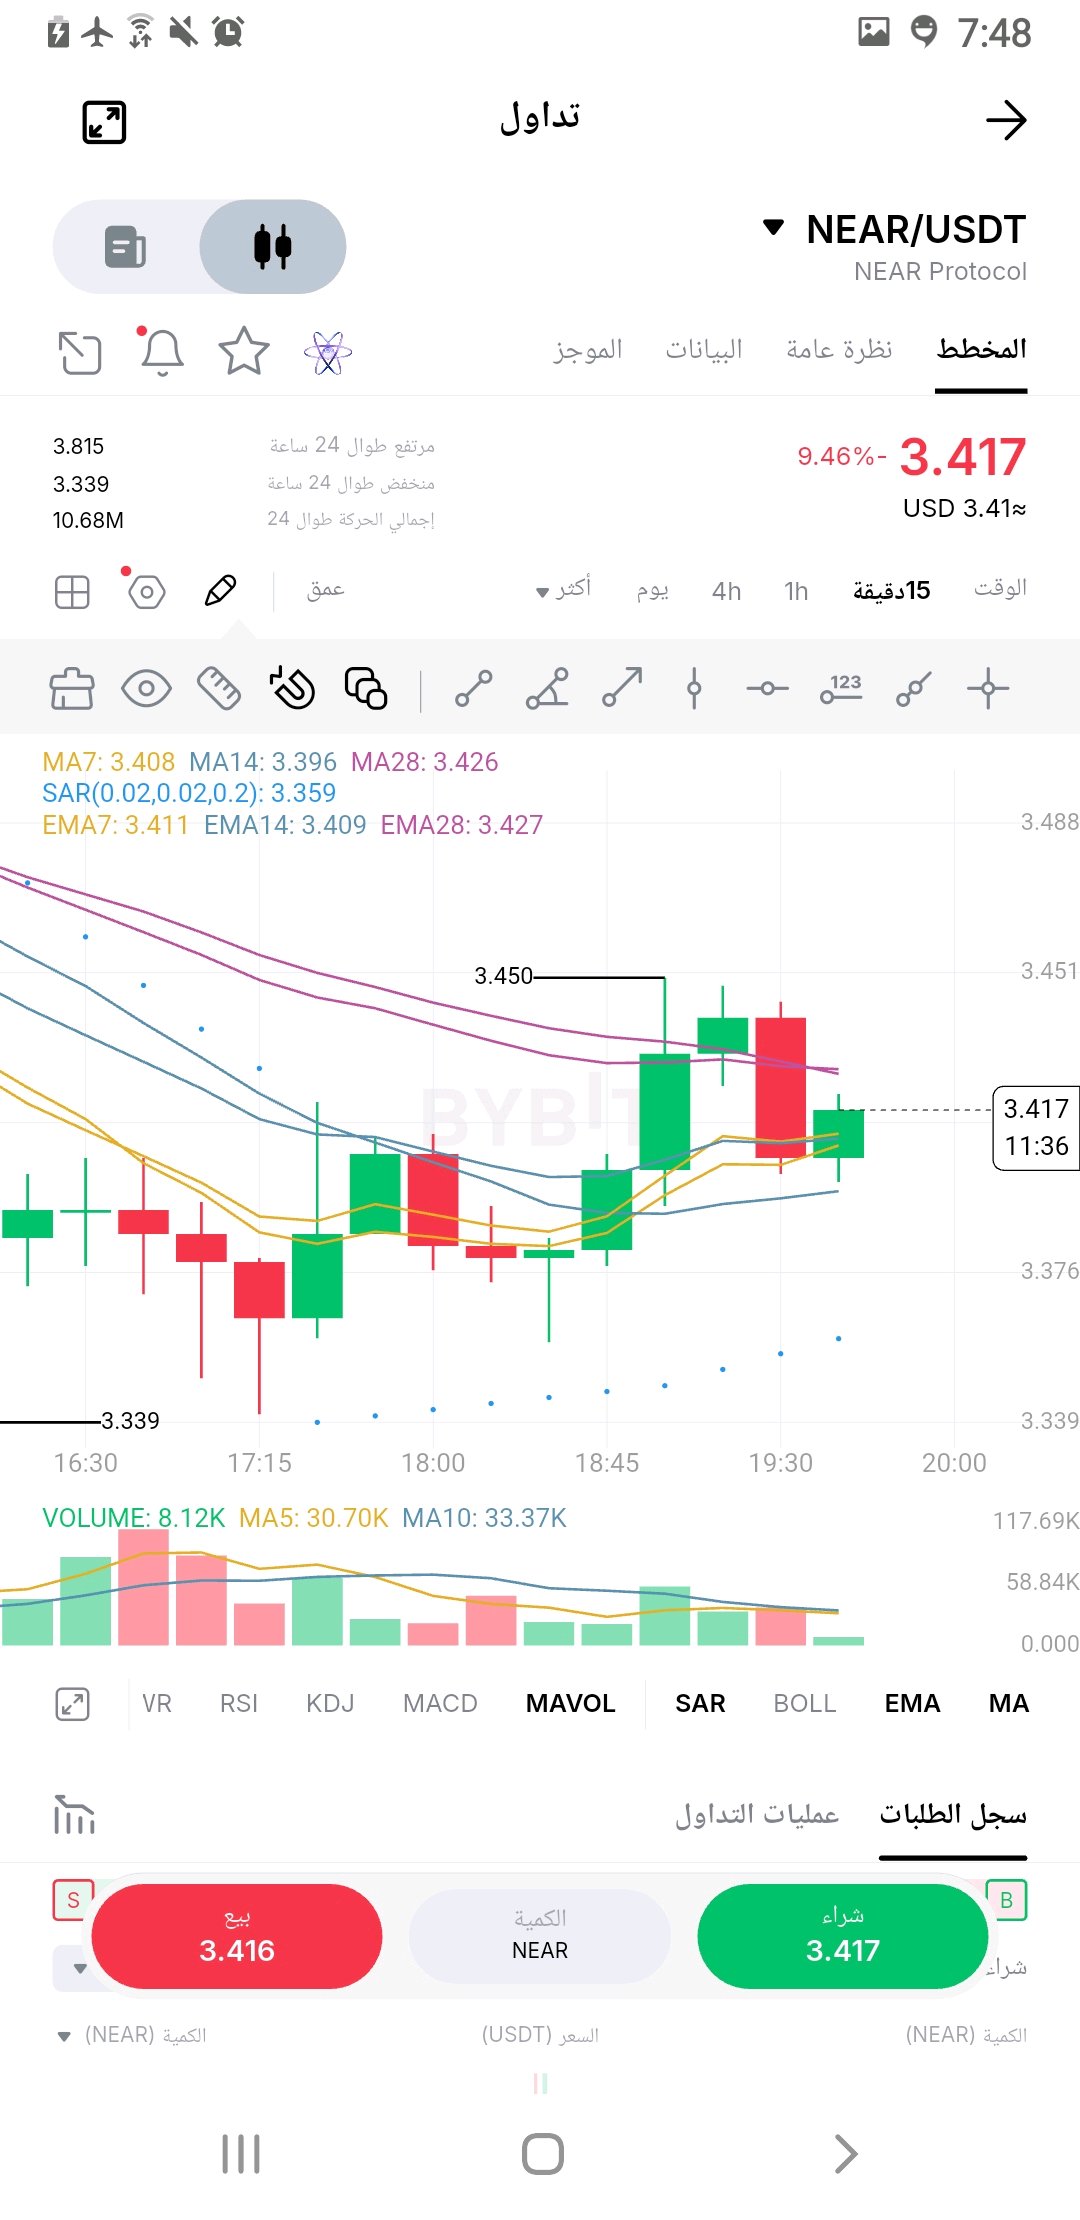
🚨🔥 $$ONDOUSDT ONDO يتحرك عند منطقة حاسمة.. هل اقترب الانفجار الصعودي؟ 💎 ONDO/USDT | فريم 15 دقيقة 💰 السعر الحالي: 0.3494$ 🟢 الدخول: 0.3470 – 0.3495$ 🚀 تأكيد الاختراق: 0.3525$ 🎯 TP1: 0.3540$ 🎯 TP2: 0.3580$ 🎯 TP3: 0.3650$ 🔥 الهدف الممتد: 0.3770$ 🛑 وقف الخسارة: 0.3430$ 📊 فنياً: ارتداد من 0.3431$ ومحاولة لاستعادة الزخم فوق المتوسطات المتحركة. اختراق 0.3525$ قد يمنح المشترين أفضلية جديدة. 🐂 هل تكون $ONDO مفاجأة الصعود القادمة؟ #ONDO #Crypto #Bybit #Trading #Altcoins ⚠️ تحليل فني وليس ضماناً للربح. إدارة المخاطر أولاً. #WSOT2026 #ارتفاع التضخم الأمريكي وزيادة الرهانات على رفع أسعار الفائدة #شركة SanDisk تعلن عن تقسيم الأسهم بنسبة 8 مقابل 1 #ينخفض بيتكوين إلى أدنى مستوى له في شهرين بعد انتخابات منتصف المدة الأمريكية #ByXIMPACT 🚨🔥 NEAR$NEARUSDT is poised for another upward attempt... Will we see a breakout above $3.45? 💎 NEAR/USDT | 15-minute timeframe 💰 Current Price: $3.417 🟢 Entry Zone: $3.400 – $3.420 🚀 Bullish Confirmation: Breakout above $3.450 🎯 TP1: $3.480 🎯 TP2: $3.520 🎯 TP3: $3.580 🔥 Extended Target: $3.650 🛑 Stop Loss: $3.375 📊 Technical Analysis: A bounce from $3.339 with the price returning above the short-term averages, attempting to regain upward momentum. The $3.450 level currently represents the most significant resistance. 🐂 Is NEAR preparing for a strong upward surge? All eyes are on the breakout! #NEAR #Crypto #Bybit #Trading #Altcoins ⚠️ Technical analysis is not a guarantee of profit. Do not enter before confirmation, and manage risk first. @ByXIMPACT @ByX
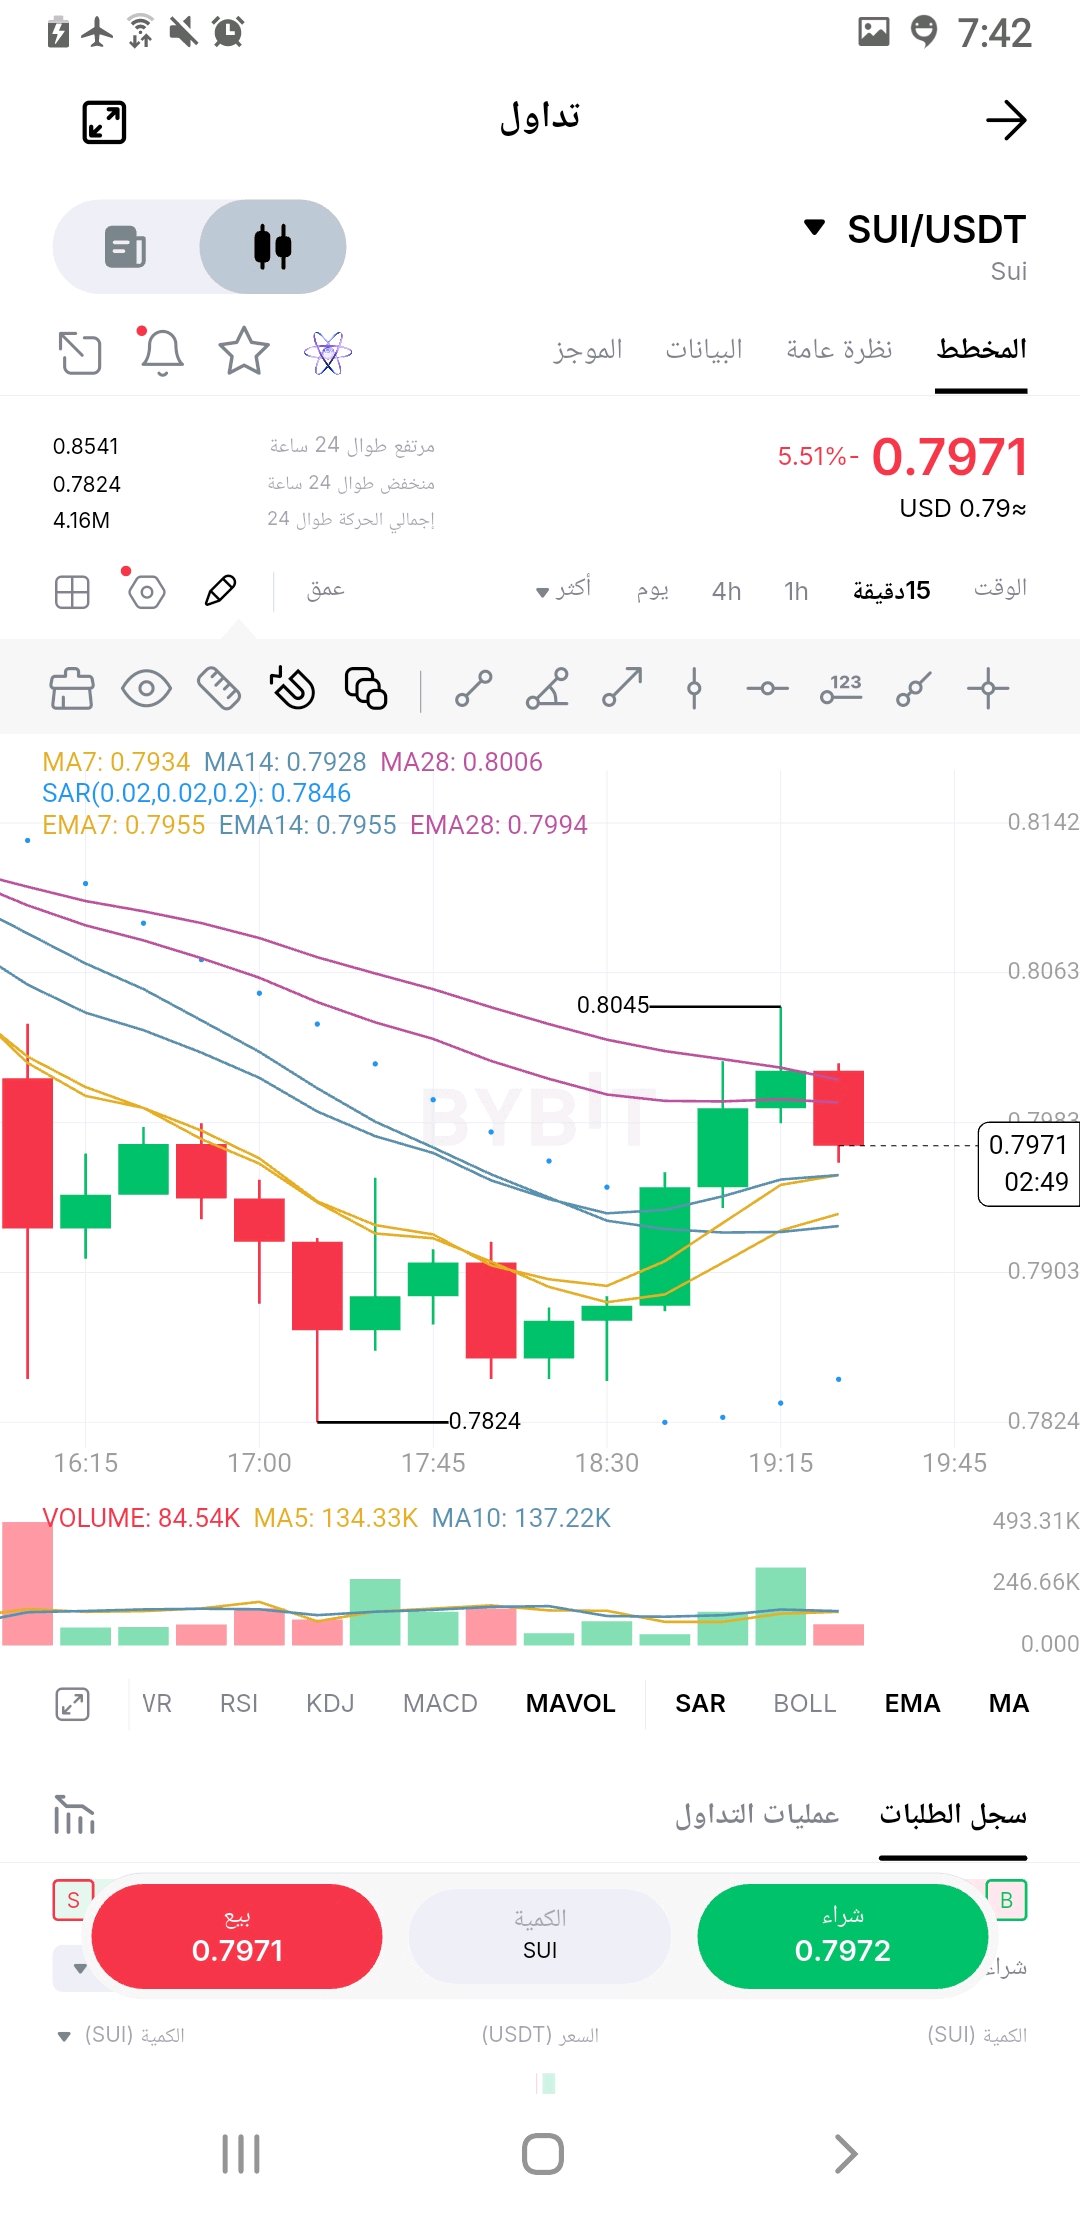
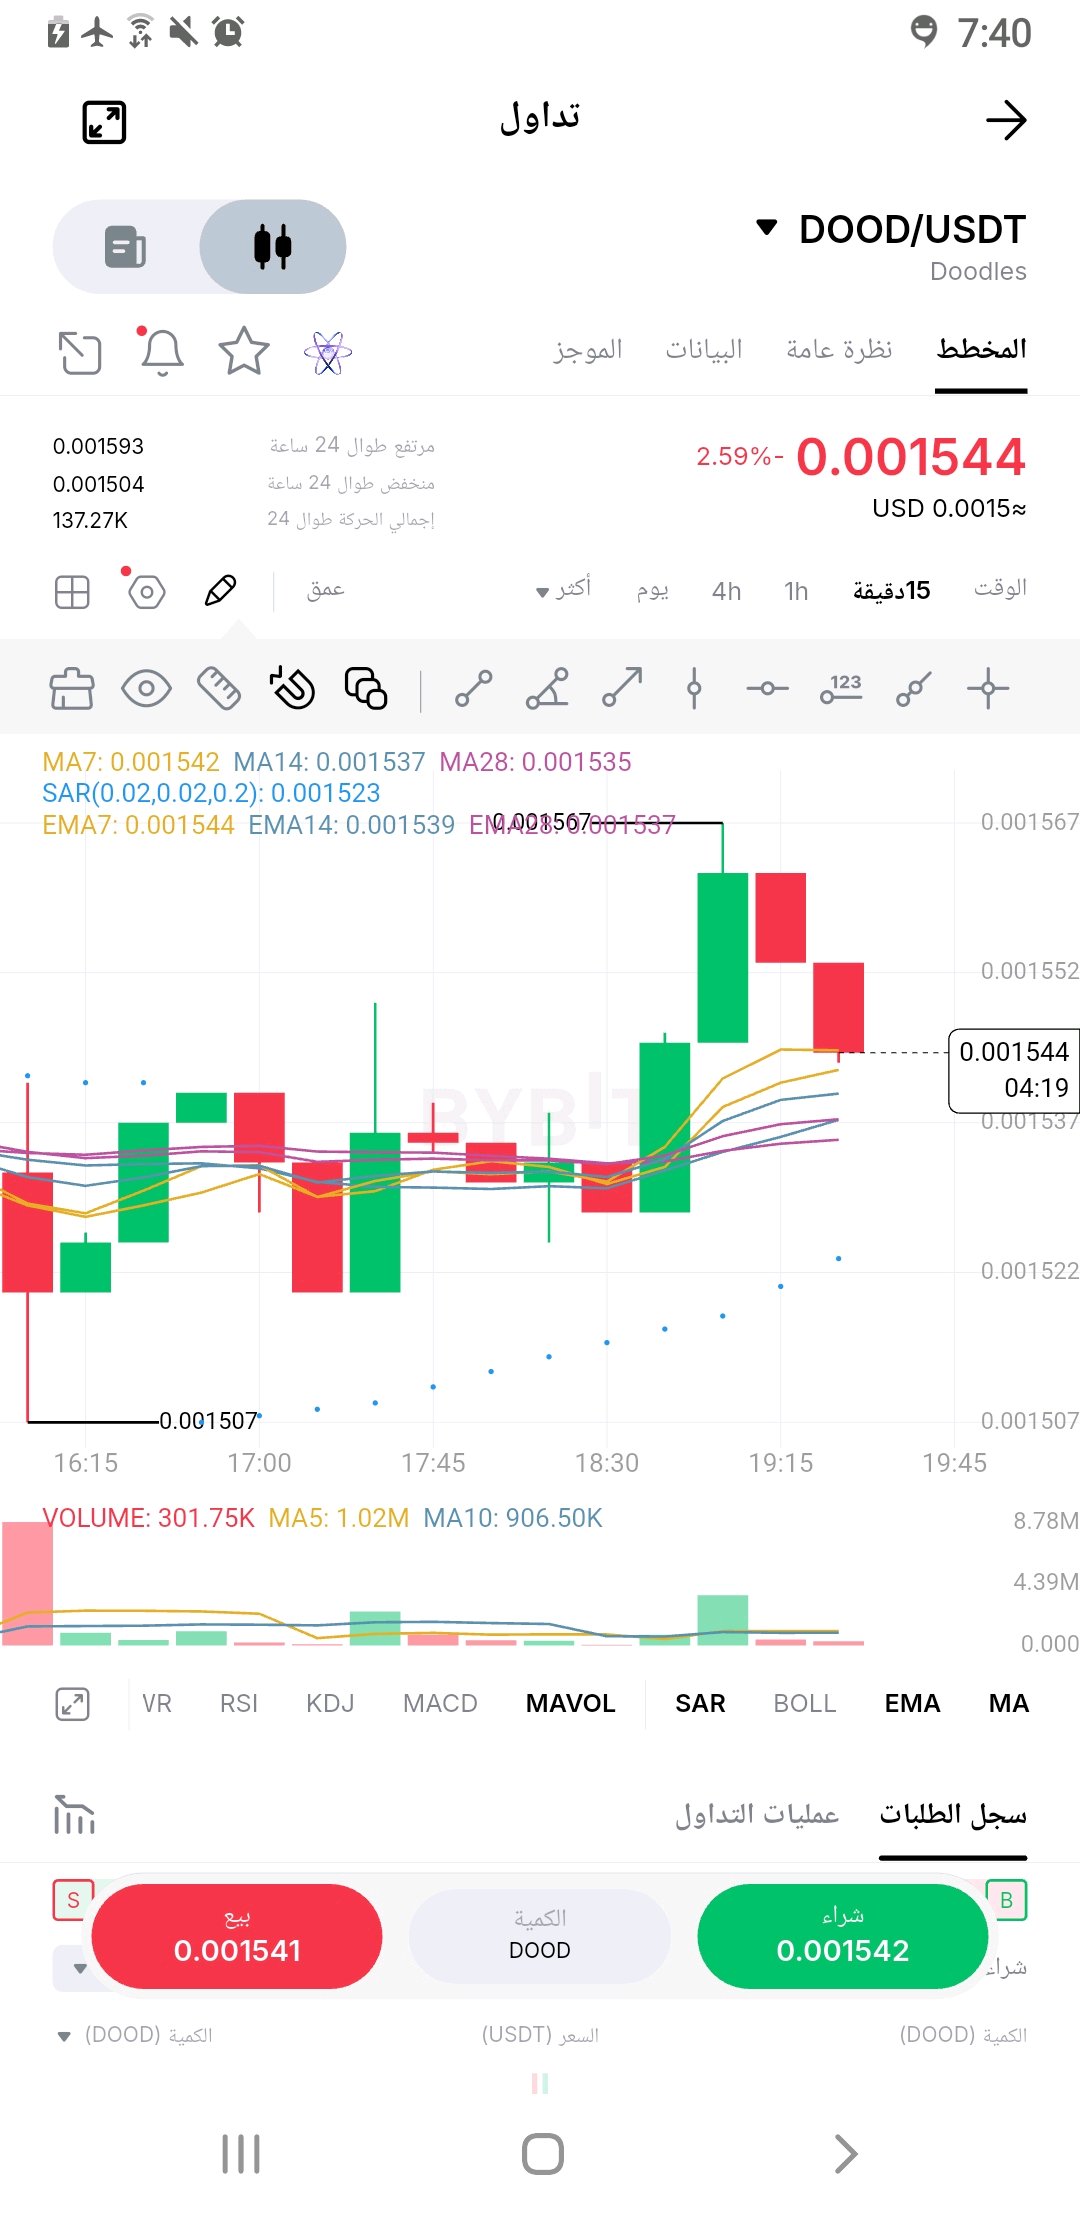
🚨🔥 $SUIUSDT faces a crucial test... Will we see a move towards $0.85? 💎 SUI/USDT | 15-minute timeframe 💰 Current price: $0.7971 🟢 Entry zone: $0.7930 – $0.7970 🚀 Bullish confirmation: Breakout above $0.8050 🎯 TP1: $0.8100 🎯 TP2: $0.8200 🎯 TP3: $0.8350 🔥 Extended target: $0.8500 🛑 Stop loss: $0.7820 📊 Analysis: A clear bounce from $0.7824, and the price is attempting to hold above the short-term averages. Resistance at $0.8000–$0.8045 is key to the next move. 🐂 Will recover to the $0.85 level, or will sellers regain control? #SUI #Crypto #Bybit #Trading #Altcoins ⚠️ Technical analysis, not a guarantee of profit. Risk management first. ByXIMPACT #ByXIMPACT #WSOT2026 #ارتفاع التضخم الأمريكي وزيادة الرهانات على رفع أسعار الفائدة #شركة SanDisk تعلن عن تقسيم الأسهم بنسبة 8 مقابل 1 #ينخفض بيتكوين إلى أدنى مستوى له في شهرين بعد انتخابات منتصف المدة الأمريكية 🚨 $DOOD$DOODUSDT is waking up again... Is the bullish wave about to begin? 🚀🔥 💎 DOOD/USDT | 15-minute timeframe 💰 Price: $0.001544 🟢 Entry: $0.001538 – $0.001545 🎯 TP1: $0.001552 🎯 TP2: $0.001567 🚀 TP3: $0.001590 🛑 Stop Loss: $0.001518 📊 The price is holding above the moving averages MA7, MA14, and MA28 after a strong upward surge, with a pullback to test the support zone. 🔥 A break above $0.001567 could open the door for a new bullish wave! 🐂 Will $DOOD be the next market surprise? #DOOD #Crypto #Bybit #Altcoins #Trading ⚠️ Technical analysis is not a guarantee of profit. Risk management first. @ByX
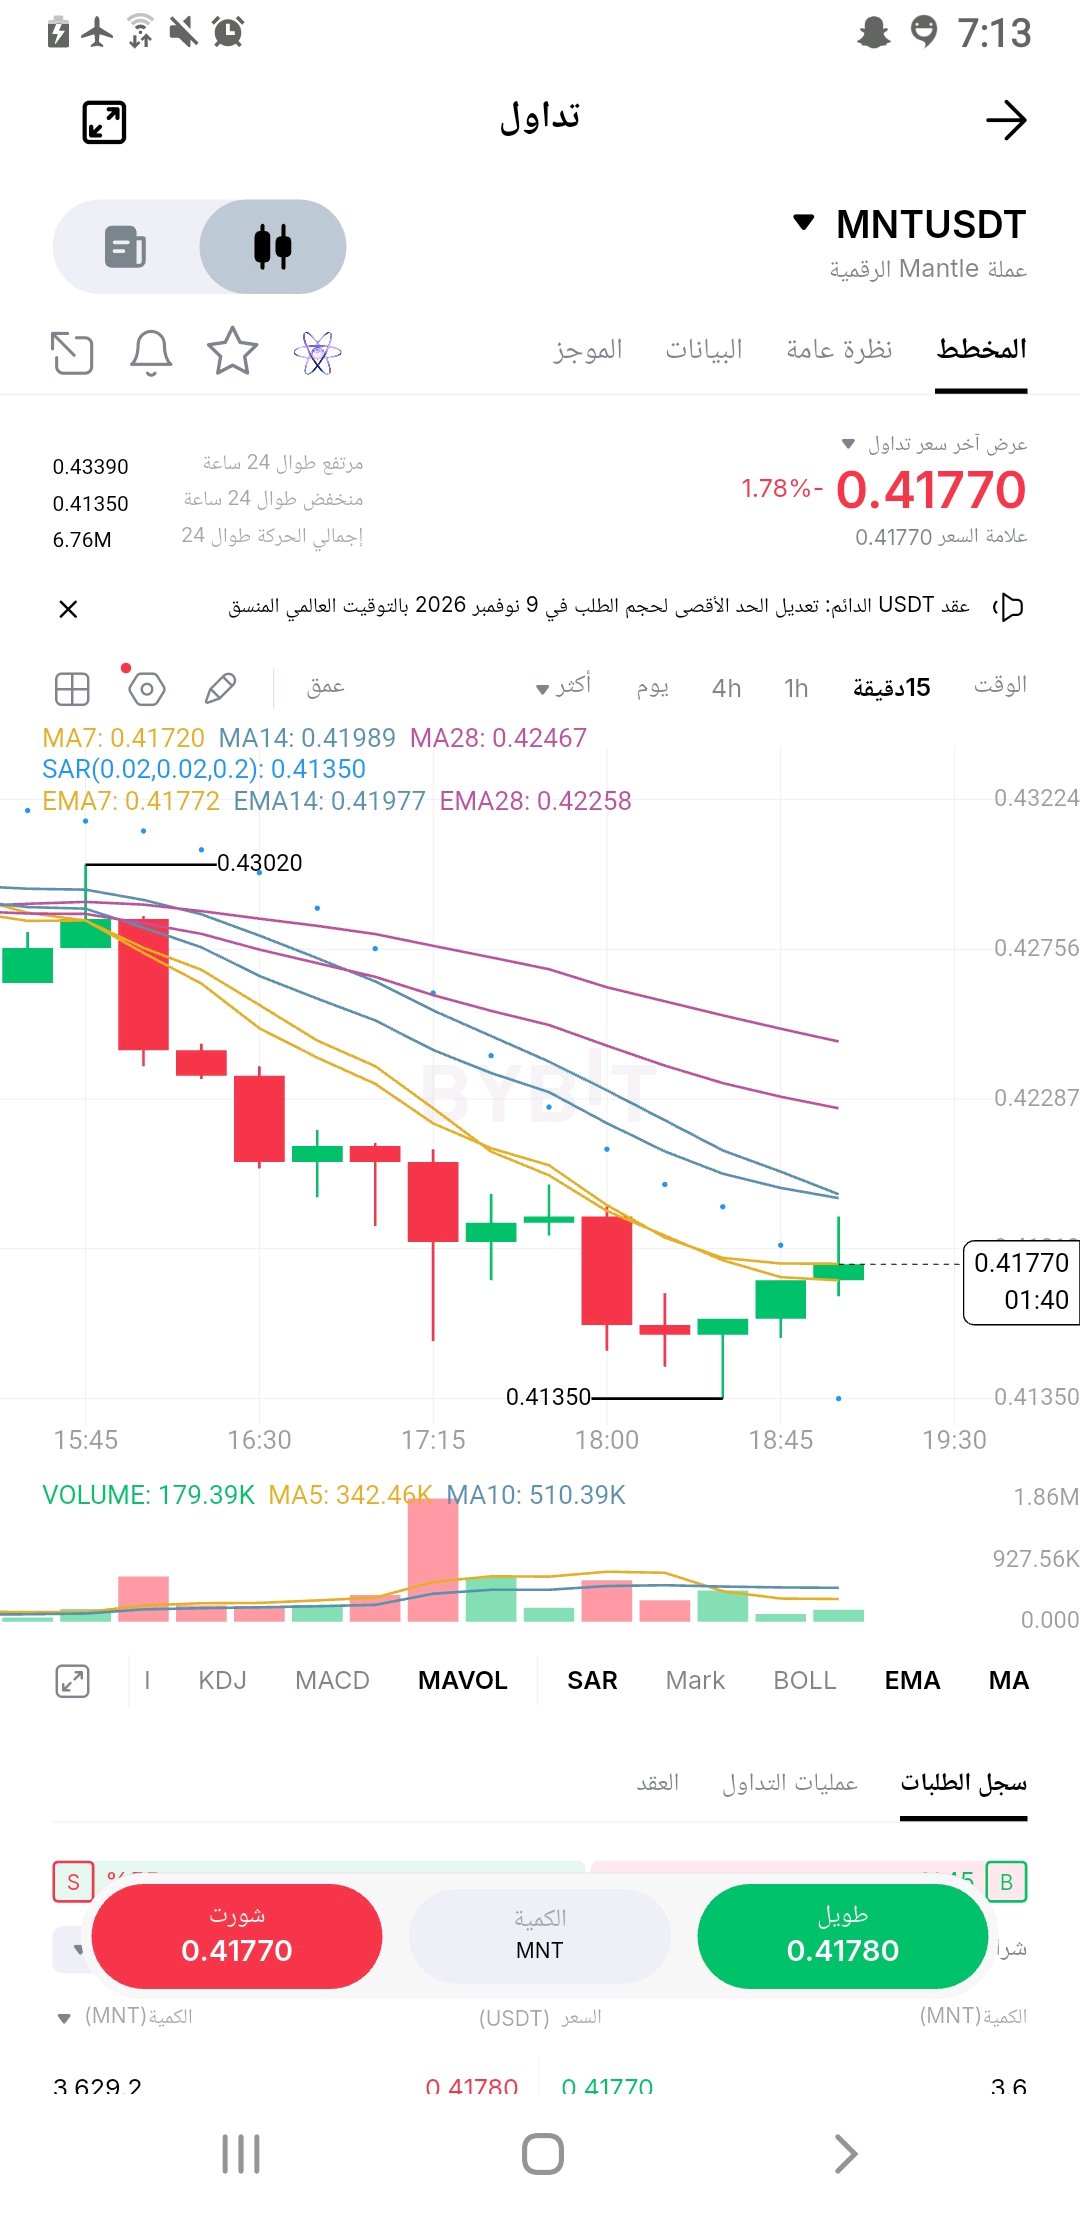
🚨 MNT is poised for a strong move! Has the bullish bounce begun? 🔥 💎 MNT/USDT | 15-minute timeframe 💰 Current price: $0.4177 🟢 Entry zone: $0.4170 – $0.4190 🚀 Bullish confirmation: Breakout above $0.4200 🎯 TP1: $0.4225 🎯 TP2: $0.4245 🎯 TP3: $0.4280 🛑 Stop loss: $0.4130 📊 A bounce from the $0.41350 support is underway as the price attempts to regain momentum, but the trend still needs confirmation with a break above the $0.4200 resistance. 🔥 All eyes are on MNT... Will we witness a new surge? #MNT #Crypto #Bybit #Trading #Altcoins ⚠️ Technical analysis is not a guarantee of profit. Risk management is key. #WSOT2026 #ارتفاع التضخم الأمريكي وزيادة الرهانات على رفع أسعار الفائدة #كشوف المرتبات الأمريكية وقرارات أسعار الفائدة تحرك الأسبوع الاقتصادي #مراقبة مؤشر أسعار المستهلك الأمريكي لشهر نوفمبر $MNTUSDT #ByXIMPACT $SUIUSDT @ByX
It collapses versus HYPE awakens!
🚨 Dual Technical Analysis: AAVE $AAVEUSDT is collapsing vs. HYPE$HYPEUSDT is waking up! Is it time to enter? Based on the attached charts (ultra-short timeframe - minutes/hours), we notice a sharp divergence in price behavior between the two coins. Here is the precise technical breakdown of each: 🔴 First Chart: AAVE/USDT (Bearish Performance) Timeframe: Appears to be 15-minute or 1-hour. Current Price: $112.90 (sharp decline of -8.41%). · Price Structure: Very strong downtrend. The price has broken successive support levels (highest peak at 125.25). · Moving Averages (MA/EMA): All stacked above the price (between 113.82 and 119.16). The price is trading below the shorter average (EMA7 = 113.90), preventing any upward attempt for now. · Parabolic SAR: Dots are above the candles (at 114.54), confirming the continuation of the bearish momentum. · Liquidity (Order Book): Selling ratio is higher (52%) vs. buying (48%). Speculators prefer selling. · Trading Volume: There was a massive previous red candle with very high trading volume, followed by a green candle (a breath-catching attempt), but it did not break any notable resistance. · Summary: The situation is dangerous for buyers. There are no reversal signals so far. Current support at 110.79 (recorded low) is the last line of defense before further downside. 🟢 Second Chart: HYPE/USDT (Bullish Performance) Timeframe: 15-minute timeframe. Current Price: $71.222 (-2.94% daily decline, but a very strong recent recovery). · Price Structure: Strong V-shape rebound from the bottom at 69.526. The current price is testing a critical resistance zone (71.300) which it recently broke upward. · Moving Averages (MA/EMA): Fast averages (MA7 and EMA7) crossed upward, piercing through the slower averages. The price is trading clearly above the averages (70.681 to 70.884), giving a bullish momentum signal. · Parabolic SAR: Dots are below the candles (at 69.663), confirming buyer dominance. · Liquidity (Order Book): A very clear imbalance! The buying ratio reaches 85% vs. 15% selling. This is massive buying pressure. · Trading Volume: Very high trading volumes accompanying the rising green candles, indicating real money entering to push the price up. · Summary: The situation favors buyers. Breaking the 71.300 level with such high volume gives a positive signal, though caution is required for a retest. 💡 Final Evaluation and Trading Advice: | Comparison Point | AAVE/USDT | HYPE/USDT | |---|---|---| | **Trend** | Bearish | Short-term Bullish | | **Liquidity** | Balanced (slight selling bias) | Massive buying pressure (85%) | | **Moving Averages** | Strong resistance above price | Strong support below price | | **Opportunity** | Wait for reversal confirmation | Quick scalping opportunity | #WSOT2026 #شركة SanDisk تعلن عن تقسيم الأسهم بنسبة 8 مقابل 1 #ينخفض بيتكوين إلى أدنى مستوى له في شهرين بعد انتخابات منتصف المدة الأمريكية #ByXIMPACT @ByX #الذكرى السنوية الثامنة لمنصة Bybit

US inflation stronger than expected
# Digital Gold (XAUT$XAUTUSDT ) Analysis: A real test of support levels amid macroeconomic pressures Digital Gold (XAUT) is facing clear selling pressure in line with the overall performance of gold, affected by the strength of the US dollar and Federal Reserve monetary policy expectations, while spot markets witness serious attempts to absorb this decline. ### Economic Landscape and its Impact on Digital Gold XAUT is currently trading near **$3,971.5**, recording a 1.82% decline over the past 24 hours, coinciding with raw gold dropping to a one-week low. These pressures are driven by stronger-than-expected US inflation data, which pushed the dollar to a 19-month high and reinforced expectations of a rate hike. On the other hand, a striking divergence in market structure stands out: **99% of liquidations** were concentrated on leveraged long positions, while spot markets recorded positive net cash inflows of **$4.6 million**, reflecting a genuine desire from spot investors to seize opportunities at support levels. ### Physical Backing and Fundamentals XAUT rests on a solid safety base, as Tether reserves reports confirm the existence of **827,417.63 ounces** of pure gold in Swiss vaults, valued at over $3.44 billion, supported by strong growth in customer holdings by 73% since last December. Despite the strength of this physical backing, the price remains governed by the general trend of gold in global markets. ### Key Figures for Current Movement: * **Current Price:** $3,971.5 * **Immediate Support:** $3,961.6 * **Immediate Resistance:** $4,053.5 * **Recovery Reference:** $4,100 * **Spot Net Inflow (24h):** +$4.6 million * **Spot Trading Volume:** $51.12 million * **Futures Volume:** $231.81 million ### Upcoming Technical Scenarios: * **Bullish Confirmation:** Requires buyers to defend the **$3,961.6** support level and successfully break through the **$4,053.5** resistance, leading to a sustained stabilization above **$4,100** supported by continued spot cash inflows. * **Bearish Confirmation:** Any decisive breakdown below the current support level will maintain the negative structure under the pressure of dollar strength and successive liquidations. The current stance represents a real test of support levels, awaiting the stabilization of overall gold prices to confirm the next recovery trend. #XAUTUSDT #ByXIMPACT $BTCUSDT #WSOT2026 #ينخفض بيتكوين إلى أدنى مستوى له في شهرين بعد انتخابات منتصف المدة الأمريكية @ByX #مراقبة مؤشر أسعار المستهلك الأمريكي لشهر نوفمبر #موجة بيع في تقنيات الذكاء الاصطناعي تمحو 2.5 تريليون دولار من مؤشر ناسداك 100 #ByXIMPACT

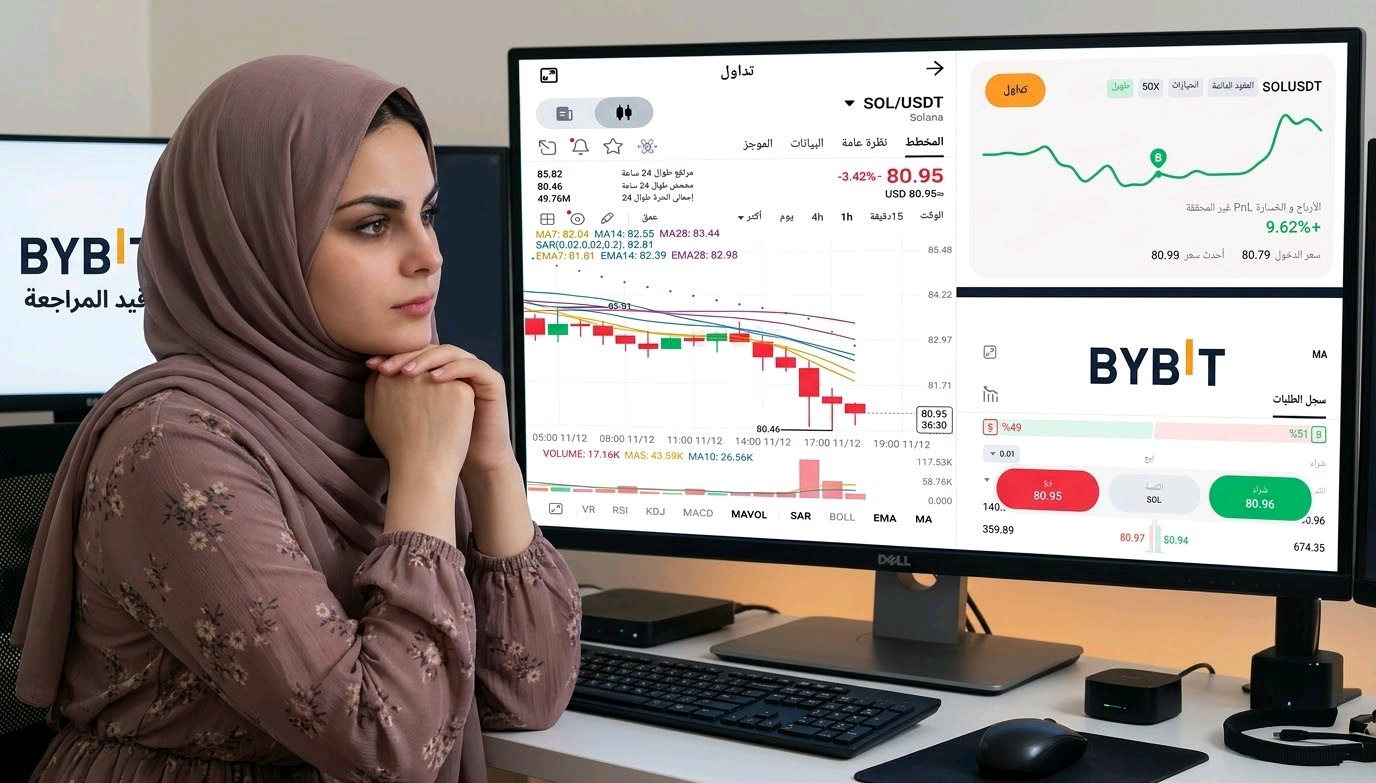
SOLUSDT$SOLUSDT – I am bullish on a recovery toward $125, but there is a much closer battle that will decide everything. Look at the difference between my two charts: the daily structure remains bearish, with sellers pushing SOL toward $82. But the weekly chart tells a different story. The price has returned to the demand zone between $77 and $93, the exact wider zone that triggered the previous expansion toward $125. This is why I am interested in this long opportunity. The selling has been strong, but SOL is approaching an area where buyers previously showed real strength. I do not believe the bottom is confirmed yet; what I believe is that this zone offers an interesting place to look for a recovery with clearly defined risk. The $100.77 Problem Before anticipating a move to $125, I need to see SOL reclaim the $90-$93 zone. That would be an encouraging first step, but $100.77 is the most critical hurdle. This level previously acted as support; now it sits above the price, and sellers may use it to defend the current downtrend. If buyers reclaim the $100.77 level and maintain their strength, my next upside levels are $113.40 and ultimately $124.95-$124.72. Here is what makes this setup interesting: even a recovery to $100.77 would provide about a 2.14 risk-to-reward ratio (R) from my specified entry point. The full move toward $124.72 offers much more than that, but it also requires a much larger change in market structure. **My Trading Plan and Risk Management** My new daily setup is defined at: * Entry reference: $82.10 * Stop loss: $73.37 * Main target: $124.72 * Extended resistance: $124.95 Potential upside: 51.91% Defined downside: 10.63% Theoretical risk-to-reward ratio: 4.88:1 These calculations apply to the specified entry prior to plotting and slippage. A different entry changes the ratio. I am watching buyers for daily candle stabilization and defense of the weekly demand zone. Any sustained weakness below roughly the $77 level would seriously damage the recovery thesis, while $73.37 is the final invalidation level for this setup. I am very optimistic about SOL's recovery potential, but I do not confuse a major support zone with a confirmed trend reversal. The $125 target is ambitious; the opportunity near $82 is what catches my attention. Now I want to see if buyers can turn this weekly support test into the beginning of a meaningful recovery. #US_Inflation_Rise and increased bets on interest rate hikes #SanDisk Corporation announces an 8-for-1 stock split #Bitcoin drops to a 2-month low following the US mid-term #WSOT2026 elections #ByXIMPACT #شركة SanDisk تعلن عن تقسيم الأسهم بنسبة 8 مقابل 1 #ارتفاع التضخم الأمريكي وزيادة الرهانات على رفع أسعار الفائدة #مراقبة مؤشر أسعار المستهلك الأمريكي لشهر نوفمبر $XAUTUSDT @ @ByX
$XRPUSDT $XRPUSDT $GRAMUSDT @– チャート上でリスクリワード比5:1のセットアップが現れています。しかし、潜在的な49%の上昇幅よりも、次の日足の終値に私が特に注目しているのには理由があります。 XRPは重要なサポートレベルをいくつも割り込み、弱気なインバランスを複数残しています。市場構造は数週間にわたって売り手が支配しており、このトレンドが突然消滅したかのようなふりをするつもりはありません。 現在の違いは、価格が到達した地点にあります。 日足チャートの左側を見てください。以前の大きな上昇の起点付近、$1.00〜$1.07の範囲にオーダーブロックが存在します。XRPはそのゾーンに戻っており、直近のローソク足は$1.0363レベルをテストした後、$1.05付近で推移しています。 私がここでトレンド逆行のロングトレードに興味を持っているのは、底打ちが確認されたからではなく、リスクを限定できるレベルにチャートが到達したからです。 何がこの回復を本物にするのでしょうか? 私の最初の懸念は、買い手が日足終値の連続的な切り下げを止められるかどうかです。このオーダーブロックからの説得力のある反応、そしてその後の高値切り上げは、心強い展開となるでしょう。 最初の上値抵抗は$1.15付近です。その先は$1.20〜$1.25の構造がレジスタンスとなる可能性があり、続いて$1.28〜$1.42付近に大きな日足インバランスがあります。 私の長期ターゲットは依然として$1.5758で、これは特定された弱気オーダーブロック付近です。これは回復が実現した場合の到達点であり、次のローソク足がどこへ向かうかの予測ではありません。 リスク管理 チャート上に描いたロングポジションは、約49%の潜在的な上昇幅に対し9.8%の下落リスクを示しており、指定されたエントリーポイントで理論上5:1のリスクリワード比となります。 私のトレードプランでは、$0.9616を損切りの目安として設定しています。正確なリスクリワード比は、チャートの図から想定するのではなく、実際のエントリー、ストップロス、ターゲットから計算する必要があります。 $1.00レベルを維持できずに下回るようなことがあれば、需要が支えられていないという早期警戒信号となります。そして、$0.9616のストップロスに達した時点で、このロングトレードは無効となります。 回復の機会については楽観的ですが、日足トレンドは依然として売り手の優位にあります。これは行動の変化を捉えようとするリスク限定の試みであり、新しい強気トレンドの確認ではありません。 遠くのターゲットがあるからこそ、この機会を検討する理由になります。このオーダーブロック内で買い手が何をするかが、このトレードが信頼に値するかを決定づけるでしょう。 #IMPACTbyTrade $XRPUSDT #WSOT2026 #Bybit8周年記念 #11月米国CPIウォッチ #ドイチェ銀行、デジタル資産カストディを開始 #IMPACTbyTrade @ByX @ByXIMPACT

HYPE$HYPEUSDTは奇妙な矛盾に直面しています。Hyperliquidプラットフォームは多額のプロトコル収益を上げていますが、主要な新規取引所に上場したにもかかわらず、そのトークンは72ドルの水準を維持するのに苦戦しています。 HYPEは72.03ドル近辺で取引されており、24時間で約0.26%下落、7日間では6.02%の下落となっています。価格は70.58ドルから74.38ドルの間で推移しており、70.58ドルの水準が当面のサポートとして注目されています。このコインは、9月の史上最高値である97.98ドルを約26.5%下回る水準で推移しています。 最新のカタリストは11月10日のUpbitへの上場で、これによりHYPEは韓国のトレーダーに対し、韓国ウォン(KRW)、ビットコイン(BTC)、テザー(USDT)市場を通じてアクセスが可能となりました。しかし、この上場は持続的なラリーにはつながりませんでした。これは、市場参加者が現在、取引所へのアクセス拡大よりも、広範な売り圧力や市場のポジショニングにより注目していることを示しています。 プロトコル収益はより強力な主要指標であり、Hyperliquidは過去30日間で約8958万ドルの手数料と6882万ドルのプロトコル収益を生み出しました。同プラットフォームのAssistance Fundは、プロトコル手数料の大部分をHYPEの市場買い付けに充てており、取引活動とトークン需要の直接的なリンクを作り出しています。採用されたAQAv2フレームワークも、リザーブ利回りからの寄付を基金に追加しています。これらは意味のある価値蓄積メカニズムですが、取引活動、取引所残高、市場環境に依然として依存しています。 機関投資家の関心も変化し始めています。Strategiesは第3四半期の純利益として6億2060万ドル(HYPEの未実現利益8億300万ドルを含む)を報告し、米国での先物取引業者としての登録を求めました。しかし、同社のエクスポージャーや財務状況を、直接的なプロトコル収益やHYPEへの保証された需要と混同すべきではありません。 デリバティブ市場を見ると、レバレッジが高い状態が続いています。先物取引高は現物取引高の約7.5倍であり、オープンインタレスト(未決済建玉)は約32.3億ドル(323万ドルから修正)となっています。資金調達率(ファンディングレート)は0.0094%とプラスを維持しており、直近の清算の約65%はロングポジションによるものです。ポジショニングは活発ですが、市場はまだ現物主導の蓄積への決定的なシフトを見せていません。 主要指標: $72.03 – 現在価格 $70.58 – 当面のサポート $74.38 – 当面のレジスタンス $78.00 – 次の回復ターゲット 182億ドル – 時価総額 2億1339万ドル – 24時間現物取引高 16億ドル – 24時間先物取引高 32.3億ドル – オープンインタレスト +0.10% – 24時間オープンインタレスト変動 0.0094% – 資金調達率 139万ドル – 24時間清算額 6882万ドル – 30日間プロトコル収益 2億5290万HYPE – 流通供給量 9億5000万HYPE – 最大供給量 強気な確認シグナル:HYPEは70.58ドルの水準を守り、より強力な現物取引の参加を伴って74.38ドルを奪還する必要があります。継続的なプロトコル収益と買い戻し活動に裏打ちされた持続的なブレイクアウトがあれば、回復の見通しは改善するでしょう。 弱気な確認シグナル:70.58ドルの水準を決定的に割り込むと、さらなる下落を招く恐れがあります。現物の需要が弱いまま先物のポジションが高止まりした場合、レバレッジをかけたロングポジションの清算が下落を加速させる可能性があります。 Hyperliquidは、分散型金融(DeFi)において最も強力な「収益からトークン需要へ」のメカニズムの一つを備えています。しかし、重要なテストは、プロトコルの活動が市場の売りと将来の供給を吸収するのに十分な買い戻し主導の需要を生み出し続けられるかどうかです。ビジネスは収益を生み出しており、HYPEの価格は依然としてその強さを反映する必要があります。 #HYPEUSDT #ByXIMPACT @ByXIMPACT @ByX #ByXIMPACT $BTCUSDT #WSOT2026 #原油価格の変動がイランの和平交渉に連動 #AnthropicIPOValuationTest #Bybit8周年記念

A8リカバリー vs トークンアンロックテスト
A8は6%近く反発していますが、供給の大幅な増加が迫っています。この回復は、さらなるトークンが市場に流入する前に買い手を引き付けられることを証明する必要があります。Ancient8は0.003056ドル付近で取引されており、24時間で約6.07%上昇していますが、過去7日間では依然として17.87%の下落となっています。価格は0.002883ドルから0.003279ドルに向けて回復しましたが、全体的なトレンドは依然として弱含みです。週間最高値の0.004872ドルは、現在の市場価格を依然として大きく上回っています。ファンダメンタルズの観点から見ると、Ancient8は単なるゲームトークンではなく、ゲームインフラを目指しています。OP StackとCelestiaのデータ可用性(Data Availability)を利用したイーサリアムのレイヤー2アーキテクチャ上に構築されたこのプロジェクトは、Web3ゲーム向けのインフラストラクチャと配信ツールを提供しています。長期的なチャンスは、開発者の誘致、実際のプレイヤーの維持、そしてエコシステム内で継続的なアクティビティを生み出せるかどうかにかかっています。しかし、インフラだけではA8の需要は保証されません。Ancient8を利用するゲームが有意義なトランザクションを生み出し、その活動がトークンにとって持続可能なユーティリティを生み出しているという証拠が市場には必要です。目先の最大の懸念は供給面です。発行上限10億A8に対し、約6億6355万A8が流通しています。11月17日には新たに2061万A8のアンロックが予定されており、これは総供給量の2.1%、現在の時価総額の約3%に相当します。このアンロックには、インサイダー、投資家、コミュニティ、財団への割り当てが含まれています。アンロックされたすべてのトークンが売却されるわけではありませんが、流動性が比較的薄い中でのタイミングは重要です。もう1つ重要な市場の詳細として、A8には現在、入手可能な市場データにおいて確立された無期限先物市場が存在しません。つまり、オープンインタレスト、資金調達率(ファンディングレート)、清算数値によってレバレッジのかかったポジションを確認することはできません。これは主に現物主導の市場であり、取引所の流動性とオーダーブックの深さが特に重要となります。 主要数値 0.003056ドル — 現在価格 0.002883ドル — 直近のサポート 0.003279ドル — 直近のレジスタンス 0.003430ドル — 次の回復の目安 202万ドル — 時価総額 50万7800ドル — 24時間の現物取引高 6億6355万A8 — 流通供給量 10億A8 — 最大供給量 66.4% — 流通供給率 2061万A8 — 11月17日の予定アンロック数 2.1% — 総供給量に対するアンロック割合 強気の確認:A8は0.002883ドルを防衛し、より強い現物取引高を伴って0.003279ドルを上抜ける必要があります。そのブレイクアウトを維持できれば、0.003430ドル、そして将来的には0.0040ドル台への回復が見えてくるでしょう。 弱気の確認:0.002883ドルを割り込むと、目先の回復の試みは無効となります。流動性の低さと11月17日のアンロックが重なり、下値のボラティリティが増大する可能性があります。 Ancient8には認知度の高いゲームインフラとしての方向性がありますが、トークンは、供給が流入し続ける中でエコシステムの採用を実際の需要に変換するという困難なテストに直面しています。価格の回復とアンロックが同時に到来するため、今後数回のセッションが重要となります。 $$A8USDT #ByXIMPACT

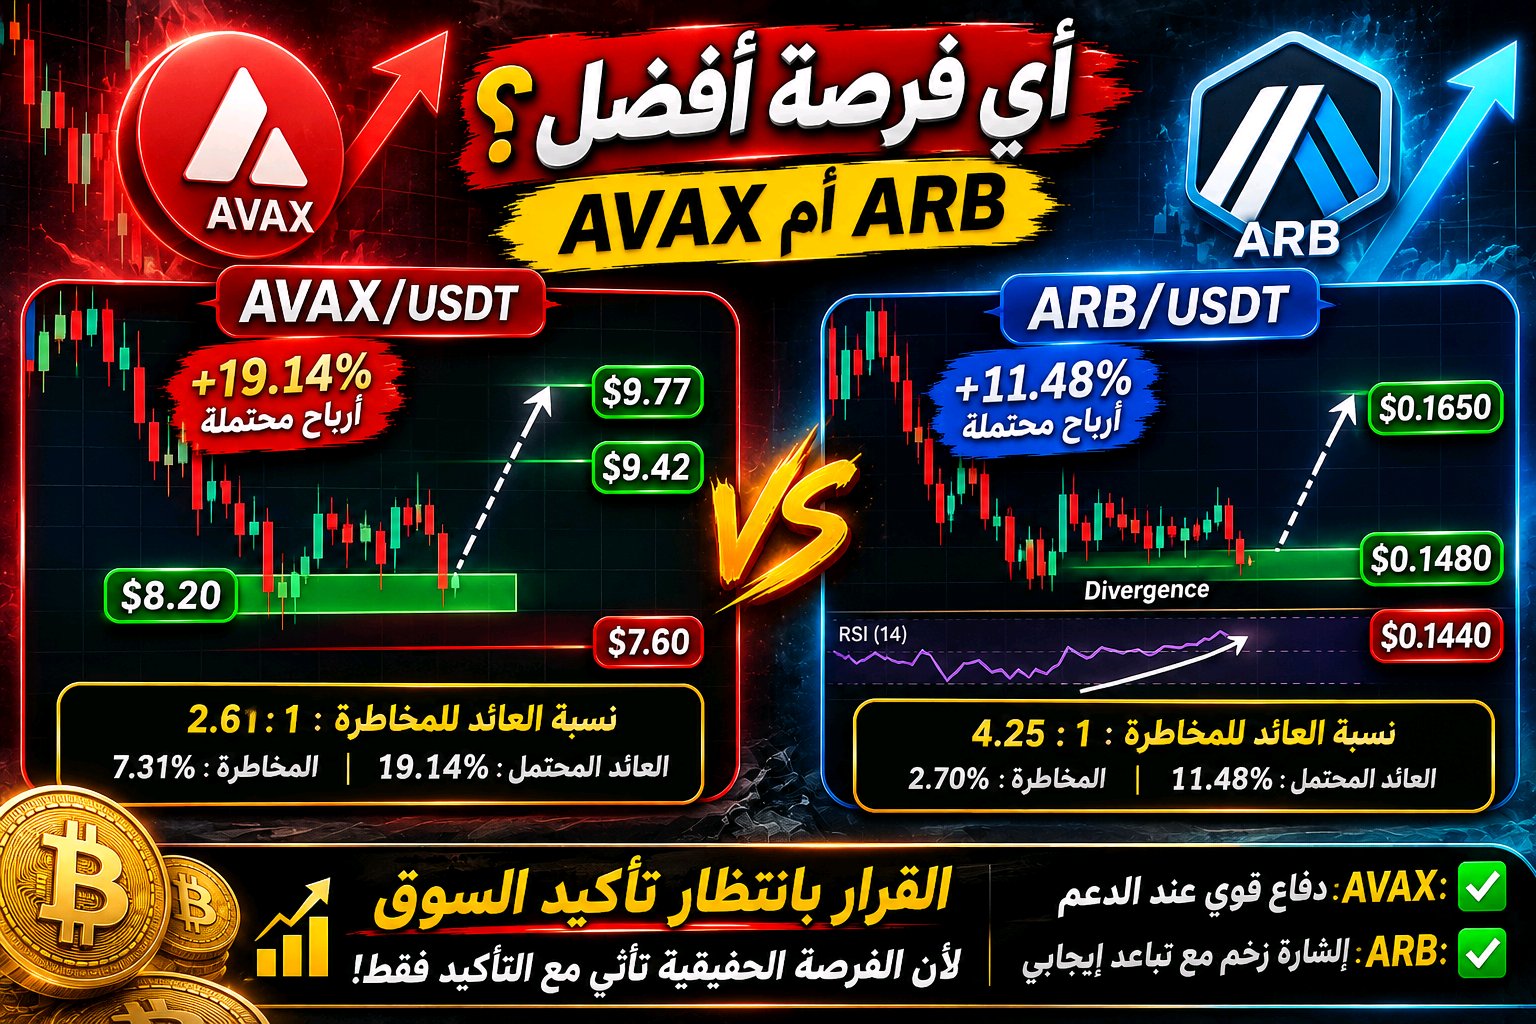
AVAX vs. ARB Trade Setup
Hey, $AVAXUSDT offers nearly 19% potential upside, ARB offers around 11% but the bigger target doesn't automatically make AVAX the better opportunity i've been comparing both charts, and the interesting part isn't how far they could rally. It's how differently buyers are behaving near their recent lows AVAX buyers are facing a serious test After falling from above $12.00, AVAX is back inside the $7.70-$8.20 daily support area. This region supported a major rally before, but the current downtrend hasn't reversed yet chart marks $8.20 as the long entry reference. A convincing defense of this support could open a recovery toward $9.42, followed by $9.77 that second level is my main target, representing approximately 19% upside concern is simple: historical support doesn't mean buyers must defend it again. I want to see price stabilize rather than assume the bottom is already in $ARBUSDT price and momentum are telling different stories Arbitrum has an interesting 4H divergence developing, price has been making lower lows while RSI has formed higher lows. That's an early indication that selling momentum may be weakening but RSI is still around 19.96, below its average near 30.54. So the divergence deserves attention, not blind confidence my marked target is $0.1650, with $0.1480 as the entry reference. I want to see buyers recover the nearby $0.1540 area before becoming more confident about that upside move Risk Comparison Most Traders Overlook AVAX: $8.20 entry, $7.60 stop, $9.77 target. Approximately 19.14% potential reward against 7.31% risk, giving 2.61:1 R.R ARB: $0.1480 entry, $0.1440 stop, $0.1650 target. Approximately 11.48% potential reward against 2.70% risk, giving 4.25:1 R.R these are theoretical ratios from my marked prices, before fees and slippage. Neither chart confirms that a new entry has triggered AVAX has the larger upside projection, but ARB offers a slightly higher reward relative to its defined risk. Neither advantage matters if the market fails to confirm the setup i'm bullish on both recovery possibilities. For AVAX, the important evidence is buyers defending daily support for ARB, it's price confirming the momentum divergence with a stronger 4H structure i'm not choosing between them based on which target looks more exciting will watching which one gives me the better reason to take risk #ByXIMPACT
You're in a winning deal
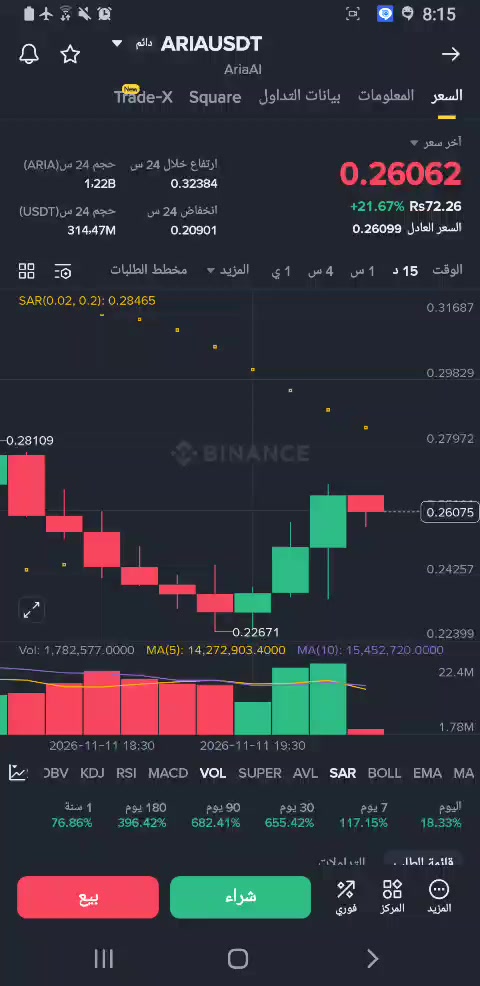
#ByXIMPACT The plan worked, and $ARIA$ARBUSDT did its job. Close the trade here. I hope some of you picked up on this move. Profit: $589 ARIAUSDT Permanent 0.25529 +19.69% My list today includes $INIT and $SPX $SPCXXUSDT If you haven't entered the trade yet (waiting trader): • Avoid buying now (top tip): The current price (0.25921) represents a "chase" after a quick bounce of three green candles. Entering here is very risky, as the last red candle could be the start of a new bearish reversal. • Safe buying scenario (Long): Wait until the price drops back down and tests the support zone (between 0.24200 and 0.24700). If the price reaches this zone and a strong green reversal candle (pin bar) appears, you can enter with a strict stop-loss below the recent low (0.22671). • Breakout scenario: If the price continues to rise strongly and breaks the resistance level at 0.26500, you can enter with the trend. 2. If you are already in the trade (a long position from a lower level): • Take profits immediately: You are in a winning trade, and due to the high volatility of this currency, it is very wise to close a large part of the trade now (e.g., 70-80%) and leave a small portion running with a stop-loss order placed at 0.25000. • Stop-loss is mandatory: Never leave the trade without a stop-loss order, as the SAR indicator is still against you. 3. If you are considering selling (short): • High-risk opportunity: Selling now (short) could be rewarding, as the overall trend is down and the SAR indicator is above the price. However, due to the strength of the recent green candles, the price may rise slightly to test the moving averages. • Entry point: If the price breaks below 0.25500 and a 15-minute candle closes below it, you can enter a short position with a target of 0.24000, placing a stop-loss order above 0.26500. #WSOT2026 #BybitAIEvolving