MDFUNDS
3277いいね0シェア87ファン137フォロー
this user would provide you a more insightful about cryptocurrency with explicit trading analysis.
this user would provide you a more insightful about cryptocurrency with explicit trading analysis.
#Bitcoin #BTCUSDT #CryptoMarket #MDFUNDS
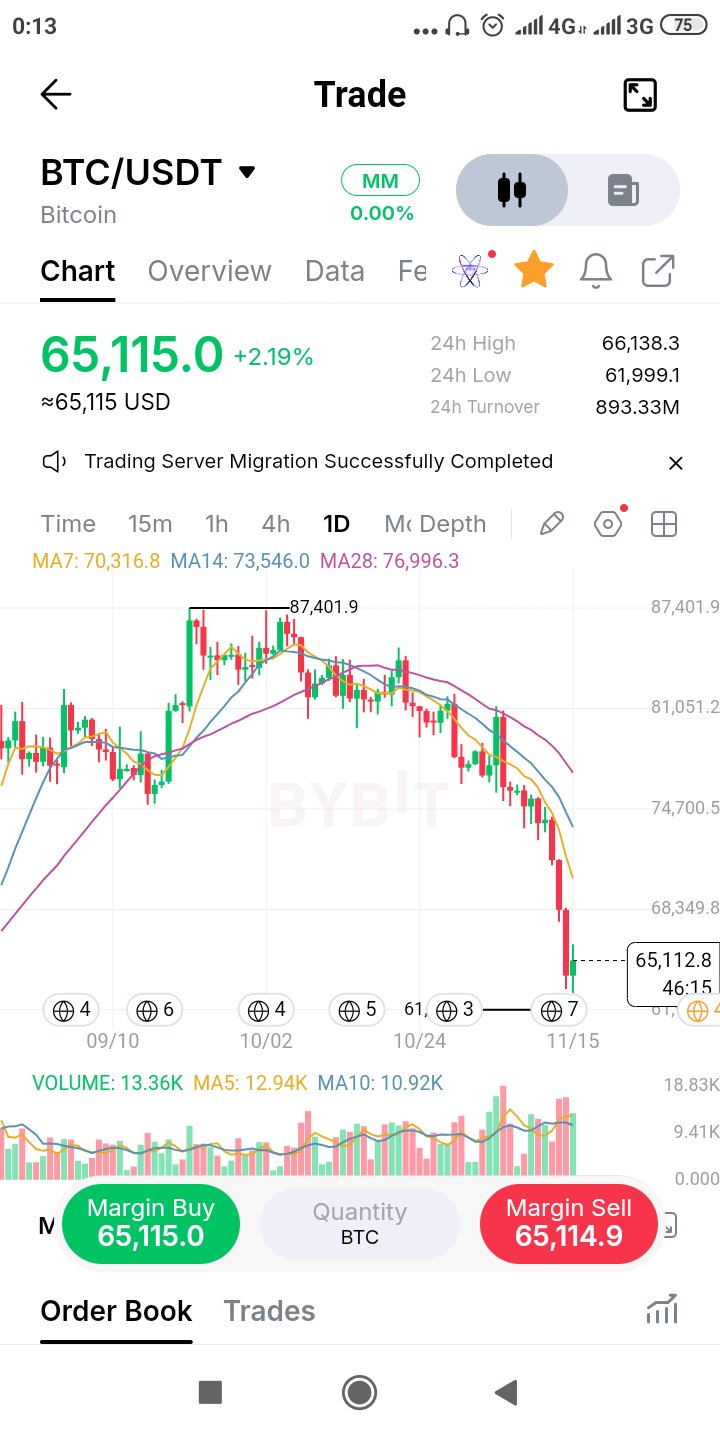
Bitcoin's $62K reaction: Is the market beginning to absorb selling pressure? Bitcoin's daily chart is showing something worth examining beyond the headline price decline. After failing to sustain its advance from the $87,401 peak, BTC entered a persistent sequence of lower highs and lower lows. The latest downside expansion pushed price towards $61,999, where buyers have started producing a visible response. BTC is now trading around $65,115, but the broader structure remains under considerable pressure. Here's the detail that interests me. Daily volume stands at 13.36K, above both its five-day average of 12.94K and ten-day average of 10.92K. That tells us participation has increased during this volatile phase. In Wyckoff terms, increased selling effort followed by a reaction from buyers can be worth monitoring. However, high volume alone does not confirm accumulation or a selling climax. The subsequent price behaviour must provide that evidence. The moving averages reinforce the caution: MA7: $70,316 MA14: $73,546 MA28: $76,996 All three remain above current price, reflecting the prevailing bearish alignment. The levels I'm watching: $61,999 — The immediate downside reference. A decisive loss could expose BTC to another leg lower. $68,350 — The first meaningful recovery hurdle visible on the chart. $70,316 — The daily MA7, which could become an important test of short-term trend recovery. What I want to see is whether BTC can establish a higher low, recover lost resistance and sustain that move with meaningful participation. Until then, calling this a confirmed bottom would be premature. My question to the market: Are we witnessing the early stages of selling-pressure exhaustion, or is this simply a temporary pause before another bearish expansion? #Bitcoin #BTCUSDT #CryptoMarket #MDFUNDS $BTCUSDT #ByXIMPACT
#QNT #Quant #仮想通貨分析 #MDFUNDS
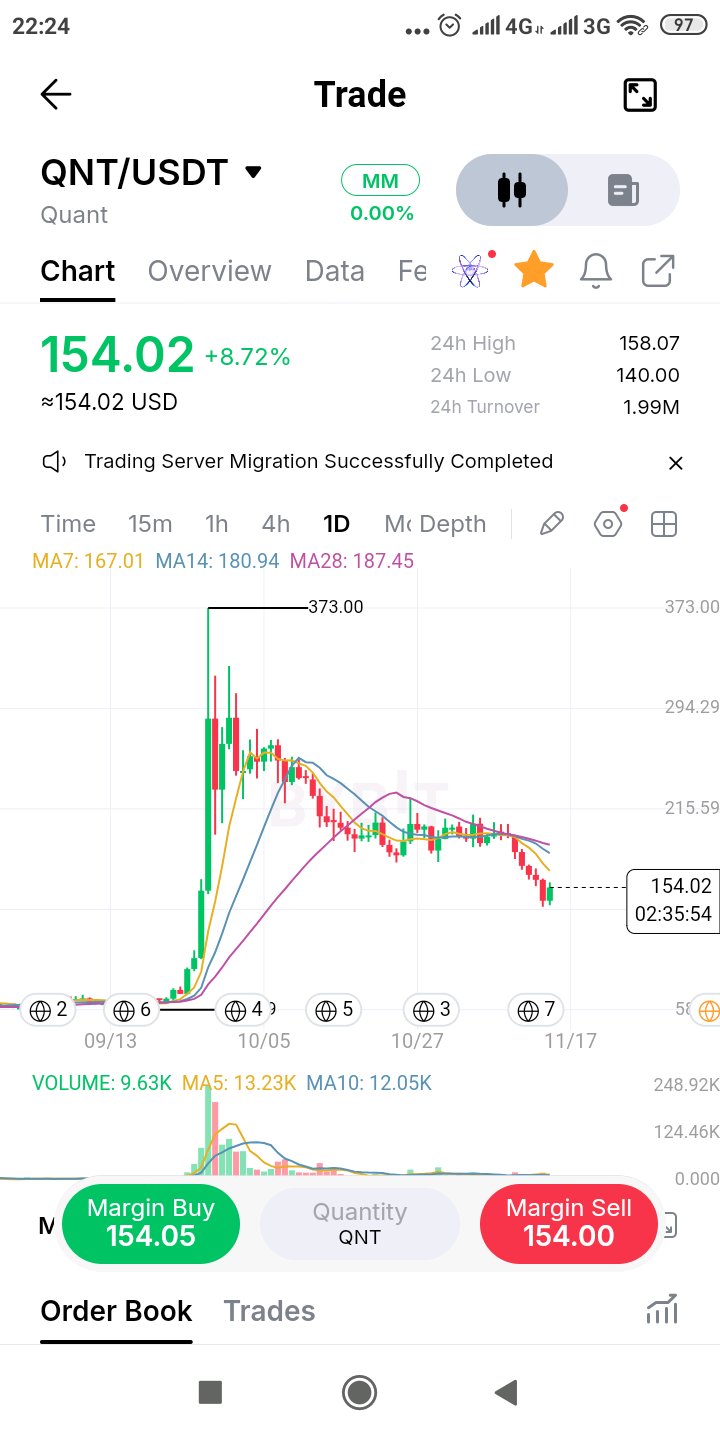
$QNTUSDT — リリーフラリーはトレンド転換ではない QNTは140ドルの領域から急反発し、8.72%上昇して日中高値の158.07ドルに達しました。この反応は重要ですが、これを強気相場への構造的転換と即断するのは時期尚早でしょう。 より大きな視点で見てみましょう。 373ドルへの爆発的な上昇以来、QNTは徐々にその利益を吐き出してきました。市場は長期にわたるディストリビューション(売り抜け)と下落局面を経て、200ドル近辺での安定を試みましたが、その後さらに一段安となりました。 本日の反発は、買い手が安値に反応していることを示しています。しかし、その需要が既存のトレンド構造を覆すほど強力であるかどうかは不透明です。 移動平均線が重要な視点を提供してくれます: MA7: 167.01ドル MA14: 180.94ドル MA28: 187.45ドル 価格はこれら3つの移動平均線をすべて下回っています。つまり、現在の回復は依然として市場の主要な日足トレンドの基準線の下で起きているということです。 特に以下の3つの価格帯に注目しています: 140ドル:直近の日足安値によって確立された、当面のサポートライン。 158〜167ドル:最初の回復の試練。この領域を維持し、MA7を奪還できれば、短期的な見通しは改善するでしょう。 180〜187ドル:次の2つの移動平均線が集中する、より強固な回復ゾーン。 出来高にも注目が必要です。表示されている9.63Kという数字は、MA5とMA10の出来高平均を下回っています。市場参加者が増えるまでは、この反発が本物であることを証明する必要があります。 ここでダウ理論から学ぶ教訓があります。意味のあるトレンド転換には、単なる力強い陽線以上のものが必要です。市場が、これまでとは異なる高値と安値のシーケンスを形成し始める必要があるのです。 私の問い:買い手は140ドルでQNTを防衛し始めているのか、それとも我々は単に、より大きな弱気構造の中での一時的なリリーフラリーを目の当たりにしているだけなのか? $QNTUSDT #ByXIMPACT
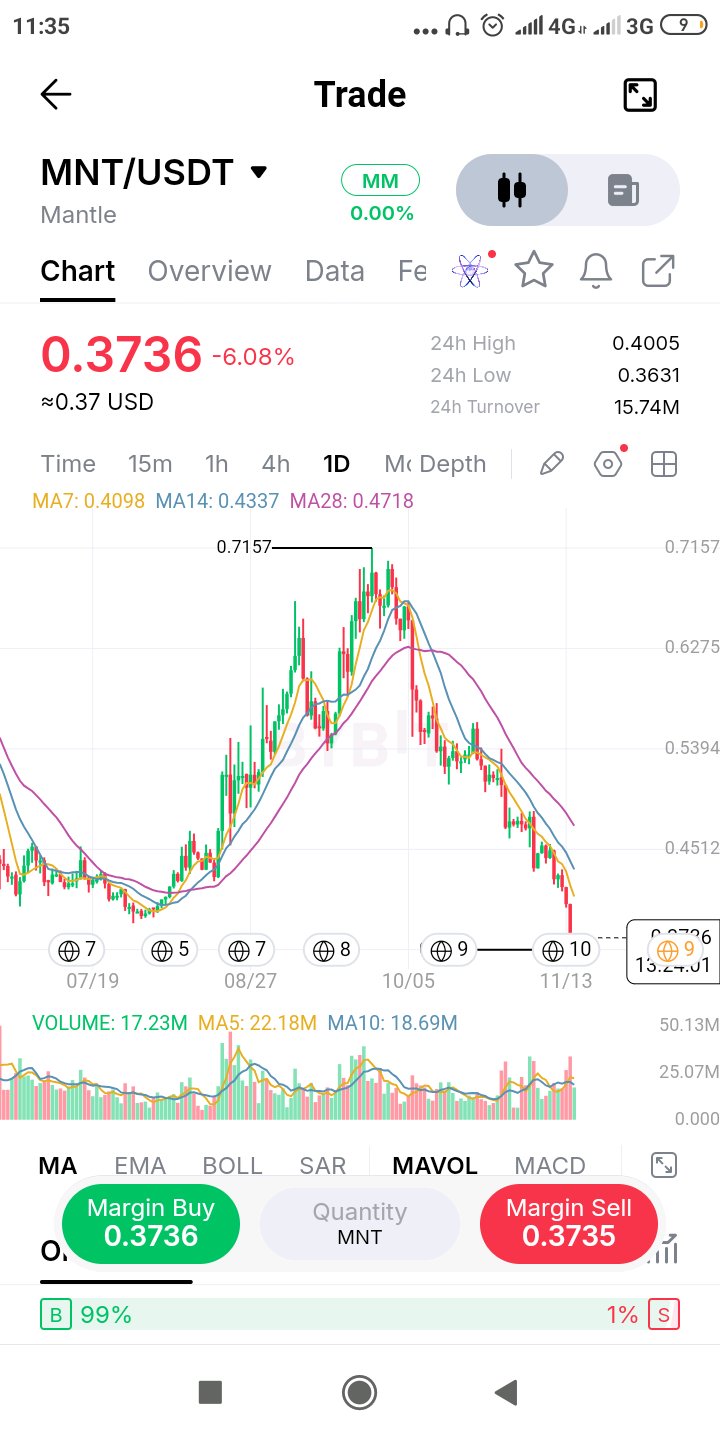
$MNTUSDT's daily candle is still open, and it's the most important one on the chart right now. Price is 0.3736, down 6%, and it has pushed under the July-August base, the floor the whole rally was built on. That's the entire run from the 0.7157 high erased, about 48%. But an intraday break isn't a breakdown. The close decides. A daily close back above roughly 0.385-0.39 turns this into a failed breakdown, the kind that traps late sellers. A close under it confirms the base is gone. If it is gone, the classic measuring rule from Edwards & Magee is the base's own height projected down from the break. That range ran roughly 0.39 to 0.45, which points to the low 0.33s. I'd treat that as a reference level, not a forecast. For bulls, even a bounce has work to do. 0.4005 is the 24h high, then the 7MA at 0.4098, with the 14 and 28 MAs (0.4337, 0.4718) stacked above and falling. Price sits 21% under the 28MA. $MNTUSDT #ByXIMPACT
#PIEVERSE #仮想通貨市場 #アルトコイン #MDFUNDS
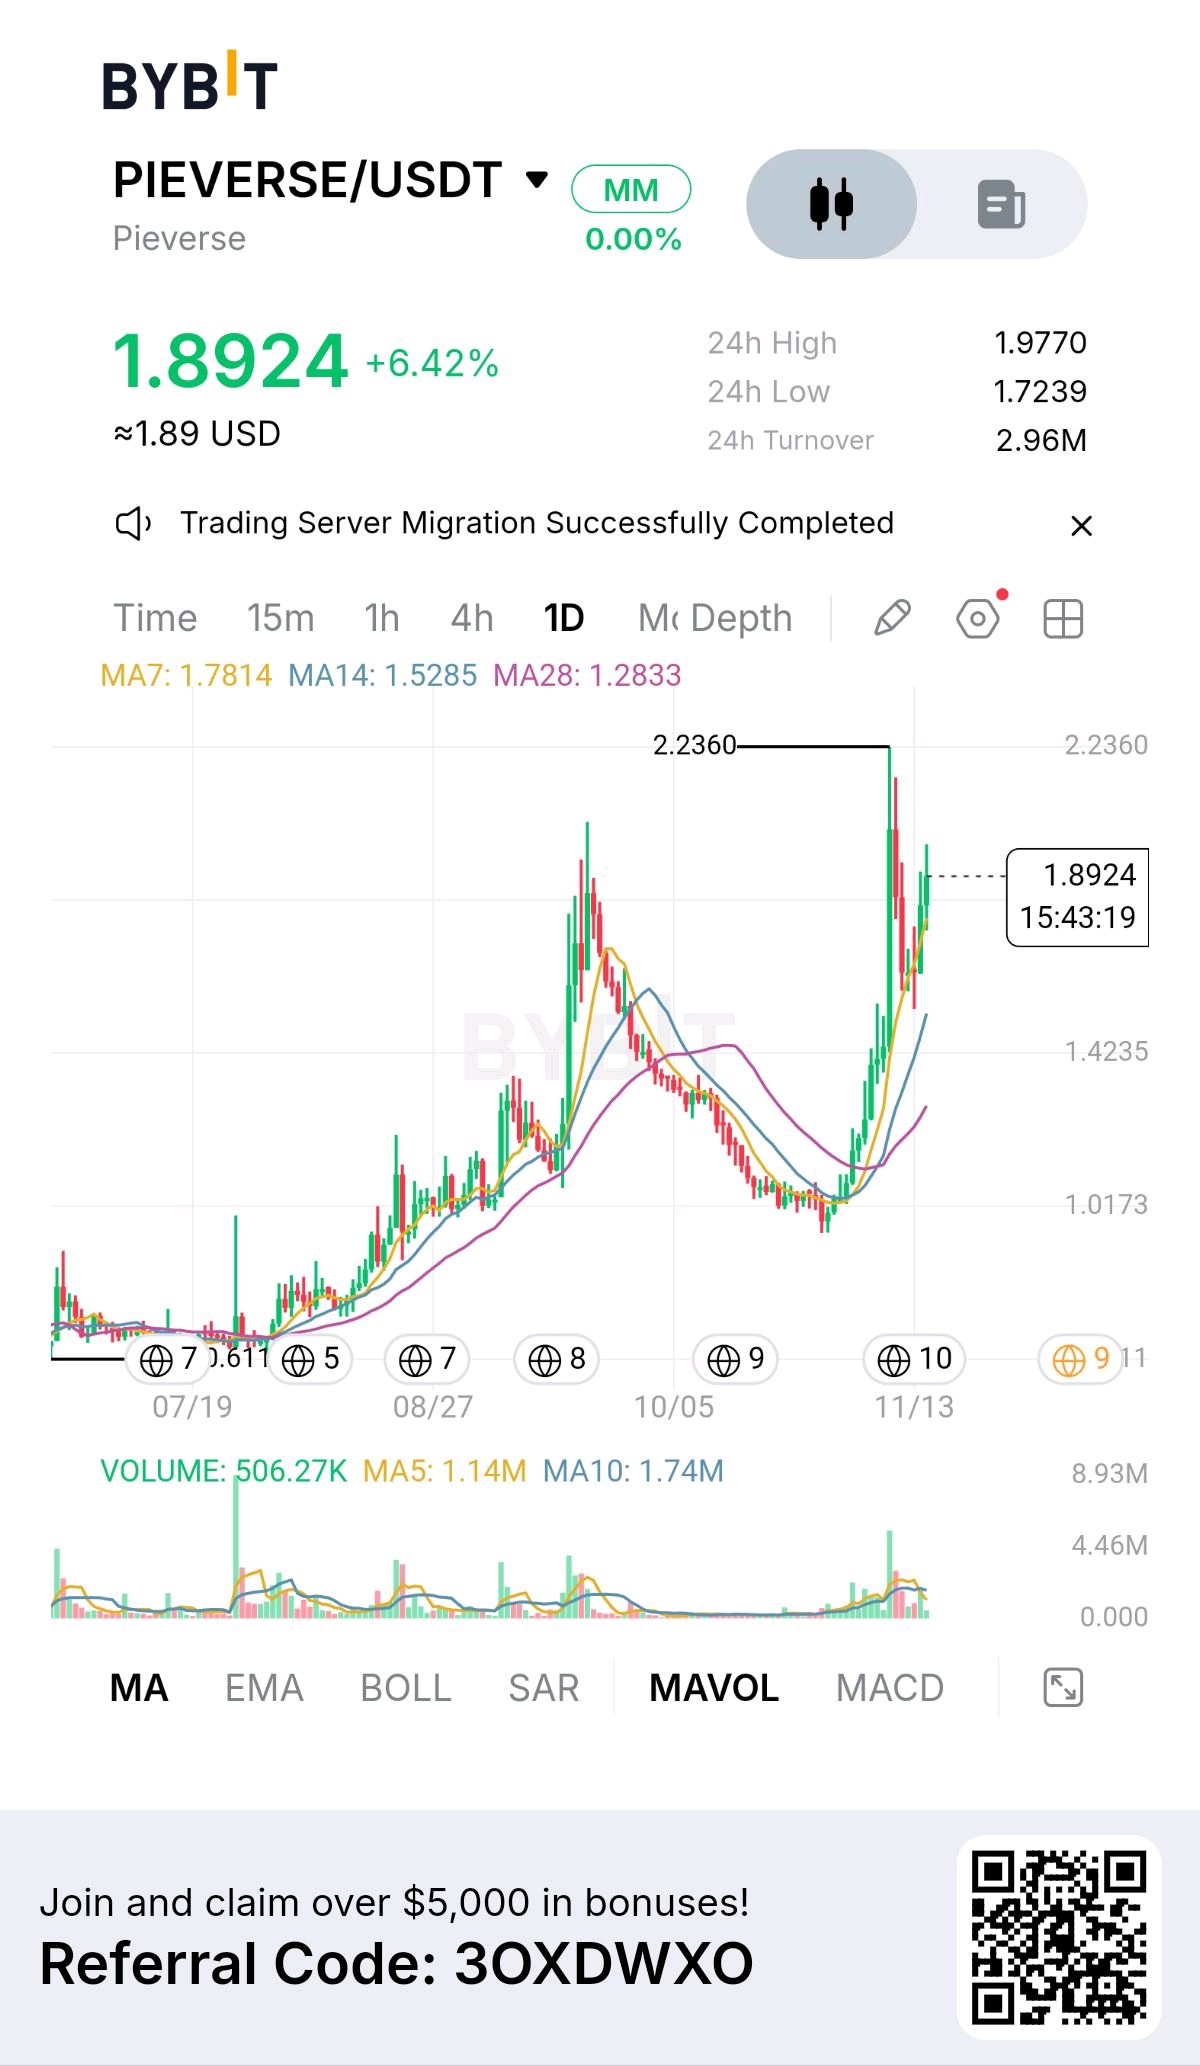
$PIEVERSEUSDT — 買い手が戻ってきましたが、この勢いを維持できるでしょうか? PIEVERSEは日足チャート上で重要な構造的変化を遂げました。 1.00ドル付近に向けて長期間下落が続いた後、市場は急激な上昇を見せ、約2.236ドルに達したところで売り圧力に直面しました。 現在のセットアップで興味深いのは、その後の調整が回復分をすべて打ち消してはいないという点です。価格は1.8924ドルまで反発しており、以下の3つの移動平均線すべての上で取引されています。 MA7:1.7814ドル MA14:1.5285ドル MA28:1.2833ドル この強気の並びは、今回の回復が単なる一日限りの急騰を超えたものになっていることを示唆しています。 ただし、力強い回復と確立された継続的なブレイクアウトを混同しないようにしたいところです。 次の価格反応が重要になるのはここからです。 1.977ドル付近が注目すべき直近のレジスタンスであり、その次が前回の主要なスイングハイである2.236ドル付近です。これらのレベルを明確に突破し、維持することができれば、上昇継続の根拠が強まるでしょう。 下落方向では、7日移動平均線に近い1.78ドルが重要な短期的な基準点となります。このエリアを割り込むと、1.53ドルがより深い基準点となり、調整局面が再燃する可能性があります。 出来高についても疑問が残ります。現在の出来高は506.27Kで、MA5の1.14M、MA10の1.74Mを下回っています。日足のローソク足はまだ形成中であるため、最終的な出来高が重要です。より強い参加を伴わないブレイクアウトには注意が必要です。 私の見解:PIEVERSEは有意義な回復を見せていますが、市場はまだ買い手が直近の高値付近で売り圧力を吸収できることを証明する必要があります。 あなたは、PIEVERSEがさらなる上昇を試みる前に1.78ドル以上でレンジ形成(揉み合い)をするのを期待しますか?それとも、買い手には2.23ドルに直接挑戦するだけのモメンタムがあると考えますか? $PIEVERSEUSDT #ByXIMPACT
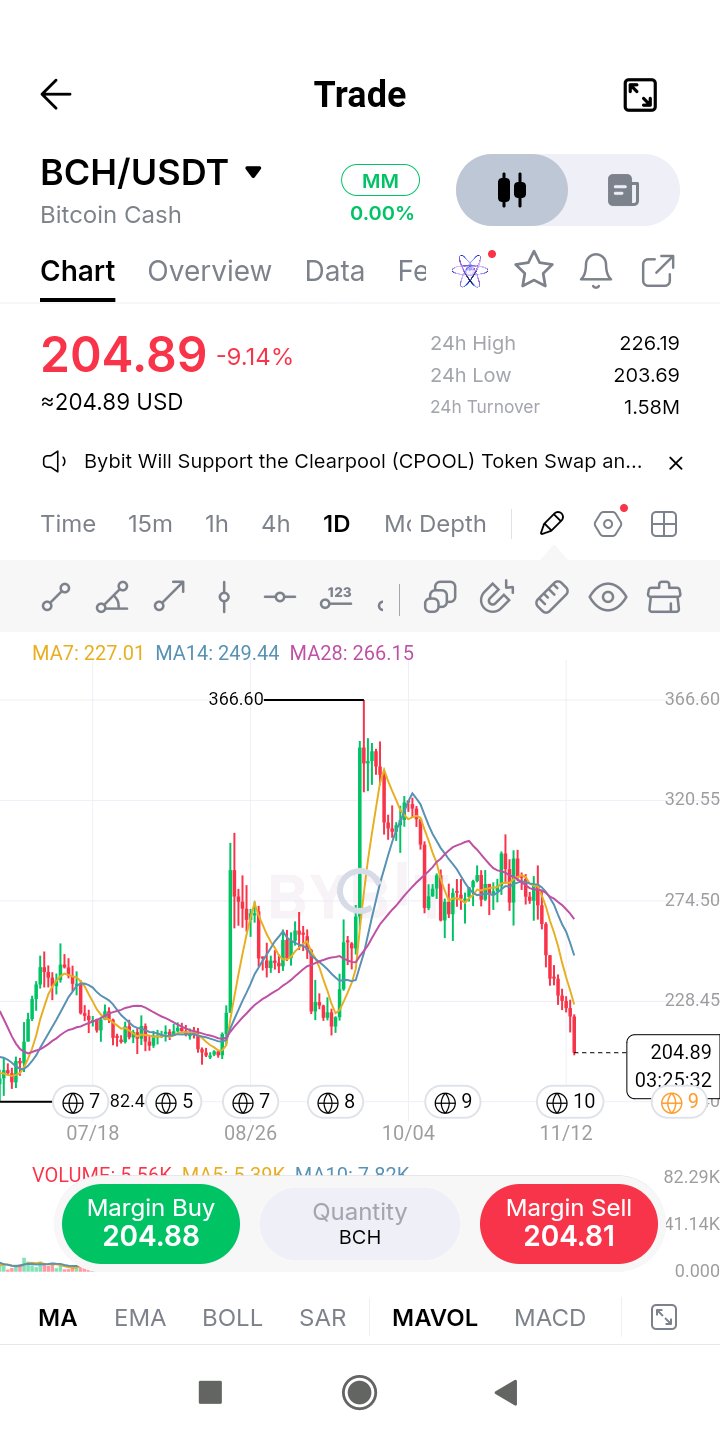
$BCHUSDT が8月のブレイクアウトの起点に戻ってきた。残る疑問は、その水準をまだ誰も気にかけているかどうかだ。 366までの上昇は完全に打ち消された。価格は高値から44%下落し、8月後半の推進力の起点となったベース付近の205近辺で取引されている。こうしたゾーンは、最初の波に乗り遅れた買い手を呼び込むか、それとも突き抜けてしまうかのどちらかだ。今日は激しく試されている。1日で9%下落し、7MA(227)である226で拒絶され、すべての移動平均線が下向きになる中、28MAを23%下回っている。 スタン・ワインスタインのステージ・フレームワークでは、価格が下向きの移動平均線を下回っている状態はステージ4であり、規律として「買ってはいけない」唯一のステージだ。古い発射台があるからといって、それだけで状況が変わるわけではない。まずはベース(基盤)が必要だ。狭いレンジ、出来高の枯渇、そして切り上がる安値だ。 今日の安値203.7を下回ると、次に見える真のサポートは7月の安値182付近で、ここからさらに約11%低い。上値については、回復と呼ぶには227、そして14MAの249付近を突破する必要がある。 $BCHUSDT #ByXIMPACT
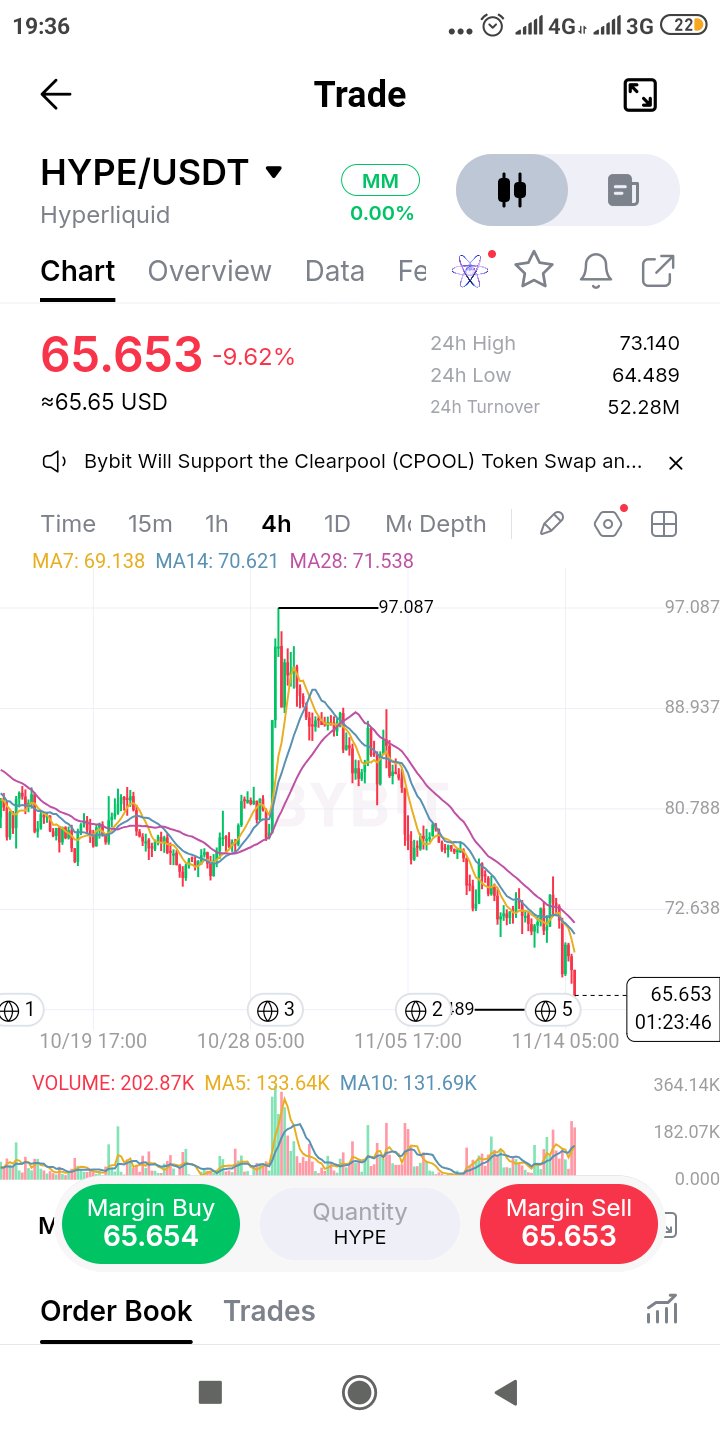
$HYPEは10月の急騰を帳消しにしただけでなく、完全にその上昇分を消し去り、さらに下落を続けています。価格は65.7で、97までの急騰の起点となったベース全体を割り込んでいます。 これが重要なのは、エドワーズ&マギー(Edwards & Magee)の最も古い格言の一つ、「ブレイクされたサポートはレジスタンスになる」からです。10月に支えとなった75~80の棚は、今や上値の重石となっています。より近い水準では、70.6から73.1にかけて14日移動平均線、28日移動平均線、そして24時間高値が重なっており、この帯域は過去24時間ですでに一度価格を押し戻しています。 ブル派が無視すべきではないのは、これが静かな出血ではないということです。価格が下落する中で4時間足の出来高は直近平均を約50%上回っており、この動きには実際の参加者が伴っています。出来高を伴う下落は、通常、何らかの動きの前にリテストを必要とします。 当面のサポートラインは今日の安値である64.49です。ここを割り込むと、夏のベースである50ドル台前半までは目立った構造が見当たりません。これはかなり遠い水準です。69~73の帯域への反発は売り圧力(サプライ)がかかる場所であり、追いかける(押し目買いする)理由にはなりません。 4時間足が73を回復して引ければ、見方を変えるつもりです。 $HYPEUSDT#ByXIMPACT
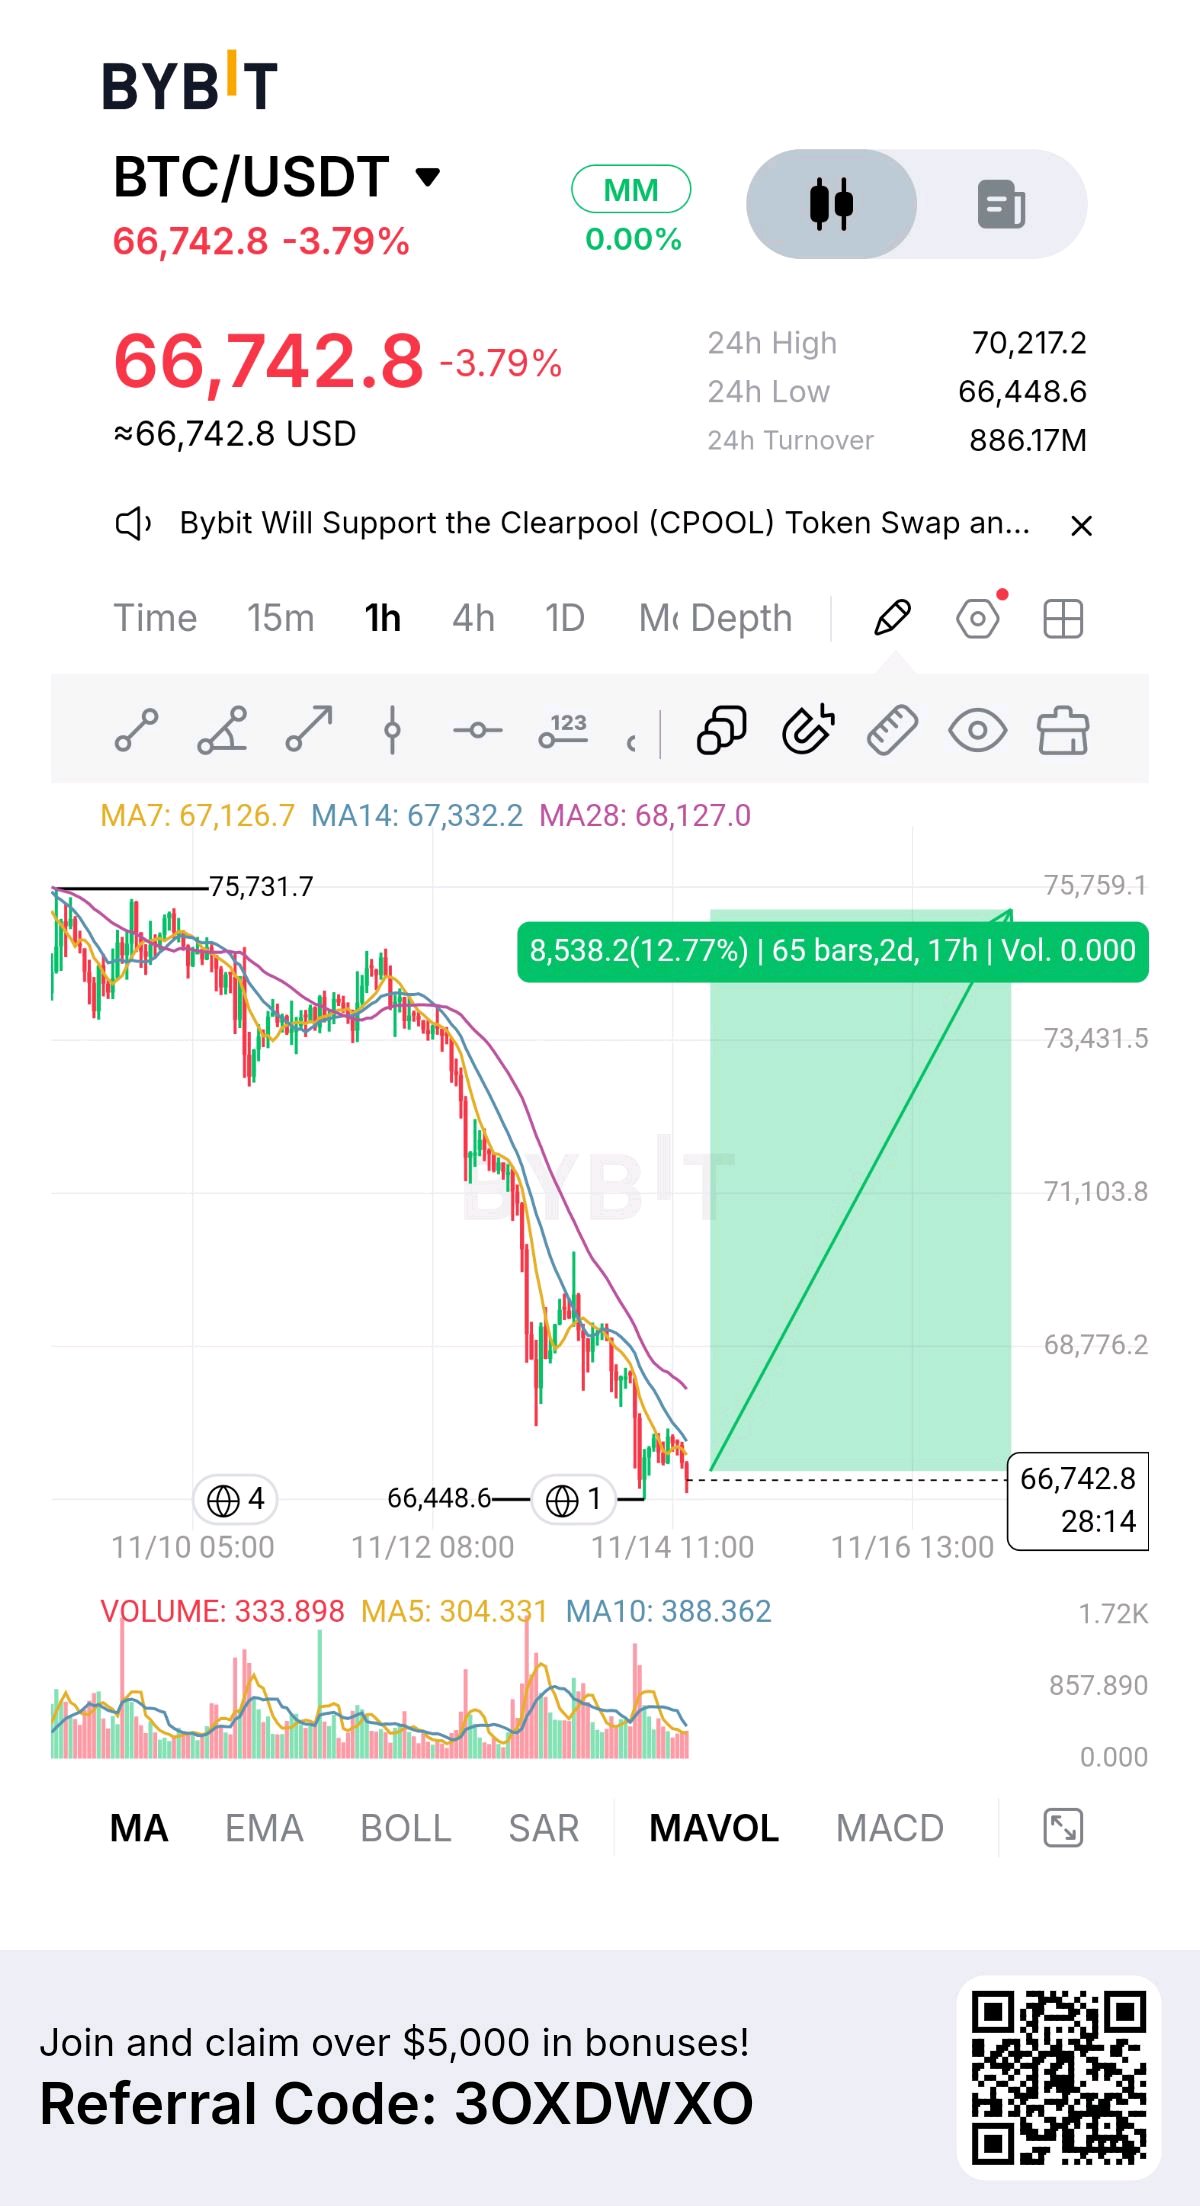
$BTCUSDT is back within 0.4% of its low, and this test decides whether 66,449 was a flush or just a pause. The drop from 75.7K cost roughly 12% in under six days. The low printed on a burst of volume. The move back toward it is quieter, with the 5-bar volume average sitting under the 10-bar. A retest on lighter volume is what you want if buyers defended that level for a reason. It isn't confirmation, it's the condition for one. The bounce after the low stalled at 70.2K, about 40% of the drop. That's the shallow end of a normal retracement, so a clean V back to 75K would mean recovering the entire leg. I'd treat 68.1K (the 28MA) and 71.1K (the 50% retrace) as the real checkpoints, with 67.3K, the 14MA, as the first rung. An hourly close under 66,449 means the retest failed and I step aside. Mark Douglas' point in Trading in the Zone applies: you don't need to know what happens next, you need to know what you'll do when it does. $BTCUSDT #ByXIMPACT
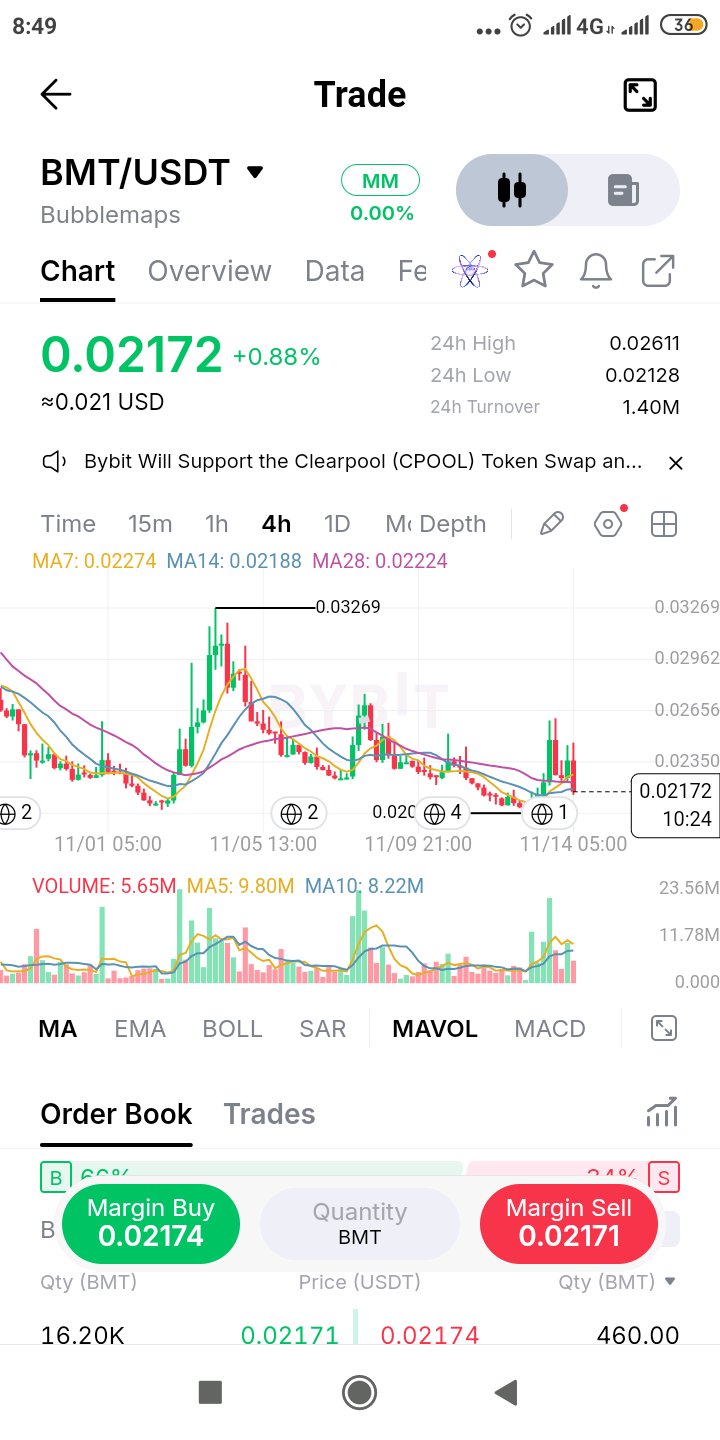
$BMTUSDTは23%急騰したものの、同じセッション内にその90%近くを吐き出しました。これはトレンドではなく、流動性イベントです。 この急騰は平均を大きく上回る出来高を伴って発生しましたが、その後価格は7日、14日、28日移動平均線(0.0219から0.0227の間に密集しており、現在は上値抵抗となっています)をそのまま下抜けて戻ってきました。これらの移動平均線が絡み合っていることは、頼るべきトレンドが存在しないことを示しています。今月これで2回目です。11月初旬の0.0327までの上昇も、結局すべて売り戻されました。ラリーは常に押し戻されており、24時間の出来高がこれほど薄い状況では、急騰を売り叩く(フェードする)のは容易です。 構造が維持されているのは、0.0201付近の安値があるためです。この水準が維持される限り、これはブレイクダウン(暴落)ではなくレンジ相場であり、0.0261の急騰高値が上限となります。 リバモアの「最小抵抗の線」を待つという習慣が、ここにも当てはまります。私はレンジの中央でトレードするつもりはありません。4時間足の終値が0.0261を上回るか、0.0201を下回れば注目します。その間の値動きはすべてノイズです。 $BMTUSDT #ByXIMPACT
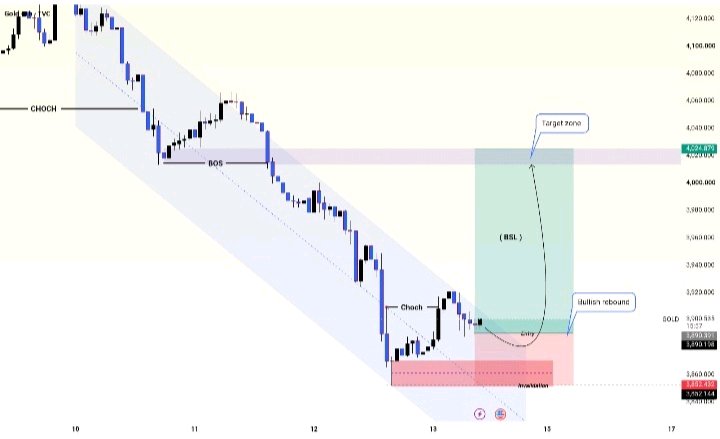
GOLD (XAUUSD) | Bullish Rebound - MDFUNDS
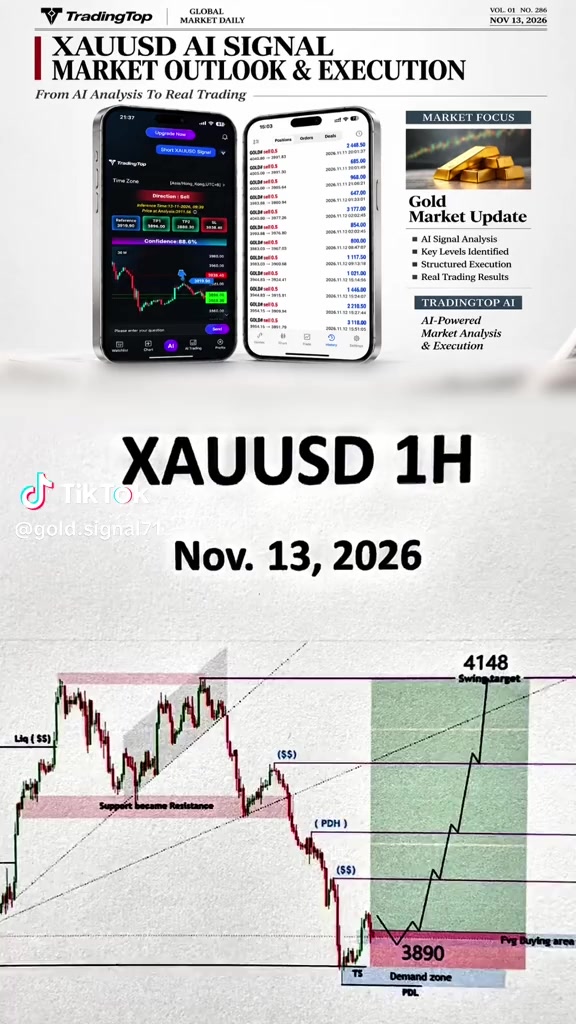
GOLD ($XAUTUSDT) | Bullish Rebound - MDFUNDS. Gold is showing signs of a potential bullish recovery after an extended bearish move within a descending channel. The recent price action has formed a bullish Change of Character (CHoCH), suggesting that selling pressure may be weakening and buyers could be attempting to regain control. Trade Setup – Potential Long - Market Bias: Bullish (Conditional) - Entry Area: Around 3,890 - Invalidation Level: 3,852 - Liquidity Target: Around 3,955 (Buy-Side Liquidity) - Final Target Zone: 4,020–4,025 Technical Outlook: The main focus is on how price reacts around the current entry area. If buyers maintain support and bullish momentum develops, Gold could attempt a recovery towards the previous liquidity area near 3,955. A sustained move above this level could open the possibility of further upside towards the 4,020–4,025 target zone. However, if price breaks below the marked invalidation level, the bullish scenario will no longer be valid. Risk Management & Disclaimer: This is a technical market analysis and a conditional trade scenario, not a guaranteed prediction or financial advice. Always manage risk carefully, use appropriate position sizing and make independent trading decisions. Wait for price confirmation before considering any entry. Follow the chart levels and respect the invalidation point. $XAUTUSDT #ByXIMPACT
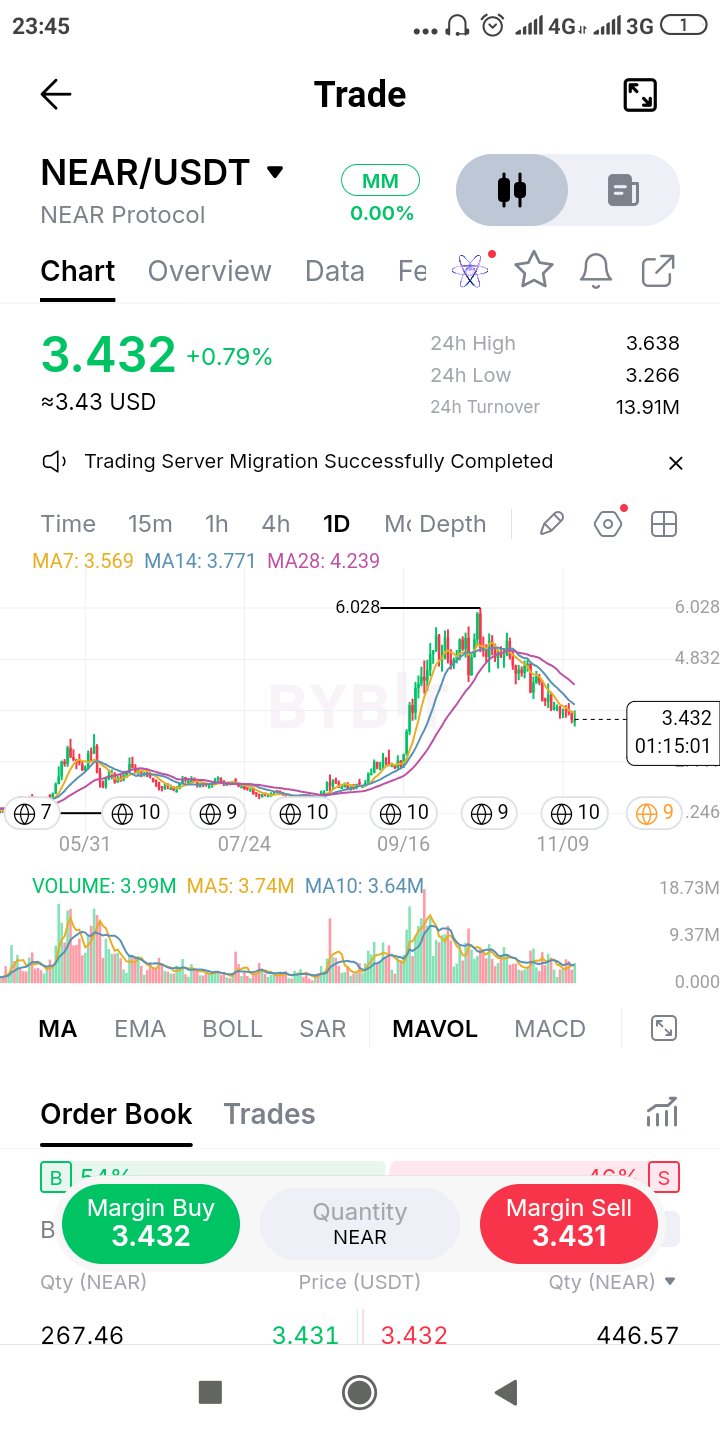
$NEARUSDT は、夏場のベース形成、6.03までの急激なマークアップ、10月中旬の天井、そして現在はマークダウンと、ワイコフ・サイクルの全行程を完全に露呈しました。価格は高値から43%下落しており、上昇幅の半分以上を吐き出しています。 なぜこれを底打ちではなくマークダウンと見ているかというと、価格が7日、14日、28日移動平均線(それぞれ3.57、3.77、4.24)の下にあり、すべて下向きだからです。特に28日移動平均線は現在の価格より約23%も上にあり、この上値の重さを解消するのは容易ではありません。今回の下落局面における出来高は平均付近で推移しており、上昇時のような急増は見られないため、終焉を示すセリングクライマックスとは言えません。 過去24時間のレンジは3.27から3.64で、高値は7日移動平均線のすぐ上で失速しました。私がまず見たいのは陽線ではなく、3.57を上回る日足終値と、その後の切り上がった安値です。 3.27を下回ると、9月上旬のブレイクアウト水準まで目立ったチャートの構造がないため、フロア(底)を予測するよりも、相場が次の動きを見せるのを待つ方が賢明だと考えています。 $NEARUSDT #ByXIMPACT
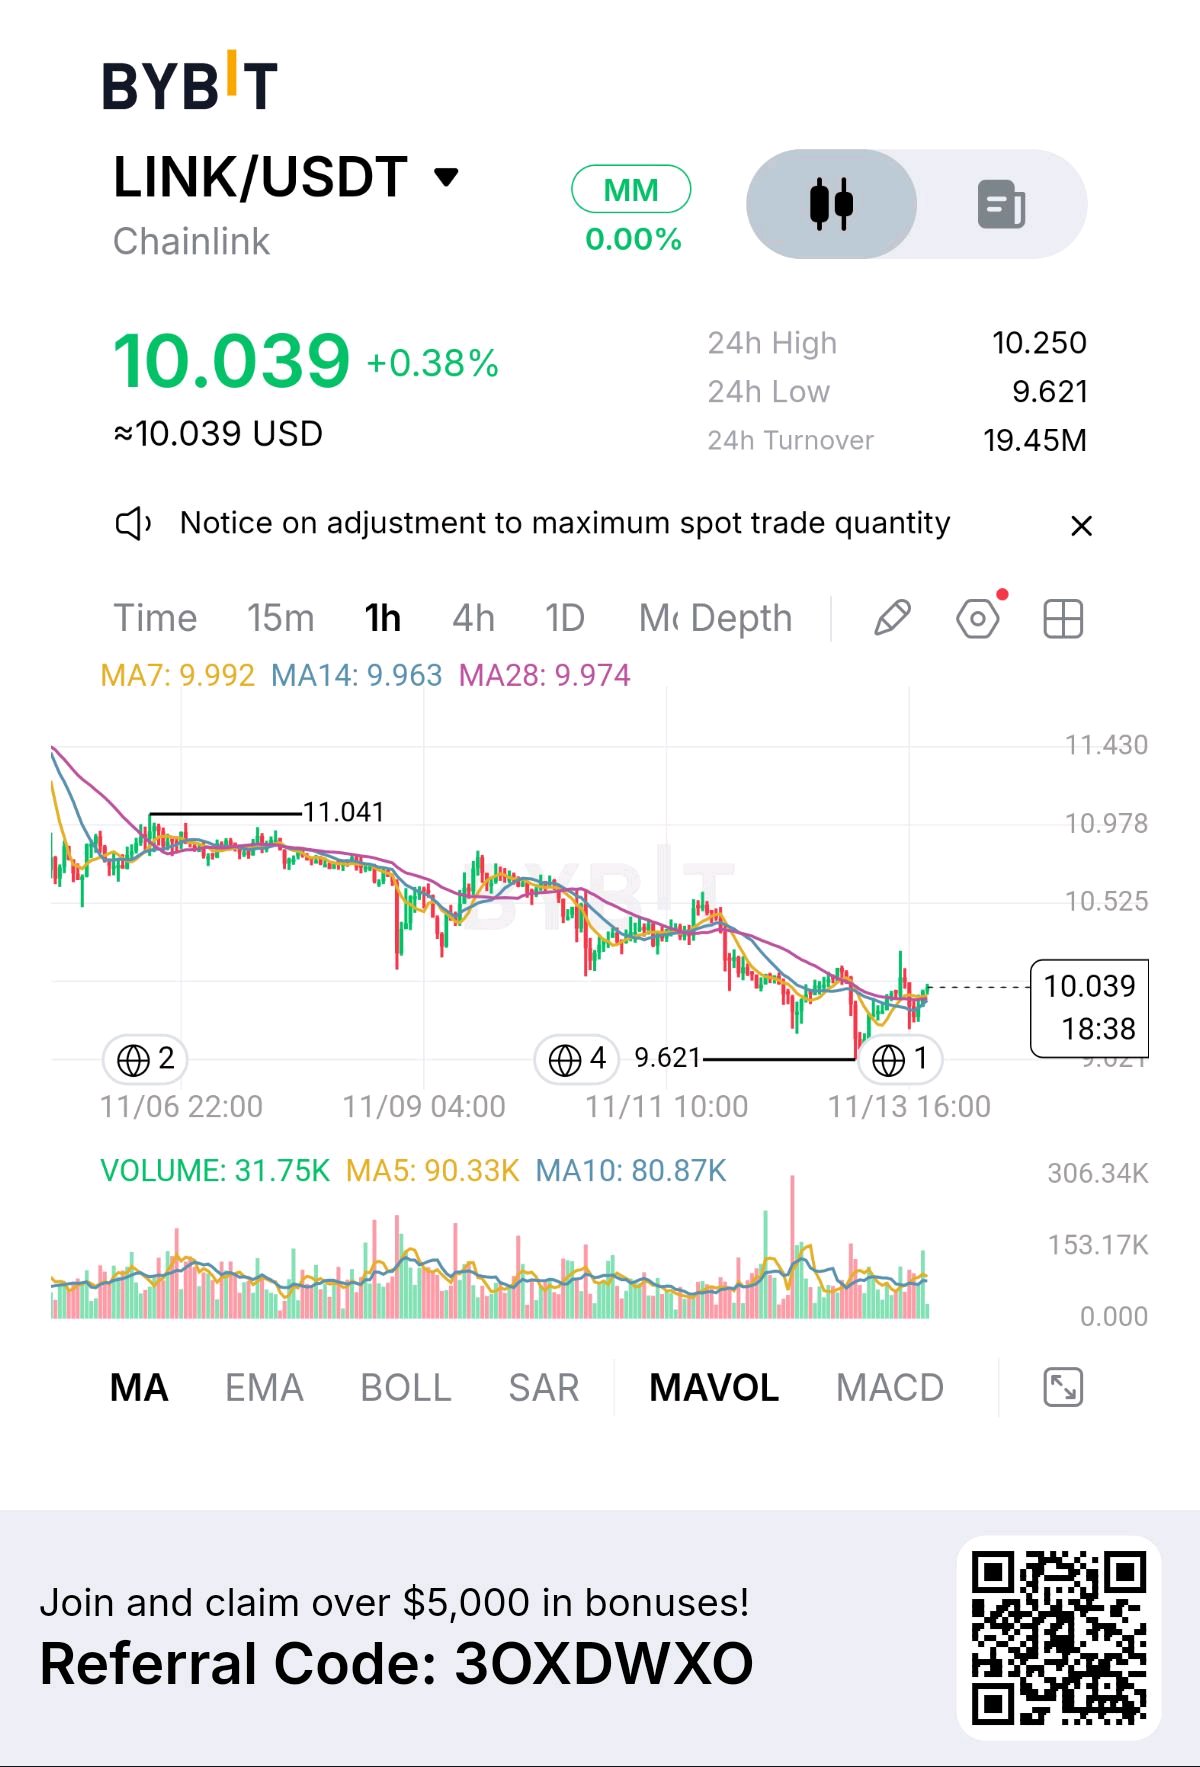
$LINKUSDT just ran the stops under its last low and couldn't stay there. The flush to 9.62 undercut the previous swing low, then price took back the whole move within hours and now sits above the 7, 14 and 28 MAs, which have flattened into one tight band around 9.96-9.99. Al Brooks' read on failed breakouts applies: the side that chased the breakdown is now trapped, and their exit becomes fuel for the move up. But keep it honest. On the hourly, every bounce has topped lower than the last, and 10.25 is the most recent of those lower highs. Until that breaks, this is a failed breakdown, not a trend change. Above 10.25 I'd look toward 10.5. Back under 9.96 and it's just another weak bounce. A close below 9.62 kills the idea outright. $LINKUSDT #ByXIMPACT
$XAUTUSDT は約3日間で4,130から約7%下落しましたが、その後の反発は反発とは呼べないほど弱いです。 価格は3,916付近までしか回復しておらず、下落幅の4分の1にも満たない状況です。マーフィーの経験則では、健全な調整とは少なくとも3分の1は戻すものであり、そうでなければ本物の試みとは見なされません。この動きの3分の1は3,944付近ですが、価格はその水準にすら近づきませんでした。買い手は現れるのが遅く、立ち去るのも早かったです。 現在は3,851の安値のすぐ上に位置しており、出来高は概ね静かで、3,878から3,887の間に位置する7日、14日、28日移動平均線の密集帯の下にあります。レジスタンスのすぐ下、サポートのすぐ上での収束は、どちらかの水準がまもなく突破されることを意味しています。 1時間足が3,851を下回って確定し、出来高を伴えば、その安値は崩れ、次の下落の余地が生まれます。逆に3,887を奪還して維持できれば、反発は底固めに転じ、再び3,916、そして3,944が視野に入ります。 どちらになるか予想はしません。私はどちらが先に自分たちの水準を守り切るかを見守るだけです。 $XAUTUSDT #ByXIMPACT
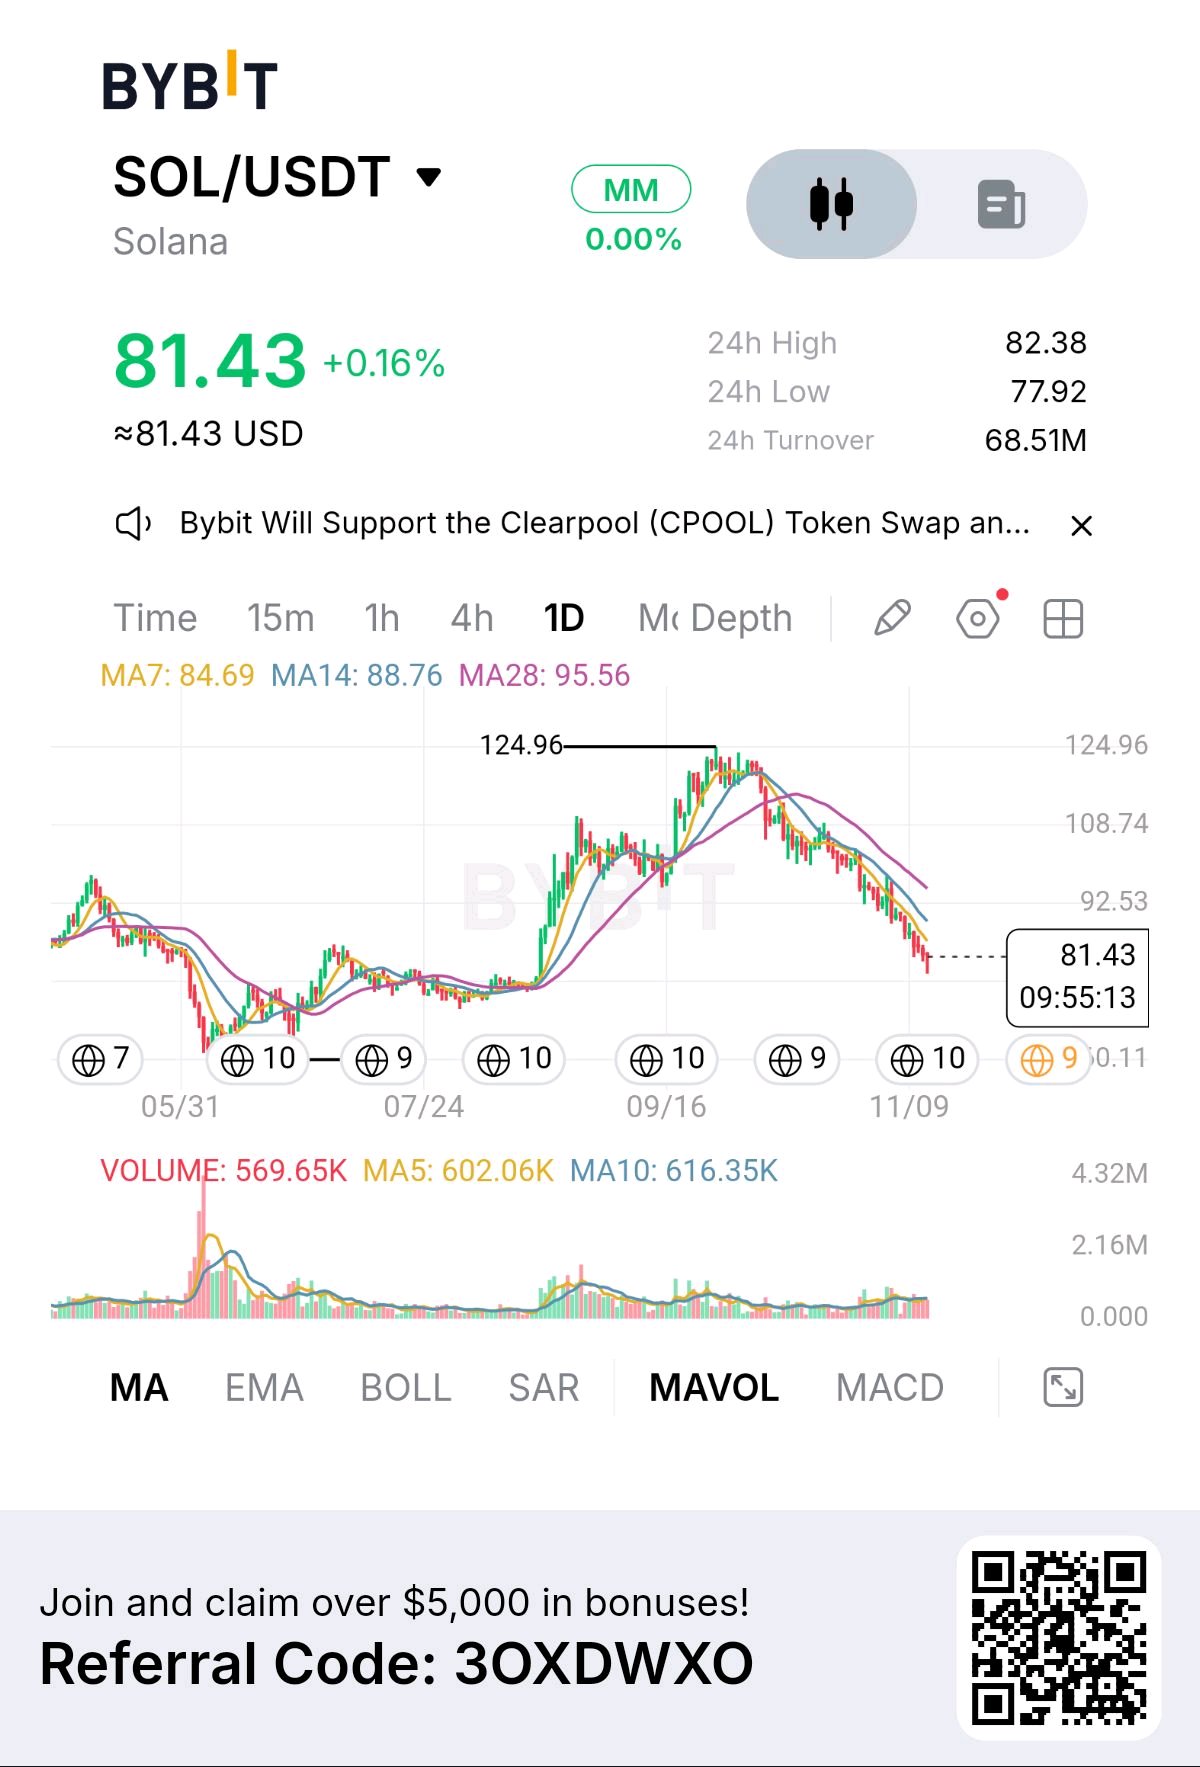
$SOLUSDTは125から約35%下落しましたが、チャートはまだ真の底に必要な動きを見せていません。 前回の大底がどのように形成されたかを見てください。通常の何倍もの出来高を伴う激しいフラッシュ(急落)があり、その後に底固めがありました。今回の下げ局面はそれとは真逆です。出来高は横ばいから減少傾向にあり、じりじりと下げています。本日の出来高57万株は、5日および10日移動平均線を下回っています。誰も強制的にポジションを解消させられていません。これは秩序だった値下げであり、秩序だった値下げは誰かがポジションから締め出されるまで続く傾向があります。 価格も28日移動平均線(28MA)を約15%下回っているため、いつでも85〜89へのスナップバック(反発)が起こり得ます。しかし、私はそれをトレンド転換ではなく、一時的な「輪ゴム」のような反発と見なします。84.7付近の7日移動平均線(7MA)が最初の抵抗線であり、95.6付近の28MAが本丸の抵抗線です。 下値で重要な水準は、本日の安値である78です。静かにここを割り込むだけでは意味がありません。私が本当に注目するのは、出来高の急増を伴うブレイク(下抜け)があり、その後に出来高を減らしてリテスト(再試行)が入る展開です。それがセリングクライマックスであり、そこからセットアップ(買い場)が始まります。 $SOLUSDT $BTCUSDT #ByXIMPACT
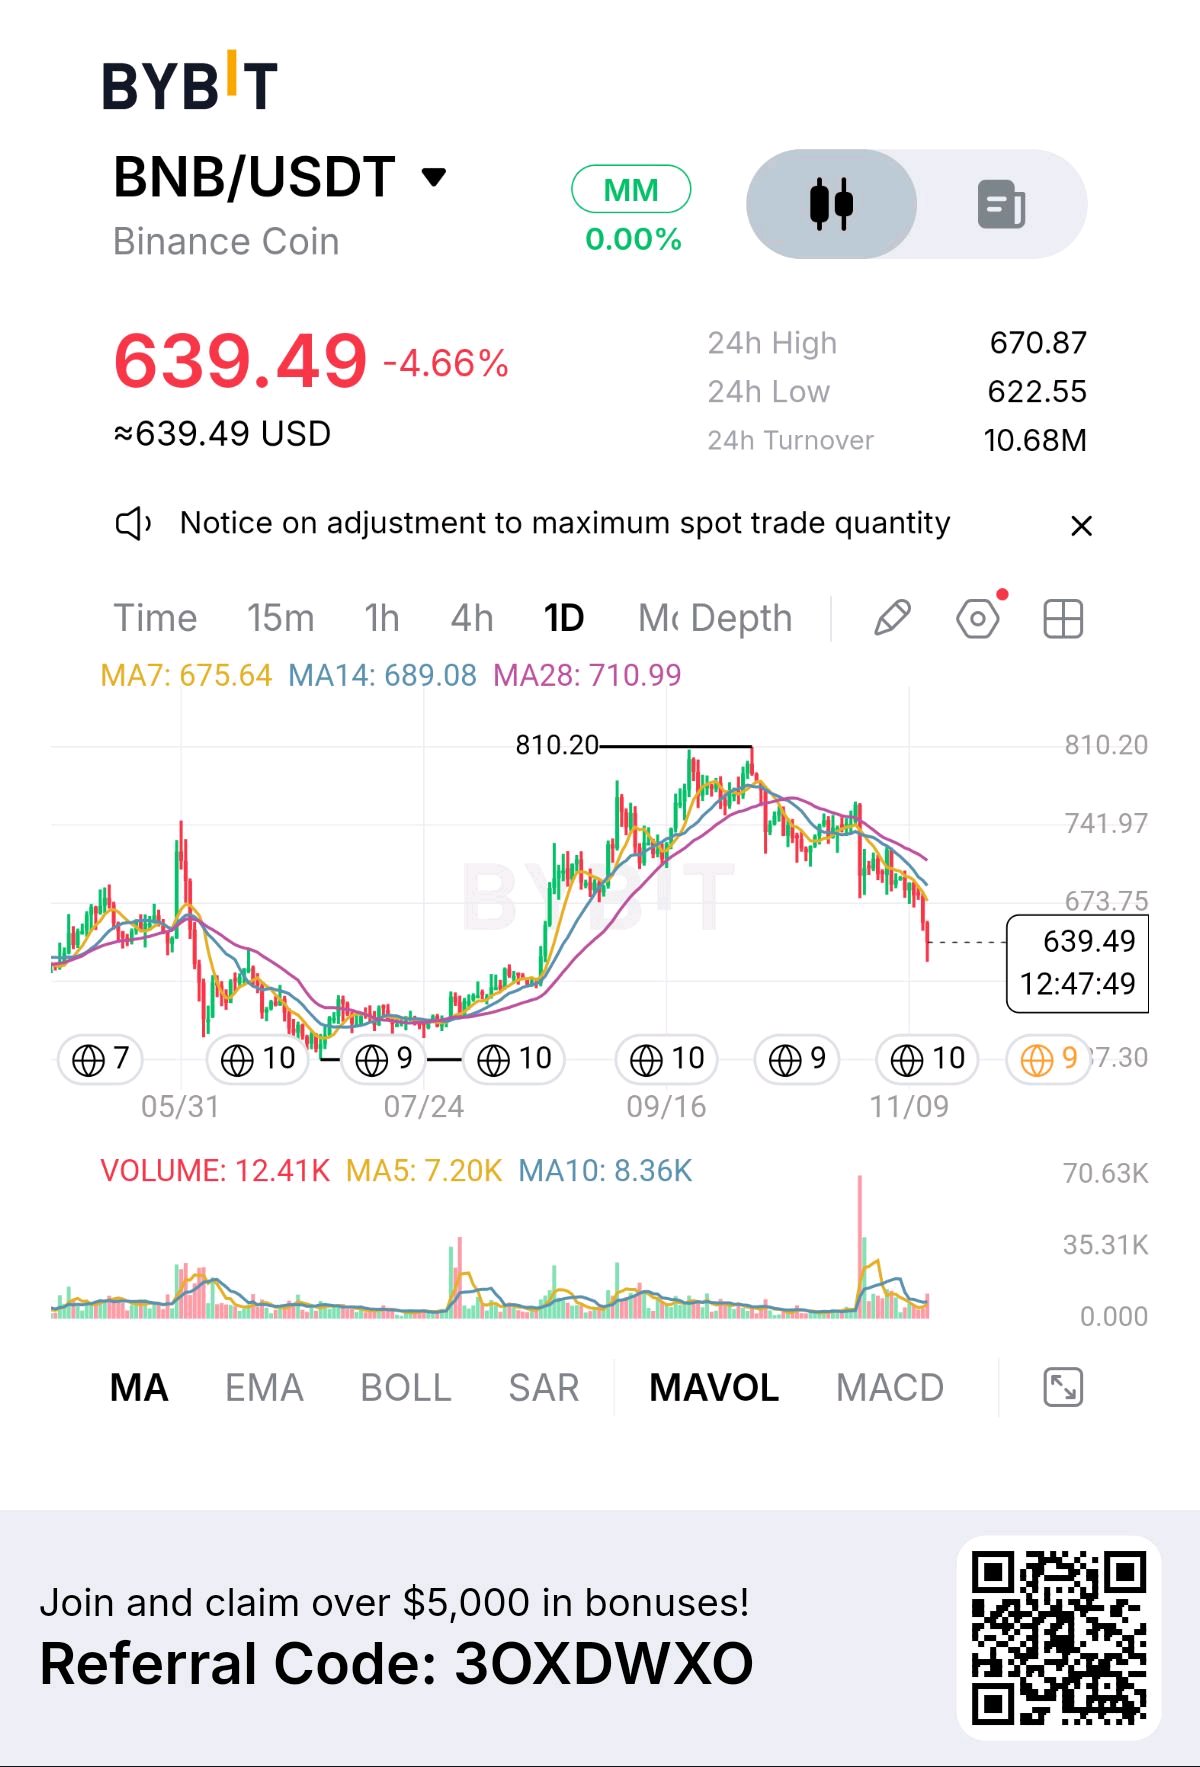
Is BNB at 640 a dip buy? Not yet, and the volume tells you why. The range gave way on a volume spike many times the normal daily average. A real selling climax gets an automatic rally and then a retest of the lows. BNB got neither. The only bounce stalled under the falling MAs and sellers stepped in at every lower high. That's a bear channel, and in Al Brooks' framework pullbacks inside one are sold, not bought, until the channel actually breaks. Today adds to it: down 4.7%, volume already running above its 5-day average, and price sitting under the 7, 14 and 28 MAs, all rolling over. Where it gets interesting: 670-676 is broken support stacked with the 7MA, so that's the first real test of any bounce. 622 is today's low. Lose it and the summer base around the mid-500s becomes the next magnet. What changes my mind is a daily close back above 676 that holds on volume. Until then, patience is the position. $BNBUSDT $ETHUSDT #ByXIMPACT
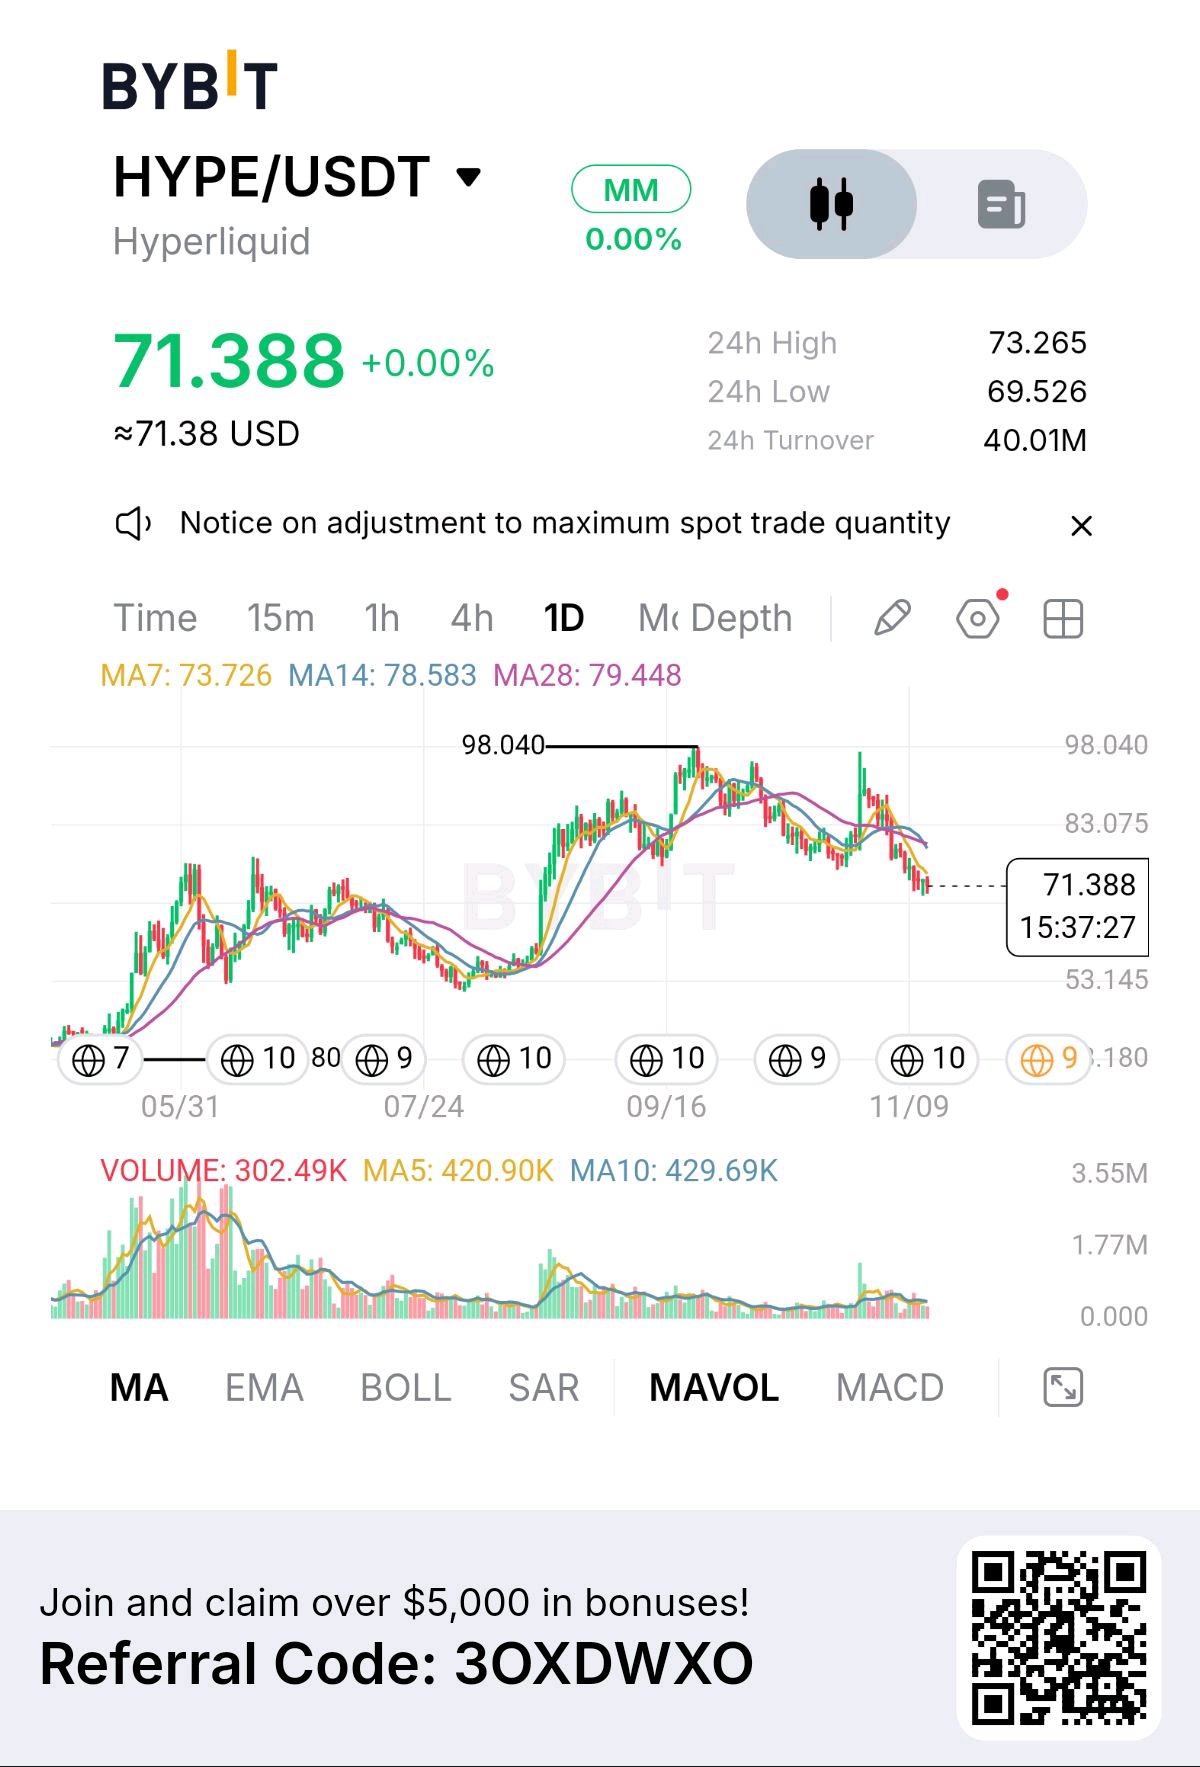
HYPEは何度も同じ天井で跳ね返されている。96〜98ドル付近で3回トライしたが、直近の動きが重要だ。出来高を伴ってレンジを上にブレイクしたものの、数日で全戻しした。ワイコフ理論で言うところの「アップスラスト(上放れだまし)」だ。大きな買い意欲があったにもかかわらず結果が出ず、ブレイクアウトで買った連中は全員高値掴みで捕まっている。 それ以降の構造は明白だ。日足のMAは7日、14日、28日の順で綺麗に並んで下を向いており、価格は71.4ドルでそのすべてより下にある。下落中の出来高は減少しているので、これはパニック売りではなくダラダラとした下げだ。こうした下げは、シグナルではなく特定の価格水準で止まることが多い。 注目している水準: 73〜74ドル:7日MA。ブル派が日足終値で奪還すべき最初のライン 83ドル:割れたサポート。反発時の売り場 69.5ドル:24時間安値で、当面のフロア 53ドル:69.5ドルを割り込んだ場合の7月のベースライン 見解:83ドル以下の反発は売り場であり、追う場面ではない。日足終値で7日MAを明確な出来高を伴って回復するまでは様子見だ。69.5ドルを割ったら拾いに行くことはせず、次のベースラインが見えてくるまで待つ。 $HYPEUSDT $BTCUSDT #ByXIMPACT
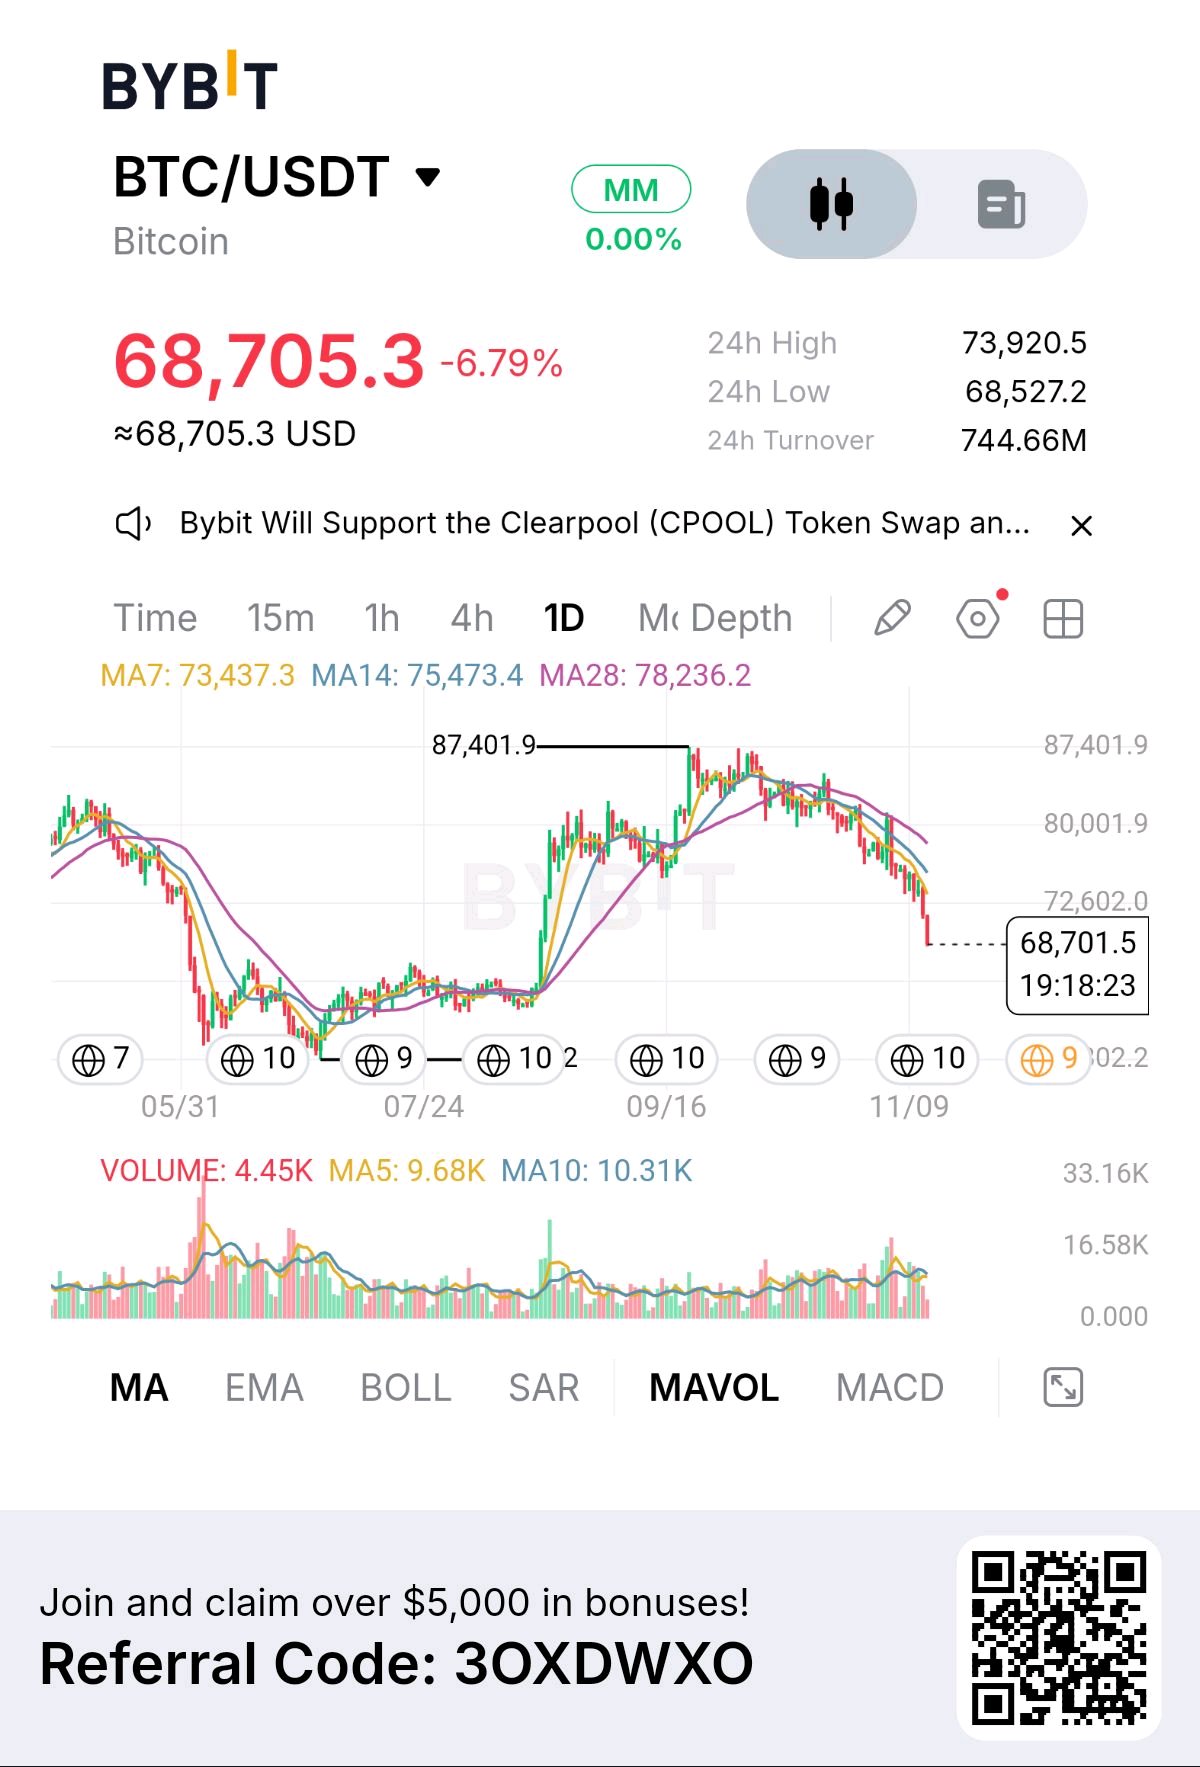
#BTC #ビットコイン #BTCUSDT #MDFUNDS
#BTCUSDT| 構造が変化しています ビットコインの最近の下落は注目に値しますが、それ以上に重要な展開は、売りが始まる前に起こったことです。 87,401ドル付近に達した後、BTCは上昇を維持するのに苦戦しました。回復局面は徐々に勢いを失い、高値は切り下がり、最終的に価格は72,600ドルの水準を割り込みました。 現在68,705ドル付近で取引されているビットコインは、以下の3つの日足移動平均線すべてを下回っています: MA7:73,437ドル MA14:75,473ドル MA28:78,236ドル この並びは、複数の時間軸において売り手が主導権を握り続けている市場であることを示しています。 見逃してはならない詳細は出来高です。表示されている出来高は4.45Kで、MA5の9.68K、MA10の10.31Kに対して低調です。現在の日足ローソク足はまだ形成中である可能性があるため、売り圧力について結論を出す前に、最終的な出来高を確認する必要があります。 目先の試練は68,500ドル付近です。ここを明確に割り込むと、次のより低い価格帯が露呈する可能性があります。一方で、72,600ドルを回復できれば、失われた構造を取り戻すための最初の試みとなるでしょう。より強力な回復には、BTCが下降している移動平均線に挑戦する必要があります。 ここでダウ理論の原則が特に重要になります。トレンド転換が認められるためには、市場が高値と安値の連続において真の変化を示す必要があります。 問題は「ビットコインが十分に下落したかどうか」ではありません。「買い手が売り手の支配力が弱まっているという証拠を示せるかどうか」です。 これをトレンド崩壊の始まりだと考えますか?それとも、BTCは意味のある回復が始まる可能性のある領域に近づいているのでしょうか? #BTCUSDT$XAUTUSDT #ByXIMPACT

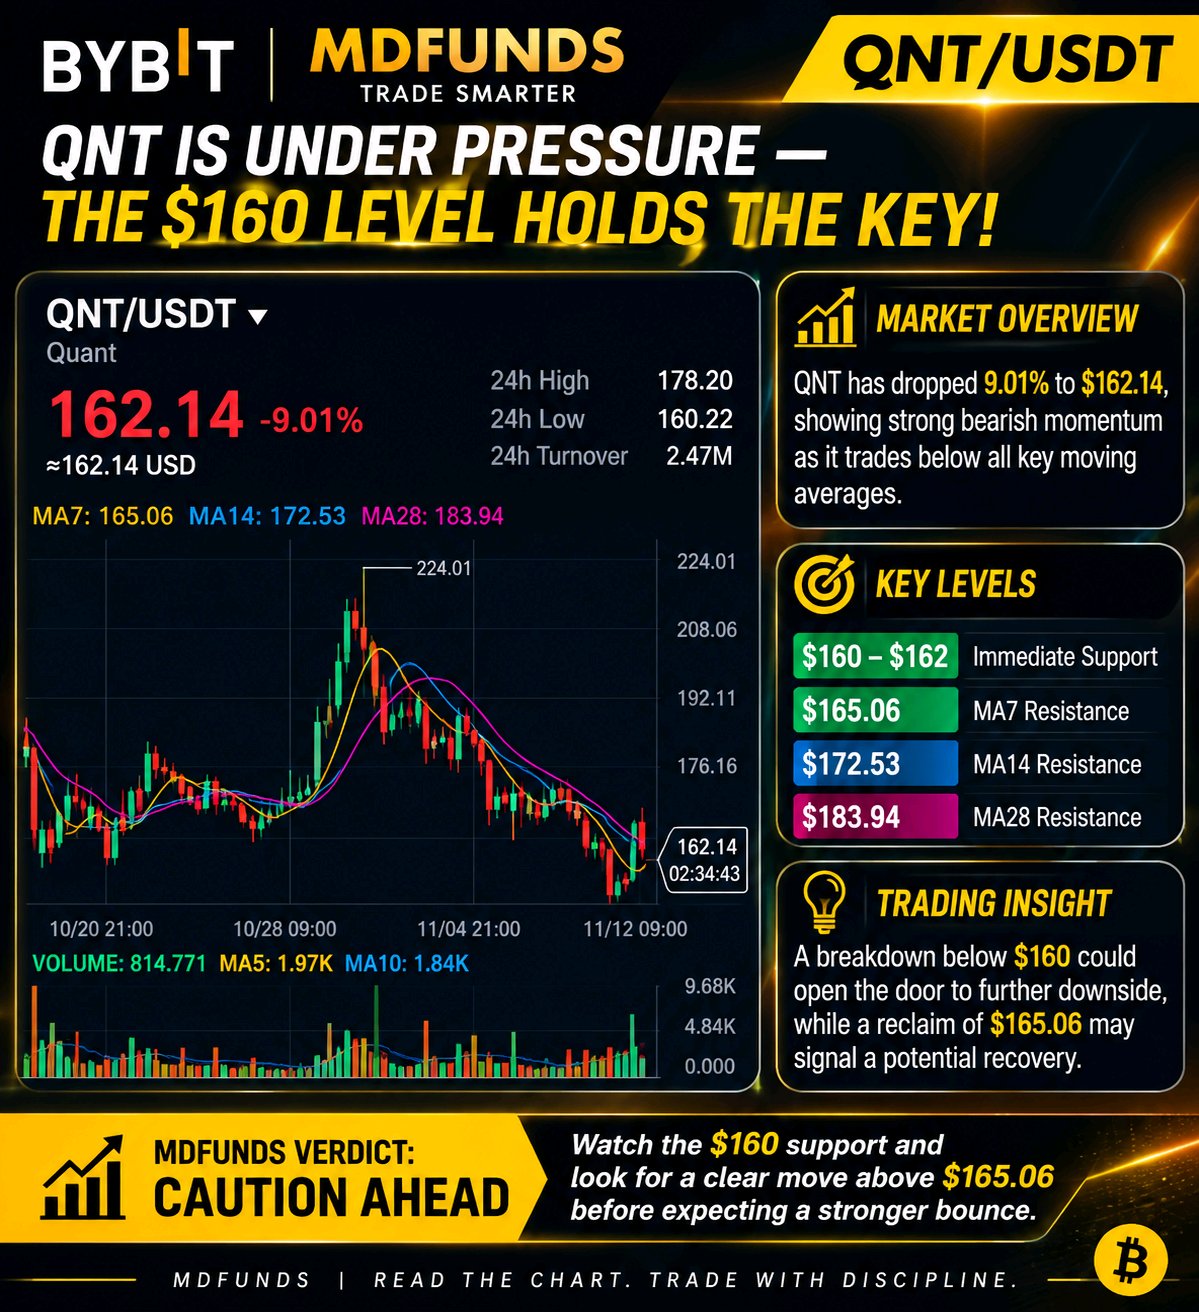
#QNT #Quant #仮想通貨トレード
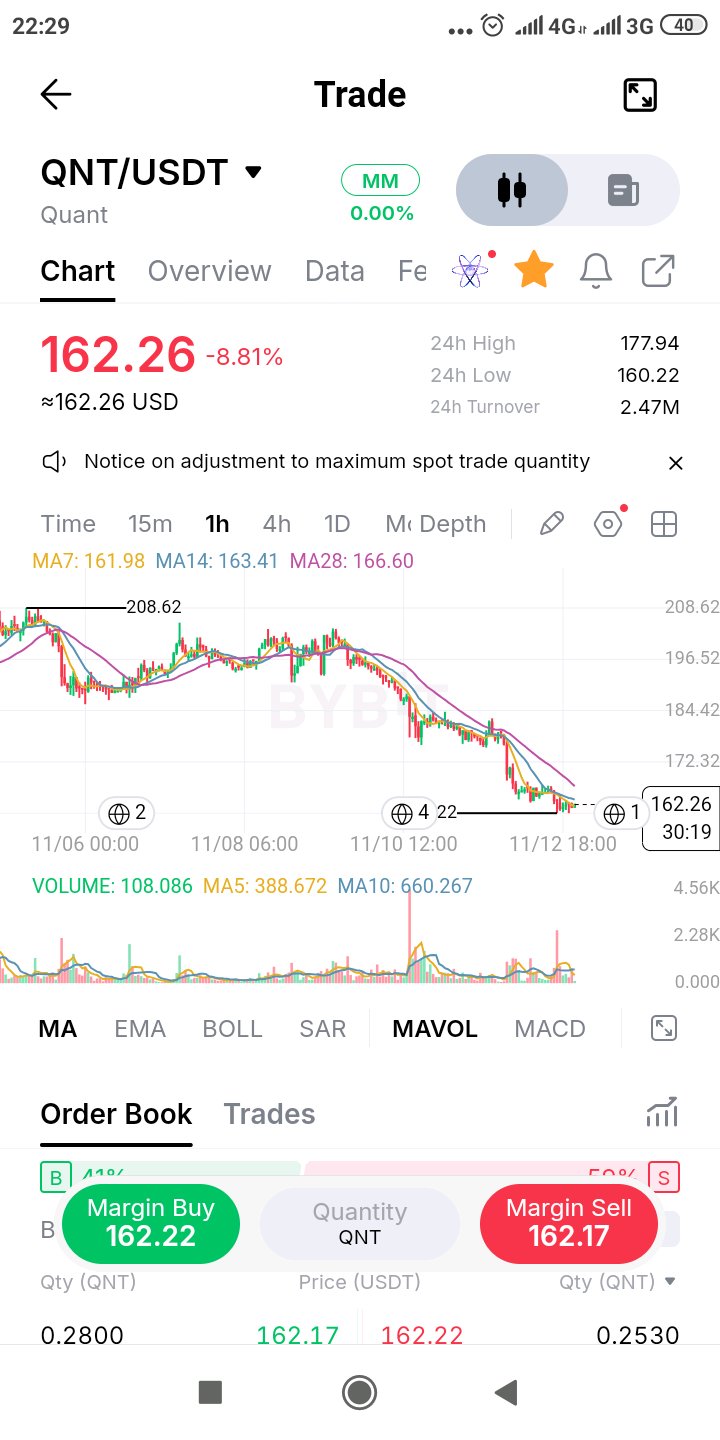
QNT/USDT — サポートテスト QNTは、買い手が依然として価格を維持する意志があるかどうかを市場が証明しなければならない水準に近づいています。 4時間足の構造はかなり悪化しています。価格は3本の移動平均線すべてを下回っており、MA7は165.07、MA14は172.54、MA28は183.94となっています。この並びは、現在売り手が構造的な優位性を持っていることを示しています。 しかし、注目すべきもう一つの詳細があります。現在価格は162付近で推移しており、24時間安値は160.22です。 ここが、次の重要な反応が起こり得る場所です。 もし買い手が160〜162の領域を守り、165を奪還できれば、安定化への動きが見られるかもしれません。172を上回るより力強い回復は、より大きな意味を持つでしょう。 しかし、4時間足で160.22を明確に割り込むと、現在のサポート防衛線は疑問視されることになります。単に価格が急落したからといって、すぐに大底だと決めつけるつもりはありません。 私が最も興味を持っているのは、この水準で買い手が単なる一時的な反発ではなく、意味のある反応を示せるかどうかです。 QNTは需要の機会に近づいているのか、それともこのサポートは単に売り手が突破を準備している次の水準に過ぎないのでしょうか? $QNTUSDT $CITYUSDT #ByXIMPACT
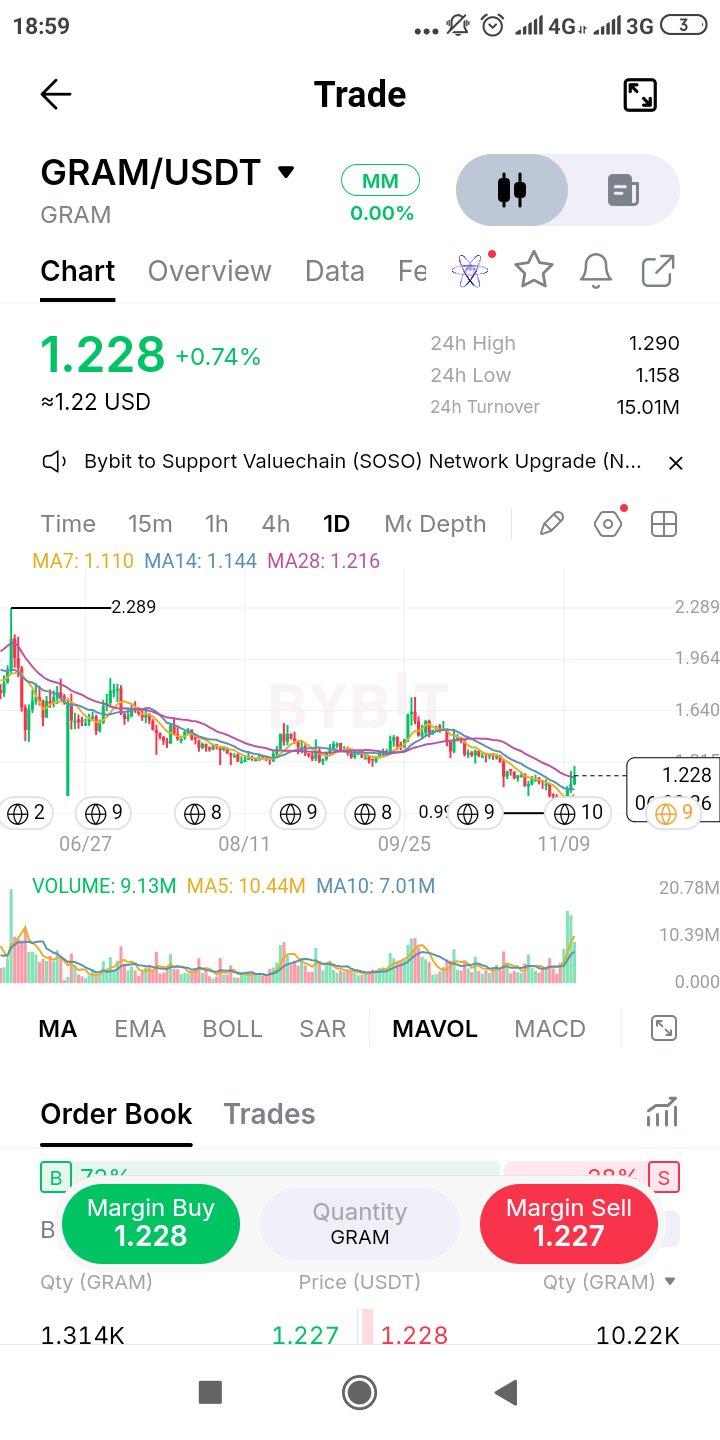
$GRAMUSDT| BULLISH REACTION GRAM IS FINALLY SHOWING SOME FIGHT — BUT IS THIS THE BEGINNING OF A REVERSAL? After an extended period of downward pressure, GRAM is attempting to change the conversation. Trading at $1.228 (+0.74%), the token has bounced from its recent lows, with the latest daily candle showing a noticeable increase in trading activity. What makes this move interesting isn't just the green percentage. It's where the recovery is happening. THE TECHNICAL DEVELOPMENT GRAM has reclaimed all three displayed moving averages: • MA7: $1.110 • MA14: $1.144 • MA28: $1.216 Price is now trading above the entire MA cluster. That's an encouraging short-term development and suggests buyers are beginning to regain some control. However, the broader chart still carries the scars of a prolonged decline from the $2.289 region. One recovery attempt doesn't automatically erase that structure. THE LEVELS I'M WATCHING • $1.216 — MA28 and immediate trend test • $1.158 — 24h low / downside reference • $1.290 — Immediate resistance • $1.40–$1.50 — Potential next recovery zone if momentum expands THE VOLUME TELLS ANOTHER STORY Current volume is 9.13M, compared with MA5 at 10.44M and MA10 at 7.01M. Activity is elevated relative to the 10-period average, supporting the idea that this bounce is attracting attention. But sustained buying participation is what will determine whether this move develops into something bigger. MDFUNDS MARKET VERDICT GRAM is showing an interesting early recovery signal. The critical test is whether buyers can keep price above $1.216 and eventually challenge $1.290. A rejection around resistance could bring another consolidation phase. A convincing breakout, supported by stronger volume, would make the bullish recovery argument considerably stronger. The interesting part isn't that GRAM is green today. It's that price has started challenging a trend that kept sellers in control for months. Watch the follow-through. MDFUNDS Spot the shift before the crowd. Trade the evidence. Analysis based on the supplied Bybit daily chart. Not financial advice. $GRAMUSDT $BTCUSDT #ByXIMPACT

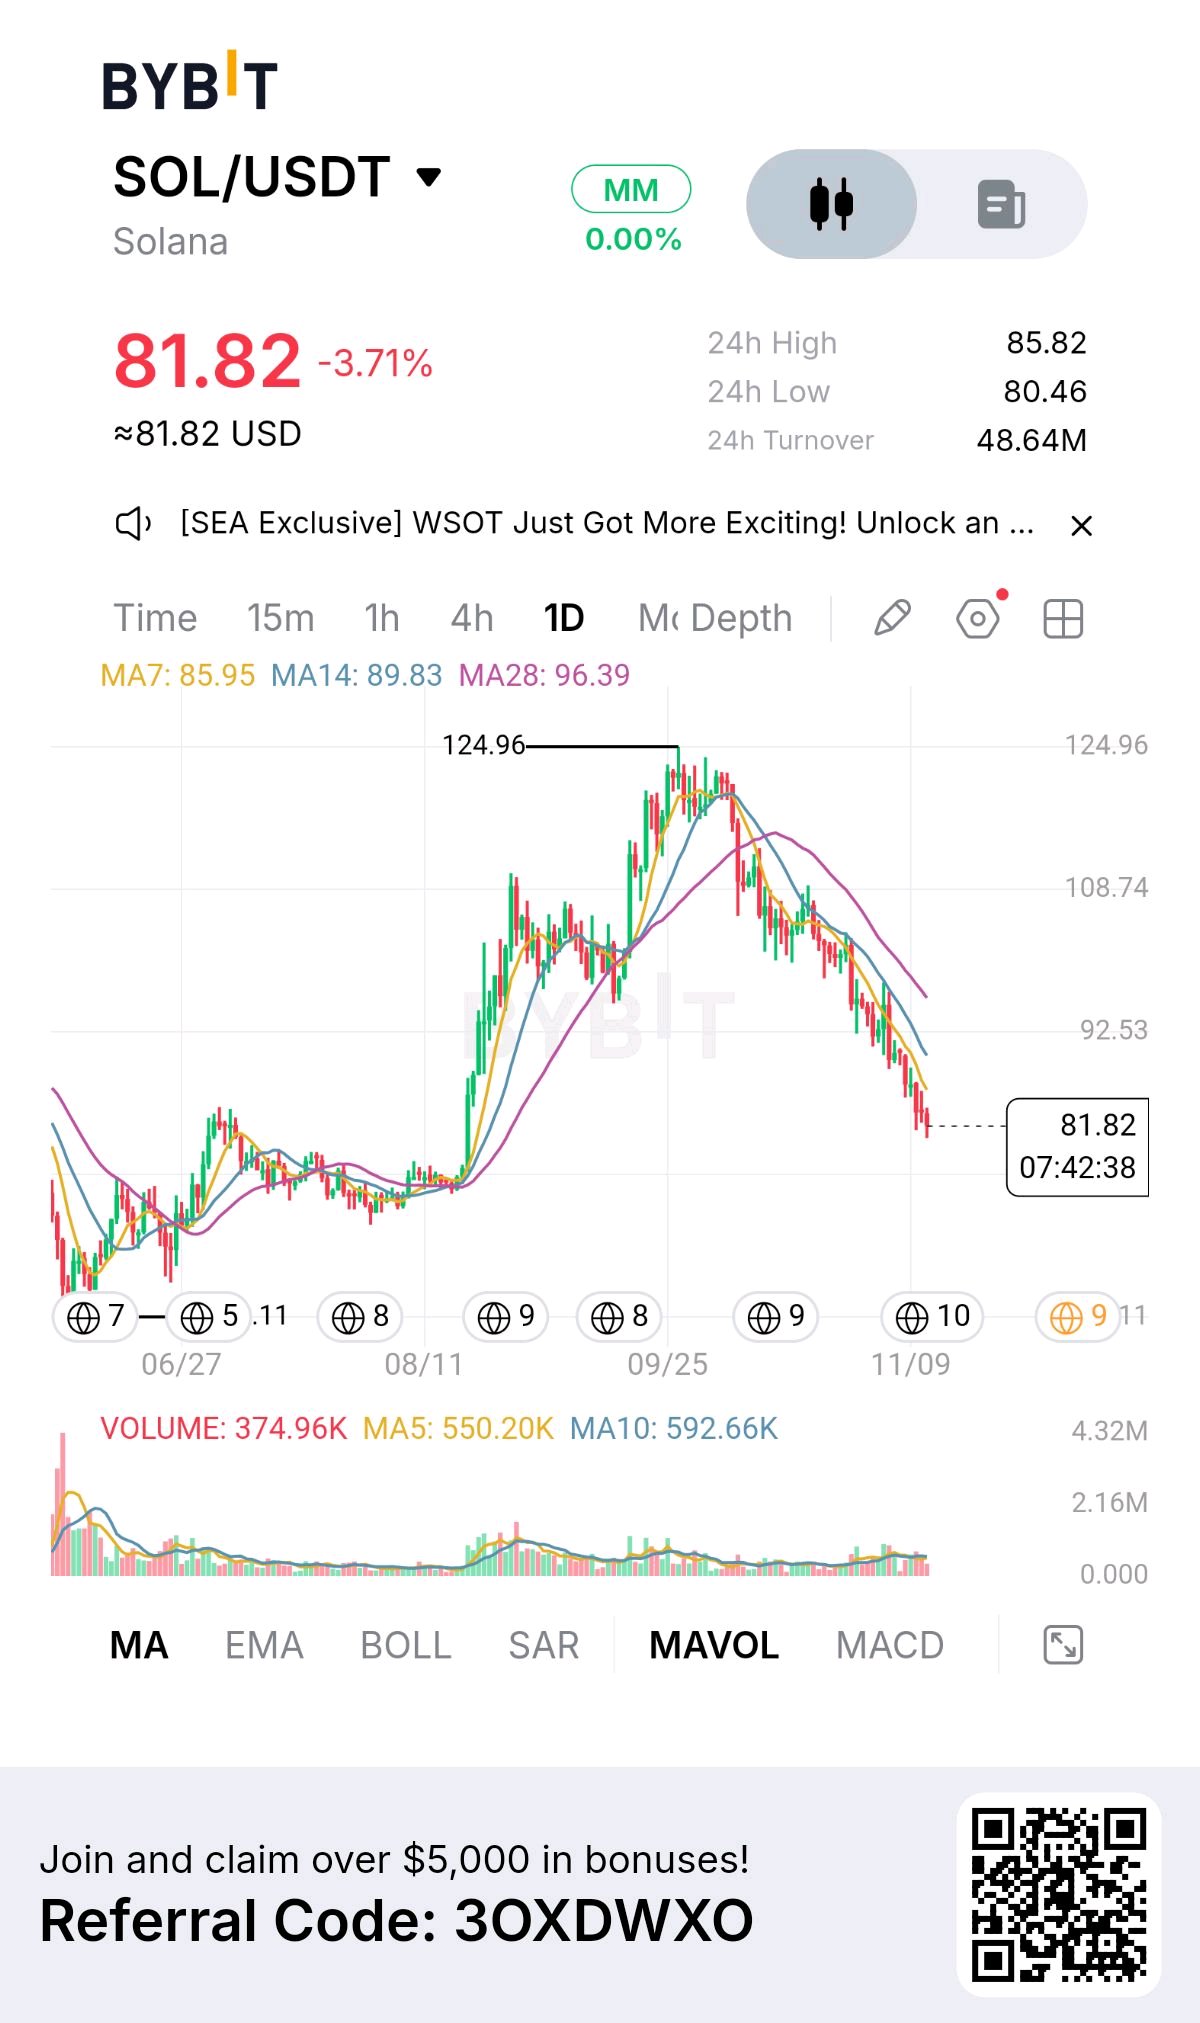
$SOLUSDT| BEARISH MOMENTUM SOLANA IS UNDER PRESSURE — AND THE SELLERS AREN'T DONE PROVING THEIR POINT. Solana is now trading around $81.82, down 3.71%, with the daily chart showing a persistent loss of bullish structure. But there's something more important here than the percentage decline: the sequence of lower highs, weakening recovery attempts and the growing distance between price and its moving averages. THE TECHNICAL PICTURE SOL has fallen below all three displayed moving averages: • MA7: $85.95 • MA14: $89.83 • MA28: $96.39 This alignment puts short-, medium- and longer-period momentum firmly under pressure. The previous rally towards $124.96 has now given way to a substantial correction. Buyers have yet to demonstrate enough strength to reverse that trend. LEVELS THAT COULD DEFINE THE NEXT MOVE • $80.46 — Immediate support / 24h low • $78–$80 — Potential downside reaction area • $85.95 — First recovery hurdle • $89.83–$96.39 — Major moving-average resistance zone WHAT DESERVES ATTENTION? Volume currently stands at 374.96K, below both MA5 (550.20K) and MA10 (592.66K). That matters. The decline is taking place without volume exceeding its recent averages, so we should distinguish between persistent bearish structure and an accelerating sell-off. MDFUNDS MARKET PERSPECTIVE I would be cautious about treating SOL's current price as an automatic buying opportunity. A sustained break below $80.46 could open the door to another leg lower. Conversely, defending that level and reclaiming $85.95 would be the first indication that buyers are attempting to regain control. The bigger challenge for SOL isn't simply bouncing. It's rebuilding a trend. Until that happens, rallies deserve scrutiny rather than blind optimism. MDFUNDS Market intelligence. Structure over speculation. Based on the supplied Bybit 1D chart. Not financial advice. $SOLUSDT $BTCUSDT #ByXIMPACT
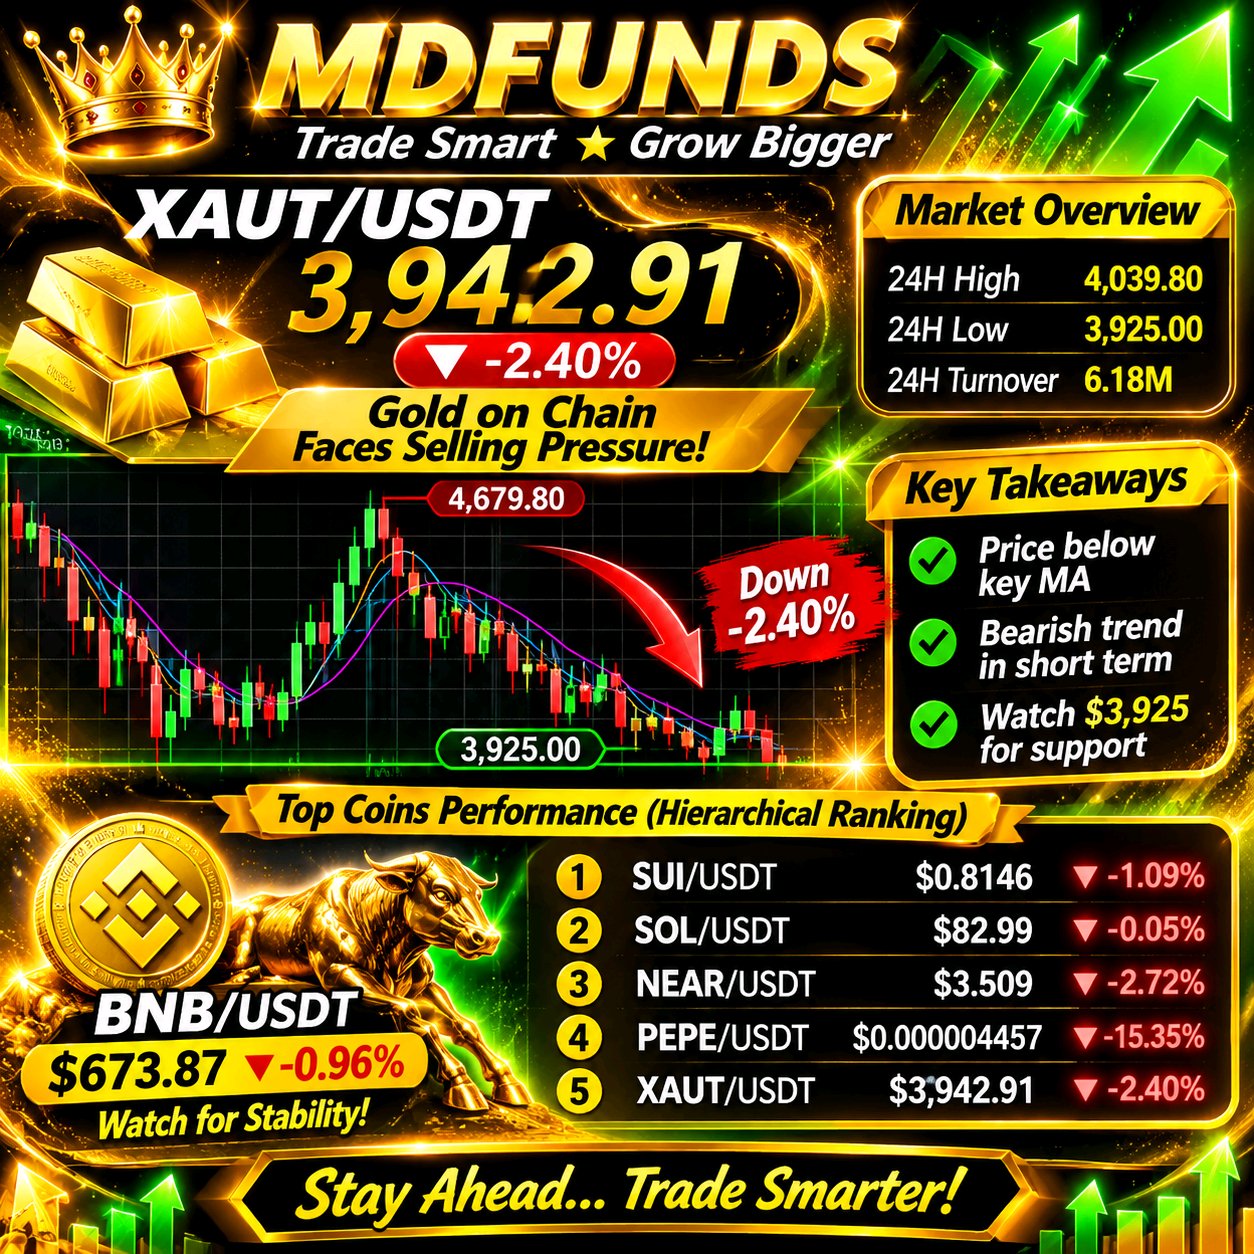
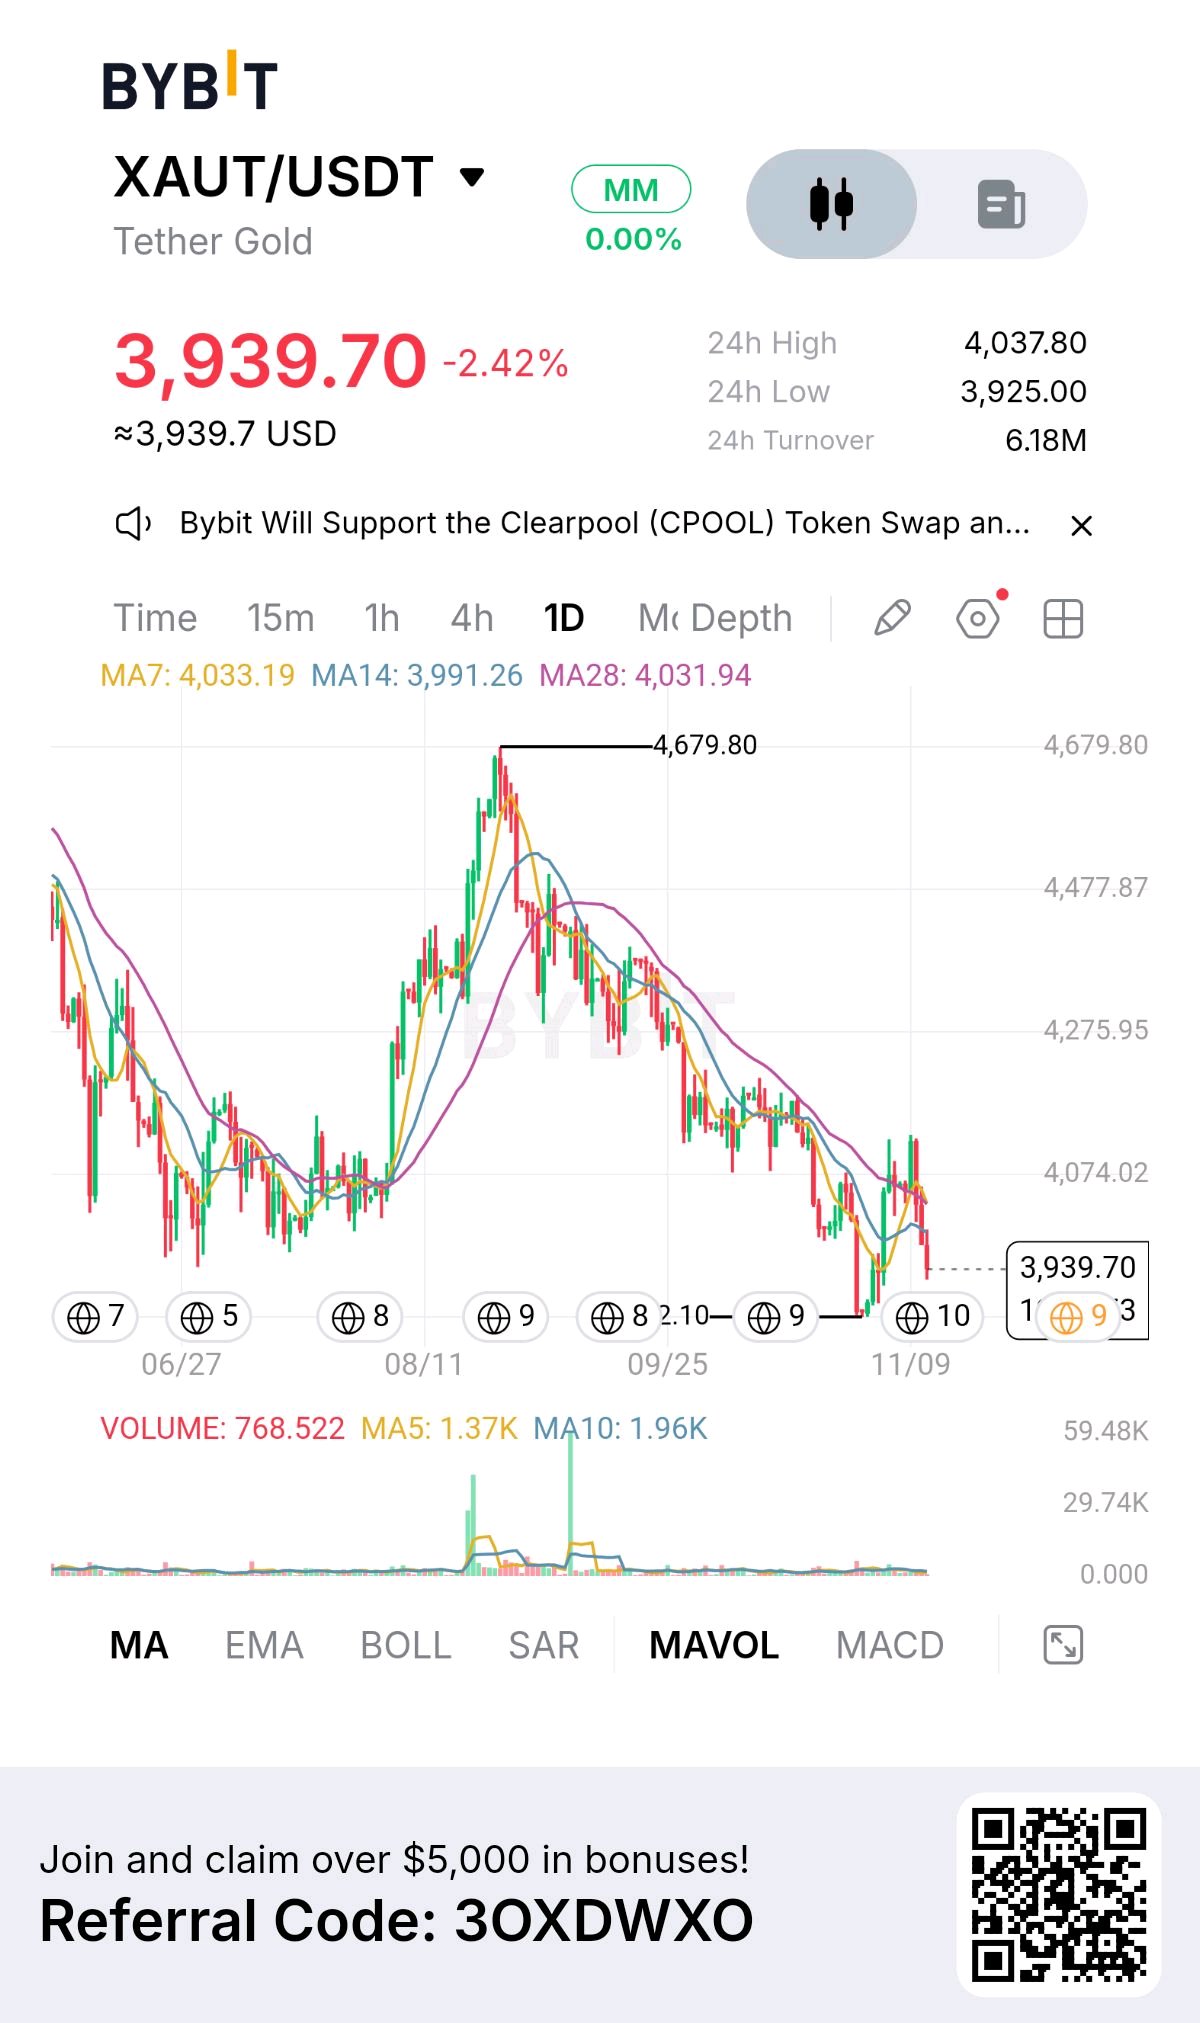
$XAUTUSDT — GOLD IS LOSING MOMENTUM. THE $3,925 LEVEL IS NOW IN FOCUS. Gold-backed crypto exposure is facing renewed selling pressure, and XAUT's daily structure is beginning to demand caution. Trading around $3,942.91 (-2.40%), Tether Gold has slipped beneath all three displayed moving averages. That is an important technical development, particularly after the rally that pushed price towards $4,679.80. WHAT THE CHART IS TELLING US This isn't simply a red candle. The broader structure shows a sequence of lower highs and weakening recovery attempts. Buyers have struggled to sustain upward momentum, while the latest decline has brought price close to its 24-hour low. THREE THINGS DESERVE ATTENTION: • $3,925 — Immediate support. A decisive breakdown could expose XAUT to further downside. • $3,991–$4,034 — Recovery barrier. Reclaiming this zone would be an important first step towards repairing the structure. • $4,039.80 — Near-term resistance. A sustained move above it would strengthen the recovery argument. THE VOLUME QUESTION Current displayed volume is 767, against MA5 at 1.37K and MA10 at 1.96K. Selling is occurring without a corresponding surge in volume. That leaves room for a stabilization attempt, but it does not yet establish buyer control. MY TRADING PERSPECTIVE I wouldn't rush to call a bottom here. If $3,925 gives way, watch for whether sellers can sustain the breakdown. If buyers defend the level and reclaim the $4,000–$4,034 region, the possibility of a short-term recovery becomes more credible. For now, XAUT needs to prove that it can attract buyers again. Patience is a position. Confirmation is an edge. Technical commentary based on the uploaded Bybit 1D chart. Not financial advice. $XAUTUSDT $BTCUSDT #ByXIMPACT