ICaty
6736いいね0シェア109ファン11フォロー
Crypto Trader 📈 | Market Researcher 🔍 Trading market structure, liquidity & narratives. No hype — just charts, data & real setups. 🎯
Crypto Trader 📈 | Market Researcher 🔍 Trading market structure, liquidity & narratives. No hype — just charts, data & real setups. 🎯
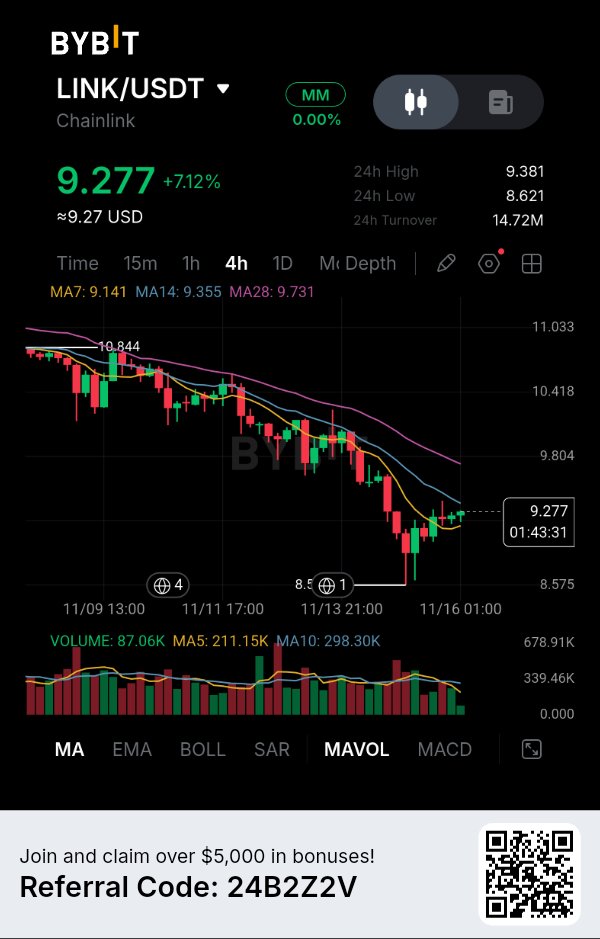
7%の回復は興味深いですが、買い手は依然として主要なレジスタンスゾーンに直面しています。 Chainlinkは短期的には力強い回復を見せており、LINKは7.12%上昇して4時間足のMA7を上回りました。しかし、私が注目しているのは、この回復がより大きな下落トレンドの構造の中で起きているという点です。 興味深いのは、買い手が直近の安値である8.62ドルから価格を押し上げることに成功したものの、現在は複数の移動平均線が回復の壁となり得る領域に近づいていることです。これが本格的なトレンド転換の始まりなのか、それとも売り手が戻ってくる前の一時的な反発(レリーフバウンス)なのかを見極めたいと考えています。 市場の状況 LINKは現在、直近の8.621ドル付近への下落から回復し、9.277ドル前後で取引されています。 4時間足チャートを見ると、これまでの下降トレンドが完全に解消されたわけではありません。MA7を上回ったとはいえ、価格は依然としてMA14およびMA28の下に位置しています。 これにより、興味深いテクニカルな状況が生まれています。 買い手は新たな強さを見せていますが、より広範な回復が確信できるためには、まず9.35ドル〜9.73ドルのレジスタンス領域を突破する必要があります。 私にとっては、目先の7%の上昇よりも、このゾーン周辺での次の反応の方が重要です。 データと根拠 提供されたBybitのスクリーンショットからの重要な数値は以下の通りです: 現在価格:9.277ドル 24時間変動率:+7.12% 24時間最高値:9.381ドル 24時間最安値:8.621ドル 24時間売買高:1472万ドル 直近の目視可能な高値:10.844ドル 移動平均線は、短期的なモメンタムと広範なトレンドの重要な違いを示しています: MA7:9.141ドル MA14:9.355ドル MA28:9.731ドル LINKはMA7を奪還しており、短期的な買い圧力が改善していることを示唆しています。 しかし、MA14とMA28は依然として現在の価格よりも上にあります。つまり、強気への転換が確定するためには、より大きな4時間足の構造での確認が必要です。 出来高も重要な詳細を提供しています: 現在の出来高:87.06K 出来高MA5:211.15K 出来高MA10:298.30K 7.12%の価格回復にもかかわらず、表示されている現在の出来高は両方の平均を下回っています。 これは無視できない点です。価格は回復していますが、市場の参加はまだ直近の平均レベルに達していません。より強力な出来高の拡大があれば、回復はより説得力のあるものになるでしょう。 私の見解 LINKの現在の構造において、2つの重要なレベルに注目しています。 1つ目はMA14が位置する9.355ドル、2つ目はMA28がさらなる抵抗を生み出す9.731ドルです。 もし買い手が両方のレベルを奪還し、その上で価格を維持できれば、現在の回復はより大きなトレンド転換へと発展する可能性があります。 しかし、LINKがこのレジスタンスゾーンで苦戦し、4時間足で確実な弱気の拒絶反応(リジェクション)が確認された場合、9.14ドル、さらには8.62ドルへの再度の下落が起こり得ます。 私の方針としては、7%上昇した後の追っかけ買いは避けたいと考えています。方向性を決める前に、まずは移動平均線周辺での価格の振る舞いを観察するつもりです。 トレードセットアップ LINK — ショート(売り)シナリオ 弱気のトリガー:9.35ドル〜9.73ドルのレジスタンス領域からの拒絶を確認し、それに続く4時間足の弱気キャンドルの確定。 エントリーゾーン:9.40ドル〜9.65ドル 損切り(ストップロス):9.85ドル 利確1(TP1):9.14ドル 利確2(TP2):8.85ドル 利確3(TP3):8.62ドル 強気の無効条件:9.85ドルを上回る4時間足の確定。これにより弱気継続のセットアップは弱まります。 下値目標はチャートの構造に基づく推測値であり、TP3は直近の8.621ドルの安値付近に設定しています。 TP3までの潜在的な下落幅:約8%〜10%。 推定リスク・リワード比:エントリーと実行方法によりますが、約2.5:1。 このセットアップは条件付きです。実際にレジスタンスからの反発を確認するまで、ショートはアクティブと見なしません。 最終的な結論 現在、Chainlinkが興味深いのは、短期的なモメンタムの改善と、回復途上の広範なトレンドとのコントラストにあります。 7.12%の上昇は買い手が戻ってきたことを示していますが、移動平均線は彼らが依然として重要な抵抗を克服しなければならないことを示唆しています。 私にとって、この回復が既存の弱気構造を打ち破るだけの強さを持っているかどうかは、9.35ドル〜9.73ドルの領域が判断材料となります。 もし買い手が説得力のある出来高を伴ってこの領域を奪還すれば、見通しは変わります。逆に売り手が防衛に成功すれば、直近の回復は大きな下降トレンドの中の「戻り高値」となるでしょう。 次の重要なシグナルは、LINKがこのレジスタンスゾーンに到達したときにどのように反応するかによって決まります。$LINKUSDT #ByXIMPACT

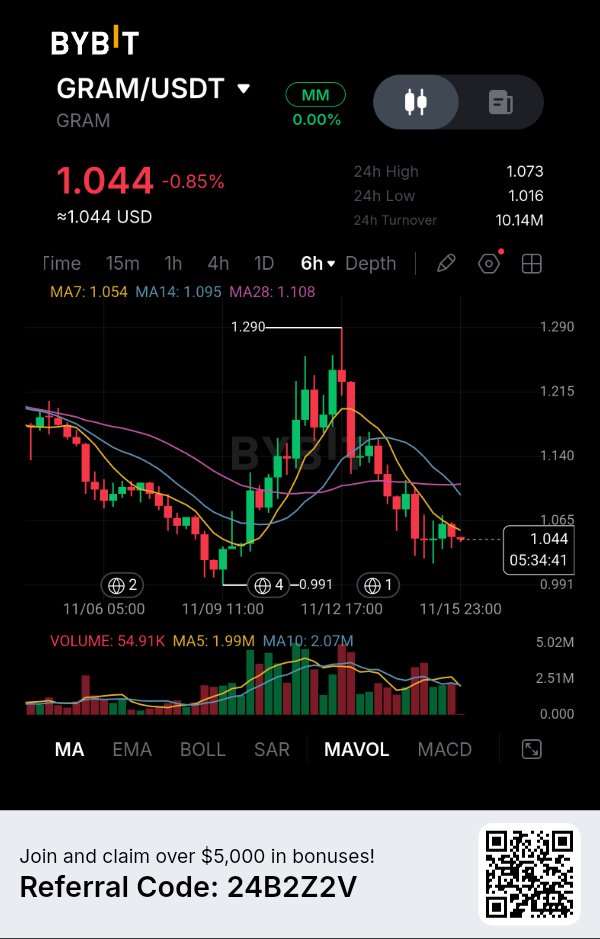
$GRAMUSDT — The recovery toward $1.29 has completely lost momentum, and the 6H chart is showing why sellers still have an advantage. GRAM is trading around $1.044, down 0.85%. What interests me is not the latest small decline, but the inability of buyers to maintain the recovery after the previous explosive rally. The market has moved from a strong upward expansion into a sequence of lower highs, suggesting that sellers are gradually regaining control. What the 6H Structure Is Revealing The moving averages are providing an important confirmation: MA7: $1.054 MA14: $1.095 MA28: $1.108 Price is trading below all three moving averages, while MA7 remains beneath MA14 and MA28. This alignment suggests that the broader short-term momentum is still bearish. Another detail deserves attention. After reaching $1.29, GRAM failed to sustain its upward momentum and gradually returned toward the $1.016 support area. The recent recovery attempts have also struggled to reclaim the moving-average cluster. For me, this suggests that buyers haven't yet demonstrated enough strength to establish a genuine trend reversal. My Market Outlook I'm leaning toward bearish continuation, particularly if price attempts another recovery toward the $1.095–$1.108 resistance zone. If sellers defend this region, another downside move could develop. My downside roadmap: $1.016 — First major support. $0.991 — Previous structural low. $0.970 — Extended projected downside objective. The $0.991 level is particularly important because it represents the previous visible swing low. My Trading Signal Direction: SHORT (conditional) Entry: $1.095–$1.108 after confirmed bearish rejection. Stop Loss: $1.130 TP1: $1.016 TP2: $0.991 TP3: $0.970 Reference Entry: $1.100 Potential downside to TP3: Approximately 11.82%. Defined risk: Approximately 2.73%. Risk-to-Reward: Approximately 4.33:1. I want to see price revisit the moving-average resistance zone and show a clear rejection before considering this setup. I won't chase the market lower at current support. What Could Invalidate My View? A sustained 6H recovery above $1.108 would be the first warning against my bearish thesis. A stronger move above $1.130 would invalidate the proposed short setup and suggest that buyers are beginning to regain control. On the other hand, a decisive breakdown below $1.016 could strengthen the bearish continuation scenario. Risk Management GRAM has already experienced significant volatility, especially during its previous rally toward $1.29. That's why I don't want to mistake a temporary bounce for a confirmed reversal. My preference is to wait for a recovery into resistance and let sellers demonstrate whether they still control the market. For now, the moving averages and lower-high structure favor sellers. The important question is whether GRAM can reclaim $1.10 or whether another failed recovery will send price back toward the $0.991 structural low. $GRAMUSDT #ByXIMPACT

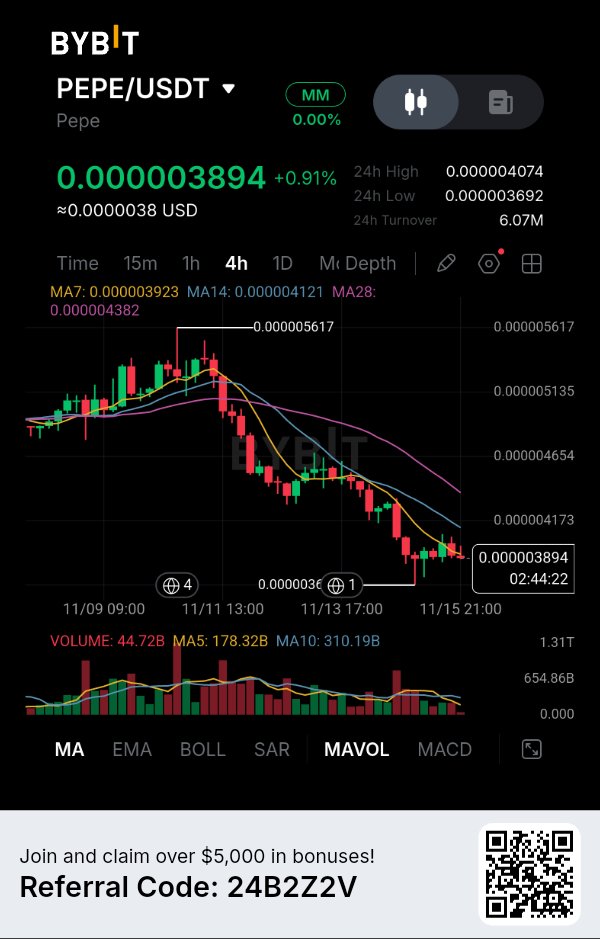
The Recovery Is Losing Momentum While Sellers Continue Controlling the 4H Structure. PEPE is showing a small positive 24H change, but the bigger picture tells a different story. What catches my attention is that despite the latest stabilization around $0.000003894, price remains below all three moving averages, and buyers have not yet demonstrated enough strength to reverse the existing downtrend. The interesting part is that PEPE is attempting to establish a floor near its recent lows, but trading activity has weakened considerably. This creates an important situation: are buyers quietly building support, or is the market simply pausing before another downward move? THE MARKET STORY PEPE is currently trading around $0.000003894, with a 24H gain of 0.91%. However, I would not interpret this small recovery as a bullish reversal. The 4H chart shows a clear sequence of lower highs and lower lows after the rejection near $0.000005617. Since then, recovery attempts have consistently struggled to regain previous resistance levels. What interests me most is the current position of price relative to the moving averages. PEPE is trading slightly below MA7 and significantly below MA14 and MA28. This suggests that the recent stabilization has not yet changed the broader bearish structure. DATA & EVIDENCE Here are the important figures from the supplied Bybit chart: Current price: $0.000003894 24H change: +0.91% 24H high: $0.000004074 24H low: $0.000003692 24H turnover: $6.07M Previous visible high: $0.000005617 The moving averages reveal the current market structure: MA7: $0.000003923 MA14: $0.000004121 MA28: $0.000004382 All three moving averages are positioned above the current price. More importantly, MA7 remains below MA14, while MA14 remains below MA28. This bearish alignment suggests that sellers continue to have the advantage on the 4H timeframe. Volume provides another important observation: Current volume: 44.72B Volume MA5: 178.32B Volume MA10: 310.19B Current displayed volume is considerably below both averages. This indicates that the latest price stabilization is happening with relatively weak trading participation. I would like to see stronger volume before considering the recovery a meaningful change in market direction. MY READ: I believe PEPE is approaching an important decision point around $0.000003692. If buyers successfully defend this level, another recovery toward $0.000003923 and potentially $0.000004121 becomes possible. However, reclaiming MA7 alone would not convince me that the trend has reversed. The more interesting scenario is a confirmed 4H breakdown below $0.000003692, followed by a failed retest. That would suggest buyers are losing their grip on the current support area and could open the door to another downward extension. I am not interested in chasing the existing decline. I want confirmation that sellers can turn the recent low into resistance. TRADING SETUP PEPE — SHORT Scenario: Bearish trigger: Confirmed 4H candle close below $0.000003692, followed by a failed retest. Entry Zone: $0.00000366–$0.00000369 Stop Loss: $0.00000388 TP1: $0.00000355 TP2: $0.00000342 TP3: $0.00000328 Bullish invalidation: PEPE reclaims $0.000004121 and establishes sustained 4H strength above this resistance. The downside targets are estimated extension levels because lower support zones are not clearly established in the supplied screenshot. Potential downside to TP3: Approximately 10%–11%. Defined risk: Approximately 5%–6%. Estimated risk-to-reward: Around 2:1. This setup remains conditional. I would not activate the SHORT position unless the $0.000003692 support breakdown is confirmed. FINAL THESIS: What makes PEPE interesting right now is the difference between its slightly positive 24H performance and its still-bearish 4H structure. A small green daily change does not necessarily mean buyers are regaining control. The moving averages, declining recovery attempts, and weaker recent volume all suggest that the market still needs stronger evidence before a trend reversal can be considered. For me, $0.000003692 is the level that deserves the most attention. A confirmed breakdown could expose lower price levels, while a successful defense followed by a reclaim of $0.000004121 would challenge the bearish thesis. The next important move will depend on whether buyers can turn this stabilization into genuine demand or whether sellers continue controlling the market structure. $PEPEUSDT #ByXIMPACT

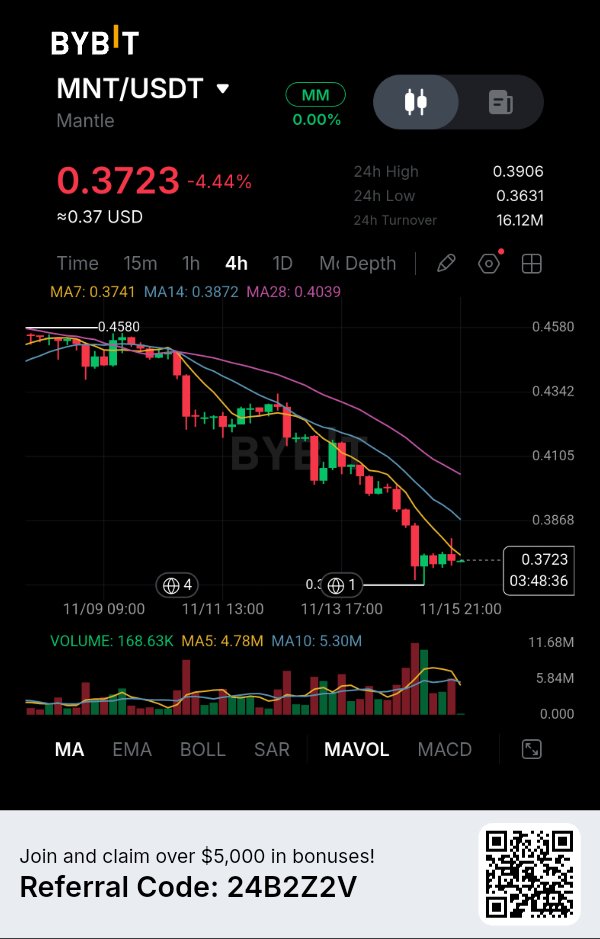
$MNTUSDT — The latest breakdown has shifted the balance further toward sellers, and I'm watching whether the next recovery attempt becomes another opportunity for downside continuation. Mantle is trading around $0.3723, down 4.44%, and the 4H chart is showing a persistent sequence of lower highs and lower lows. What caught my attention is that buyers are struggling to recover even after price reaches a nearby support area. The latest bounce remains relatively weak compared with the selling pressure that preceded it. What the 4H Structure Is Revealing The moving averages are showing a clear bearish alignment: MA7: $0.3741 MA14: $0.3872 MA28: $0.4039 Price is trading below all three averages, with the MA7 positioned beneath the MA14 and MA28. This suggests that the broader short-term momentum remains bearish. Another important observation is the rejection from the $0.4100 region. Since that rejection, sellers have gradually pushed MNT lower, eventually bringing price toward the $0.3631 area. For me, the MA14 around $0.3872 is particularly important. Unless buyers reclaim this region, the current recovery attempts remain vulnerable. My Market Outlook I'm favoring bearish continuation, but I don't want to chase the current decline. My preferred scenario is a recovery toward the $0.3820–$0.3870 resistance zone, followed by a confirmed rejection. If sellers defend that area, another downside move could develop. My downside roadmap: $0.3631 — Immediate support and first target. $0.3550 — Next projected downside level. $0.3450 — Extended downside objective. The lower two levels are estimated projections rather than confirmed support levels on the visible chart. My Trading Signal Direction: SHORT (conditional) Entry: $0.3820–$0.3870 after confirmed bearish rejection. Stop Loss: $0.4050 TP1: $0.3631 TP2: $0.3550 TP3: $0.3450 Reference Entry: $0.3850 Potential downside to TP3: Approximately 10.39%. Defined risk: Approximately 5.19%. Risk-to-Reward: Approximately 2.00:1. I want sellers to demonstrate strength around the entry zone before considering this position. If MNT continues falling without a retest, I won't chase the move. What Could Invalidate My View? A sustained 4H recovery above $0.3872 would be the first warning against my bearish thesis. A stronger reclaim of the $0.4039 MA28 would challenge the broader downward structure and suggest buyers are beginning to regain control. On the other hand, a decisive breakdown below $0.3631 could strengthen the bearish continuation scenario. Risk Management MNT is approaching an important support area, and that's exactly why entry timing matters. Selling directly into support can expose a position to an unexpected rebound. I'd rather wait for price to recover toward resistance and allow sellers to confirm their presence. For now, the moving averages and market structure favor sellers. The next important battle is around $0.3870. Can buyers reclaim the lost trend levels, or will another recovery attempt give sellers the opportunity to push Mantle toward lower prices? $MNTUSDT #ByXIMPACT

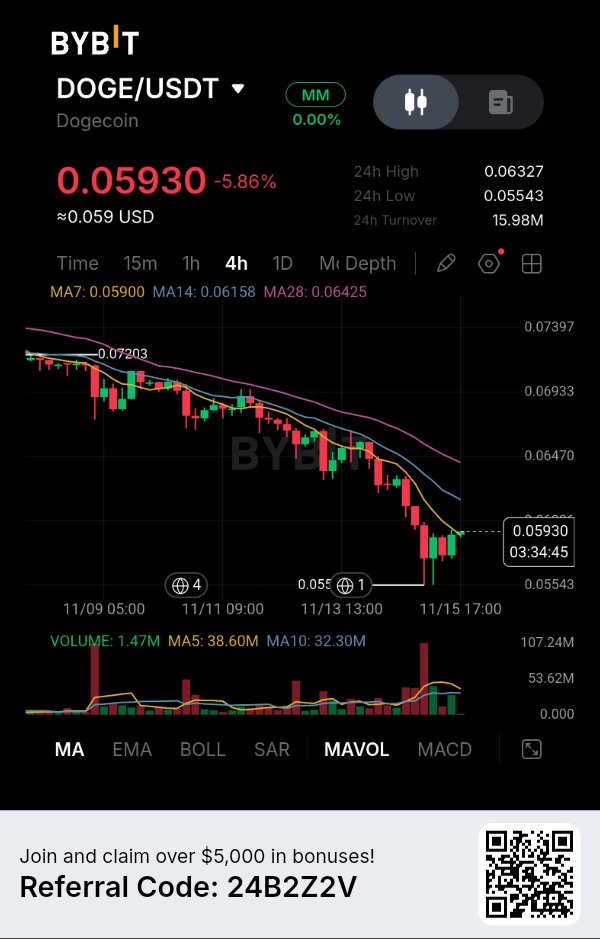
反発は見られるものの、買い手は依然として実力を証明する必要がある。Dogecoinは直近の安値からわずかに回復したが、興味深いのは、この反発が広範な4時間足の市場構造をまだ変えていないという点だ。DOGEは5.86%下落した後、0.05930ドル付近で推移しており、2本のより期間の長い移動平均線が依然として上値抵抗として機能している。 注目しているのは0.05543ドル付近での反応だ。この水準付近で買いが入ったものの、直前の下落と比較すると、回復は依然として限定的である。これにより興味深い状況が生まれている。DOGEは一時的な底を形成しているのか、それとも売り手が直近安値への再挑戦を準備しているのか。 市場の状況:DOGEは現在、0.07203ドルの目立った高値から下落した後、0.05930ドル付近で取引されている。 4時間足チャートは、安値切り下げと高値切り下げの連続を示している。しかし、直近のローソク足は、0.05543ドルへの急落後、買い手が価格を安定させようとしていることを示唆している。 特に注目しているのは移動平均線の位置関係だ。 DOGEはMA7をわずかに上回ったものの、MA14とMA28は依然としてかなり高い位置にある。これは、広範なトレンド転換の確認なしに、短期的な買い意欲が出現したことを示唆している。 私にとって、次の重要な攻防ラインは0.06158ドル付近だ。 データとエビデンス 提供されたBybitチャートからの重要な数値は以下の通り。 * 現在価格:0.05930ドル * 24時間変動:-5.86% * 24時間高値:0.06327ドル * 24時間安値:0.05543ドル * 24時間売買高:1,598万ドル * 直近の目立った高値:0.07203ドル 移動平均線は現在の市場構造を明らかにしている。 * MA7:0.05900ドル * MA14:0.06158ドル * MA28:0.06425ドル DOGEはMA7をわずかに上回っているが、MA14およびMA28を下回ったままだ。 これらの平均線の配置は依然として弱気であり、MA7がMA14の下に、MA14がMA28の下にある。これは、広範な売り構造が維持されていることを示唆している。 出来高はまた別の興味深い詳細を提供している。 現在の出来高:147万 出来高MA5:3,860万 出来高MA10:3,230万 直近の表示出来高は、両方の移動平均を大幅に下回っている。これは、現在の回復には、過去の期間に見られたような同水準の取引活動が伴っていないことを示している。 この反発を市場の方向性の有意義な変化として扱う前に、より強い参加を確認したいと考えている。 私の見解:DOGEは重要な抵抗テストに近づいていると考えている。 0.06158ドル付近は、MA14と一致するため特に重要だ。もし買い手がこの水準を奪還し、価格を維持できれば、現在の弱気な解釈は弱まり始めるだろう。 しかし、DOGEがこの領域に近づき、売り手が回復を拒否すれば、0.05800ドル、そして0.05543ドルへの再下落の可能性がある。 DOGEはすでに下落しているため、単純にショートするつもりはない。 抵抗線付近で買い手が勢いを失い、弱気な4時間足の反応を通じて売り手の復帰が確認されるのを見たい。 それが、より興味深い取引機会を提供してくれるだろう。 トレーディングセットアップ DOGE/USDT — ショートシナリオ 弱気のトリガー:0.06100ドル~0.06158ドルの抵抗帯からの拒絶(4時間足での弱気確定が必要) エントリーゾーン:0.06100ドル~0.06150ドル ストップロス:0.06350ドル TP1(利確目標1):0.05800ドル TP2(利確目標2):0.05650ドル TP3(利確目標3):0.05550ドル 強気無効化ライン:4時間足で0.06350ドルを維持して確定。 下値目標は、推定価格予測と目に見えるサポート構造に基づいている。最終目標は、前回の0.05543ドルの安値近くに設定されている。 TP3までの下落余地:約9%。 定義されたリスク:約3.3%~4.1%。 推定リスク・リワード比:実行にもよるが、約2:1以上。 この設定は条件付きのままだ。現在の価格でエントリーを追うのではなく、抵抗線での拒絶を待つつもりだ。 最終結論:今、DOGEを興味深いものにしているのは、短期的な安定化と、実際の市場構造の回復との違いだ。 買い手は直近の安値を防衛したが、トレンドが有意義に改善したと見なすには、移動平均線による抵抗を克服する必要がある。 私にとって、0.06158ドルが最も注目すべき水準だ。奪還に成功すれば現在の見通しが変わる可能性がある一方、再度拒絶されれば0.05543ドルが再び焦点となるだろう。 次の動きは、買い手がこの小さな回復を持続的な需要に変えられるか、それとも売り手が広範な構造を支配し続けるかにかかっている。DOGEUSDT #ByXIMPACT

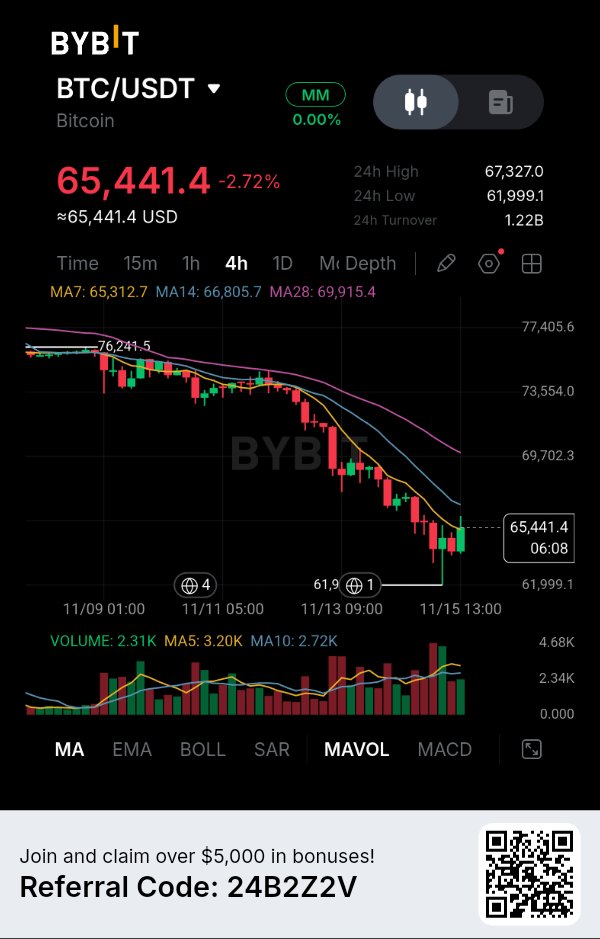
$BTCUSDT — Bitcoin's latest bounce is interesting, but I'm not convinced the market has found its bottom yet. The 4H structure still favors sellers, and the next resistance test could reveal whether this recovery has real strength. Bitcoin is trading around $65,441, down 2.72%. After falling from the $76,241 region toward $61,999, buyers have finally produced a noticeable reaction. But there's an important distinction between a relief bounce and an actual trend reversal. What the 4H Chart Is Revealing The moving averages are showing where the current pressure remains: MA7: $65,312.7 MA14: $66,805.7 MA28: $69,915.4 Price has managed to move slightly above MA7, which suggests short-term stabilization. However, BTC remains below MA14 and MA28. The wider structure is still bearish, with a clear sequence of lower highs and lower lows. What interests me most is the $66,800 region. This is where the MA14 sits, making it an important resistance area for the next recovery attempt. If buyers fail to reclaim this level, the recent bounce could become another opportunity for sellers. My Market Outlook I'm leaning toward bearish continuation unless Bitcoin can establish a stronger structure above the moving-average resistance. My downside roadmap: $61,999 — Previous major low and first downside objective. $60,500 — Next projected downside target. $58,500 — Extended downside objective. The lower two levels are projected extensions, not confirmed support levels on the visible chart. My Trading Signal Direction: SHORT (conditional) Entry: $66,000–$66,800 after confirmed bearish rejection. Stop Loss: $68,000 TP1: $61,999 TP2: $60,500 TP3: $58,500 Reference Entry: $66,400 Potential downside to TP3: Approximately 11.90%. Defined risk: Approximately 2.41%. Risk-to-Reward: Approximately 4.94:1 to TP3. I want to see sellers defend the MA14 resistance zone before considering this trade. If Bitcoin breaks above resistance with convincing momentum, I won't force a short position. What Could Invalidate My View? A sustained 4H recovery above $66,805 would be the first warning against my bearish thesis. A stronger reclaim of the $69,915 MA28 would suggest that buyers are beginning to challenge the broader downward structure. On the other hand, a rejection from $66,800 followed by a breakdown toward $61,999 would strengthen the bearish continuation scenario. Risk Management Bitcoin has already experienced a significant decline, so chasing the current move lower isn't my preferred approach. I'd rather wait for a recovery into resistance and let the market show whether sellers are still in control. For now, MA7 is providing short-term support, but MA14 and MA28 remain overhead obstacles. The next important battle is around $66,800. Bitcoin has shown that buyers can produce a bounce. Now they need to prove they can turn that bounce into a genuine change in market structure. $BTCUSDT #ByXIMPACT


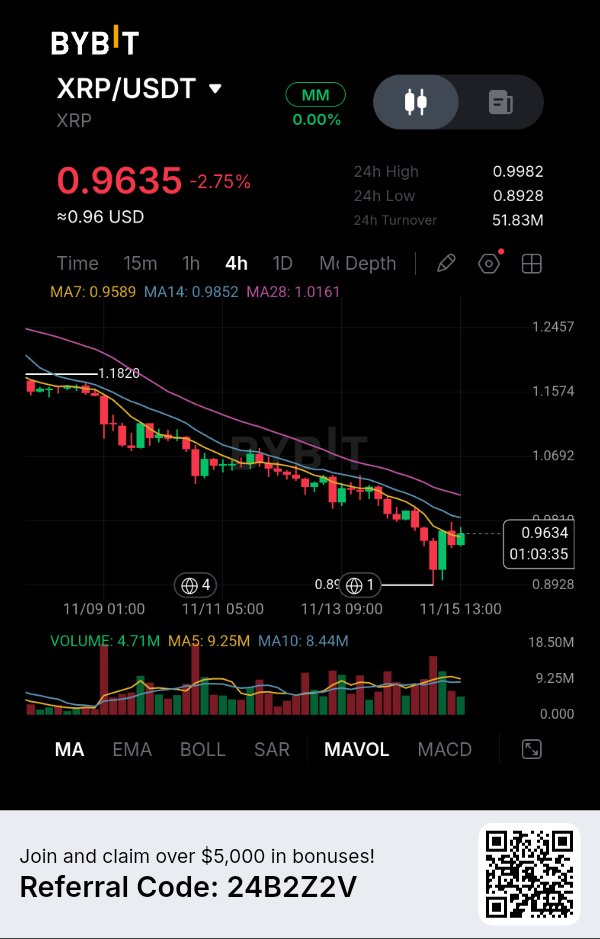
A Small Recovery Is Emerging, But the Bigger Trend Still Favors Sellers. XRP is attempting to stabilize after a prolonged 4H decline, but what catches my attention is the difference between the latest bounce and the broader market structure. Price has recovered from the $0.8928 low, yet it is still struggling to regain its major moving averages. The interesting part is that buyers have managed to push XRP back above its short-term MA7, but the MA14 and MA28 remain overhead. This creates an important question: is this the beginning of a meaningful recovery, or simply a temporary bounce inside a bearish trend? THE MARKET STORY XRP is currently trading around $0.9635, down 2.75% over 24 hours. The 4H chart shows a consistent sequence of lower highs and lower lows, indicating that sellers have maintained control throughout the recent decline. However, the latest reaction from $0.8928 deserves attention. Buyers stepped in near that level and managed to produce a recovery toward $0.9635. I am not treating this bounce as a confirmed reversal. What matters now is whether buyers can reclaim the $0.9852 resistance area or whether sellers use that region to resume the downward move. DATA & EVIDENCE Here are the important figures from the supplied Bybit screenshot: Current price: $0.9635 24H change: -2.75% 24H high: $0.9982 24H low: $0.8928 24H turnover: $51.83M Previous visible high: $1.1820 The moving averages reveal an interesting situation: MA7: $0.9589 MA14: $0.9852 MA28: $1.0161 XRP has recovered above MA7, which suggests some short-term buying interest. However, MA14 and MA28 remain above the current price, with the averages still arranged bearishly. This means the broader 4H structure has not yet changed. Volume provides another important detail: Current volume: 4.71M Volume MA5: 9.25M Volume MA10: 8.44M Current volume remains below both averages. This suggests that the latest recovery has not yet attracted participation comparable to recent trading activity. For me, this makes the current bounce less convincing as a trend reversal. MY READ I believe $0.9852 is the next important level for XRP. If buyers manage to reclaim this resistance and establish sustained 4H strength above it, the bearish interpretation will begin to weaken. But if price approaches this region and sellers reject another recovery attempt, the market could revisit the $0.9300 area before testing the previous low at $0.8928. I am particularly cautious about entering during the current bounce. A declining market can produce temporary recoveries without changing its overall direction. I want to see how XRP reacts around MA14 before considering a bearish continuation position. TRADING SETUP XRP — SHORT Scenario: Bearish trigger: Rejection around $0.9750–$0.9852, followed by a confirmed 4H bearish candle. Entry Zone: $0.9750–$0.9850 Stop Loss: $1.0050 TP1: $0.9400 TP2: $0.9150 TP3: $0.8930 Bullish invalidation: Sustained 4H acceptance above $1.0050, weakening the bearish continuation setup. The lower targets are estimated from the visible chart structure, with TP3 positioned near the previous $0.8928 low. Potential downside to TP3: Approximately 8.4%–9.3%. Defined risk: Approximately 2.0%–3.1%. Estimated risk-to-reward: Around 3:1, depending on entry and execution. This setup is conditional. I would not activate it without a confirmed rejection from the proposed entry region. FINAL THESIS: What makes XRP interesting right now is that the first signs of short-term buying interest are appearing while the broader 4H structure remains bearish. The recovery above MA7 is encouraging, but it is not enough to establish a trend reversal. For me, the next important battle is around $0.9852. If buyers reclaim that level, the bearish thesis will need reconsideration. If sellers defend it, XRP could revisit its recent lows. I am watching whether this recovery develops into genuine buying strength or becomes another lower high in the existing downtrend. $XRPUSDT #ByXIMPACT

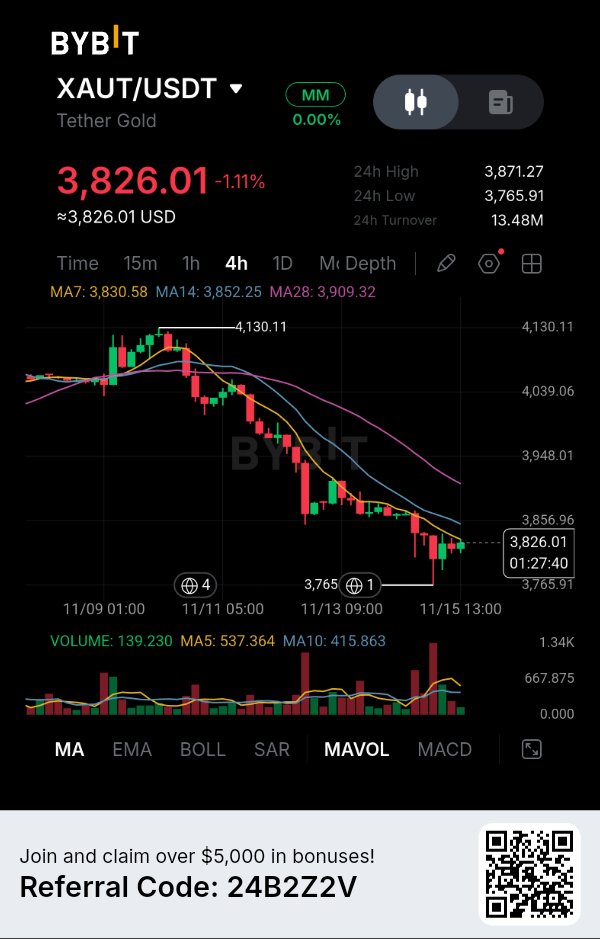
$XAUTUSDT — The bounce from $3,765 has caught my attention, but the broader 4H structure still suggests sellers are controlling the market. Tether Gold is trading around $3,826.01, down 1.11%. After falling from the $4,130 region, price has attempted to stabilize, but the recovery remains relatively weak compared with the preceding selling pressure. What interests me most is the position of price beneath the moving-average resistance cluster. What the 4H Chart Is Revealing The current moving-average readings are: MA7: $3,830.58 MA14: $3,852.25 MA28: $3,909.32 Price remains below all three moving averages. Although the latest candles show a modest recovery, the broader structure continues to produce lower highs and lower lows. There's another important detail: the recent decline toward $3,765.91 attracted some buying activity, but buyers haven't yet demonstrated enough strength to reclaim the MA14. For me, this looks more like an attempted stabilization inside a broader downtrend than a confirmed reversal. Where I'm Looking Next The $3,830–$3,852 region is my immediate resistance zone. If price revisits this area and sellers produce another rejection, I believe the market could resume its downward movement. My downside roadmap: $3,765.91 — Previous swing low and first major support. $3,735 — Next projected downside target. $3,700 — Extended downside objective. The lower two levels are estimated projections, not confirmed support levels on the visible chart. My Trading Signal Direction: SHORT (conditional) Entry: $3,835–$3,855 after confirmed bearish rejection. Stop Loss: $3,890 TP1: $3,765.91 TP2: $3,735 TP3: $3,700 Reference Entry: $3,845 Potential downside to TP3: Approximately 3.77%. Defined risk: Approximately 1.17%. Risk-to-Reward: Approximately 3.22:1. I want to see sellers defend the resistance zone before considering this setup. If price breaks above resistance with strong buying momentum, I won't force a short entry. What Could Invalidate My View? A sustained 4H recovery above $3,852 would be the first warning against my bearish outlook. A stronger reclaim above $3,909 would challenge the broader downside structure and suggest buyers are gaining control. On the other hand, a decisive breakdown below $3,765.91 could strengthen the bearish continuation scenario. Risk Management I'm not interested in selling directly into the previous low. Support can produce sharp reactions, especially after an extended decline. My preference is to let price recover toward resistance and wait for sellers to confirm their presence. For now, the moving averages continue to favor the downside, but the next resistance test will be important. The real question is whether this bounce marks the beginning of a genuine recovery or simply gives sellers another opportunity to push Tether Gold lower. $XAUTUSDT #ByXIMPACT

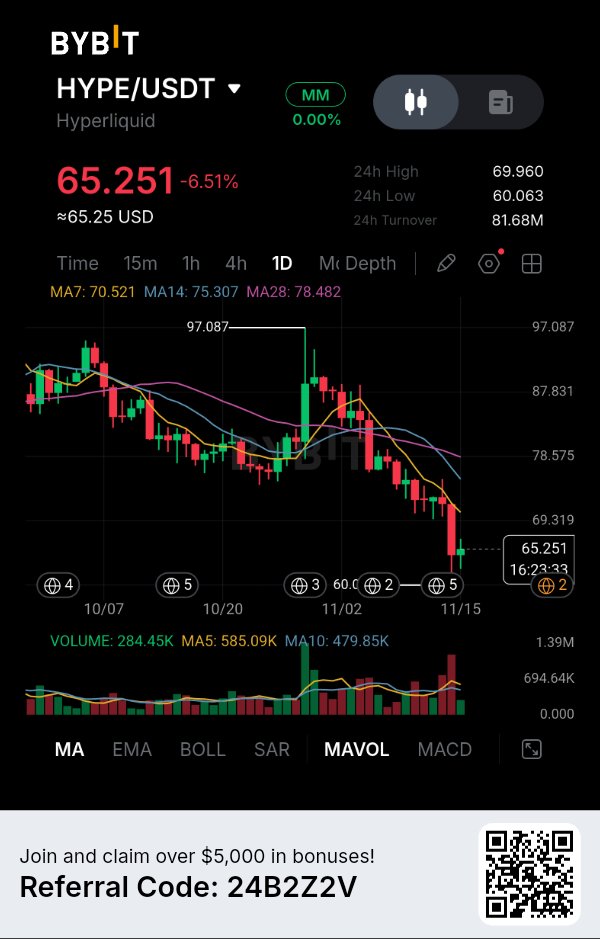
回復局面が直面する大きな問題 ― 市場のトレンドは依然として売り手が支配している。 Hyperliquidは6.51%下落していますが、私が注目しているのは現在の価格と主要な日足移動平均線との乖離です。HYPEは60ドル付近までの急落後に安定化を試みていますが、直近の回復はより大きな市場構造を変化させるほど強力なものではありません。 興味深いのは、買い手が直近安値からの反発をなんとか作り出したものの、価格が依然として3本の移動平均線すべてを下回っている点です。これは極めて重要な局面です。これは回復の始まりなのでしょうか、それともより大きな下落トレンドにおける一時的な小休止に過ぎないのでしょうか? 【市場の状況】 HYPEは現在約65.251ドルで取引されており、確認できる高値97.087ドルから大幅に下落しています。 通常の調整とは異なり、日足チャートは高値切り下げ、安値切り下げのシーケンスを示しています。直近の下落は60.063ドルまで加速し、その後買い手が回復を試みました。 この反発が重要な移動平均線のレジスタンスレベルをまだ奪還できていないため、次に何が起こるのか非常に注目しています。 私にとって、一時的な回復と本格的なトレンド転換の違いは、買い手がこれらのレベルを奪還できるかどうかにかかっています。 【データと根拠】 提供されたBybitのスクリーンショットから読み取れる重要な数値は以下の通りです: 現在価格:$65.251 24時間変動率:-6.51% 24時間高値:$69.960 24時間安値:$60.063 24時間出来高:$81.68M 過去の確認できる高値:$97.087 日足移動平均線は弱気な構造を示しています: MA7(7日移動平均線):$70.521 MA14(14日移動平均線):$75.307 MA28(28日移動平均線):$78.482 3本の平均線すべてが現在価格を上回っており、MA7がMA14を下回り、MA14がMA28を下回っています。 この並びは、より広い日足トレンドにおいて売り手が依然として主導権を握っていることを示唆しています。 出来高にも重要な詳細があります: 現在の出来高:284.45K 出来高MA5:585.09K 出来高MA10:479.85K 現在表示されている出来高は、両方の平均を下回っています。これは、直近の回復が、近年の平均的な取引活動に匹敵するほどの参加者を集められていないことを示唆しています。 この反発を持続可能な反転の証拠と見なす前に、より強い出来高を確認したいところです。 【私の見解】 HYPEは重要なテクニカルな決断ポイントに近づいていると考えます。 60.063ドルの水準は、このチャート上で最も重要な視覚的サポートです。 もし買い手がこのエリアをうまく防衛できれば、HYPEは70.521ドル、そして75.307ドルを目指す再度の回復を試みる可能性があります。 しかし、これらのレベルを奪還するには、いくつかの陽線が出るだけでは不十分です。 懸念されるのは、価格が依然として移動平均線を大きく下回っており、市場全体の構造が依然として売り手に有利であるという点です。 現在の急落を追いかけるよりも、ブレイクダウンが確定するのを待つ方が賢明だと考えます。 【トレード戦略】 HYPE — ショートシナリオ 弱気のトリガー:60.063ドルを下回る日足確定と、その後の戻り売り失敗。 エントリーゾーン:59.50ドル〜60.00ドル ストップロス:62.20ドル TP1(利益確定1):57.50ドル TP2(利益確定2):55.00ドル TP3(利益確定3):52.50ドル 強気への無効化:HYPEが70.521ドルを奪還し、この水準を上回る持続的な日足の強さを示すこと。 下値目標は提供されたスクリーンショットでは確認できないサポートレベルがあるため、エクステンションに基づいた推定値です。 TP3までの潜在的な下落幅:約11.8%〜12.5% 定義されたリスク:約3.7%〜4.5% 推定リスクリワード比:約2.7:1(執行による) この戦略はあくまで条件付きです。60.063ドルのブレイクダウンが確認されない限り、ショートを開始するつもりはありません。 【最終結論】 現在、HYPEが興味深いのは、短期的な回復と日足ベースの全体的な構造との乖離です。 買い手は60ドル付近で一定の需要を示しましたが、重要な移動平均線をまだ回復できていません。そのため、市場は再度売られるリスクに対して脆弱なままです。 私にとって次の大きなシグナルは60.063ドルのサポートから来るでしょう。このサポートのブレイクダウンが確定すればさらなる下落を招く可能性がありますし、一方で70.521ドルを超える力強い回復が見られれば、現在の弱気シナリオに異議が唱えられることになります。 直近の反発を底打ちと決めつけるのではなく、Hyperliquidがこの一時的な安定化を、本格的な日足トレンドの回復へと変えられるかどうかを見守っています。$HYPEUSDT #ByXIMPACT

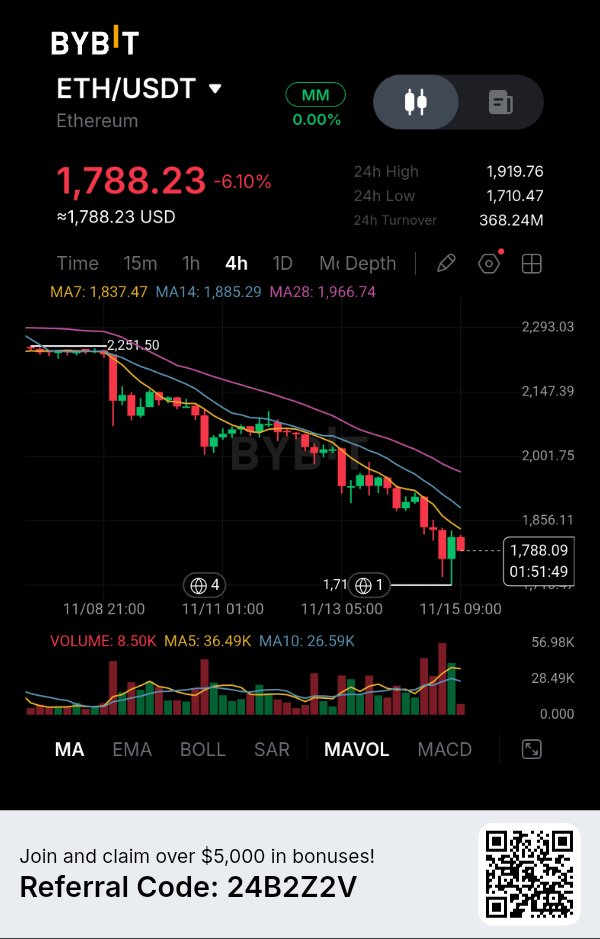
$ETHUSDT — イーサリアムの最近の下落により、価格は重要なサポートエリアに押し込まれましたが、これまでの回復は私の弱気な見通しを変えるほど確信が持てるものではありません。 ETHは4時間足チャートでのさらなる激しい売り波を受け、6.10%下落の1,788.23ドル付近で取引されています。 私が注目しているのは、この下落の背後にある構造です。買い手は繰り返し市場を安定させようと試みてきましたが、回復のたびに以前のレジスタンスレベルを奪還するのに苦戦しています。 市場構造は依然として弱い イーサリアムは2,251ドルの領域から、安値を切り下げ、高値も切り下げる展開に移行しています。 現在の移動平均線の数値は、この弱さをさらに明確にしています: MA7: 1,837.47ドル MA14: 1,885.29ドル MA28: 1,966.74ドル 価格はこれら3つの平均線をすべて下回っており、移動平均線は弱気な並び(逆パーフェクトオーダー)を維持しています。 これは、直近の反発が転換を確信するものではなく、より広範な下降トレンドの構造内で発生していることを示しています。 私が注視しているもう一つのレベルは、直近24時間安値の1,710.47ドルです。 売り手が強いモメンタムでこのエリアを割り込めば、イーサリアムはさらなる下落拡大に直面する可能性があります。 次のチャンスをどこに見ているか 私は特に1,837ドルから1,885ドルのレジスタンス領域に関心があります。 このエリアにはMA7とMA14が含まれており、次の回復の試みにとって重要なゾーンとなっています。 もしETHがこの領域まで反発し、売り手がその動きを拒否(リジェクション)した場合、弱気トレンドの継続の可能性がより高まると考えています。 私のアウトライン(下落シナリオ): 1,710ドル — 直近のサポート 1,680ドル — 最初の予想下落目標 1,640ドル — より深い下落ターゲット これらより下のターゲットは、スクリーンショットで確認できる確定したサポートレベルではなく、あくまで予測です。 私のトレードシグナル 方向性:ショート(条件付き) エントリー:1,840ドル~1,885ドル(弱気な反転が確認された後) 損切り(ストップロス):1,925ドル 利確1(TP1):1,710ドル 利確2(TP2):1,680ドル 利確3(TP3):1,640ドル 参考エントリー:1,855ドル TP3までの潜在的な下落幅:約11.59% 設定リスク:約3.77% リスク・リワード比:約3.07:1 このポジションを検討する前に、まずはレジスタンスへの回復と、それに続く明確な反転(リジェクション)を確認したいと考えています。すでに大幅に下落した後で、安値を追うようなトレードはしません。 何が私の見通しを無効にするか? 1,885ドルを超える持続的な4時間足での回復は、私の弱気なシナリオに対する最初の警告となります。 もし買い手がMA14を奪還し、その後1,925ドルの領域に挑戦するようなら、現在の売り構造は弱まり始める可能性があります。 その一方で、1,710ドルを決定的に下回れば、弱気トレンド継続のシナリオは強化されます。 リスク管理 イーサリアムは重要なサポートエリアに近づいており、一時的な反発があっても不思議ではありません。 だからこそ、サポートラインで直接ショートポジションを取るのではなく、レジスタンスの再テストを待つことを優先しています。 私の焦点は引き続き1,837ドル~1,885ドルのゾーンと、価格がそこに達した時の売り手の反応にあります。 現状、移動平均線と市場構造は売り手に有利です。 本当の問題は、イーサリアムがこの直近の反発を本物の回復に変えられるのか、それとも次のレジスタンスのテストが売り手にとっての新たな好機となるのか、ということです。 $ETHUSDT #ByXIMPACT

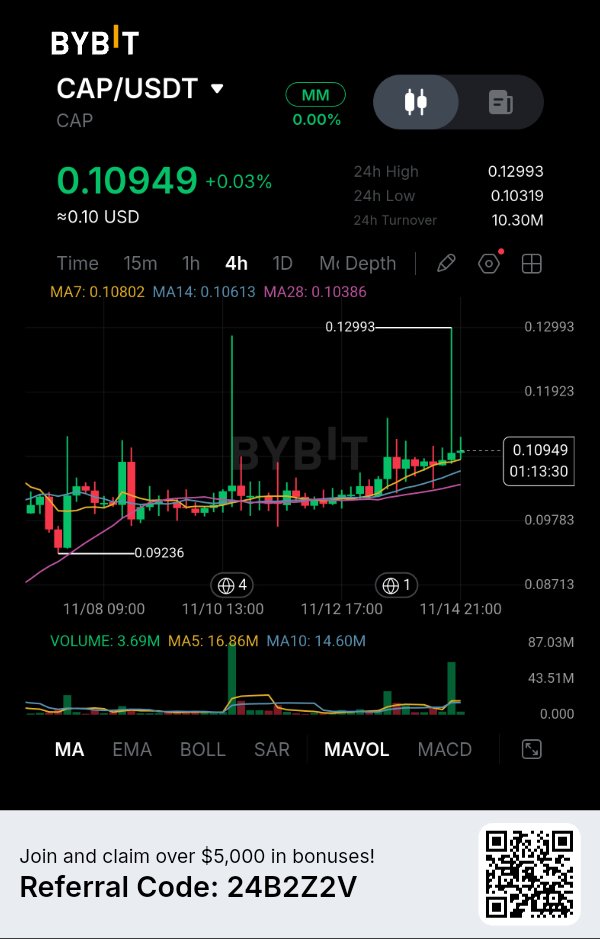
買い手が徐々に主導権を取り戻しつつあるが、一つのレジスタンスが全体の構成を一変させる可能性がある。 CAPは、下落傾向にある他のいくつかのアルトコインとは異なる市場構造を見せている。注目すべきは、最近のボラティリティにもかかわらず、価格が3本の移動平均線すべての上で推移し、$0.10949近辺で揉み合っている点だ。 興味深いのは、買い手が短期的な構造を徐々に改善しているものの、取引活動がまだ力強いブレイクアウトを裏付けていないことだ。これは重要な問いを投げかけている。CAPはさらなる上昇の準備をしているのか、それとも現在の回復はレジスタンスの下で勢いを失いつつあるのか? 市場の状況 CAPは現在$0.10949で取引されており、24時間比でほぼ横ばいの+0.03%となっている。 継続的に安値を更新する市場とは異なり、直近の4時間足チャートは、比較的安定した揉み合いの後に緩やかな回復を見せている。 私が最も注目しているのは移動平均線の位置関係だ。現在、価格はMA7、MA14、MA28を上回っており、短期的な買い手が優位に立ち始めていることを示唆している。 しかし、チャートを見ると、$0.12993に向けての急激な上ヒゲも確認できる。その動きは高値圏での著しいボラティリティを示しており、この以前の高値は今後の上昇ポテンシャルを評価する上で重要な参照点となる。 データとエビデンス 提供されたBybitチャートから読み取れる重要な数値は以下の通りだ: 現在価格: $0.10949 24時間変動: +0.03% 24時間高値: $0.12993 24時間安値: $0.10319 24時間出来高: $10.30M 直近の目視可能な安値: $0.09236 移動平均線は強気の並びを形成しつつある: MA7: $0.10802 MA14: $0.10613 MA28: $0.10386 3本とも現在の価格を下回っており、MA7 > MA14 > MA28となっている。 これは短期的なトレンドが改善していることを示唆しており、心強いテクニカルな進展だ。 しかし、出来高は少し異なる物語を語っている: 現在の出来高: 3.69M 出来高MA5: 16.86M 出来高MA10: 14.60M 現在表示されている出来高は、どちらの平均値も大幅に下回っている。 強力な参加を伴わない価格回復は、持続的なブレイクアウトに発展するのに苦労する可能性があるため、これは重要だ。 私の見解:CAPにおいて興味深いセットアップが形成されつつあると見ている。 買い手にとって最も強力な根拠は、強気の移動平均線の並びと、価格が$0.106〜$0.108の領域を維持できていることだ。 しかし、私はこの回復が完全に確認されたとは考えていない。 チャートの目視スケールと直近の価格動向に基づくと、次の重要なレジスタンスは約$0.11293となる。 もし買い手が出来高の増加を伴ってこの領域の上で4時間足を確定できれば、さらなる高値への継続的な上昇に興味が湧くだろう。 一方で、レジスタンスを奪還できなければ、CAPは現在の揉み合いレンジに閉じ込められたままになる可能性がある。 単に移動平均線が良い形をしているからといってエントリーするよりも、ブレイクアウトが確定するのを待つ方が賢明だ。 取引セットアップ CAP — ロングシナリオ: 強気のトリガー: 出来高の増加を伴い、$0.11293を上回る4時間足の確定。 エントリーゾーン: $0.1130–$0.1140 損切りライン: $0.1080 TP1 (利益確定1): $0.11923 TP2 (利益確定2): $0.12400 TP3 (利益確定3): $0.12993 弱気の無効化: ブレイクアウト試行後に$0.1080を維持できず、強気のセットアップが弱まる場合。 高値のターゲットは、チャート構造に基づく予測であり、$0.12993は以前の目視可能な高値を表している。 TP3までの潜在的な上昇幅: 約14.0%〜15.0%。 定義されたリスク: 約4.4%〜5.3%。 推定リスク・リワード: エントリーによるが、約2.7:1。 このセットアップは条件付きだ。レジスタンスが確実に奪還されるまでは、ロングが有効とはみなさない。 最終的な結論:CAPが興味深いのは、価格が比較的安定している一方で、4時間足構造が徐々に改善している点だ。 強気の移動平均線の並びは心強いシグナルだが、強力な出来高の裏付けがないことは無視できない。 私にとって次の重要な展開は、買い手がブレイクアウト確定後に$0.11293をサポートに転換できるかどうかだ。 もしそれが実現すれば、前回の高値である$0.12993が重要な上方参照点となる。それまでは、CAPはブレイクアウト確定というよりも、回復過程にあるセットアップといえる。 $CAPUSDT #ByXIMPACT

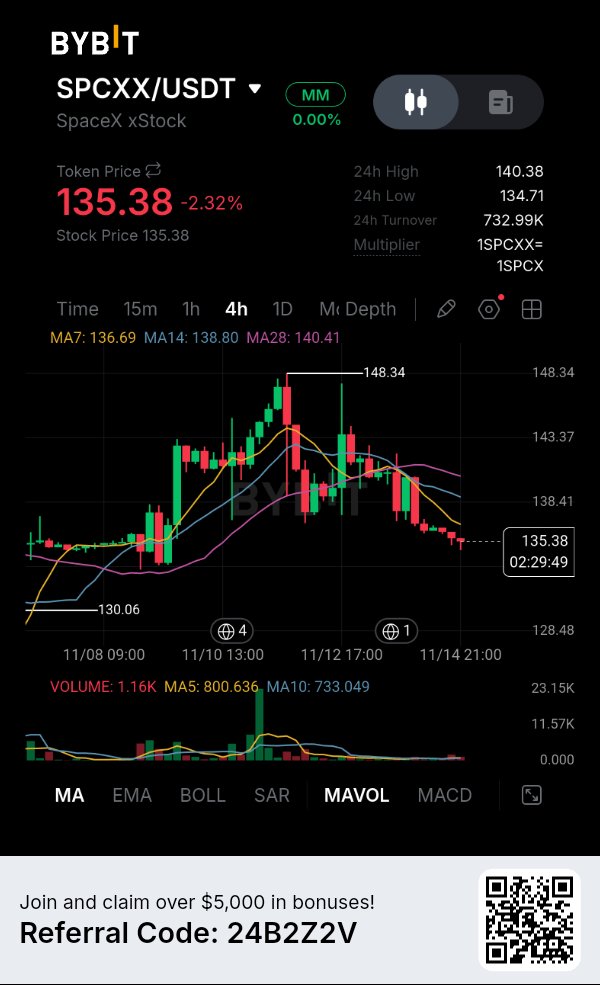
$SPCXXUSDT — The recovery has lost momentum, and sellers are gradually pushing SpaceX xStock back toward an important demand area. What caught my attention on the 4H chart is that price is no longer holding its previous recovery structure. After reaching $148.34, SPCX started forming lower highs, and the latest candles show buyers struggling to defend higher levels. Currently trading around $135.38, the token is down 2.32%, with the $134.71 area acting as immediate support. What the 4H Structure Is Revealing The moving averages are showing a clear shift in momentum: MA7: $136.69 MA14: $138.80 MA28: $140.41 Price is trading below all three moving averages, and their positioning reflects increasing short-term weakness. Another important detail is the rejection from the $143–$148 region. Buyers previously managed to push price higher, but they couldn't sustain that recovery. Now the market is approaching a critical area where another decision could emerge. My Market Outlook I'm leaning toward bearish continuation, but I don't want to chase price directly into support. The $136.69–$140.41 region is the resistance zone I'm watching. If SPCX attempts a recovery into this area and sellers reject it, another downside move becomes possible. My downside roadmap: $134.71 — Immediate support. $132.50 — Next projected downside target. $130.06 — Major structural support and final objective. The $130.06 level is particularly important because it represents the previous visible chart low. My Trading Signal Direction: SHORT (conditional) Entry: $137.00–$138.50 after confirmed bearish rejection. Stop Loss: $141.00 TP1: $134.71 TP2: $132.50 TP3: $130.06 Reference Entry: $137.75 Potential downside to TP3: Approximately 5.58%. Defined risk: Approximately 2.36%. Risk-to-Reward: Approximately 2.36:1. I want sellers to confirm their presence around the entry zone before considering this trade. If price continues falling without a retest, I won't chase the move. What Could Invalidate My View? A strong 4H recovery above $140.41 would be the first warning against my bearish thesis. If buyers reclaim the moving-average cluster and establish higher highs, the current weakness could turn into another recovery attempt. On the downside, a decisive breakdown below $134.71 could strengthen the bearish continuation scenario. Risk Management I'm not ignoring the possibility of a bounce from the current support area. The market has already experienced a meaningful decline, and short positions opened too late can face sudden reversals. My preference is to wait for a recovery toward resistance and let sellers confirm the next move. For now, the moving averages favor sellers, but the $134.71 support remains an important level to monitor. The bigger question is whether SPCX can recover its lost momentum or whether sellers will push price toward the $130 demand region again. $SPCXXUSDT #ByXIMPACT

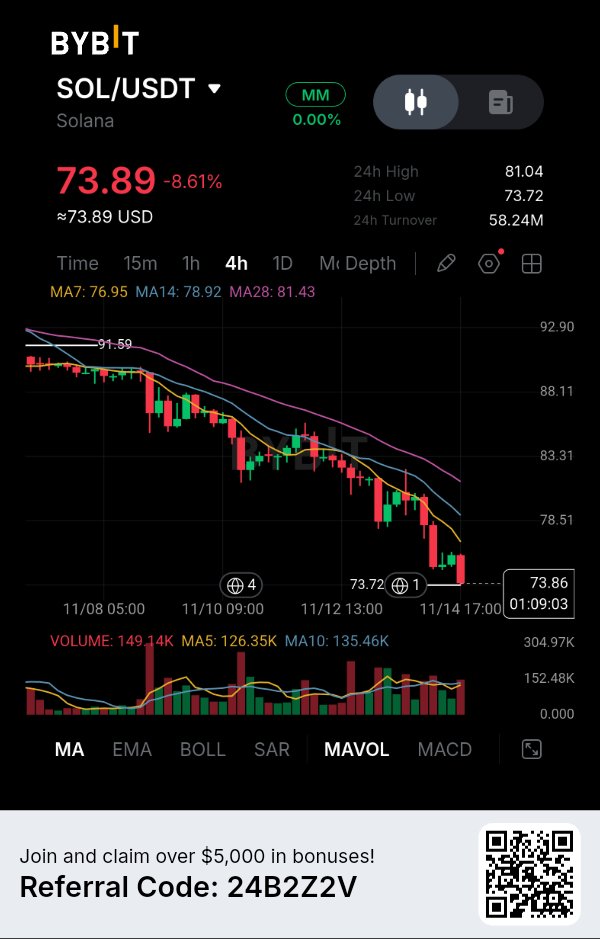
売り手がSolana(SOL)を重要なサポートラインのブレイクダウンへと追い込んでいる。 Solanaは8.61%下落していますが、私が注目しているのは、売り手が4時間足の構造をいかに一貫して支配しているかという点です。あらゆる回復の試みは勢いを得るのに苦戦しており、直近の下落によりSOLは目視可能なサポートラインである73.72ドルに危険なほど接近しています。 興味深いのは、価格が現在3つの主要な移動平均線をすべて下回って推移しており、売り圧力が高止まりしている点です。これは重要な状況を作り出しています。買い手が現在のサポートラインを守らなければ、さらなる下落局面が展開する可能性があります。 市場のストーリー SOLは現在、目視可能な91.59ドルの水準から下落し、73.89ドル付近で取引されています。 このチャートを興味深くしているのは、安値切り下げ(lower-high)の構造が一貫している点です。買い手が有意義なトレンド転換を確立する前に、回復のたびに抵抗に遭っています。 私は特に73.72ドルの水準に注目しています。なぜなら、これが24時間安値であり、最も近い重要なサポートラインだからです。 もし売り手が4時間足の終値でこの水準を明確にブレイクした場合、既存の弱気構造はさらに勢いを増す可能性があります。 しかし、買い手がこのエリアを死守すれば、移動平均線に向かって一時的に回復する可能性は残されています。 データとエビデンス 提供されたBybitのスクリーンショットから、重要な数値を示します: * 現在価格:73.89ドル * 24時間変動:-8.61% * 24時間高値:81.04ドル * 24時間安値:73.72ドル * 24時間売買代金:5,824万ドル * 直近の高値:91.59ドル 移動平均線は明確な弱気の並びを示しています: * MA7:76.95ドル * MA14:78.92ドル * MA28:81.43ドル 3つの移動平均線すべてが現在の価格よりも上にあります。 さらに重要なことに、MA7はMA14の下にあり、MA14はMA28の下にあります。この配置は、短期的な市場構造が依然として売り手に有利であることを示しています。 出来高はもう一つの重要な観測点です: * 現在の出来高:149.14K * 出来高MA5:126.35K * 出来高MA10:135.46K 現在表示されている出来高は、両方の移動平均線を上回っています。これは、下落局面において取引活動が高止まりしていることを示唆しています。 これを自動的に積極的な売りが続いていると解釈するつもりはありませんが、弱気な価格構造と組み合わせると、注意を払うべき点です。 私の見解 SOLは重要なテクニカル上の決断ポイントに近づいていると見ています。 73.72ドルのサポートラインは、私が最も注視している水準です。 もし買い手がこのエリアを死守すれば、SOLは76.95ドル、続いて78.92ドルへの回復を試みる可能性があります。しかし、これらの移動平均線はリバウンド時に抵抗として機能する可能性があります。 一方で、73.72ドルを割り込んで4時間足で確定し、その後の戻り試行に失敗すれば、弱気な継続シナリオが強まります。 私は現在の価格で下落を追いかけるつもりはありません。売り手が既存のサポートラインを実際にレジスタンスへと転換できるかどうかの確認が必要です。 トレード戦略 SOL — ショートシナリオ 弱気のトリガー:73.72ドルを下回って4時間足が確定し、その後のリテストに失敗する。 エントリーゾーン:73.40ドル〜73.70ドル ストップロス:76.20ドル TP1(利益確定1):72.00ドル TP2(利益確定2):70.00ドル TP3(利益確定3):68.00ドル 強気への無効化:SOLが78.92ドルを奪還し、このレジスタンスの上で4時間足の強さを維持する。 下値目標は推定値です。これらの下位サポートレベルは提供されたスクリーンショットでは表示されていないためです。 TP3までの下落ポテンシャル:約7.4%〜7.7%。 許容リスク:約3.4%〜3.8%。 推定リスク・リワード比:約2:1。 このセットアップは条件付きであり、サポートラインのブレイクダウンが確認された後にのみ有効となります。 最終結論:Solanaが現在興味深いのは、持続的な高値切り下げ、弱気な移動平均線の並び、そして下落中の取引活動の増加が組み合わさっているためです。 次に重要な展開は、73.72ドル付近での反応から生まれます。 もし買い手がこの水準を正常に防衛すれば、回復の試みが付近の移動平均線に挑戦するかもしれません。しかし、売り手が明確なブレイクダウンを確立すれば、市場はさらなる下落の道を開く可能性があります。 今のところ、私はSOLがサポートを維持できるか、それとも売り手が新しい下位の取引レンジを確立するかを見守っています。次の4時間足の確定が、どちらの側が主導権を握っているかを示す最も明確な兆候となるでしょう。$SOLUSDT #ByXIMPACT

$BBSOLUSDT — Sellers have pushed price into a critical support area, but I'm more interested in what happens during the next recovery attempt. BybitSOL is trading around $88.42, down 8.60%, after an extended decline from the $107 region. The 4H chart is showing persistent selling pressure, and buyers have struggled to produce a meaningful recovery. What stands out to me is the separation between price and the moving averages. The market is trading significantly below its trend indicators, suggesting that sellers still have control. What the 4H Structure Is Revealing The current moving-average readings are: MA7: $90.79 MA14: $92.94 MA28: $95.75 All three averages are positioned above the current price, with a bearish alignment. Another important observation is the recent selling-volume expansion during the decline. This suggests increased trading activity as BBSOL moved lower. Price is now approaching the $88.14 area, which represents the visible 24-hour low. For me, this is an important decision zone. A temporary bounce is possible, but the broader structure hasn't shown convincing reversal confirmation yet. My Market Outlook I'm favoring bearish continuation, particularly if price recovers toward the moving-average resistance area and sellers defend it again. The $92.94–$95.75 region is particularly important because it contains the MA14 and MA28 resistance levels. My downside roadmap: $88.14 — Immediate support. $86.50 — First projected downside extension. $84.50 — Extended downside objective. The lower targets are estimated projections, not confirmed support levels from the visible chart. My Trading Signal Direction: SHORT (conditional) Entry: $92.80–$94.00 after confirmed bearish rejection. Stop Loss: $96.90 TP1: $88.14 TP2: $86.50 TP3: $84.50 Reference Entry: $93.40 Potential downside to TP3: Approximately 9.53%. Defined risk: Approximately 3.75%. Risk-to-Reward: Approximately 2.54:1. I want to see price recover into the entry zone and demonstrate that sellers are still defending resistance. If price continues falling without a retest, I won't chase the move. What Could Invalidate My View? A sustained recovery above $95.75 would be an important warning against my bearish thesis. If buyers reclaim the MA28 and establish higher highs on the 4H chart, the current downward structure could begin to weaken. On the other hand, a decisive breakdown below $88.14 could strengthen the bearish continuation scenario. Risk Management BBSOL has already experienced a substantial decline, so chasing the current price carries additional risk. I would rather wait for a recovery toward resistance than enter directly above an important support level. My focus is on the $92.80–$94.00 region and how price behaves when it gets there. For now, the moving averages favor sellers, but the next recovery attempt will reveal whether buyers have enough strength to challenge the prevailing trend. The important question is no longer how far BBSOL has fallen. It's whether buyers can finally stop sellers from controlling every recovery attempt. $BBSOLUSDT #ByXIMPACT
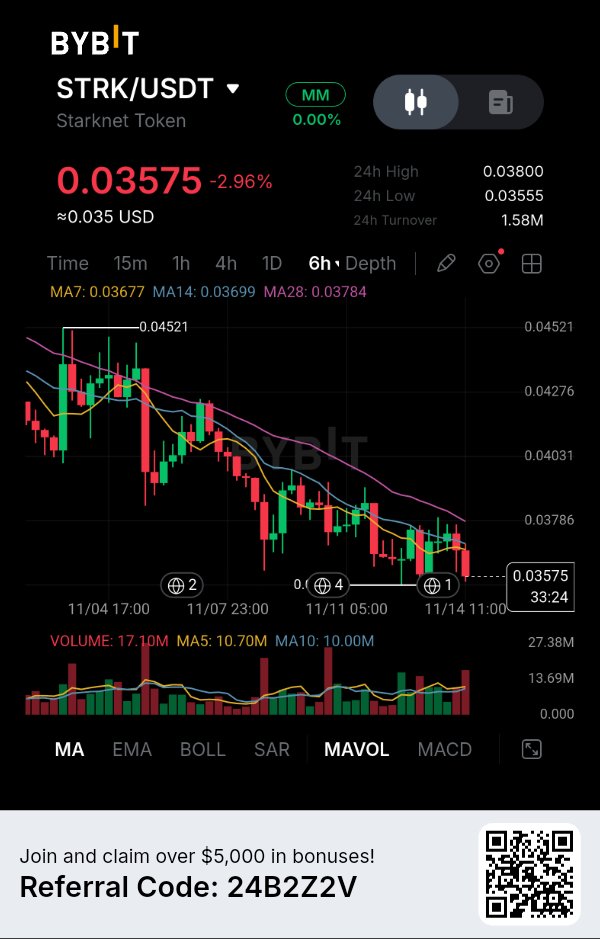
$STRKUSDT — Sellers are maintaining control, and the latest 6H candles suggest the recovery attempts are still struggling to gain traction. Starknet is trading around $0.03575, down 2.96%, and what concerns me most is the consistent sequence of lower highs forming across the chart. This isn't just a single red candle. The broader structure is showing persistent selling pressure. What the Chart Is Revealing Looking at the 6H timeframe, STRK has continued to lose ground after its rejection near the $0.04521 region. The moving averages are providing another important clue: MA7: $0.03677 MA14: $0.03699 MA28: $0.03784 Price is trading below all three averages, with MA7 beneath MA14 and MA28. This alignment suggests that sellers still have control over the current trend. Another detail worth watching is the $0.03555 area, which is close to the current price and represents the visible 24-hour low. If sellers break this support convincingly, another downside expansion could follow. My Market Outlook I'm leaning toward bearish continuation rather than an immediate reversal. However, I don't want to chase STRK at current support. My preferred opportunity would be a recovery into the moving-average resistance zone followed by a clear rejection. My downside roadmap: $0.03555 — First support target. $0.03480 — Next projected downside level. $0.03400 — Extended downside objective. The lower two targets are projections rather than confirmed support levels visible on the screenshot. My Trading Signal Direction: SHORT (conditional) Entry: $0.03690–$0.03740 after bearish rejection. Stop Loss: $0.03820 TP1: $0.03555 TP2: $0.03480 TP3: $0.03400 Reference Entry: $0.03715 Potential downside to TP3: Approximately 8.48%. Defined risk: Approximately 2.83%. Risk-to-Reward: Approximately 3.00:1. I want to see sellers defend the resistance zone before considering an entry. If price continues falling without a retest, I won't chase the move. What Could Invalidate My View? A sustained recovery above $0.03784 would be the first meaningful warning against my bearish thesis. If buyers reclaim the MA28 and establish higher highs, the current downward structure could begin losing strength. On the other hand, a decisive breakdown below $0.03555 would strengthen the continuation scenario. Risk Management STRK is approaching an important support area, so timing matters. Selling directly into support could expose a position to an unexpected rebound. I'd rather wait for a recovery and let the market confirm whether sellers are still defending the trend. For now, the moving averages and lower-high structure favor sellers. The important question is whether buyers can finally reclaim $0.03784 or whether another failed recovery will open the door to lower prices. $STRKUSDT #ByXIMPACT

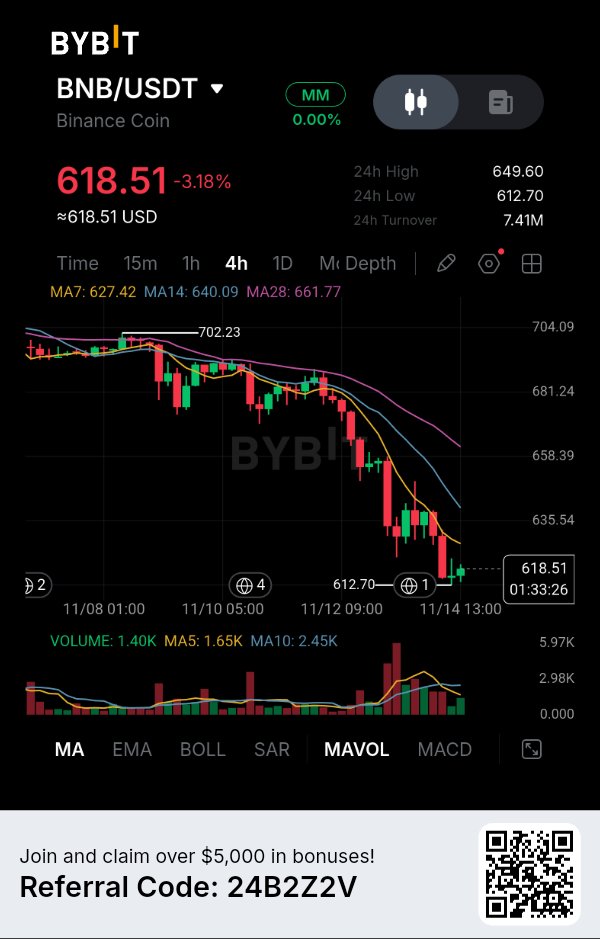
The $612 Support Is Becoming the Most Important Level on the Chart. BNB is down 3.18%, but what catches my attention is how consistently sellers have maintained control throughout the latest 4H decline. Every recovery attempt has struggled to regain momentum, while the moving averages continue pointing toward a weaker market structure. The interesting part is that BNB is now trading close to $612.70, its visible 24H low. This puts the market near an important decision point: either buyers defend this area or sellers gain another opportunity to extend the decline. THE MARKET STORY BNB is currently trading at $618.51, considerably below its three visible moving averages. What makes this situation interesting is the distance between the current price and the MA28 at $661.77. This shows how far price has moved away from its longer-term moving average on the displayed timeframe. I am particularly interested in whether the $612.70 support can survive another selling attempt. If it breaks, the market could enter another downward expansion. If buyers defend it, a temporary recovery toward the moving averages becomes possible. DATA & EVIDENCE Here are the important figures from the supplied Bybit chart: Current price: $618.51 24H change: -3.18% 24H high: $649.60 24H low: $612.70 24H turnover: $7.41M Previous visible high: $702.23 The moving averages reveal the current trend structure: MA7: $627.42 MA14: $640.09 MA28: $661.77 All three averages are positioned above the current price, with MA7 below MA14 and MA14 below MA28. This bearish alignment suggests that buyers have not yet established enough strength to reverse the prevailing 4H structure. Volume adds another detail: Current volume: 1.40K Volume MA5: 1.65K Volume MA10: 2.45K Current volume is below both averages. This means I would like to see stronger participation before treating a potential support breakdown as a convincing continuation signal. MY READ: I believe the most important level to watch is $612.70. BNB has already experienced a substantial decline from the visible $702.23 region, but the current chart does not yet show a convincing reversal structure. My concern for buyers is that price remains below all three moving averages. Even if BNB produces a short-term bounce, the $627–$640 region could become an important resistance area. I would not enter a SHORT position simply because the market is falling. I want to see a confirmed 4H breakdown below $612.70, followed by a failed attempt to reclaim that level. That would provide a more structured opportunity. TRADING SETUP BNB — SHORT Scenario: Bearish trigger: Confirmed 4H candle close below $612.70, followed by a failed retest. Entry Zone: $610–$613 Stop Loss: $628 TP1: $600 TP2: $588 TP3: $575 Bullish invalidation: BNB reclaims $640.09 and establishes sustained strength above this resistance. The downside targets are estimated projections because these support levels are not established on the visible portion of the chart. Potential downside to TP3: Approximately 5.7%–6.2%. Defined risk: Approximately 2.5%–2.9%. Estimated risk-to-reward: Around 2:1, depending on entry and execution. This setup remains conditional. If BNB holds $612.70, I would avoid chasing the downside. FINAL THESIS: What makes BNB interesting right now is the combination of bearish moving-average alignment and an approaching support test. The next meaningful signal will come from the reaction around $612.70. A confirmed breakdown could expose lower price levels, while a successful defense could force sellers to reconsider their positions. For now, I am more interested in whether sellers can convert this support into resistance than in predicting how low BNB might eventually go. $BNBUSDT #ByXIMPACT

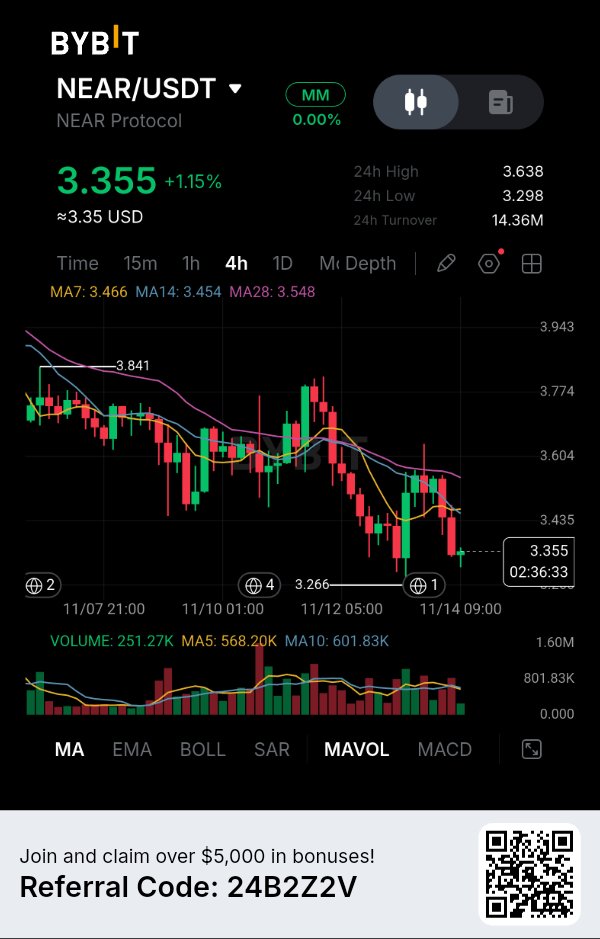
$NEARUSDT — Buyers are attempting to stabilize the price, but the 4H structure still shows sellers controlling the bigger picture. NEAR Protocol is trading around $3.355, up 1.15%, yet this small recovery hasn't changed the underlying technical structure. What interests me is the repeated failure to sustain moves above the moving-average cluster. The Market Structure I'm Watching NEAR has been forming lower highs after reaching the $3.84 region. Each recovery attempt has struggled to establish a stronger upward structure. The latest rejection near $3.60 has pushed price back toward the $3.35 area. Current moving-average readings: MA7: $3.466 MA14: $3.454 MA28: $3.548 Price is trading below all three averages. More importantly, the MA28 remains above the shorter averages, suggesting that the broader 4H momentum is still under pressure. There are two nearby support levels worth watching: $3.298 — Immediate support. $3.266 — Recent structural low. For me, the important detail is that buyers haven't yet demonstrated enough strength to reclaim the $3.45–$3.55 resistance region. My Market Outlook I'm leaning toward another downside test, provided sellers defend the moving-average resistance zone. A recovery into $3.45–$3.55 followed by a clear rejection could create an opportunity for bearish continuation. My downside roadmap: $3.298 — First support target. $3.266 — Previous structural low. $3.180 — Extended projected downside target. The $3.266 level is particularly important. If sellers break it convincingly, the market could start exploring lower prices. My Trading Signal Direction: SHORT (conditional) Entry: $3.46–$3.54 after bearish rejection. Stop Loss: $3.65 TP1: $3.298 TP2: $3.266 TP3: $3.180 Reference Entry: $3.50 Potential downside to TP3: Approximately 9.14%. Defined risk: Approximately 4.29%. Risk-to-Reward: Approximately 2.13:1. The entry requires a confirmed rejection from resistance. I don't want to chase the current price while it is already approaching support. What Could Invalidate My View? A strong 4H recovery above $3.548 would be the first warning against my bearish outlook. If buyers reclaim $3.60 and establish higher highs, the current selling structure could begin to weaken. On the other hand, a decisive breakdown below $3.266 would strengthen the bearish continuation scenario. Risk Management I'm watching NEAR carefully because the distance between current price and nearby support is relatively small. Selling directly into support would not offer the same opportunity as waiting for a resistance retest. My preference is to let price recover, watch how sellers respond, and execute only if the rejection is confirmed. For now, NEAR needs to prove that buyers can reclaim the moving-average cluster before I reconsider the broader bearish structure. The next important battle is around $3.45–$3.55. Will buyers finally reclaim control, or will another recovery attempt become an opportunity for sellers? $NEARUSDT #ByXIMPACT

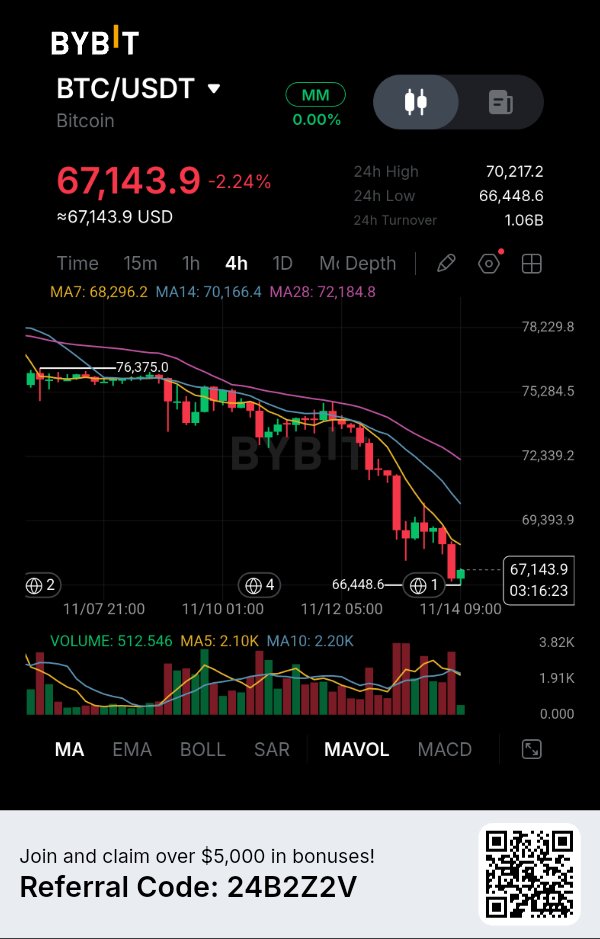
Bitcoin Is Approaching a Critical Support Zone, But Buyers Have Yet to Prove Their Strength. Bitcoin's latest 4H movement is showing something I don't want to overlook: price has continued making lower highs and lower lows, while every recovery attempt has struggled to regain meaningful resistance. What makes this situation interesting is that BTC is now trading close to $66,448, its visible 24H low. Buyers have attempted a small recovery, but the larger technical structure remains firmly under pressure. For me, this is not yet a convincing bottom formation. It is a market approaching an important decision point.# WHY IT MATTERS BTC is currently trading at $67,143.9, down 2.24%. The interesting part is the distance between the current price and its moving averages. Bitcoin is trading below all three displayed averages, suggesting that sellers continue to control the 4H structure. When price remains below multiple moving averages during a sequence of lower highs, I become cautious about treating small green candles as genuine reversals. The $66,448.6 area is therefore particularly important. If sellers break this support and successfully turn it into resistance, another downward expansion could develop. DATA & EVIDENCE Here are the important figures visible in the Bybit screenshot: Current price: $67,143.9 24H change: -2.24% 24H high: $70,217.2 24H low: $66,448.6 24H turnover: $1.06B Moving average structure: MA7: $68,296.2 MA14: $70,166.4 MA28: $72,184.8 All three moving averages are positioned above the current price. There is also a clear bearish alignment: MA7 is below MA14, while MA14 is below MA28. This arrangement reflects persistent downward momentum rather than an established recovery. The volume panel provides another detail: Displayed volume: 512.546 Volume MA5: 2.10K Volume MA10: 2.20K The latest displayed volume is below both averages. This means the small recovery visible in the latest candles has not yet demonstrated strong participation relative to recent volume averages.# MY READ I am focusing on $66,448.6 because this is the nearest important support visible in the screenshot. A clean 4H breakdown below this level, followed by a failed retest, would provide stronger evidence that sellers are preparing another downward move. However, I would not blindly SHORT directly into support. If buyers successfully defend $66,448 and reclaim $68,296, the bearish setup would become less attractive. My preference is to wait for confirmation rather than anticipate a breakdown that has not happened yet. TRADING SETUP BTC — Conditional SHORT: Bearish trigger: Confirmed 4H candle close below $66,448.6, followed by a failed retest. Entry zone: $66,300–$66,400 Stop Loss: $67,250 TP1: $65,500 TP2: $64,500 TP3: $63,500 Invalidation: BTC reclaims $67,250 and establishes sustained 4H strength above that level. TP2 and TP3 are estimated downside extension targets, not confirmed chart support levels. Approximate risk-to-reward to TP3 is around 2.9:1, depending on execution. The SHORT setup is conditional and is not active at the current price. FINAL THESIS: Bitcoin's current structure is telling me that the market has not yet finished dealing with selling pressure. The moving averages remain bearish, recovery attempts have been relatively weak, and $66,448.6 is now an important level to monitor. I am not interested in chasing every red candle. I want to see whether sellers can convert this support into resistance. If that happens, BTC could open the door toward lower price levels. If buyers defend the region and reclaim the short-term moving averages, the downside thesis will need reassessment. For now, the most important development is whether Bitcoin can hold its latest visible support or whether sellers force another breakdown. $BTCUSDT #ByXIMPACT

$LITUSDT — 回復の勢いは重要な移動平均線のクラスター付近で失速しており、売り手がこのエリアを新たな反落ポイントに変えられるかどうか注視しています。 Lighterは$3.2271前後で取引されており、1.56%上昇していますが、直近の4時間足の構造を見ると、日次の上昇率以上に興味深い状況が示唆されています。 価格は以前$3.0031の安値から回復し、$3.40付近まで反発しました。しかし、買い手はその勢いを維持するのに苦戦しており、最新のローソク足は回復が抵抗に直面していることを示唆しています。 4時間足チャートが示すもの 現在の移動平均線の数値は以下の通りです: MA7: $3.2305 MA14: $3.2429 MA28: $3.2614 価格は現在これら3つの移動平均線すべてを下回って推移しており、短期平均線も長期平均線の下に位置しています。 この配置は、短期的なモメンタムが依然として圧力を受けていることを示唆しています。 もう一つの重要な詳細は、$3.40付近での最近の反落です。買い手は上昇を試みましたが、市場はその動きを維持できませんでした。 特に注目しているのは$3.24〜$3.27の領域です。もし価格がこのエリアを再試行し、売り手が防衛すれば、さらなる下落の動きが可能になります。 市場見通し 直近のサポートは$3.1440付近です。 この水準を割り込めば、$3.0800のエリア、そして前回の構造的な安値である$3.0031付近が意識される可能性があります。 下落のロードマップ: $3.1440 — 第1サポートターゲット $3.0800 — 第2下落ターゲット $3.0031 — 主要な構造的安値 私にとっての重要な問いは、買い手が移動平均線のクラスターを奪還できるか、それとも売り手が次の回復の試みを支配権を取り戻すために利用するかということです。 トレードシグナル 方向:ショート(条件付き) エントリー:$3.2400〜$3.2600(弱気の反落が確認された後) ストップロス:$3.4100 TP1: $3.1440 TP2: $3.0800 TP3: $3.0031 参考エントリー:$3.2500 TP3までの潜在的な下落幅:約7.60% 定義されたリスク:約4.92% リスクリワード比:約1.55:1 この設定を検討する前に、エントリーゾーン付近で売り手の存在を確認したいと思います。価格が直接サポートに落ちた場合、追随はしません。 見通しが無効になるケース $3.2614を超える力強い4時間足での回復は、私の弱気な見通しに対する最初の警告となります。 もし買い手が$3.28〜$3.40の領域を奪還し、高値を切り上げれば、現在の短期的な弱さは再び回復の試みに転じる可能性があります。 下値については、$3.1440を決定的に割り込むことが、弱気継続のシナリオを強固にします。 リスク管理 LITは重要な決断エリア付近で取引されているため、一時的な反発をトレンドの反転と混同しないようにしています。 今のところ、レジスタンスの再試行と明確な反落を待ってからエントリーするのが私の好みです。 現時点では、移動平均線は売り手に有利ですが、現在の価格変動よりも次の反応が重要になります。 真の攻防は$3.25付近で繰り広げられています。買い手はこのゾーンを奪還できるのか、それとも売り手が回復の試みを下落トレンドに変えるのか? $LITUSDT #ByXIMPACT
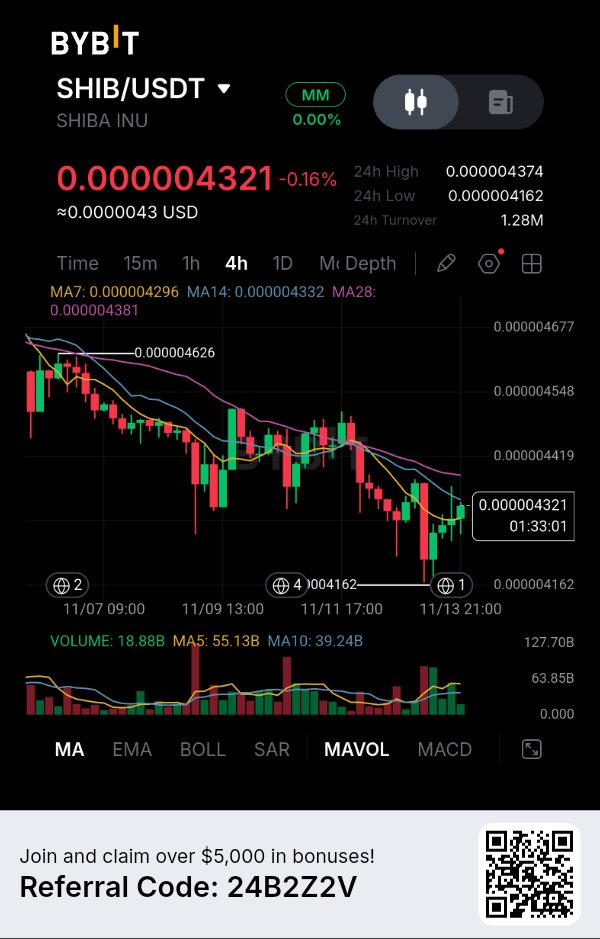
$SHIBUSDT: Is This Recovery the Beginning of a Reversal or Just Another Temporary Bounce? SHIB has managed to recover from its recent low, but the bigger picture is still presenting a challenge for buyers. What makes this setup interesting is that price has climbed back above the 7-period moving average while remaining below the 14-period and 28-period averages. I see an early attempt at stabilization, but not yet a confirmed change in trend. WHY THIS MOVE MATTERS The 4H chart shows that SHIB has been struggling with persistent selling pressure. Several recovery attempts have failed to establish a sustained upward structure. Now buyers are defending the $0.000004162 area and pushing price toward $0.000004374. The important question is whether this recovery can attract enough buying pressure to overcome the moving-average resistance above the current price. If it does, the market could begin developing a stronger recovery structure. If it fails, the recent bounce could become another lower high. MARKET DATA & EVIDENCE Here is what I can confirm from the supplied chart: * Current price: $0.000004321 * 24H change: -0.16% * 24H high: $0.000004374 * 24H low: $0.000004162 * 24H turnover: $1.28M * Volume: 18.88B Moving average structure: * MA7: $0.000004296 * MA14: $0.000004332 * MA28: $0.000004381 There are two details I find particularly important. First, SHIB has recovered above MA7, indicating some improvement in short-term price positioning. Second, MA14 and MA28 are still overhead. This means buyers have not yet reclaimed the resistance structure needed to establish a convincing reversal. Volume also requires attention. The displayed volume of 18.88B is below MA5 at 55.13B and MA10 at 39.24B. Therefore, the recovery has not yet demonstrated strong participation relative to those averages. MY READ I am focusing on the $0.000004381 resistance area. A successful 4H breakout above this region, followed by a defended retest, would give buyers a better opportunity to challenge the next visible resistance levels. However, I would not consider the current price sufficient confirmation for a LONG position. On the downside, $0.000004162 remains the critical support reference. Losing that level could expose SHIB to another downward expansion. My approach is to let the market confirm its direction before committing to a trade. TRADING SETUP SHIB — Conditional LONG Bullish trigger: A confirmed 4H close above $0.000004381, followed by a successful retest. Entry: $0.000004385–$0.000004405 Stop Loss: $0.000004330 TP1: $0.000004548 TP2: $0.000004626 TP3: $0.000004677 Bearish trigger: A confirmed 4H breakdown below $0.000004162. Bullish invalidation: Failure to hold the reclaimed $0.000004381 region. Targets are based on visible chart resistance levels. Approximate risk-to-reward to TP3 is around 2.7:1, depending on entry and execution. The setup is conditional and is not active at the current price. FINAL THESIS: I believe SHIB is approaching an important decision point. The recovery above MA7 shows that buyers are attempting to regain short-term control, but the remaining moving-average resistance makes this an incomplete recovery. For me, the real signal will come when SHIB can reclaim $0.000004381 with convincing buying participation. Until then, I would treat this movement as an early recovery attempt rather than a confirmed bullish reversal. The next 4H reaction around resistance could determine whether SHIB has enough strength to change its current market structure. $SHIBUSDT #ByXIMPACT