
KAZ_0
4046いいね0シェア65ファン31フォロー
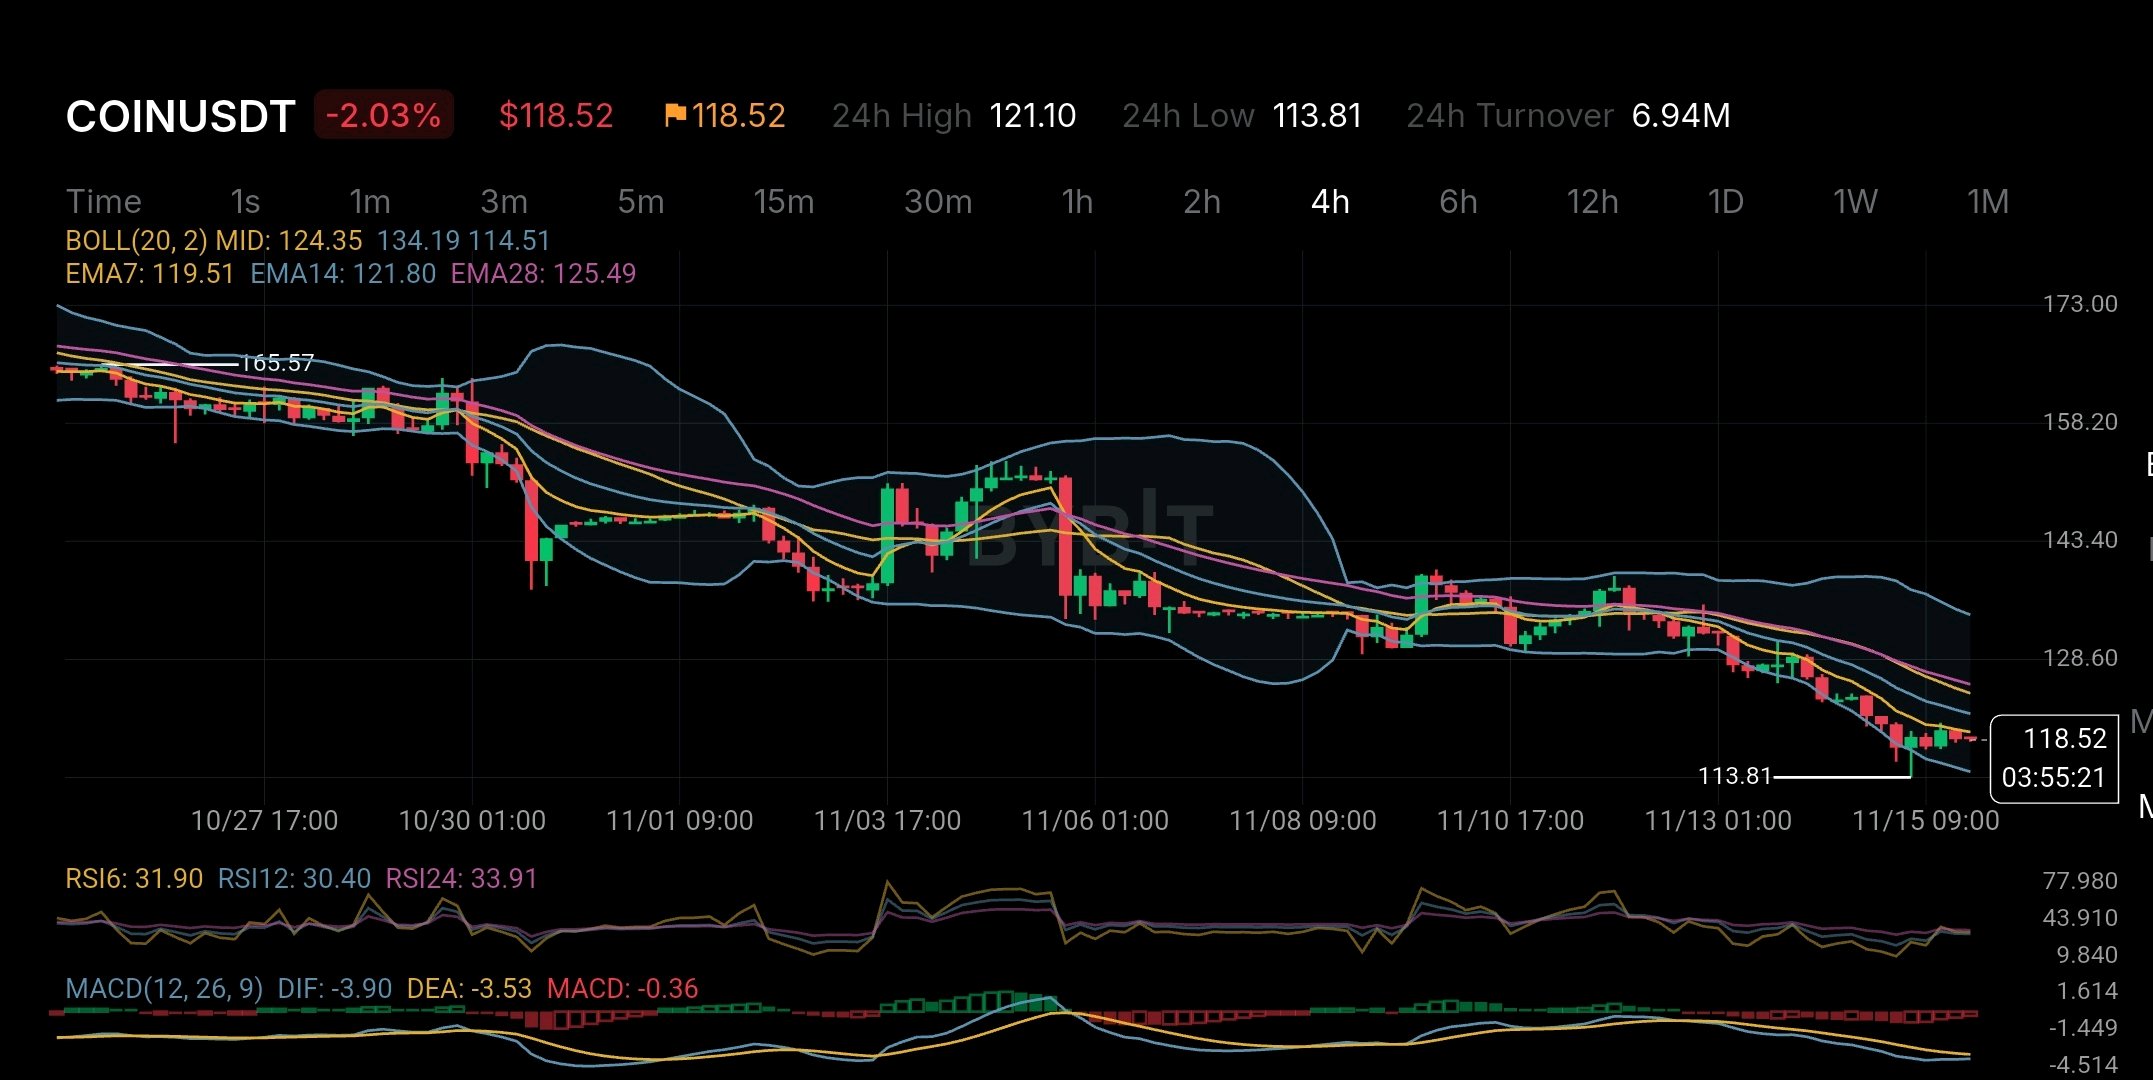
Coinbase reported $718.7 million in net income for Q3 2026. But there is one detail behind that profit that investors should not ignore. Its adjusted net income was only $77.7 million. The difference came mainly from a $715 million gain on crypto assets held for investment. This means the headline profit looks much stronger than the company's adjusted operating performance. There is another important detail. Coinbase generated $1.22 billion in Q3 revenue which was down 35% compared with the same period last year. Transaction revenue fell 44% to $590.2 million. This shows how much Coinbase still depends on activity in the crypto market even as it expands into other businesses. There is a positive side too. Subscription and services revenue reached $570.2 million and represented around 49% of total net revenue. Prediction markets also crossed $200 million in annualized revenue. This diversification could make Coinbase more resilient when crypto trading activity slows down. But the stock market is not ignoring the risks. Looking at the 4-hour COINUSDT chart price is around $118.52 after a steady decline from the $165 area. The price is trading below EMA7 at $119.51 EMA14 at $121.80 and EMA28 at $125.49. All three moving averages are pointing to selling pressure. RSI readings are close to 30 which suggests that sellers have pushed the market into an oversold area. However oversold does not automatically mean a reversal is coming. The MACD is also still negative which means bearish momentum has not clearly disappeared. The $113.81 area is an important nearby support to watch. If buyers defend this zone and price moves back above $121.80 the market could start showing signs of recovery. On the other hand a clean break below $113.81 could open the door to another leg down. One more thing traders should understand: COINUSDT on Bybit is a perpetual contract tracking Coinbase stock. It does not provide actual shares ownership voting rights or dividends. For me the biggest takeaway is this. Coinbase is building new revenue streams beyond crypto trading but its latest earnings show that headline profits can still be heavily influenced by crypto market gains. The real question is whether its growing recurring businesses can become strong enough to support the company even when the crypto market stops helping. #WSOTShowYourAITradeToEarn10USDT #ByXIMPACT
One thing about SUI that many investors may be missing is that more network activity doesn't always mean more value for the token. And this is something worth looking at. According to the latest available data Sui handled around 73.39 million transactions in 24 hours with nearly 70,268 active addresses. Its DeFi ecosystem also had around $363–375 million in TVL. These numbers look good but there is another side to the story. Daily network fees were reported at around $4,511 while applications on Sui generated about $55,000 in revenue. These are two different things but they raise an important question: If people are using the Sui network so much how much of that activity actually creates value for SUI holders? Sui has some strong technology behind it. It uses the Move programming language a unique object-based system and the Mysticeti consensus protocol to make transactions faster and more efficient. That's a clear advantage. But good technology alone doesn't guarantee a higher token value. For SUI holders the important thing is whether more network users will create more demand for the token through transaction fees staking and ecosystem growth. There is also the supply issue. SUI has a maximum supply of 10 billion tokens but not all of them are currently in circulation. More tokens will enter the market over time which could create selling pressure if demand doesn't grow enough. Looking at the 4-hour chart the situation is still weak. SUI is trading below EMA7 EMA14 and EMA28. MACD is also negative while RSI is around 35. This shows that sellers still have control. A recovery is possible but the chart has not confirmed a trend reversal yet. For me the biggest question about SUI is not how fast its network can process transactions. It's whether that growing activity can create real and lasting demand for the SUI token. A network can become popular but the real test is whether its token benefits from that popularity. $SUIUSDT #IMPACTbyTrade

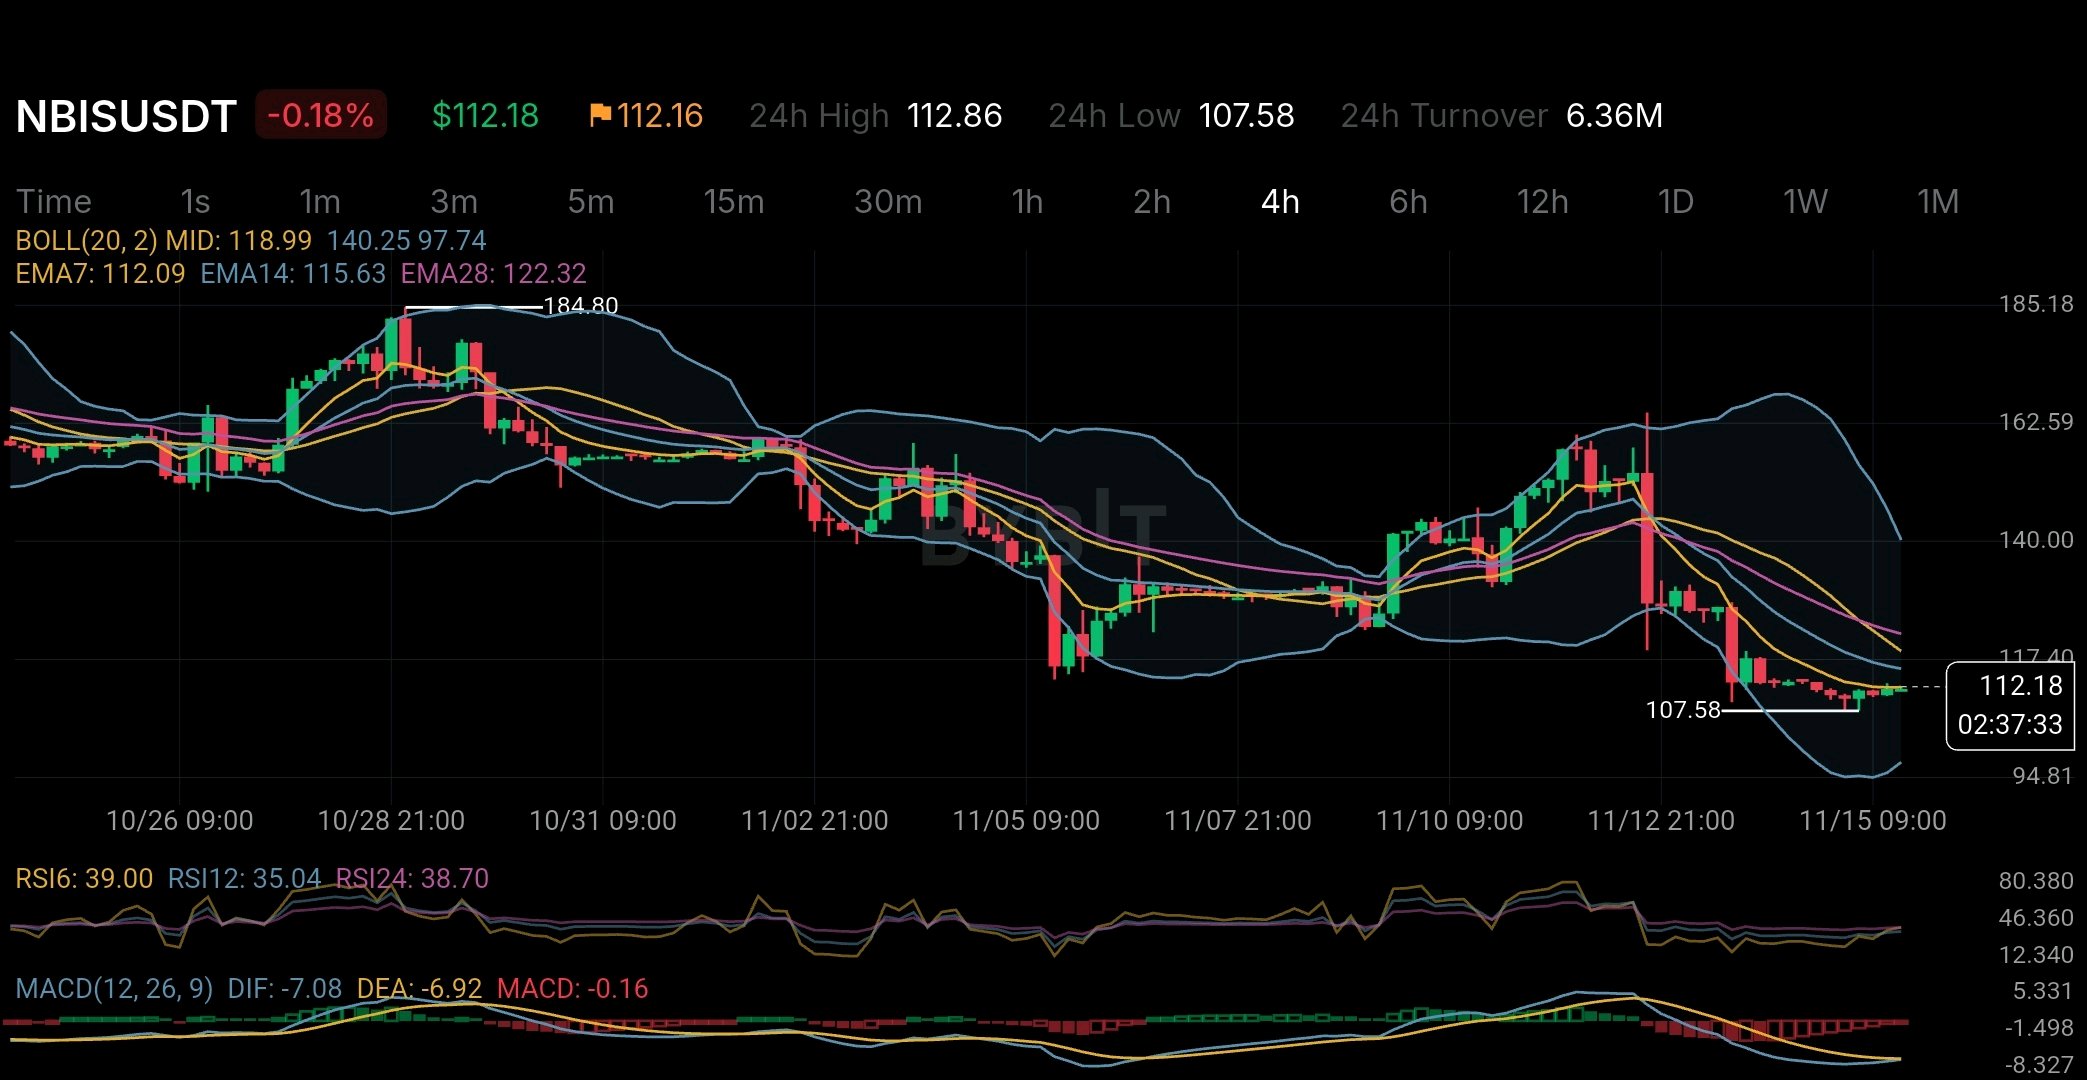
Nebiusは前年比571%という驚異的な収益成長を報告しました。しかし、その最新の決算発表には、ヘッドライン以上に注目すべき詳細が一つあります。 その成長のすべてが、従来のAIクラウド事業から生まれたわけではないということです。 Nebiusが発表した2026年第3四半期の収益は9億8,080万ドルでしたが、そのうち約3億2,500万ドルは、アセットライト(資産を抱えない)なインフラパートナーシップモデルの初期展開による非経常的収益でした。 これがなぜ重要なのか、その理由は以下の通りです。 このモデルの下では、パートナー企業がデータセンターの資金調達、所有、運営を行います。Nebiusは、インフラのアーキテクチャ、ソフトウェアスタック、ハードウェアの専門知識、そして顧客関係を提供します。 これは非常に興味深い戦略的転換です。 すべてのGPUやデータセンターを自社でファイナンスするのではなく、外部パートナーが資金を提供するインフラを活用することで、NebiusはグローバルなAIクラウドの拠点を拡大できるのです。 この潜在的なメリットは甚大です。自社ですべての資本負担を負うことなく、より多くのコンピューティング能力を確保できるからです。 しかし、方程式には別の側面もあります。 Nebiusは第3四半期だけで、有形固定資産および無形資産に約73億ドルを費やしました。これら資産への9ヶ月間の投資額は、約154億ドルに達しています。 その一方で、継続事業からの営業キャッシュフローは、第3四半期中にマイナス2億7,300万ドルとなりました。 ここに、収益成長と財務的に持続可能な成長との間に重要な区別が生じます。 アセットライトモデルは時間をかけて資本効率を改善する可能性がありますが、投資家は今後、このモデルがどれだけの経常収益を生み出し、パートナーシップがいかに収益化され、顧客需要が展開されるインフラを正当化できるかを見極める必要があります。 また、競争上の課題もあります。Nebiusは、確立されたクラウド大手や、CoreWeaveのような専門的なAIインフラプロバイダーと競合しています。GPU、電力、データセンターの容量、そして資金調達へのアクセスが、誰がAI需要の次のフェーズを勝ち取るかを左右するでしょう。 市場チャートは、さらなる視点を提供します。 11月15日のスナップショットでは、NBISUSDTは4時間足チャートで約112.18ドルで取引されています。価格は依然として14および28 EMAを下回っており、RSIは約35と弱いモメンタムを示しています。MACDもわずかにマイナスです。 これはトレンドの転換を示すものではありません。市場センチメントが、同社が報告した成長にまだ追いついていないことを示しています。 一つ重要な補足として、Bybit上のNBISUSDTは、Nebius Groupの株式に連動するUSDT証拠金の無期限契約であり、独立したブロックチェーン・トークノミクスを持つ従来の暗号資産トークンではありません。 Nebiusを取り巻く真の問いは、AIインフラの需要が存在するかどうかではありません。 拡大コストが成長そのものよりも大きな問題となる前に、同社が莫大な需要と投資を、持続可能で収益性の高いキャッシュフローに転換できるかどうかです。 ByXIMPACT
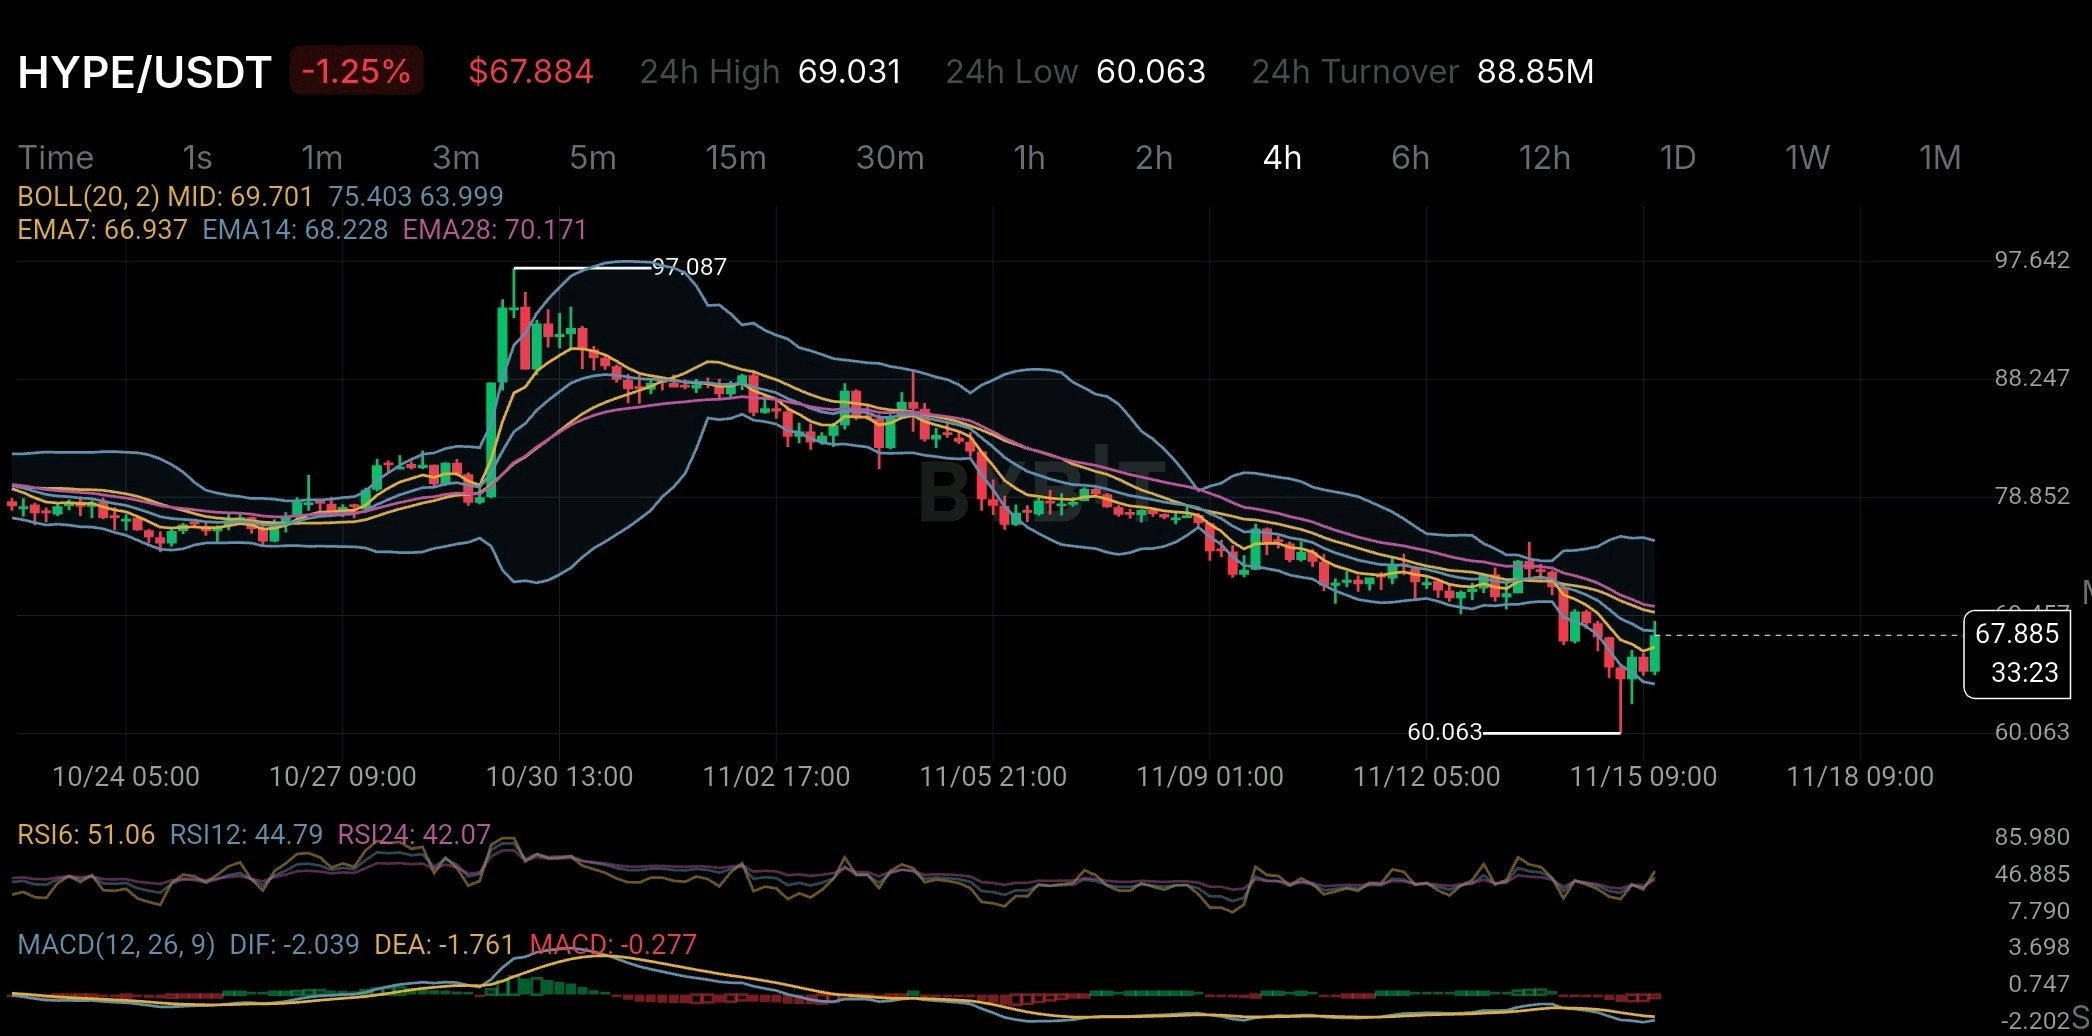
HYPE has something that many crypto tokens don't: a system that uses trading fees to buy HYPE tokens and burn them permanently. But despite this system the price has still dropped from around $97 to $60 on the 4-hour chart. This is something worth looking at more closely. One of the most interesting parts of Hyperliquid is its Assistance Fund. According to its official documents trading fees are used to buy HYPE tokens through this fund. The tokens collected are then permanently burned. The numbers are important. A September 2026 SEC filing reported that 99% of protocol fees went to the Assistance Fund. By September 8 around 47.1 million HYPE tokens had been bought and permanently removed from circulation. That's equal to 4.7% of the original supply. This connects the platform's trading activity directly to HYPE demand. More trading can generate more fees. More fees can mean more HYPE purchases and fewer tokens in circulation. But there is one important thing to understand: Token burns do not guarantee a higher price. They create buying demand but they cannot stop the price from falling. If investors sell more HYPE than the fund buys the price can still go down. Market conditions liquidity and investor sentiment also play a major role. The chart shows this clearly. HYPE recently dropped to $60.063 before recovering to around $67.884. However the price is still below EMA14 at $68.228 and EMA28 at $70.171 on the 4-hour chart. MACD is also still negative which means the overall downward trend has not clearly ended. The recent recovery is a positive sign but it is too early to call it a trend reversal. For investors the most important thing is not just how many HYPE tokens are burned. What matters is whether the demand created by real platform activity can become stronger than the selling pressure. HYPE has an interesting advantage because its token demand is connected to actual platform activity rather than depending only on hype. But even a strong token-burning system cannot guarantee a higher market price. The real challenge for HYPE is simple: Can actual platform demand become stronger than the pressure from people selling their tokens? $HYPEUSDT #ByXIMPACT

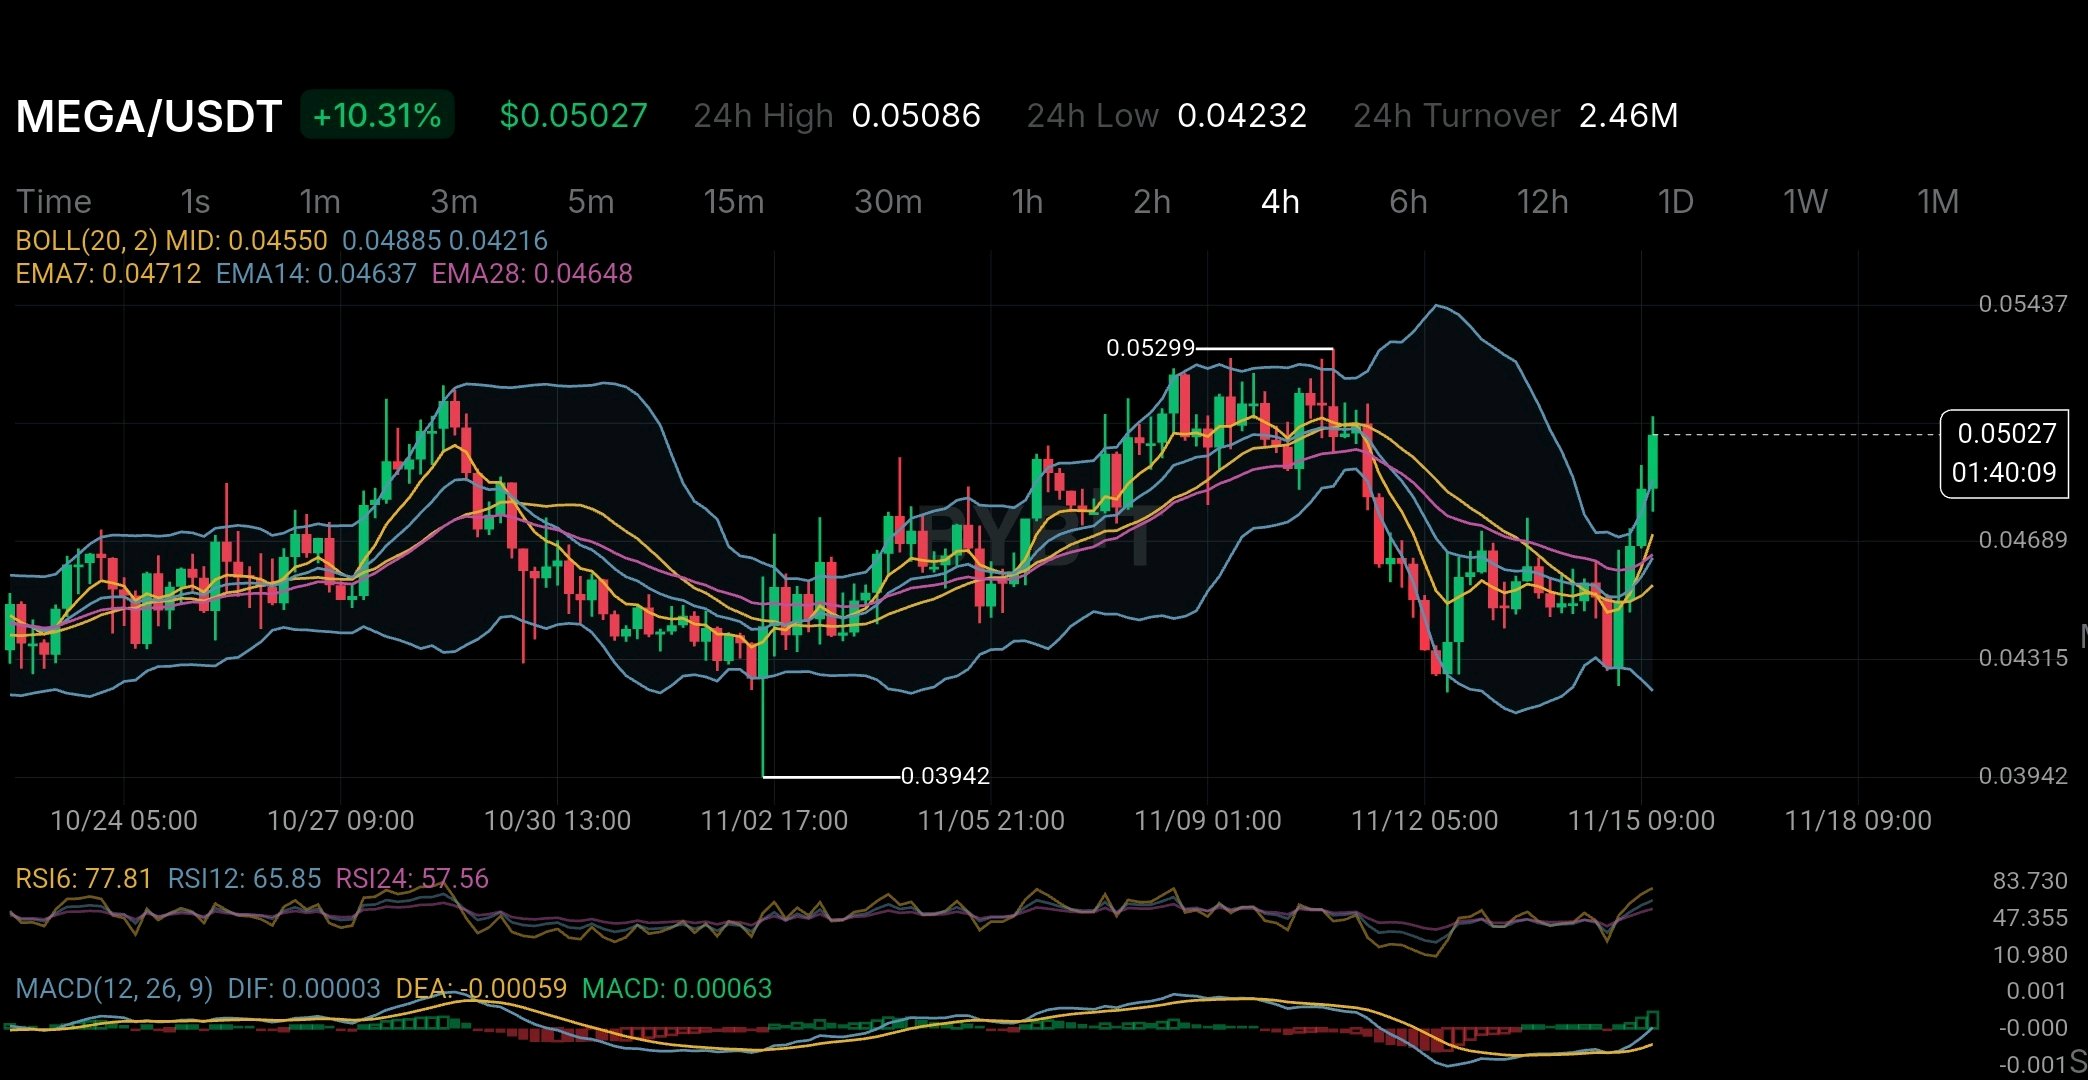
MEGAは10.31%上昇していますが、舞台裏で起きていることには、この価格上昇よりも注目すべき点があります。 MegaETHは計画を変更しつつあるようです。 11月10日、チームは新製品開発のために3,000万ドルの資金を投入すると発表しました。最初の大きなプロジェクトは、12月にローンチ予定の分散型AIマーケットプレイスです。 そのアイデアはシンプルです。開発者は単一のAIプロバイダーを使うのではなく、複数のプロバイダーから選択し、価格、速度、パフォーマンスを比較できるようになります。 しかし、ここに興味深い点があります。 MegaETHは当初、高速なイーサリアムレイヤー2ネットワークを構築するという一つの主要な目標を掲げていました。現在、チームはブロックチェーン技術の構築以上のことを目指しており、そのネットワーク上で有用な製品を創出することも視野に入れています。 では、なぜこのような動きになっているのでしょうか? 注目すべき数値がいくつかあります。 CoinDeskの11月14日のレポートによると、MegaETHのDeFi TVL(預かり資産)は、かつての2億4,500万ドルを超える高値から、約880万ドルまで減少しました。 これは大きな減少です。プロジェクトがエコシステムにさらなるユーザーと資金を呼び込む必要があることを示しています。 もう一つの重要な動きとして、11月13日にMEGAは人員を20%削減すると発表しました。この変更は、ブロックチェーン開発、ウォレット、エコシステムサポートを担当するチームに影響を与えています。 これはプロジェクトが失敗していることを意味するわけではありません。しかし、チームが優先順位を変更していることは確かです。 MEGAのトークン供給量も注視すべき点です。 公式のトークン配布情報によると、総供給量の約53%がKPIベースの報酬用に確保されています。 簡単に言えば、トークンは固定のリリーススケジュールに従うのではなく、ネットワークが特定の目標をどれだけ達成したかに基づいて配布されます。 このアプローチは、トークン報酬とエコシステムの成長を直接結びつけるものです。 しかし、投資家が理解しておくべきことがあります。 プロジェクトの成長が、必ずしもトークン価値の上昇を意味するわけではありません。 MEGAを保有していても、投資家に会社への直接的な所有権が与えられるわけではなく、収益の分配が保証されるわけでもありません。 チームがAI分野に進出している今、この点はより一層重要になっています。 さて、4時間足チャートを見てみましょう。 MEGAは現在0.05027ドル近辺で推移しており、10.31%の上昇を見せています。価格は0.04885ドルのボリンジャーバンド上限を上抜けており、RSI6は77.81となっています。 MACDもプラス圏に転じており、買いの勢いが強まっていることを示しています。 ただし、注意すべき点があります。RSIがすでに高水準にあるため、この急騰の後に調整が入る可能性があります。 私にとっての真の物語は、単なるAIのアイデアや今日の一時的な価格上昇ではありません。 MegaETHが新たな計画を実際のユーザーやアクティビティへと変えられるかどうか、それが鍵となります。 AIマーケットプレイスは、プロジェクトにとって新たな成長の機会を切り開く可能性があります。しかし、真の試練は、その成長がMEGA保有者にとって実際に価値を生み出すものになるかどうかです。 強力なプロジェクトには、優れたアイデア以上のものが必要です。人々が実際に目にすることができる結果が必要なのです。 $MEGAUSDT #IMPACTbyTrade
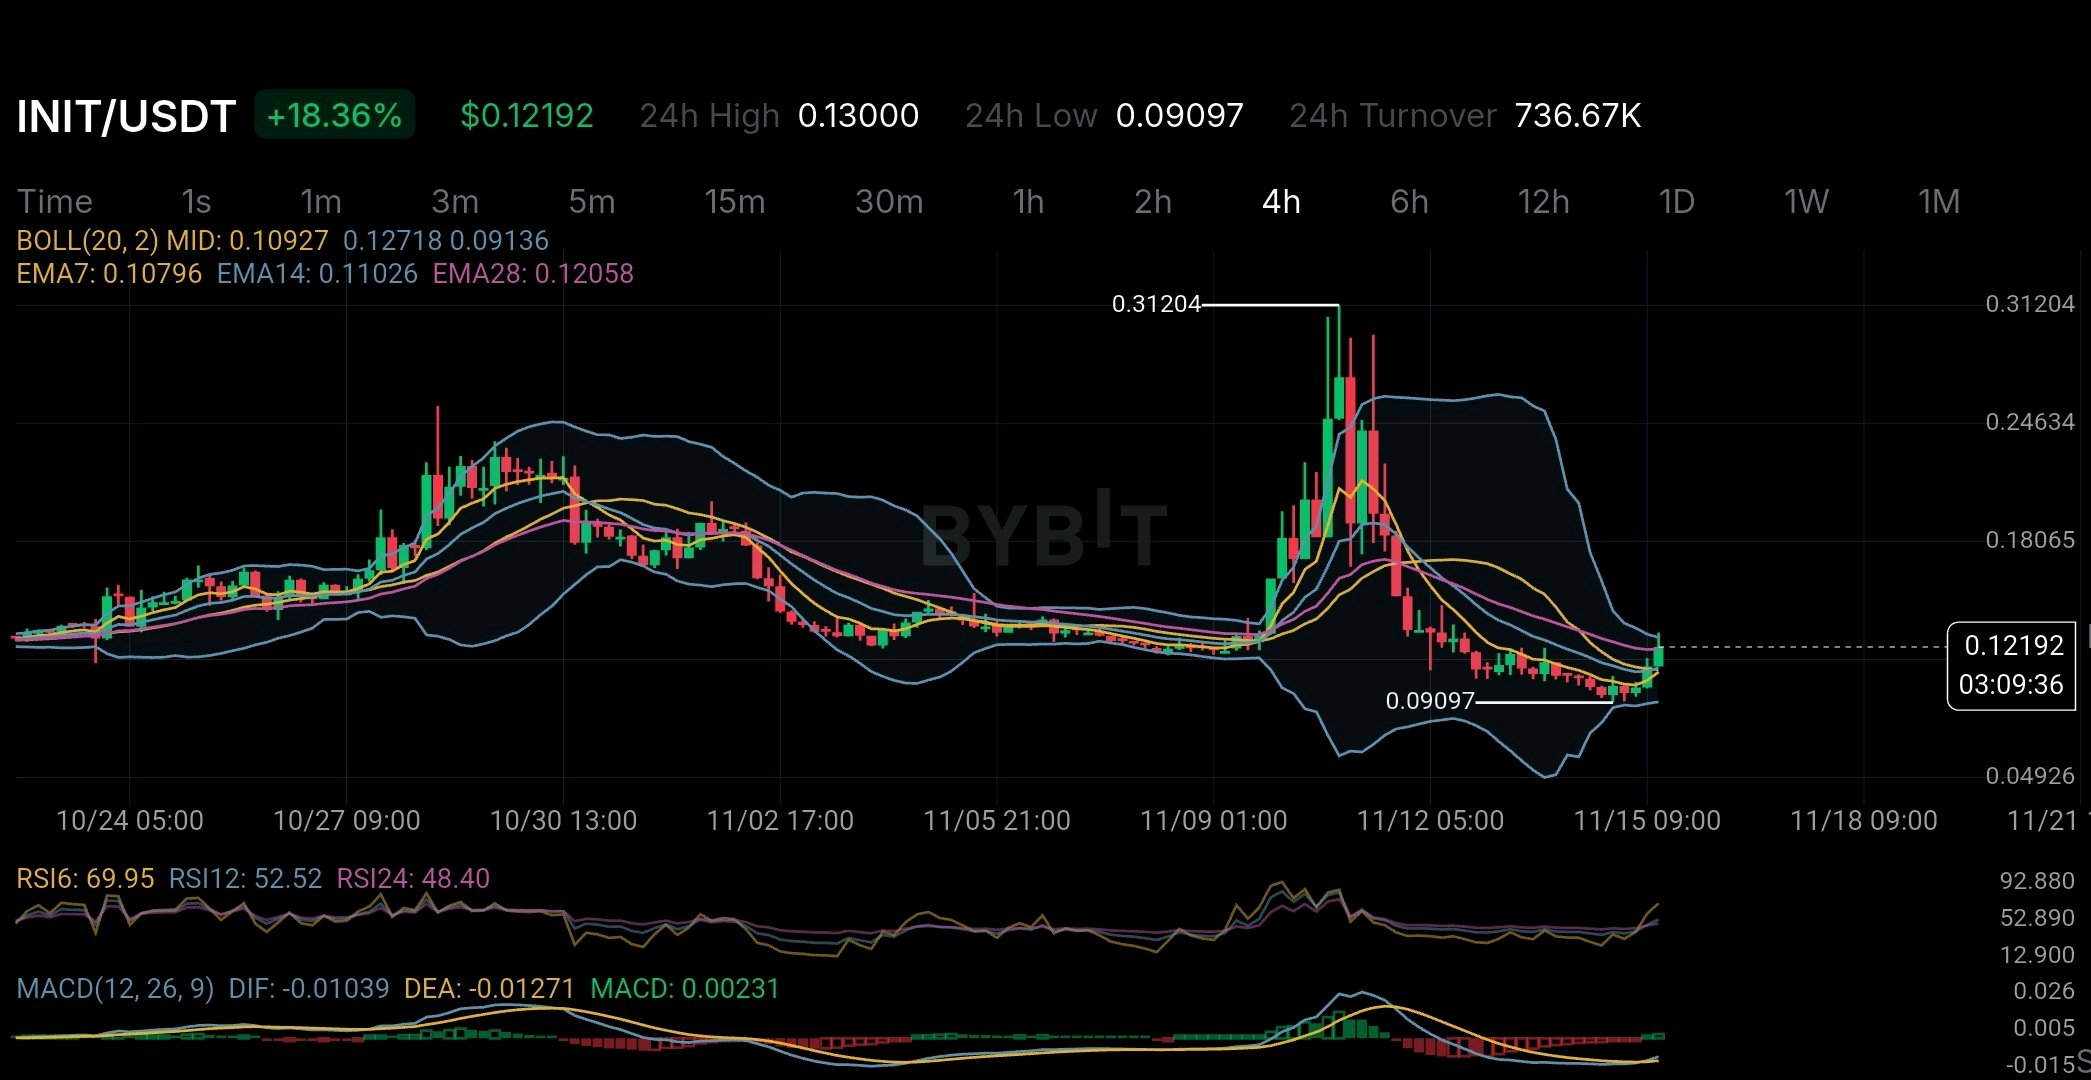
INIT is up 18.36% on the 4H chart but there is something important happening with its token supply. The main thing to understand is that unlocked tokens and tokens actually available in the market are not always the same. Here is the bigger concern. According to DefiLlama's November 10 analysis around 96 million INIT tokens were already vested but were not included in the circulating supply. It also reported an annual inflation rate of 57.28%. There is another thing worth watching. DefiLlama's market data showed average futures trading volume of around $90.5M compared to only $19.9M in spot volume. Open interest was also close to 77% of market cap. Funding was negative which means short traders were paying long traders. This makes the current rally interesting. The price could be rising partly because short traders are closing their positions rather than because of strong buying in the spot market. On the 4H chart INIT has moved above its EMA levels and MACD has turned positive. But RSI6 is already close to 70 which means the short-term move may be getting overheated. I would like to see stronger spot buying before trusting this recovery. A price pump is one thing. Keeping that price strong while more tokens enter the market is a completely different challenge. The big question is whether INIT can maintain this momentum when supply pressure increases. $INITUSDT #IMPACTbyTrade
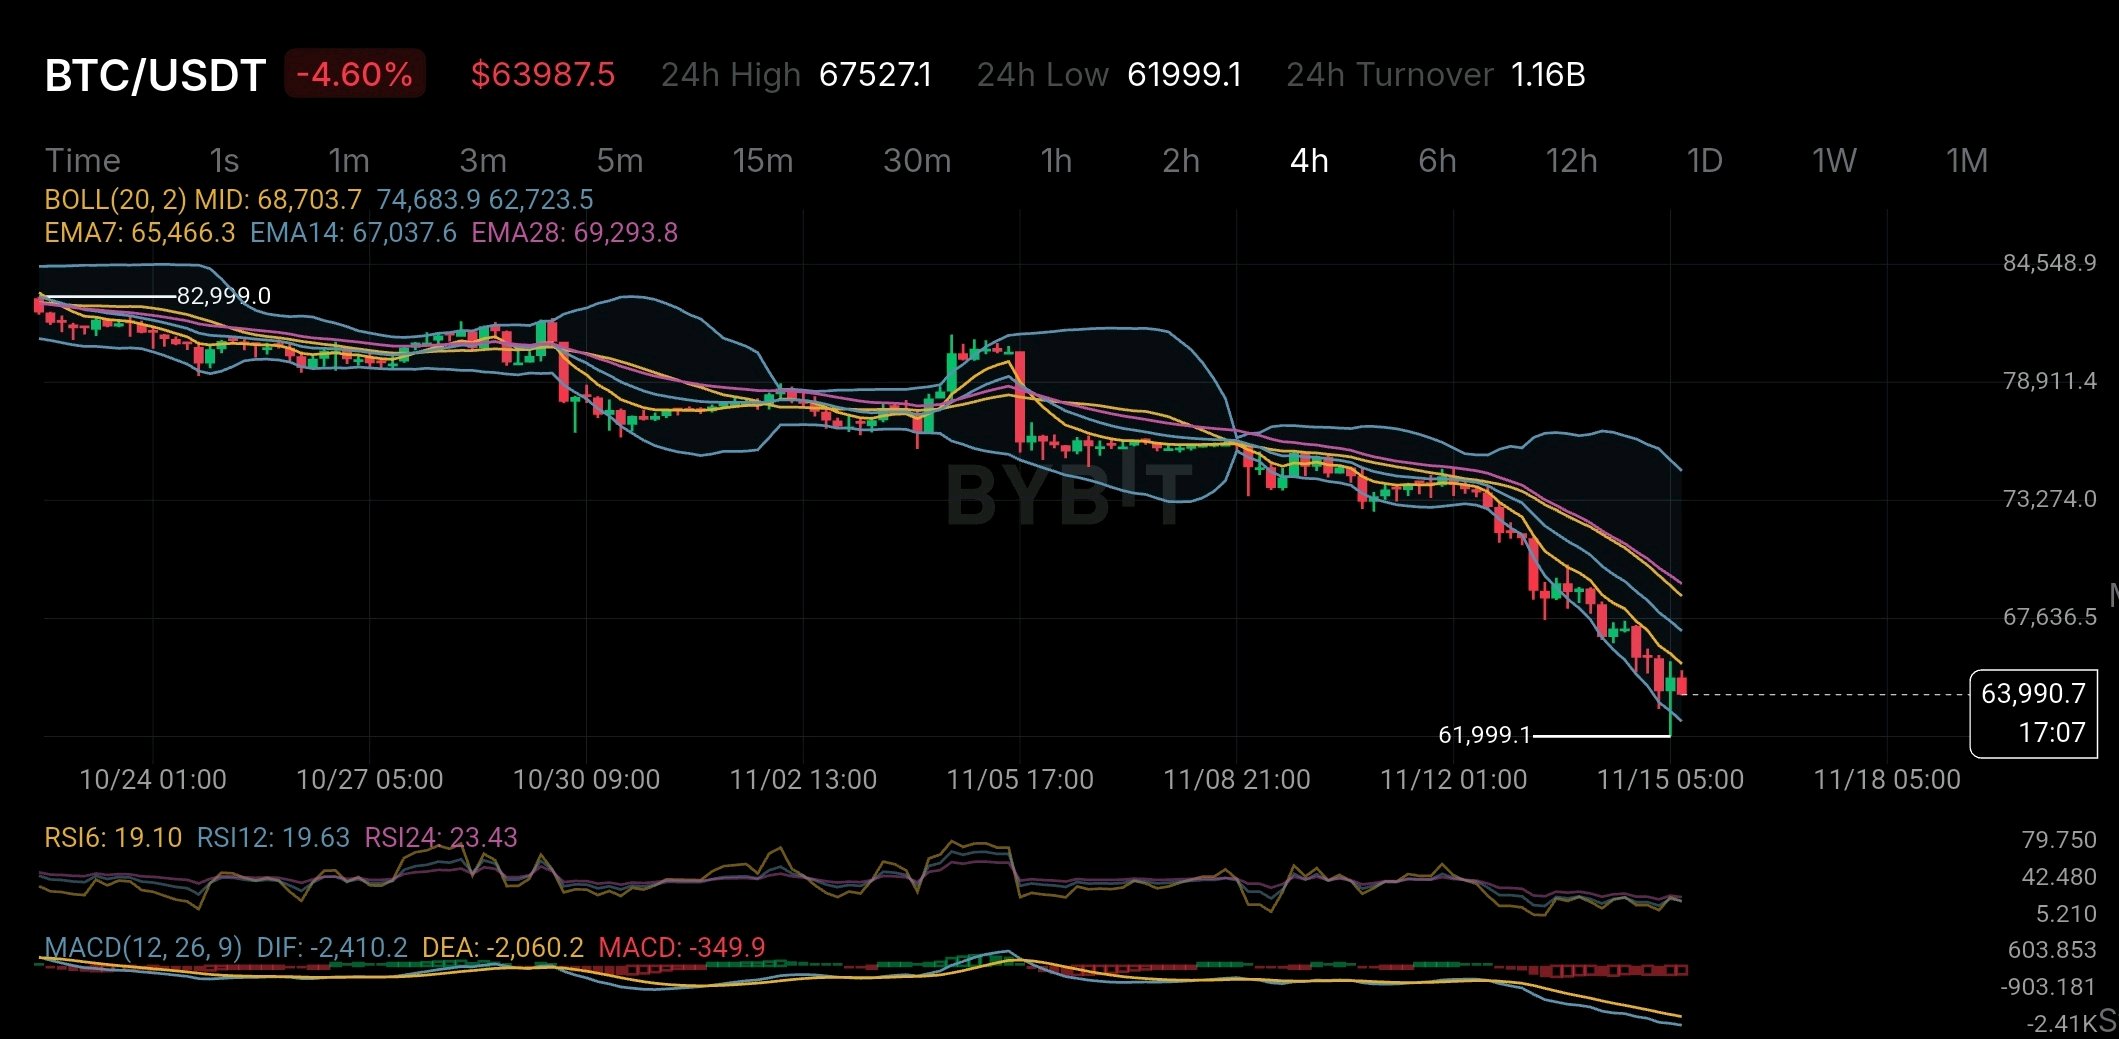
Bitcoin is showing more weakness than a normal price drop. What worries me is how quickly buyers have lost control on the 4-hour chart. BTC is trading around $63,987 after dropping nearly 4.6%. It also recently touched $61,999. One thing I noticed is that all the momentum indicators are looking weak. RSI is around 19–23 and BTC is trading below the 7 14 and 28 EMAs. MACD is also showing negative momentum. This tells me that sellers are still in control. But the very low RSI also makes me think about one thing. Are sellers getting tired or is another drop coming? For me the bigger concern is not just the chart. It is the demand from big investors. US spot Bitcoin ETFs have seen around $2.3 billion in money flowing out during November so far. Nine out of the first ten trading sessions were negative. Another important detail is that the crypto market saw around $1.64 billion in liquidations within 24 hours on November 13. Most of these losses came from traders who were using leverage to bet on higher prices. So this drop is not only about weak chart signals. A stronger US dollar and expectations of higher interest rates are also putting pressure on risky assets like Bitcoin. The main level I am watching is $61,999. If BTC breaks below this support with strong selling pressure then we could see another move down. But if buyers defend this level and BTC starts moving back above the short-term EMAs then a recovery bounce could happen. I also think the low RSI is worth watching. It could lead to a quick bounce but it does not mean the bottom is confirmed. Bitcoin still has a maximum supply of 21 million coins. Its block reward is also 3.125 BTC after the 2024 halving. But there is one important thing to understand. Limited supply does not guarantee higher prices when buyers are not coming into the market. That is what I am watching right now. Bitcoin's long-term supply has not changed but demand in the short term is getting weaker. The big question is whether buyers will step in around $62K or whether Bitcoin needs another drop before finding a stable bottom. $BTCUSDT #IMPACTbyTrade
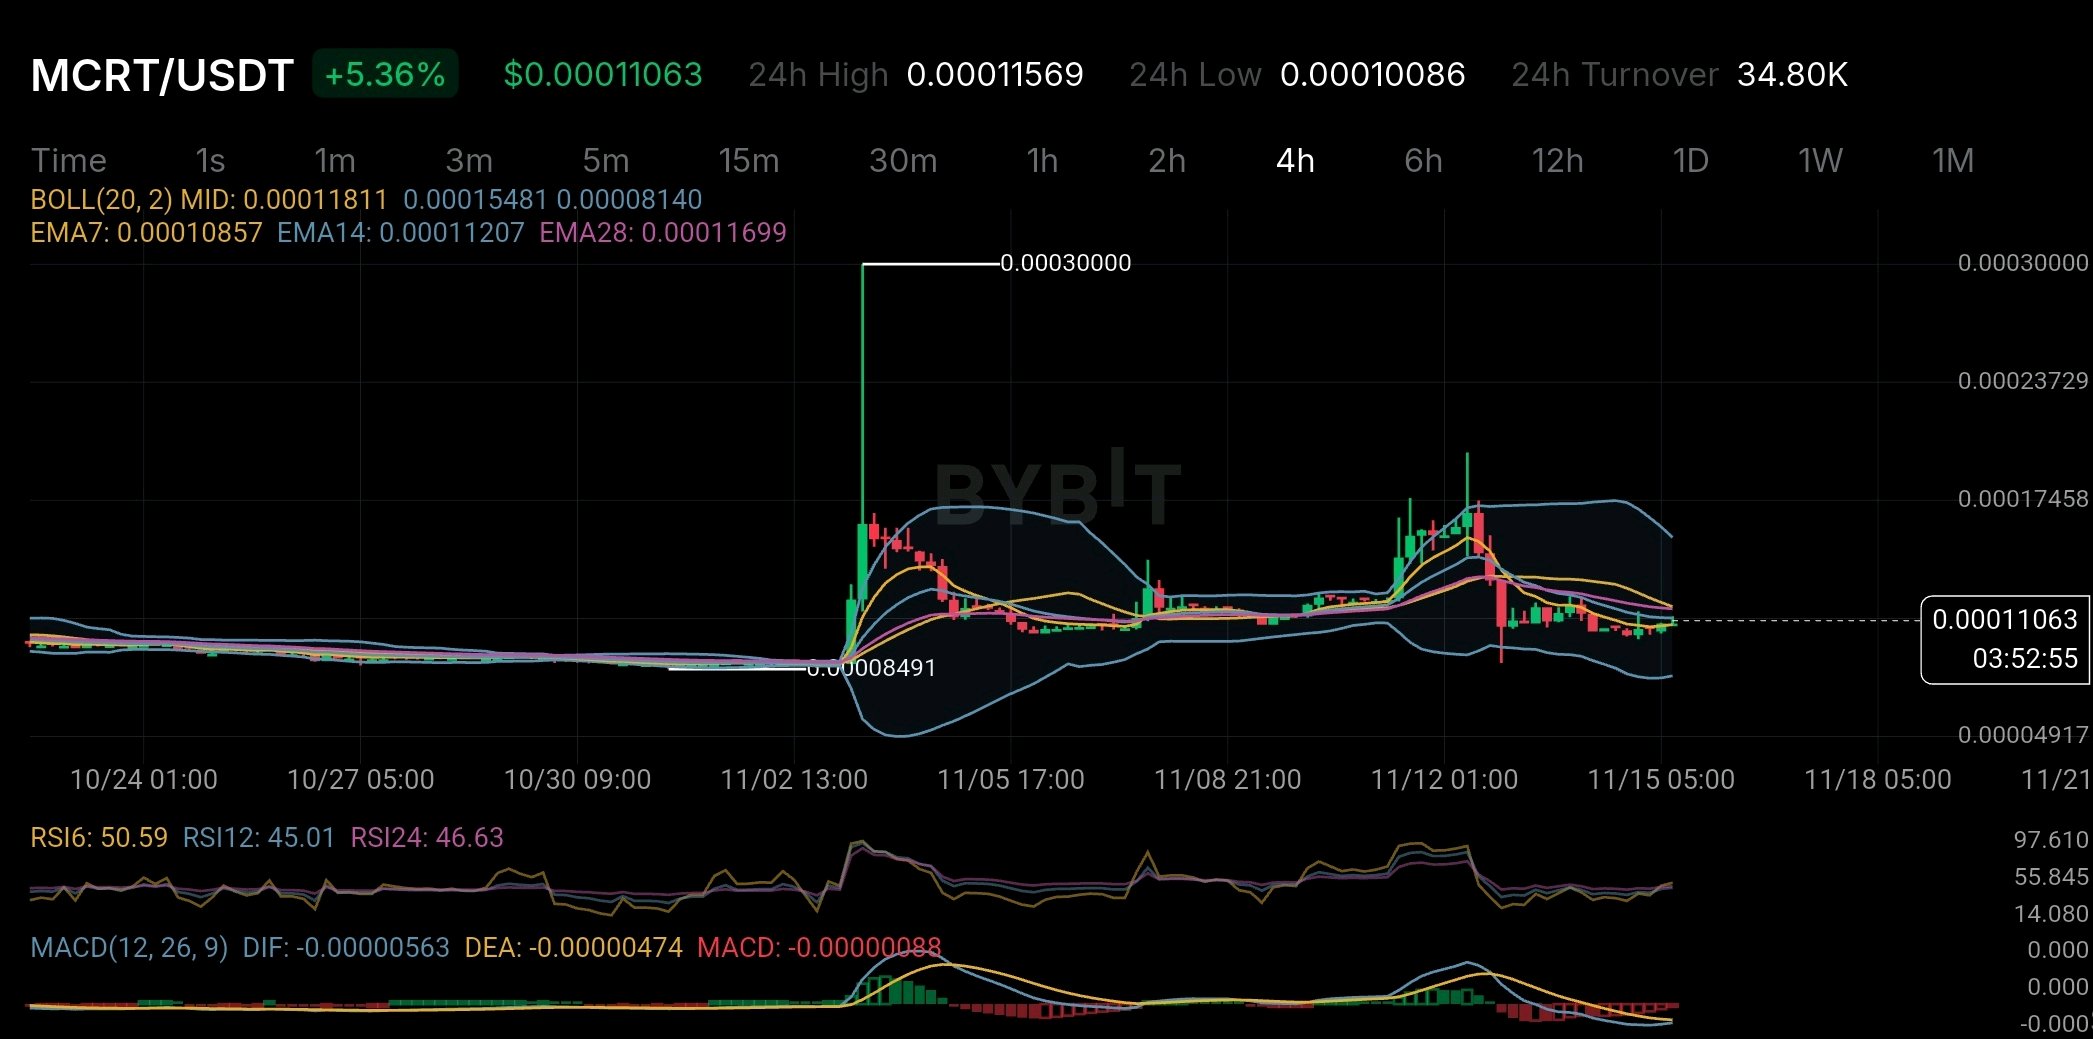
MCRTは4時間足チャートで回復の兆しを見せていますが、買い手が完全に主導権を握っているとはまだ確信が持てません。 現在価格は5.36%上昇して0.00011063ドル付近ですが、強気になるにはまだいくつか確認したい点があります。 気になったのはトークンの供給量です。 MagicCraftの最大供給量は100億MCRTです。公式のトークノミクスによれば、トークンバーン(焼却)の仕組みはありません。 供給量の約43.5%がゲーミングとエコシステムの成長のために確保され、さらに12%がステーキング報酬に割り当てられています。 つまり、将来のトークン放出量と実需には注目しておく必要があります。 また、循環供給量のデータに大きな乖離があることも気になっています。公式サイトでは2026年10月時点で約84億MCRTと推定されていますが、CoinGeckoでは循環供給量が約50.38億トークン、総供給量が72億トークンと表示されています。 算出方法の違いによるものかもしれませんが、依然として注目すべき差異です。 チャートを見ると、MCRTは依然としてEMA14とEMA28を下回っています。ボリンジャーバンドの中央値は約0.00011811ドルです。 RSIは中立付近で、MACDは依然としてマイナス圏にあります。現時点では、明確なトレンド転換というよりは、価格が落ち着こうとしているように見えます。 私は0.000112ドル~0.000118ドルの範囲を注視しています。MCRTがより強さを示すには、このゾーンを上回る必要があります。 下値では、0.000100ドルが重要なサポートラインとして注目されます。 個人的には、あまり自信を持つ前に、買い手が価格を移動平均線の上まで押し上げるのを確認したいですね。 陽線が出るのは良いことですが、より重要なのは、ゲームからの実需が長期的にトークンを支えられるかどうかです。 $MCRTUSDT #IMPACTbyTrade
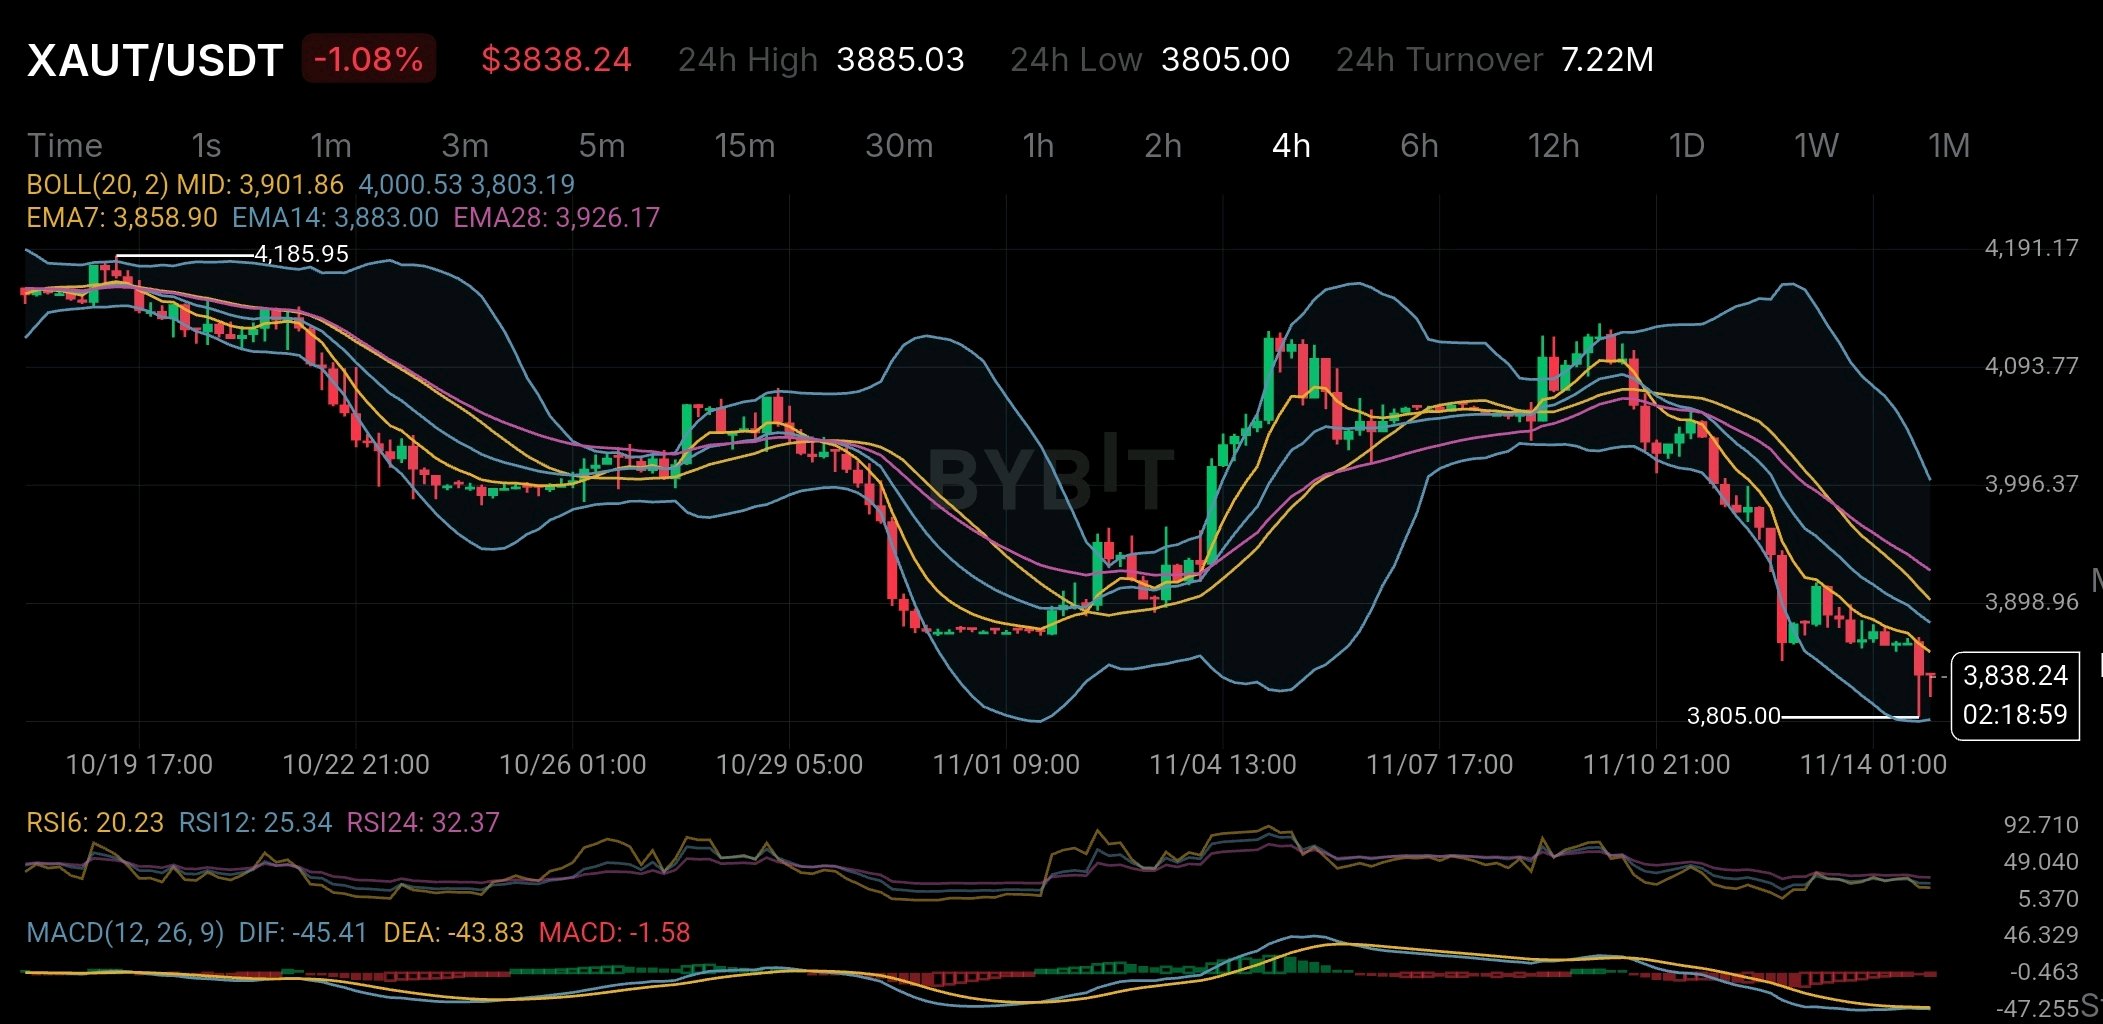
One thing I find interesting about XAUT is that its gold backing isn't the only thing investors should be looking at. I've been studying Tether Gold and there's a detail in its reserve figures that caught my attention. According to the September 30 2026 reserve report Tether had minted 827417.63 XAUT backed by the same amount of physical gold in fine troy ounces. But here's something worth looking at. Out of those tokens 709323.66 had already been sold while 118093.97 were held by a related entity and listed as available for sale. That's roughly 14.3% of the minted supply. I don't see this as an immediate red flag because those tokens are also covered by the reported gold reserves. Still I think it's important to understand the difference between total minted supply and the amount already circulating in buyers' hands. There's also something else people don't always consider. Owning XAUT doesn't mean you can easily walk in and collect physical gold whenever you want. Redemption comes with KYC requirements fees and delivery arrangements in Switzerland. So there's a bit more to owning tokenized gold than simply holding a token in your wallet. Now looking at the 4H chart XAUT is trading around $3,838.24 and the short-term picture isn't looking very strong. Price is sitting below EMA7 at $3,858.90 EMA14 at $3,883 and EMA28 at $3,926.17. RSI6 is around 20.23 which shows heavy selling pressure while MACD is still negative. The $3,805 level is the support I'm keeping an eye on. If buyers step in around this area we could see some recovery. But I don't want to call it a trend reversal until price starts moving back above the EMAs. Personally I still find XAUT an interesting way to get gold exposure through blockchain. But I wouldn't look at gold backing alone when evaluating it. Supply liquidity and the actual process of redeeming physical gold matter just as much. That's the part I think investors should pay more attention to. $XAUTUSDT #ByXIMPACT

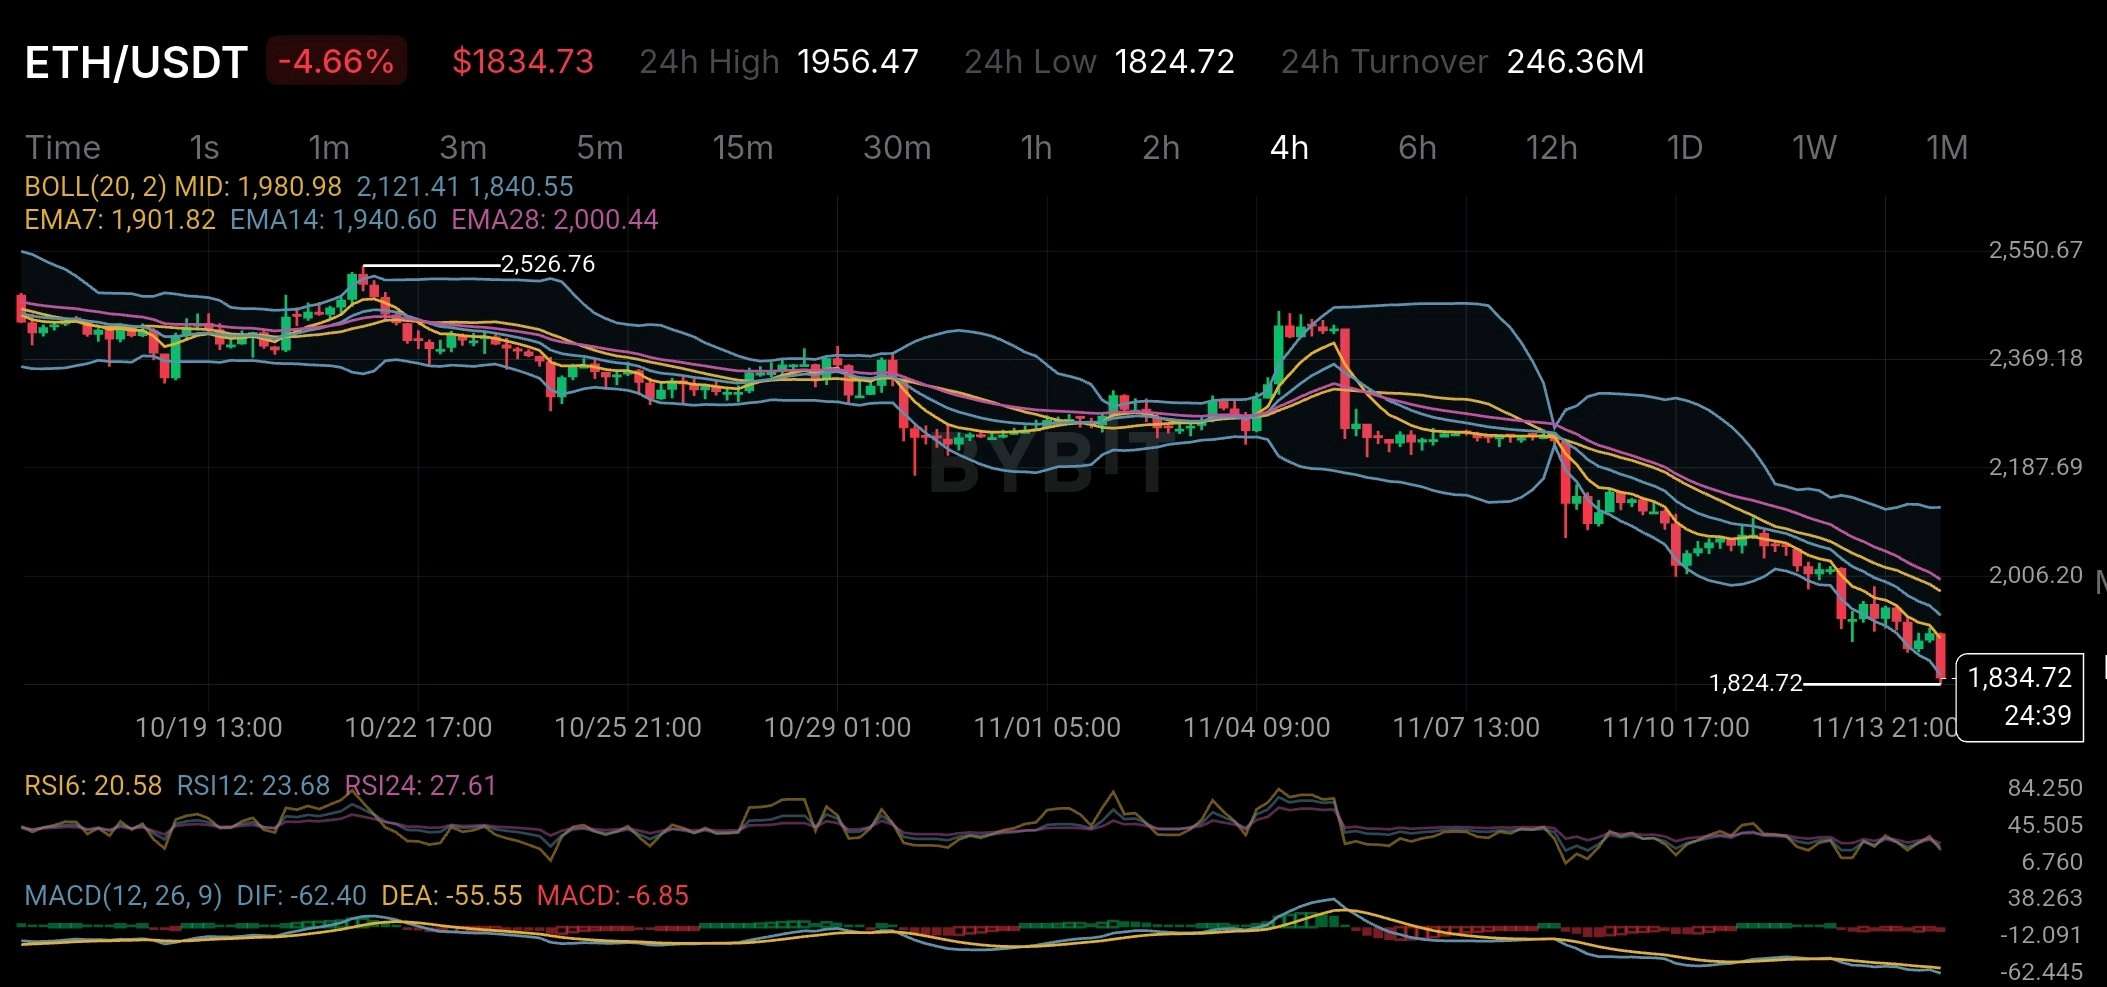
イーサリアムは4時間足チャートで深刻な売られすぎの状態にあるように見えます。しかし、底打ちを判断する前にトレーダーが注意すべき点があります。 ETHは1,834ドル付近で推移しており、全体的なトレンドは依然として下向きです。 移動平均線を見てみましょう。EMA 7は1,901ドル、EMA 14は1,940ドル、EMA 28は2,000ドル付近にあります。価格はこれら3つすべてを下回っています。 これは売り手が依然として主導権を握っており、市場はまだトレンド転換の明確なサインを出していないことを示しています。 しかし、チャートには興味深い部分があります。 RSI 6は20.58まで低下し、RSI 12は23.68、RSI 24は27.61となっています。3つすべてが30を下回っています。 これは、売りがかなり激しかったことを物語っています。これらの水準では、短期的な反発があっても不思議ではありません。しかし、売られすぎであることは、価格がすぐに反転しなければならないことを意味するわけではありません。 MACDも依然としてマイナス圏です。DIFは-62.40、DEAは-55.55となっています。したがって、今のところモメンタムは依然として弱いままです。 イーサリアムには注目すべきもう一つの側面があります。 ETHはEIP-1559メカニズムを通じて取引手数料がバーン(焼却)されるため、デフレ資産と表現されることがよくあります。しかし、それは供給量が常に減少していることを意味するわけではありません。 11月14日に入手可能な最新の数字によると、過去30日間で約89,721 ETHが発行されたのに対し、バーンされたのはわずか2,934 ETHでした。その結果、ネットでの発行量は約86,787 ETHとなりました。 これは重要な違いです。 イーサリアムはユーザーが基本手数料を支払うとETHをバーンしますが、ネットワークアクティビティが低いときはバーンされる手数料が少なくなる一方で、バリデーターへの報酬が継続的に流通量に新しいETHを追加します。 つまり、イーサリアムのデフレストーリーはネットワーク需要に大きく依存しているということです。エコシステムの成長が自動的にETHをデフレにするわけではありません。 チャートを振り返ると、ETHは1,840ドル付近のボリンジャーバンド下限近くでも取引されています。直近安値の1,824.72ドルも注視すべき水準です。 1,901ドルを超えてくれば、モメンタム改善の最初の兆候となる可能性があります。それより上では、1,940ドルから2,000ドルが引き続き重要なレジスタンスゾーンとなります。 今のところ、私は価格動向と供給ダイナミクスの両方を注視しています。 ETHは売られすぎかもしれませんが、より大きな問題は、トレンドを変えるのに十分なほど買い需要が力強く戻ってくるかどうかです。 $ETHUSDT #ByXIMPACT

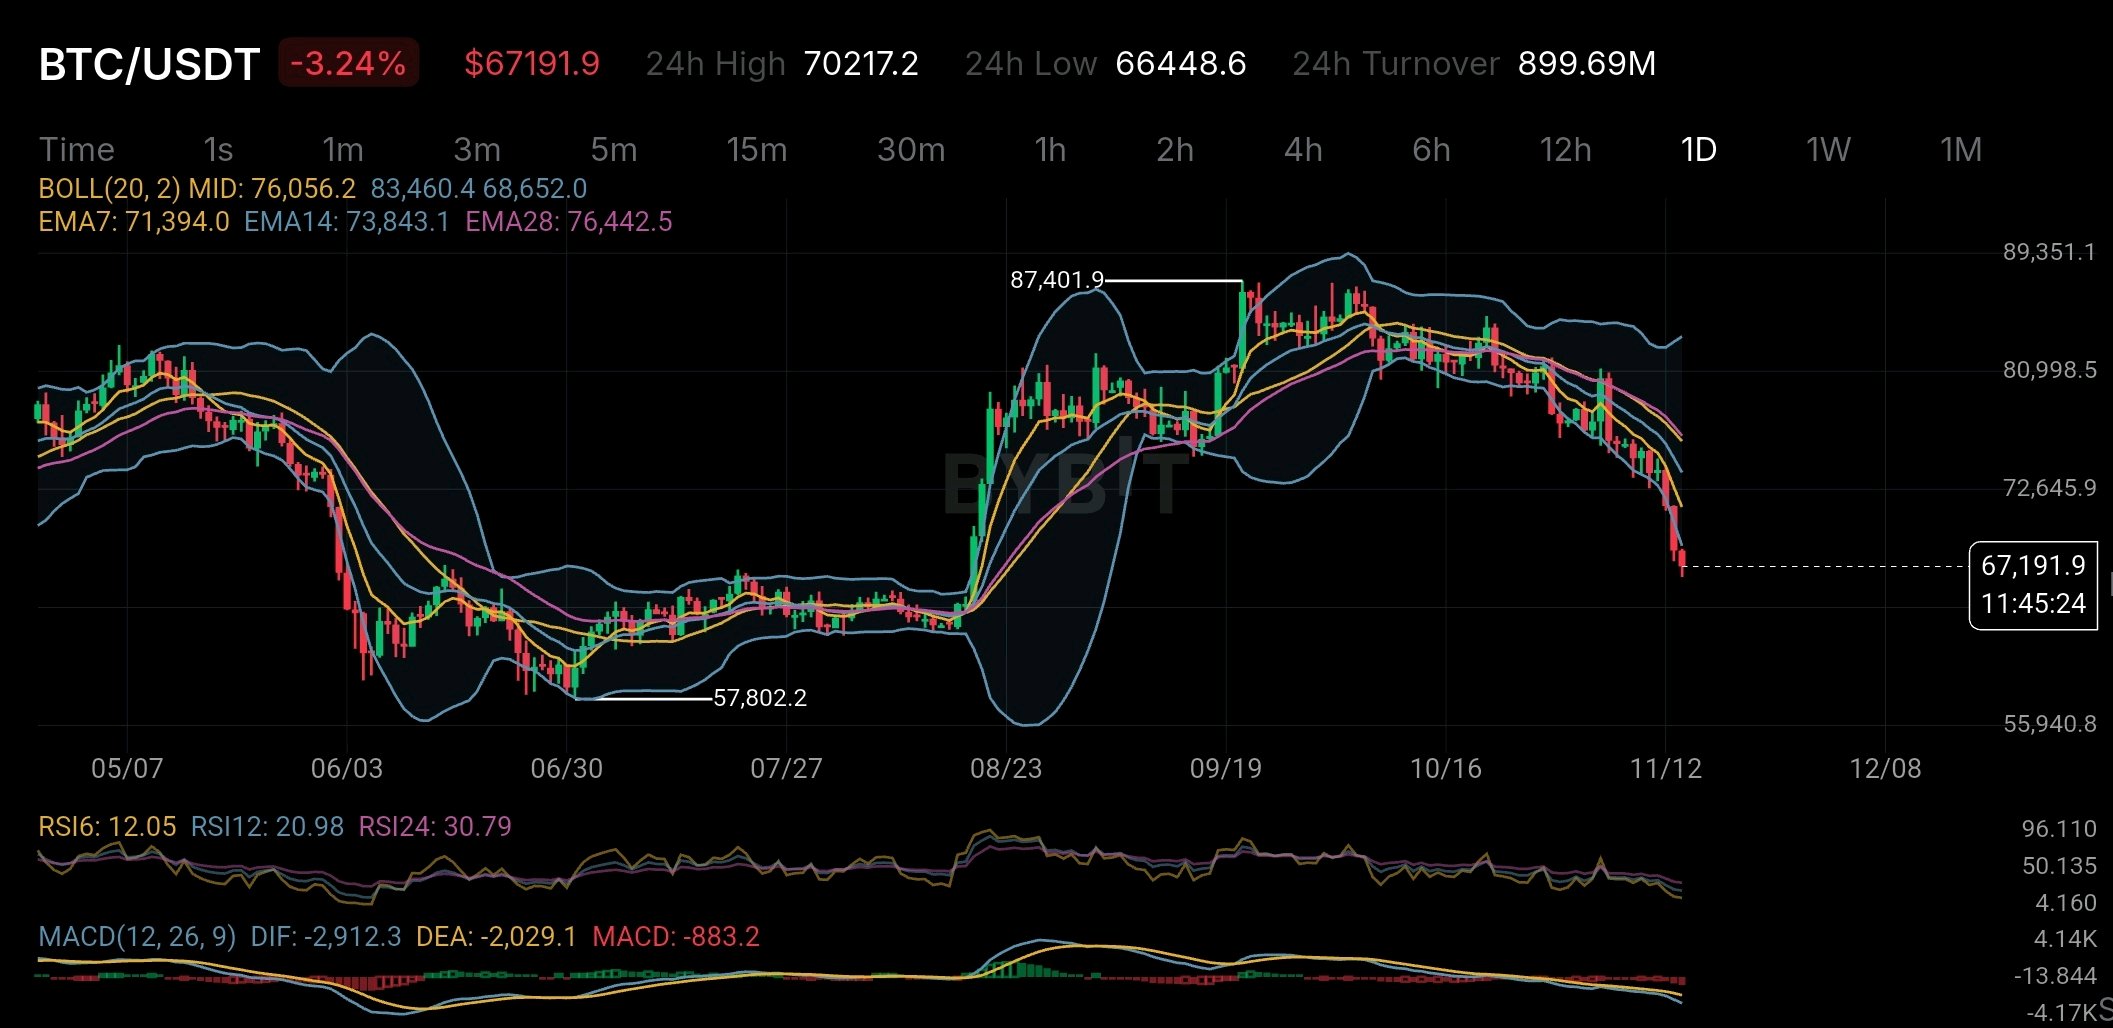
ビットコインは現在かなりの売られすぎ状態ですが、必ずしも底を打ったとは限りません。 BTCは67,191ドル近辺で推移しており、前日比で3%以上下落しています。私が注目しているのは単なる価格の下落ではありません。日足のインジケーターがどれほど弱含んでいるかという点です。 RSIの数値は異常に低く、RSI(6)は12.05、RSI(12)は20.98、RSI(24)は30.79となっています。 これらの水準は、売り手がかなりの期間、市場を支配してきたことを示唆しています。 しかし、ここからが興味深いところです。 多くのトレーダーはRSIが売られすぎ水準になると、すぐに買いの機会を探し始めます。問題は、特に全体的なトレンドが依然として下向きである場合、売られすぎの状態が予想よりもはるかに長く続く可能性があることです。 そして、ビットコインの現在のチャートには、力強さはあまり見られません。 価格は3つの指数平滑移動平均線(EMA)すべてを下回って推移しています。 EMA7:71,394ドル EMA14:73,843ドル EMA28:76,442ドル これは、短期、中期、長期のモメンタムすべてに売り圧力がかかっていることを示しています。 MACDも安心できる状況ではありません。DIFとDEAはいずれもマイナス圏に留まっており、ヒストグラムもマイナスです。 注目すべきもう一つの重要な水準は、76,056ドル近辺のボリンジャーバンドの中間線です。BTCはそれを大幅に下回って推移しており、直近の平均値からどれだけ価格が乖離しているかがわかります。 とはいえ、リリーフ・ラリー(自律反発)の可能性を排除するつもりはありません。 これほど売りが強まると、短期間の回復は起こり得ます。しかし、反発したからといってトレンドが転換したとは限りません。 66,448ドル近辺の直近安値には注目する価値があります。買い手がこのエリアを死守できれば、BTCは回復を試みる可能性があります。もしこのサポートが機能しなければ、さらなる下落圧力を無視することはできません。 今のところ、私は正確な底値を予測しようとするよりも、買い手が実際に参入してくるのを見極めることに関心があります。 一つだけはっきりしているのは、ビットコインは深く売られすぎているものの、全体的なトレンドは依然として弱いということです。 トレーディングにおいて最も難しいのは、良いエントリーポイントを見つけることではなく、下落し続ける市場と、ようやく回復の準備が整った市場を見極めることかもしれません。 $BTCUSDT #ByXIMPACT #WSOTあなたのAI取引を見せて10USDTを獲得 #WSOT2026

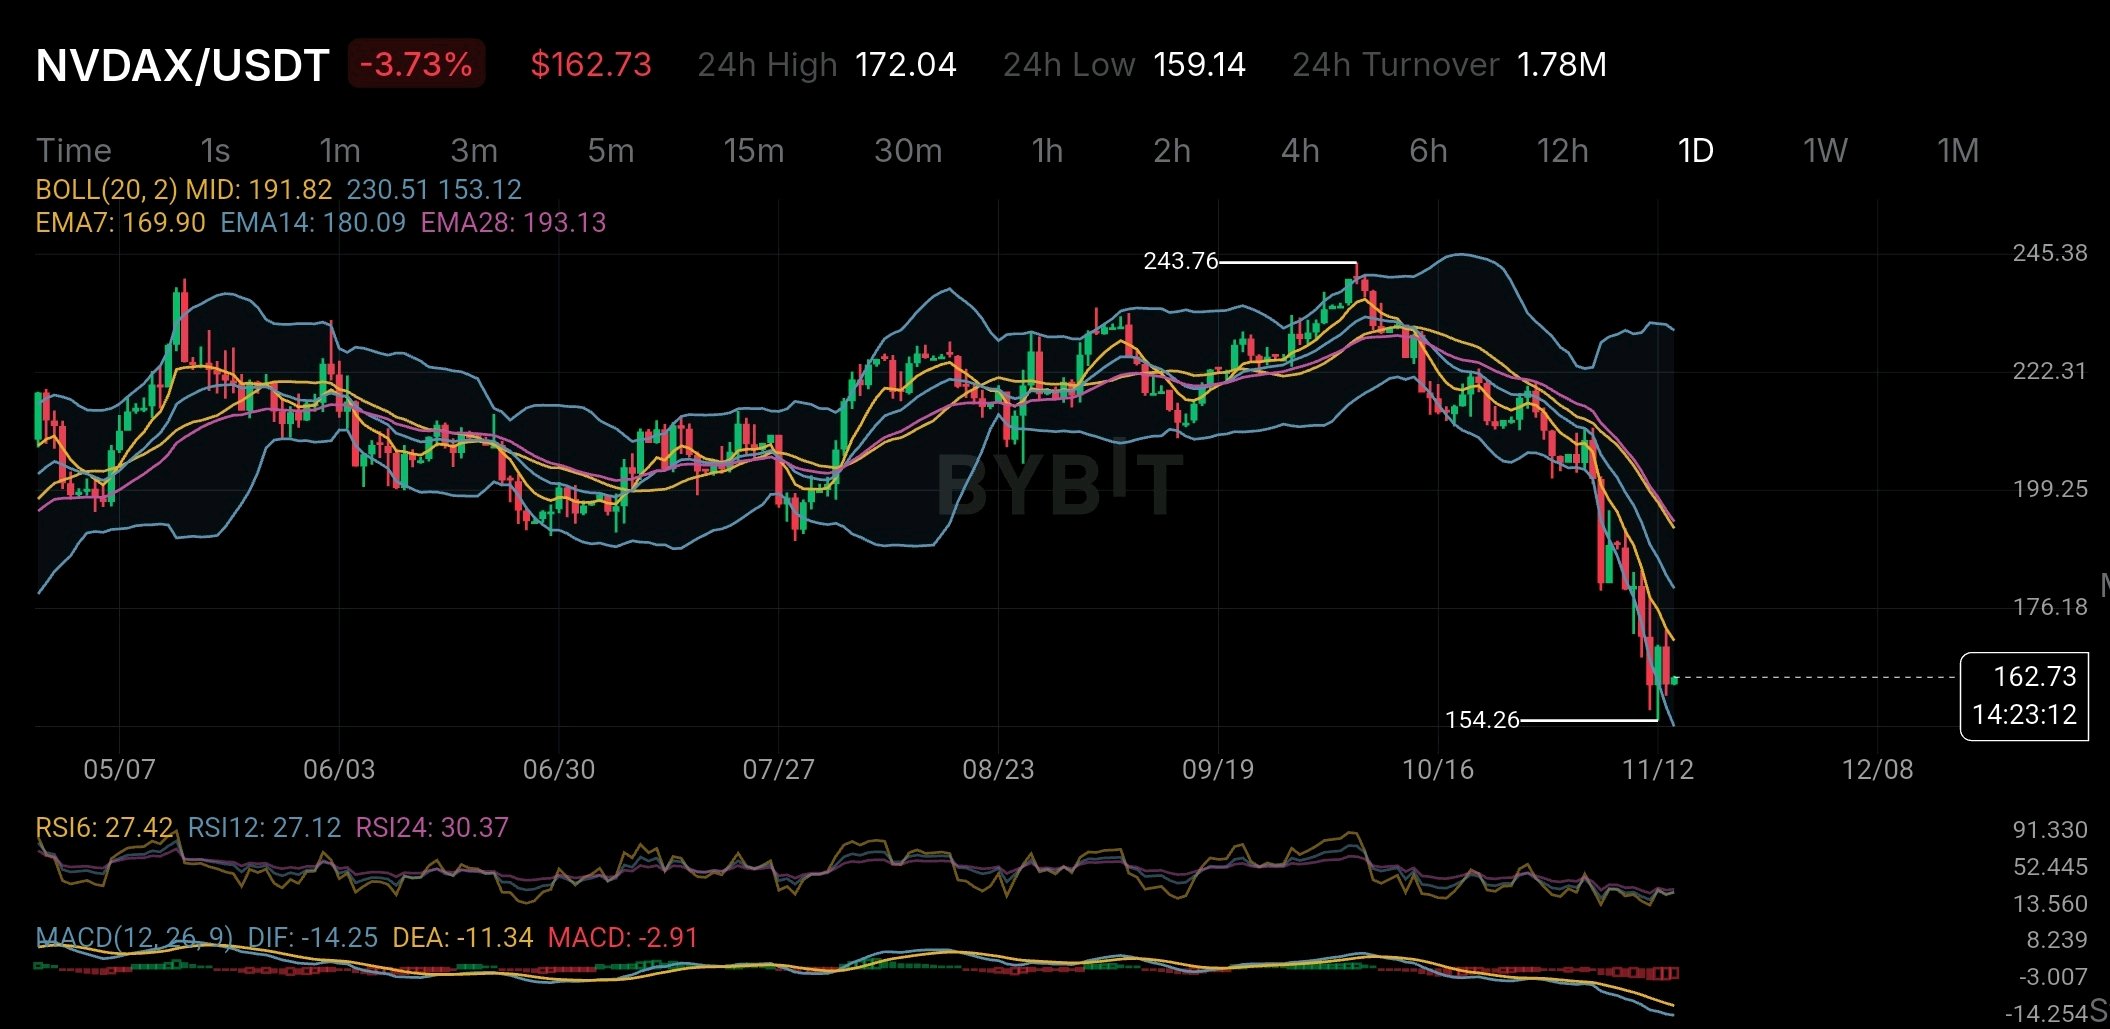
NVDAX is falling sharply but there is something about this token that many traders may not fully understand. At $162.73 NVDAX is down 3.73% on the daily chart. RSI6 is at 27.42 while RSI12 is at 27.12. Both readings show strong selling pressure. Price is also below all three major EMAs. EMA7 is at $169.90 EMA14 at $180.09 and EMA28 at $193.13. The chart looks weak. But the bigger story is not just about the price. NVDAX is a tokenized version of NVIDIA stock issued through Backed Finance. It is designed to follow NVIDIA's share price and is intended to be backed 1:1 by actual NVIDIA shares held in custody. Sounds simple. But there is an important difference. Buying NVDAX does not mean you own NVIDIA shares. According to Bybit's official xStocks terms holders do not receive shareholder voting rights or direct ownership of the company. They also do not receive dividends directly. Any dividend value may instead be reflected through an adjustment to the token's multiplier. There is another detail worth understanding. Bybit provides the trading platform but it does not issue or hold the underlying shares. The tokens are issued and redeemed by Backed Finance. Bybit also clearly states that it does not guarantee redemption liquidity or fair market pricing. It also says it does not independently verify or monitor the underlying collateral. This creates an important difference between owning a traditional NVIDIA share and holding NVDAX. You get exposure to NVIDIA's price through a blockchain-based token but you also take on issuer and custody risks. Now look at the chart again. NVDAX has fallen close to its recent low of $154.26. The price is also near the lower Bollinger Band at $153.12. A short-term bounce is possible but the negative MACD and downward EMA structure suggest that sellers are still in control. The $154 area is worth watching. A break below it could bring more selling pressure while a recovery above $170 would be an early sign of improving momentum. NVDAX offers an interesting way to access traditional stocks through crypto markets. But investors should remember one thing: Getting exposure to a company's share price and actually owning its shares are two very different things. $NVDAXUSDT #ByXIMPACT
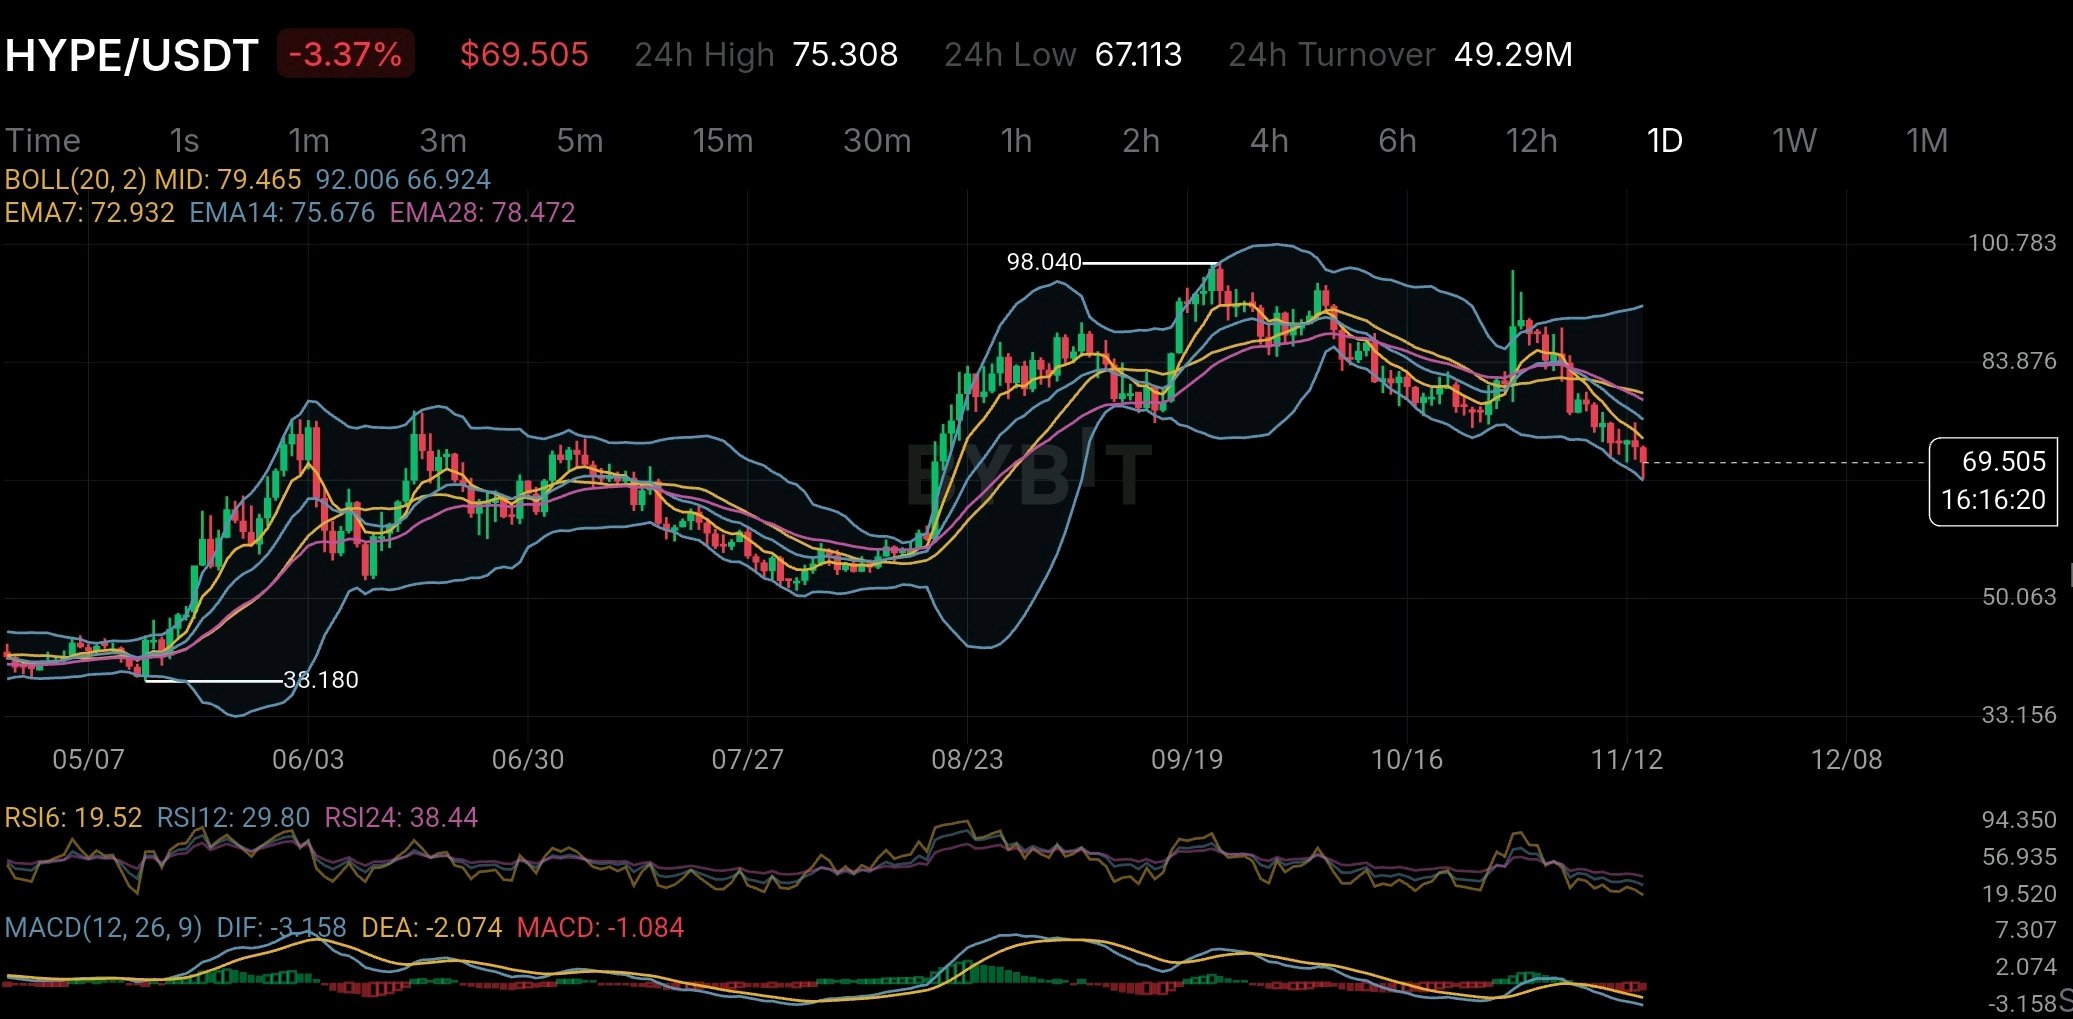
HYPEは、バイバック(自社株買い)メカニズムを通じて、すでに約5,000万トークンを流通市場から削除しました。しかし、投資家が無視すべきではないもう一つの供給要因が存在します。 真の問題は、HYPEのトークンバーン(焼却)が、まだ市場に流通していない供給量に追いつけるかどうかです。 Hyperliquidは、仮想通貨市場の中でもとりわけ興味深いトークノミクスモデルを採用しています。 2026年11月の投資家向け開示資料によると、プロトコル手数料の約99%が「アシスタンス・ファンド(Assistance Fund)」に向けられています。このファンドは、オープン市場から直接HYPEを購入し、取得したトークンを永久に流通から除外します。 開示されたバイバックは、2026年10月28日時点で約4,830万HYPEに達していました。 これはかなりの量です。 これにより、取引活動とトークン需要の間に直接的な結びつきが生まれます。取引所の手数料収入が増えれば、その分HYPEを購入するための資本も増加する仕組みです。 しかし、ここで注目すべき点があります。 HYPEの最大供給量は当初10億トークンでした。バイバックやネットワーク手数料の焼却によって約5,000万トークンが削除されたことを考慮しても、残りの供給構造には将来的な供給分が依然として大きく残っています。 11月の開示資料によると、約4億1,000万HYPEが将来の排出分およびコミュニティ報酬に、さらに6,100万HYPEがHyper Foundationに割り当てられています。 また、コア貢献者向けに2億3,800万トークンが割り当てられています。 ここに興味深い矛盾が生じます。 HYPEには、継続的な市場需要を生み出し、流通供給量を削減する真のメカニズムが存在します。しかし、長期的な供給状況を理解するには、バーン(焼却)だけを見ていては不十分です。 将来の排出ペースが同じくらい重要だからです。 プロトコルの収益が成長し続ければ、バイバックメカニズムは重要な構造的アドバンテージとなる可能性があります。しかし、排出量やアンロックされる割り当て分が実際の需要よりも速く増加する場合、それらの購入によるプラスの効果は薄れる可能性があります。 チャートも別の側面を示しています。 HYPEは、9月の高値近辺の98ドルから下落し、日足タイムフレームでは約69.50ドルで取引されています。価格は、72.93ドルのEMA 7、75.67ドルのEMA 14、78.47ドルのEMA 28を下回っています。 日足のRSI 6は19.52付近であり、短期的なモメンタムが深刻な売られすぎ状態であることを示しています。 そのため、現在の弱気な状況は興味深いものの、反転を確定させるものではありません。目に見えるトレンドは依然として売り手が支配しています。 私にとって監視すべき最も重要な指標は、単に何枚のHYPEトークンが焼却されたかではありません。 真のプロトコル収益が、流通市場に流入する供給量を一貫して吸収できるかどうかです。 強力なバイバックメカニズムはトークンの経済を支えることができますが、持続可能な需要は最終的に、新規供給を補う以上の役割を果たさなければなりません。 それこそがHYPEにとっての真の試練です。 出典: Hyperliquid Strategies 2026年11月5日付開示資料および提供されたHYPE日足チャート $HYPEUSDT #ByXIMPACT

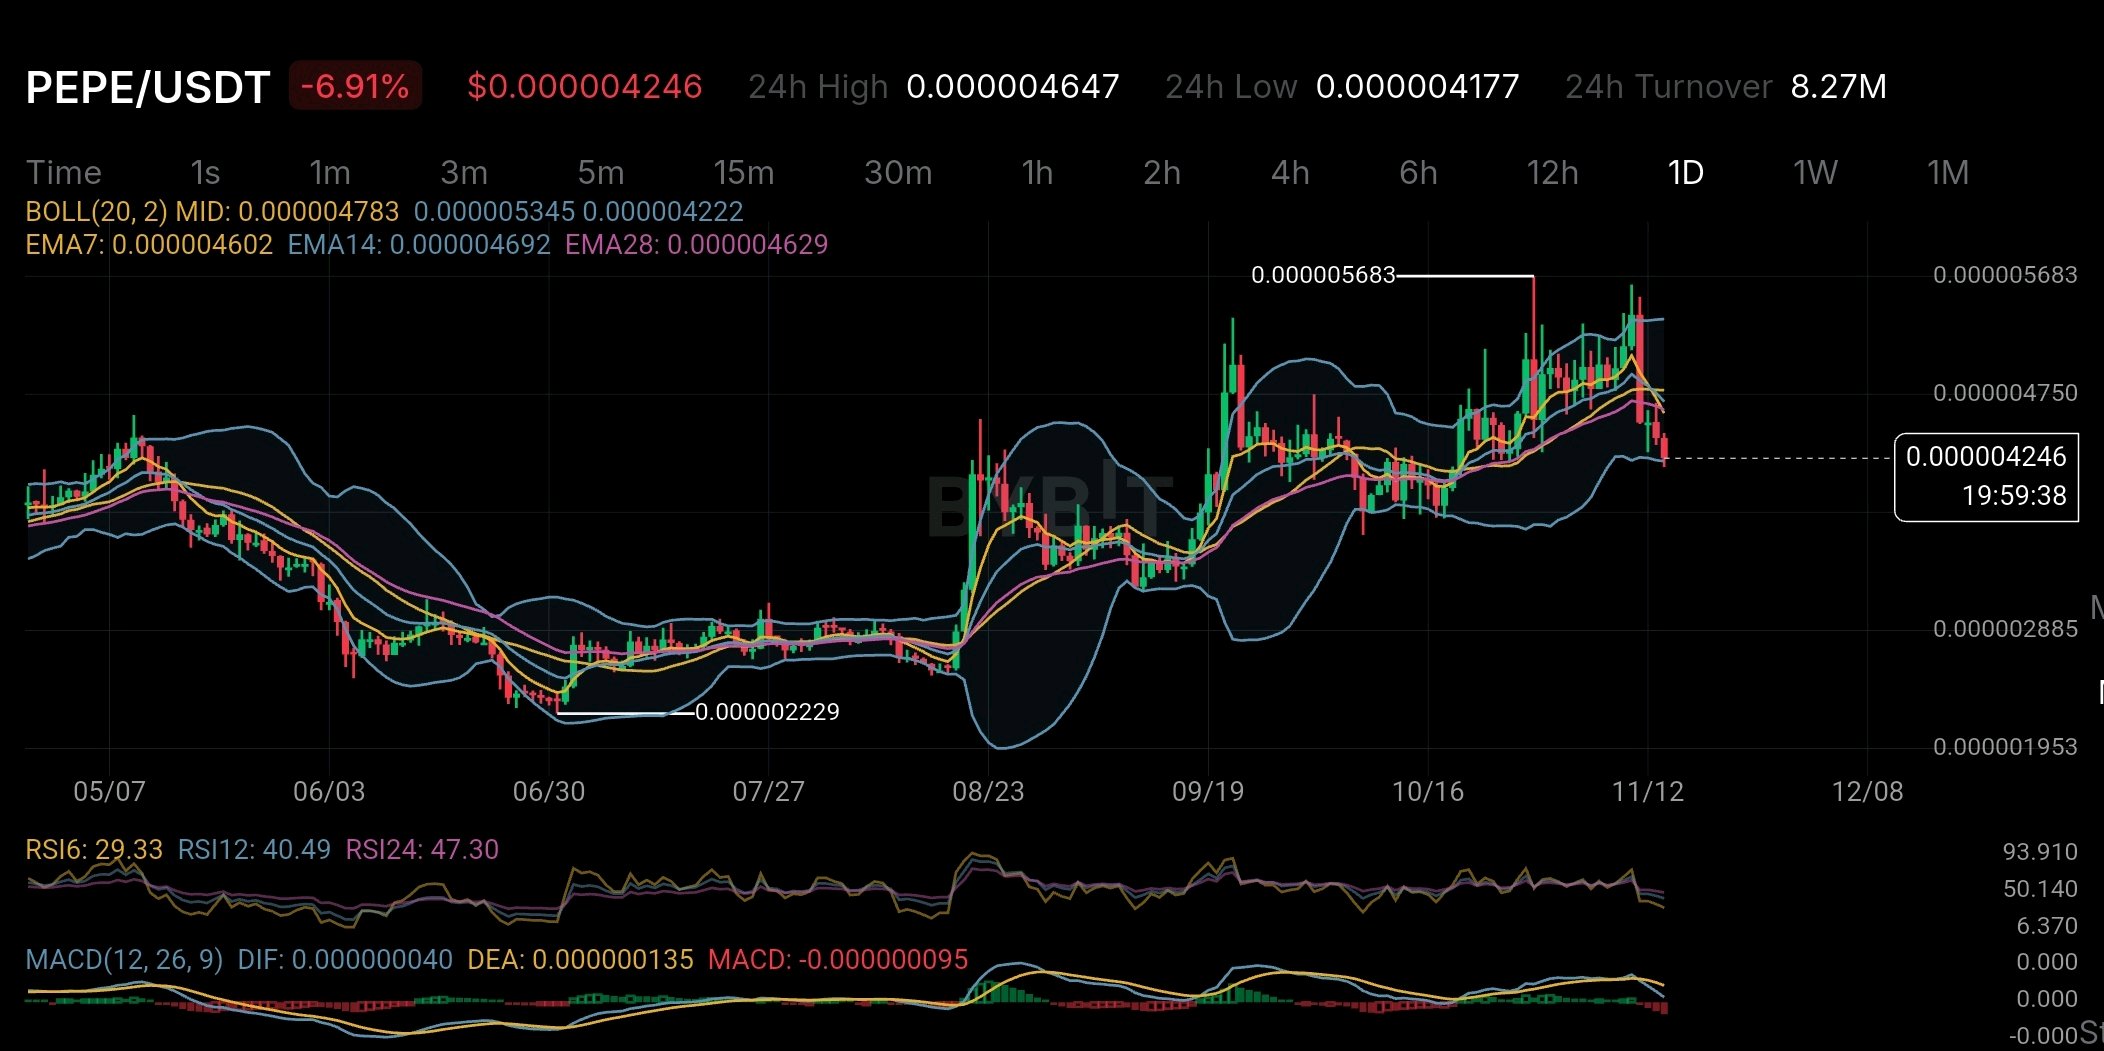
PEPEには、予定されたアンロックによる売り圧力はほとんど残っていませんが、供給量が売りリスクから完全に解放されているというわけではありません。 その配布履歴には、もっと注目すべき重要な詳細が隠されています。 Canary Capitalの2026年4月のSEC提出書類によると、PEPEには正式なベスティングやアンロックのスケジュールはなく、2026年1月時点で当初供給量の約98.4%がすでに流通しています。 ポジティブに聞こえますよね? しかし、興味深い点があります。同報告書によると、上位10個のウォレットアドレスが流通供給量の約41%を保有していました。興味深いことに、上位15個のアドレスのうち11個は取引所のものであり、ウォレットの集中が必ずしも15人の巨大な個人保有者を意味するわけではありません。 それでも、複数のウォレットにまたがる未知の所有権は、依然として真のリスクとして残っています。 次に日足チャートを見てみましょう。 PEPEは0.000004246ドル前後で取引されており、6.91%下落しています。価格はEMA7、EMA14、EMA28を下回り、RSI6は29.33付近に位置しています。MACDもマイナスに転じました。 RSIが低いため短期的には反発の余地があるものの、売り圧力が現在強いことを示唆しています。 重要な違いは、PEPEは従来のベスティングやアンロックのカレンダーには直面していないものの、保有の集中とセンチメント主導の需要が依然として深刻な売り圧力を生み出す可能性があるということです。 PEPEにとって、より大きな問題は、何トークンがアンロックされているかだけではありません。実際に市場に供給を放出できるのは誰なのか、ということです。 $PEPEUSDT #ByXIMPACT

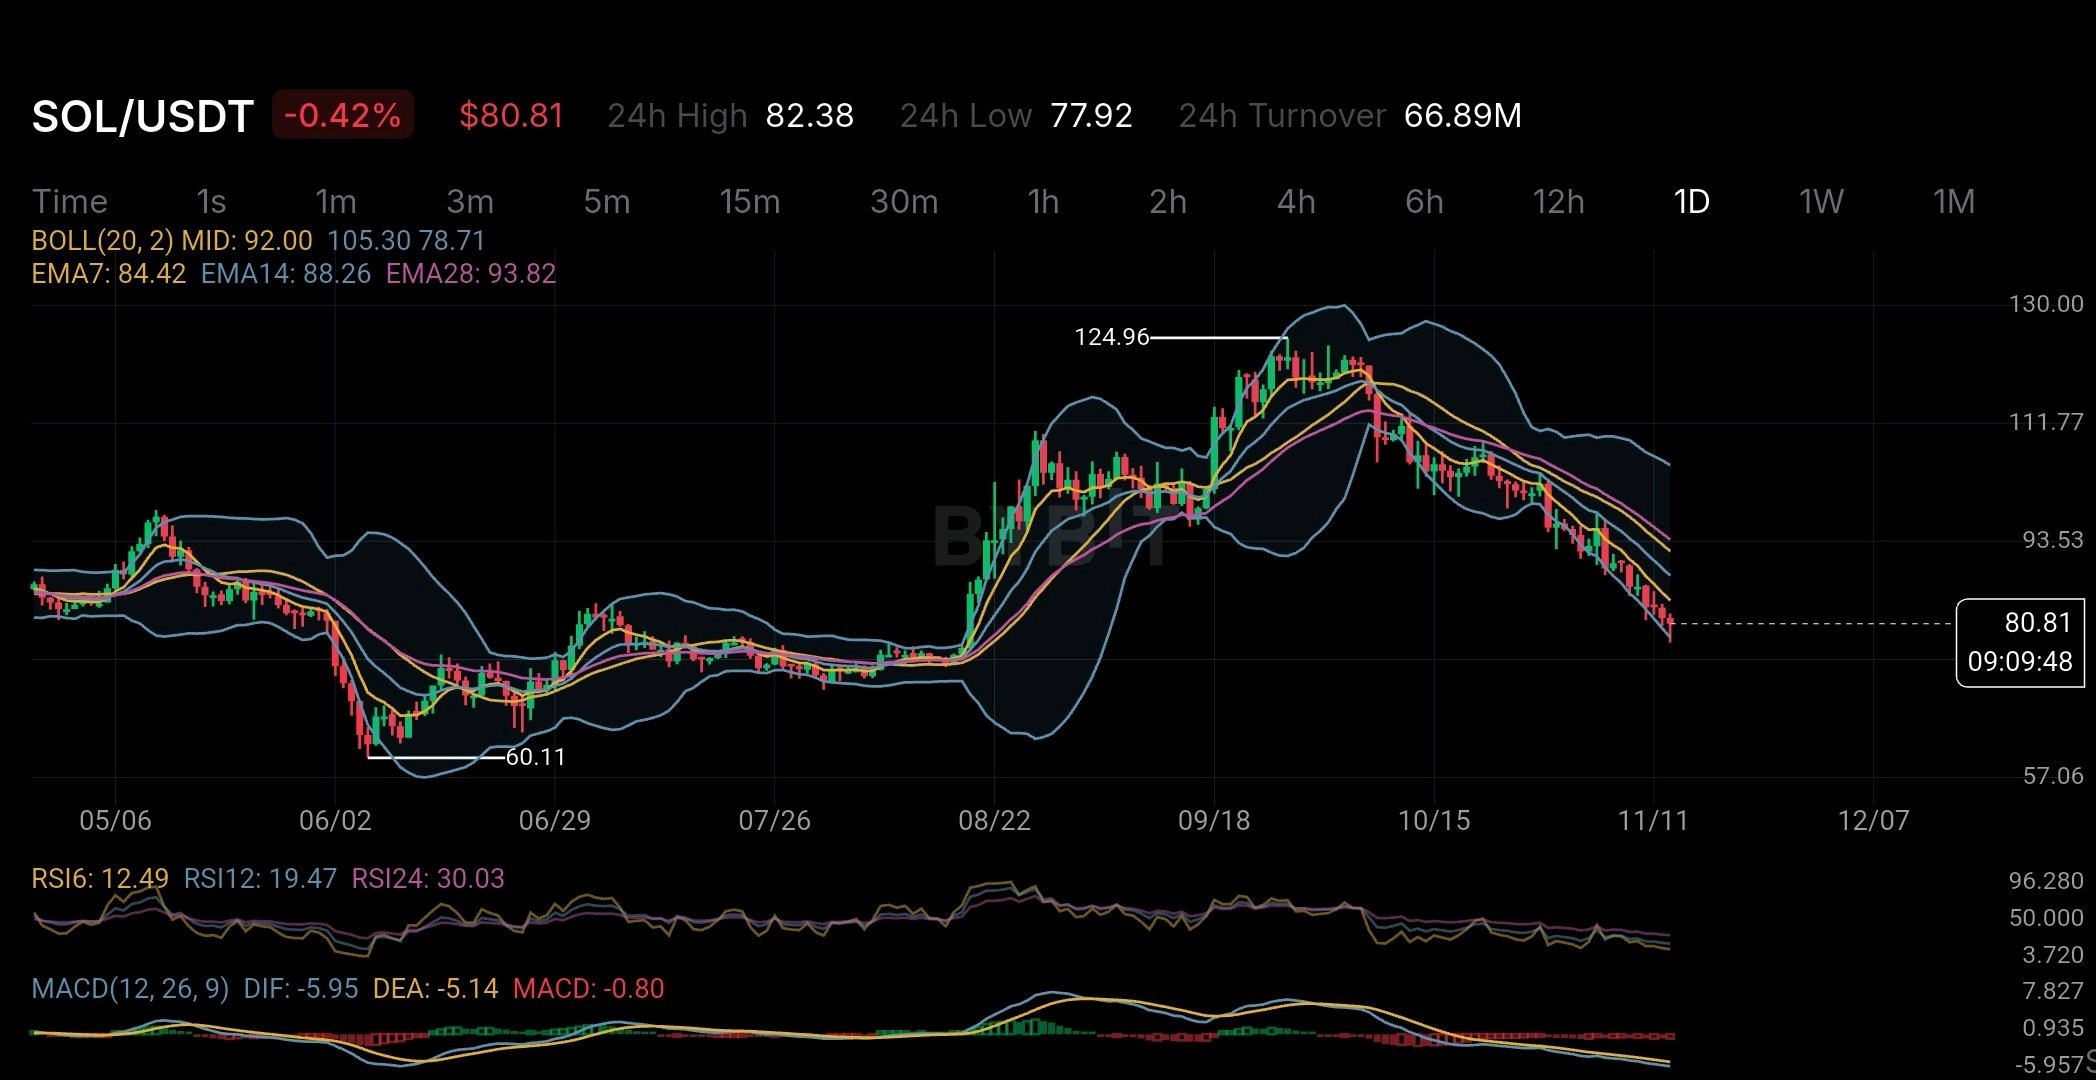
SOL looks oversold right now but there is something bigger happening behind its price that investors should understand. At around $80.81 SOL's daily RSI has dropped to 12.49. This is a very low level. The price is also below all three major EMAs: EMA7 at $84.42 EMA14 at $88.26 and EMA28 at $93.82. A price bounce could happen soon. But being oversold does not mean the bottom is confirmed. One thing that makes Solana interesting is how its token supply works. Unlike projects that release large amounts of tokens at certain times SOL adds new tokens regularly through staking rewards. These rewards help validators keep the network running and secure. Solana started with an 8% yearly inflation rate. This rate was planned to decrease by 15% every year until it reached 1.5%. But something important has changed. In August 2026 Solana approved SGP-0002. This change increases the yearly reduction in inflation from 15% to 30%. The aim is to reach the 1.5% inflation target around 2029 instead of 2032. This is good news for long-term holders because fewer new SOL tokens will enter the market over time. But there is another side to the story. Blockworks' Q3 2026 research reported that around 441.3 million SOL was staked. Staking rewards were worth approximately $495 million during the quarter. Almost all of these rewards came from newly created tokens rather than transaction fees. This is something investors should pay attention to. Staking rewards may look like free money but they are not. When new SOL enters the market it can reduce the value of existing holders' share if they are not staking. Even people who stake need to understand how much of their reward is simply covering this effect. Now let's look at the chart again. SOL is getting close to the $78–80 area. Its lower Bollinger Band is around $78.71. RSI shows that selling pressure is very high. However the downward EMAs and negative MACD show that the overall trend is still weak. A recovery is possible but the indicators have not confirmed a trend change yet. For Solana reducing inflation is a good step. But the real challenge is to bring in more users and generate more fee income so the network does not have to depend so much on creating new tokens. A blockchain becomes stronger when people use it because it provides real value not just because it gives them rewards. $SOLUSDT #ByXIMPACT

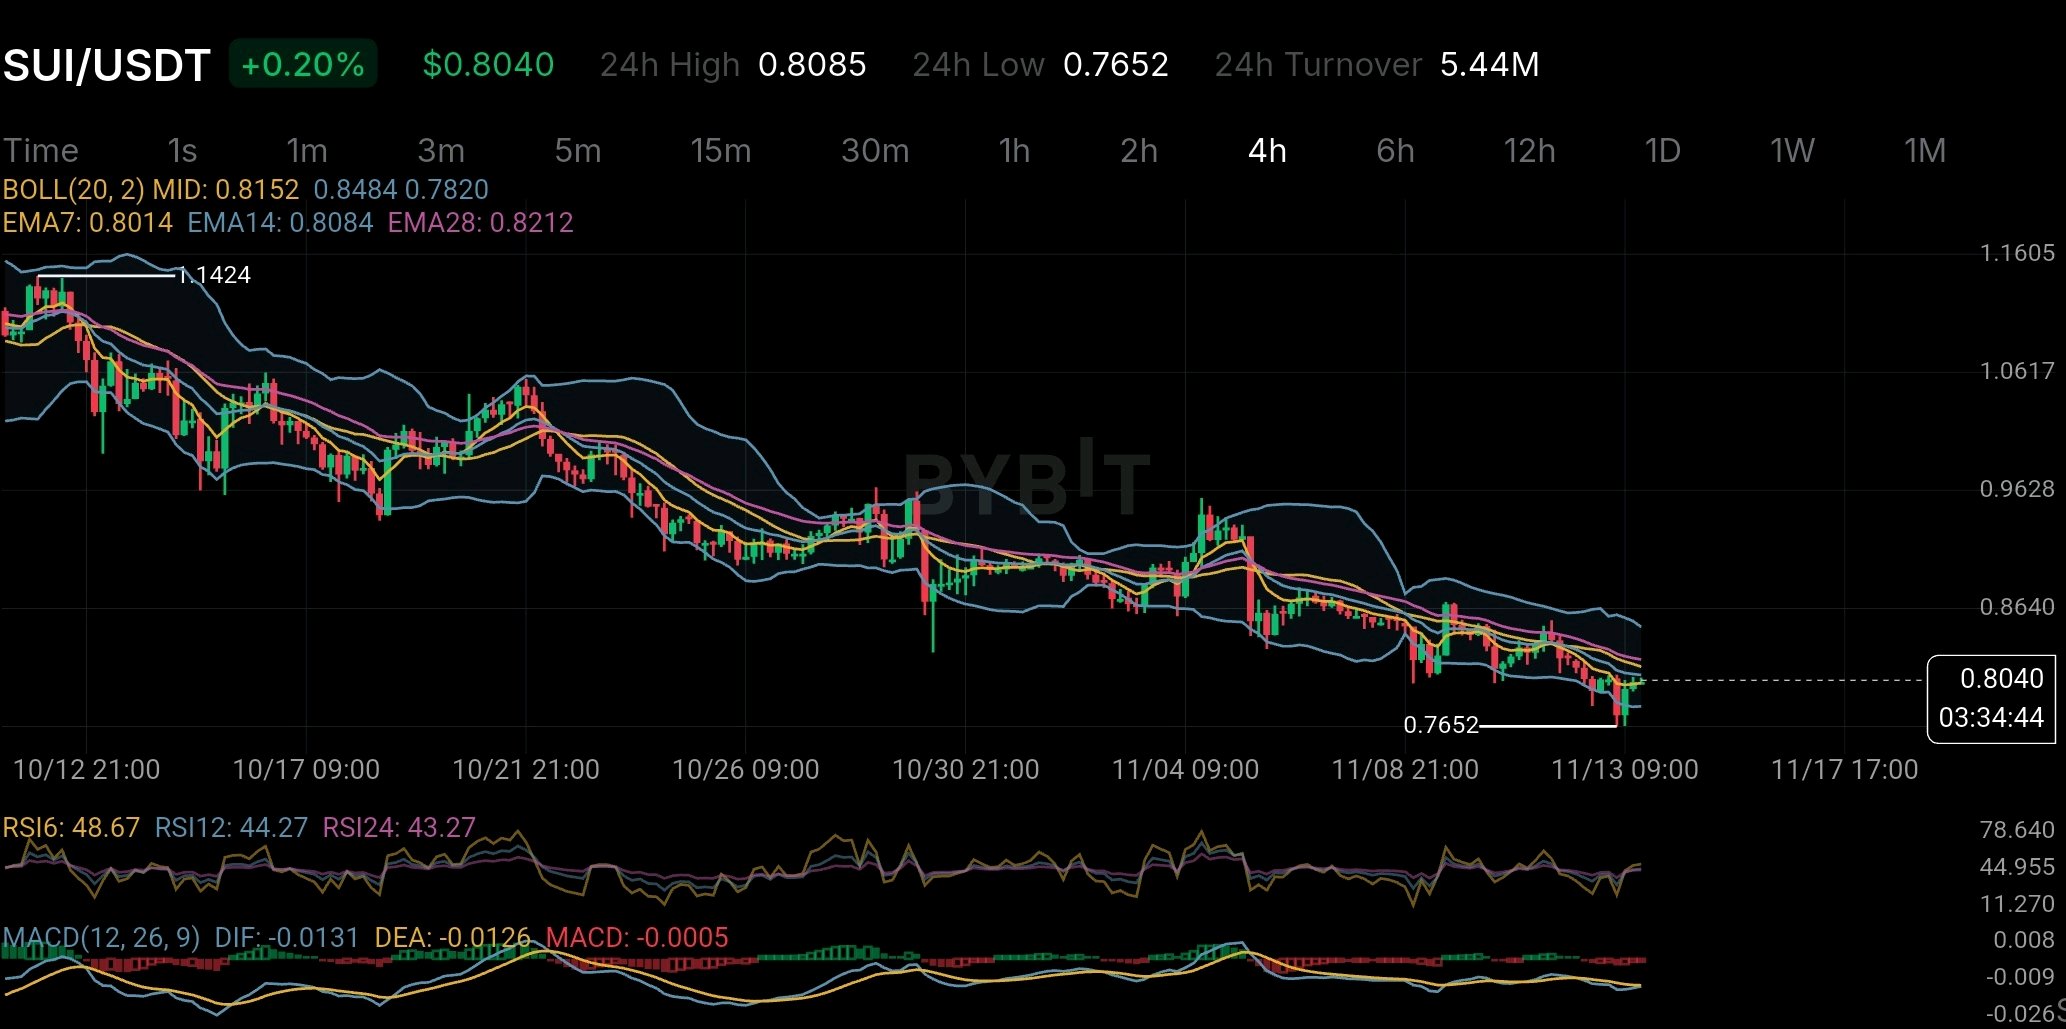
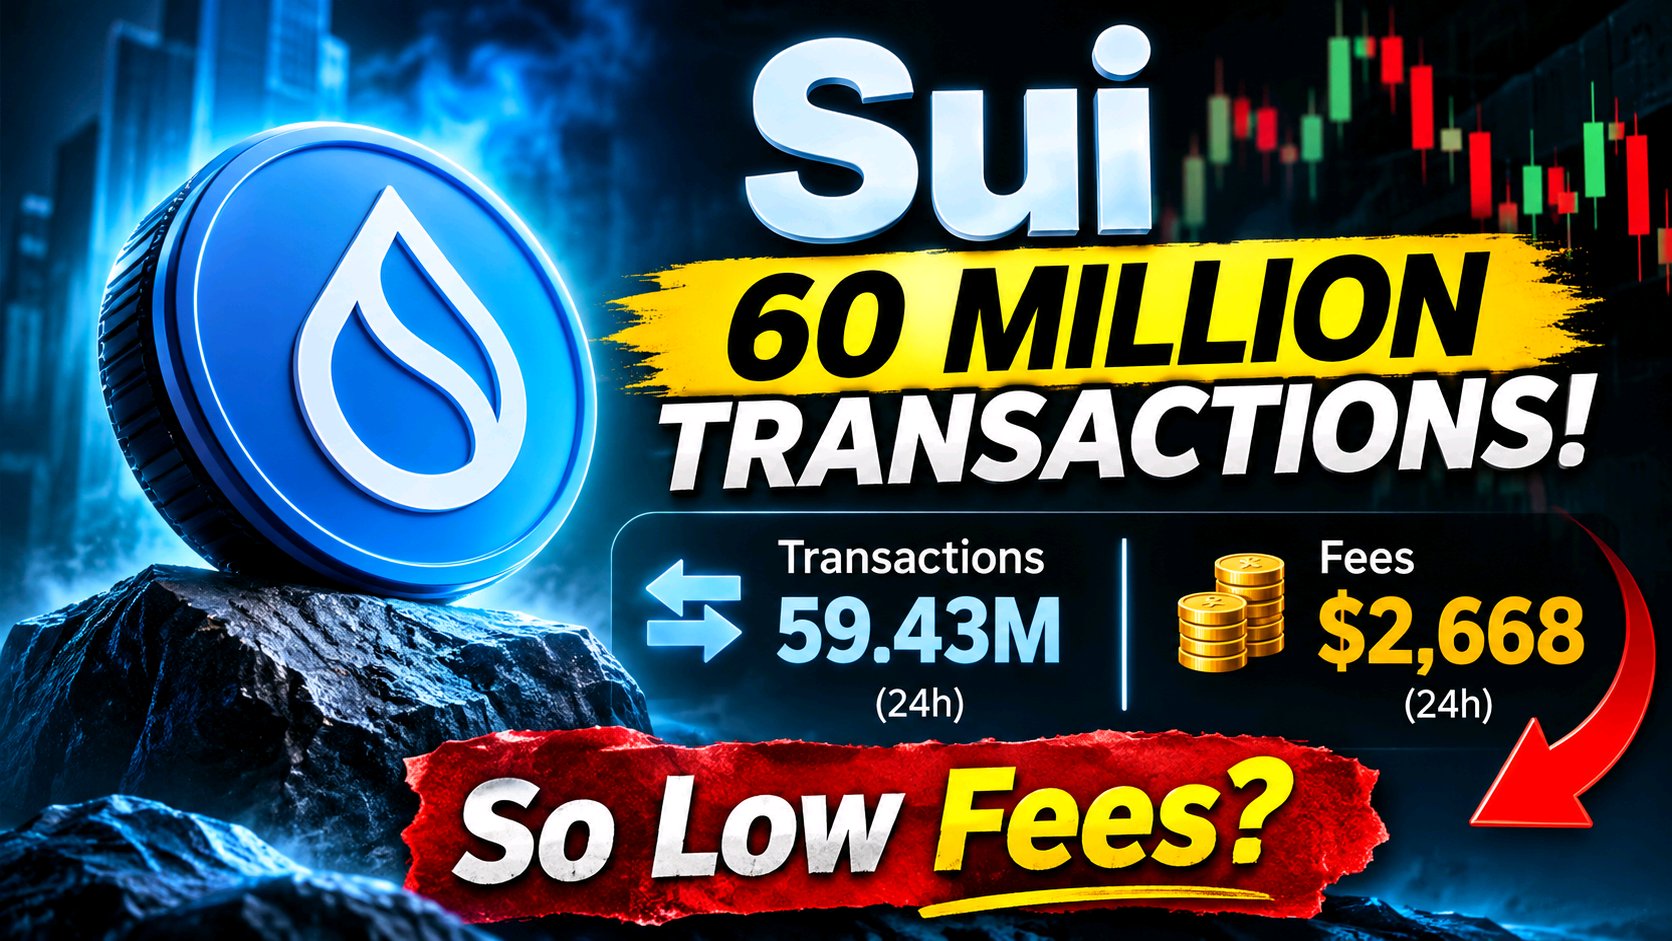
Suiは1日あたり6000万件近いトランザクションを処理していますが、ネットワーク手数料が示す現実は驚くほど異なります。 その対比は、SUIの価格に関する議論以上に注目に値します。 DefiLlamaの11月13日のデータによると、Suiは24時間で約5943万件のトランザクションを記録しましたが、チェーン手数料の生成額はわずか2,668ドルでした。一方で、エコシステム全体のアプリケーションは、約14万2283ドルの手数料を生成しています。 この違いは重要です。 Suiのアーキテクチャは、高スループットかつ低コストのトランザクションを実現するように設計されています。これは、頻繁なオンチェーンアクティビティを必要とするアプリケーションにとって、真の競争優位性です。 しかし、トランザクションのボリュームだけで経済的価値が決まるわけではありません。 より大きな疑問は、そのアクティビティのうちどれだけがSUI自体の持続的な需要を生み出しているかという点です。トークンはガス代、ステーキング、ガバナンスに必要ですが、ネットワークの使用が自動的にトークンの価値獲得に比例するわけではありません。 チャートには別の懸念もあります。0.8040ドルという水準では、SUIは4時間足の14期間EMAおよび28期間EMAを下回ったままです。RSIは中立に向けて回復しつつありますが、MACDはわずかにネガティブな状態が続いています。 したがって、注目すべき点は2つあります。ネットワークのアクティビティが経済的に意味のあるものになるかどうか、そして買い手が下降トレンドにある移動平均線を奪還できるかどうかです。 Suiはスループットの面では勝っているかもしれません。より長期的なテストは、その成功がネイティブトークンのより強い経済的需要へと結びつくかどうかです。 $SUIUSDT #IMPACTbyTrade
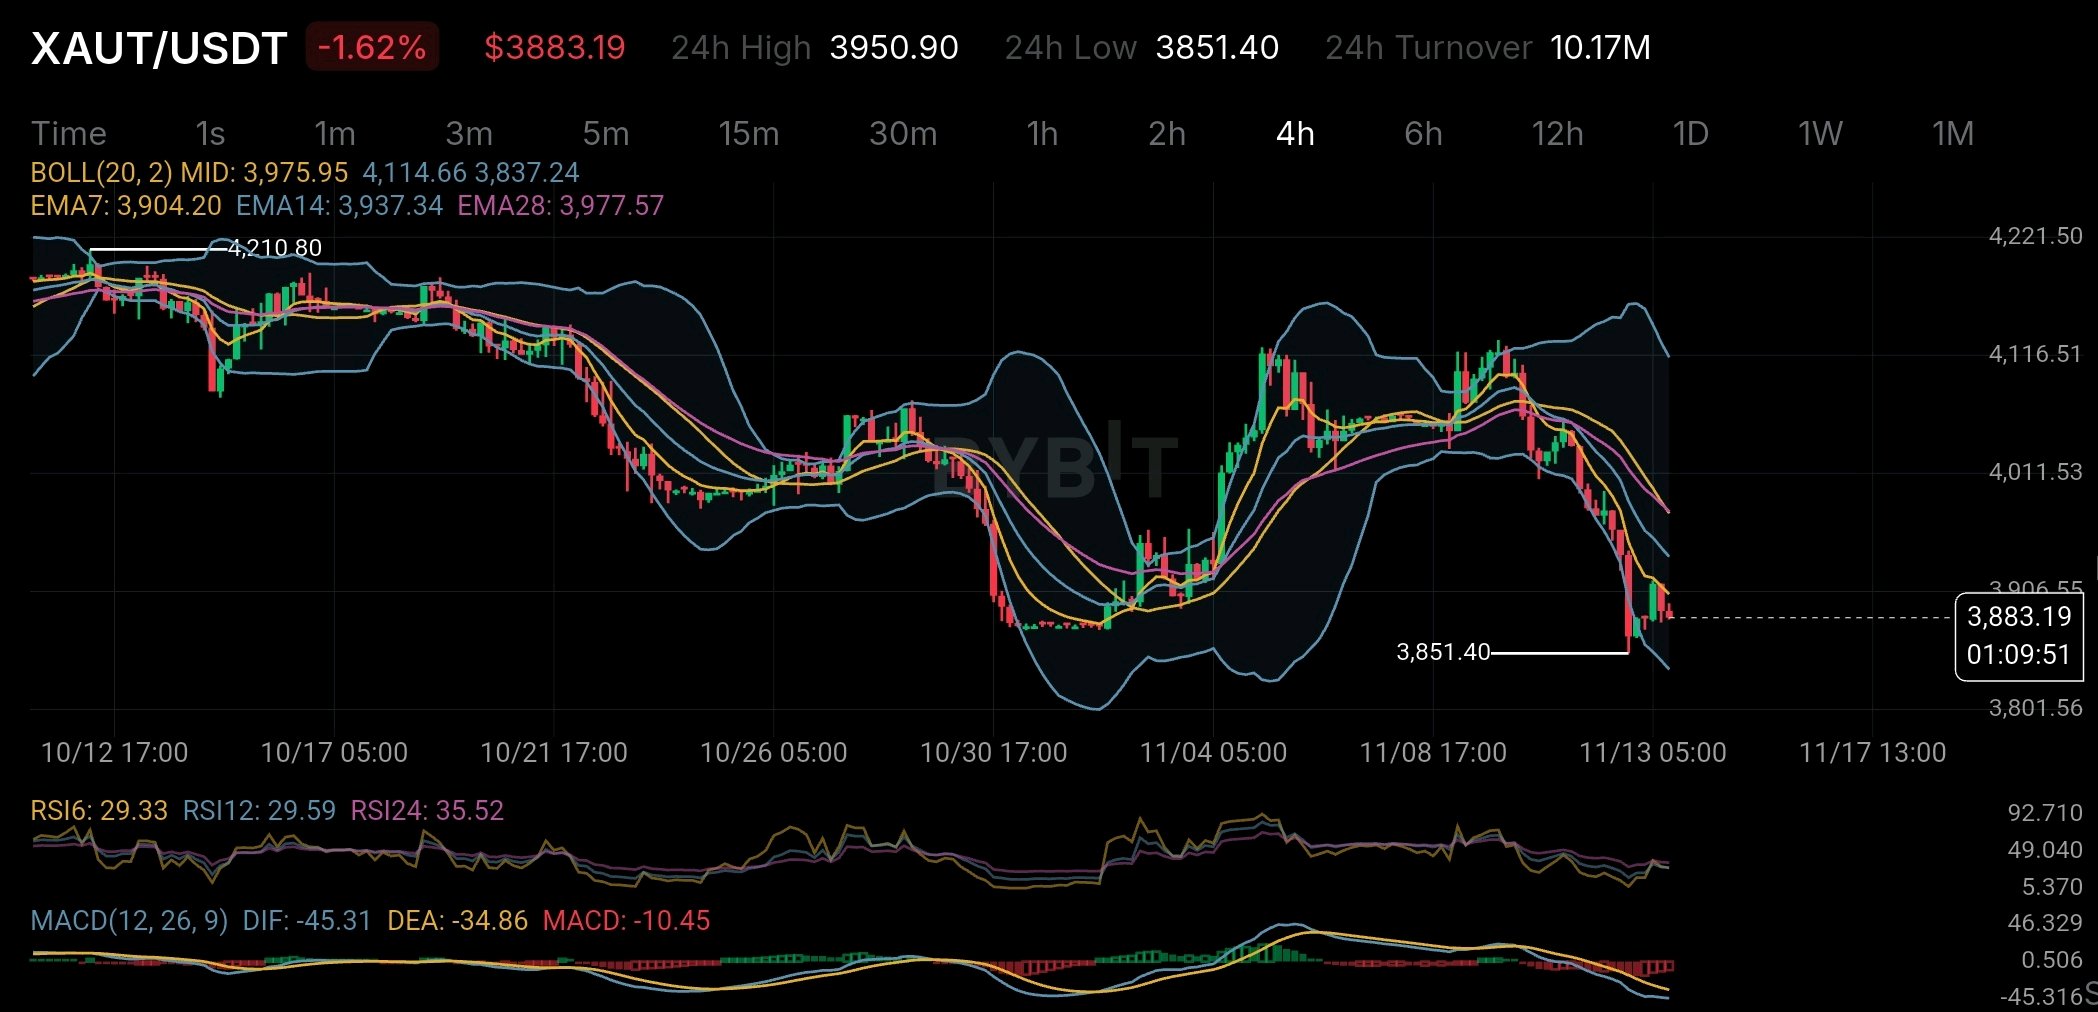
XAUTについて調べていたのですが、最近の価格変動以外で気になった点があります。 Tether Goldの2026年9月30日付けの準備金報告書によると、827,417.63 XAUTが、同量である827,417.63ファイントロイオンスの現物金に裏付けられていました。 一見シンプルに見えますが、もう一つ注目すべき詳細があります。 発行済み総供給量のうち、709,323.66 XAUTがすでに販売済みであり、残りの118,093.97トークンは関連会社であるAlpha Group Commoditiesを通じて販売可能となっています。 これは発行済み総供給量の約14.3%にあたります。 売り圧力が来るなどとは言いません。しかし、保有者は念頭に置いておくべきことだと思います。需要が変化し始めたとき、供給可能量は重要になります。 検証面では、KPMGが最近発行体の2025年度財務諸表の独立監査を完了しており、BDOの2026年9月の準備金保証報告書も報告日時点での金による裏付けを確認しています。 さて、4時間足チャートを見ると、特に強い動きではありません。 XAUTは約3,883ドルで取引されており、EMA7、EMA14、EMA28の3つのEMAすべてを下回っています。RSIは29付近で推移しており、MACDもマイナス圏です。 現状、モメンタムは明らかに弱気です。RSIは売られすぎの状況を示唆していますが、それだけで反転と呼ぶには不十分です。 個人的には、金の需要がどう展開するか、そして販売可能なXAUT供給量が要因となるかどうか、この2点を注視したいと思っています。 トークンの背後に現物金があることと、その背後にある供給力学を理解することは別物です。 私がもっと注目すべきだと思うのはその点です。 $XAUTUSDT #IMPACTbyTrade

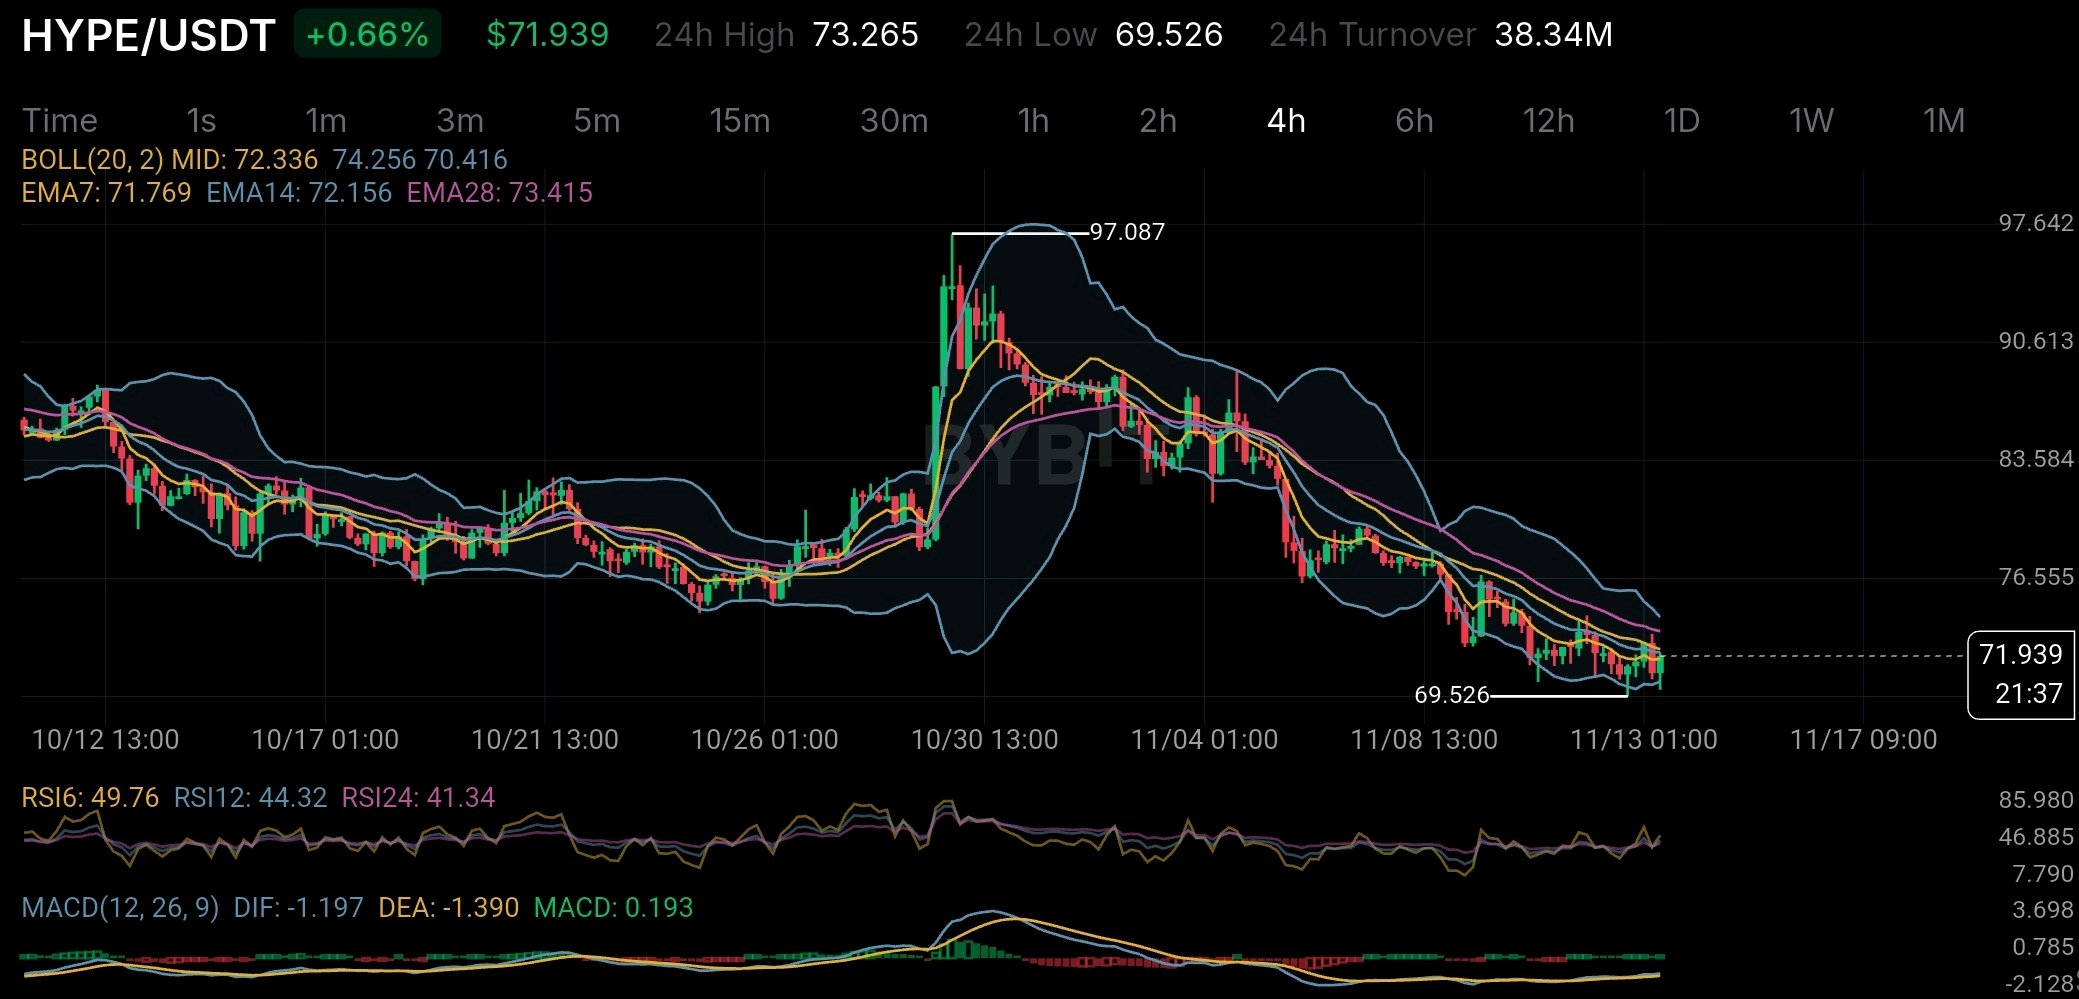
HYPEについて興味深い点は、そのバイバック(自社株買い)とバーン(焼却)のメカニズムが、実際にHyperliquid上で発生するアクティビティに結びついていることだ。しかし、トレーダーが無視すべきではない、この話のもう一つの側面がある。 Hyperliquidの2026年9月のSEC提出書類によると、プロトコル手数料の99%は「Assistance Fund(支援基金)」に充てられ、その資金を使って公開市場からHYPEが買い戻されている。 9月8日までに約4,710万HYPEが恒久的にバーンされた。これは当初の供給量10億の約4.7%に相当する。 これはかなりの量であり、プラットフォームのアクティビティとトークン需要の間に直接的なリンクを生み出している。取引アクティビティが増えれば手数料も増え、それがHYPEのさらなる買い戻しとバーンにつながる可能性がある。 ポジティブに聞こえるだろうか?ただ、一つ心に留めておくべきことがある。 HYPEの最大供給量は10億トークンだ。そのうち約38.9%が将来のコミュニティ排出と報酬に割り当てられ、さらに23.8%がコア貢献者に割り当てられている。 したがって、バーンメカニズムは供給量の削減には寄与するものの、売り圧力が単純になくなるわけではない。新規トークンの発行や将来の排出は依然として重要な要素だ。 4時間足チャートを見ると、HYPEは71.94ドル付近で推移しており、EMA14(72.16ドル)やEMA28(73.42ドル)を依然として下回っている。ボリンジャーバンドの中央線も72.34ドル付近にある。 直近の安値69.526ドルが、私がサポートとして注目しているラインだ。 いくつか励みになる兆候もある。RSIが回復し始めており、MACDヒストグラムもわずかにプラスに転じた。売り圧力は緩和しつつあるかもしれないが、まだトレンド転換と呼ぶには早いだろう。 私のトレードセットアップは以下の通り: 私は強気のブレイクアウトの可能性を求めて、72.3ドル〜73.4ドルのゾーンを注視している。ロングエントリーを検討する前に、このエリアを上回るしっかりとした4時間足の終値を確認したい。 もしブレイクアウトが維持され、価格がこのゾーンを再テストできれば、次に注目すべき上値レベルは76.55ドル、その次は83.58ドルとなる。 一方で、69.526ドルが重要なサポートラインだ。このレベルを下回れば、私の強気な回復シナリオは無効となり、トレードを再検討することになる。 ここで緑のローソク足を追っかけたくはない。正確な底値を拾おうとするよりも、確認が重要だ。 長期的には、結局のところ単純な話だ。Hyperliquidは、市場に流入する新規供給を上回るバイバック需要を維持できるほど経済的アクティビティを生み出せるだろうか? トークンをバーンすることと、排出が続く中で需要を維持し続けることは全く別の課題だからだ。 私がHYPEで注目しているのはそこだ。単なるバーンの数字だけでなく、実際の事業活動が長期にわたってトークンを支えられるかどうかを見ている。 $HYPEUSDT #IMPACTbyTrade

Bitcoin is facing a combination that deserves more attention than an oversold RSI: aggressive long liquidations and weakening institutional demand. Looking at the BTC/USDT 4-hour chart, the selling pressure is difficult to ignore. BTC is trading around $68,823, down 6.66%, after touching $67,563. The price has broken below the lower Bollinger Band at $69,738, while EMA 7, EMA 14 and EMA 28 are all sitting above the market. But the technical picture is only half the story. According to available derivatives data, Bitcoin experienced roughly $352 million in liquidations over 24 hours, with approximately $346 million coming from long positions. That's a massive imbalance. It suggests leveraged buyers were caught on the wrong side, and forced selling likely accelerated the decline. There's another detail worth watching: institutional flows. US spot Bitcoin ETFs recorded six consecutive days of net outflows through November 12, totaling approximately $1.49 billion. When leveraged traders are being forced out while ETF investors are withdrawing capital, the market loses two potential sources of buying support simultaneously. This is why I wouldn't treat an extremely low RSI as an automatic buying signal. The 4-hour RSI readings are particularly stretched: RSI 6 is 5.54, RSI 12 is 15.01 and RSI 24 is 24.78. A relief bounce wouldn't be surprising, but oversold conditions can persist during strong downtrends. For me, $67,563 is the immediate level to watch. A sustained breakdown could expose BTC to another leg of selling. On the recovery side, $70,900 and $72,100 are important EMA resistance areas. Reclaiming them would be an early sign that sellers are losing control. The bigger question is whether fresh spot demand returns after this liquidation wave. Bitcoin doesn't necessarily need more leveraged buyers right now. It needs buyers willing to absorb actual selling pressure. An oversold market can produce a bounce. But only sustained demand can build a recovery. $BTCUSDT #IMPACTbyTrade

ONDO is approaching a supply event that I think the market needs to pay more attention to. The next major token unlock is scheduled for January 18, 2027, and the amount involved is pretty significant. According to Tokenomics.com, around 1.71 billion ONDO tokens are expected to enter circulation on that date. That's 17.1% of the maximum supply and an estimated 35.1% of the current market cap. Here's what caught my attention: only around 48.7% of ONDO's 10 billion maximum supply is currently circulating. The rest is still subject to the vesting schedule. But there's more to this than just another token unlock. The upcoming distribution is allocated roughly 46.3% to the community, 38.6% to the foundation and 15.1% to private investors. That breakdown matters because unlocked tokens don't automatically mean selling pressure. Some could go toward ecosystem development, while others might eventually find their way onto exchanges. I also think there's something investors should understand about ONDO itself. According to its official documentation, ONDO is mainly a governance token for the Ondo DAO and Flux Finance. Being part of a growing real-world asset sector doesn't automatically mean token holders own the underlying tokenized assets or receive their yields. Now, looking at the chart, ONDO is trading around $0.3327 on the supplied 4-hour timeframe, down 6.75%. Price is below EMA7, EMA14 and EMA28, while RSI6 is around 16.72. That's deeply oversold in the short term, but it doesn't necessarily mean a reversal is coming. The overall structure is still showing lower highs and lower lows. There's another thing worth watching: derivatives activity is considerably higher than spot activity. CoinGlass reported roughly 3.8 times more futures volume than spot volume on November 13, alongside heavy long liquidations. My concern isn't that ONDO lacks a strong RWA narrative. It's whether demand for the token can keep up with the growing circulating supply while the market is already under pressure. An oversold RSI can lead to a bounce, but it doesn't fix a supply imbalance. For me, the real test isn't just whether buyers can defend $0.33. It's whether genuine demand can keep pace with the tokens entering circulation. $ONDOUSDT #IMPACTbyTrade