MaverickAlpha
Crypto Market Intelligence 📊 Clean charts. Real setups. Smart market reads. Price Action • Liquidity • Market Structure No hype — just the logic behind the trad
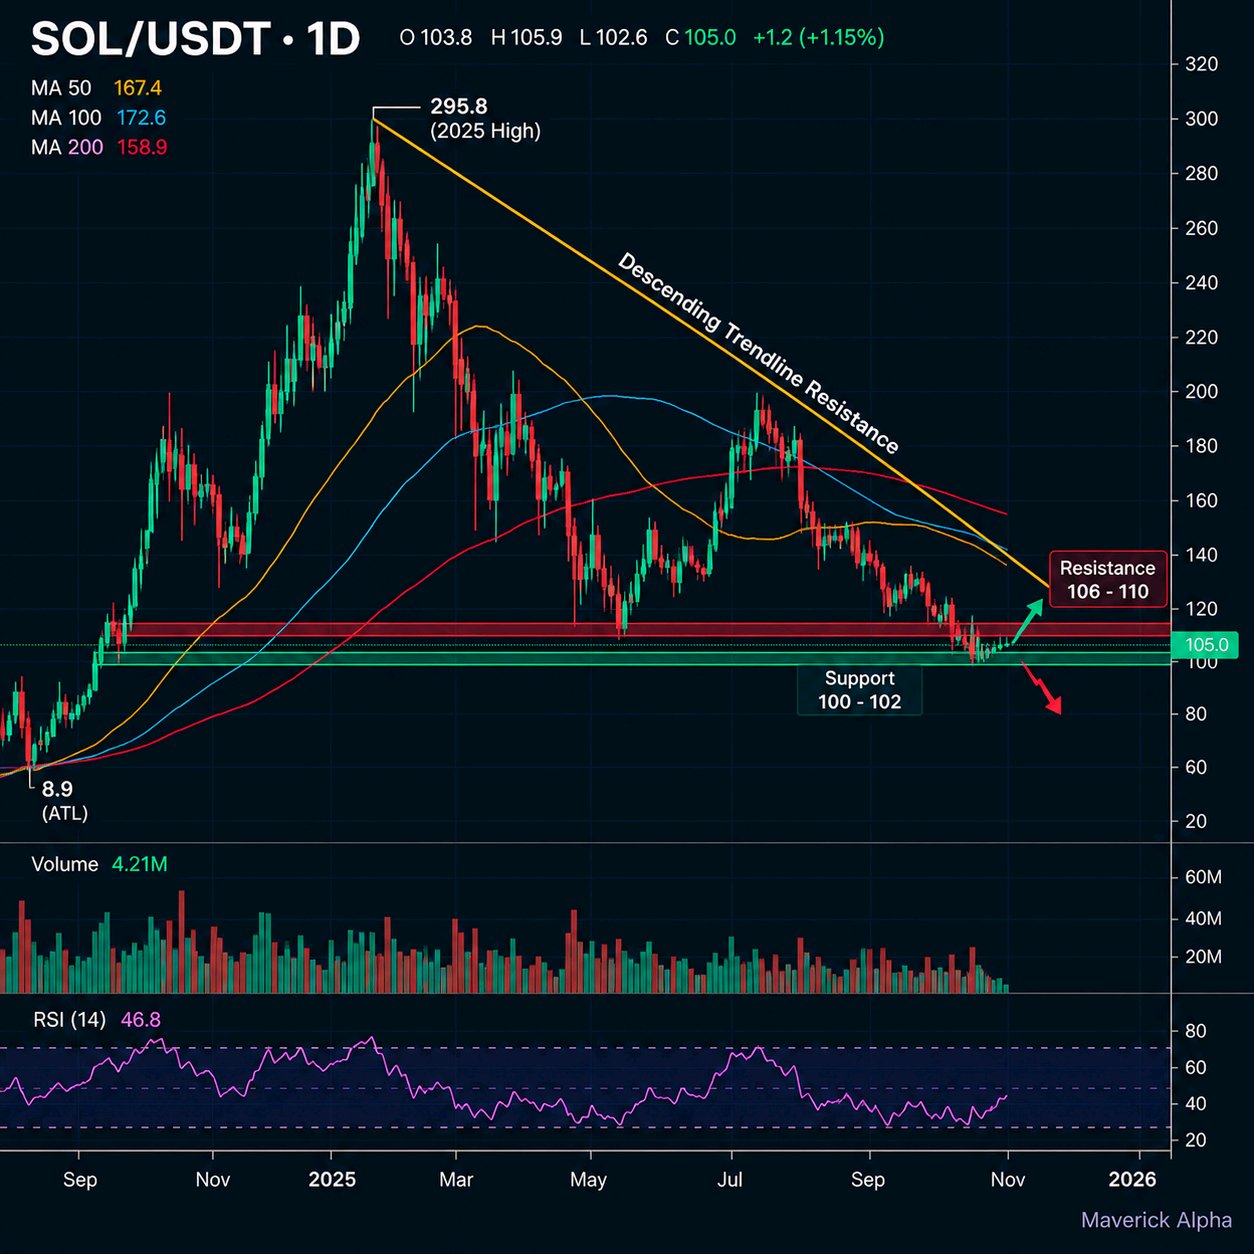
SOL: Real Adoption, But Price Still Under Pressure
Solana’s ecosystem keeps expanding, with institutional tokenization and payments gaining traction. Samsung Wallet is also preparing USDC transfers on Solana for millions of Galaxy devices. But SOL trades near $105, roughly 64% below its January 2025 all-time high. Infrastructure growth is encouraging, but it doesn’t guarantee token price recovery.Key levels: $100–$102 support; $106–$110 resistance. A sustained break above resistance would strengthen the recovery case. Losing $100 would weaken it. This is a watch, not a long. SOL needs sustained demand and stronger price structure—not just ecosystem headlines. #ByXIMPACT #BybitAIBestReplies $SOLUSDT
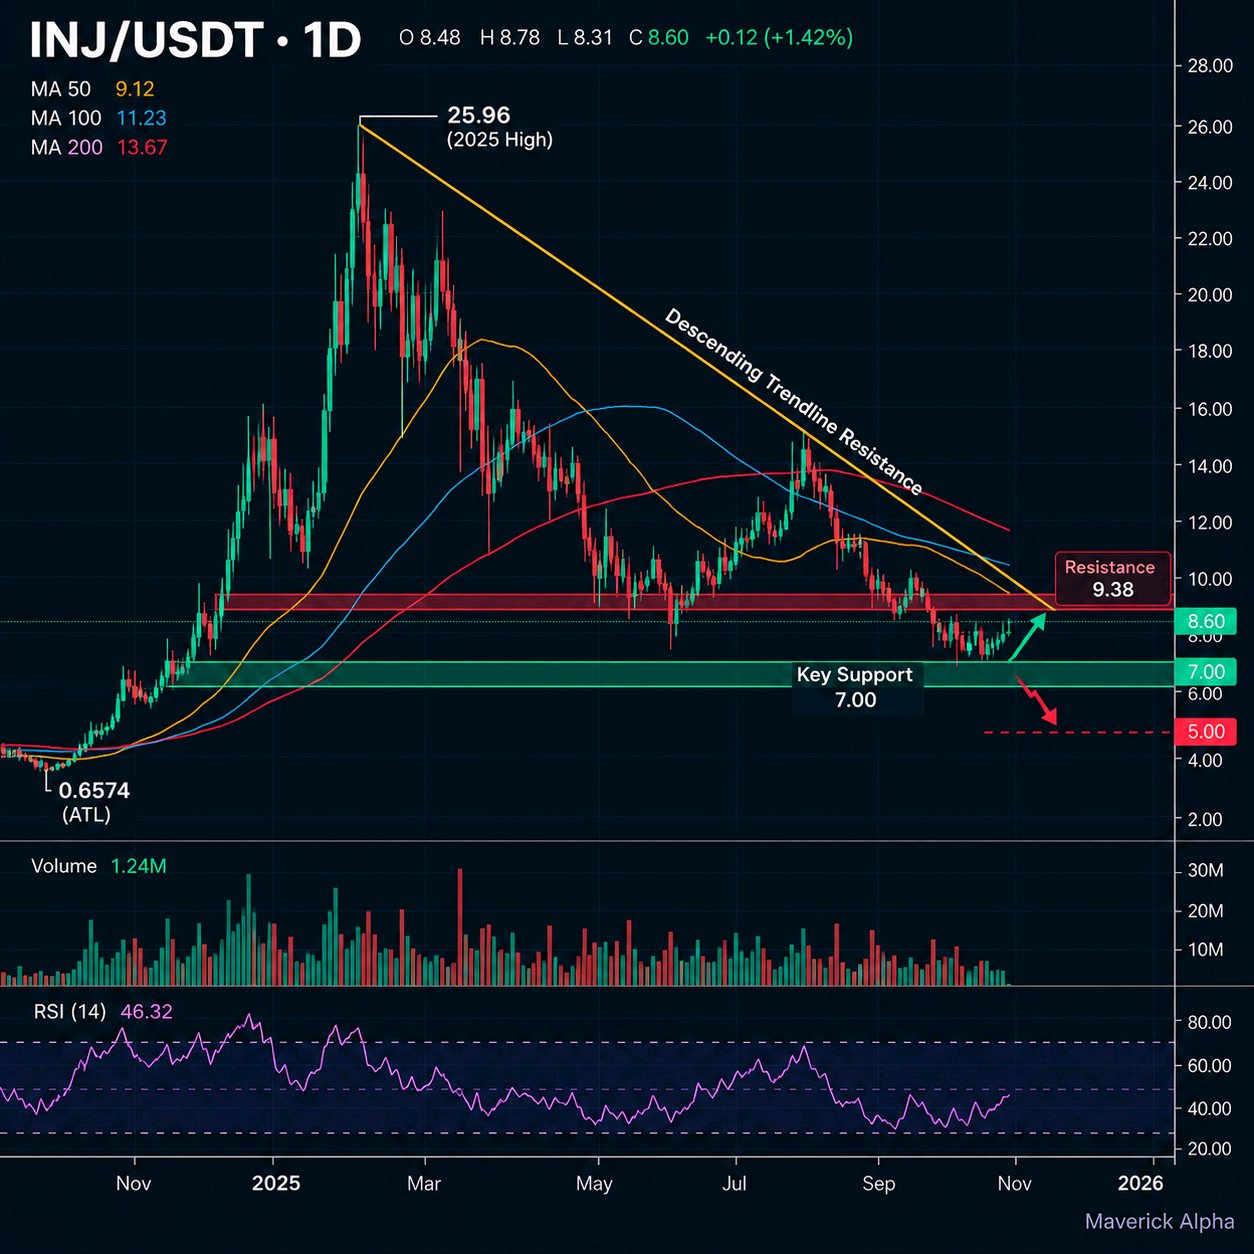
INJ: Stronger Infrastructure, Weaker Price
Injective keeps expanding its infrastructure, but INJ still trades near $8.60—about 67% below its 2025 high. EVM expansion, institutional validators, and a U.S. staked-INJ ETF filing add to the story. But announcements aren’t adoption. Sustained trading activity, RWA growth, and measurable token demand still need to prove themselves. This is a watch, not a long. $7.00 is the key support. Reclaiming $9.38 would be the first sign of improving momentum. Until usage and capital inflows strengthen, the thesis remains unproven. #ByXIMPACT $INJUSDT
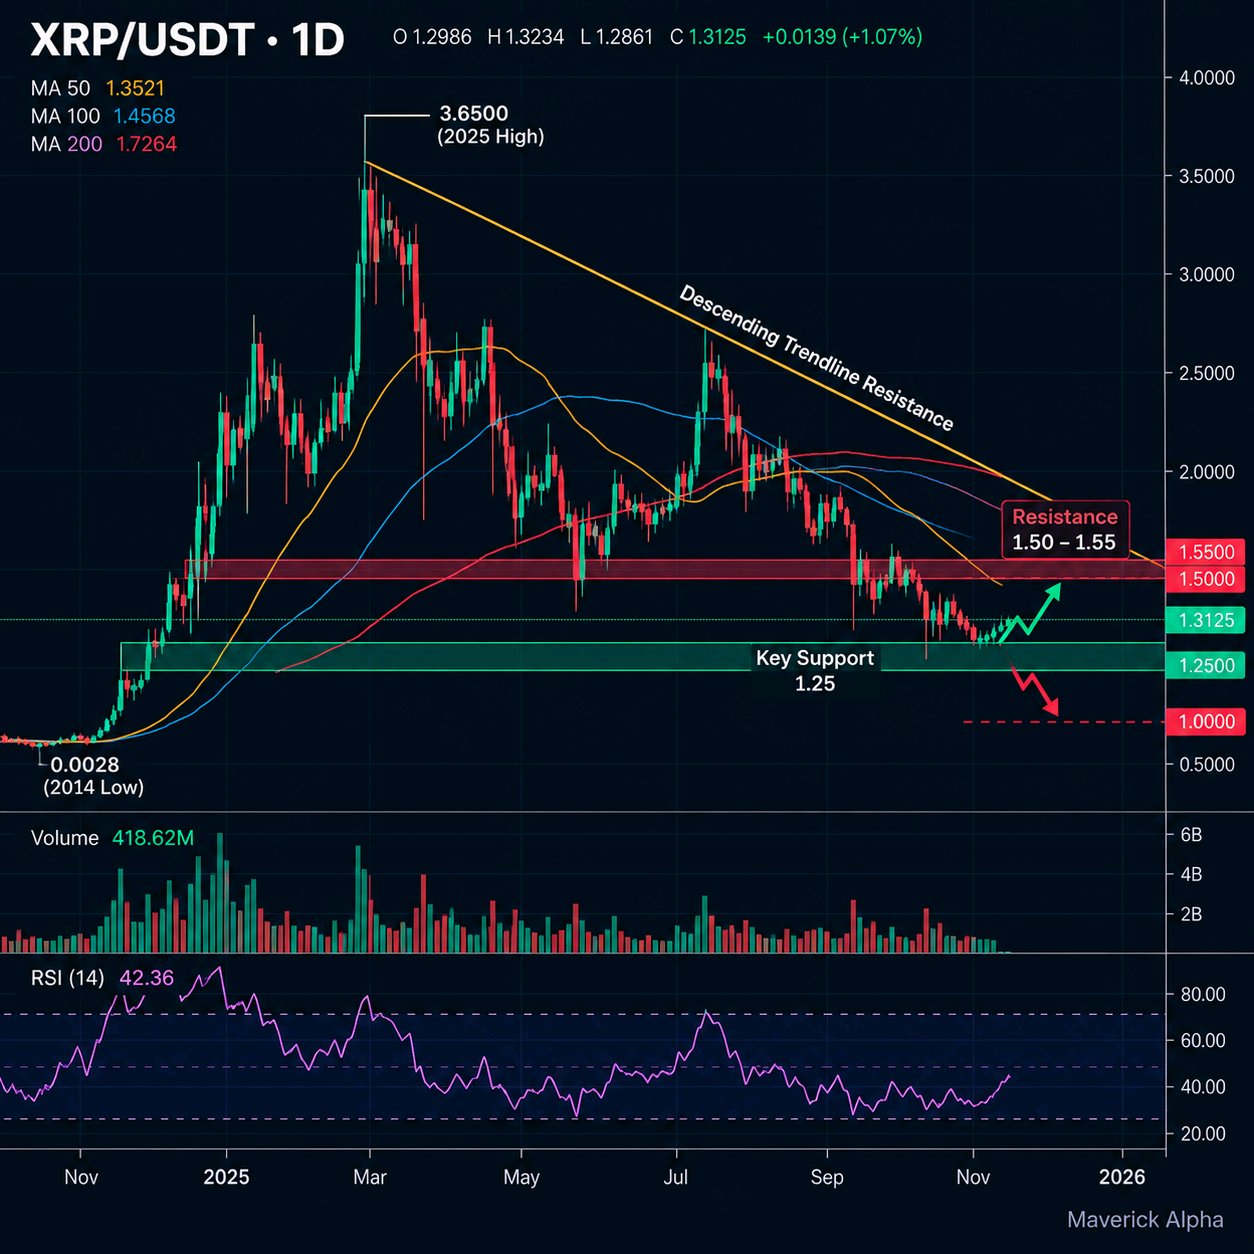
XRP HAS THE LICENSES | WHERE’S THE PRICE RESPONSE
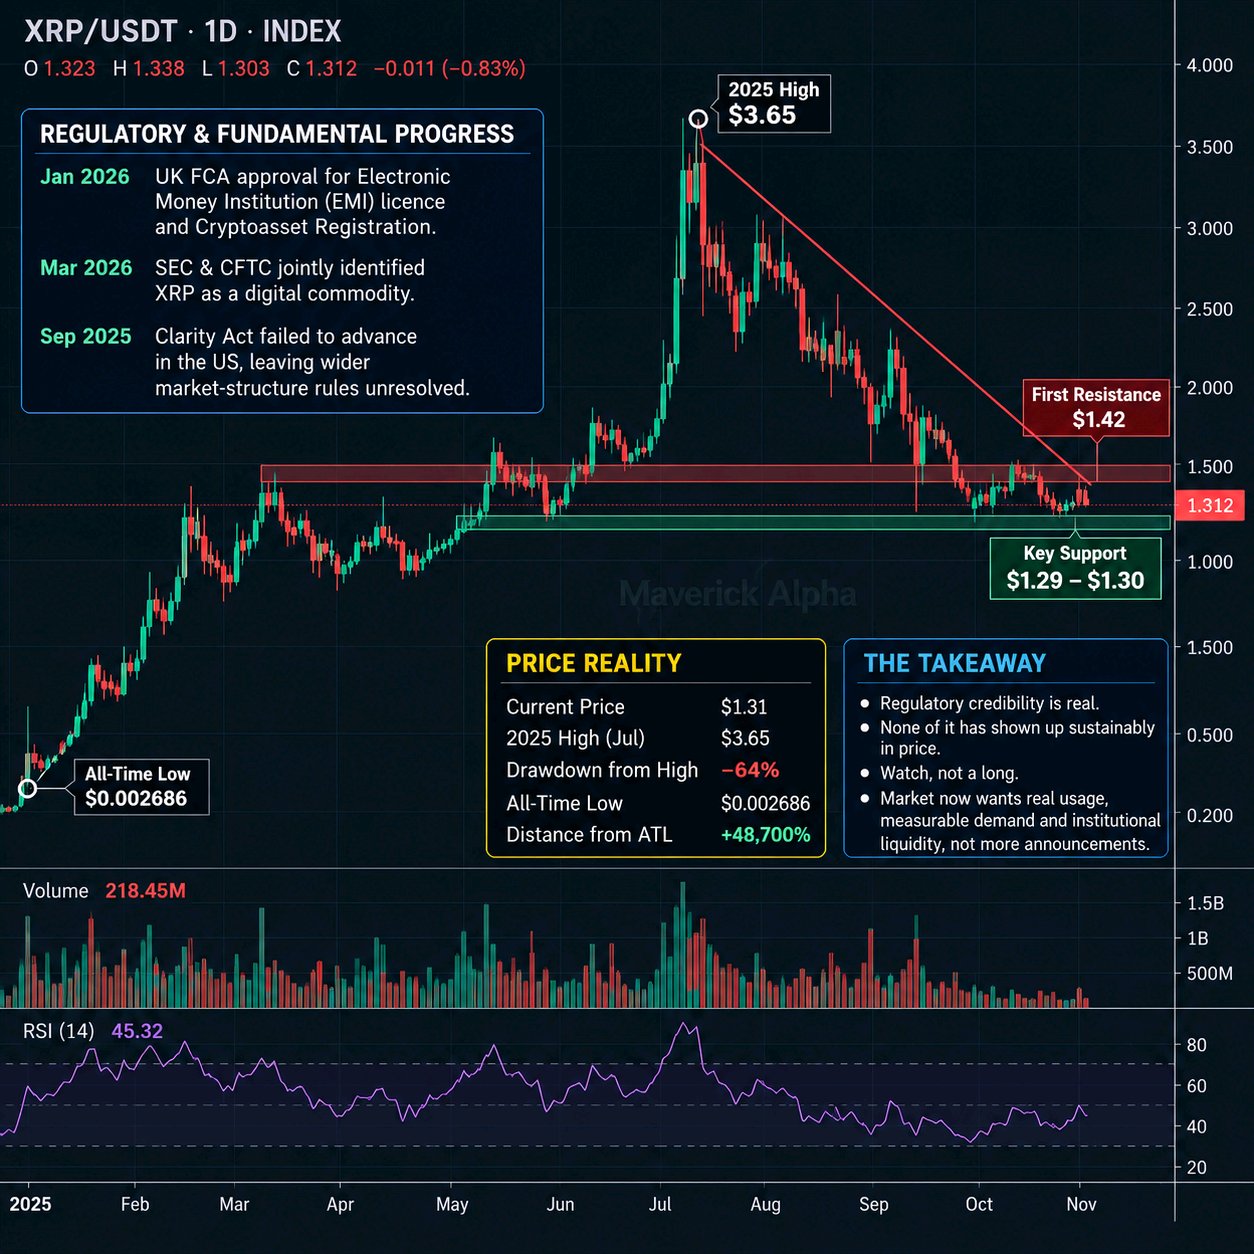
Ripple secured UK FCA EMI licensing and cryptoasset registration in January 2026, full EU EMI approval in February, and full MiCA CASP authorisation in Luxembourg in July. RLUSD also gained regulatory recognition in Dubai and Japan. These are meaningful milestones, but Ripple’s licences do not automatically translate into XRP demand. XRP trades near $1.31, roughly 64% below its July 2025 ATH of $3.65, yet more than 48,000% above its 2014 all-time low. The fundamental stack is expanding, but none of it has shown up convincingly in price. This is a watch, not a long. The level that matters is $1.25; a decisive breakdown risks further weakness. The first sign sentiment’s turning is a sustained reclaim of $1.50–$1.55. The market needs measurable XRP usage, deeper liquidity, and sustained demand—not more announcements. #ByXIMPACT #BybitStocks $XRPUSDT
BITCOIN’S RECOVERY ISN’T A REVERSAL YET
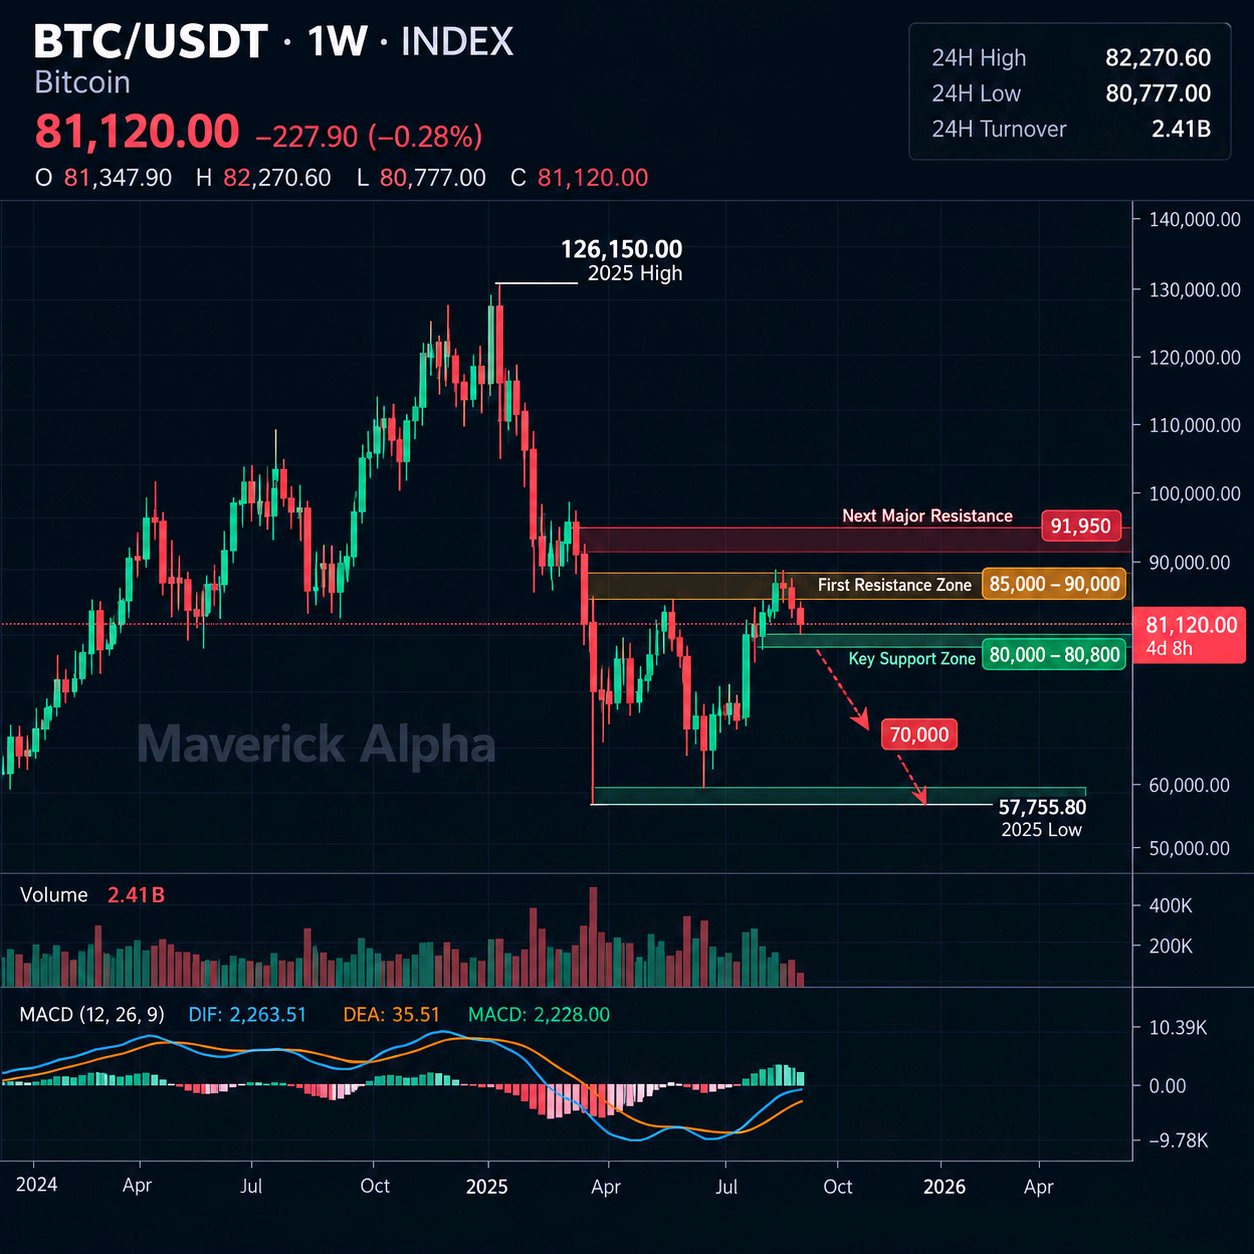
BTC is trading at $81,120 , down 0.28% on the day. The weekly chart shows a recovery from $57,755.80, but price remains well below the $126,150 peak—a 35.7% drawdown. The bounce is constructive, but the broader structure has yet to confirm a bullish reversal. Momentum is improving; confirmation is still missing. $80,000–$80,800 is the support zone that matters. A breakdown could expose $70,000, with the $57,755 low back in focus. On the upside, $85,000–$90,000 is the first resistance zone. A sustained breakout and successful retest would be the first sign sentiment is turning. Above that, $91,950 is the next hurdle. MACD recovery alone is not enough. BTC needs sustained buying pressure and a confirmed higher high. This is a watch, not a long. Wait for confirmation before committing capital. Protect risk; don't chase the bounce. #ByXIMPACT $BTCUSDC
XRP Has the Regulatory Progress.
Where’s the Price Reaction Ripple has built a regulatory position that many crypto projects still lack. Its UK regulatory approvals, US legal progress and growing institutional ambitions strengthen the long-term case for XRP. But regulatory credibility and token demand are two different things. Price remains the reality check. XRP’s key question is whether institutional access can translate into measurable demand, sustained XRPL activity and deeper liquidity. Announcements alone are no longer enough to move this market. This is a watch, not a long. The $1.29–$1.30 zone is the support area to watch; a decisive breakdown would weaken the setup. $1.42 is the first resistance. A clean reclaim would be the first sign sentiment’s turning. The catalyst is actual traction: live products, verifiable capital flows and growing network usage. Until those translate into price strength, the gap between Ripple’s progress and XRP’s market performance remains unresolved. #ByXIMPACT #BybitStocks $XRPUSDC
BITCOIN AT THE EDGE: BREAKOUT OR BREAKDOWN
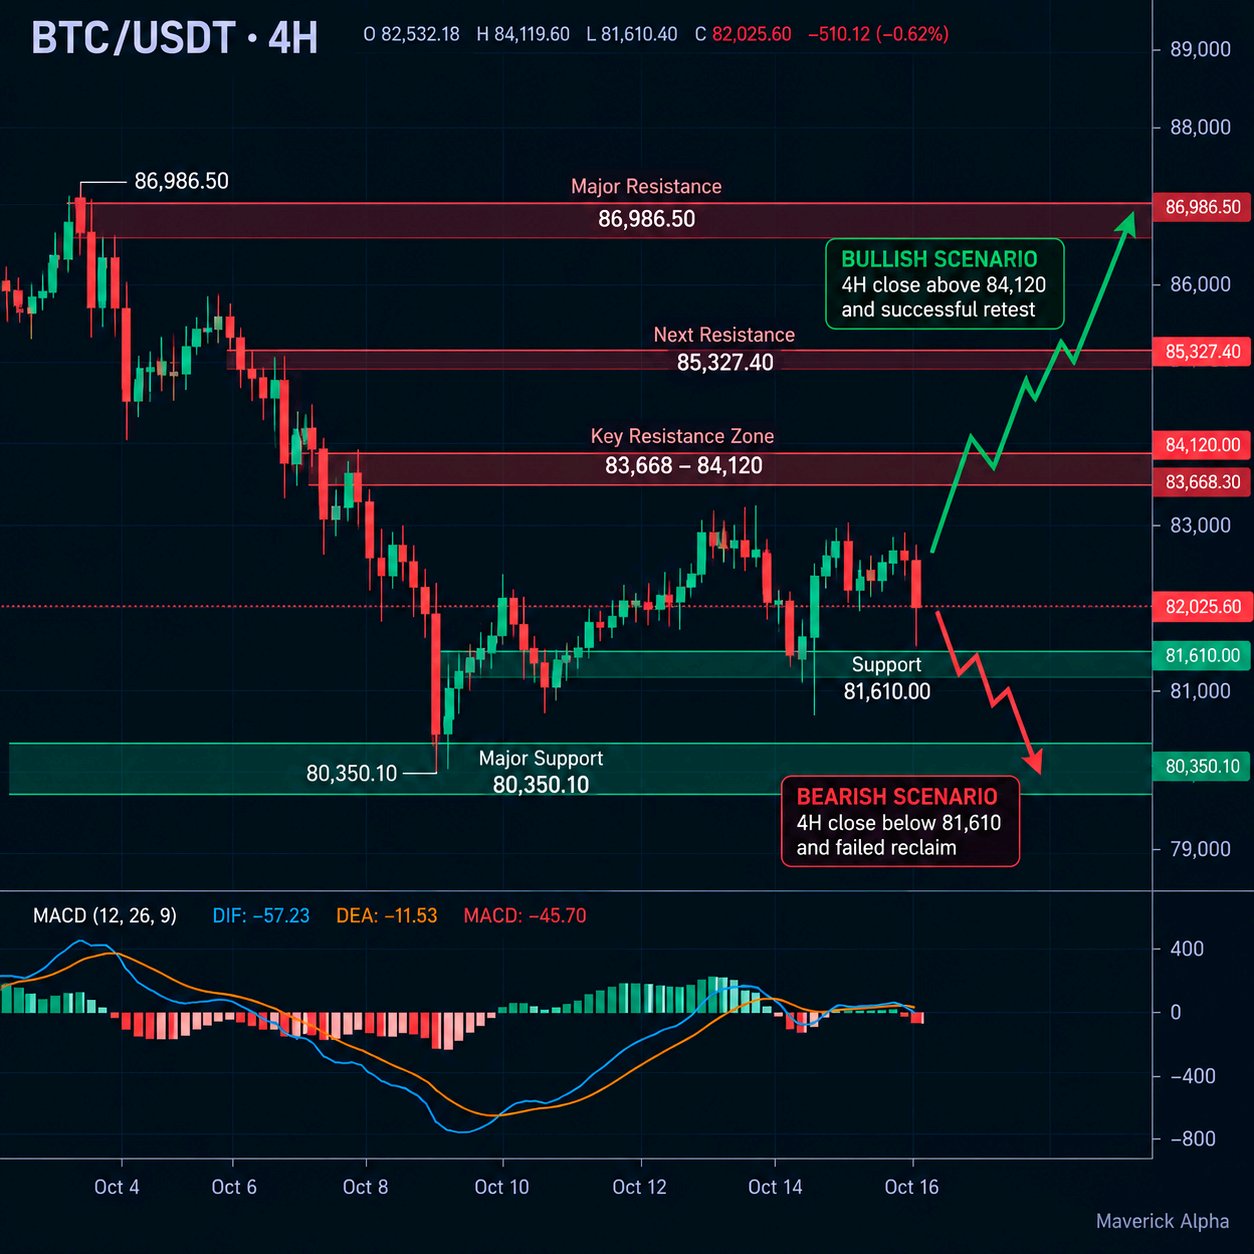
BTC is near $82,025, and the 4H chart is showing renewed selling pressure. The key battle is between $81,610 support and $83,668–$84,120 resistance. BUY scenario: A confirmed 4H close above $84,120, followed by a successful retest, could open the way toward $85,327 and $86,986. SELL scenario: A 4H close below $81,610 and a failed reclaim could send BTC toward $80,350. A breakdown of that low would strengthen the bearish case. MY FINAL TAKE: Bitcoin is at a decision point. Let confirmation lead; don’t chase either direction. #ByXIMPACT #BybitAIBestReplies $BTCUSDC
ETH’s Relief Rally Faces Its Biggest Test Yet
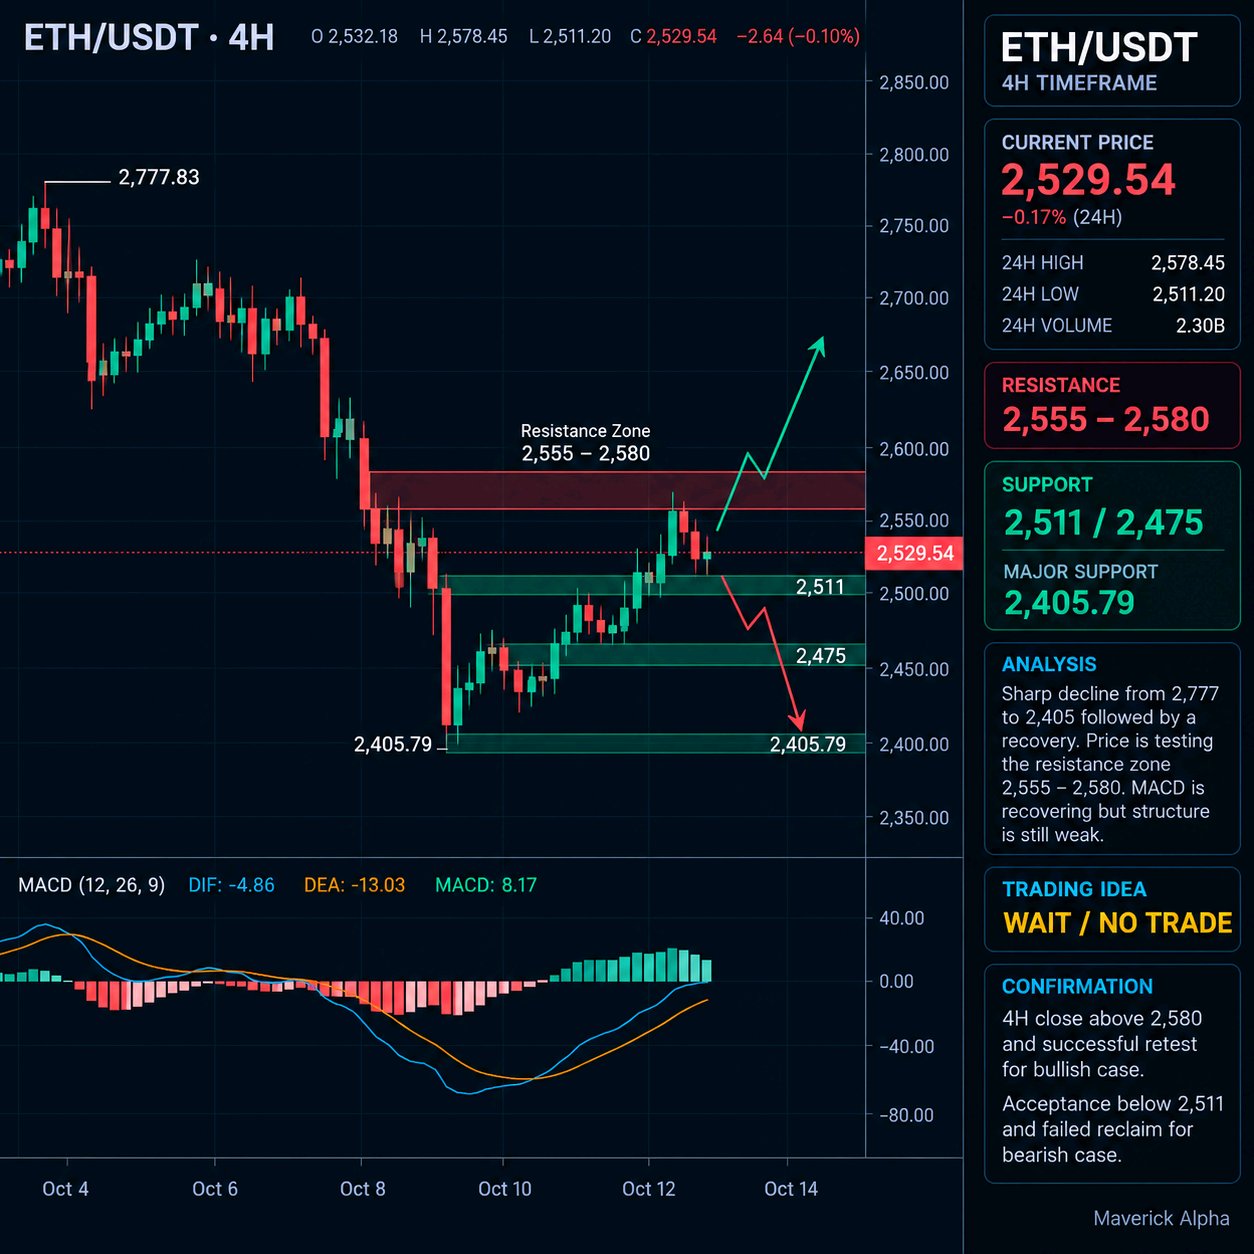
ETH bounced from $2,405, but buyers still have work to do. Price is now near $2,530, approaching the $2,555–$2,580 resistance zone. A 4H close above $2,580, followed by a successful retest, would strengthen the bullish case. If ETH loses $2,511, the recovery could weaken, bringing $2,475 and $2,405 back into focus. MY FINAL TAKE: I’m staying on the sidelines until price confirms a direction. No need to force a trade. #BybitOdds #BybitAIBestReplies $ETHUSDC
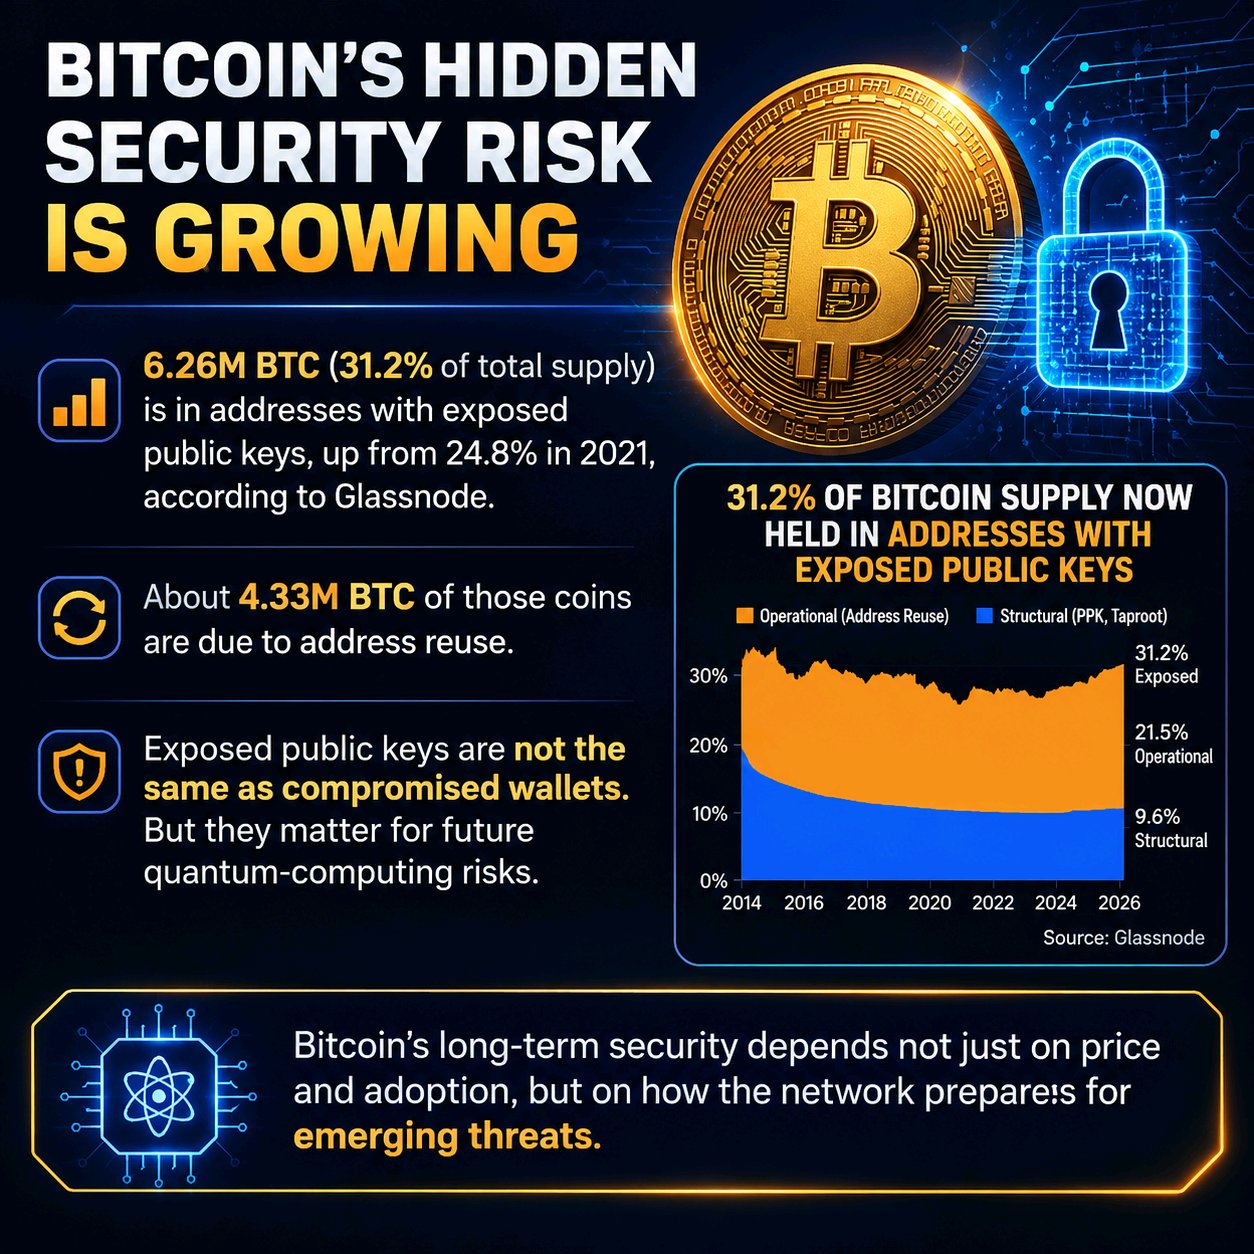
Bitcoin’s Hidden Security Risk Is Growing
Glassnode data shows 6.26M BTC (31.2% of total supply) sits in addresses with exposed public keys, up from 24.8% in 2021. Around 4.33M BTC is linked to address reuse. Exposed public keys are not the same as compromised wallets. But they matter in discussions about future quantum-computing risks. Bitcoin’s long-term security depends not just on price and adoption, but on how the network prepares for emerging threats. #BybitAIBestReplies #ByXIMPACT $BTCUSDC
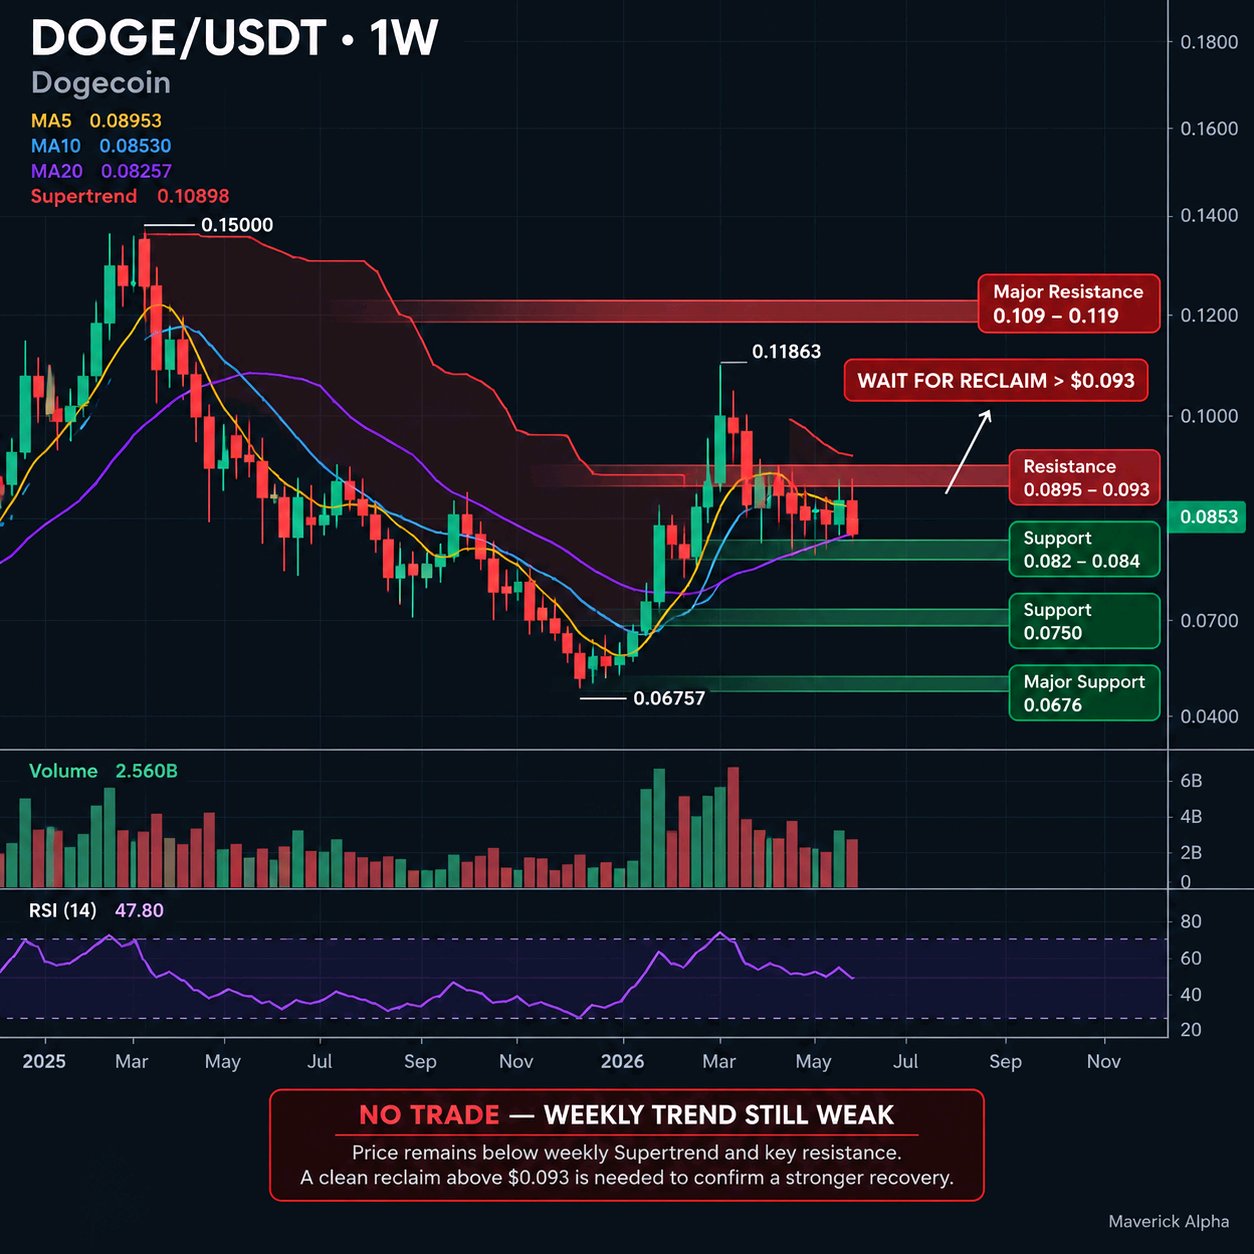
DOGE/USDT: Recovery Attempt or Another Rejection?
Dogecoin is trading around $0.0851, trying to stabilize after a prolonged weekly downtrend. Price has recovered from the $0.06757 low, but the latest candles suggest that buyers are struggling to push through overhead resistance. 📊 Weekly Technical Breakdown 🔹 Current Price: $0.08514 🔹 Immediate Support: $0.082–$0.084 🔹 Major Support: $0.075 🔹 Critical Support: $0.0676 🔹 Immediate Resistance: $0.0895–$0.093 🔹 Major Resistance: $0.109–$0.119 What matters next? DOGE is hovering near its short-term moving averages, while the weekly Supertrend remains bearish around $0.109. RSI is near 48, indicating relatively neutral momentum rather than a confirmed bullish reversal. A sustained weekly reclaim above $0.093, supported by strong buying volume, would be the first sign of improving structure. A stronger recovery would require DOGE to challenge the $0.109–$0.119 resistance zone. On the downside, losing $0.082 could weaken the current base and expose $0.075. A break below $0.0676 would put the broader recovery attempt at risk. Maverick Alpha Verdict: NO TRADE — WAIT FOR CONFIRMATION. The chart offers potential, but potential is not confirmation. Let price reclaim resistance before chasing a move, and watch how buyers respond at support. #BybitOdds #ByXIMPACT $DOGEUSDT
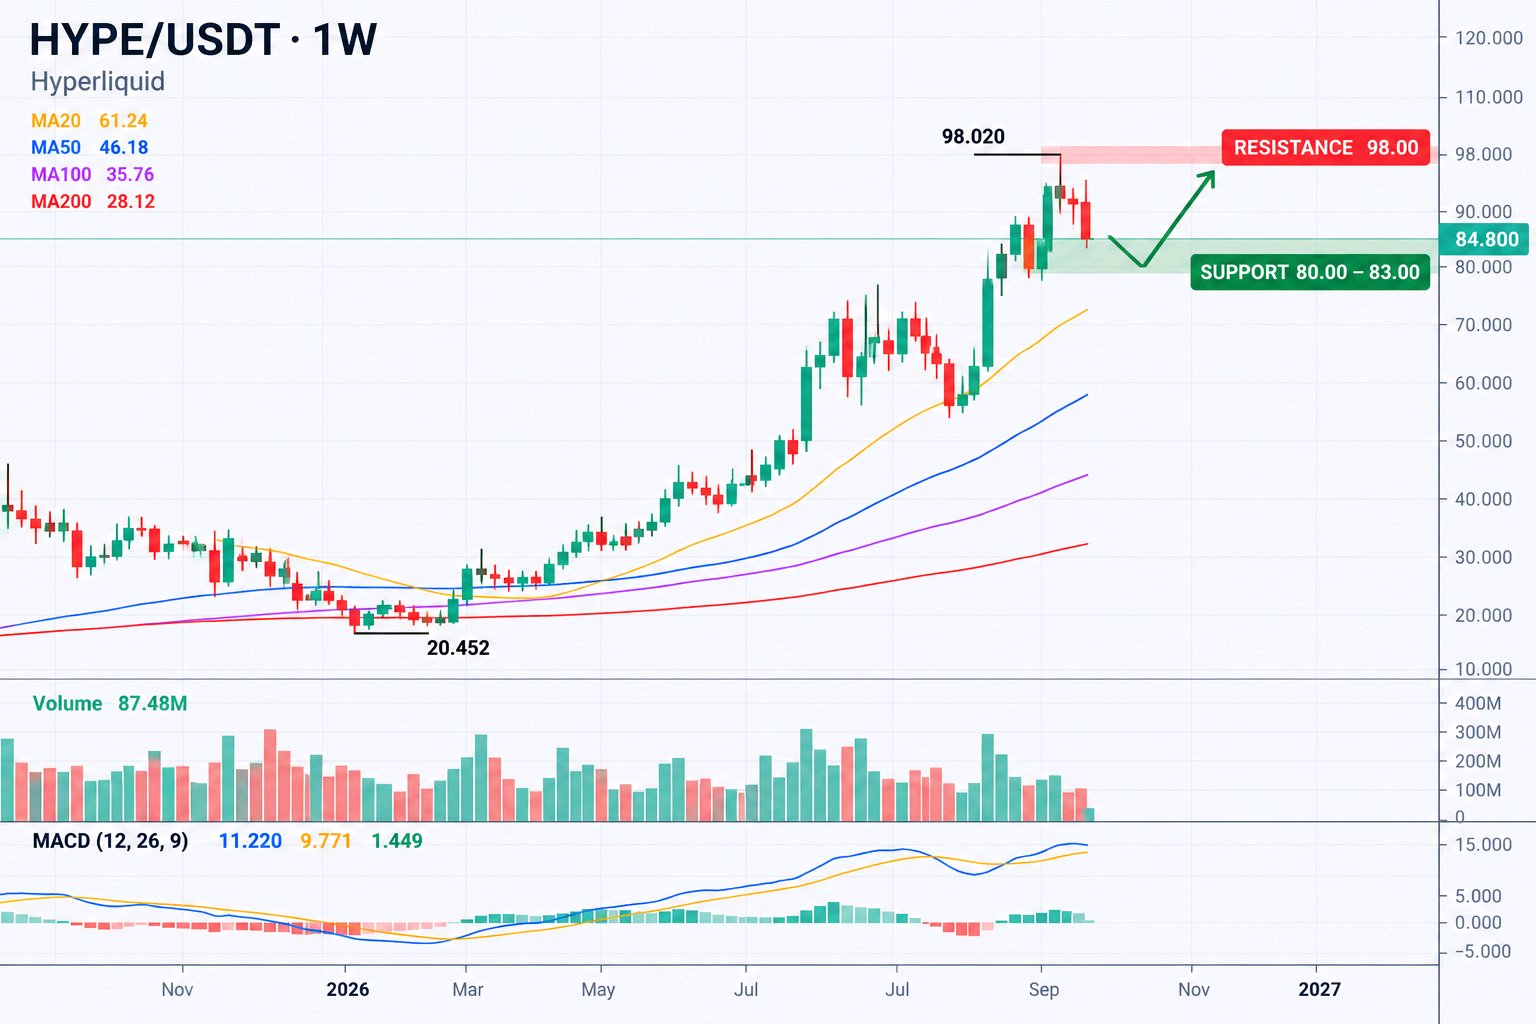
HYPE: $98 Breakout or Another Rejection?
Hyperliquid has moved beyond crypto-only trading. In 2025, it expanded its on-chain spot and perpetual markets; by May 2026, HIP-3 had generated over $250B in cumulative volume, extending trading into equities, commodities and indices. The protocol routes 99% of fees to its Assistance Fund for HYPE buybacks. These are live mechanisms, not roadmap promises. Now the price reality: HYPE trades near $84.80 on the supplied Bybit chart, roughly 13% below its September 2026 peak of $98.02. It remains dramatically above its $3.81 all-time low, so calling fundamentals invisible in price would be misleading. The issue is whether growth can sustain another leg. This is a watch, not a long. $80–$83 is the near-term support zone; losing it risks a deeper retracement. $98 is the first major resistance. The market needs sustained HIP-3 volume, durable fees and buybacks—not another announcement. #ByXIMPACT #BybitOdds $HYPEUSDT
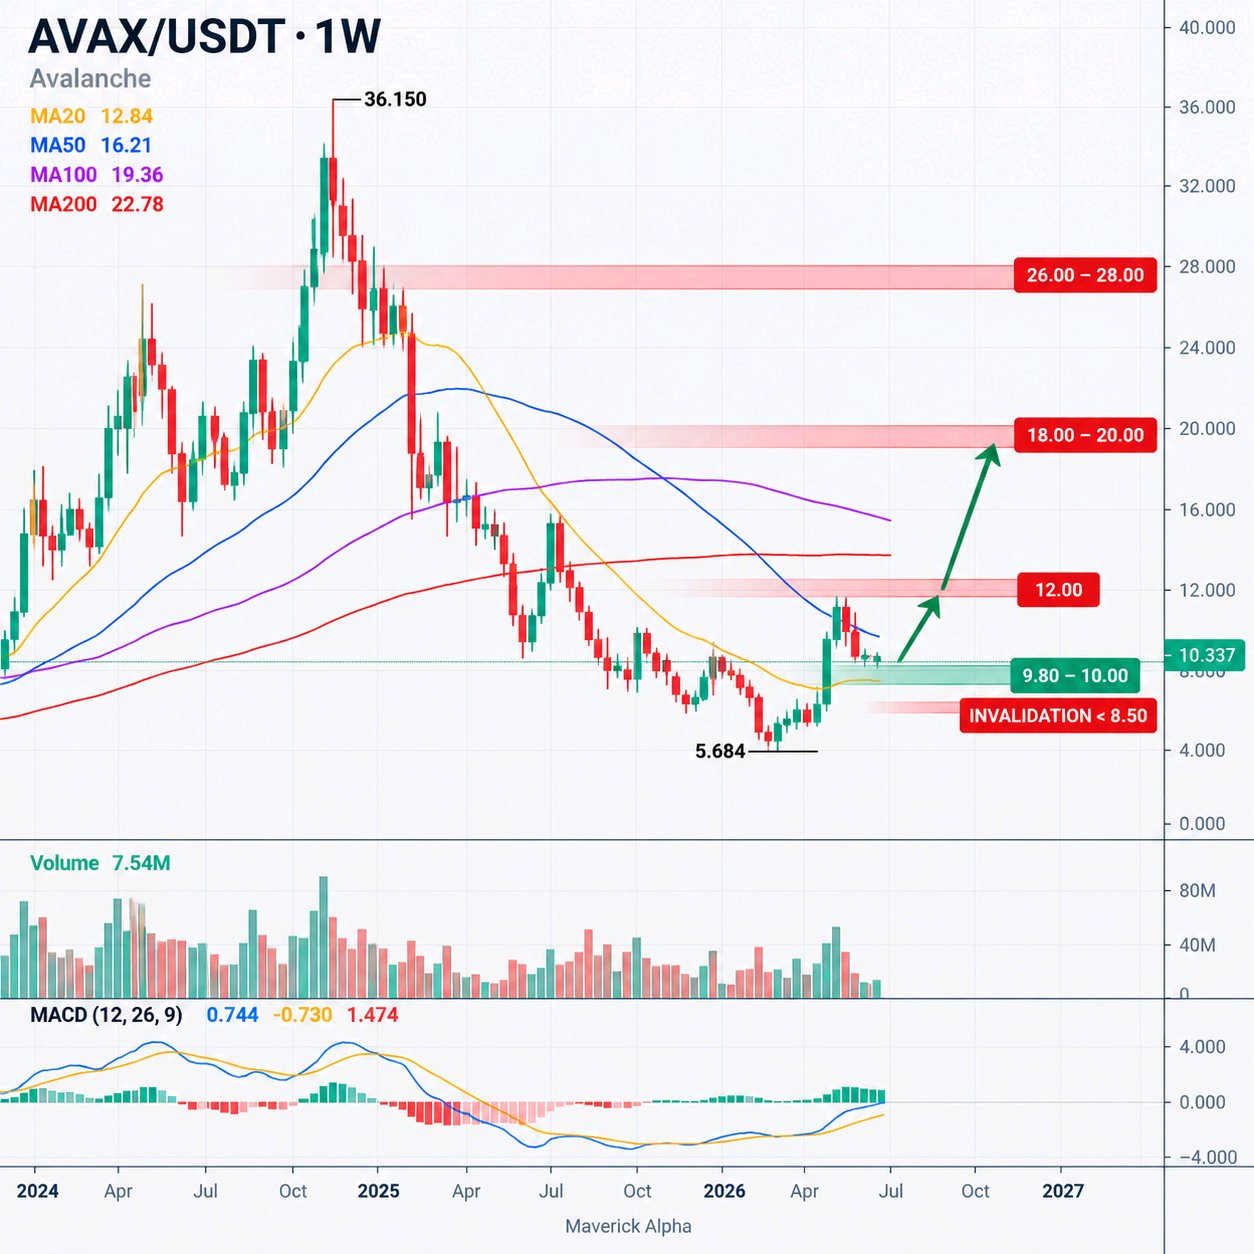
Avalanche Has the Institutional Access
Avalanche has spent the past year building a serious institutional case. Tokenized assets, regulated infrastructure and integrations with major financial players are helping strengthen its position in the RWA market. The ecosystem is growing, but AVAX holders are still waiting for that progress to translate into sustained price appreciation. AVAX is trading near $10.34, roughly 71% below its 2025 high of $36.15. The weekly chart shows a recovery from $5.68, but one bounce doesn’t confirm a lasting trend reversal. This is a watch, not a long. The $9.80–$10.00 zone is the level that matters. Losing it would weaken the recovery. Reclaiming $12 and holding it would be the first sign sentiment is turning. The market doesn’t need another announcement. It needs measurable RWA growth, real network usage and stronger demand for AVAX itself. #ByXIMPACT #BybitAIBestReplies $AVAXUSDT
Bitcoin’s Rebound: Breakout or Bull Trap?
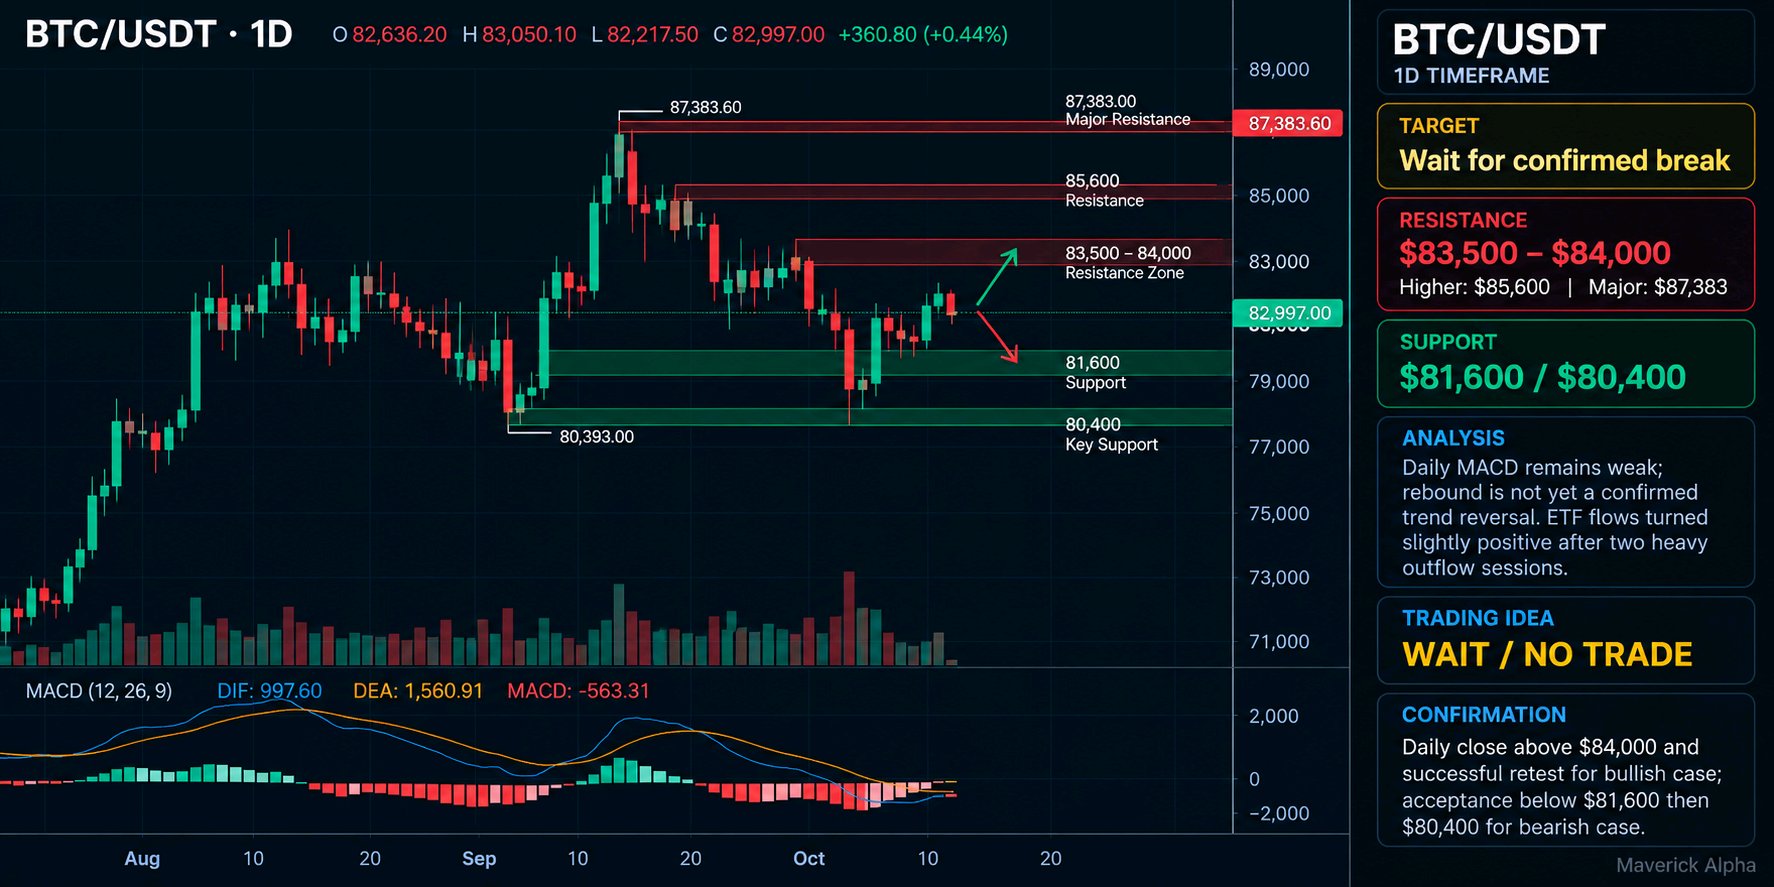
Current price: $82,997 Bitcoin is attempting a rebound, but daily MACD remains weak. U.S. spot Bitcoin ETFs recorded a $21.1M inflow on October 9, following roughly $729M in outflows over the previous two sessions. Resistance: $83,500–$84,000 Support: $81,600, then $80,400 Bullish confirmation: Daily close above $84,000 and a successful retest. Bearish confirmation: Lose $81,600 and fail to reclaim it. MY FINAL TAKE: The rebound needs confirmation. Avoid chasing price in the middle of the range. #ByXIMPACT #BybitAIBestReplies $BTCUSDT
SOLANA PULLS BACK: BUYERS MUST RECLAIM RESISTANCE!
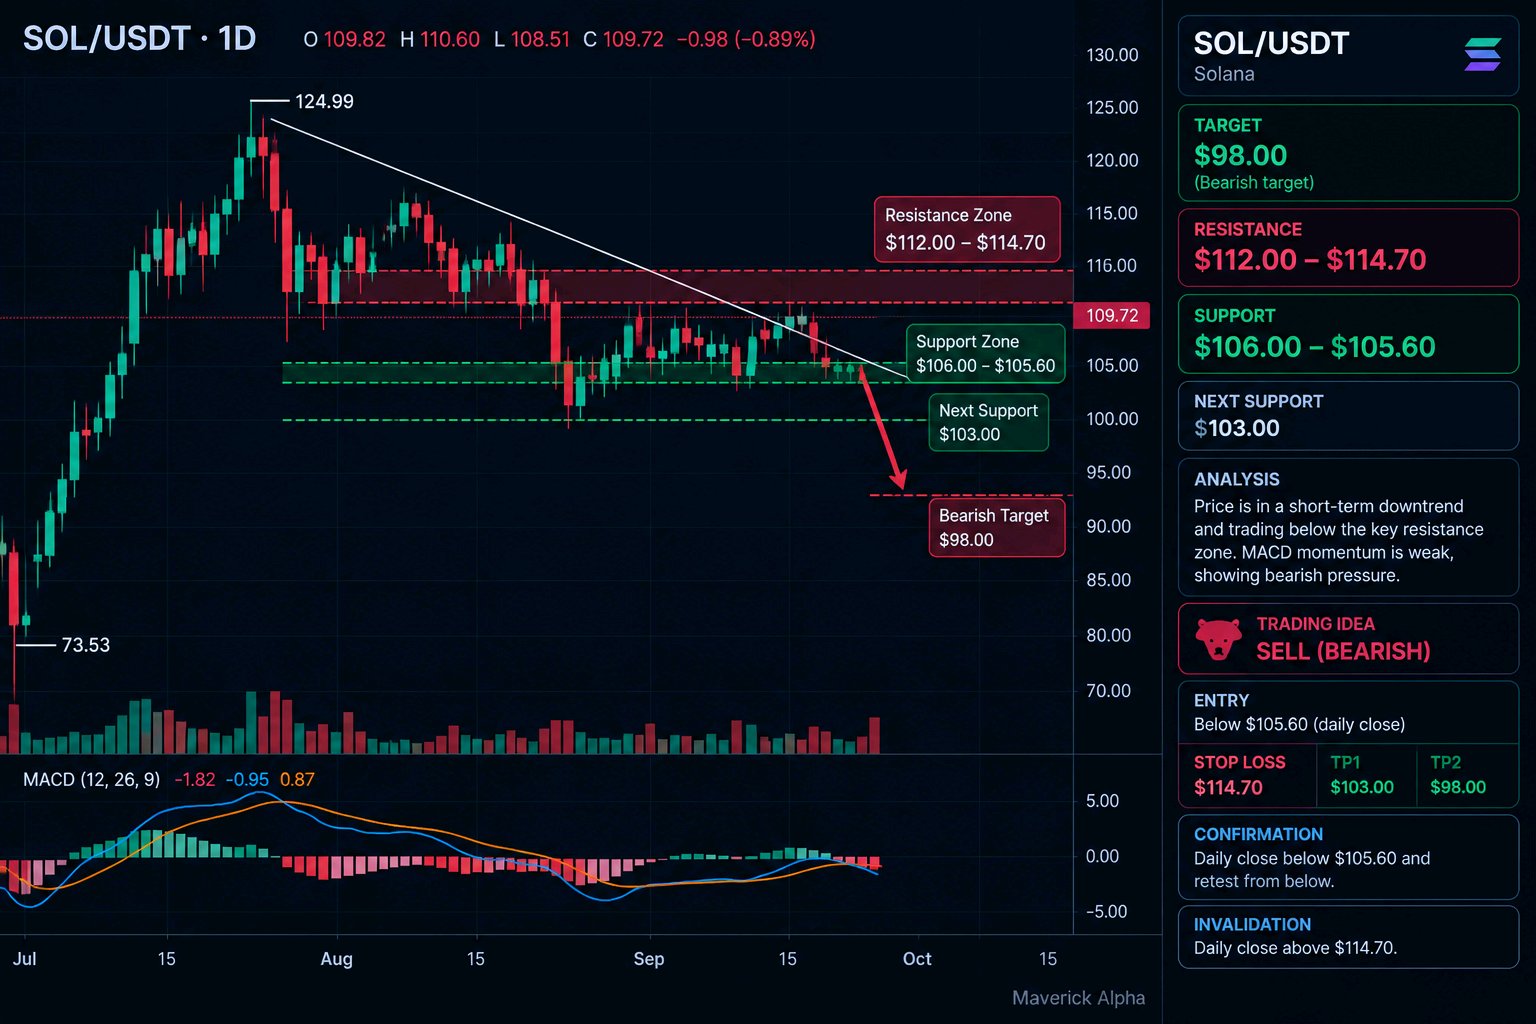
SOL/USDT is trading near $109.72 on the daily chart after retreating from $124.99. MACD momentum has weakened, so the rebound needs confirmation before considering a long. Signal: WAIT / NO TRADE Resistance: $112.00–$114.70 Support: $106.00–$105.60 Next support: $103.00 Bullish confirmation: Daily reclaim above $114.70 and a successful retest. Bearish trigger: Daily acceptance below $105.60. MY FINAL TAKE: SOL is at a decision point. Wait for confirmation rather than chasing the rebound. #ByXIMPACT #BybitOdds $SOLUSDT
ETH REBOUNDS, BUT THE DOWNTREND STILL HOLDS TODAY!
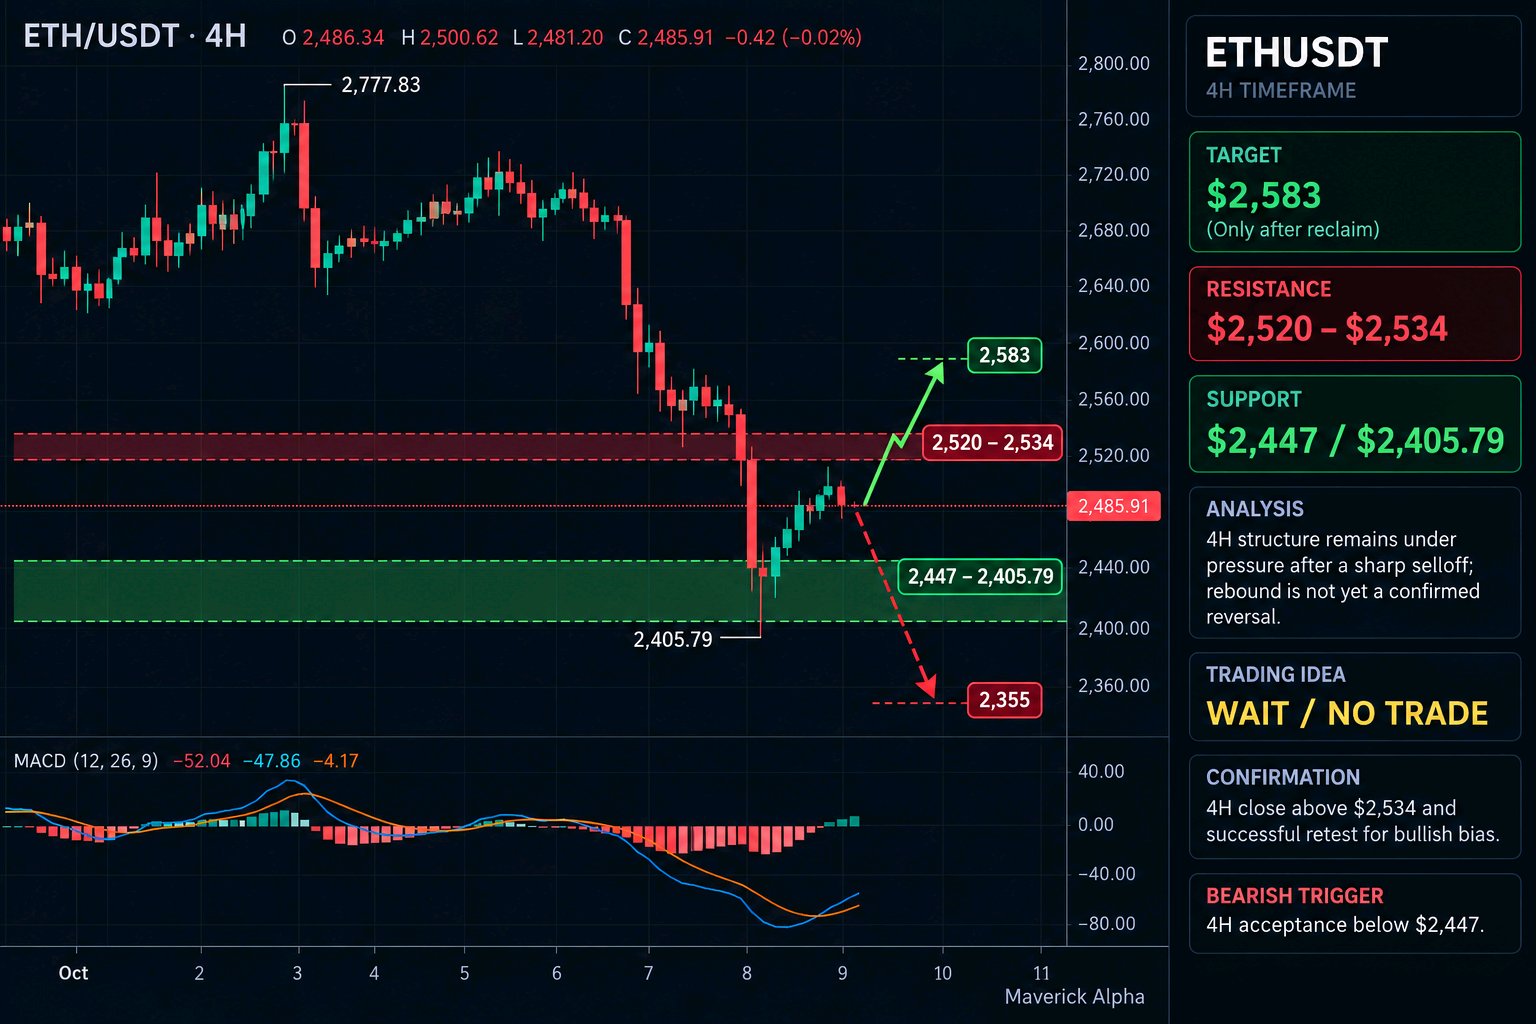
ETH is trading near $2,490 after bouncing from the $2,406 low. Buyers need to reclaim resistance before a stronger recovery can be considered. Signal: WAIT / NO TRADE Resistance: $2,520–$2,534 Support: $2,447–$2,406 Bullish target: $2,583 after a confirmed reclaim Bearish target: $2,355 if support breaks and price accepts below it Confirmation: A 4H close above $2,534 supports a bullish case. Losing $2,447 strengthens the bearish outlook. MY FINAL TAKE: The bounce alone isn’t a reversal. Wait for confirmation before entering. #ByXIMPACT #BybitAIBestReplies $ETHUSDC
SKYCOIN TESTS THE CHANNEL CEILING: BREAKOUT NEXT!
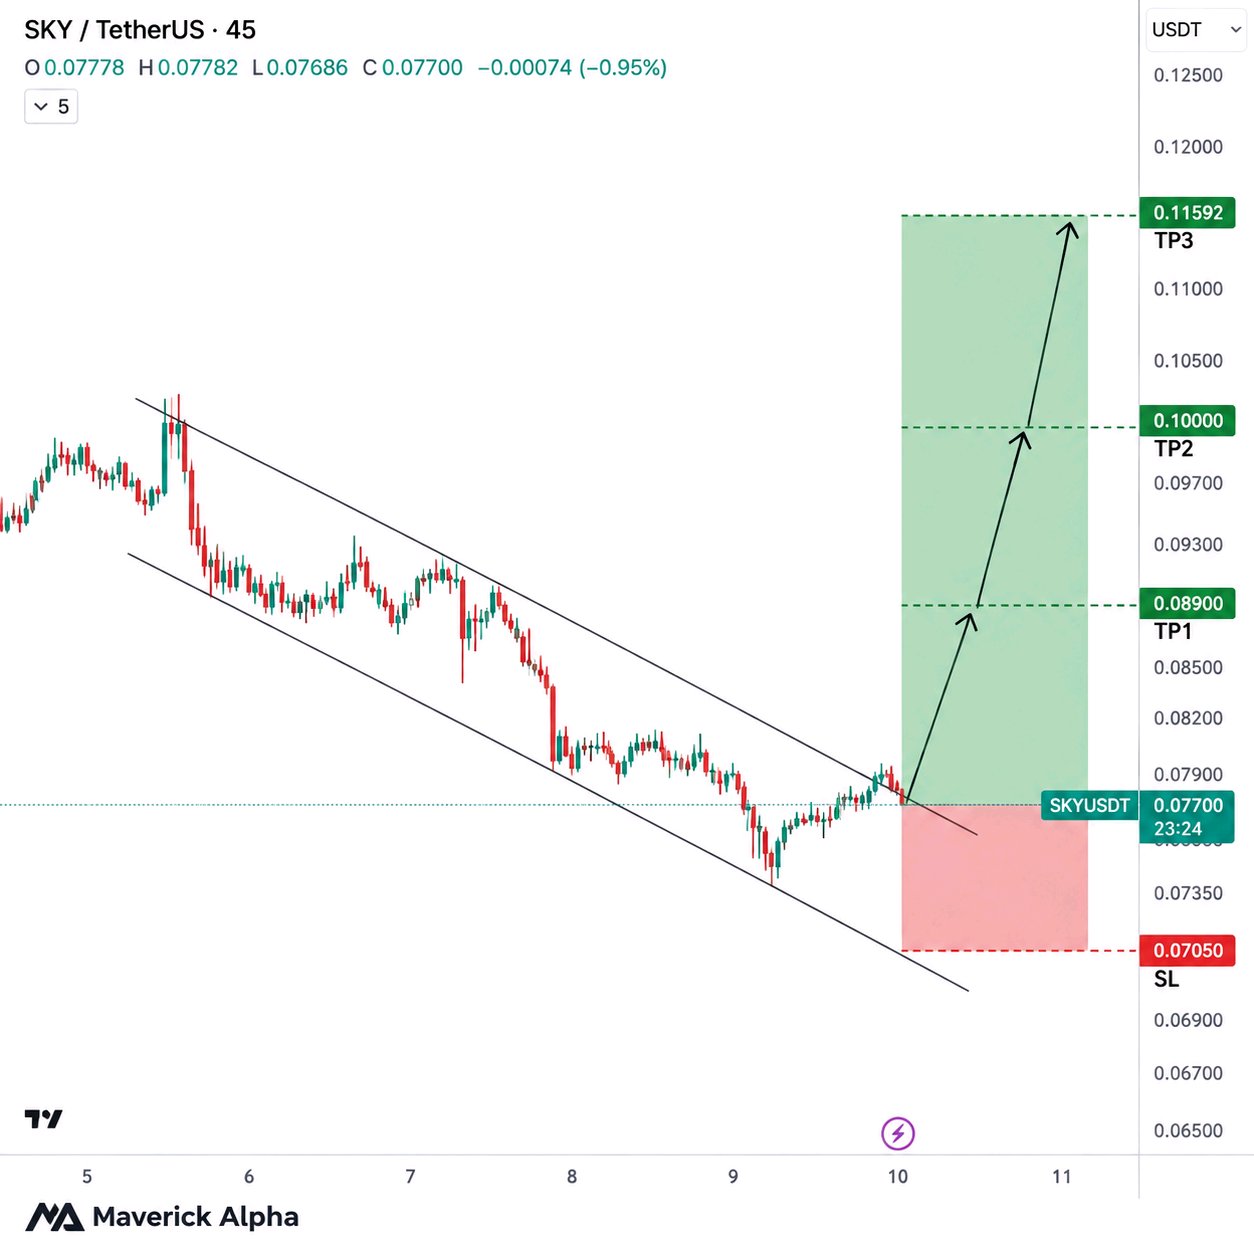
SKY/USDT is approaching a critical turning point after spending several sessions moving inside a descending channel. Price is currently around $0.0770, and the next move could determine whether buyers can finally challenge the ongoing downtrend. 📊 THE TECHNICAL SETUP 🟢 Potential Entry: Above $0.0780 after breakout confirmation 🎯 TP1: $0.0890 🎯 TP2: $0.1000 🚀 TP3: $0.1159 🛑 Stop Loss: $0.0705 🐂 Bullish Scenario: If SKY breaks above the channel resistance and holds the breakout, buyers could push toward the next resistance zones. A strong breakout with increased volume would provide better confirmation. 🐻 Bearish Risk: If price gets rejected at the channel ceiling, SKY could continue consolidating or revisit lower support levels. A move below $0.0705 would invalidate this proposed setup. MY FINAL TAKE SKY is approaching a potentially important breakout zone, but the breakout is not confirmed yet. Patience is key: wait for price to close above resistance and hold before considering an entry. These are chart-based scenarios, not guaranteed targets. Would you wait for breakout confirmation or enter before the move? #ByXIMPACT #BybitAIBestReplies $SKYUSDT
BITCOIN FACES A KEY TEST NEAR $83K — WATCH CLOSELY
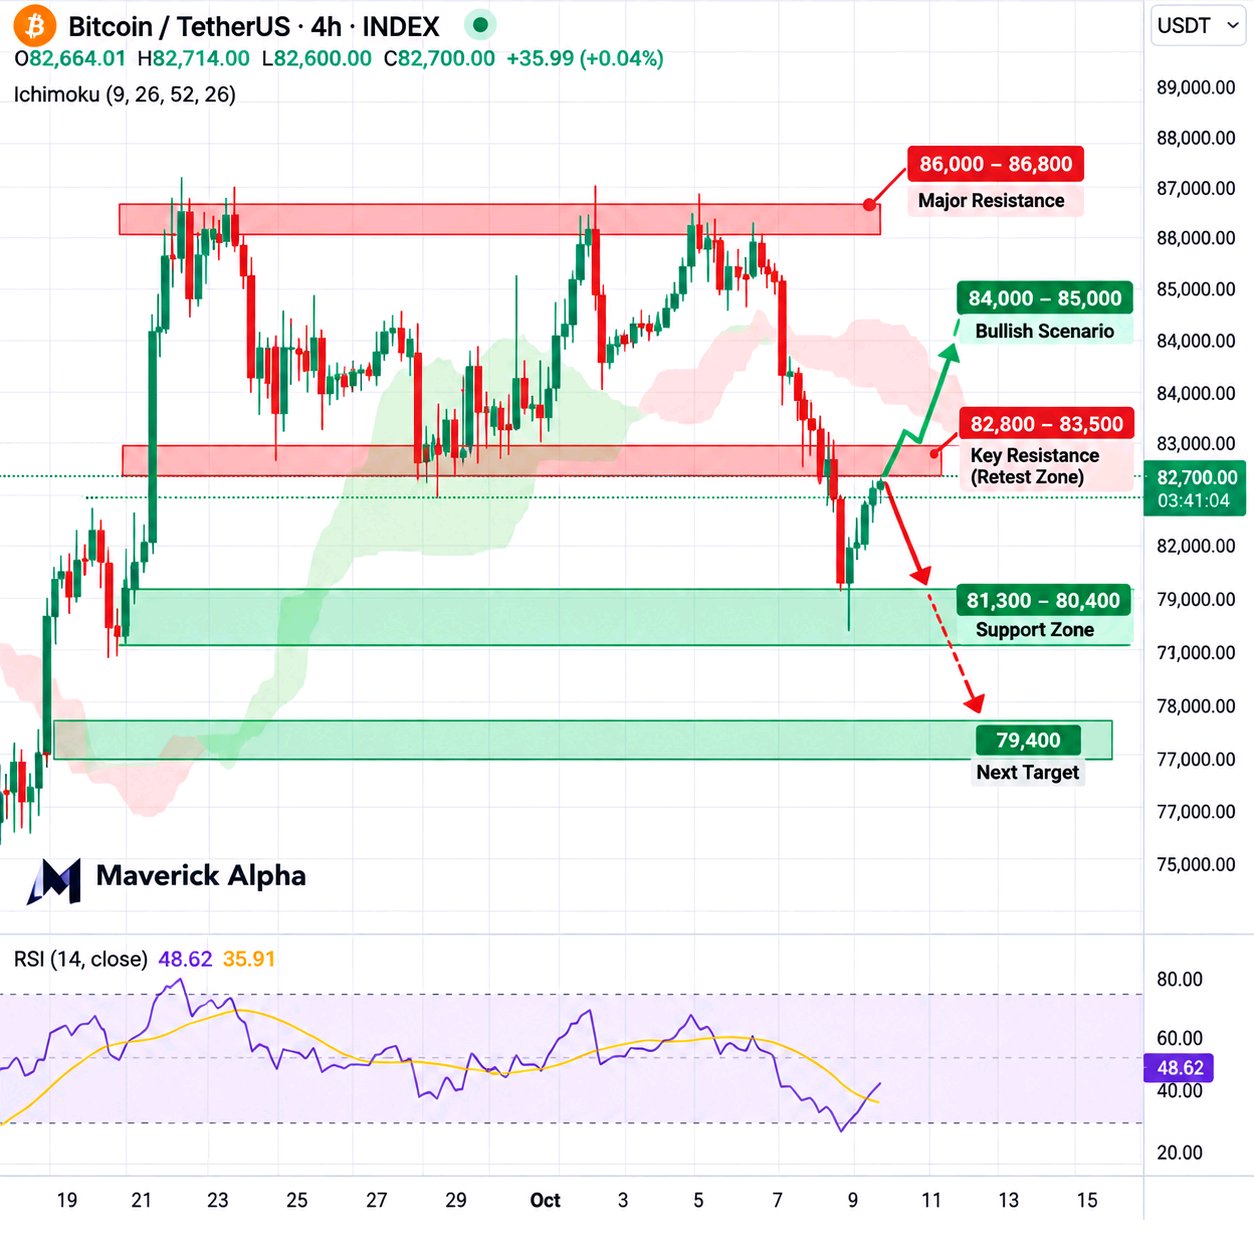
Bitcoin is trading around $82.6K after slipping below $83K. The recent bounce looks encouraging, but BTC still needs to reclaim resistance before bulls can take control. 📉 Short-term outlook: Bearish, but wait for confirmation. 🔴 Resistance: $82.8K–$83.5K 🟢 Support: $81.3K–$80.4K 🎯 Downside targets: $80.5K, then $79.4K 🛑 Invalidation: A strong 4H close above $83.5K If BTC retests the resistance zone and gets rejected, further downside is possible. But opening a short near support can be risky, so patience matters. ETF outflows and macroeconomic pressure are adding to market uncertainty, although neither guarantees another drop. MY FINAL TAKE Bitcoin is at a decision point. I’d wait for a clear rejection before considering a short. If BTC reclaims $83.5K, the bearish setup needs to be reassessed. What matters more now: a rejection below $83.5K or a strong breakout above it? #ByXIMPACT #BybitAIBestReplies $BTCUSDC
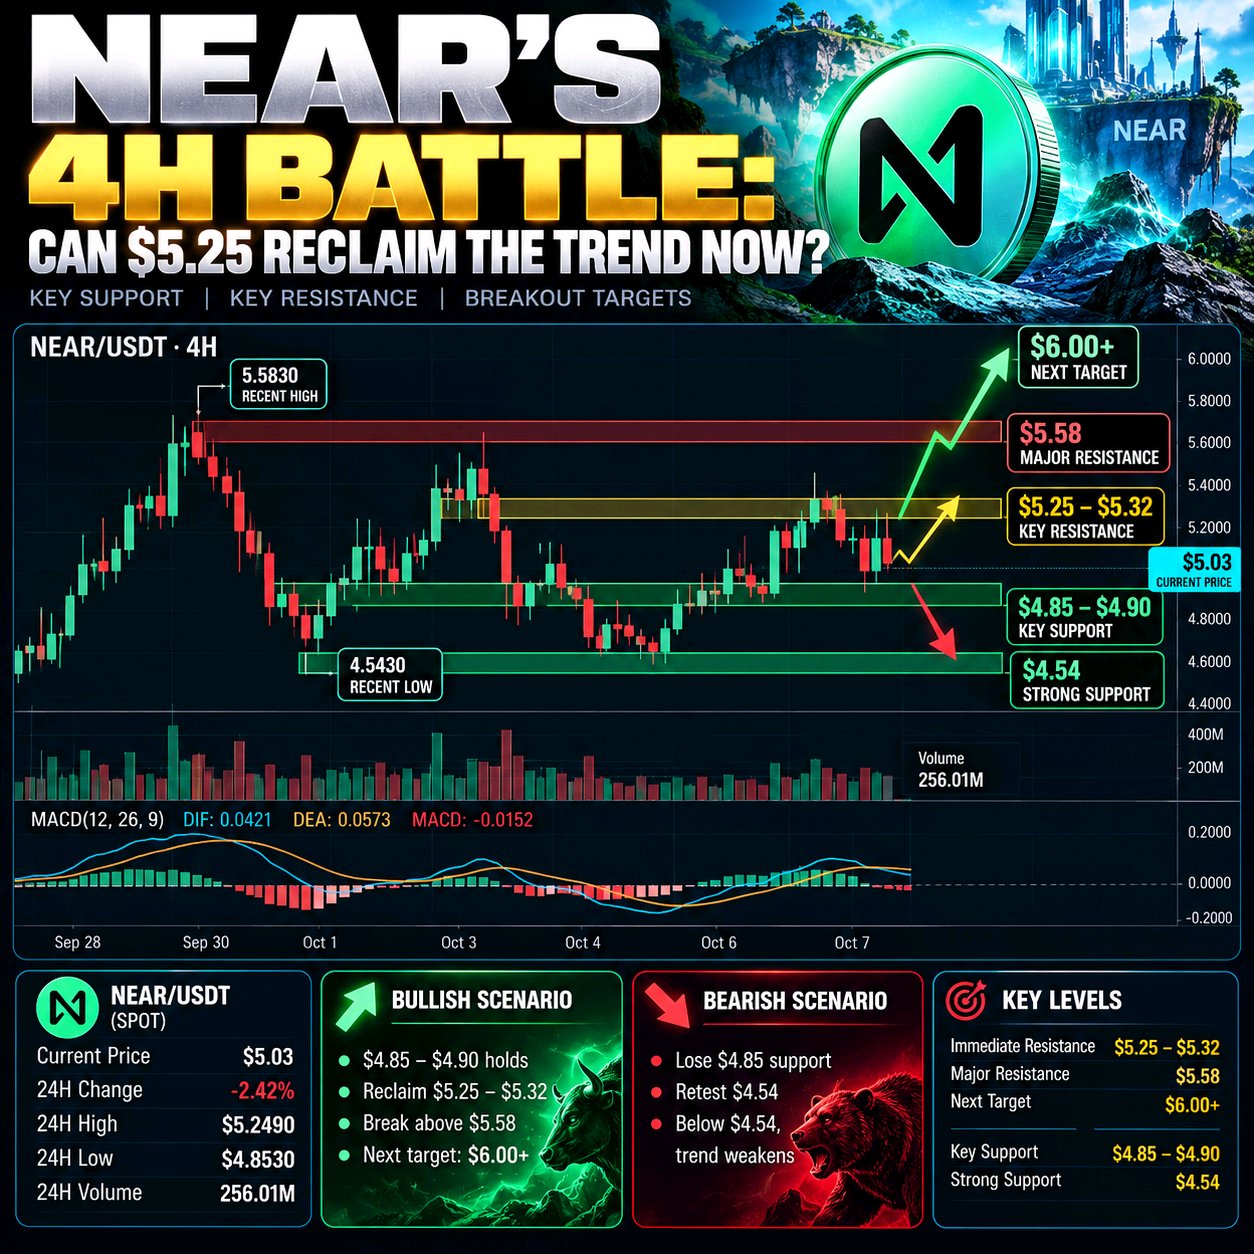
NEAR'S 4H BATTLE: CAN $5.25 RECLAIM THE TREND NOW
NEAR is sitting at an important decision point. The 4H chart you shared shows NEAR/USDT around $5.03, after a powerful September rally that pushed the token from the mid-$3 area to above $5.50. Current market data confirms that NEAR closed around $5.07 on October 6, while October 7 trading has remained volatile around the $5 area. The bigger picture is impressive: NEAR gained roughly 168% over the past three months based on settled daily data, with September delivering a particularly strong acceleration. But momentum has now cooled. On your 4H chart, price is below the MA20 around $5.41, while the recent swing high sits near $5.58. MACD has also weakened, with the histogram turning negative and the DIF below the DEA. That doesn't automatically mean the trend is over. It means NEAR needs to prove that buyers are still willing to defend the breakout. THE LEVELS THAT MATTER $4.85–$4.90 is the first area bulls need to protect. Below that, the next important chart area is around $4.54, matching the recent swing low visible on the chart. On the upside, the first challenge is $5.25–$5.32. A clean 4H reclaim of that zone would put the recent $5.58 high back in play. A breakout above $5.58 could potentially open the way toward $6.00+, but that would require confirmation rather than simply assuming the September momentum continues. WHY NEAR STILL HAS A FUNDAMENTAL STORY The rally isn't happening in isolation. NEAR's 2026 roadmap is increasingly focused on two themes: cross-chain financial infrastructure through NEAR Intents and autonomous AI agents through NEAR AI. The project describes its longer-term goal as building infrastructure where humans and agents can transact across chains. That gives NEAR a different narrative from a simple Layer-1 speculation trade. However, there is also a fresh risk investors cannot ignore. NEAR Intents was hit by an exploit reported on October 1, involving approximately $3.8M. The affected cross-chain service was paused, and the stolen assets were subsequently reported as returned. That doesn't automatically invalidate the broader NEAR thesis, but it makes security and execution important variables to watch after such a rapid price increase. WHAT THE CHART IS SAYING The structure currently looks like: Bullish case $4.85–$4.90 holds → $5.25 reclaim → $5.58 breakout → $6.00+ becomes possible Bearish case $4.85 fails → $4.54 becomes the major downside test → losing $4.54 would significantly weaken the recent bullish structure. The important point is that NEAR does not need to break $6 today. It first needs to prove that the current pullback is consolidation rather than distribution. MY FINAL TAKE NEAR's larger trend remains interesting after its huge September expansion, but the 4H chart is currently asking for confirmation. I would watch $4.85 support and $5.25–$5.32 resistance very closely. A reclaim of $5.25 followed by a break above $5.58 would give bulls a much stronger technical argument. Until then, chasing the move after a 100%+ multi-month rally carries significantly more risk. The next NEAR move may be decided by one thing: whether buyers can turn $5.25 back into support. Would you wait for the $5.25 reclaim before considering the next move? #ByXIMPACT $NEARUSDT
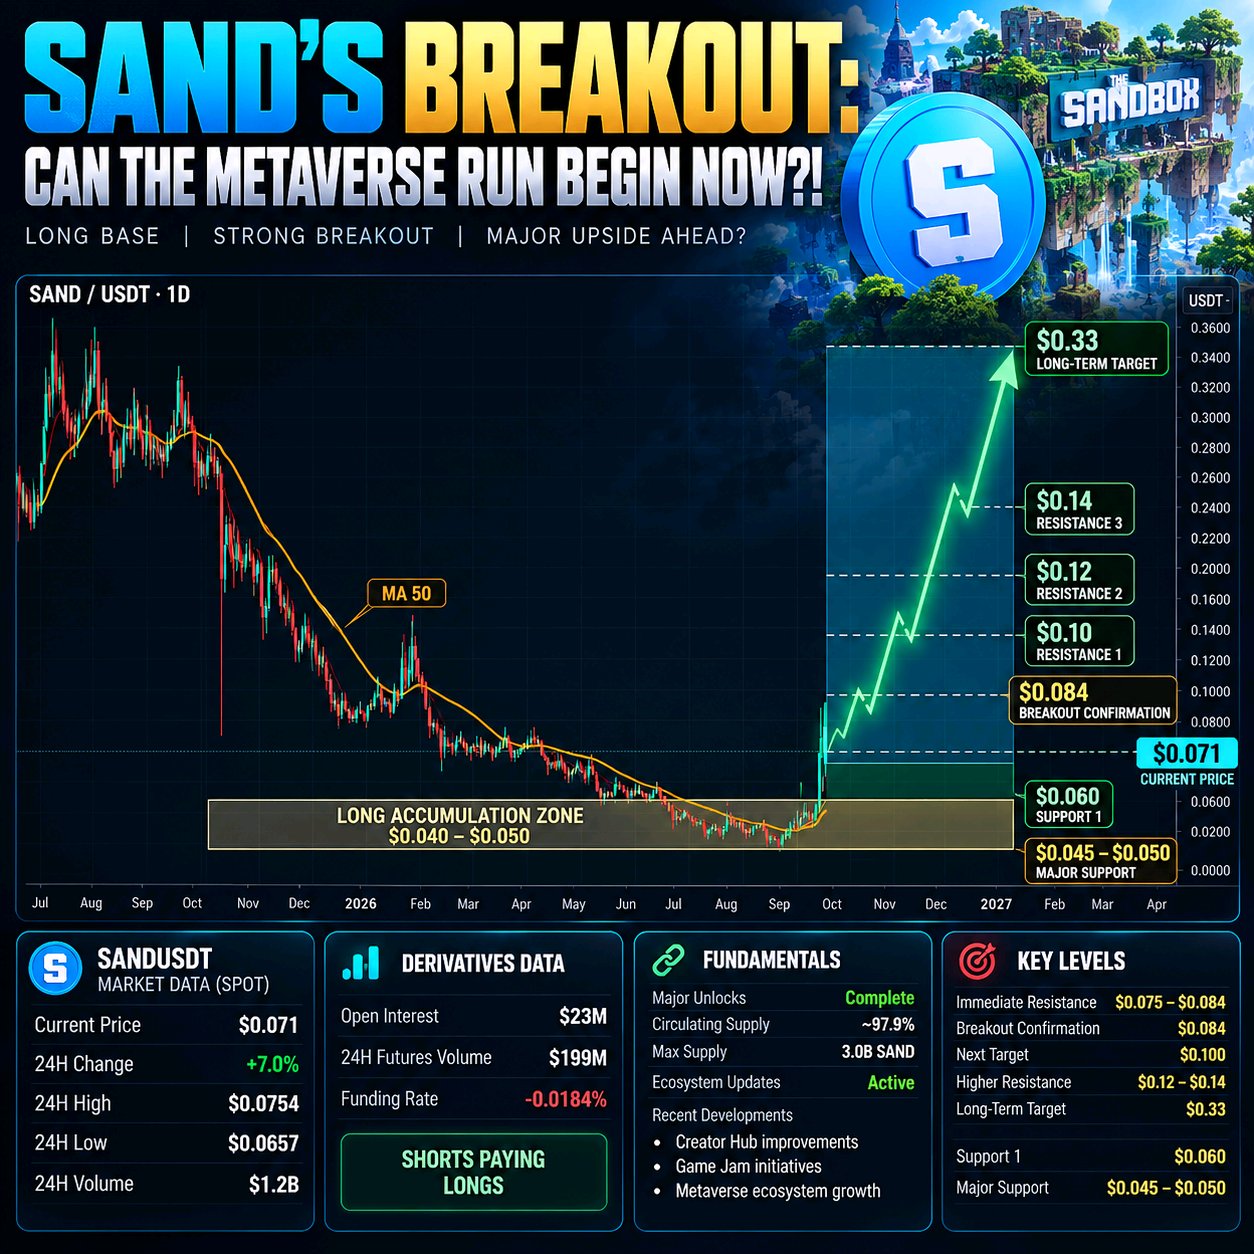
SAND’S BREAKOUT: CAN THE METAVERSE RUN BEGIN NOW
SAND is suddenly showing a very different market structure. The token is trading around $0.071–$0.073, after exploding from roughly $0.045 on October 1 to above $0.08 this week. On October 2 alone, SAND gained more than 54%, while volume surged into the billions. The chart you shared shows the bigger story. After months of decline, SAND spent a long period building a base around the $0.04–$0.05 region. The recent breakout pushed price sharply above the long-term moving averages visible on the chart. But this is where traders need to slow down. SAND already reached approximately $0.083–$0.084 during this move, meaning the first major resistance has been tested. A clean daily close above that area could open the door toward $0.10, followed by the larger $0.12–$0.14 resistance zone. The chart's longer-term upside projection extends much higher, toward roughly $0.33, but that should be treated as a macro scenario—not an immediate target. DERIVATIVES ARE INTERESTING Binance SAND perpetual funding has remained strongly negative, while open interest is around $23M and 24-hour futures volume is roughly $199M. Negative funding means shorts have been paying longs, which can create fuel for a continued move if price keeps rising. But there is another side. SAND futures volume was extremely elevated during the early-October breakout, and aggregate futures data shows OI expanded sharply during the initial move before cooling afterward. That means the next few daily candles matter more than the first breakout candle. THE FUNDAMENTAL CATALYST The Sandbox ecosystem is still actively developing. Its Creator Hub recently reported a September 22 engine update with improvements to physics, particle editing, animation tools, templates and workflow. The project has also been pushing new creator-focused initiatives and Game Jams. Importantly, SAND's scheduled vesting program is now essentially complete. The major unlock schedule ended in August 2025, with about 97.9% of the 3B maximum supply circulating according to current tokenomics data. That removes one major source of recurring scheduled unlock pressure. KEY LEVELS Current: $0.071–$0.073 Immediate resistance: $0.075–$0.084 Breakout confirmation: Daily acceptance above $0.084 Next psychological target: $0.100 Higher resistance: $0.12–$0.14 Major long-term chart objective: $0.33 Support: $0.060 Major breakout-base support: $0.045–$0.050 MY FINAL TAKE SAND's move is real, but the easy part of the breakout may already be over. The key question is whether SAND can turn $0.075–$0.084 from resistance into support. If it does, the market could start pricing a much larger recovery toward $0.10 and beyond. If price repeatedly rejects the $0.08 area and falls back below $0.06, this could become another violent altcoin spike rather than the beginning of a durable trend reversal. The chart is bullish—but confirmation matters more than the candle. #ByXIMPACT $SANDUSDT
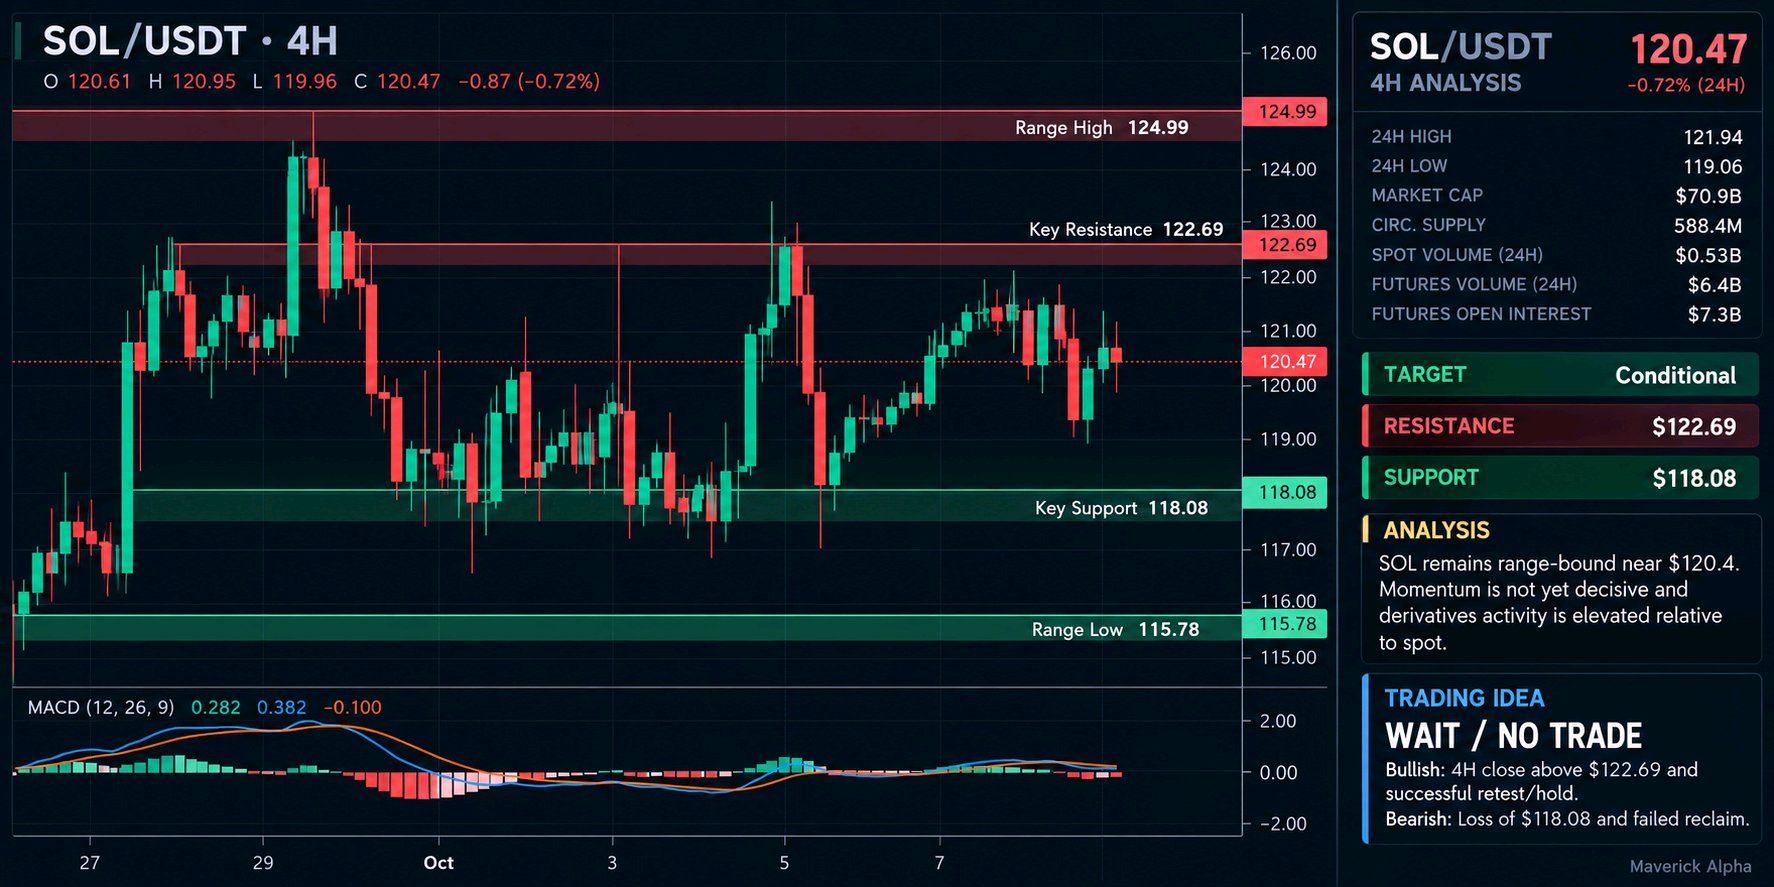
SOL Sits at the Edge of a Breakout, Not Yet Ready!
SOL is sitting near $120.7, while your 4H chart shows a broader $115.78–$124.99 range. The key battleground is $122.69 resistance and $118.08 support. Until one side breaks and confirms, the middle of the range is not an attractive risk/reward zone. The fundamentals are stronger than the price action suggests. Solana currently has about $6.7B TVL, $16.6B in stablecoin liquidity, roughly 3.18M active addresses, and more than 112M daily transactions. DEX activity remains substantial, while real-world-asset adoption has passed the multi-billion-dollar level. Institutional development is also accelerating. Solana Foundation announced Solana DvP today, an open-source delivery-versus-payment settlement framework designed for financial institutions, while Project Harmonia is connecting Solana tokenized funds with Allfunds' network of 3,300+ asset managers and institutions. But derivatives deserve caution. SOL futures open interest is around $7.3B, with futures volume dramatically larger than spot volume. That means leverage is significant, so a breakout without spot confirmation could become a liquidity trap. Trade plan: BUY only: 4H close above $122.69 + successful retest/hold. SELL only: loss of $118.08 + failed reclaim. Between $118.08–$122.69: NO TRADE. The network story is bullish, but price still needs to prove it. #ByXIMPACT #BybitAIBestReplies
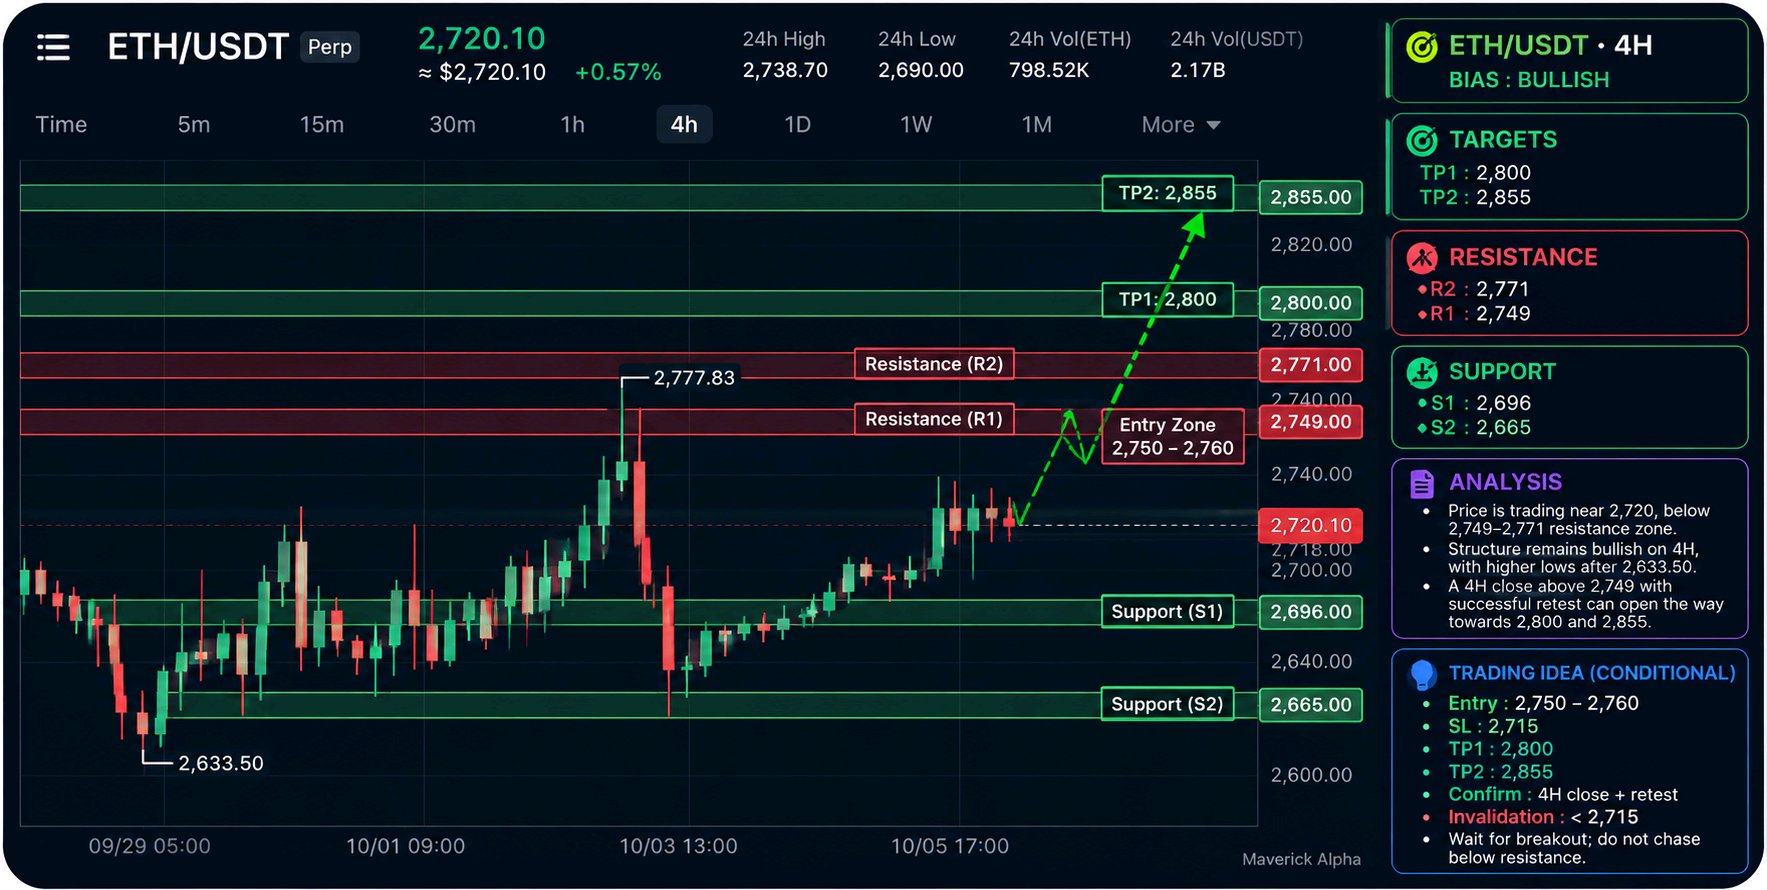
ETH/USDT 4H | BULLISH, but no entry yet
ETH is holding the higher-low structure from $2,633, while the current price remains below the key $2,749–$2,771 resistance. Daily/weekly momentum also remains bullish. Conditional LONG Entry: $2,750–$2,760 after 4H close + retest SL: $2,715 TP1: $2,800 TP2: $2,855 Invalidation: 4H close below $2,715 R:R: ~1.1 / 2.7 The main catalyst is still constructive staking demand, although the recent MetaMask-related validator exits add short-term uncertainty. Do not chase ETH below resistance. Wait for confirmation. #ByXIMPACT #BybitAIBestReplies $ETHUSDC