Jack09
16775Лайк0Акциялар282Жанкүйерлер24Жазылу
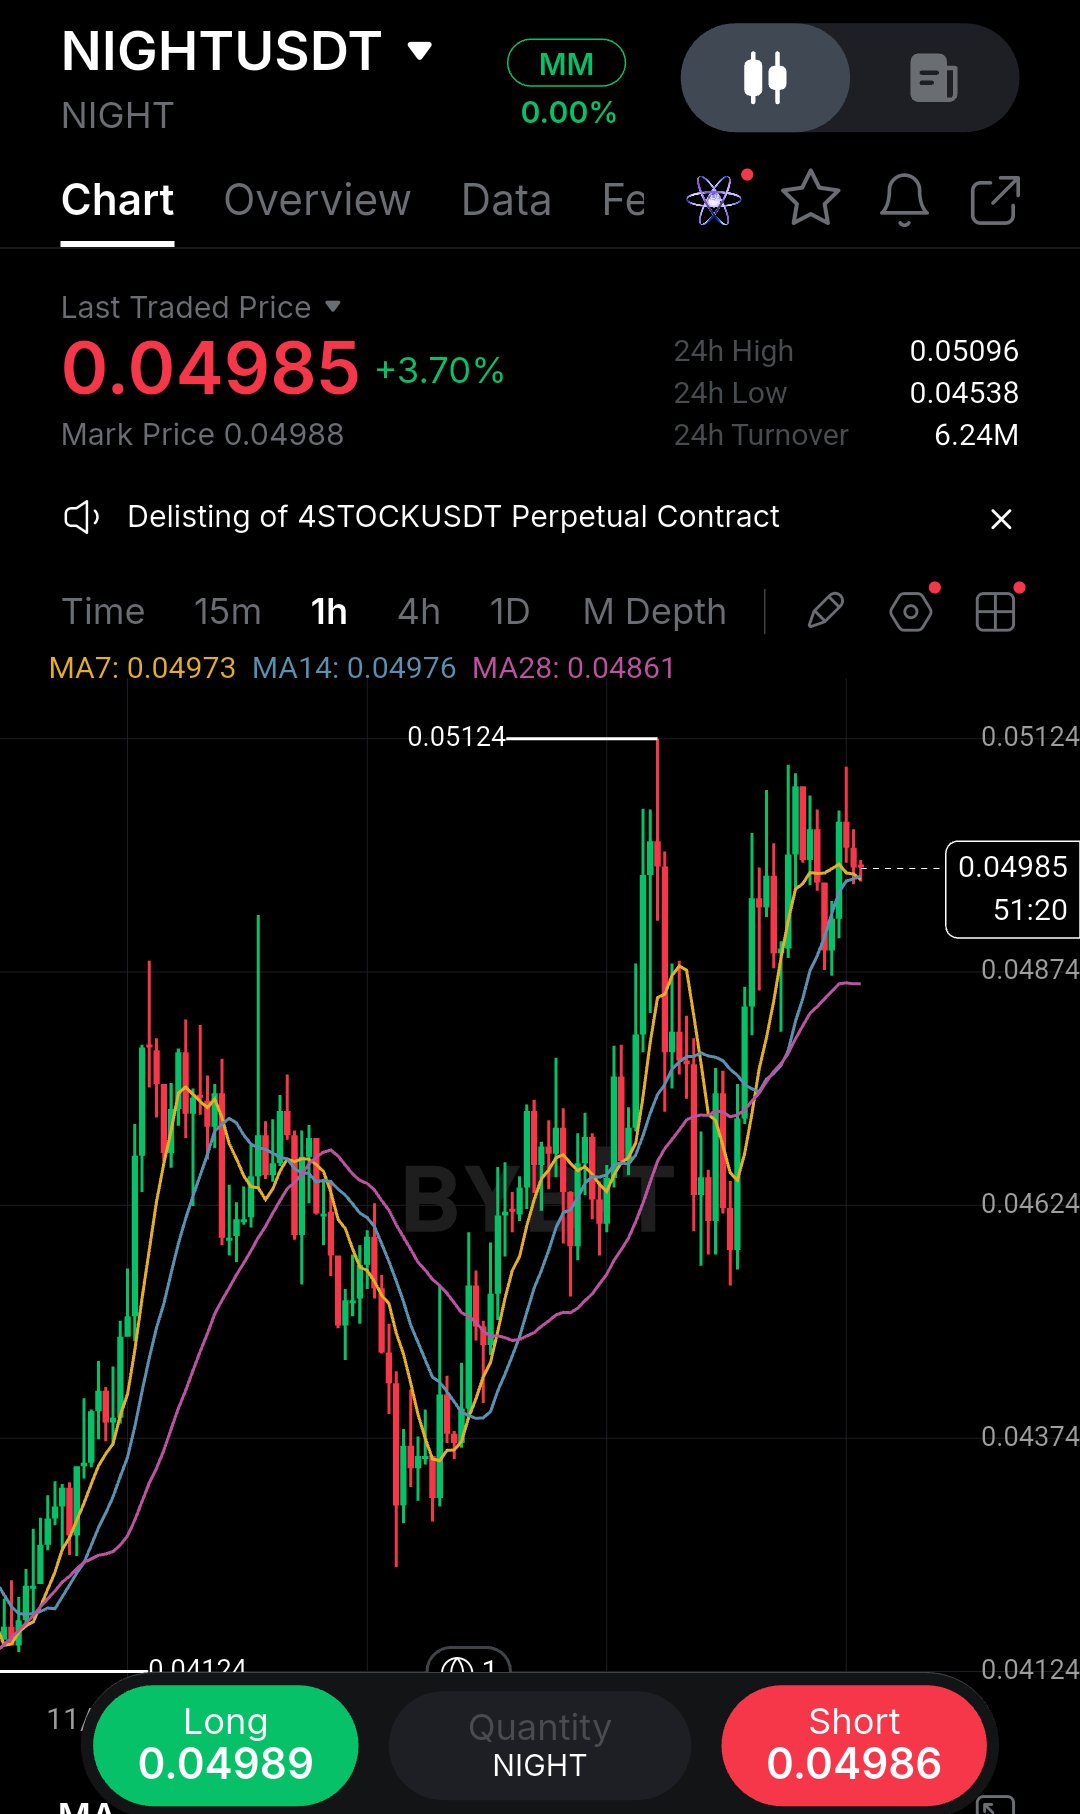
I’ve learned the hard way that buying right into a resistance cluster usually ends with me staring at a red candle, so this NIGHT 1h chart has my full attention. Price is pushing 0.04985, but it’s running directly into the 0.05124 swing high while the 7 and 14 MAs are flattening out. The real story is the 28 MA way down at 0.04861.Momentum is slowing, and buyers are losing their early drive. I’m not chasing this vertical move. Let me break down exactly what I see. The recovery from the 0.04124 low was aggressive and clean, but the rally is now stalling just beneath the previous swing high at 0.05124. That’s not a coincidence. That level was a rejection point before, and it’s likely to act as supply again. Meanwhile, the 7 MA at 0.04973 and the 14 MA at 0.04976 are curling over, which tells me short-term momentum has peaked. The 28 MA at 0.04861 is the true trend anchor, and it’s still rising, so the broader uptrend isn’t broken .it’s just overheated. This is a classic pullback setup waiting to happen, not a breakout entry. What supports the bullish case? The higher low structure is intact, the 28 MA is sloping upward, and the 24h low at 0.04538 shows buyers defended the dip aggressively. If price pulls back to the 28 MA and holds, that would be a textbook continuation setup with the trend. What supports the bearish case? The 0.05124 level is a clear rejection point, the short-term MAs are flattening, and the current candle is showing exhaustion near resistance. If buyers fail here, price could roll over and test the 28 MA as support or break through it entirely. My read is that the highest-probability trade is a long on the pullback, not a chase at current price. I’d rather wait for price to come to me, into the 0.04870–0.04900 zone where the 28 MA offers actual structural support. If we get a clear bullish rejection candle there, I’ll take the long. Entry: 0.04880 (on confirmation candle) SL: 0.04820 (below the 28 MA) TP1: 0.05050 TP2: 0.05120 Invalidation: A strong close below 0.04820 means the trend is broken and I step aside. I used to enter on the first green candle after a drop, and it taught me to let price prove itself. If it pumps without me, I accept it. Where are you watching for the retest? #ByXIMPACT #WSOT2026 $NIGHTUSDT $SPCXXUSDT
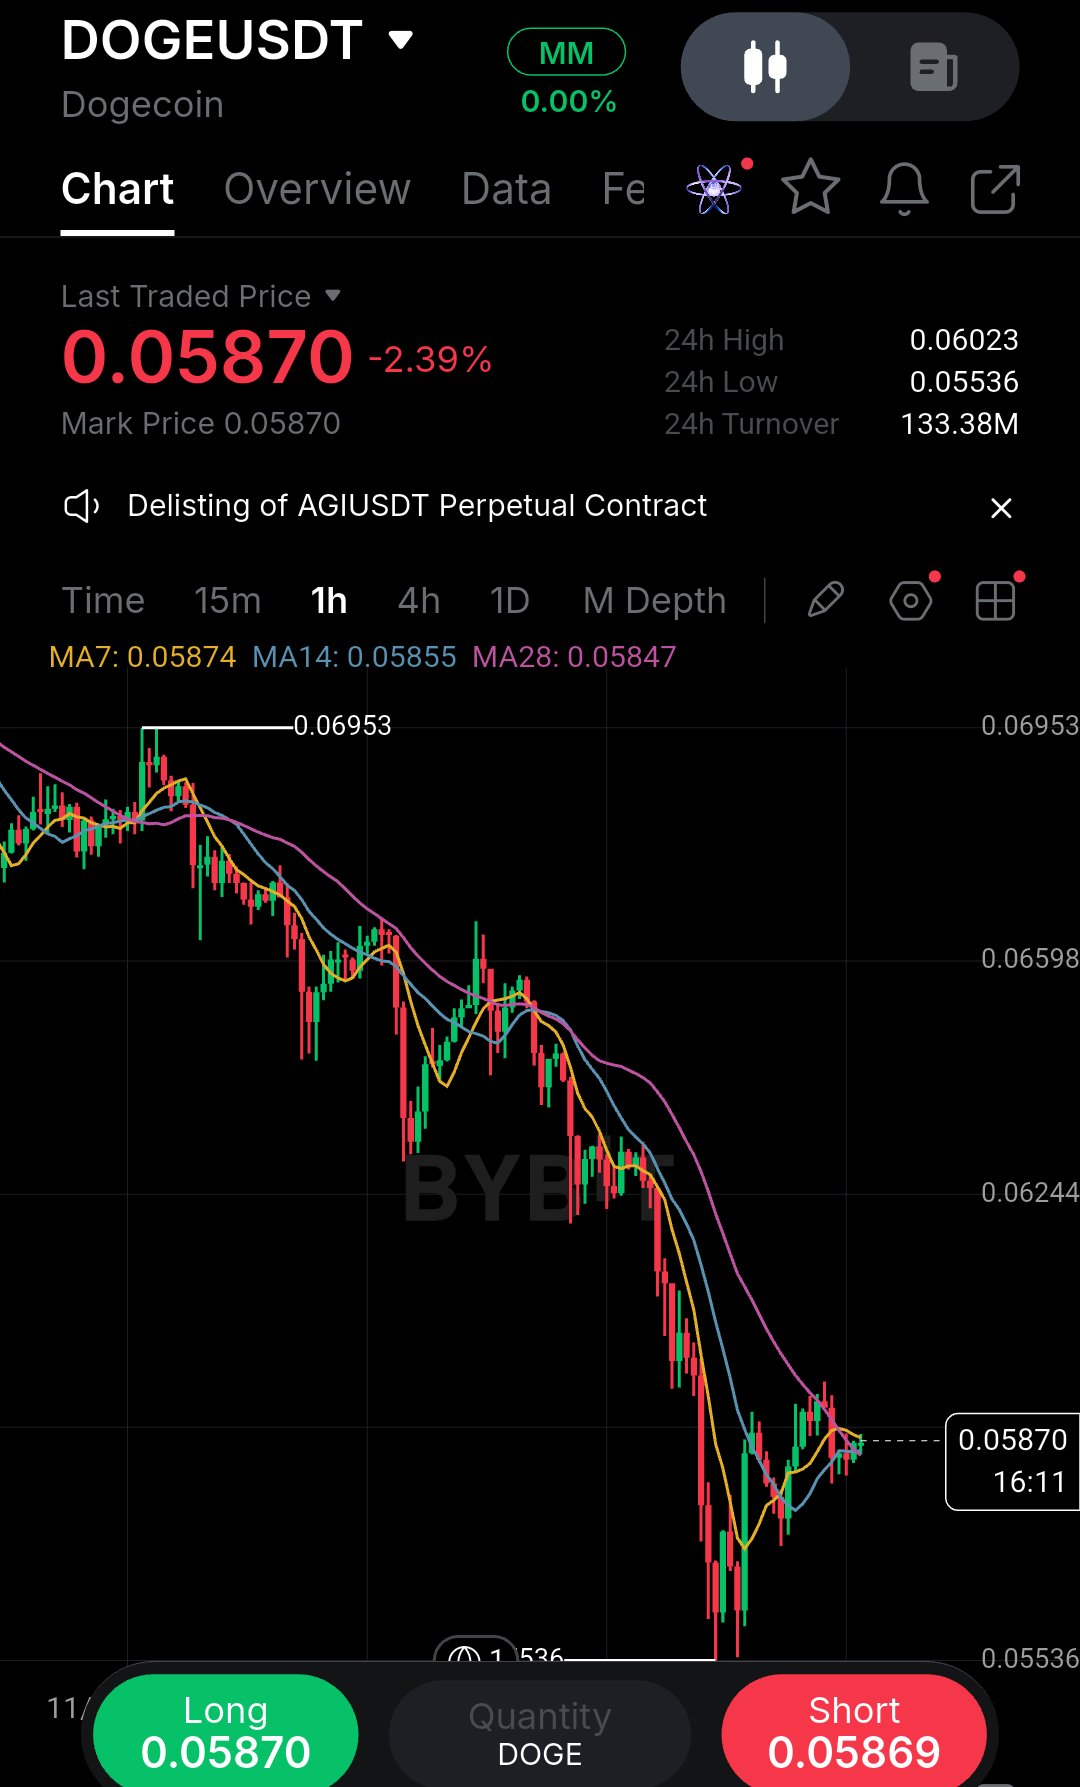
I’ve learned to distrust perfectly clean bounces after a hard dump, so I’m watching this DOGE 1h chart with patience rather than excitement. Price is clinging to 0.0587 after a brutal slide, but the structure is still a series of lower highs. The 7 and 14 MAs are flat, yet the 28 MA at 0.0584 is the real battleground.it’s acting as immediate overhead pressure. I can see the trapped buyers from the 0.062 breakdown, and I have no intention of adding myself to that crowd. Here is the honest read: this is not a reversal yet. It is a bounce inside a downtrend. The drop from 0.06953 to the 0.05536 low was fast and heavy, and fast drops usually leave a trail of unfinished business above. Those buyers who entered near 0.062 are now underwater, and every small rally gives them a chance to exit at break-even or with a smaller loss. That creates a wall of selling pressure right where the 28 MA sits. Until price reclaims that level and holds it, the path of least resistance remains down. What supports the bullish case? The wick at 0.05536 shows buyers defended that zone aggressively, and the short-term MAs are flattening, which means selling momentum is cooling. If price can reclaim 0.0590 with a strong close, the trapped sellers above may start covering, and that fuel could push us toward 0.0620. What supports the bearish case? Everything else. The trend is down, the structure is lower highs, and the bounce is weak relative to the drop. A failure at the 28 MA would likely send price back to test 0.05536, and a break there opens the door to deeper levels. My execution plan is simple. I want a decisive reclaim and close above 0.0590 to confirm buyers are actually stepping in. If that fails, a lower high is the signal to stay out and wait. Entry: 0.0591 (confirmation) SL: 0.0575 (below recent wick) TP1: 0.0620 TP2: 0.0650 Risk/Reward is roughly 1:1.6 to TP1, which is acceptable for a counter-trend bounce but not a trade I would oversize. Invalidation is a clean break below 0.0575.If that happens, the bounce thesis is dead and I step aside. I used to jump on these early reversals and get stopped out by the retest. Now I let the candle close first. Discipline beats FOMO every time. Where’s your line in the sand? #ByXIMPACT #WSOT2026 $DOGEUSDT $SPCXXUSDT
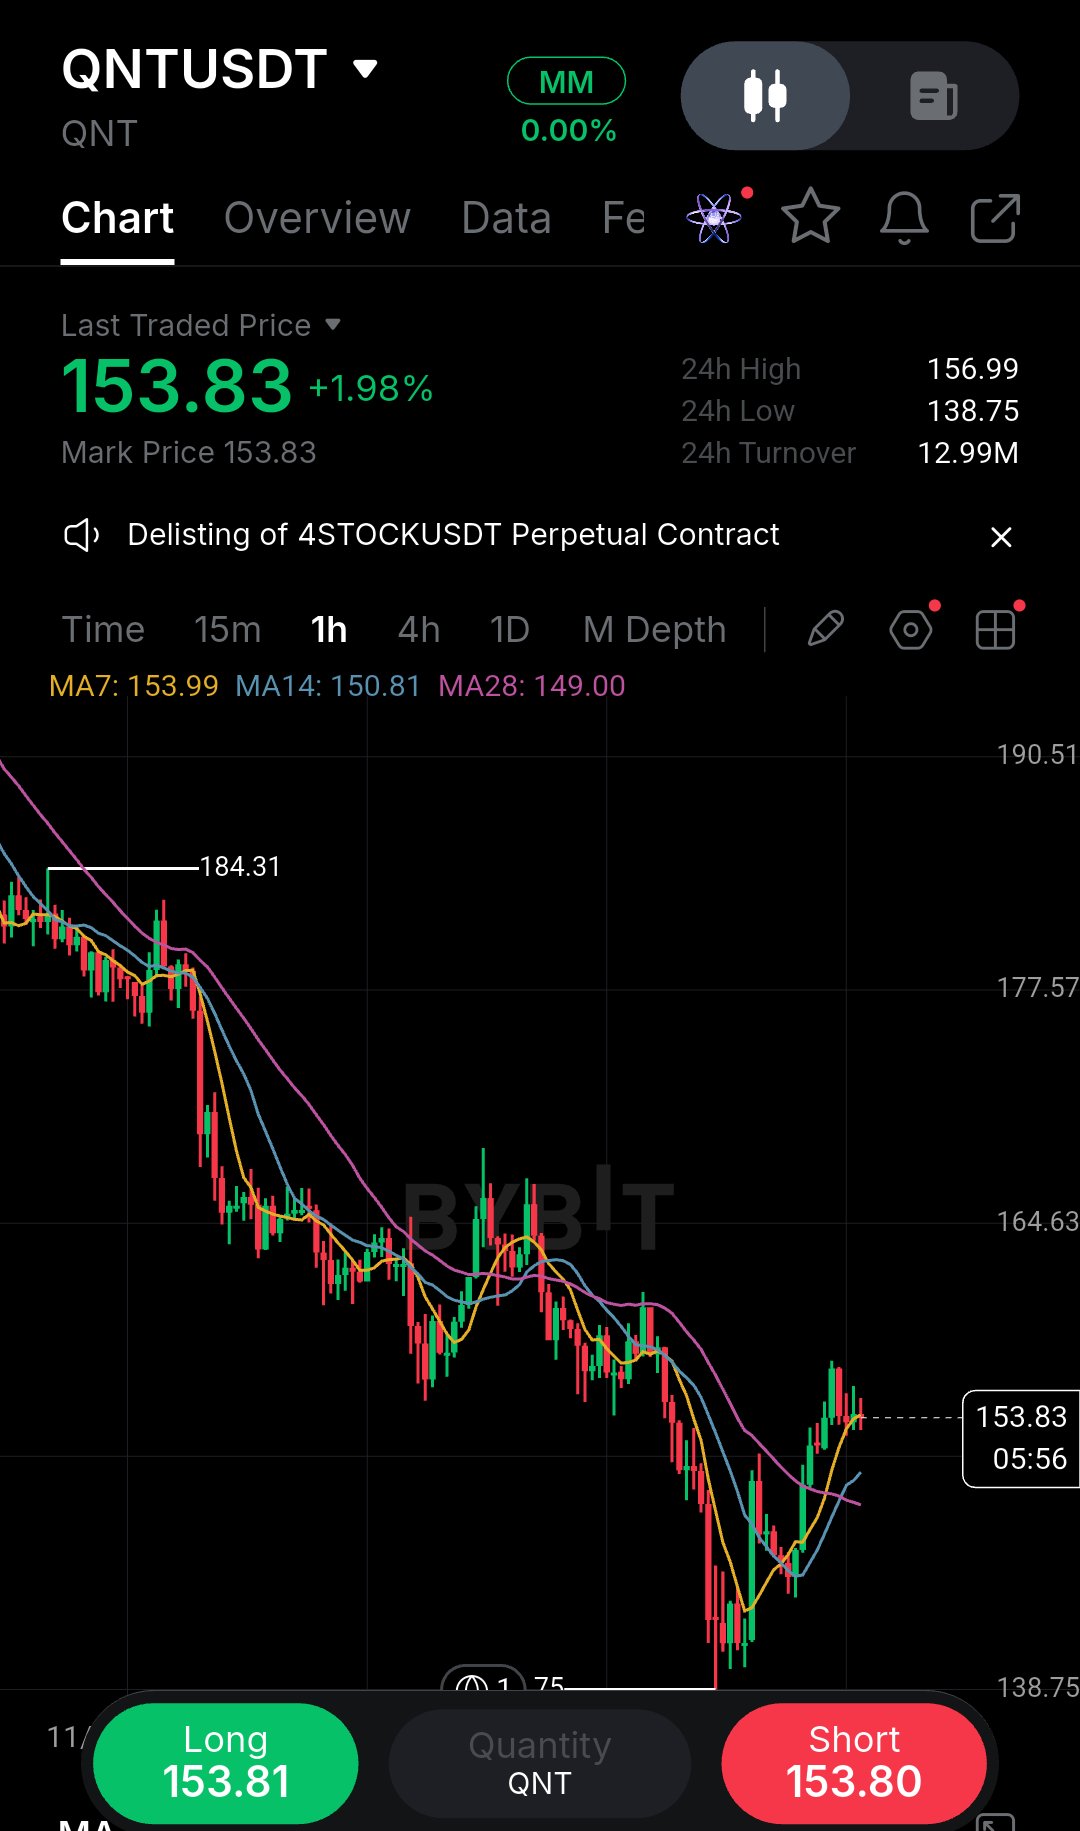
I’ve seen too many traders get chopped up trying to catch falling knives, so I’m approaching this QNT bounce with a lot of caution. Yes, we got a sharp liquidity sweep down to 138.75 and a decent reaction, but look where we are now 153.83, right underneath the MA7 at 153.99. The one thing that matters here is whether this is a genuine reclaim or just a lower high forming in a brutal downtrend. Sellers still control the broader structure, and this little bounce is testing its first real dynamic resistance. The MA14 sits at 150.81 and the MA28 is way down at 149.00, meaning price has already pushed above the slower averages but is struggling to clear the fastest one. That tells me momentum is shifting, but it hasn't fully flipped yet. I’m not stepping in just because it’s green. If price can print a strong 1H close above 154.5, I’ll consider a long for the continuation. Otherwise, I’m just watching. The bearish case is straightforward.This is a classic relief rally after a liquidity grab, and the trend remains down. The bullish case is that the sweep at 138.75 trapped sellers, and the higher low forming now could be the start of a reversal. But "could be" isn't confirmation. I need to see buyers absorb the supply at the MA7 before I risk capital. Entry: Confirmed 1H close above 154.5. SL: 149.0 (below the MA28). TP1: 164.6 (previous breakdown zone). TP2: 177.5 (major structural resistance). The lesson I keep in mind: a bounce isn't a reversal until it proves it can break structure. Don't move your stop if it wiggles. If 154 rejects, I stay flat. How are you playing this retest? #ByXIMPACT #WSOT2026 $QNTUSDT $SPCXXUSDT
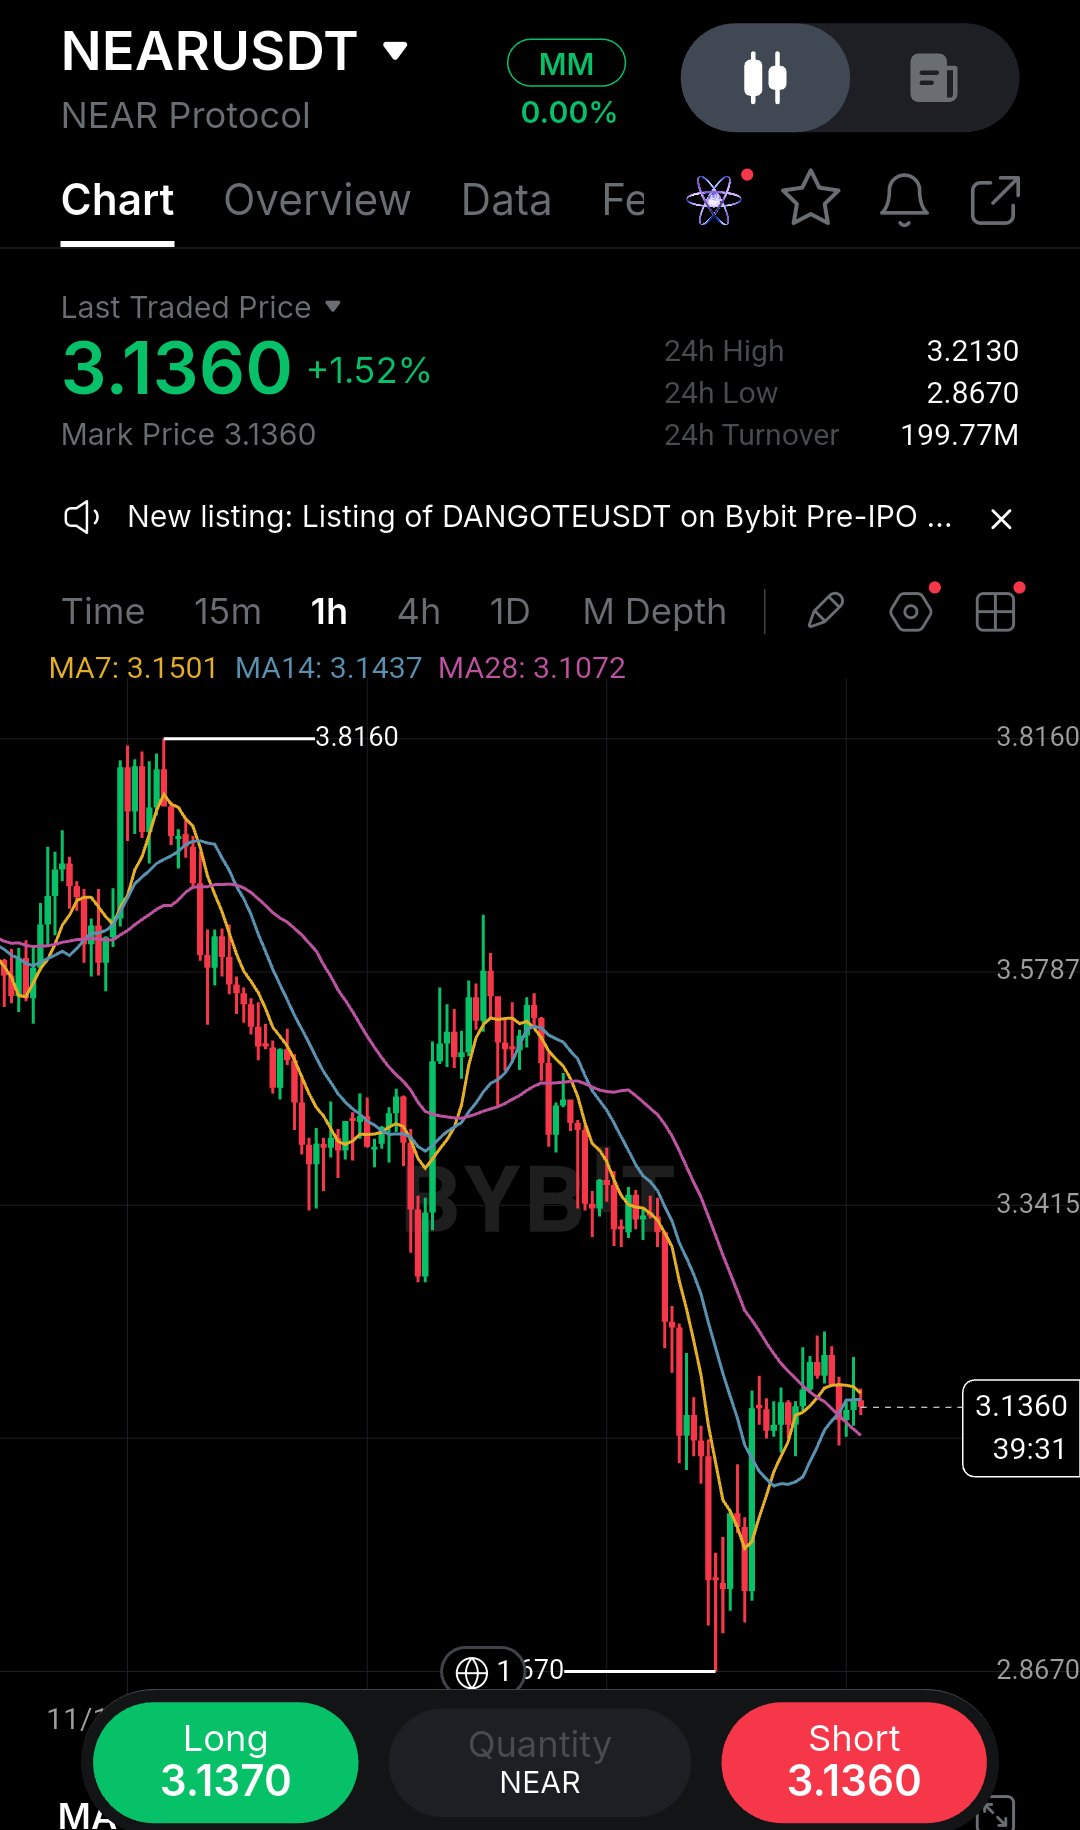
I’ve caught myself forcing longs on charts like this before, so I’m being deliberately patient here. NEAR is printing a clear bounce off the 2.8670 low, but it’s still trapped below the 3.15–3.20 cluster where the shorter MAs sit. Look at the structure carefully. Price sold off hard from the 3.8160 high, printing a series of lower highs and lower lows before finally finding a bid near 2.8670. That low was a sharp wick.A classic liquidity sweep where sellers pushed price below the prior consolidation and then got trapped as buyers absorbed the selling. The bounce we’re seeing now is real, but it’s happening into a very specific supply zone. The 1H chart shows the MA7 at 3.1501, MA14 at 3.1437, and MA28 at 3.1072. Notice how price is currently grinding right into the MA7 and MA14.That’s your first real test. If buyers can’t push through that cluster with conviction, the bounce is just a retest of prior support-turned-resistance. The bearish case is simple: the trend is still down, the moving averages are still sloping lower, and this bounce hasn’t broken any meaningful structure. The bullish case is that the 2.8670 wick shows sellers exhausted, and the higher low forming on the 1H is a potential early reversal signal. But potential isn’t a trade. I need confirmation. That’s why my plan is strict. I’m not entering until I see a clean 1H close above 3.16, which would clear the MA cluster and reclaim the prior support zone. If that happens, the entry is valid. Entry: Only on a confirmed 1H close above 3.16. SL: 3.07 (below the recent swing low and the MA28). TP1: 3.34 (next structural resistance). TP2: 3.58 (previous breakdown zone). Invalidation: A rejection wick at 3.16 followed by a break under 3.10. The lesson I keep learning: a bounce isn’t a reversal until structure confirms it. I’ve chased too many green candles that looked like the bottom, only to watch them fade into the next leg down. Don’t move your stop just because price wiggles. If 3.16 rejects, I’m flat and waiting. What’s your trigger here? #ByXIMPACT #WSOT2026 $NEARUSDT $SPCXXUSDT
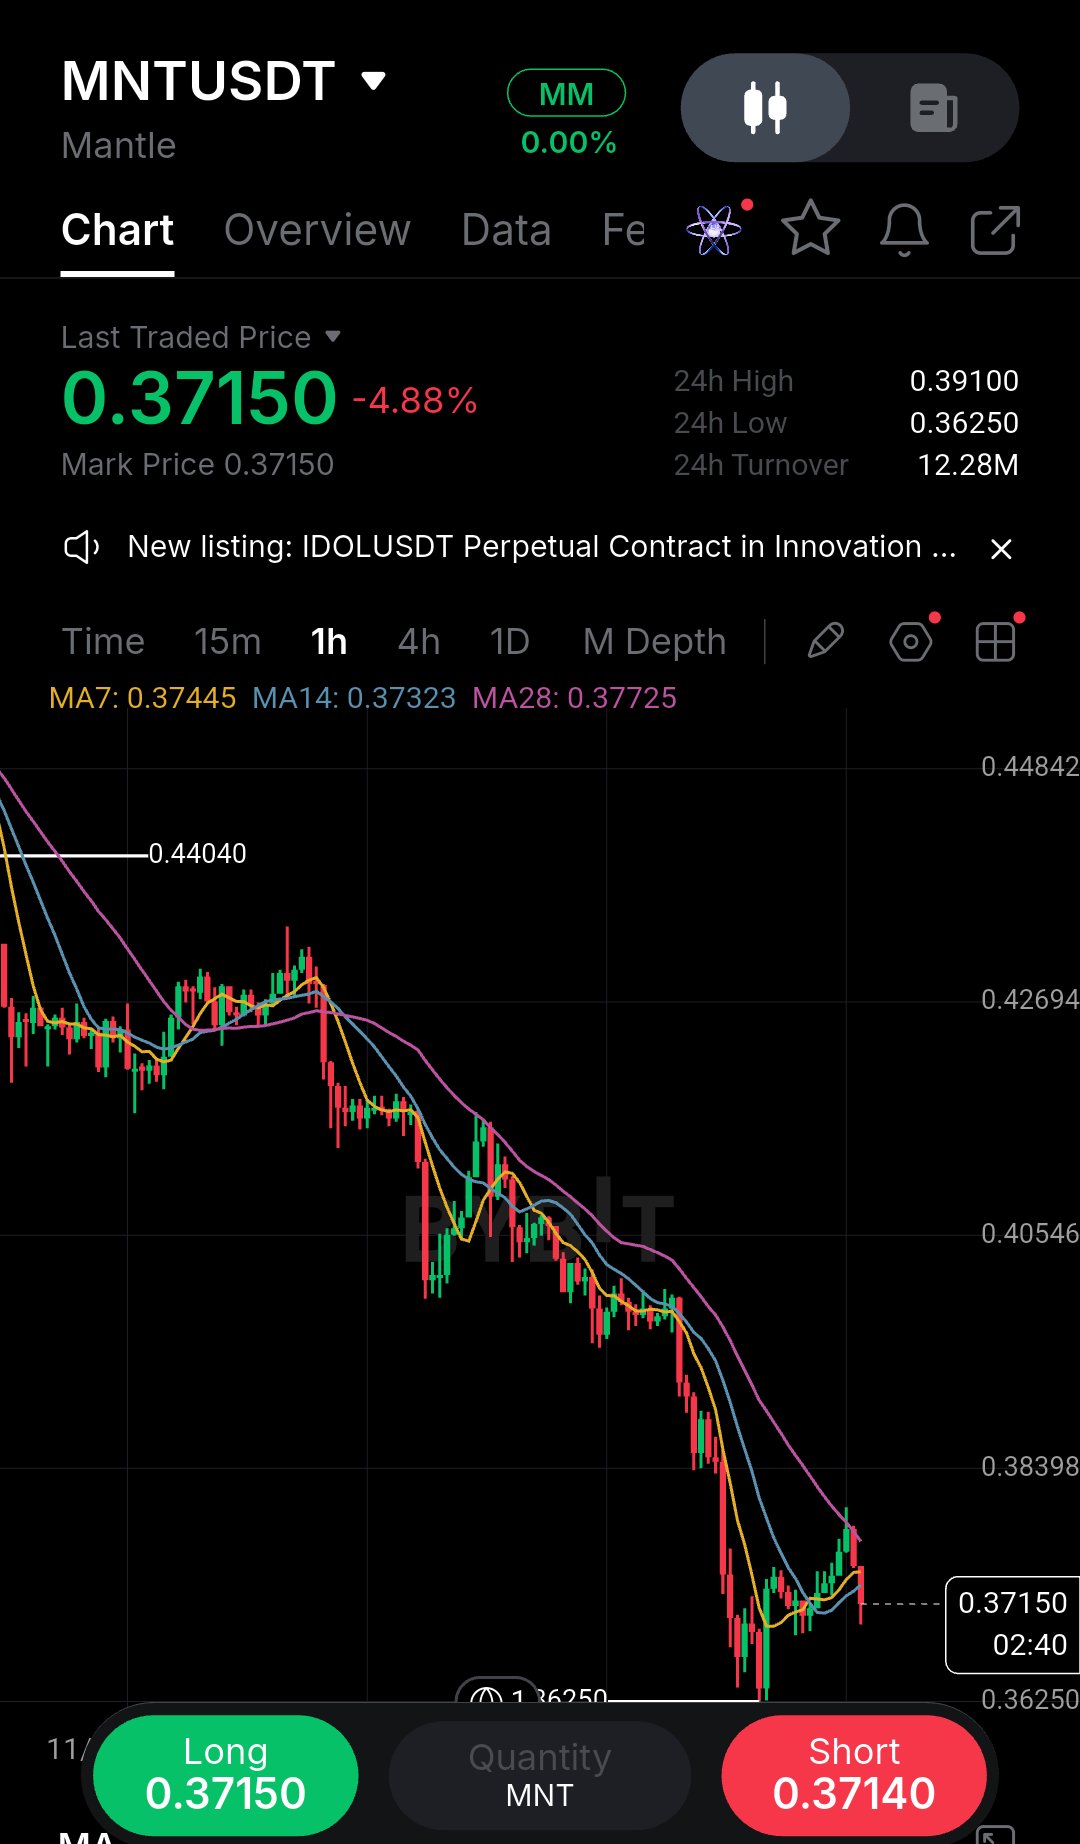
I've learned to be patient with charts that look ready to bounce before they actually confirm. Looking at MNT on the 1h, price is down nearly 5% and bleeding below all key moving averages (MA7, MA14, MA28). The structure is clearly bearish, but the last few candles show a potential liquidity sweep near the 0.3625 low, with buyers stepping in. That wick is interesting, but it is not a reversal yet. I'm not chasing this bounce. The real test is whether price can reclaim the 0.3770 area, where MA28 sits and where prior support turned into resistance. Until that happens, the trend remains heavy, and every green candle is just a bounce inside a downtrend. The 24h high of 0.3910 shows where sellers previously took control, while the 24h low of 0.3625 is the level that matters right now. Entry: Wait for a 1h close above 0.3730. SL: 0.3620, below the recent wick low. TP1: 0.3830, nearest resistance. TP2: 0.3950, structural high. TP3: 0.4050 only if momentum expands. Invalidation: A clean break below 0.3625 without a reclaim cancels the idea. One lesson I've paid for: never treat a green candle as confirmation. I used to enter on the first sign of buying, only to get stopped out as the downtrend resumed. Let the structure prove itself. A bounce becomes a reversal only when price breaks structure and holds above it. Risk management here is simple: if price rejects 0.3730 and rolls over, I stay out. If it closes above and retests, I take the trade with a tight stop. TP1 is where I take partials, not proof the whole trade works. Move the stop only after structure confirms, never because price moves against you. Would you take this bounce, or is the trend too strong to fight? #ByXIMPACT #WSOT2026 $MNTUSDT $NVDAXUSDT
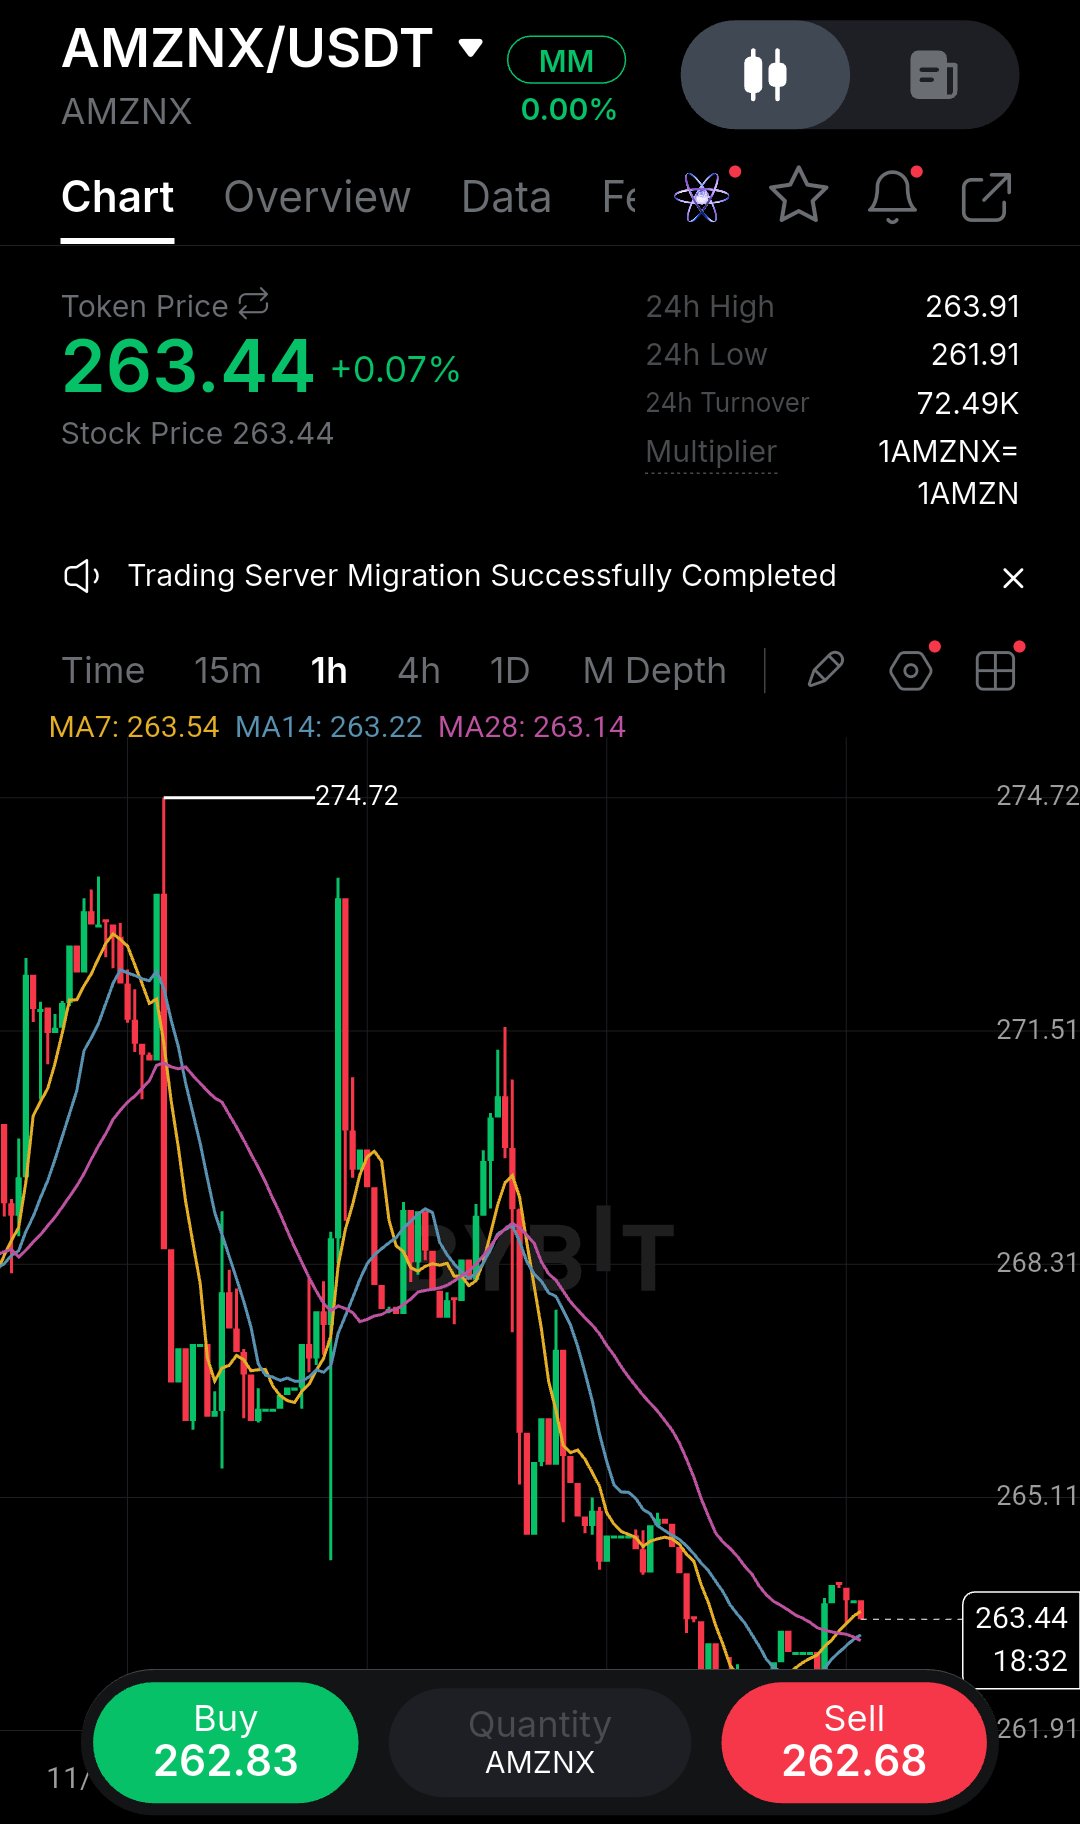
I've been in this exact spot before seeing a brutal downtrend finally pause and trying to guess the exact bottom. AMZNX has bled heavily from 274.72 down to this 263 floor, but the 1h structure is starting to show early exhaustion. The price is resting right at the 263.44 level, and notably, the moving averages are starting to flatten out and compress. This tells me sellers are losing momentum. However, guessing a reversal here is dangerous. I’d rather see buyers actually prove they can push back before risking capital. When a chart looks like this, the temptation is to jump in early and catch the absolute low, but that's a rookie mistake. The market has been in a relentless downtrend, and the bounce we are seeing is still unproven. Notice how the price is hovering around the MA7, MA14, and MA28. These averages are converging, which often indicates a period of consolidation before a larger move. The problem is that the immediate momentum is still bearish, and the recent candles show indecision rather than a strong bullish reversal. If I buy here and the support breaks, I'm immediately underwater and forced to manage a losing position. I’d much rather wait for the market to show its hand. Bias: LONG (on confirmation) Entry: 264.00 – 264.50 (only after a 1h close above the MA cluster) Confirmation: A strong 1h close reclaiming 264.20, signaling a structural shift. SL: 261.90 (just below the 24h low) TP1: 266.00 TP2: 268.50 Invalidation: A 1h candle close below 261.90. If it breaks down instead, don't force it. The key here is to let the market prove itself. If we get that confirmed reclaim, the risk-to-reward becomes much more favorable because the stop loss can be placed tightly below the recent swing low. But if we don't, then the downtrend remains intact, and we simply avoid the trade. This is where patience pays off.There's no shame in missing a move if the setup wasn't confirmed. Wait for the close, respect your invalidation level, and don't let FOMO ruin your risk management. Do you buy the immediate bottom or wait for the trend shift? #ByXIMPACT #WSOT2026 $AMZNXUSDT $SPCXXUSDT
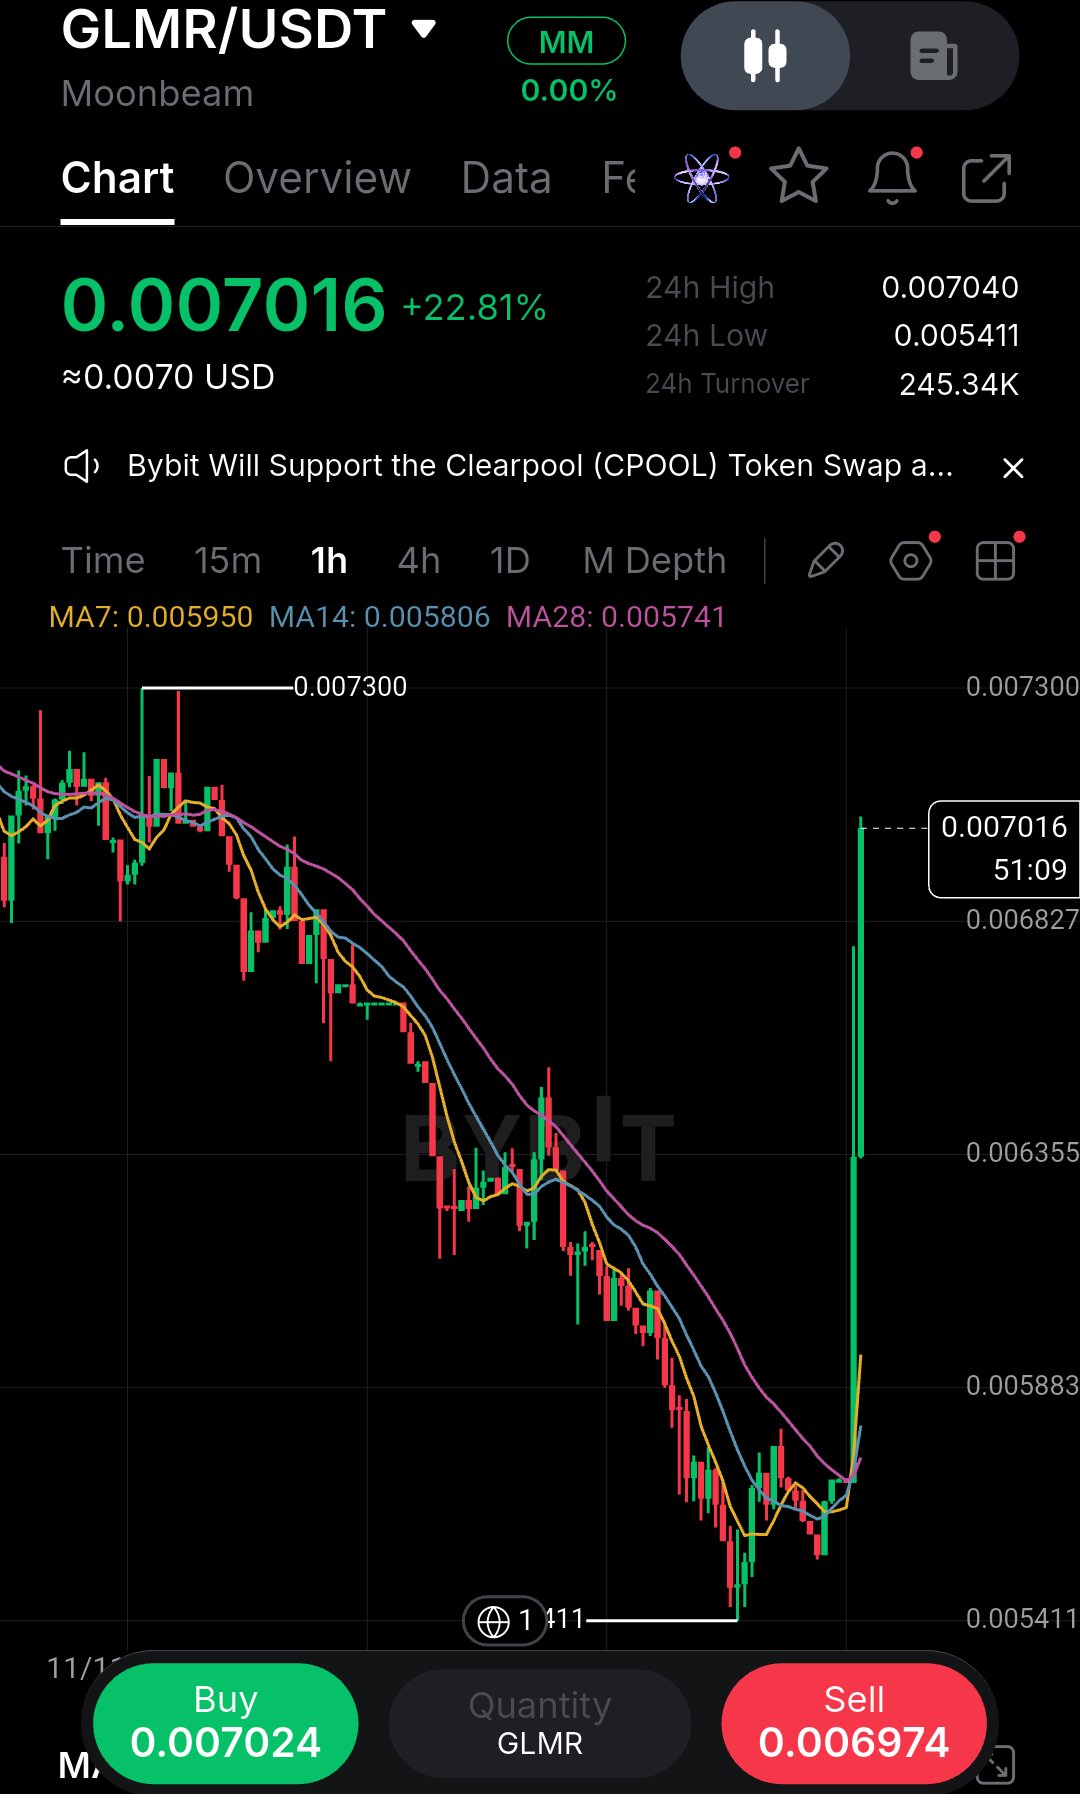
I’ve been burned buying vertical green candles like this before, so my instinct is to wait for the chart to breathe rather than chase the top. GLMR just ripped from the 0.005411 lows straight to 0.007016 on the 1h timeframe, completely clearing the moving averages. The structure shows a massive liquidity sweep, but the problem is the lack of a retest. Shorting this momentum is dangerous, and buying right here is just gambling on a pullback that hasn't happened. When a move is this aggressive, the market rarely gives you a clean entry at the current price. The candles are expanding, volatility is high, and the risk to reward from this exact level is poor because your stop loss has to be incredibly wide to survive normal noise. I’d rather let the initial FOMO cool off. If price pulls back and holds the 0.00650–0.00680 zone (near the moving average cluster), that’s the real confirmation I need. That area represents the origin of the breakout, and a successful retest there proves buyers are still defending the move rather than just chasing a green candle. Entry: 0.00660–0.00680 (on a confirmed hold) SL: 0.00620 (below the local structure) TP1: 0.00730 (prior swing high) TP2: 0.00780 Invalidation: A 1h close below 0.00635. My early mistake was always entering before confirmation. If we lose 0.00635, the pump was likely a trap, and trapped buyers will provide the liquidity for the next leg down. Do you wait for the retest or trade the breakout? #ByXIMPACT #WSOT2026 $GLMRUSDT $SPCXXUSDT
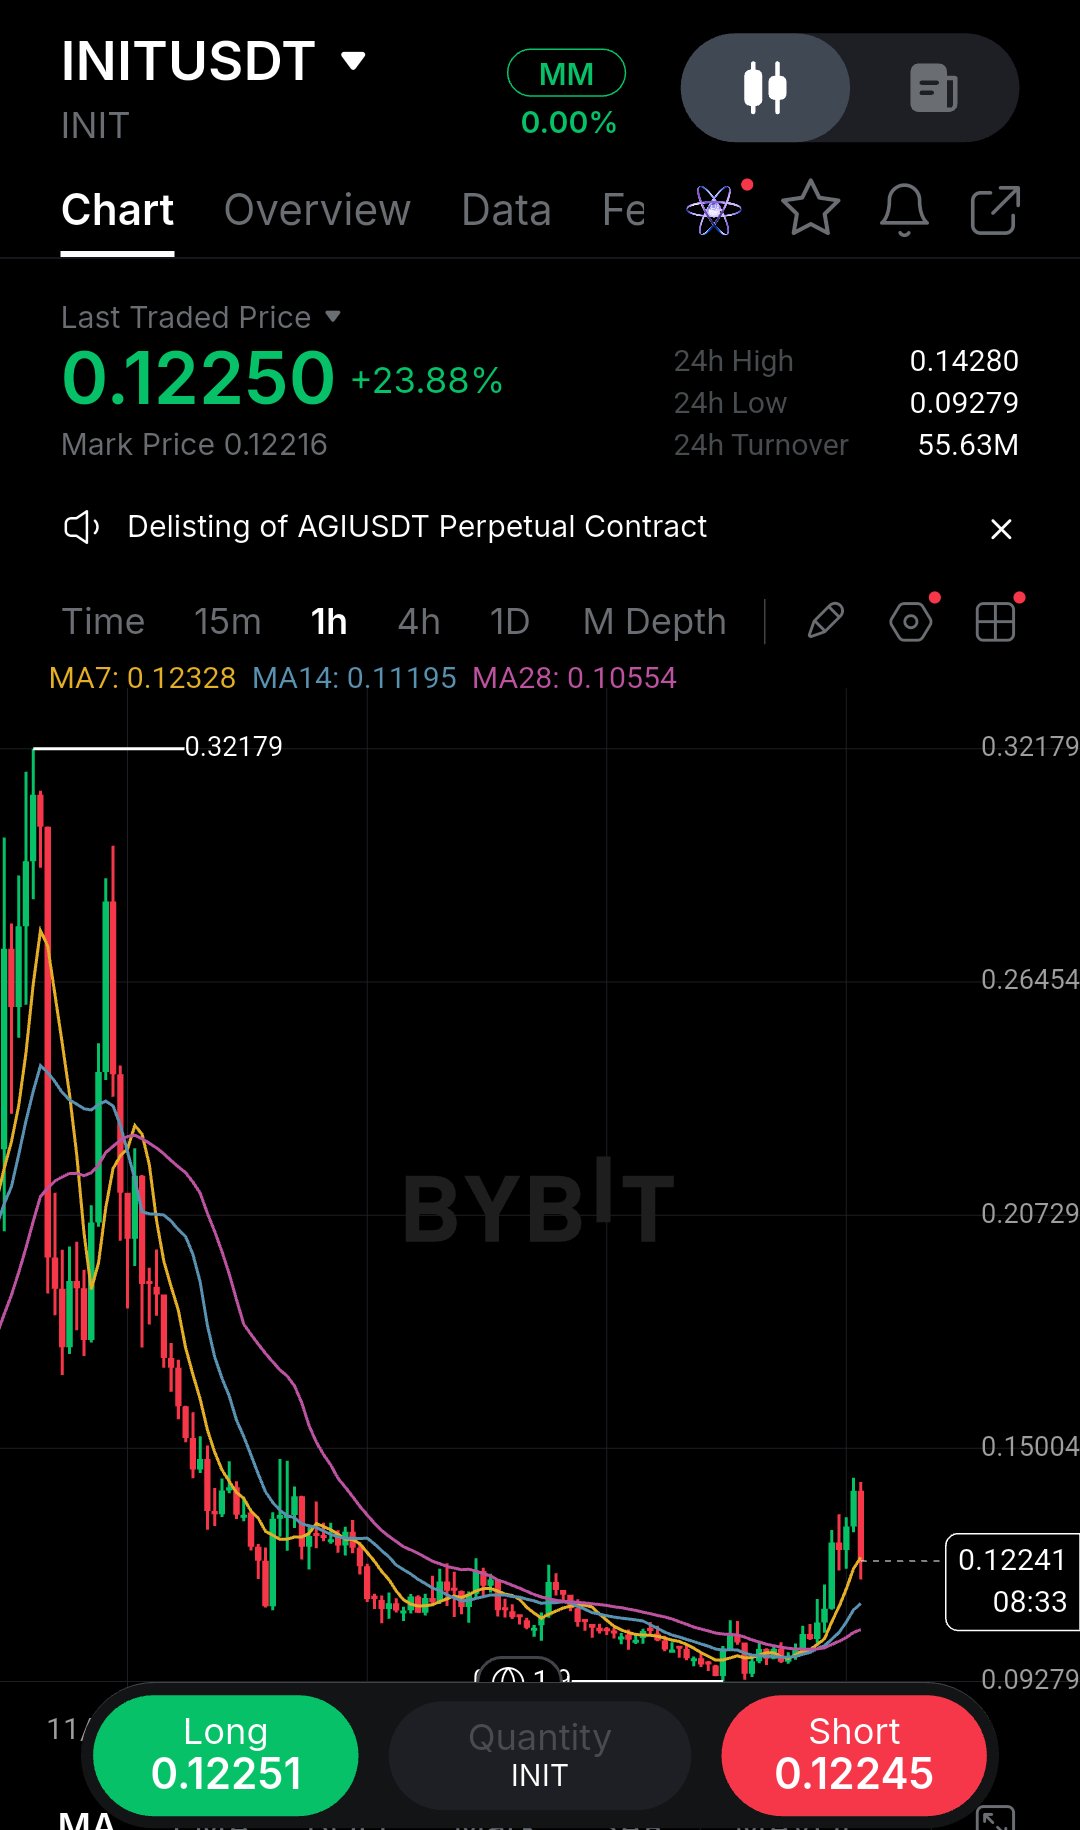
Seeing a chart finally print a strong green candle after a brutal downtrend always makes me check the higher-timeframe context before hitting buy. On this INIT 1h chart, price is up nearly 24% from the $0.09279 low, but look at the wreckage above. We are still trading way below the massive $0.32179 peak, and this current bounce is slamming directly into the MA14 resistance at $0.11195. It's easy to get distracted by the green candles, but perspective is everything in this game. What catches my eye is the pure momentum of this V-shaped recovery. It’s aggressive, but buying right into the MA cluster is usually how you get trapped. I’ve done it before buying the first green candle after a massive dump, only to watch it reject and roll over. The structure is still technically bearish overall, so I’m treating this as a potential relief rally until proven otherwise. The market has a way of luring in impatient buyers right before the next leg down, and I'd rather not be one of them. I’d rather wait for a clean retest. If price pulls back to the $0.1050–$0.1100 zone and holds above the MA28 ($0.10554), that gives us a defined higher low to trade against. The part I like about this approach is that it forces me to be patient. If the bounce is real, it will give us a structural entry. If it’s a fakeout, we avoid the drawdown entirely. Trade Plan Bias: WAIT (Long on pullback) Entry: $0.1070 – $0.1100 Confirmation: 1h bullish rejection candle off the MA28/MA14 cluster SL: $0.10100 (below the MA28) TP1: $0.12328 (MA7) TP2: $0.13500 The main risk is a complete rejection at the MA14, sending us back to the lows. If we lose $0.105 with momentum, the bullish thesis is dead, and I’m out. Do not chase the current candle; wait for the structure to confirm. Are you waiting for the retest, or fading this bounce? #ByXIMPACT #WSOT2026 $INITUSDT $HYPEUSDT
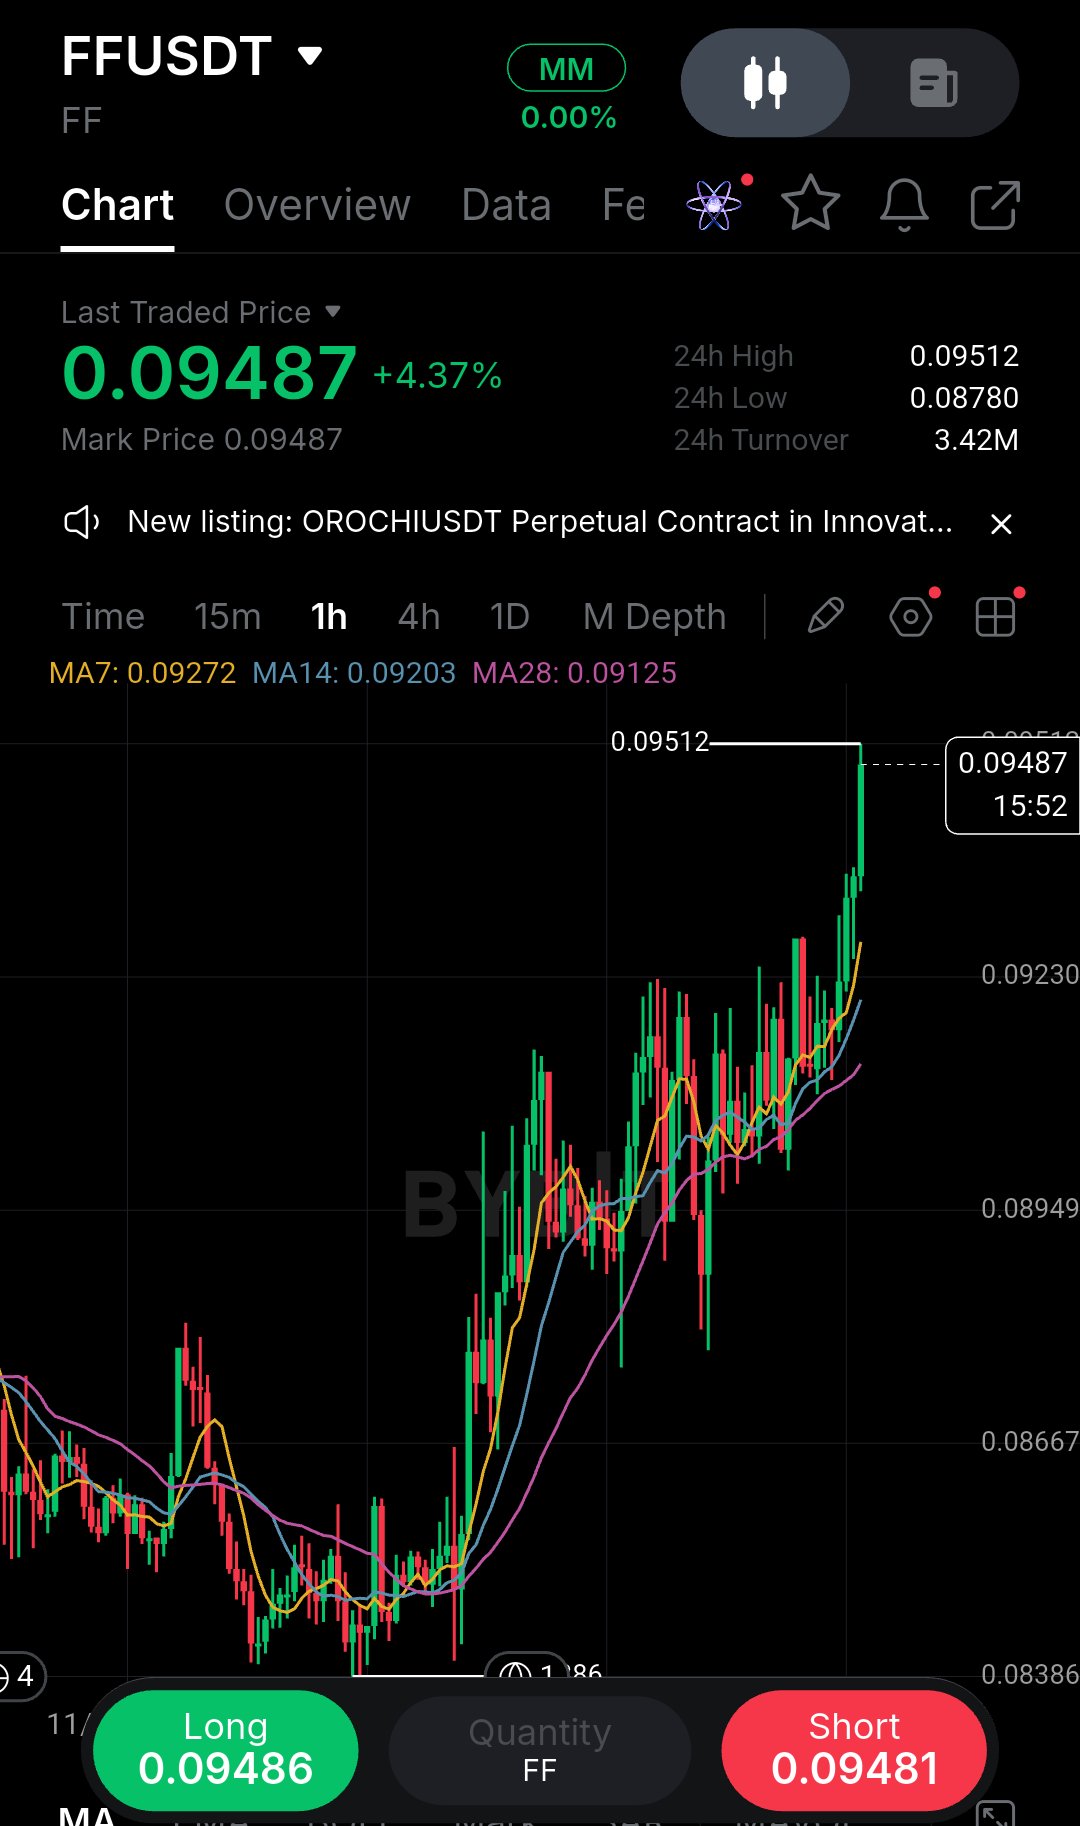
I’ve learned to be careful with vertical green candles that look ready before they actually confirm. Looking at FF on the 1H, the trend is undeniably bullish, but price is running straight into the $0.09512 high, and the last few candles are getting aggressive. What caught my attention isn't just the green momentum.It's the massive space between the current price and the moving averages. The MA7 is at $0.09272, but the MA14 sits way down at $0.09203, and the MA28 is even lower at $0.09125. That is a big gap. If you enter long right now, you are chasing a heavily extended move with your stop far away. I’ve done that before, and it usually ends with a tight stop-out the moment price breathes. The market has a habit of punishing late chasers. When a chart stretches this far from its dynamic support, the risk to reward on a fresh entry is poor. You're essentially hoping the candle keeps going up without any retracement, which is a gamble, not a strategy. My read is to wait for a retest. If this is a real breakout, price will come back to the $0.0920–$0.0930 zone to test the MA support, flush out the late longs, and give us a clean entry. The part I like about this setup is that the moving averages are stacked in perfect bullish order (MA7 > MA14 > MA28), confirming the trend. But that doesn't mean I should buy at the top. Trade Plan Bias: WAIT (Long on pullback) Entry Zone: $0.0920 – $0.0930 Confirmation: 1H bullish rejection candle on the MA cluster Stop / Invalidation: $0.09050 (below the MA28 and recent consolidation) TP1: $0.09510 (current high) TP2: $0.09800 Invalidation: A 1H close below $0.09125 kills the structure. The biggest risk is FOMO. Do not chase this candle. If it runs to $0.098 without a pullback, let it go. Accept the missed trade and move on. Are you waiting for the retest, or taking a short here? #ByXIMPACT #WSOT2026 $FFUSDT $TSLAXUSDT
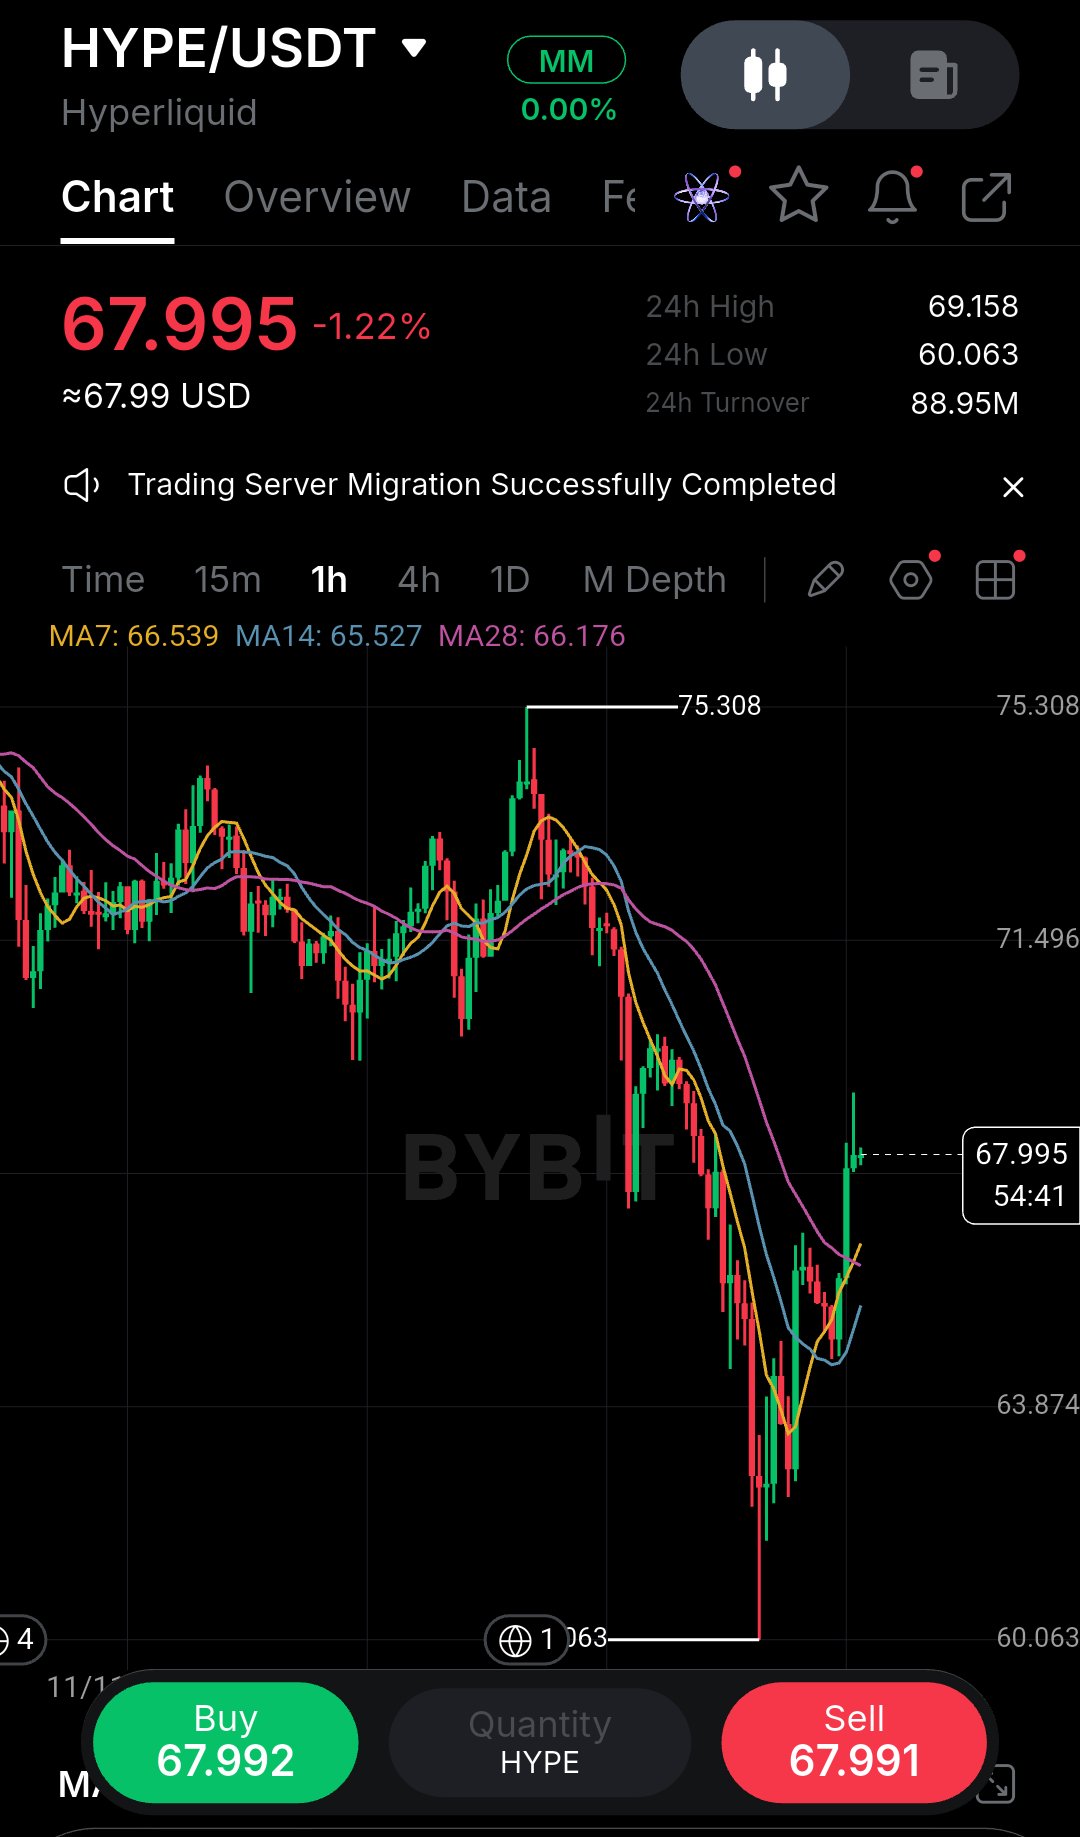
I’ve been burned before trying to catch a falling knife just because the candle looked big and green. Looking at HYPE on the 1H chart, the market structure is still fundamentally bearish despite this violent bounce from the $60.063 low. What catches my eye is how price is currently slamming into the $68–$69 region, which aligns perfectly with the MA28 at $66.17 and a previous breakdown area. The way I see it, the market just swept liquidity at the bottom, and now we're seeing a relief rally into heavy overhead supply. The $75.308 swing high remains the anchor for this downtrend. Right now, this looks like a short-term relief rally, not a confirmed reversal. I wouldn't chase this long here. Instead, I'm watching for a rejection off this resistance or a pullback to see if the lows hold. If price rejects this $69 zone and breaks back below the MA14 ($65.52), I'll look for a short. Trade Plan Bias: SHORT (on confirmation) Entry Zone: $67.50 – $68.50 (on a confirmed rejection) Confirmation: 1H bearish rejection candle (like a shooting star) or a close back below $66.50 Stop / Invalidation: $69.50 (above the recent high) TP1: $64.00 TP2: $60.50 (retest of the low) R:R: ~1:2 to TP2 if entry fills near $68.00 The risk I’m most concerned about is a true structural break above $69 that traps early shorts. If we get a strong 1H close above that level, I’d invalidate the idea and step aside. I’d also cancel the trade if price just chops sideways here without clear rejection patience is key. Personally, I'm not entering until I see the bears step back in. Are you waiting for a reclaim of $70, or fading this bounce? #ByXIMPACT #WSOT2026 $HYPEUSDT $SPCXXUSDT
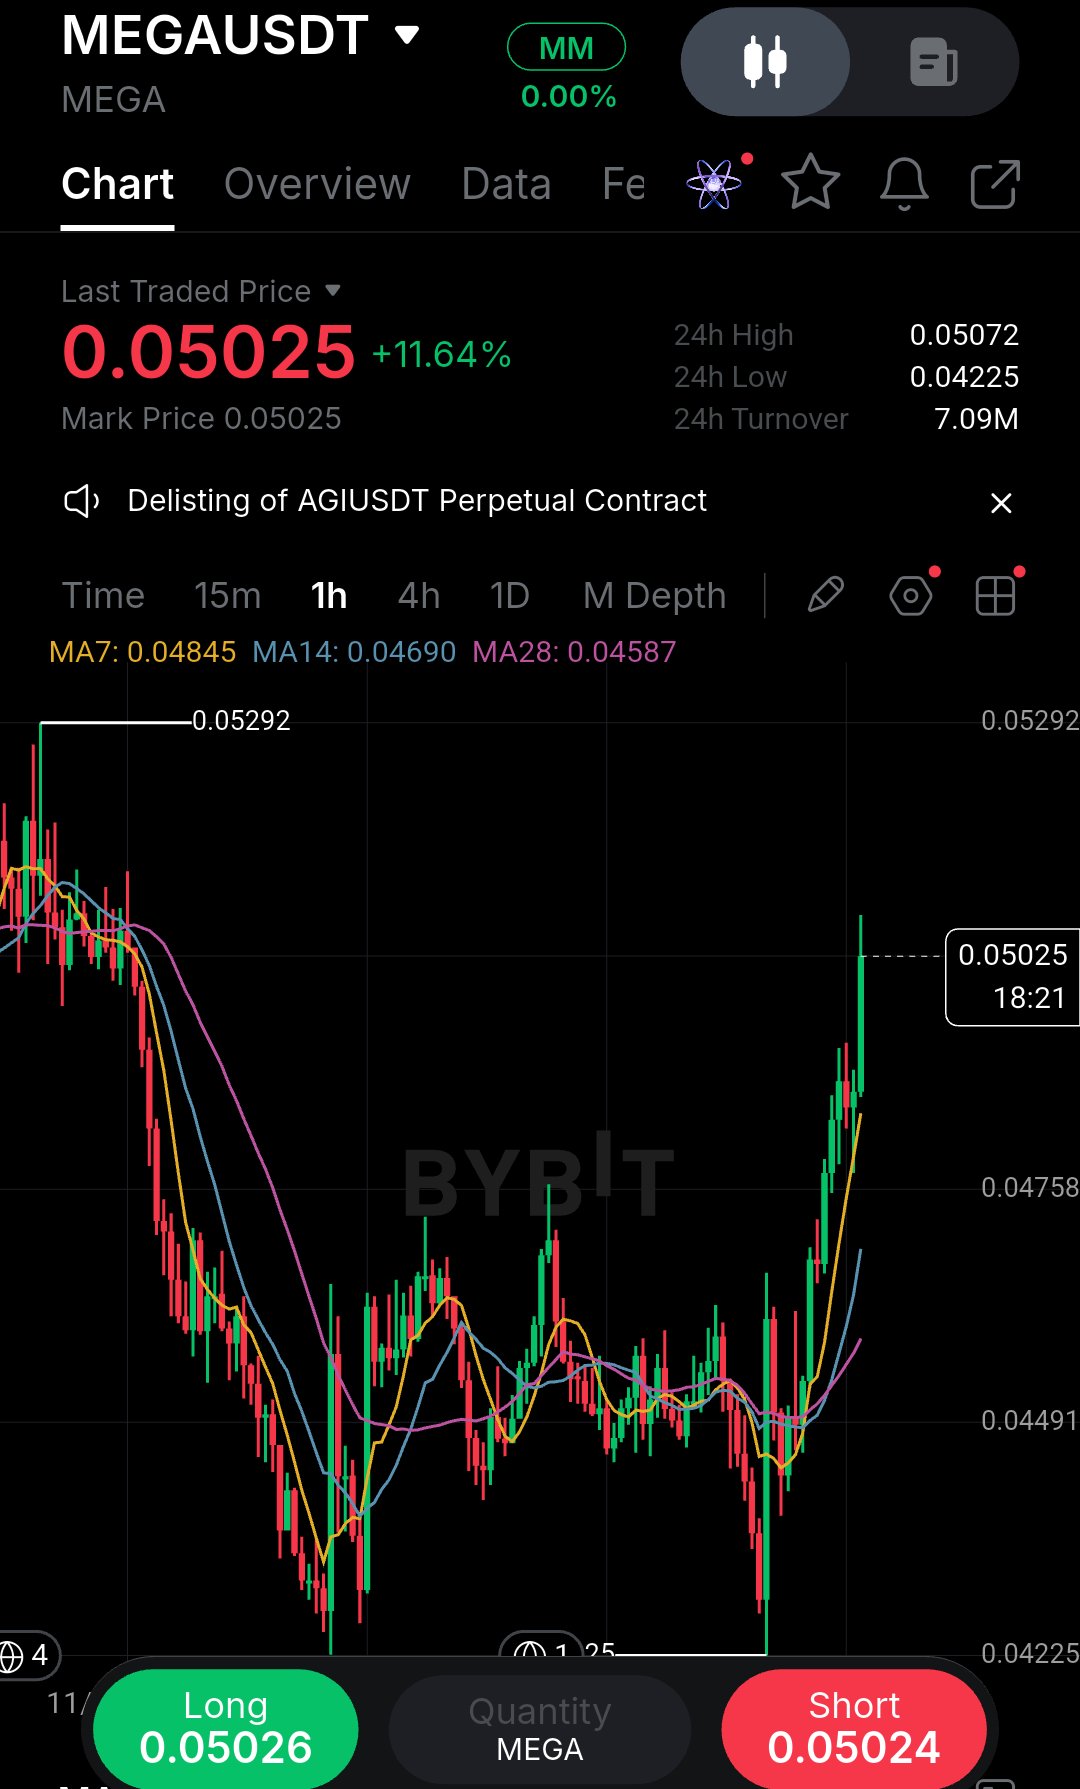
I’ve been burned chasing green candles exactly like this before, so when I see a chart this vertically extended, my instinct is to wait for the pullback rather than enter at the absolute highs. MEGA just ripped from a low of $0.042 to $0.050 in a near-vertical, parabolic move on the 1H timeframe. This kind of aggressive expansion is exciting, but it leaves a massive structural gap behind it, and late buyers are extremely vulnerable to a sudden mean-reversion snap back. While the momentum is clearly bullish right now, this is a textbook FOMO trap. The price is far detached from the 7, 14, and 28 moving averages, which are all trailing way down near $0.045–$0.048. When price gets this stretched from its dynamic support, gravity usually wins in the short term. Buying here is a poor risk-reward setup because you are risking a deep retracement just to catch the last few cents of a pump. The chart has clearly established a new 24h high at $0.05072, but there is no base, no higher low, and no tested support beneath the current price. I want to see a healthy retracement to let the moving averages catch up and allow the market to digest this move. If buyers step in and defend the $0.048 area ideally printing a higher low.That is where I would look for a calculated long. If it just keeps running without a test, I’ll simply miss it. Missing a trade costs nothing; chasing a bad entry costs capital. Trade Plan (WAIT) · Bias: Neutral / Wait · Long Entry: $0.0475 – $0.0485 (retest of the 7/14 MA cluster) · Confirmation: 1H rejection wick or bullish engulfing candle on the retest · Stop / Invalidation: $0.0465 (break of the local structural support) · TP1: $0.0505 (recent local high) · TP2: $0.0529 (major swing high) · R:R: Approx 1:2.5 based on the retest entry The main risk here is a total failure of the rally. If price loses $0.046 without showing any signs of demand, the trend is likely reversing, and the quick momentum money has already left the building. Patience is key; wait for the structure to reset and give you a proper entry. Are you waiting for the pullback, or are you buying the breakout? #ByXIMPACT #WSOT2026 $MEGAUSDT $SPCXXUSDT
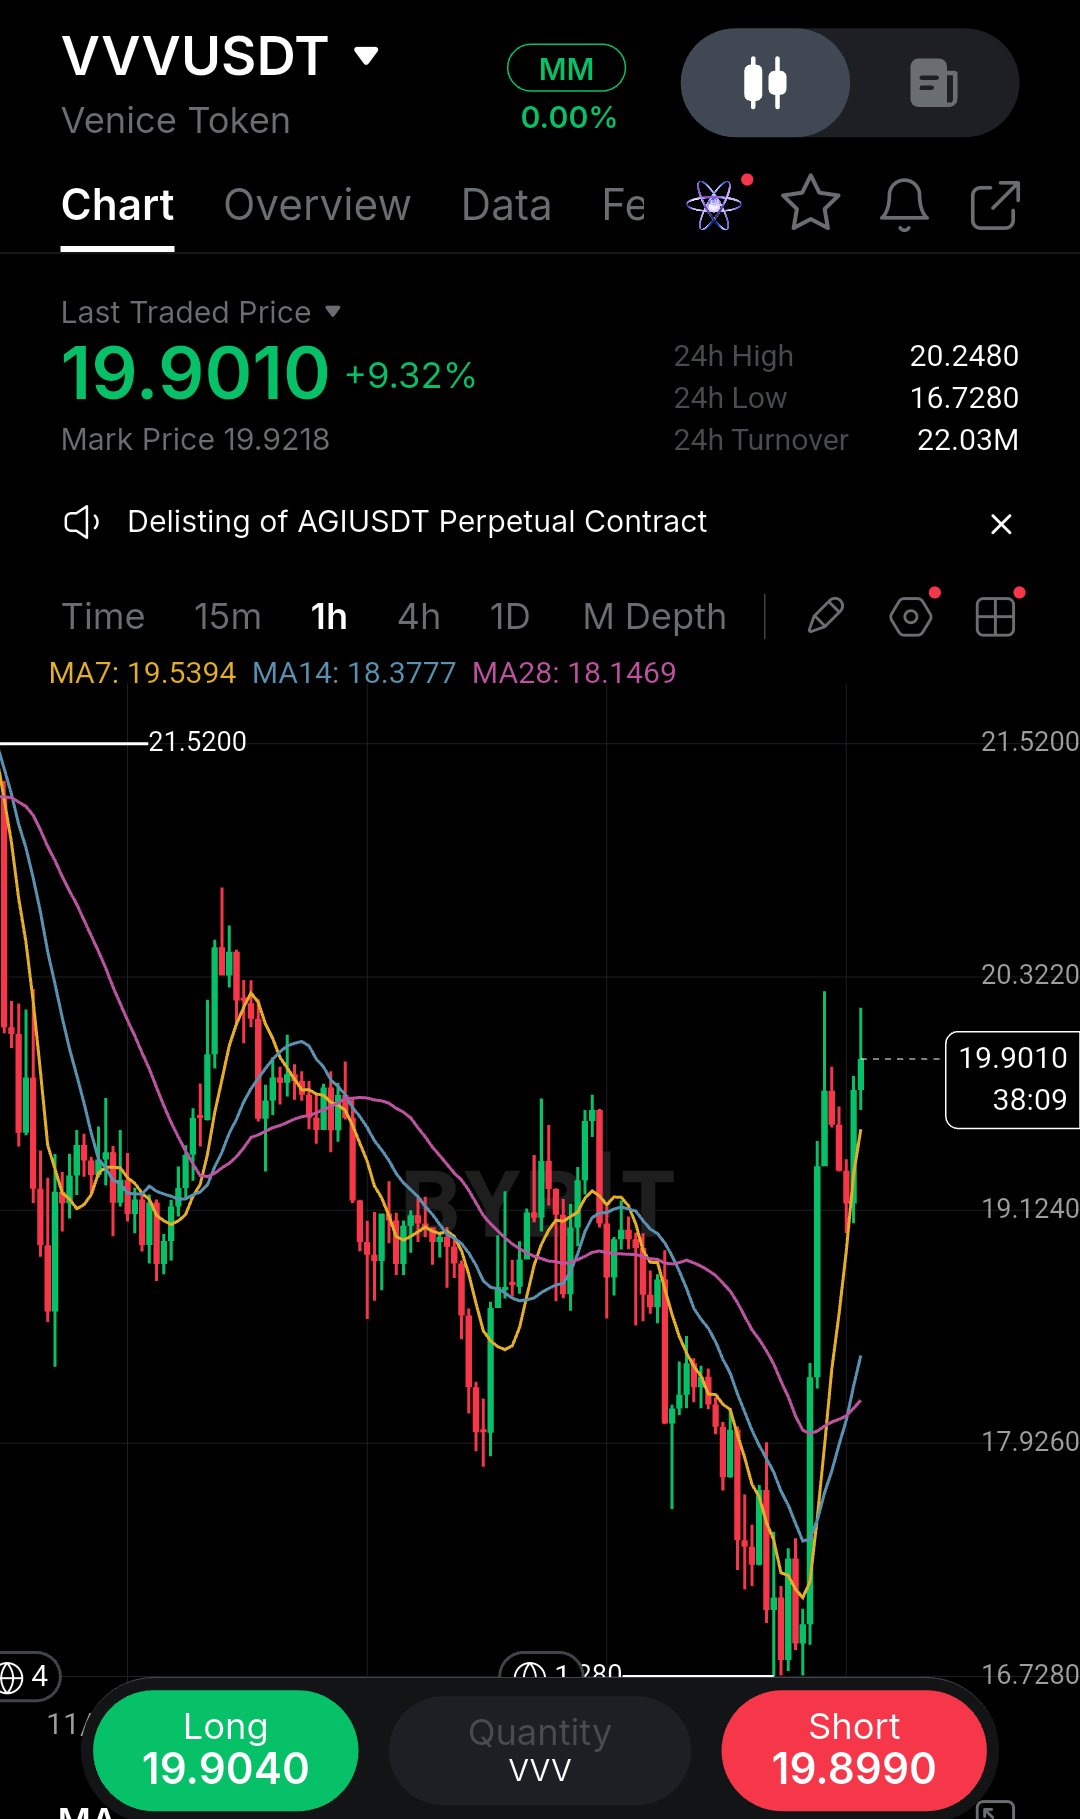
What caught my attention on this VVVUSDT 1H chart is the sheer violence of that recent bounce. After bleeding down to a local low of $16.72, price printed a massive V-shaped recovery, ripping straight back up to test the $20.20 region. It is the kind of aggressive, impulsive move that forces traders to make emotional decisions—either chasing the green candles out of FOMO or trying to short the top without confirmation. Right now, the market structure is in a heavy retracement phase following that impulse. Price is cooling off at $19.90, holding just above the 7-period moving average ($19.53) while the 14 and 28 MAs trail below at $18.37 and $18.14 respectively. The moving averages are fanning out, which is generally a bullish sign, but the price action is currently compressing. My read is that we are at a critical decision point. Chasing a long here is risky because you are buying right into the overhead resistance from the previous breakdown. The market clearly rejected the $20.20–$20.30 area on that first spike, leaving a cluster of wicks that tell me sellers are defending that zone. Conversely, shorting a market with this much raw bullish momentum is dangerous unless we see a clear structural break down. I have seen too many traders fade strong recoveries and get stopped out on the next leg up. Personally, I’d rather wait for the market to show its hand rather than guess the next move. If the bulls want to take control, they need to absorb this selling pressure and print a clean higher low. If the bears want to trap the late longs, they will defend $20.20 and drive price back down toward the $18.30 support. That is the battleground. Trade Plan (WAIT / Conditional Setup) · Bias: Neutral / Wait · Long Entry: $19.60 – $19.80 (Only on a successful retest holding above the 7-MA) · Confirmation: 1H candle close above $20.25 (clearing local resistance) · Stop / Invalidation: $19.10 (loss of short-term moving average support) · TP1: $20.50 · TP2: $21.50 (previous major swing high) · TP3: $22.50 (extension) · R:R: Approx 1:2 on the initial TP1 The biggest risk right now is a failed breakout leading to a lower high. This often happens after a massive impulse—retail buyers get trapped at the top, and the market maker sweeps the lows. If price loses the $19.10 level, the immediate momentum shifts bearish, and I would expect a retest of the $18.30 support zone. I’d stay patient until we see a decisive close out of this current consolidation. Are you guys anticipating a break of $20, or are you expecting this bounce to get sold back down? #ByXIMPACT #WSOT2026 $VVVUSDT $SPCXXUSDT
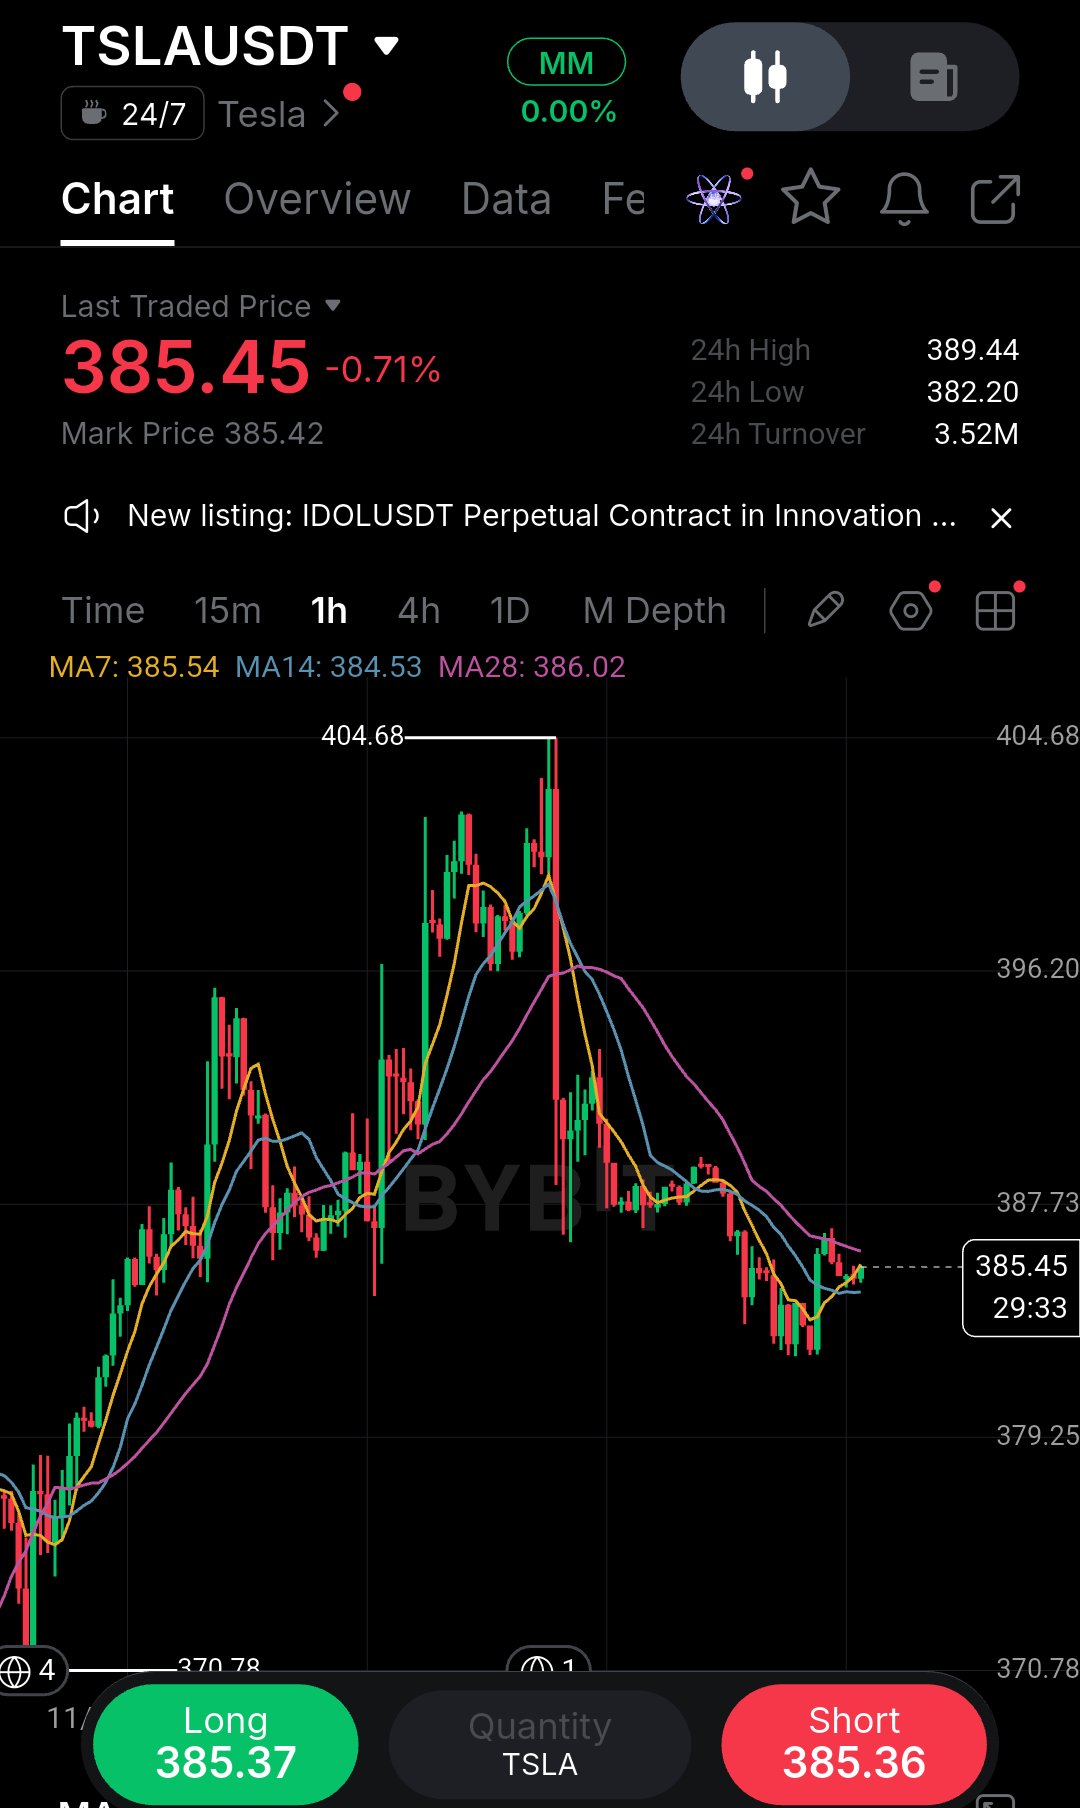
I’ve learned to be careful with charts that look like they’re stabilizing before they actually confirm a real shift in trend. What made me pause on this TSLAUSDT 1h chart is the way price is interacting with the moving averages after that heavy drop from the 404.68 peak. We are currently seeing a minor bounce off the local lows, but the MA7 and MA14 are still pinned below the MA28, keeping the broader market structure firmly bearish. The momentum from the initial sell-off was strong, and bounces like this often struggle to find follow-through when the moving averages are stacked against them. The part I’d rather not ignore is the current level around 385.45. If you look left, this area acted as a minor pivot before the big breakdown, meaning it now likely acts as dynamic resistance. I wouldn't rush to call this a reversal yet. The biggest risk here is buying a dead-cat bounce right into overhead supply. I’ve made that exact mistake before jumping in too early on a green candle only to watch the price get immediately rejected by the moving averages. Because of that experience, I’d prefer to wait for a clear shift in momentum and a confirmed structural break before taking a long. Furthermore, the 24-hour turnover is sitting at 3.52M, which tells me there isn't a massive surge of aggressive buyers stepping in to reverse this trend just yet. A true reversal usually requires volume and a decisive reclaim of key levels. My plan is to stay patient until price either reclaims 386.50 with conviction or rejects cleanly from here. Long Entry: 386.60 – 386.80 (on a 1h close above) SL: 384.80 TP1: 389.44 TP2: 396.20 Invalidation: A loss of the recent 384.50 local low. If it rejects here, I’ll stay flat and avoid forcing a trade in a choppy environment. Are you waiting for a reclaim or fading this bounce? #ByXIMPACT #WSOT2026 $TSLAXUSDT $SPCXXUSDT
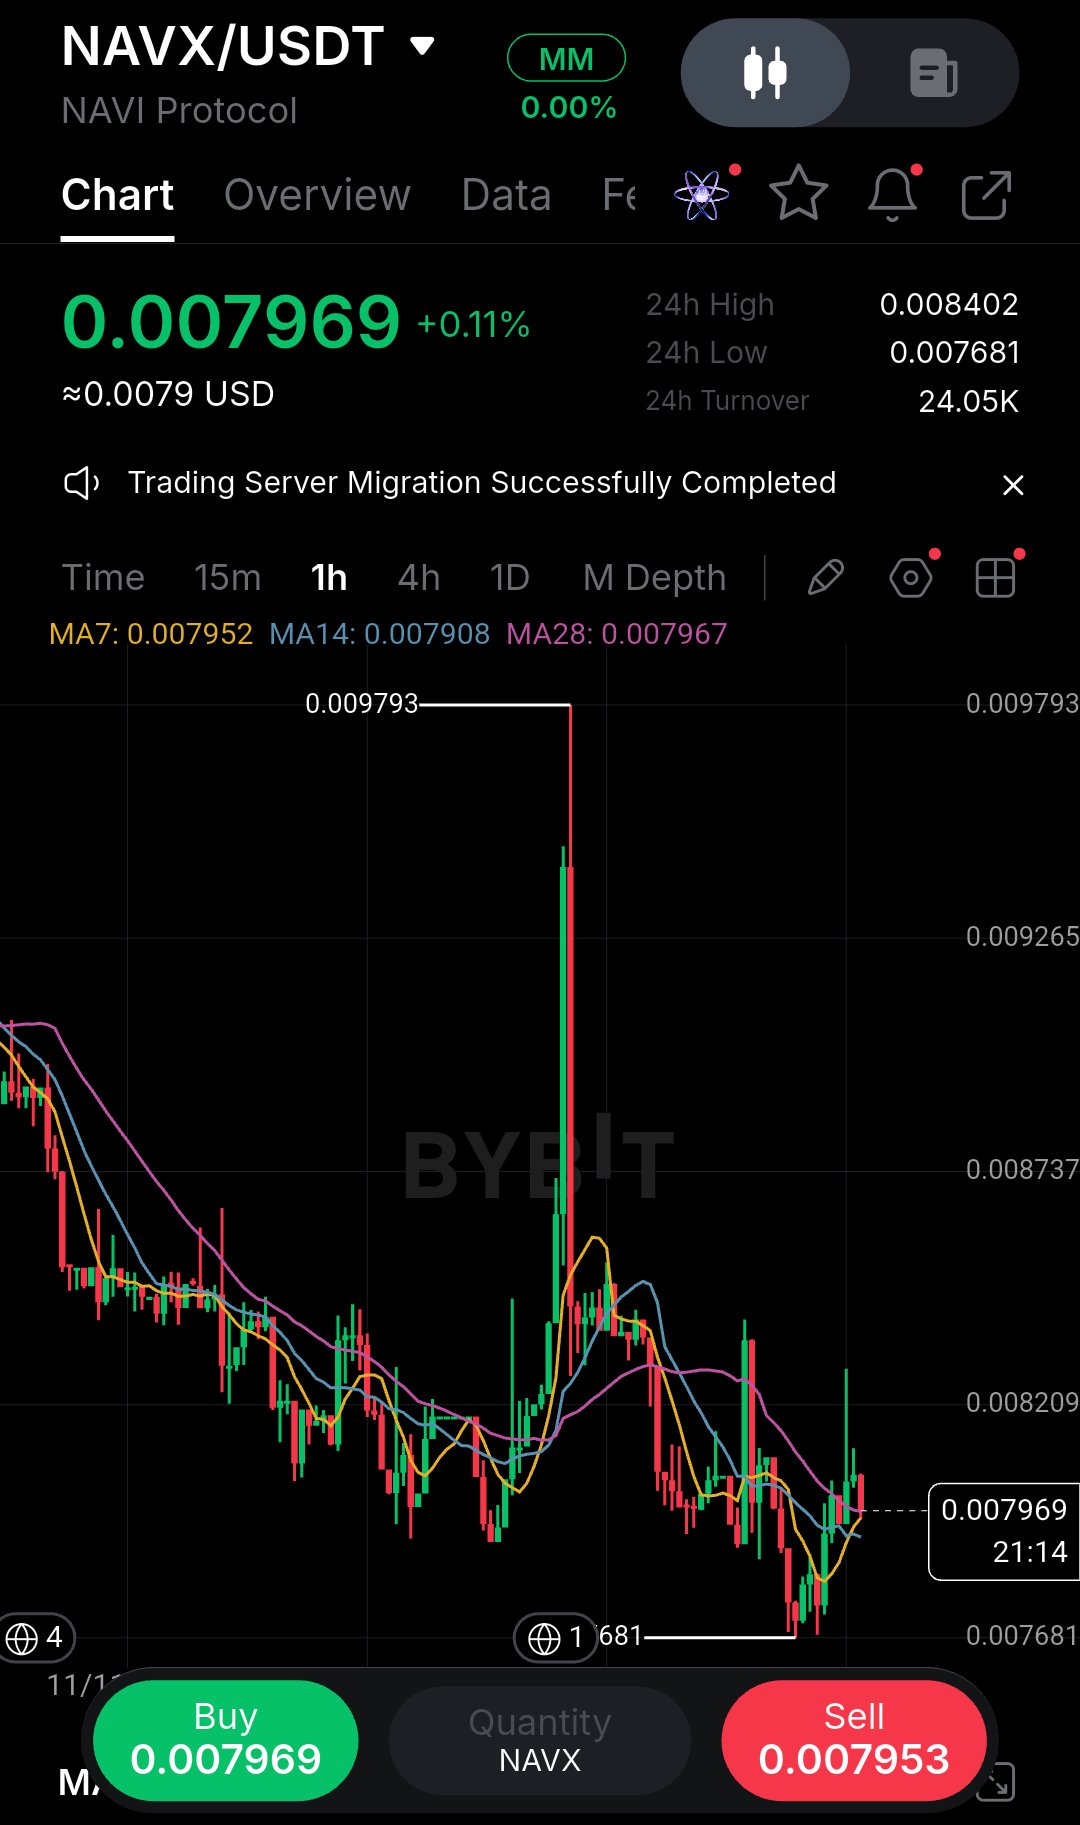
I’ve learned the hard way to be careful with charts that look like they are basing before they actually confirm it. I’ve been trapped by early entries plenty of times, buying a bounce only to watch it get immediately rejected. What made me pause and look closer at this NAVX 1h chart is that massive red wick stretching all the way up to 0.009793. That wasn't a real pump driven by organic spot buying; it looks exactly like a quick liquidity grab to sweep late shorts before price was violently rejected right back down. Since that sharp flush, we’ve seen a slow bleed out to the 0.007681 low. However, the current price action is starting to get interesting. I’m now seeing price reclaim the 7 and 14 moving averages and begin printing a series of higher lows. The local structure is definitely trying to shift, but we have to acknowledge the context: the volume is incredibly thin at just 24K. With such low turnover, it doesn't take much size to push the price around in either direction, which makes this environment highly prone to fakeouts. Because of that low liquidity, I wouldn't chase this current green candle. I’d rather wait for a clear structure retest to manage my risk properly. Direction: Long (on confirmation) Entry: 0.00785 – 0.00795 Confirmation: A strong 1h close above 0.00805, or a successful retest of 0.00785 holding firmly as support. SL: 0.00765 (Just below the recent swing low) TP1: 0.00820 TP2: 0.00840 TP3: 0.00875 Invalidation: A breakdown below 0.00768. The biggest risk here is getting trapped in another fakeout. If we lose that 0.00785 level and break back below the MAs, my thesis is dead, and I'm stepping out. I’d rather miss a move than force a position. Are you waiting for a confirmed breakout, or looking for a lower entry? #ByXIMPACT #WSOT2026 $NAVXUSDT $AAPLXUSDT
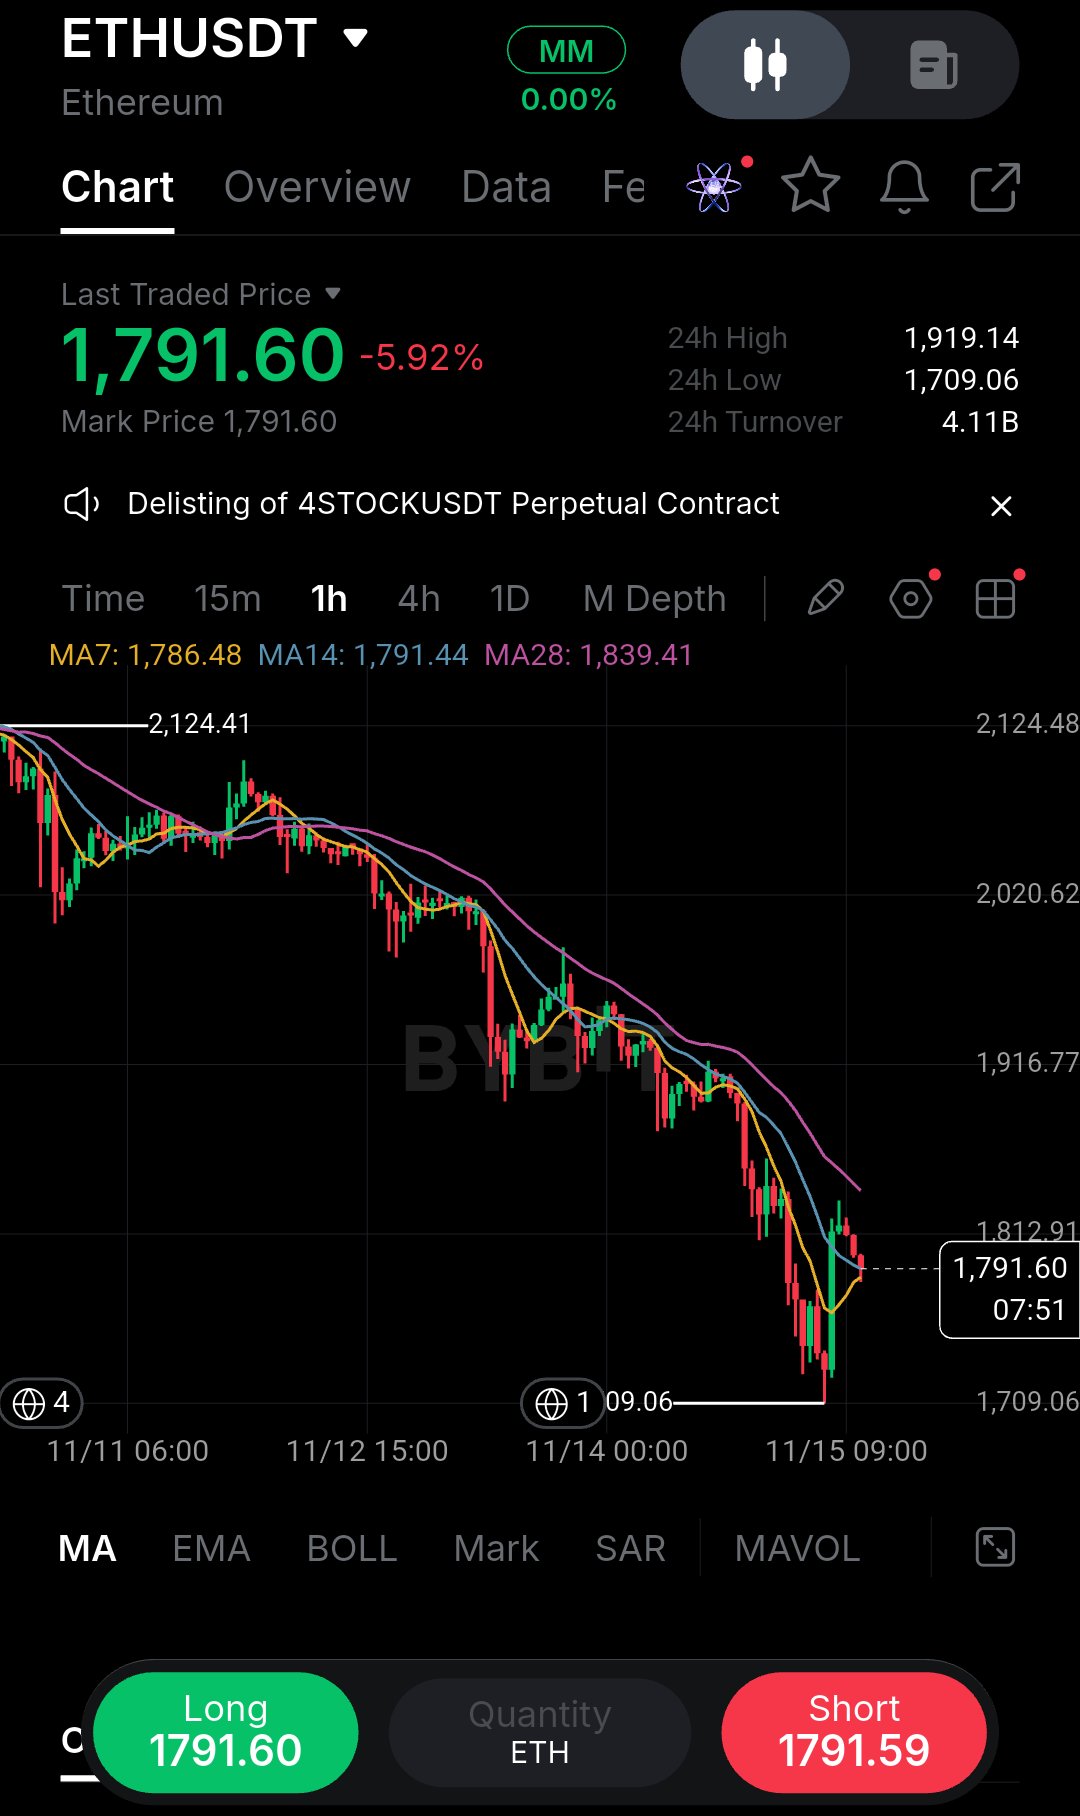
I’ve learned to be skeptical of sharp bounces inside a heavy downtrend, so this ETH chart has my full attention. After bleeding down to a low of $1,709, price printed a strong relief rally and is now pressing $1,791.60. What stands out is that we are hitting dynamic resistance.The MA14 sits right at $1,791.44. That’s not a coincidence; it’s the first real test for the bulls. The trend is still heavily bearish, given the massive drop from $2,124, but the short-term momentum has shifted. Bulls are trying to reclaim ground, but right here, the market is at a decision point. I wouldn’t rush to long this immediate bounce, nor would I blindly short into this localized strength. The candles are green, the volume is picking up, and that’s exactly when FOMO kicks in. But a bounce is not a reversal until the structure proves it. I’m waiting for a clean 1H close above $1,800 to confirm a structural shift, or a clear rejection here to short the next leg down. The $1,800 level is psychological, and it’s just above the MA14 and MA7. If price closes above it, the short-term trend flips, and we can target the MA28 at $1,839. If it rejects, the downtrend resumes, and we look for a lower high to short. If we get a strong close above the MA cluster: Long Entry: $1,805 SL: $1,750 (below the local support) TP1: $1,840 (MA28 resistance) TP2: $1,880 The risk: getting caught buying a dead-cat bounce. I’ve been burned chasing green candles in a downtrend before, and it taught me to wait for confirmation. A close above $1,800 is the signal; until then, this is just noise. Don’t enter until the level proves itself, and don’t move your stop if price wicks against you. If the setup invalidates, accept it and move on. Are you buying this dip or waiting for a lower high to short? #ByXIMPACT #WSOT2026 $ETHUSDT $BTCUSDT
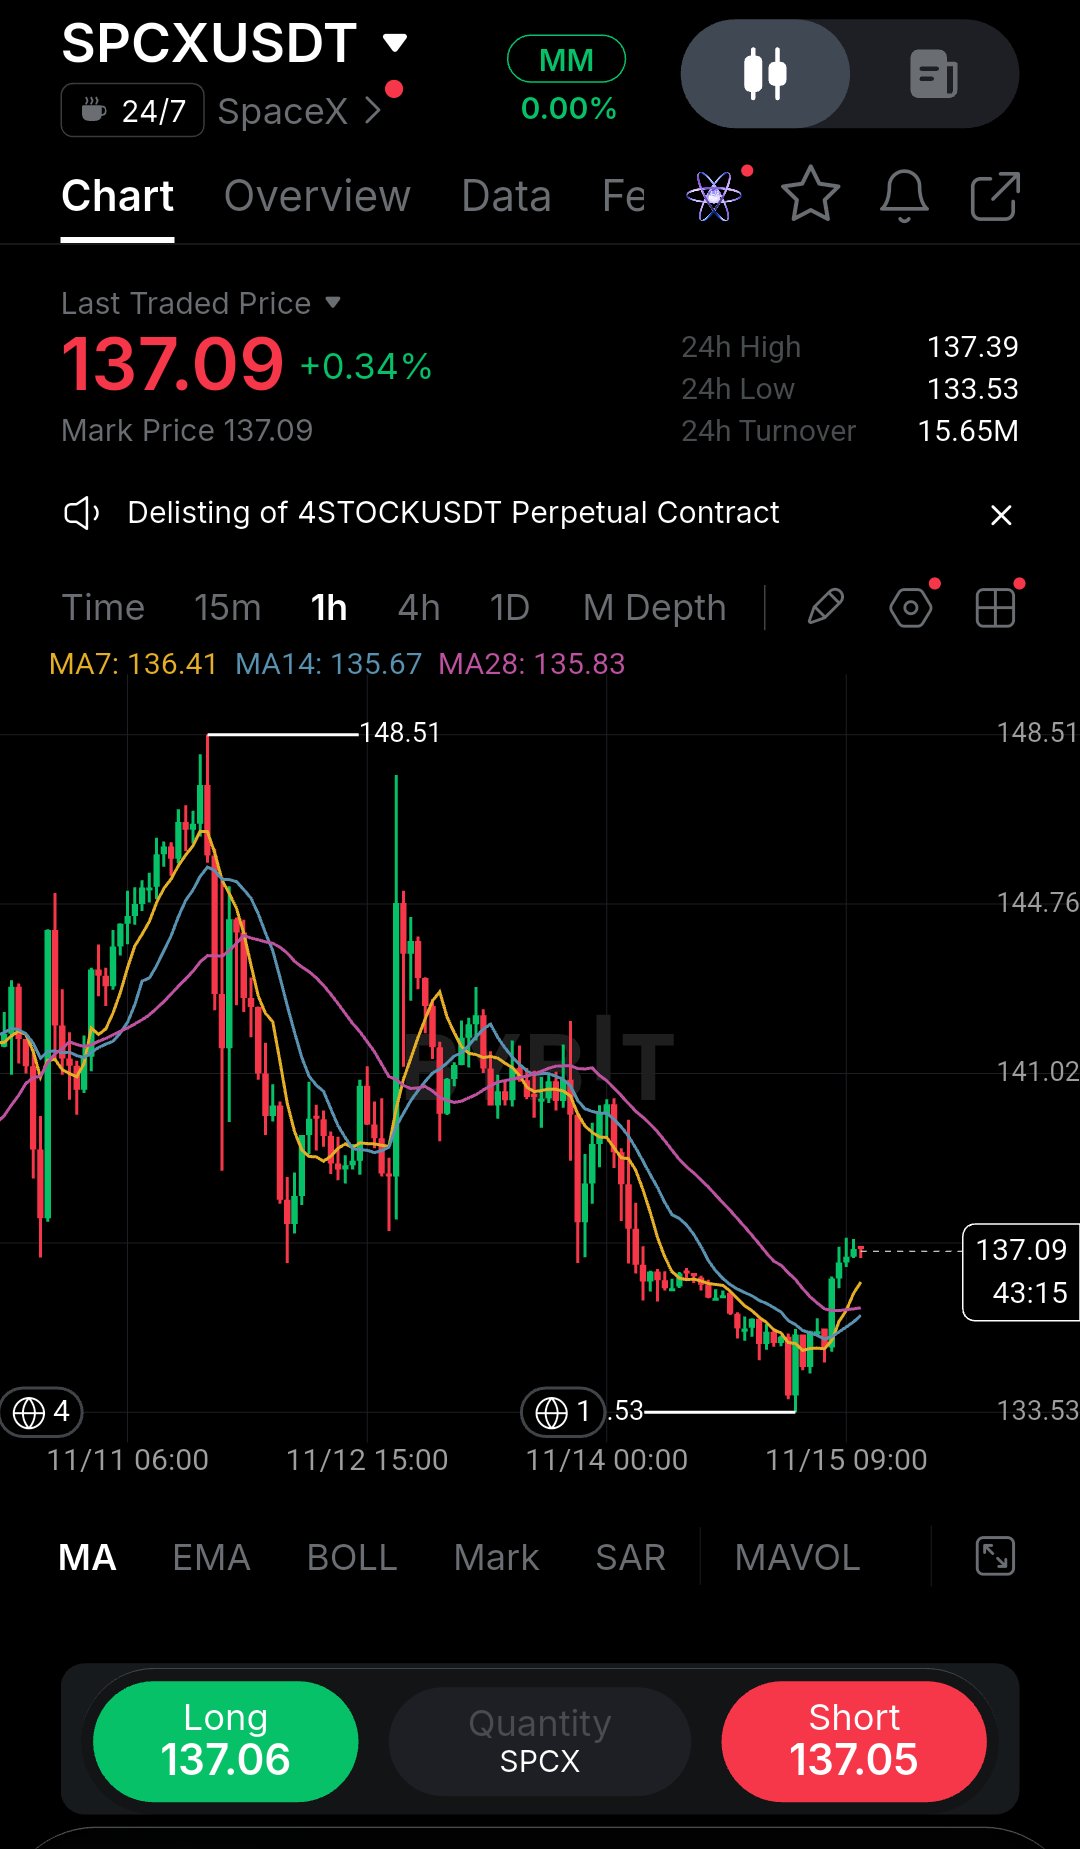
I’ve caught myself jumping on recovery bounces too early, so I’m watching this SpaceX chart with a bit more patience. Price dumped hard to 133.53, but instead of continuing lower, it printed a sharp reclaim. Now it’s holding above the short-term moving averages MA7 at 136.41, MA14 at 135.67, and MA28 at 135.83 and pressing 137.09. That aggressive defense of the low is the key detail here. The market structure shifted from aggressive selling into a sudden display of buying pressure, and that’s exactly the kind of transition that traps impulsive traders on both sides. Let’s break down what the chart is actually telling us. The structure looks like a short-term exhaustion bounce. Sellers failed to break the 133.53 floor decisively, and the subsequent move created a potential liquidity sweep of late shorts. Notice how the price didn’t just stabilize; it ripped back above all three moving averages in a single impulsive leg. That’s a signal that the immediate downside momentum has stalled. However, we are still trading well below the 148.51 swing high, and the broader 1H trend remains damaged. The 141.02 level is the critical test.It acted as support on the way down, and it’s now the first major supply zone overhead. If buyers can hold this reclaimed zone, the next logical test is that 141.02 area, followed by 144.76. But we must respect that this is a counter-trend play until proven otherwise. Here’s how I’m playing it: Entry: Wait for a 1H close above 137.10 to confirm the reclaim and avoid getting faked out by a wick. SL: 135.50 (below the MAs and the recent consolidation base). TP1: 141.02 TP2: 144.76 Invalidation: A clean 1H close back below 135.50 kills the bounce thesis and suggests sellers are regaining control. My lesson here: don’t confuse a violent relief rally with a full trend reversal. I’ve been burned before by entering on the first green candle after a dump, only to watch the price roll over at the moving averages. That’s why I’m waiting for the close above 137.10 rather than buying the initial spike. The risk is tight because the low is clearly defined at 133.53, giving us a favorable risk-to-reward ratio if the bounce materializes. But if this doesn't hold, I'm out no moving stops, no hoping. The trading psychology here is crucial. After a drop like that, FOMO kicks in when you see the green candles printing. But the professional approach is to let the market prove itself first. A close above 137.10 shows buyers are willing to pay up, not just cover shorts. If we get that confirmation, the trade is valid. If we don't, we sit on our hands. That discipline is what separates a good setup from a forced trade. Are you waiting for the breakout confirmation or fading the resistance at 141? I’d love to hear how you’re reading this structure. #ByXIMPACT #WSOT2026 $SPCXXUSDT $AAPLXUSDT
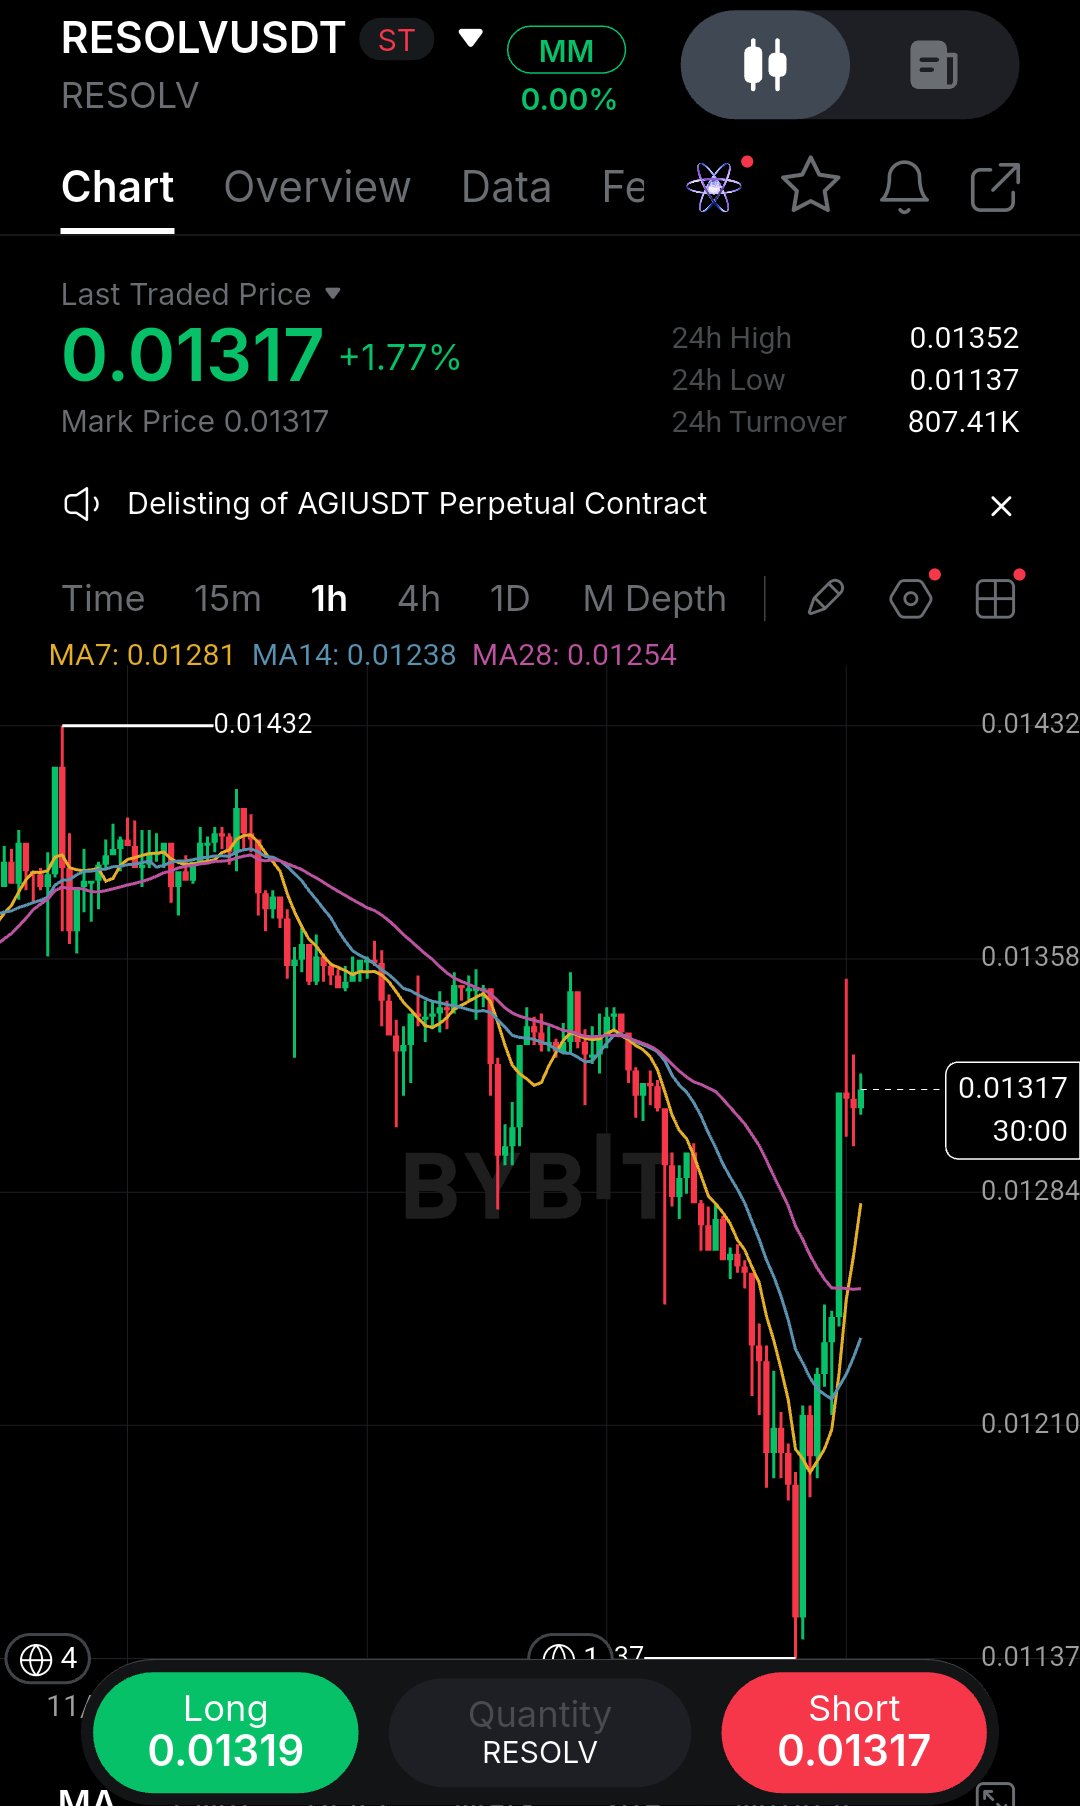
I’ve seen too many traders get chopped up trying to catch a falling knife, which is why I always wait for a clear structural break before acting. What stands out on this RESOLVUSDT 1h chart is the brutal sell-off down to $0.01137, followed by a sudden, aggressive V-shaped bounce. It looks tempting, but recovering from that kind of vertical drop is rarely a straight line. My read is that the market structure is still primarily bearish, and this bounce is likely just a relief rally. Price is currently hovering around $0.01317, pushing directly into the cluster of moving averages (MA7, MA14, MA28) which are acting as dynamic resistance. I’m treating this $0.01330–$0.01350 zone as a potential lower high. Rather than buying this green momentum, I’d prefer to wait for exhaustion and rejection here to target the downside. Execution Plan: Bias: SHORT Entry: $0.01320 – $0.01350 Confirmation: Bearish rejection wick or 15m close back below $0.01300 Stop / Invalidation: $0.01370 TP1: $0.01250 TP2: $0.01210 R:R: Approx 1:2 The biggest risk is a sudden breakout above the moving averages, which would trap shorters and force a squeeze. If price closes above $0.01370, I’m out and reassessing. Don't fade the bounce until it actually stalls and prints a clear lower high. Patience here is crucial because the volatility is extreme. Are you waiting for the rejection, or trying to catch this falling knife? #ByXIMPACT #WSOT2026 $RESOLVUSDT $AAPLXUSDT
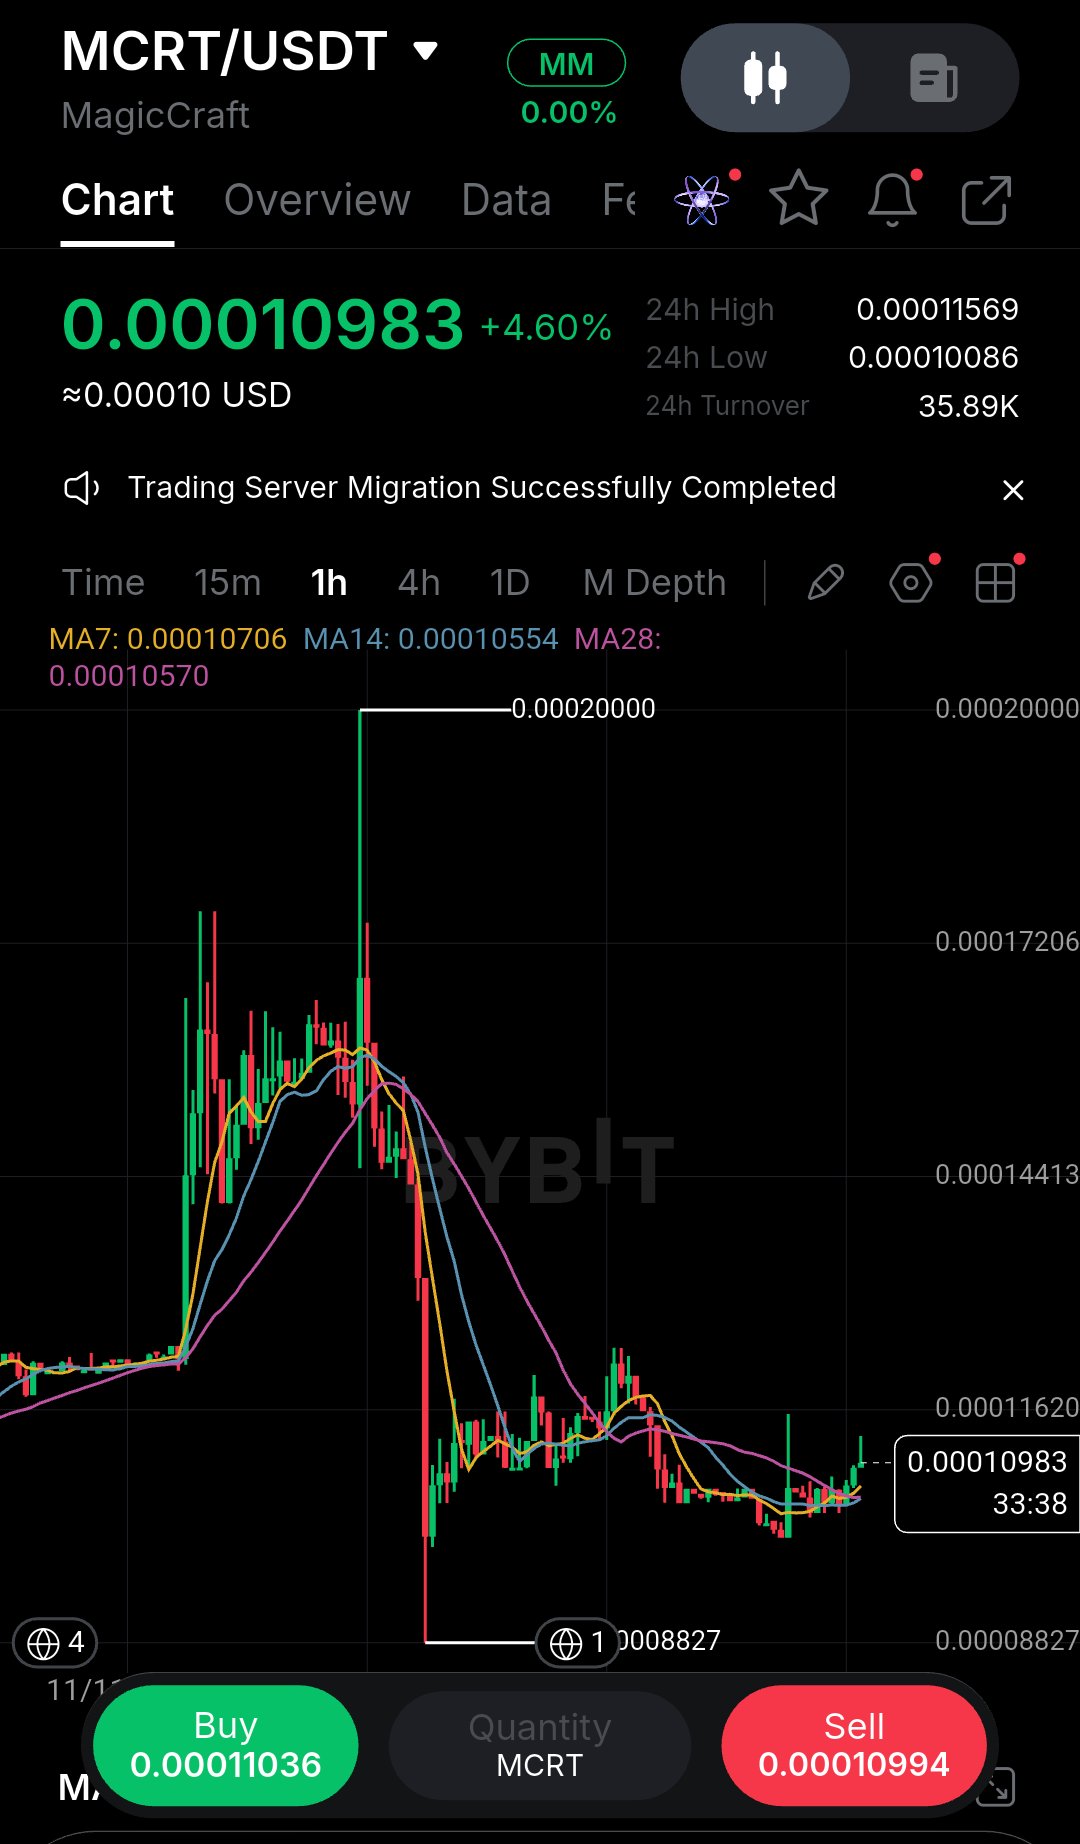
I’ve definitely been burned before by trying to catch falling knives, so I pay close attention when a chart finally stops making lower lows. What caught my eye on this MCRT 1h chart is the violent flush down to 0.00008827 followed by the choppy, slow grind we are seeing now. That massive red candle wiped out a lot of late buyers, and we are currently sitting at 0.00010983, trying to establish some footing. The market structure is heavily damaged, but price is currently trying to find a floor. The moving averages are flattening out near 0.00010554, which tells me the intense selling pressure is finally pausing. I’m treating this as a potential short-term reversal rather than a continuation. Instead of shorting into support, I’d rather look for a relief bounce if buyers can step up here. The key for me is the local resistance around 0.00011620; a clean break and hold above that level would confirm a shift in market structure and give the bulls some breathing room. Execution plan: Bias: LONG (Scalp) Entry: 0.00010800 – 0.00010980 Confirmation: Bullish 1h close above the MA14 SL: 0.00010086 (Below local support) TP1: 0.00011620 TP2: 0.00014413 Invalidation: A breakdown below the recent sweep low at 0.00008827. The biggest risk is that this is just a dead cat bounce and sellers use it to reload shorts. Don't chase the green candles; wait for a clear structural reclaim. If price struggles to push past the MA14 and starts printing lower highs again, I am out. Position sizing here should be conservative because volatility is high and liquidity is thin. Are you waiting for a confirmed higher low, or just fading the current momentum? #ByXIMPACT #WSOT2026 $MCRTUSDT $AAPLXUSDT
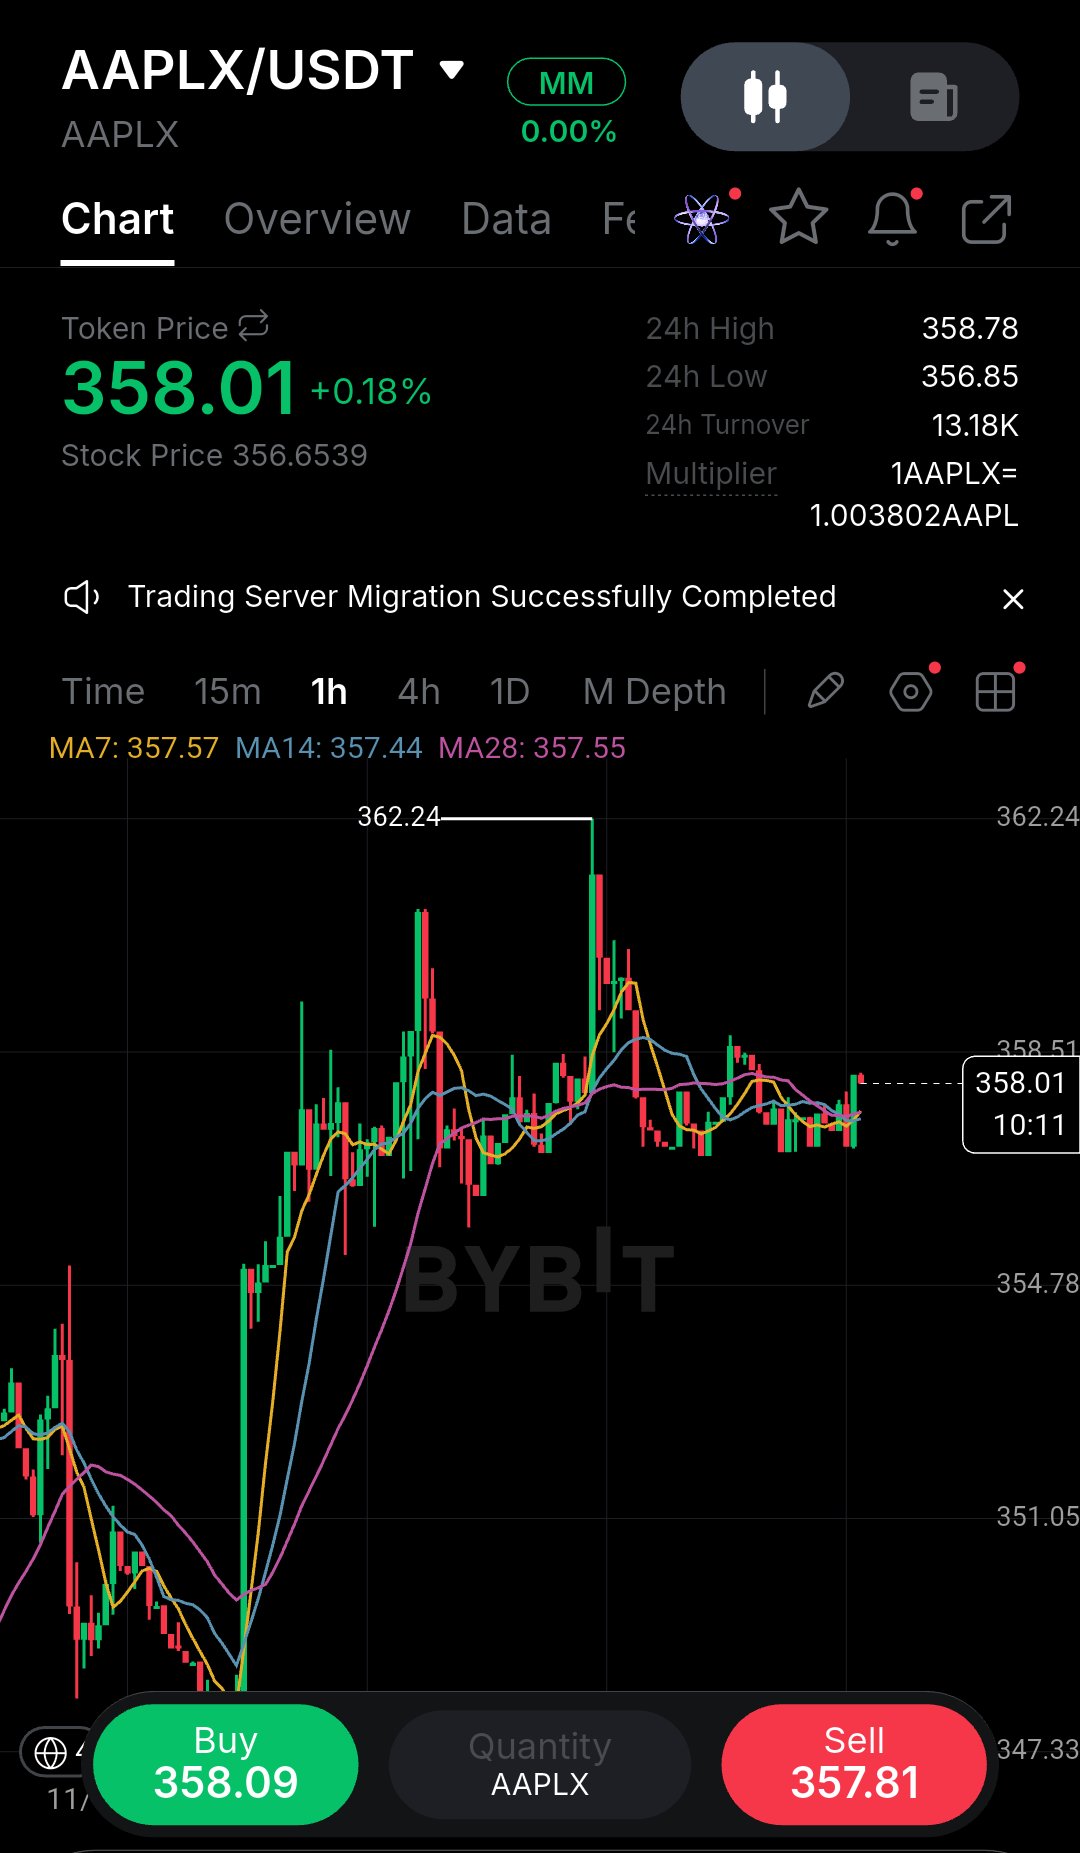
I’ve learned to be cautious when price hovers in a tight cluster because that’s usually where impatient traders get chopped up. What caught my eye on this AAPLX 1h chart is the heavy rejection from the $362.24 high followed by a slow, grinding drift down to the $357–$358 zone. The market structure looks heavy. Price is currently pinned right on the moving averages (MA7, MA14, MA28), all tangled around $357.50. This tight compression suggests a volatile expansion is near, but the momentum favors the downside. That $362 rejection left a lot of trapped buyers who are now underwater. I’m watching the $358.50 local lower high as immediate resistance. I’d rather wait for a breakdown retest than jump in right here. If price breaks below $356.80 and retests it as resistance, I’ll look for a short scalp. Execution Plan: Bias: SHORT Entry: $357.40 – $358.00 (on a failed retest) Confirmation: 15m close below $356.80, followed by a weak bounce SL:$358.80 TP1: $355.50 TP2:$354.00 Invalidation: A clean 1h close above $358.80 The risk here is getting chopped up if volume stays flat and price just ranges. Don't chase the breakdown; wait for the retest to prove sellers are still in control. Are you waiting for the range to break, or fading this compression? #ByXIMPACT #WSOT2026 $AAPLXUSDT $SOLUSDT
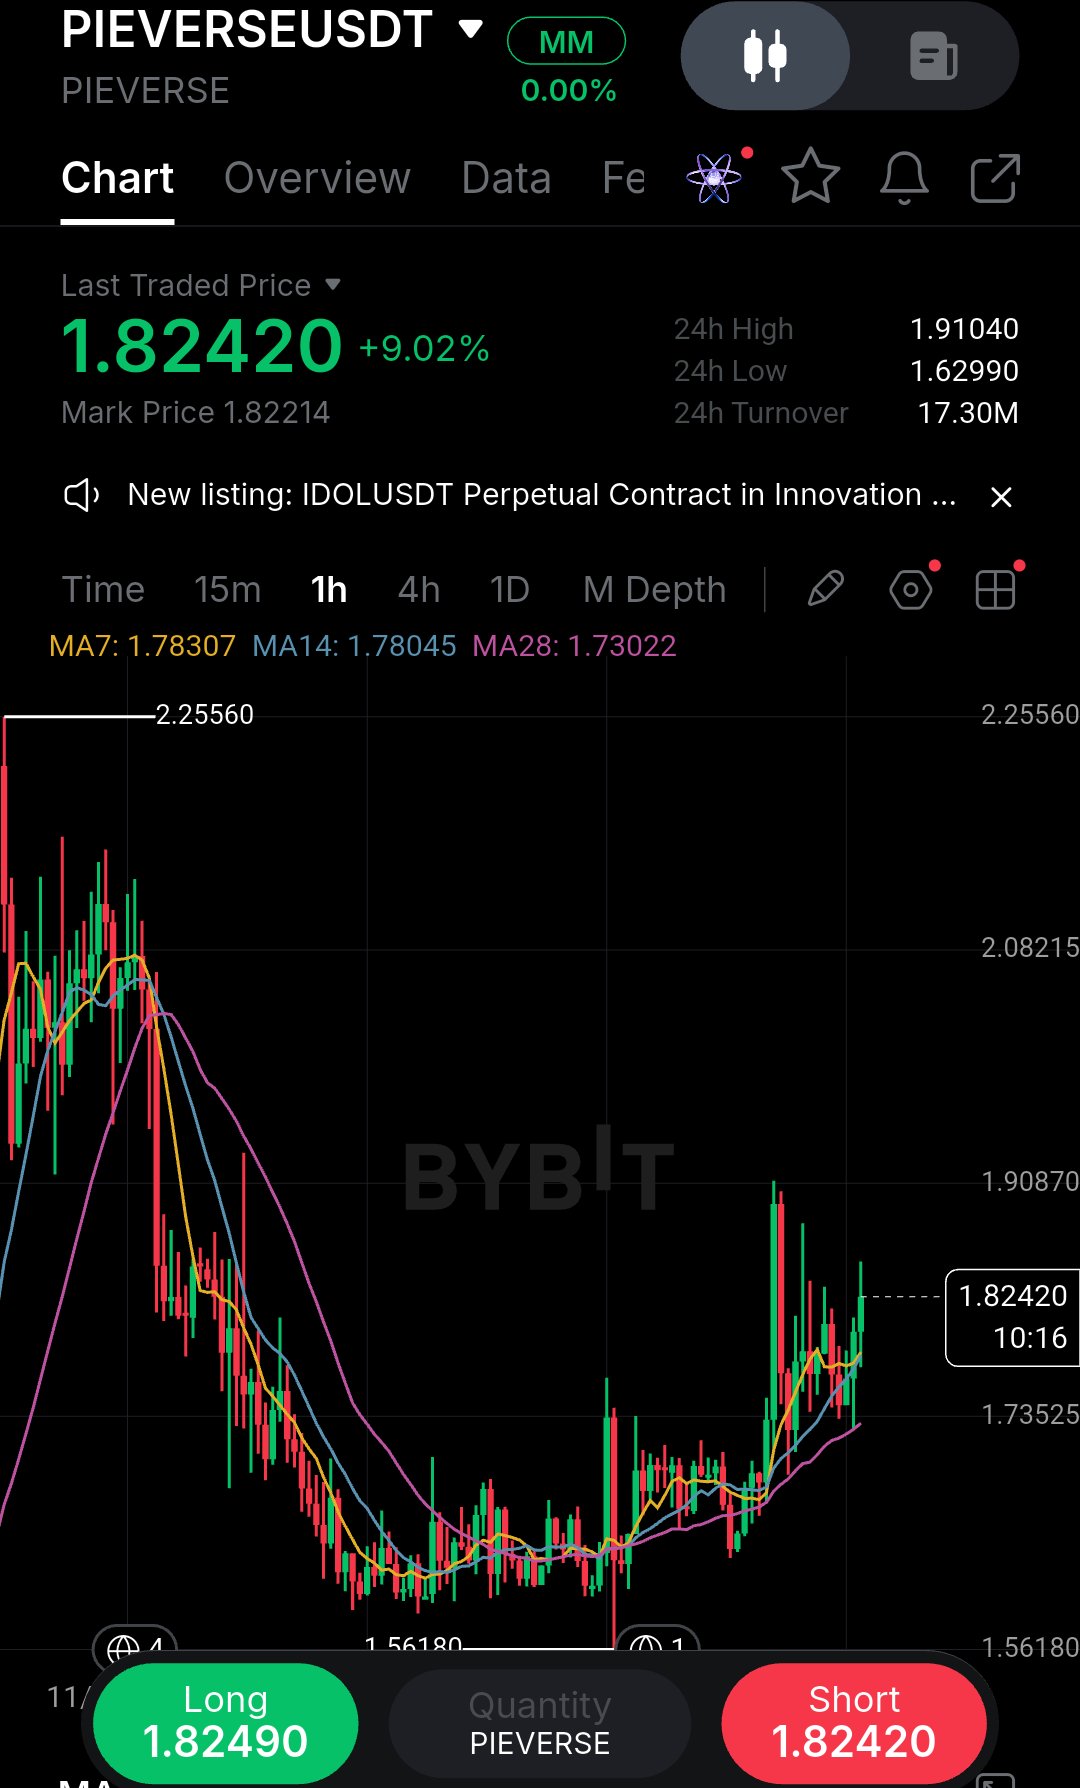
I've chased enough of these post-reversal bounces to know that entering right after a massive green candle usually ends in a quick drawdown. It is easy to get caught up in the excitement of a 9% move, but what stands out on this PIEVERSEUSDT 1h chart isn't just the size of the bounce, but the aggressive defense of the $1.56 low. The market completely rejected lower prices and has since reclaimed all major moving averages, which is a very encouraging sign for the bulls. The broader structure has shifted to the upside, but I have to be realistic about the immediate price action. Price is currently stalling right below the $1.91 local resistance level. My read is that chasing here at $1.82 is risky because buyers are likely to face a natural pullback after such a sharp run-up. Retail traders often get trapped buying the top of these initial impulses. I’d much rather wait for the market to prove the new support holds before risking my capital. The $1.78 zone, where the MA7 and MA14 sit, is the key battleground. This area is perfect for a "break and retest" setup. If price pulls back to this zone and prints a clear bullish rejection candle like a hammer or a strong green engulfing candle.That’s the confirmation I need to enter. It gives us a much tighter stop loss and a better risk-to-reward ratio. · Entry: $1.78 – $1.80 · SL: $1.73 (Below the MA28) · TP1: $1.86 · TP2: $1.91 · Invalidation: A 1h close below $1.73. The main risk is a fake breakout where price wicks up to $1.85 before dumping hard. Wait for the retest rather than FOMOing into the current candle. Are you waiting for that $1.78 pullback, or looking for a direct breakout above $1.91? #ByXIMPACT #WSOT2026 $PIEVERSEUSDT $BRUSDT