Umar
2198Лайк0Акциялар29Жанкүйерлер41Жазылу
I'm Umar by name from Nigeria
I'm Umar by name from Nigeria
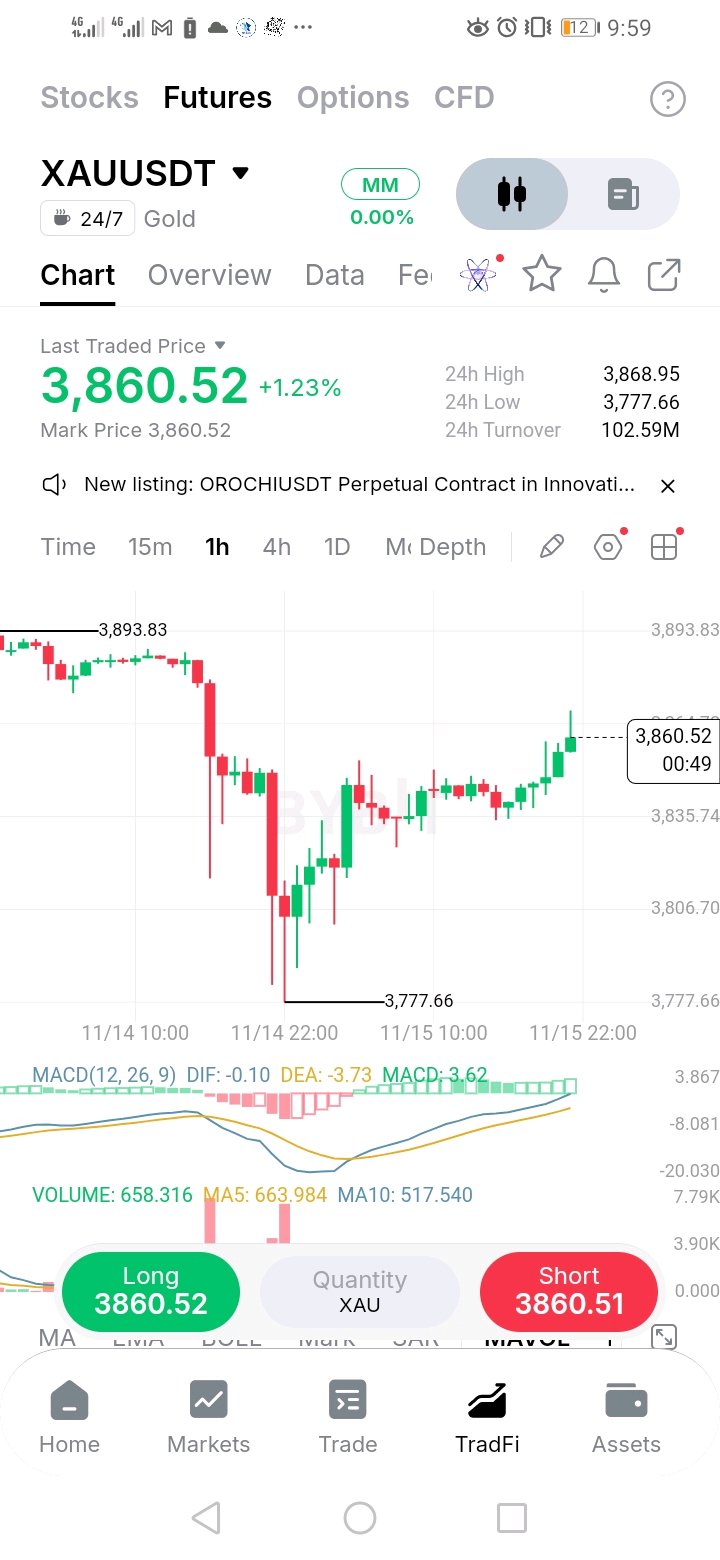
| V-shaped recovery from 3,777 is back at the old 3,860 floor. Sellers defended it before, so this is the test. Gold flushed to 3,777.66 on a heavy-volume drop, then rebuilt in a clean staircase of higher lows: about 3,820, then 3,830, then 3,840. Price is now at 3,860, almost exactly the old floor that broke on Friday, and the last candle printed a small upper wick near 3,868.95 (the 24h high). Broken support often acts as resistance on the first retest, so this is where the move gets decided. MACD has turned up (DIF -0.10, DEA -3.73) and the histogram is positive, so momentum is shifting. But DIF has only just reached zero, so the turn is early. Current volume (658) is in line with its 5-period average (664) and above the 10-period average (518), but the candle is still open, so judge it at the close. Support: 3,835 (higher-low zone), 3,806, 3,777.66 (24h low and flush low) Resistance: 3,860 to 3,869 (old floor and 24h high), 3,894 (swing high) Bullish plan A: buy the pullback (my preferred entry) Entry: 3,842 to 3,836 Stop loss: 3,828 Take profit: 3,860, then 3,869 (about 1.9R and 2.7R) What it means: holding the higher-low zone shows buyers defend the recovery, and the old floor gets retested. Bullish plan B: breakout Trigger: 1H close above 3,869 Entry: retest of 3,865 Stop loss: 3,850 Take profit: 3,894, then 3,920 (about 1.9R and 3.7R) Note: 3,920 is above anything on this chart, so treat it as an estimate. What it means: reclaiming the old floor and the 24h high turns the breakdown into a fake-out, and shorts have to cover. Bearish plan A: sell the rejection Entry: 3,862 to 3,869, if price gets rejected at the old floor Stop loss: 3,885 Take profit: 3,835, then 3,806 (about 1.7R and 3.5R) What it means: broken support turning into resistance confirms the breakdown, and the higher lows get tested. Bearish plan B: recovery fails Trigger: 1H close below 3,835 Entry: retest of 3,837 from below Stop loss: 3,850 Take profit: 3,806, then 3,778 (about 2.4R and 4.5R) What it means: breaking the higher-low staircase sends price back to the flush low. Invalidation: bulls are wrong on a 1H close below 3,835. Bears are wrong above 3,869. Risks - Gold reacts fast to US data, dollar moves and rate news. One headline can ignore every level here. - The bigger trend is still down, and a 1H bounce inside a downtrend has to prove itself. - Weekend trading is usually thinner, and moves can be sharper when traditional markets reopen. - The 1H chart is noisy, so wait for candle closes, not wicks. - Futures carry funding and liquidation risk, so size small and use stops. Recommendation: don't buy into the old floor. Let price come back to the higher-low zone, or wait for a close above 3,869 and trade the retest. If you sell the rejection, use a defined stop. Keep size small. Does 3,860 cap the recovery again, or does gold reclaim it? Not financial advice.#ByXIMPACT $XAUTUSDT $ETHUSDT
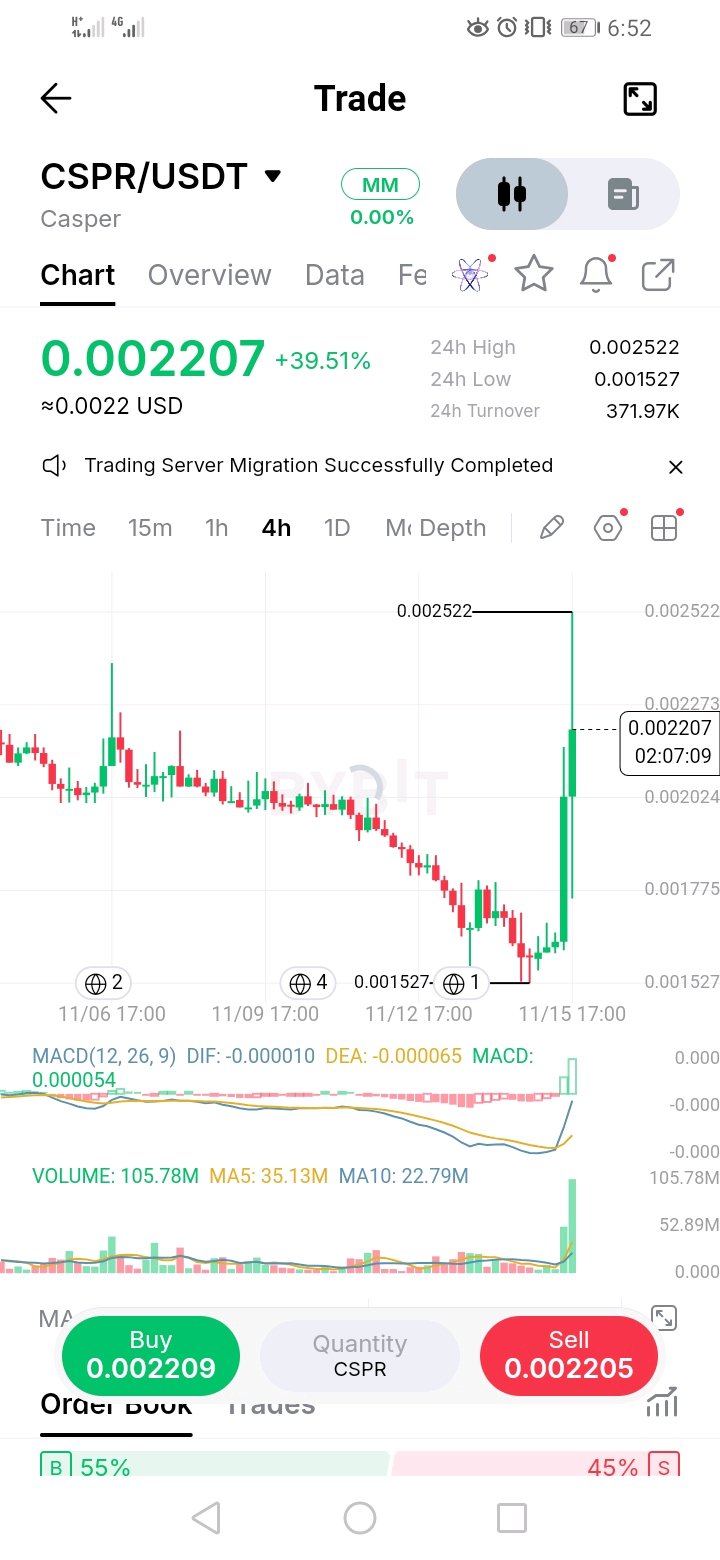
$CSPR 4H | +39% on 3x average volume. A volume climax can be the start of a trend or the top of a spike. CSPR slid for days in lower highs and lower lows, down to 0.001527. Then one candle exploded to 0.002522 and closed near 0.0022, wiping out most of the last leg down. The volume bar (105.8M) is more than 3x its 5-period average (35.1M) and about 4.6x its 10-period average (22.8M). That is real participation, but huge volume at the end of a vertical candle can also mean the buyers are already spent. The long upper wick tells the story: price touched 0.002522 and sellers pushed it back about 12%. MACD has just crossed up from below zero, so momentum is new, not proven. The order book is balanced (55/45), so there's no one-sided pressure. Support: 0.002024 (mid-candle level), 0.001775, 0.001527 (24h low and swing low) Resistance: 0.002273, 0.002522 (24h high and wick). Nothing above it on this chart. Bullish plan A: buy the pullback (my preferred entry) Entry: 0.002080 to 0.002020 Stop loss: 0.001950 Take profit: 0.002273, then 0.002522 (about 2.2R and 4.7R) What it means: holding the middle of the vertical candle shows buyers defend the move, and the wick high gets retested. Bullish plan B: breakout Trigger: 4H close above 0.002522 Entry: retest of 0.002490 Stop loss: 0.002380 Take profit: 0.002700, then 0.002900 (about 1.9R and 3.7R) Note: there's no resistance above 0.002522 on this chart, so these targets are estimates. What it means: a close above the wick high would trap sellers and can start a second leg. Bearish plan A: spike fades Trigger: 4H close below 0.002024 Entry: retest of 0.002030 from below Stop loss: 0.002120 Take profit: 0.001775, then 0.001527 (about 2.8R and 5.6R) What it means: the move was a one-candle squeeze, and the old low gets retested. Bearish plan B: sell the wick high Entry: 0.002450 to 0.002520, if price gets rejected again Stop loss: 0.002620 Take profit: 0.002273, then 0.002100 (about 1.6R and 2.9R) What it means: sellers keep defending the high, and price rotates back toward the middle of the candle. Invalidation: bulls are wrong on a 4H close below 0.002024. Bears are wrong above 0.002522. Risks - A +39% candle is extremely extended, and giving back half of it is common. - Volume spikes this big can mark exhaustion, not just strength. - Turnover is thin (about 372K in 24h), so wicks, slippage and fake moves are common. - MACD has only just turned up, so momentum is early. - A BTC dip can erase the whole move. Recommendation: don't buy the green candle. Let price come back toward 0.00205, or wait for a close above 0.002522 and trade the retest. Keep size small and use wider stops than usual. Do buyers defend 0.00205, or does CSPR hand the whole move back? #ByXIMPACT $CSPRUSDT
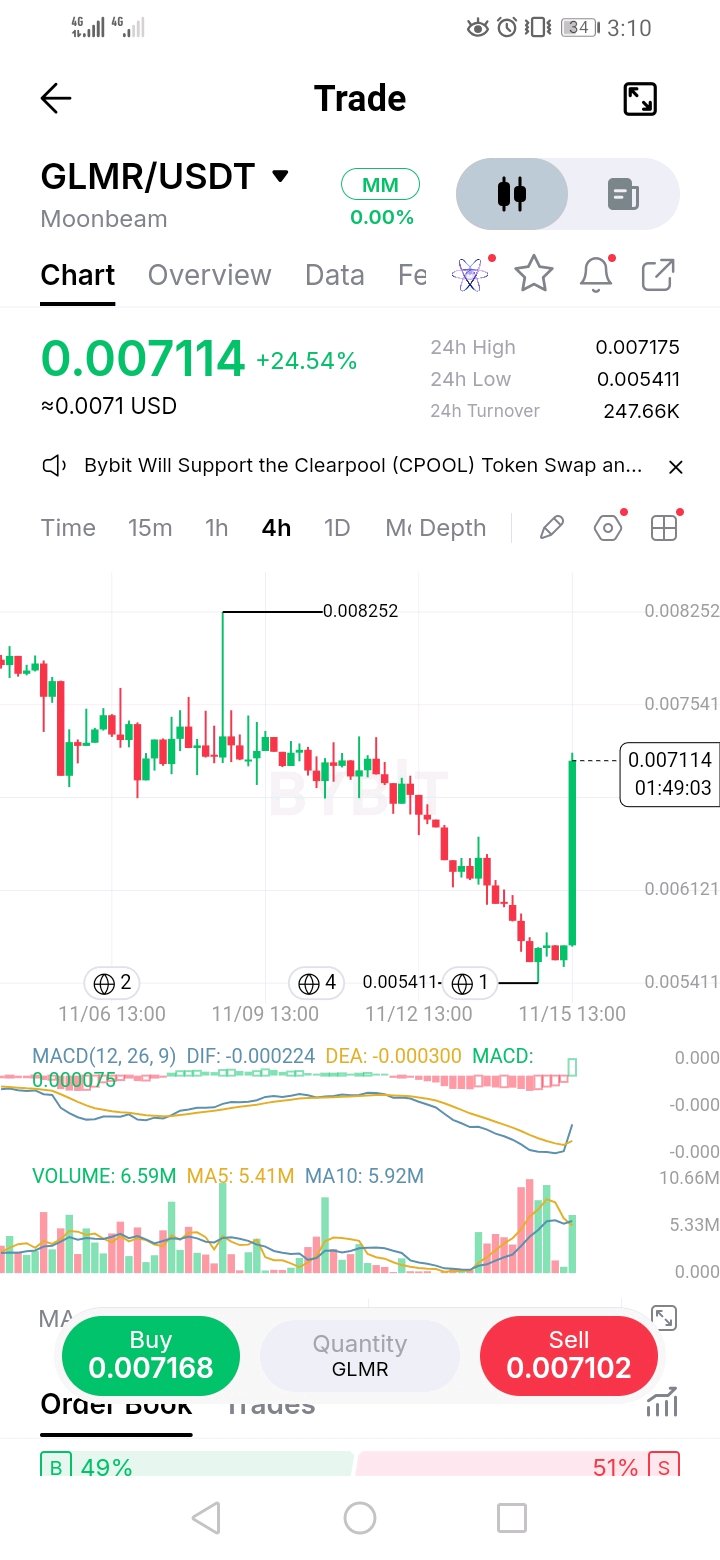
$GLMR 4H | One +24% candle erased the whole last leg down. Now the question is whether it holds. GLMR slid for days in lower highs and lower lows, from the 0.0075 area down to a low of 0.005411. Then a single candle went from about 0.0059 to 0.0071, taking back nearly everything it lost. Volume (6.6M) is already above its 5-period average (5.4M), and MACD is turning up from deep negative, so the move has some participation behind it. The catch is how fast it happened. A move this vertical leaves a gap of air below it, and price is now pressing the 24h high (0.007175), right under the area where the downtrend started. MACD is still below zero, so momentum is only just turning. Support: 0.00612 (mid-range level), 0.005411 (24h low and swing low) Resistance: 0.007175 (24h high), 0.007541, 0.008252 (swing high) Bullish plan A: buy the pullback (my preferred entry) Entry: 0.00665 to 0.00640 Stop loss: 0.00610 Take profit: 0.00717, then 0.00754 (about 1.5R and 2.4R) What it means: holding the middle of the vertical candle shows buyers defend the move, and the highs get retested. Bullish plan B: breakout Trigger: 4H close above 0.007541 Entry: retest of 0.00750 Stop loss: 0.00725 Take profit: 0.00825, then 0.00870 (about 3R and 4.8R) Note: 0.00870 is above anything on this chart, so treat it as an estimate. What it means: reclaiming the old breakdown zone would trap sellers and can drive a move toward the swing high. Bearish plan A: spike fades Trigger: 4H close below 0.00612 Entry: retest of 0.00615 from below Stop loss: 0.00640 Take profit: 0.00560, then 0.005411 (about 2.2R and 3R) What it means: the move was a one-candle squeeze, and the low gets retested. Bearish plan B: sell the rejection Entry: 0.00740 to 0.00754, if price gets rejected under the old breakdown zone Stop loss: 0.00775 Take profit: 0.00690, then 0.00650 (about 1.8R and 3.2R) What it means: sellers defend the old support, and price rotates back to the middle of the candle. Invalidation: bulls are wrong below 0.00612. Bears are wrong on a 4H close above 0.007541. Risks - A +24% candle is extended, and giving back a big part of it is common. - MACD has only just turned up from below zero, so momentum is early, not proven. - Turnover is thin (about 248K in 24h), so wicks, slippage and fake moves are common. - The order book is balanced (49/51), so there's no one-sided pressure either way. - A BTC dip can erase the whole move. Recommendation: don't buy the green candle. Let price come back toward the middle of the move, or wait for a close above 0.007541 and trade the retest. Keep size small and use wider stops than usual. Does GLMR hold above 0.0064, or does it hand the whole move back? #ByXIMPACT $GLMRUSDT $LTCUSDT
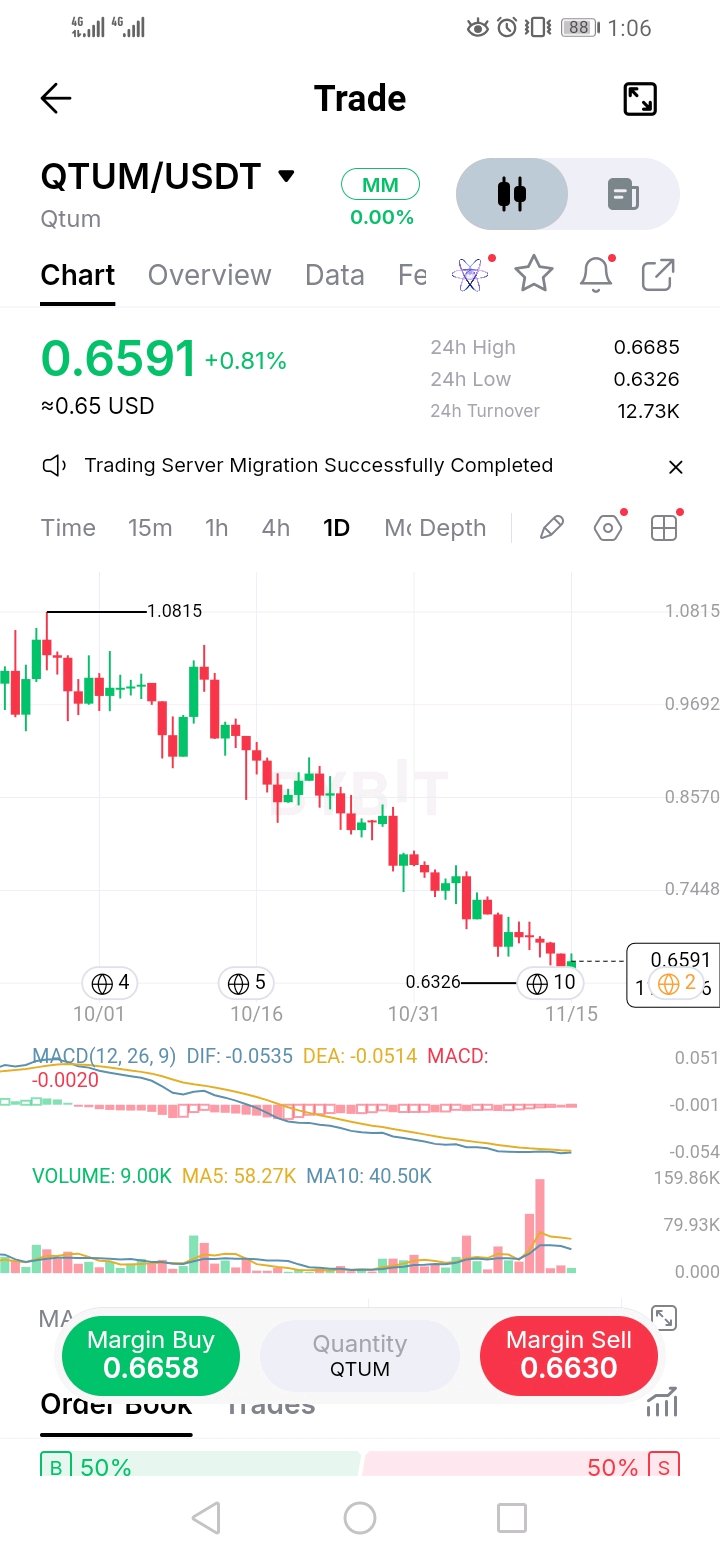
1D | A month-long staircase down from 1.08. Candles are shrinking, but there's no reversal yet. QTUM has fallen from 1.0815 to 0.6326 in steady steps of lower highs and lower lows, with almost no real bounce along the way. The recent candles have gotten smaller and more cramped near the lows, and the biggest volume bar on the chart came a few days ago and has faded since. That pattern often means selling pressure is cooling. It doesn't mean buyers have taken over. MACD is deeply negative, but the histogram has shrunk to almost nothing (DIF -0.0535 vs DEA -0.0514), so downside momentum is flattening. The order book is a flat 50/50, so neither side is pushing hard. Support: 0.6326 (24h low and swing low). Nothing marked below it on this chart. Resistance: 0.6685 (24h high), 0.7448, 0.8570, 0.9692, 1.0815 (swing high) Bearish plan A: sell the rejection Entry: 0.6680 to 0.6720, if price gets rejected at the 24h high Stop loss: 0.6900 Take profit: 0.6450, then 0.6326 (about 1.2R and 1.9R) What it means: sellers keep defending every bounce, and the low gets retested. Bearish plan B: breakdown Trigger: daily close below 0.6326 Entry: retest of 0.6340 from below Stop loss: 0.6480 Take profit: 0.6050, then 0.5800 (about 2.1R and 3.9R) Note: there's no support under 0.6326 on this chart, so these targets are estimates. Trail your stop. What it means: the floor is gone, and the downtrend extends. Bullish plan A: bounce scalp (high risk) Entry: 0.6420 to 0.6340 Stop loss: 0.6240 Take profit: 0.6685, then 0.7000 (about 2.2R and 4.4R) What it means: if buyers defend the low again, a relief bounce toward the 24h high is possible. It's a trade, not a trend change. Bullish plan B: real reversal Trigger: daily close above 0.7448 Entry: retest of 0.7400 Stop loss: 0.7100 Take profit: 0.8570, then 0.9692 (about 3.9R and 7.6R) Note: 0.7448, 0.8570 and 0.9692 come from the price axis, so treat them as approximate. What it means: only then does the downtrend lose its grip, and trapped sellers become buyers. Invalidation: bears are wrong on a daily close above 0.7448. The bounce scalp is wrong below 0.6240. Risks - The trend is down, so counter-trend longs have the lower odds. - Shrinking candles can mean a bottom, or just a pause before the next leg. Don't call it early. - Today's volume looks tiny next to its averages, but the candle is still open, so judge it at the close. - Turnover is very thin, so wicks and fake moves are common. - QTUM follows BTC. A BTC dip can break the low quickly. Recommendation: don't try to catch the exact bottom. Sell the rejection near the 24h high with a defined stop, or wait for a close above 0.7448. If you scalp the low, use a small size and a hard stop. Does 0.6326 hold again, or is it waiting to be broken?$QTUMUSDT $ADAUSDT
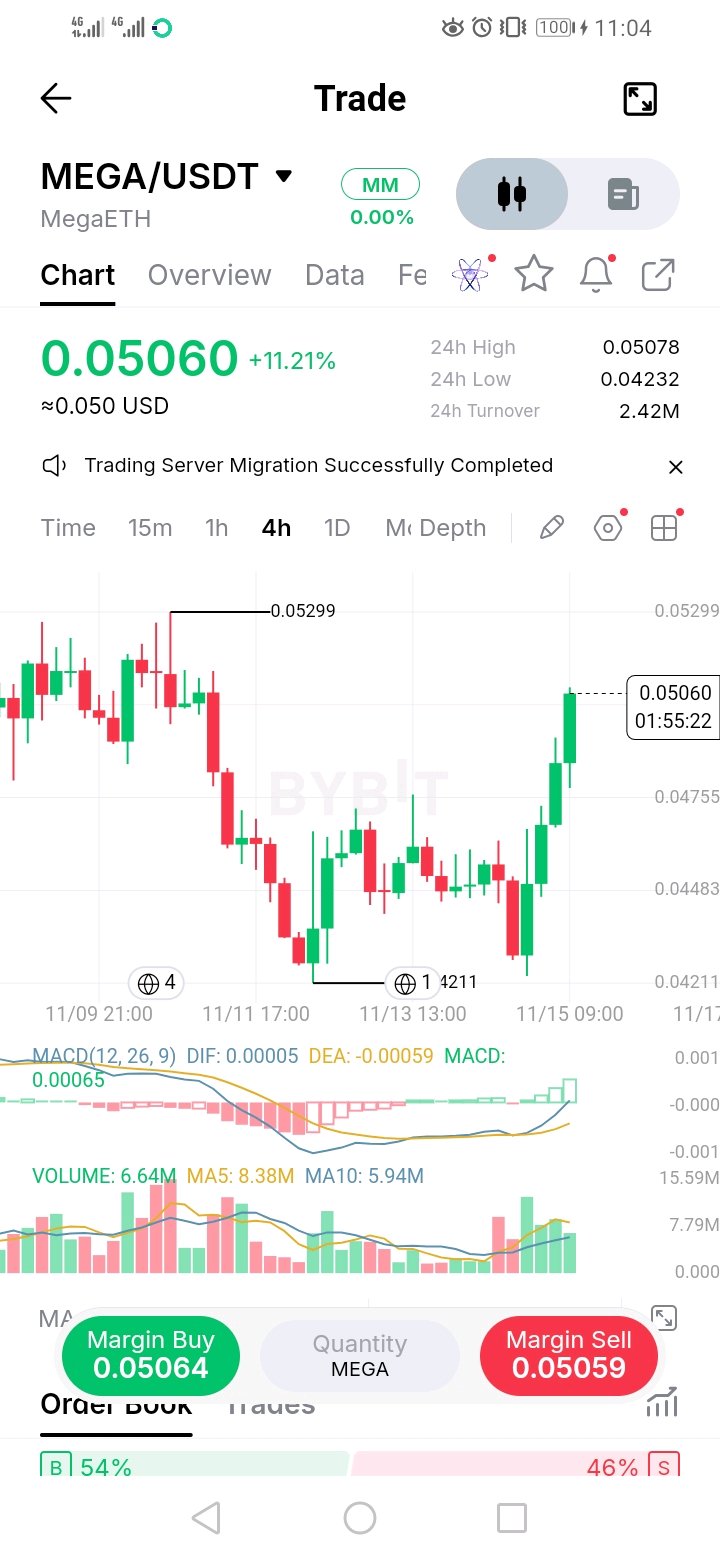
What is interested for me is the last three bullish candle together with high volum MEGA fell from 0.05299, bottomed at 0.04211, bounced to about 0.0487, then dropped back and held 0.04232, almost the same low. Two lows at the same level with a bounce between them is a double bottom. The neckline sits near 0.0487, and the latest candle (+11%) has pushed right through it to 0.0506. MACD has just crossed up (DIF 0.00005 vs DEA -0.00059) and the histogram is turning green, so momentum is shifting. The order book is balanced (54/46), so neither side dominates yet. The catch is the speed. Price is about 20% above the lows, so chasing here means buying after most of the move. The cleaner entry is a retest of the neckline. Support: 0.0487 (neckline), 0.04755, 0.04483, 0.04232 (24h low), 0.04211 (swing low) Resistance: 0.05078 (24h high), 0.05299 (swing high). Nothing above it on this chart. Bullish plan A: buy the neckline retest (my preferred entry) Entry: 0.0490 to 0.0483 Stop loss: 0.0472 Take profit: 0.0508, then 0.0530 (about 1.5R and 3R) What it means: a broken neckline turning into support confirms the double bottom, and the range top gets retested. Bullish plan B: breakout Trigger: 4H close above 0.05299 Entry: retest of 0.0525 Stop loss: 0.0510 Take profit: 0.0555, then 0.0580 (about 2R and 3.7R) Note: there's no resistance above 0.05299 on this chart, so these targets are estimates. What it means: clearing the swing high would trap sellers and can start a bigger move. Bearish plan A: failed breakout Trigger: 4H close below 0.04755 Entry: retest of 0.0476 from below Stop loss: 0.0490 Take profit: 0.04483, then 0.04232 (about 2R and 3.8R) What it means: the bounce was only a squeeze, and the double bottom gets retested. Bearish plan B: sell the range top Entry: 0.0525 to 0.0530, if price gets rejected at the swing high Stop loss: 0.0540 Take profit: 0.0506, then 0.0490 (about 1.7R and 3R) What it means: sellers defend the old high, and price rotates back toward the neckline. Invalidation: bulls are wrong on a 4H close below 0.04755. Bears are wrong above 0.05299. Risks - An 11% candle is extended, and pullbacks after moves like this are common. - MACD has only just crossed up near zero, so momentum is early, not proven. - Current volume (6.6M) is below its 5-period average (8.4M), but the candle is still open, so judge it at the close. - Turnover is thin (about 2.4M in 24h), so wicks and fake moves are common. - A BTC dip can break the pattern quickly. Recommendation: don't buy the green candle. Let price come back to the neckline, or wait for a close above 0.05299 and trade the retest. Keep size small and use stops. Does the 0.0487 neckline hold as support, or does MEGA slip back into the range? $MEGAUSDT $AAPLXUSDT #ByXIMPACT
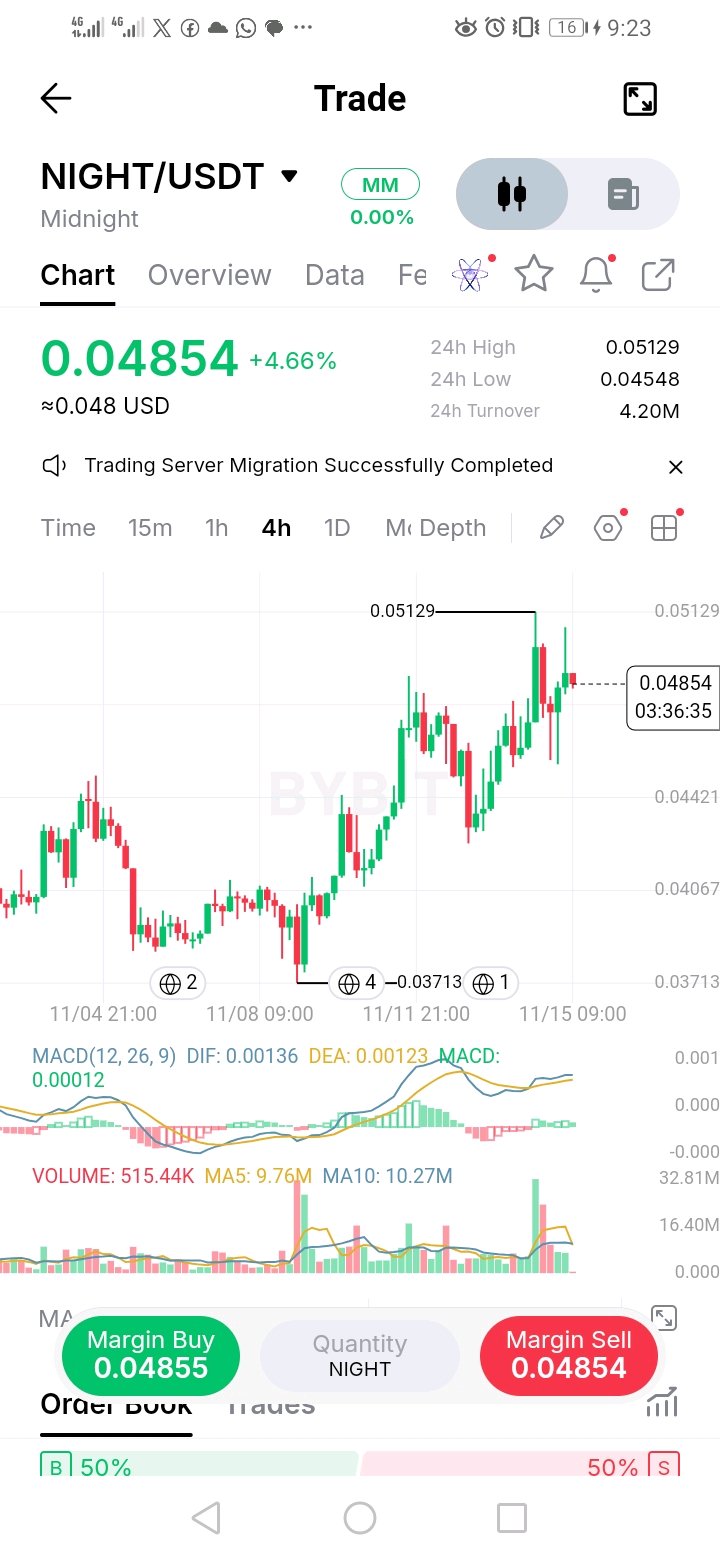
NIGHT 4H | Second rejection at 0.0513. Now the range between 0.0455 and 0.0513 decides the next move. NIGHT pushed to 0.05129, got sold, dipped to 0.04548, and bounced back up for another try. That second try failed too, leaving a long upper wick under the old high. Two rejections at the same level make it a real ceiling, so buyers need to break it with volume. The base is still healthy. The dip low (0.04548) is well above the last swing low (0.04421 area), so the higher-low staircase is intact. MACD is still positive with DIF above DEA, so the trend is up, but flat. The order book is split 50/50, so neither side is pushing hard right now. Volume is fading. Current volume (515K) looks tiny next to its averages (9.8M and 10.3M), but the candle is still open, so judge it at the close. Support: 0.04548 (24h low), 0.04421, 0.04067, 0.03713 (swing low) Resistance: 0.05129 (24h high and double rejection). Nothing above it on this chart. Bullish plan A: buy the range low Entry: 0.0460 to 0.0455 Stop loss: 0.0443 Take profit: 0.0485, then 0.0510 (about 1.9R and 3.6R) What it means: if buyers defend the dip low again, price rotates back to the top of the range. Bullish plan B: breakout Trigger: 4H close above 0.05129 Entry: retest of 0.0508 Stop loss: 0.0492 Take profit: 0.0540, then 0.0570 (about 2R and 3.9R) Note: there's no resistance above 0.05129 on this chart, so these targets are estimates. What it means: a close above a level that rejected twice would trap sellers and can start a second leg. Bearish plan A: range breakdown Trigger: 4H close below 0.04548 Entry: retest of 0.0456 from below Stop loss: 0.0468 Take profit: 0.0442, then 0.0407 (about 1.2R and 4.1R) What it means: losing the dip low breaks the higher-low structure, and the base of the move gets retested. Bearish plan B: sell the double top Entry: 0.0505 to 0.0512, if price gets rejected a third time Stop loss: 0.0525 Take profit: 0.0485, then 0.0460 (about 1.4R and 2.8R) What it means: sellers keep defending the high, and price rotates back to the range low. Invalidation: bulls are wrong on a 4H close below 0.04548. Bears are wrong above 0.05129. Risks - A level that rejects twice can break on the third try, so don't short the top without a stop. - Volume is fading, so a breakout without a volume pickup can fail. - Turnover is thin (about 4M in 24h), so wicks and fake moves are common. - A BTC dip can break the range low quickly. Recommendation: don't trade the middle of the range. Buy the low or sell the top with tight stops, or wait for a close outside 0.0455 to 0.0513 and trade the retest. Keep size small.$NIGHTUSDT $VVVUSDT #ByXIMPACT
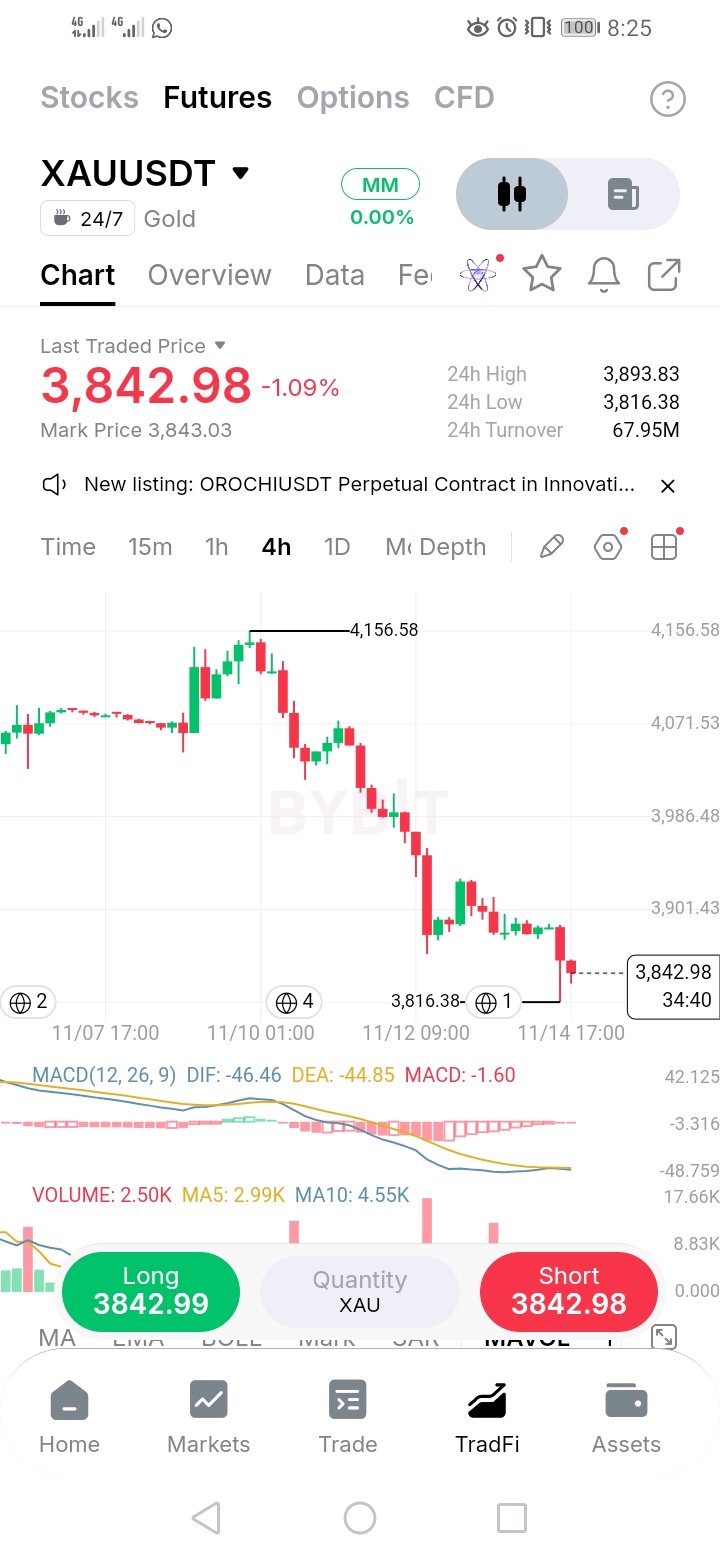
Gold has fallen almost 8% from the 4,156 high in a staircase of lower highs and lower lows. The flush low near 3,860 that held on Thursday gave way, and price tagged 3,816 before a small bounce to 3,843. That bounce is still under the old floor, so the first retest of 3,860 is where sellers are likely to defend. There are early signs the selling is tiring. The last red candle has a long lower wick, so buyers showed up near 3,816. Volume (2.5K) is below its 5 and 10 period averages (3.0K and 4.6K), though the candle is still open, so judge it at the close. MACD is still negative, but the histogram has shrunk to almost nothing (DIF -46.5 vs DEA -44.9), so downside momentum is fading. That says the drop may pause, not that it has reversed. Support: 3,816 (24h low and swing low). Nothing marked below it on this chart. Resistance: 3,860 (old floor), 3,894 (24h high), 3,901, 3,986, 4,072, 4,157 (swing high) Bearish plan A: sell the retest Entry: 3,860 to 3,880, if price gets rejected at the old floor Stop loss: 3,900 Take profit: 3,830, then 3,816 (about 2R and 2.7R) What it means: broken support turning into resistance confirms the breakdown, and the low gets retested. Bearish plan B: breakdown continuation Trigger: 4H close below 3,816 Entry: retest of 3,820 from below Stop loss: 3,840 Take profit: 3,790, then 3,760 (about 1.5R and 3R) Note: there's no support under 3,816 on this chart, so these targets are estimates. Trail your stop. What it means: the low gives way, and the slide extends. Bullish plan A: bounce scalp (high risk) Entry: 3,825 to 3,818 Stop loss: 3,800 Take profit: 3,860, then 3,880 (about 1.7R and 2.6R) What it means: if buyers defend the wick low, a relief bounce back to the old floor is possible. It's a trade, not a trend change. Bullish plan B: real reversal Trigger: 4H close above 3,895, which reclaims the 24h high Entry: retest of 3,890 Stop loss: 3,865 Take profit: 3,986, then 4,072 (about 3.8R and 7R) Note: 3,986 and 4,072 come from the price axis, so treat them as approximate. What it means: only then does the downtrend lose its grip, and shorts have to cover. Invalidation: bears are wrong on a 4H close above 3,895. The bounce scalp is wrong below 3,800. Risks - The trend is down, so counter-trend longs have the lower odds. - Gold reacts fast to US data, dollar moves and rate news. One headline can ignore every level here. - After a drop this big, a sharp squeeze back to the old floor is common, so don't chase the lows. - Futures carry funding and liquidation risk, so size small and use stops. Recommendation: don't try to catch the exact bottom. Sell the retest of 3,860 with a defined stop, or wait for a close above 3,895. If you scalp the low, use a small size and a hard stop. Does 3,860 cap the next bounce, or does gold reclaim it? #ByXIMPACT $XAUTUSDT $GRAMUSDT
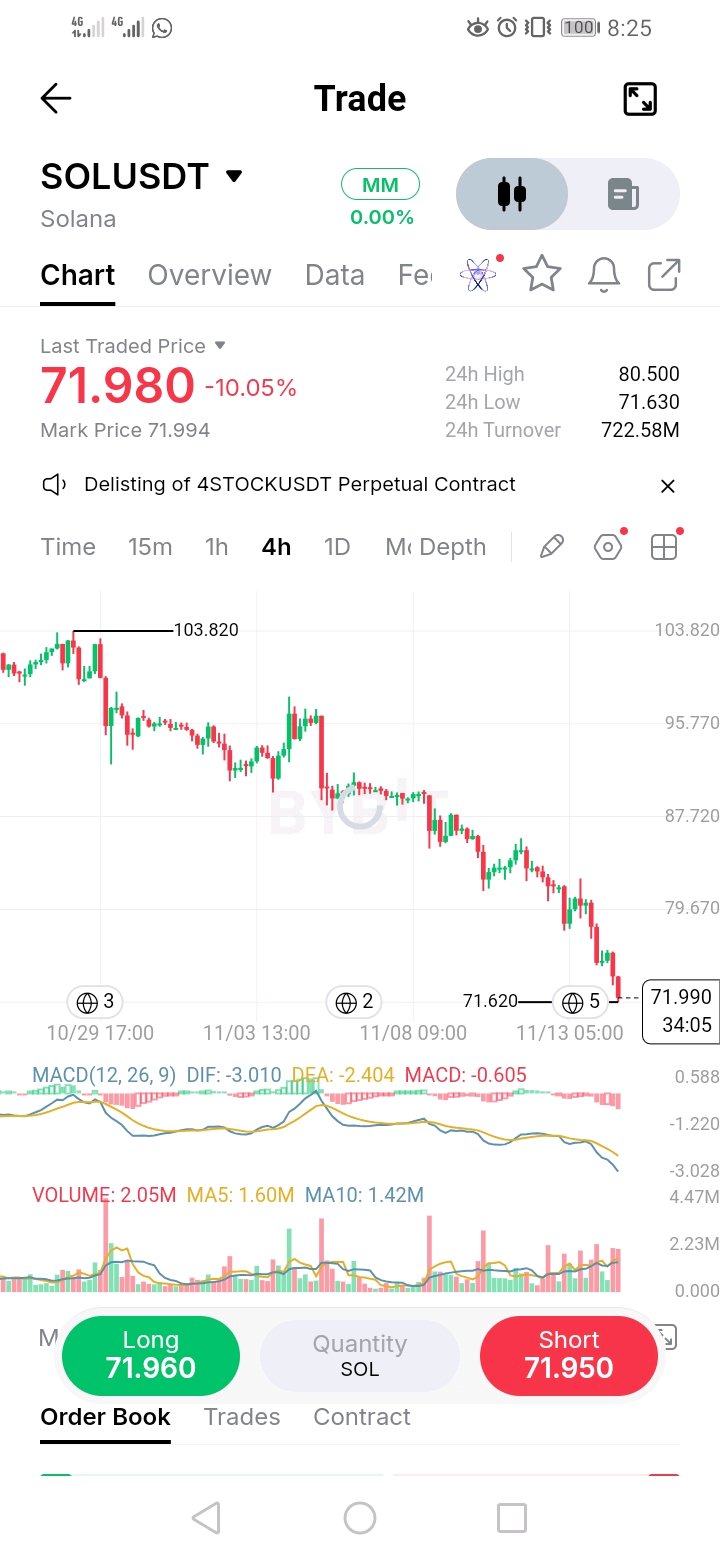
SOL 4H | The 77.92 floor broke and price fell 10% to 71.6. Old support is now the ceiling. Two days ago SOL was bouncing off 77.92 and I was watching whether it would hold. It didn't. Price slid through it in a staircase of lower highs and lower lows and is now at 71.98, sitting right on the 24h low (71.63). Every bounce on this chart has been sold, and the weak little rally near 80.5 failed completely. The selling has real participation. Current volume (2.05M) is already above its 5 and 10 period averages (1.60M and 1.42M), and MACD is negative and widening (DIF -3.01 vs DEA -2.40). That is a trend with momentum, not a drift. After a drop this fast, the usual pattern is a sharp bounce into the old floor before the next move. That makes 77.9 the level to watch. Support: 71.62 (24h low and swing low). There is no marked support below it on this chart. Resistance: 77.92 (old floor), 79.67, 80.50 (24h high), 81.28 (earlier daily low), 87.72, 95.77, 103.82 (swing high) Bearish plan A: sell the retest Entry: 77.40 to 78.00, if price gets rejected at the old floor Stop loss: 79.80 Take profit: 74.00, then 71.60 (about 1.9R and 3.1R) What it means: broken support turning into resistance confirms the breakdown, and the low gets retested. Bearish plan B: breakdown continuation Trigger: 4H close below 71.62 Entry: retest of 71.70 from below Stop loss: 73.00 Take profit: 69.50, then 67.00 (about 1.7R and 3.6R) Note: there's no support under 71.62 on this chart, so these targets are estimates. Trail your stop. What it means: the flush low gives way, and the slide extends. Bullish plan A: bounce scalp (high risk) Entry: 72.30 to 71.70 Stop loss: 70.60 Take profit: 75.00, then 77.90 (about 2.1R and 4.2R) What it means: if buyers defend the low, a relief bounce back to the old floor is possible. It's a trade, not a trend change. Bullish plan B: real reversal Trigger: 4H close above 81.30, which reclaims the earlier low and the 24h high Entry: retest of 81.00 Stop loss: 79.40 Take profit: 87.70, then 95.80 (about 4R and 9R) Note: 87.72 and 95.77 come from the price axis, so treat them as approximate. What it means: only then does the downtrend lose its grip, and trapped shorts have to cover. Invalidation: bears are wrong on a 4H close above 81.30. The bounce scalp is wrong below 70.60. Risks - The trend is down with momentum, so counter-trend longs have the lower odds. - A 10% drop can trigger forced selling that pushes price through levels faster than expected. - After a sharp flush, a violent squeeze back to the old floor is common, so don't chase the lows. - SOL follows BTC. A BTC move can ignore every level here. - Macro news can break levels fast. - Futures carry funding and liquidation risk, so size small and use stops. Recommendation: don't try to catch the exact bottom. Sell the retest of 77.9 with a defined stop, or wait for a close above 81.30. If you scalp the low, use a small size and a hard stop. Does 77.9 cap the next bounce, or does SOL slide further first? $SOLUSDT $MNTUSDT #ByXIMPACT
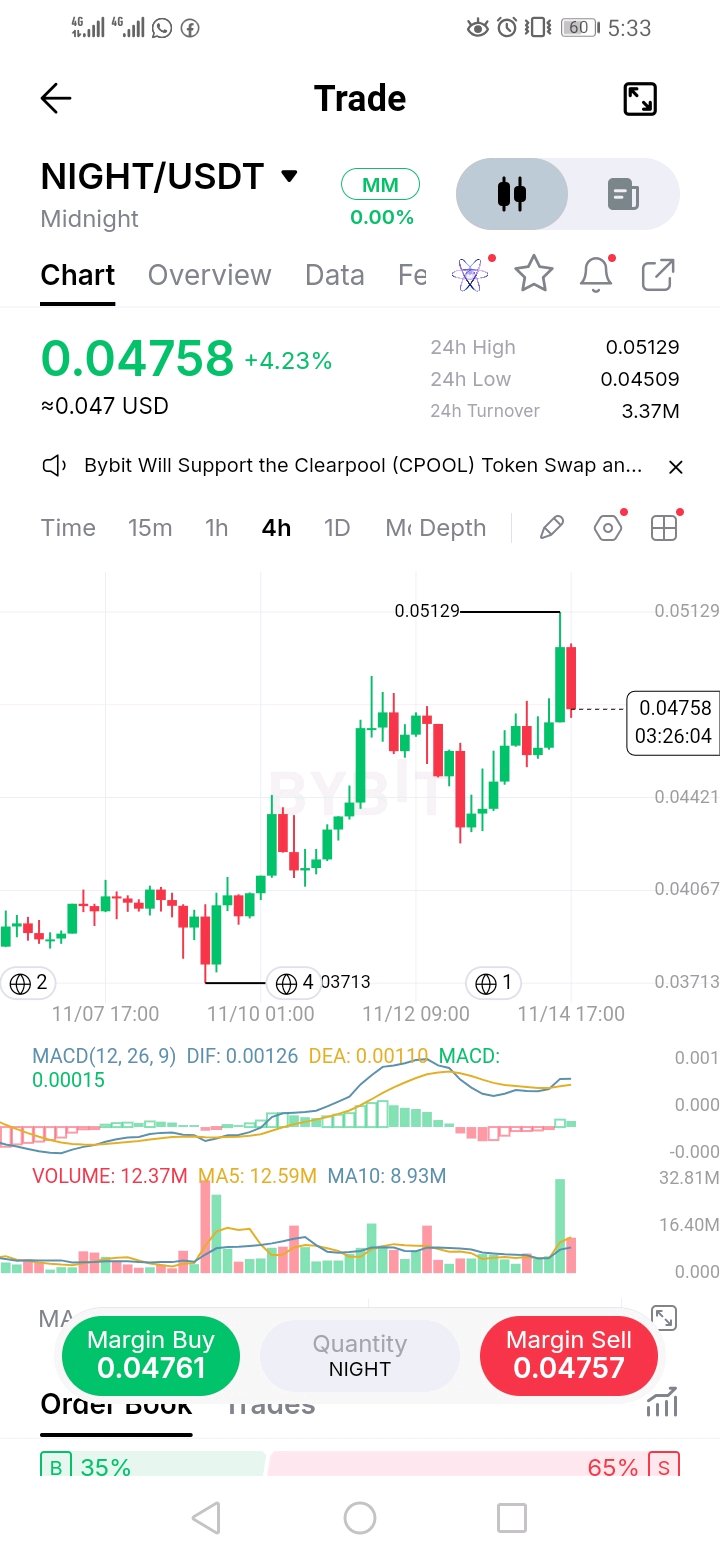
NIGHT 4H | Higher lows all week, but the spike to 0.05129 got rejected. The pullback zone decides the trend. NIGHT has been climbing in clean steps from 0.03713: higher highs, higher lows, and a dip to the 0.0425 area that buyers absorbed fast. The latest push cleared the old swing high near 0.0467 and spiked to 0.05129 on the biggest volume bar on the chart. The next candle is red and gave back part of that spike, leaving a long upper wick. Buyers pushed hard, and sellers answered at the top. MACD is positive with DIF above DEA, so the trend is still up, but the histogram is thin. The order book leans to sellers (65%), which is a short-term warning for bulls, though it can flip in seconds. Support: 0.04509 (24h low), 0.04421, 0.04067, 0.03713 (swing low) Resistance: 0.05129 (24h high and wick). Nothing above it on this chart. Bullish plan A: buy the pullback (my preferred entry) Entry: 0.0465 to 0.0455 Stop loss: 0.0440 Take profit: 0.0490, then 0.05129 (about 1.5R and 2.6R) What it means: the old swing high turning into support shows the breakout was real, and the spike high gets retested. Bullish plan B: breakout Trigger: 4H close above 0.05129 Entry: retest of 0.0508 Stop loss: 0.0490 Take profit: 0.0540, then 0.0570 (about 1.8R and 3.4R) Note: there's no resistance above 0.05129 on this chart, so these targets are estimates. What it means: a close above the wick high would trap sellers and start a second leg. Bearish plan A: breakdown Trigger: 4H close below 0.04421, which breaks the higher-low structure Entry: retest of 0.0443 from below Stop loss: 0.0460 Take profit: 0.0407, then 0.0371 (about 2.1R and 4.2R) What it means: the uptrend is over, and the base of the move gets retested. Bearish plan B: sell the wick high Entry: 0.0500 to 0.0512, if price gets rejected again Stop loss: 0.0525 Take profit: 0.0475, then 0.0451 (about 1.6R and 2.9R) What it means: sellers keep defending the spike high, and price rotates back to the breakout zone. Invalidation: bulls are wrong below 0.04421. Bears are wrong above 0.05129. Risks - A rejection candle after a volume spike often leads to a deeper pullback before any continuation. - The order book is sell-heavy (65%), so the short-term edge leans to sellers. - Turnover is thin (about 3.4M in 24h), so wicks and fake moves are common. - Current volume (12.4M) is near its 5-period average (12.6M), but the candle is still open, so judge it at the close. - A BTC dip can break the higher-low structure quickly. Recommendation: don't buy the middle. Let price come back to the old swing high zone, or wait for a close above 0.05129 and trade the retest. Keep size small and use stops. Do buyers defend 0.0455, or does NIGHT need a deeper reset first? Not financial advice. $NIGHTUSDT $AAPLXUSDT #ByXIMPACT
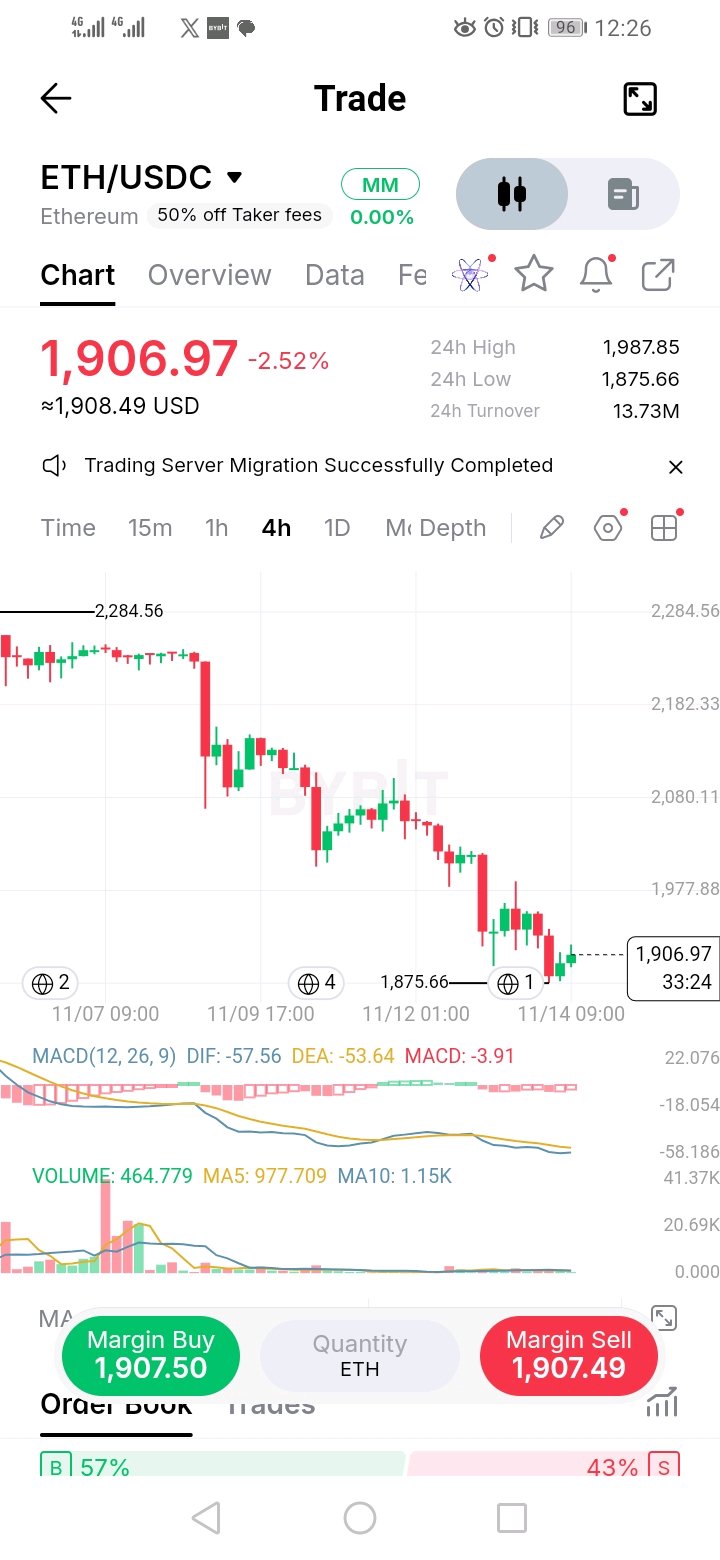
ETH was ranging near 2,245 for days, then dropped in steps: a sharp flush, a weak bounce that stalled near 2,110, another leg down, and a lower bounce that stalled near 1,990. Each rally made a lower high and each dip made a lower low. That is a clean downtrend, and the last leg took out the 2,004 floor and printed 1,875.66. Price is back at 1,907, but still under the old floor. When support breaks, the first retest of it is usually sold. MACD is negative and sitting below its signal line (DIF -57.6 vs DEA -53.6), so momentum still leans down. Volume peaked during the first flush and has faded since. Current volume (465) is well below its averages (978 and 1.15K), but the candle is still open, so judge it at the close. Support: 1,875.66 (24h low and swing low). Nothing marked below it on this chart. Resistance: 1,950 to 1,988 (24h high zone), 2,004 (old floor), 2,080, 2,182, 2,285 (swing high) Bearish plan A: sell the retest Entry: 1,960 to 1,985, if price gets rejected under the old floor Stop loss: 2,012 Take profit: 1,900, then 1,876 (about 2.4R and 3.4R) What it means: broken support turning into resistance confirms the breakdown, and the low gets retested. Bearish plan B: breakdown continuation Trigger: 4H close below 1,875.66 Entry: retest of 1,880 from below Stop loss: 1,905 Take profit: 1,840, then 1,800 (about 1.6R and 3.2R) Note: there's no support under 1,875.66 on this chart, so these targets are estimates. Trail your stop. What it means: the low gives way, and the downtrend extends. Bullish plan A: bounce scalp (high risk) Entry: 1,890 to 1,878 Stop loss: 1,858 Take profit: 1,950, then 1,988 (about 2.5R and 4R) What it means: if buyers defend the low again, a relief bounce toward the 24h high is possible. It's a trade, not a trend change. Bullish plan B: reclaim the floor Trigger: 4H close above 2,004 Entry: retest of 2,000 Stop loss: 1,975 Take profit: 2,080, then 2,182 (about 3R and 7R) Note: 2,080 and 2,182 come from the price axis, so treat them as approximate. What it means: getting back above the broken floor turns the breakdown into a fake-out, and shorts have to cover. Invalidation: bears are wrong on a 4H close above 2,004. The bounce scalp is wrong below 1,858. Risks - The trend is down, so counter-trend longs have the lower odds. - After a sharp drop, a quick squeeze back to the old floor is common, so don't chase the lows. - ETH follows BTC and macro news. One headline can ignore every level here. - The order book is balanced (57/43), so there's no one-sided pressure either way. - Forced selling can push price through levels faster than expected. Recommendation: don't buy the middle. Sell the retest of the old floor with a defined stop, or wait for a close above 2,004. If you scalp the low, use a small size and a hard stop. Does the old floor cap the next bounce, or does ETH reclaim it? #ByXIMPACT $ETHUSDT $SOLUSDT
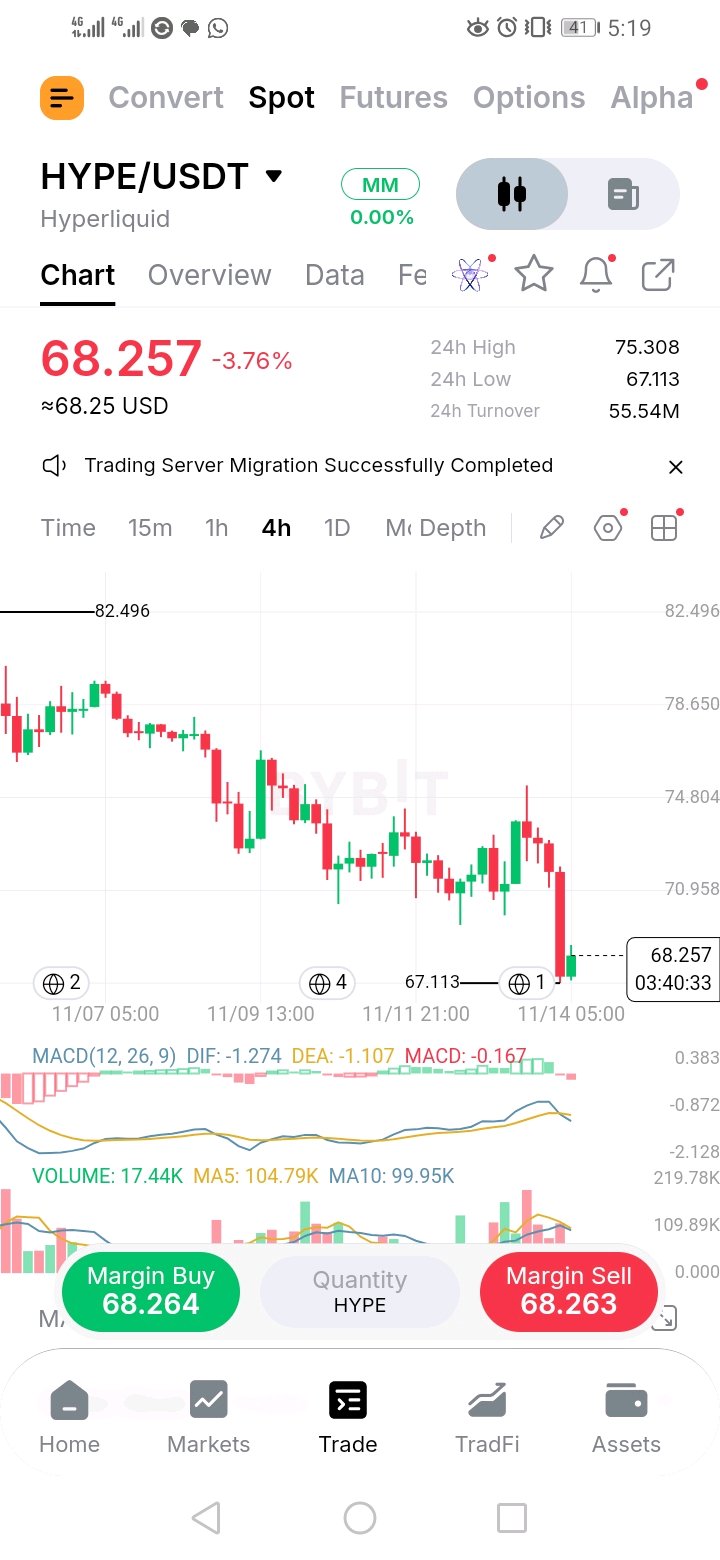
HYPE spent days chopping between about 69.5 and 73.3. Then one heavy red candle dropped from the mid-70s straight through the range floor to a low of 67.11. A small green candle has bounced it to 68.26, but that bounce is still under the old floor. When a range breaks down, the old support usually acts as resistance on the first retest. That puts 69.5 in play as the first area sellers will defend. MACD has also turned back down (DIF -1.27 vs DEA -1.11), so momentum is leaning down again after yesterday's brief upturn. Support: 67.11 (24h low and flush low). There is no marked support below it on this chart. Resistance: 69.50 (old range floor), 70.96, 73.30 (old range top), 74.80, 75.31 (24h high), 78.65, 82.50 (swing high) Bearish plan A: sell the retest Entry: 69.30 to 69.60, if price gets rejected at the old floor Stop loss: 70.40 Take profit: 68.00, then 67.11 (about 1.5R and 2.5R) What it means: broken support turning into resistance confirms the breakdown, and the low gets retested. Bearish plan B: breakdown continuation Trigger: 4H close below 67.11 Entry: retest of 67.20 from below Stop loss: 68.20 Take profit: 65.50, then 64.00 (about 1.7R and 3.2R) Note: there's no support under 67.11 on this chart, so these targets are estimates. Trail your stop. What it means: the flush low gives way, and the downtrend extends. Bullish plan A: bounce scalp (high risk) Entry: 67.60 to 67.20 Stop loss: 66.50 Take profit: 69.50, then 70.96 (about 2.3R and 4R) What it means: if buyers defend the flush low, a relief bounce back to the old floor is possible. It's a trade, not a trend change. Bullish plan B: reclaim the range Trigger: 4H close above 70.96 Entry: retest of 70.70 Stop loss: 69.60 Take profit: 73.30, then 74.80 (about 2.4R and 3.7R) Note: 70.96 and 74.80 come from the price axis, so treat them as approximate. What it means: getting back inside the old range turns the breakdown into a fake-out, and shorts have to cover. Invalidation: bears are wrong on a 4H close above 70.96. The bounce scalp is wrong below 66.50. Risks - The trend is down, so counter-trend longs have the lower odds. - After a sharp flush, a quick squeeze back to the old floor is common, so don't chase the lows. - Current volume (17K) looks small next to its averages (about 105K and 100K), but the candle is still open, so judge it at the close. - HYPE tends to follow BTC. A BTC move can ignore every level here. - Macro news can break levels fast. Recommendation: don't buy the middle. Sell the retest of 69.5 with a defined stop, or wait for a close above 70.96. If you scalp the low, use a small size and a hard stop. Does 69.5 hold as resistance, or does HYPE reclaim its range? #ByXIMPACT $HYPEUSDT $PEPEUSDT
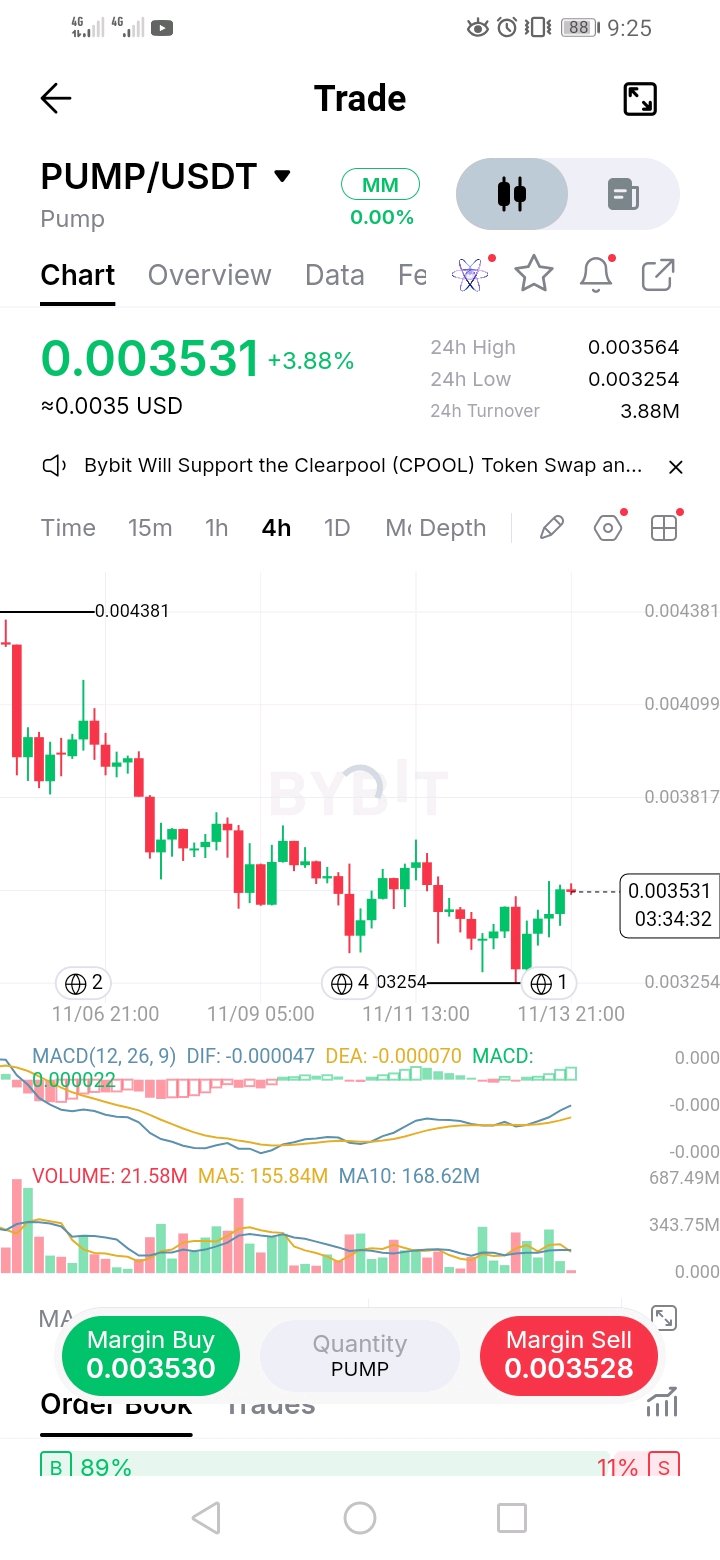
$PUMP 4H | Second test of the 0.00325 low held. A base is forming, but it isn't confirmed until 0.00382 breaks. PUMP fell from 0.004381 in a steady staircase of lower highs, then stopped at 0.003254 and bounced. It has now tested that low twice, and the second bounce is printing higher lows. If you draw it out, it looks like a double-bottom attempt, with the neckline near 0.00382 where earlier bounces got sold. MACD has just crossed up just below zero, so momentum is turning, but it's early. Current volume (21.6M) looks tiny next to its averages (156M and 169M), but the candle is still open, so judge it at the close. The order book is very bid-heavy (89/11), but that can flip in seconds and isn't a signal. Support: 0.003254 (24h low and swing low), about 0.00335 (earlier low zone) Resistance: 0.003564 (24h high), 0.003817 (neckline), 0.004099, 0.004381 (swing high) Bullish plan A: buy the higher low Entry: 0.003450 to 0.003400 Stop loss: 0.003320 Take profit: 0.003564, then 0.003817 (about 1.3R and 3.7R) What it means: if buyers keep defending higher lows, price works its way back toward the neckline. Bullish plan B: neckline breakout Trigger: 4H close above 0.003817 Entry: retest of 0.003800 Stop loss: 0.003700 Take profit: 0.004099, then 0.004381 (about 3R and 5.8R) What it means: a close above the neckline would confirm the double bottom and trap sellers who shorted the range. Bearish plan A: breakdown Trigger: 4H close below 0.003254 Entry: retest of 0.003260 from below Stop loss: 0.003340 Take profit: 0.003150, then 0.003050 (about 1.4R and 2.6R) Note: there's no support under 0.003254 on this chart, so these targets are estimates. Trail your stop. What it means: the base fails on a third test, and the downtrend resumes. Bearish plan B: sell the neckline Entry: 0.003780 to 0.003817, if price gets rejected Stop loss: 0.003900 Take profit: 0.003600, then 0.003450 (about 2R and 3.5R) What it means: sellers defend the range top, and price rotates back to the lows. Invalidation: bulls are wrong below 0.003254. Bears are wrong on a 4H close above 0.003817. Risks - The bigger trend is still down. A bounce inside a downtrend has to prove itself. - A third test of a low often breaks it, since each test absorbs more buyers. - MACD has crossed up but sits near zero, so momentum is early. - Meme and launchpad tokens can move 10% or more on one candle. - A BTC dip can break the low quickly. Recommendation: don't trade the middle of the range. Buy the higher lows with a tight stop, or wait for a close above 0.003817 and trade the retest. Keep size small. Does 0.003254 hold for a third time, or is the base about to fail? #ByXIMPACT $PUMPUSDT
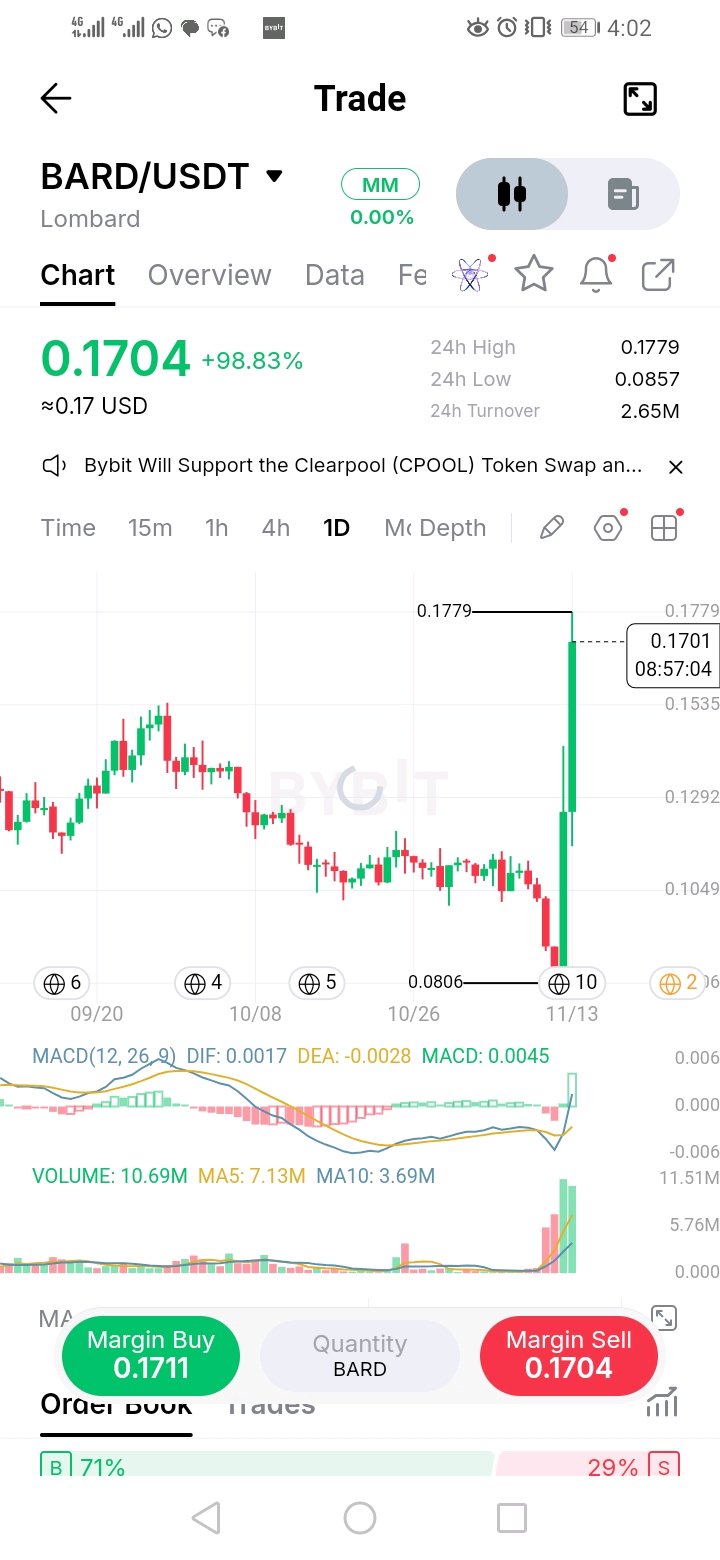
$BARD 1D | Nearly doubled in a day. The move is real, but the trade is the pullback, not the chase. BARD spent weeks drifting in a range around 0.10 to 0.13, then dropped to a low of 0.0806 and reversed straight up. Price is now at 0.1704, almost 100% off the 24h low (0.0857). It has also blown through the old swing high near 0.1535, which is a strong sign. Volume (10.7M) is far above its 5 and 10 day averages (7.1M and 3.7M), and MACD just crossed up from below zero, so buyers showed up with real size. The catch is how stretched this is. A near-vertical candle leaves a lot of air below it, and moves like this often give back a big part before any continuation. The candle already printed a small upper wick at 0.1779. Support: 0.1535 (old swing high, now the first test), 0.1292, 0.1049 (old range base), 0.0857 (24h low), 0.0806 (swing low) Resistance: 0.1779 (24h high). Nothing above it on this chart. Bullish plan A: buy the pullback (my preferred entry) Entry: 0.1560 to 0.1500 Stop loss: 0.1400 Take profit: 0.1704, then 0.1779 (about 1.3R and 1.9R) What it means: old resistance turning into support shows the breakout is accepted, and the high gets retested. Bullish plan B: continuation Trigger: daily close above 0.1779 Entry: retest of 0.1760 Stop loss: 0.1680 Take profit: 0.1900, then 0.2000 (about 1.8R and 3R) Note: there's no resistance above 0.1779 on this chart, so these targets are estimates. What it means: a daily close above the wick high would trap sellers and can start a second leg. Bearish plan A: spike fades Trigger: daily close below 0.1535 Entry: retest of 0.1520 from below Stop loss: 0.1620 Take profit: 0.1292, then 0.1049 (about 2.3R and 4.7R) What it means: the move was a one-day squeeze, and the old range comes back into play. Bearish plan B: sell the wick high Entry: 0.1740 to 0.1779, if price gets rejected Stop loss: 0.1850 Take profit: 0.1600, then 0.1535 (about 1.8R and 2.5R) What it means: sellers defend the 24h high, and price rotates back toward the breakout zone. Invalidation: bulls are wrong on a daily close below 0.1292. Bears are wrong above 0.1779. Risks - A near-100% daily move can reverse fast, and giving back half of it is common. - Turnover is thin (about 2.65M in 24h), so wicks, slippage and fake moves are common. - MACD just crossed up and is barely above zero, so momentum is new, not proven. - The order book leans to buyers (71/29), but that can flip in seconds and isn't a signal. - A BTC dip can erase the whole move. Recommendation: don't buy the green candle. Let price come back to the old high near 0.1535, or wait for a daily close above 0.1779. Keep size small and use stops. Does 0.1535 hold as support, or does BARD give the whole move back? Not financial advice. #ByXIMPACT $BARDUSDT $MNTUSDT
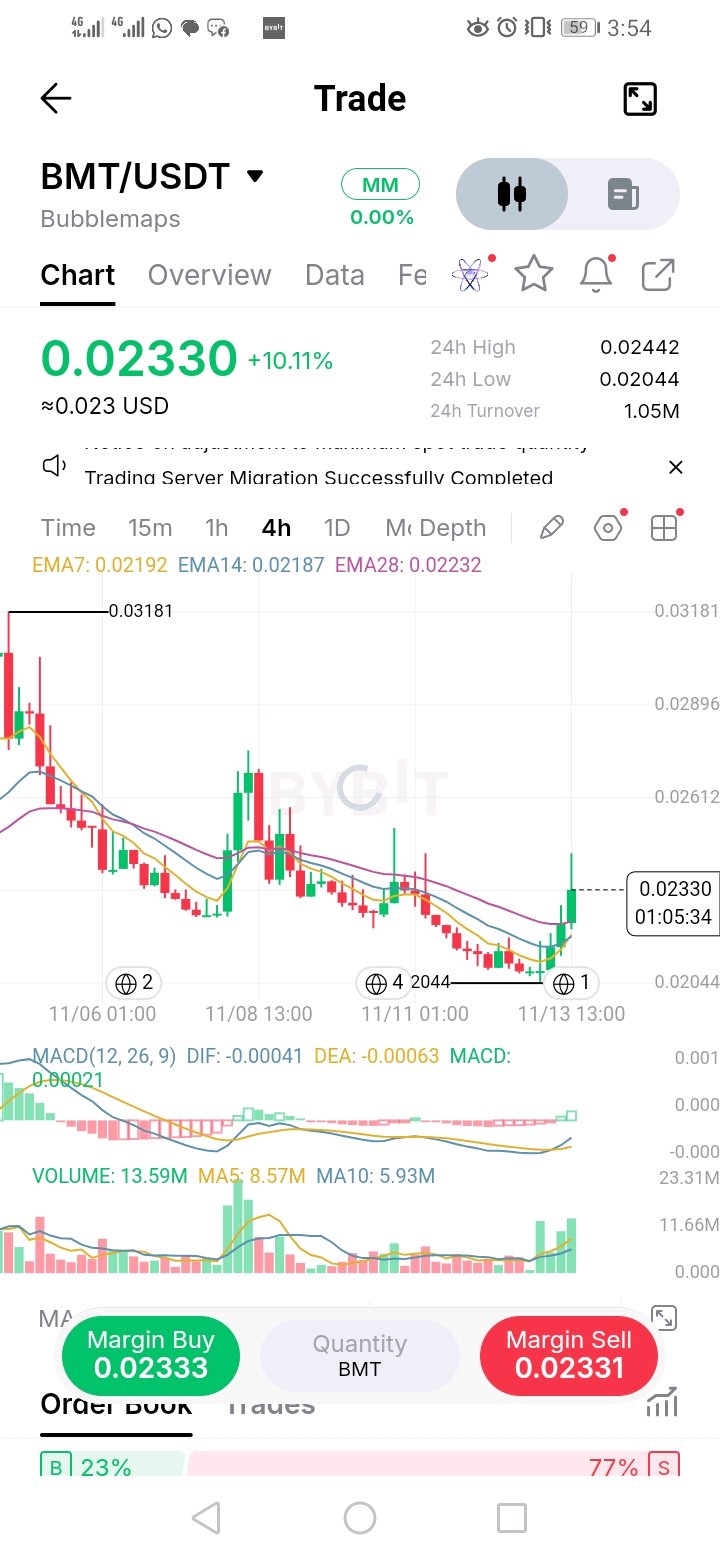
4H | Price broke out of a tight squeeze on rising volume. Now the question is whether the downtrend is really over. BMT fell from 0.03181 down to a low of 0.02044, then spent days grinding along its three 4H averages (EMA 7, 14, 28). Those averages are now bunched tightly around 0.0219 to 0.0223, which means the market had no direction. This candle (+10%) broke out of that cluster, and volume (13.6M) is well above its 5 and 10 period averages (8.6M and 5.9M), so the move has real participation behind it. MACD has just crossed up near zero. The catch is that the longer trend is still down, and the candle already printed an upper wick near 0.0245. Price is about 5% above the averages, so the better entry is a pullback, not the chase. Support: 0.02232 (EMA28), 0.02192 / 0.02187 (EMA7 / EMA14), 0.02044 (24h low and swing low) Resistance: 0.02442 (24h high and wick), 0.02612, 0.02896, 0.03181 (swing high) Bullish plan A: buy the pullback (my preferred entry) Entry: 0.02235 to 0.02195 Stop loss: 0.02130 Take profit: 0.02442, then 0.02612 (about 2.7R and 4.7R) What it means: price holding the old squeeze zone shows the breakout is real, and the wick high gets retested. Bullish plan B: breakout Trigger: 4H close above 0.02442 Entry: retest of 0.02430 Stop loss: 0.02340 Take profit: 0.02612, then 0.02896 (about 2R and 5R) What it means: clearing the wick high would trap sellers, and the next supply zone comes into play. Bearish plan A: failed breakout Trigger: 4H close below 0.02187, which puts price back under all three averages Entry: retest of 0.02195 from below Stop loss: 0.02260 Take profit: 0.02044, then 0.01950 (about 2.3R and 3.8R) Note: there's no support under 0.02044 on this chart, so 0.01950 is an estimate. Trail your stop. What it means: the move was a one-candle squeeze, and the low gets retested. Bearish plan B: sell the wick high Entry: 0.02420 to 0.02440, if price gets rejected Stop loss: 0.02500 Take profit: 0.02330, then 0.02235 (about 1.6R and 2.9R) What it means: sellers defend the 24h high, and price rotates back to the averages. Invalidation: bulls are wrong below 0.02187. Bears are wrong above 0.02442. Risks - The bigger trend is still down, so breakouts have to prove themselves. - MACD has just crossed up below zero, so momentum is early, not strong. - The order book is sell-heavy (77%), which is a short-term warning for bulls, but it can flip in seconds. - Turnover is thin (about 1M in 24h), so wicks and fake moves are common. - A BTC dip can erase the whole move. Recommendation: don't buy the green candle. Let price come back to the averages, or wait for a close above 0.02442. Keep size small and use stops. Do buyers defend 0.0223, or does BMT slip back into the squeeze? #ByXIMPACT $BMTUSDT $ETHUSDT
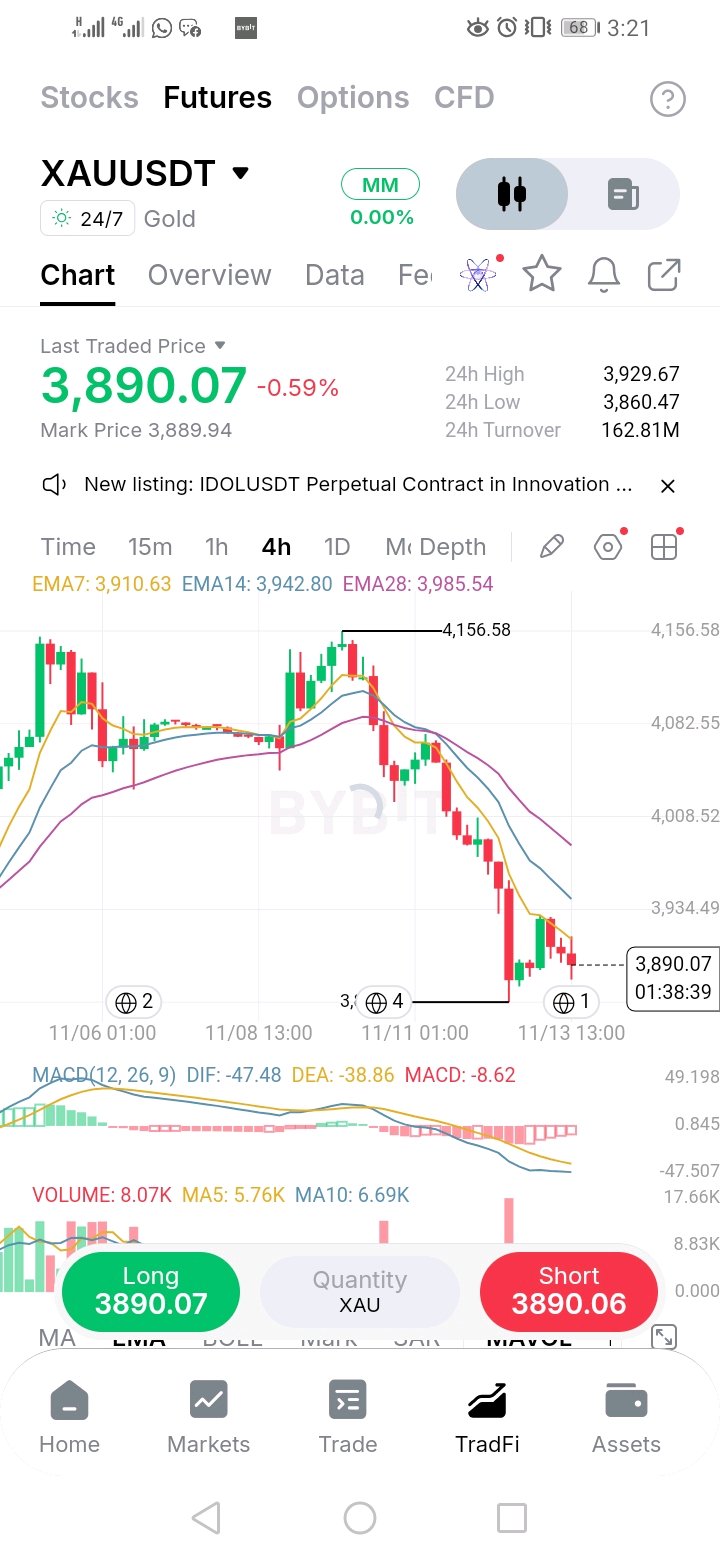
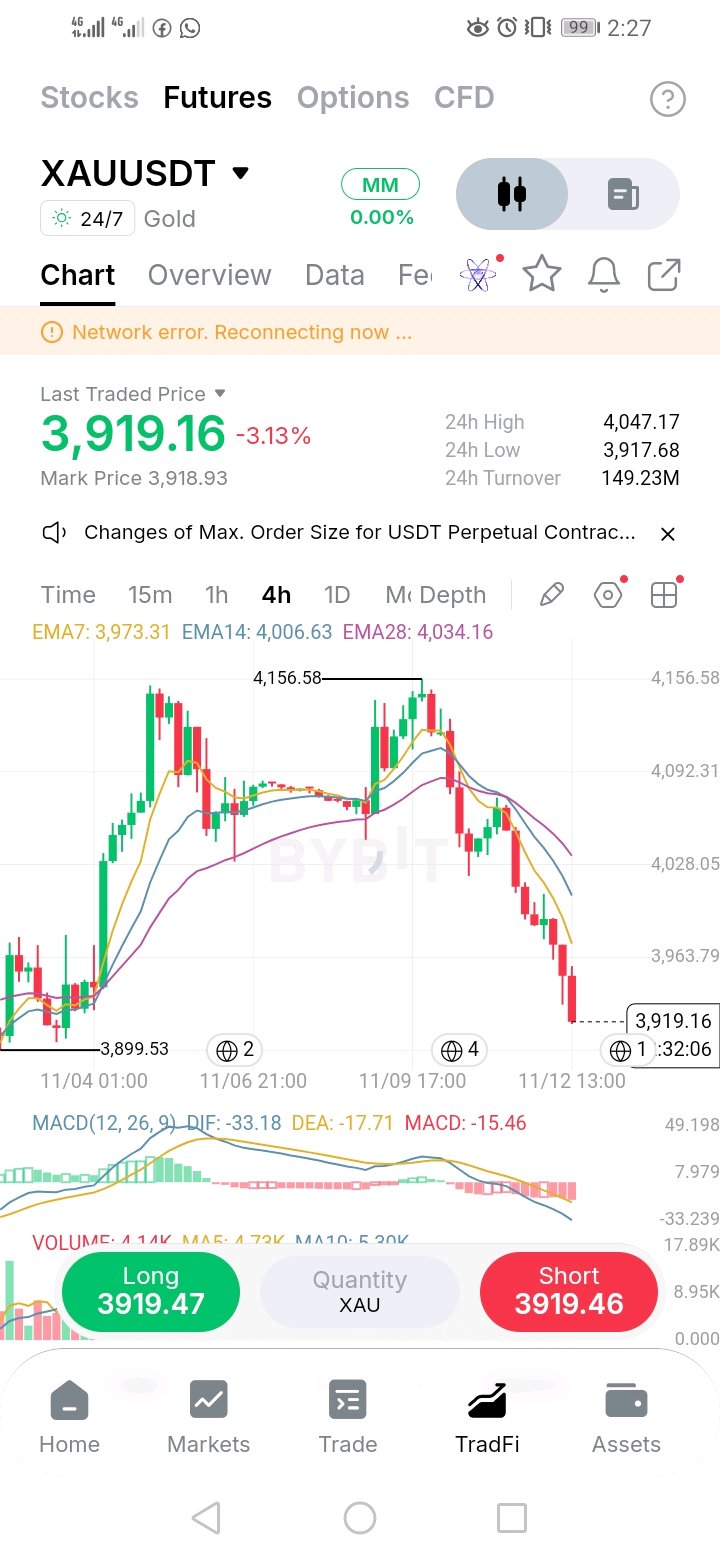
Gold peaked near 4,156, then sold off in steps. The 4H averages (EMA 7, 14, 28 at 3,911 / 3,943 / 3,986) have turned down and fanned out, with price underneath all three. After the big red flush candle, the bounce only made it back to about 3,930 (the 24h high), and the last candles are red again. A bounce that can't reclaim EMA7 is a pause, not a recovery. MACD is negative and widening (DIF -47.5 vs DEA -38.9), so momentum is still down. The flush candle printed the biggest volume bar on the chart. That is real selling, not drift. Support: 3,860 (24h low and flush low). Nothing marked below it on this chart. Resistance: 3,911 (EMA7), 3,930 (24h high), 3,943 (EMA14), 3,986 (EMA28), 4,009 and 4,083 (soft levels), 4,157 (swing high) Bearish plan A: sell the rejection Entry: 3,908 to 3,920, if price gets rejected at EMA7 or EMA14 Stop loss: 3,945 Take profit: 3,860, then 3,830 (about 1.7R and 2.7R) What it means: sellers still own the averages, and the flush low gets retested. Bearish plan B: breakdown Trigger: 4H close below 3,860 Entry: retest of 3,865 from below Stop loss: 3,885 Take profit: 3,830, then 3,800 (about 1.8R and 3.2R) Note: there's no support under 3,860 on this chart, so these targets are estimates. Trail your stop. What it means: the floor is gone, and the slide continues. Bullish plan A: bounce scalp (high risk) Entry: 3,870 to 3,862 Stop loss: 3,845 Take profit: 3,910, then 3,930 (about 2.1R and 3R) What it means: if buyers defend the flush low again, a bounce back to the averages is possible. It's a trade, not a trend change. Bullish plan B: real reversal Trigger: 4H close above 3,986, which reclaims all three averages Entry: retest of 3,980 Stop loss: 3,955 Take profit: 4,009, then 4,083 (about 1.2R and 4.1R) What it means: only then does the downtrend lose its grip, and shorts have to cover. Invalidation: bears are wrong above 3,986. The bounce scalp is wrong below 3,845. Risks - The trend is down, so counter-trend longs have the lower odds. - Gold reacts fast to US data, dollar moves and rate news. One headline can ignore every level here. - After a sharp flush, a quick squeeze higher is common, so don't chase the lows. - Current volume (8.1K) is above its averages (5.8K and 6.7K), but the candle is still open, so judge it at the close. Recommendation: don't buy the middle. Sell the rejection near the averages with a defined stop, or wait for a close above 3,986. If you scalp the low, use a small size and a hard stop. Does gold reject at EMA7 again, or does the flush low finally give way? Not financial advice. $XAUTUSDT $AAVEUSDT #ByXIMPACT
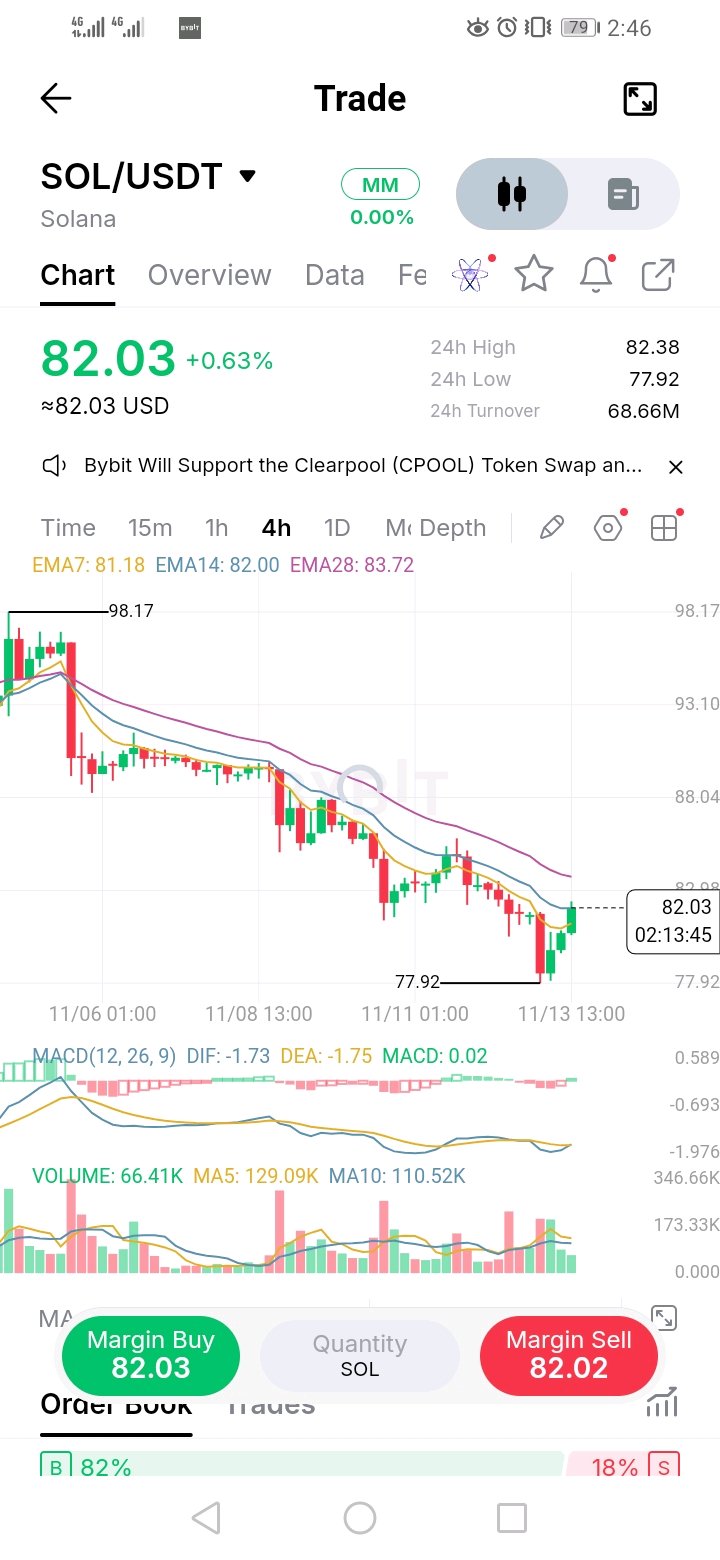
SOL 4H | Last week's low at 81.28 gave way. Now price is back at it from below, and EMA14 is capping it. SOL kept stepping down along its averages, then broke under the 81 area and flushed to 77.92 before buyers stepped in. Price is back at 82.03, which puts it right on EMA14 (82.00) and just above EMA7 (81.18). When price falls through a level and bounces back to it, that level usually acts as resistance first. All three 4H averages (EMA 7, 14, 28) still point down, with EMA28 overhead at 83.72. MACD has only just ticked up (DIF -1.73 vs DEA -1.75), and it is still below zero. That is an early turn, not a trend change. Support: 81.18 (EMA7), 77.92 (24h low and swing low) Resistance: 82.00 (EMA14), 82.38 (24h high), 83.72 (EMA28), 88.04, 93.10 and 98.17 (swing high) Bearish plan A: sell the rejection Entry: 83.40 to 83.70, if price gets rejected at EMA28 Stop loss: 84.80 Take profit: 81.20, then 77.95 (about 1.9R and 4.5R) What it means: sellers still own the averages, and the new low gets retested. Bearish plan B: breakdown Trigger: 4H close below 77.92 Entry: retest of 78.00 from below Stop loss: 79.20 Take profit: 75.80, then 73.50 (about 1.8R and 3.8R) Note: there's no support under 77.92 on this chart, so these targets are estimates. Trail your stop. What it means: the bounce failed, and the slide continues. Bullish plan A: reclaim the averages Trigger: 4H close above 83.72, which clears all three averages Entry: retest of 83.60 Stop loss: 82.40 Take profit: 88.00, then 93.10 (about 3.7R and 7.9R) Note: 88.00 and 93.10 come from the price axis, so treat them as approximate. What it means: buyers take control back, and sellers who shorted the breakdown have to cover. Bullish plan B: dip scalp (high risk) Entry: 78.80 to 78.00 Stop loss: 77.30 Take profit: 81.20, then 82.00 (about 2.5R and 3.3R) What it means: if buyers defend the low again, a bounce back to the averages is possible. It's a trade, not a trend change. Invalidation: bulls are wrong below 77.92. Bears are wrong above 83.72. Risks - The trend is down, so counter-trend longs have the lower odds. - Current volume (66K) is below its averages (129K and 111K), but the candle is still open, so judge it at the close. - The order book is bid-heavy (82/18), but that can flip in seconds and isn't a signal. - SOL follows BTC. A BTC dip can break the low quickly. - Macro news can ignore every level here. Recommendation: don't buy into EMA14. Sell the rejection at EMA28 with a defined stop, or wait for a close above 83.72. If you scalp the low, use a small size and a hard stop. Does SOL reclaim 83.72, or is the old low now a ceiling? Not financial advice. $SOLUSDT $PEPEUSDT #ByXIMPACT
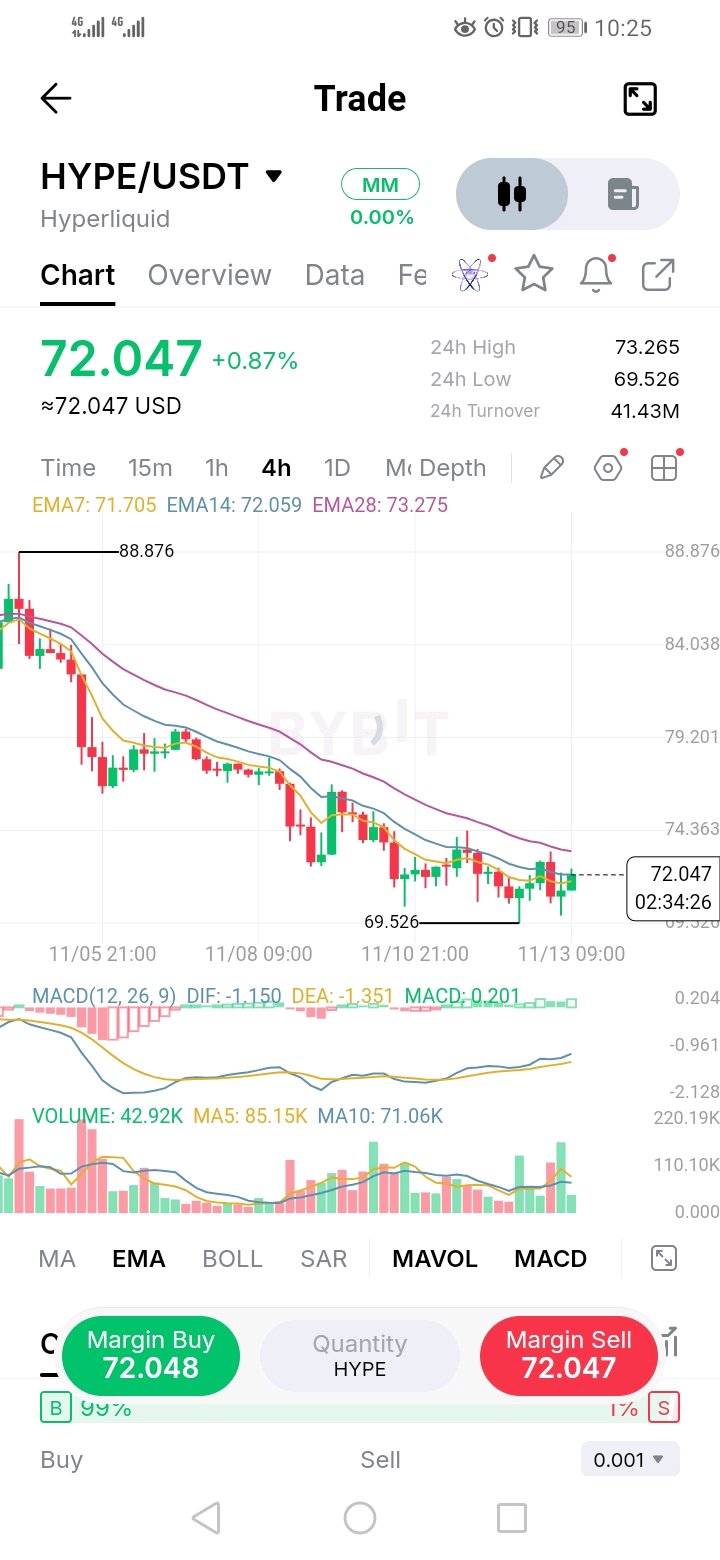
$HYPE 4H | Down 19% from 88.88, now stuck in a range at the lows. The edges decide the next move. HYPE has been in a steady downtrend, with all three 4H averages (EMA 7, 14, 28) pointing down. For the last few days, though, the selling has slowed into a tight range between 69.5 and 73.3. Price is now sitting right on EMA14 (72.06) and just above EMA7 (71.7), with EMA28 (73.28) overhead at the range top. There are early signs of a bottoming attempt. Sellers failed to push below 69.5 again, and MACD just crossed up. But MACD is still below zero, and price has not yet cleared EMA28, so the trend is still down until proven otherwise. Support: 71.70 (EMA7), 69.53 (24h low and swing low) Resistance: 72.06 (EMA14), 73.27 (24h high), 73.28 (EMA28), 74.36, 79.20, 88.88 (swing high) Bullish plan A: range breakout Trigger: 4H close above 73.30, which clears EMA28 and the 24h high Entry: retest of 73.10 to 73.30 Stop loss: 72.00 Take profit: 74.40, then 79.20 (about 1R and 5R) What it means: reclaiming all three averages ends the lower-highs pattern, and trapped sellers become buyers. Bullish plan B: buy the range low Entry: 70.20 to 69.70 Stop loss: 68.80 Take profit: 72.00, then 73.20 (about 1.7R and 2.7R) What it means: if buyers defend the low a third time, the range holds and price rotates back to the top. Bearish plan A: breakdown Trigger: 4H close below 69.53 Entry: retest of 69.60 from below Stop loss: 70.80 Take profit: 67.50, then 65.00 (about 1.7R and 3.8R) Note: there's no support under 69.53 on this chart, so these targets are estimates. Trail your stop. What it means: the floor is gone, and the downtrend resumes. Bearish plan B: sell the range top Entry: 73.00 to 73.30, if price gets rejected at EMA28 Stop loss: 74.40 Take profit: 71.70, then 69.70 (about 1.2R and 2.9R) What it means: sellers still control the averages, and price rotates back to the range low. Invalidation: bulls are wrong below 69.53. Bears are wrong above 74.36. Risks - The trend is still down, so breakouts have to prove themselves. - MACD has crossed up but sits below zero, so momentum is early, not strong. - Current volume (42.9K) is below its averages (85K and 71K), but the candle is still open, so judge it at the close. - The order book looks heavily bid-sided, but that can flip in seconds and isn't a signal. - HYPE tends to follow BTC. A BTC dip can break the range low quickly. Recommendation: don't trade the middle of the range. Buy the low or sell the top with tight stops, or wait for a close outside 69.53 to 73.30 and trade the retest. Keep size small. Which breaks first, 73.30 or 69.53? Not financial advice. #ByXIMPACT
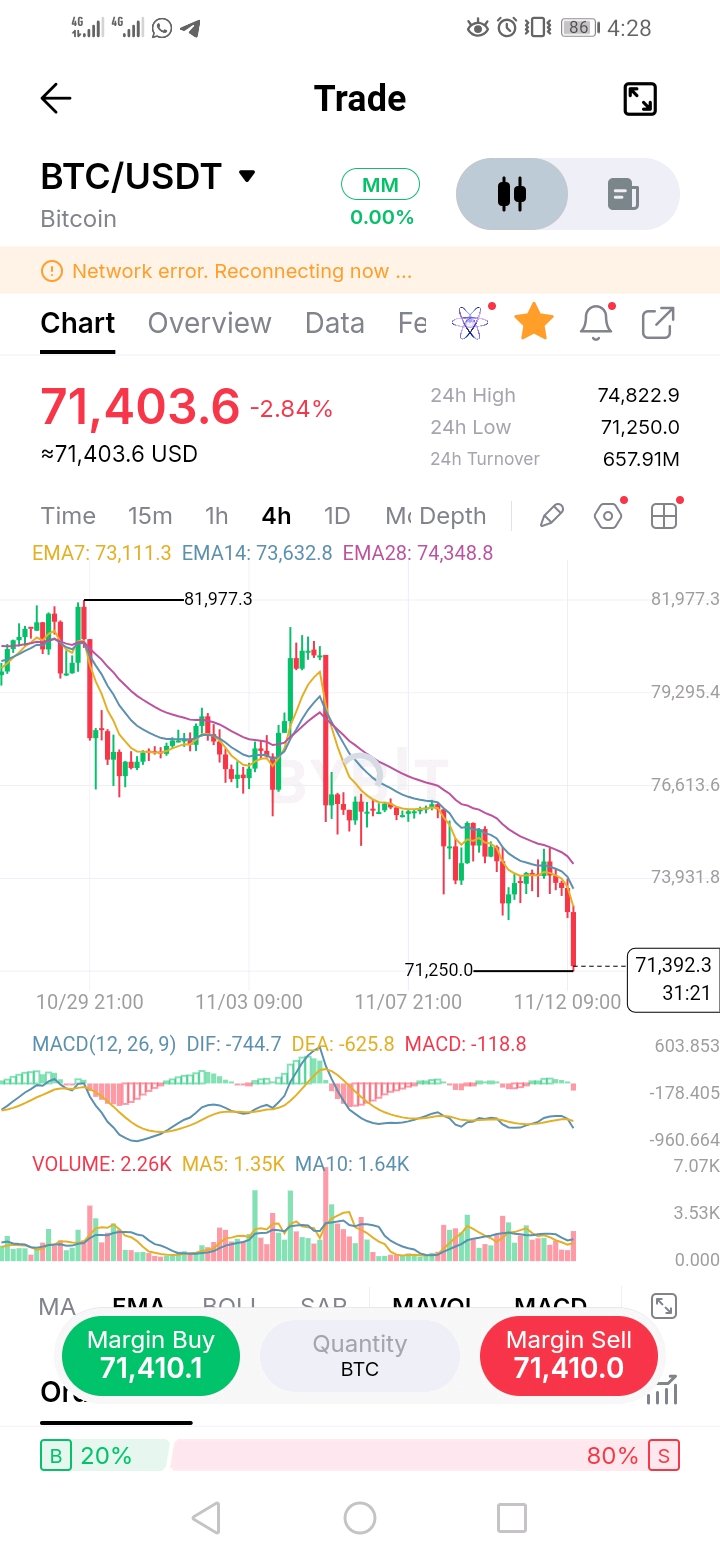
BTC has been making lower highs since the 81,977 top, with all three 4H averages (EMA 7, 14, 28) pointing down and price below them. The last candle dropped about 2.8% and printed a new low at 71,250, and the range that held it near 74,000 failed. Volume matters here. Current volume (2.26K) is already above its 5 and 10 period averages (1.35K and 1.64K), so this drop has real selling behind it. MACD is negative and widening, and the order book leans heavily to sellers (80%). Price is about 2.3% below EMA7 (73,111), so a bounce is likely at some point, but a bounce under falling averages is still a rally into resistance. Support: 71,250 (24h low and swing low). There is no marked support below it on this chart. Resistance: 73,111 (EMA7), 73,632 (EMA14), 74,349 (EMA28), 74,823 (24h high), 76,614 (soft level), 79,295 (soft level), 81,977 (swing high) Bearish plan A: breakdown continuation Trigger: 4H close below 71,250 Entry: retest of 71,300 from below Stop loss: 71,900 Take profit: 70,200, then 69,000 (about 1.8R and 3.8R) Note: there's no support below 71,250 on this chart, so these targets are estimates. Trail your stop. What it means: the floor is gone, and the slide continues. Bearish plan B: sell the bounce Entry: 72,900 to 73,100, if price gets rejected at EMA7 Stop loss: 73,750 Take profit: 71,800, then 71,250 (about 1.6R and 2.3R) What it means: sellers still control the averages, and the low gets retested. Bullish plan A: bounce scalp (high risk) Entry: 71,500 to 71,250 Stop loss: 70,800 Take profit: 72,500, then 73,100 (about 1.8R and 2.8R) What it means: if buyers defend the low, a relief bounce back to the averages is possible. It's a trade, not a trend change. Bullish plan B: real reversal Trigger: 4H close above 74,349, which reclaims all three averages Entry: retest of 74,300 Stop loss: 73,650 Take profit: 76,600, then 79,300 (about 3.5R and 7.7R) What it means: only then does the downtrend lose its grip, and trapped sellers have to cover. Invalidation: bears are wrong above 74,349. The bounce scalp is wrong below 70,800. Risks - The trend is down, so counter-trend longs have the lower odds. - Breakdowns can trigger forced selling, which pushes price through levels faster than expected. - A sharp drop often brings a sharp bounce first, so don't chase the lows. - BTC leads the whole market. A move here hits every altcoin. - Macro news (US data, rate talk, ETF flows) can ignore every level here. - The order book is sell-heavy (80%), which supports the bears, but it can flip in seconds and isn't a signal. Recommendation: don't try to catch the exact bottom. Sell the rejection near the averages with a defined stop, or wait for a close above 74,349. If you scalp the low, use a small size and a hard stop. Does 71,250 hold, or is this the start of the next leg down? $BTCUSDT $HYPEUSDT #ByXIMPACT
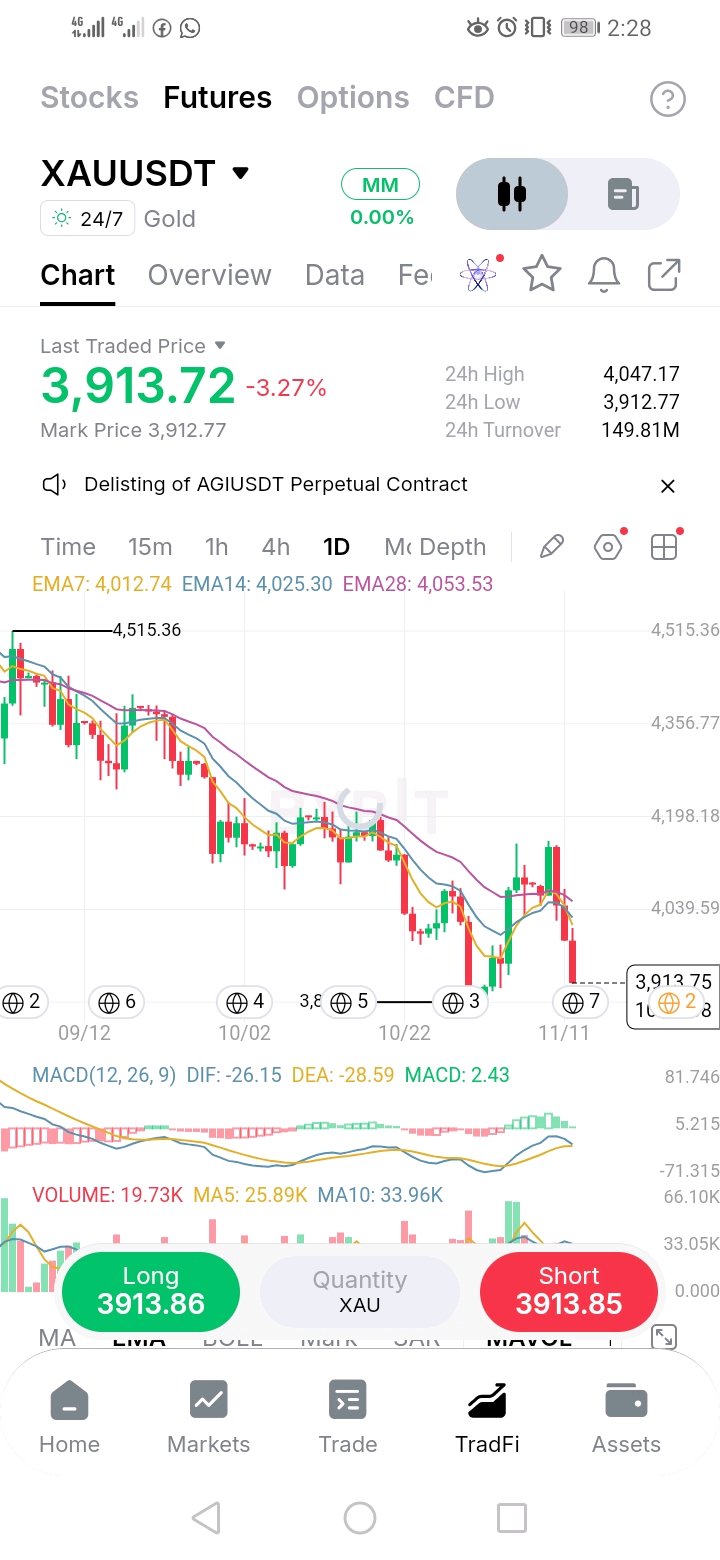
XAUUSDT 1D | Gold failed the rally, lost every daily average, and is now sitting near the old lows. Gold has been in a steady downtrend since the 4,515 high, with all three daily averages (EMA 7, 14, 28) pointing down. The recent bounce topped out near 4,150, then reversed hard. Today's candle is a big red one (-3%) that closed back under EMA7, EMA14 and EMA28 (4,012 / 4,025 / 4,054). That turns the whole bounce into a failed rally. Price is now at 3,914, close to the previous swing low near 3,880. MACD looks slightly positive, but price is making lower lows while it does, so I don't trust it. Volume (19.7K) is below its 5 and 10 day averages, but the candle is still open, so judge it at the close. Support: 3,912 (24h low), about 3,880 (previous swing low) Resistance: 4,012 (EMA7), 4,025 (EMA14), 4,047 (24h high), 4,054 (EMA28), about 4,150 (rally high) Bearish plan A: sell the rejection Entry: 4,000 to 4,012, if price gets rejected at the averages Stop loss: 4,035 Take profit: 3,950, then 3,880 (about 1.9R and 4.3R) What it means: sellers keep control, and the old low gets retested. Bearish plan B: breakdown Trigger: daily close below 3,880 Entry: retest of 3,885 from below Stop loss: 3,915 Take profit: 3,820, then 3,760 (about 2.2R and 4.2R) Note: there's no support under 3,880 on this chart, so these targets are estimates. Trail your stop. What it means: the floor is gone, and the slide continues. Bullish plan A: bounce scalp (high risk) Entry: 3,900 to 3,885 Stop loss: 3,860 Take profit: 3,960, then 4,012 (about 2R and 3.6R) What it means: if buyers defend the old low, a relief bounce back to the averages is possible. It's a trade, not a trend change. Bullish plan B: real reversal Trigger: daily close above 4,054, which reclaims all three averages Entry: retest of 4,045 Stop loss: 4,010 Take profit: 4,150, then 4,200 (about 3R and 4.4R) What it means: only then does the downtrend lose its grip, and trapped sellers become buyers. Invalidation: bears are wrong above 4,054. The bounce scalp is wrong below 3,860. Risks - The trend is down, so counter-trend longs have the lower odds. - Gold reacts fast to US data, dollar moves and rate news. One headline can ignore every level here. - A big daily drop often brings a sharp, short bounce before the next leg, so don't chase the lows. - MACD is slightly positive while price falls, so the signals disagree. Recommendation: don't try to call the exact bottom. Sell the rejection at the averages with a defined stop, or wait for a close above 4,054. If you scalp the bounce, use a small size and a hard stop. Does 3,880 hold, or is gold heading lower? Not financial advice. Before posting: Cut-off label: the swing-low label is partly hidden in your screenshot. I estimated it at about 3,880 from the price axis, so check it on the live chart before posting. Estimated level: the rally high near 4,150 is also read from the axis, so treat it as a soft level. $XAUTUSDT $SOLUSDT #ByXIMPACT
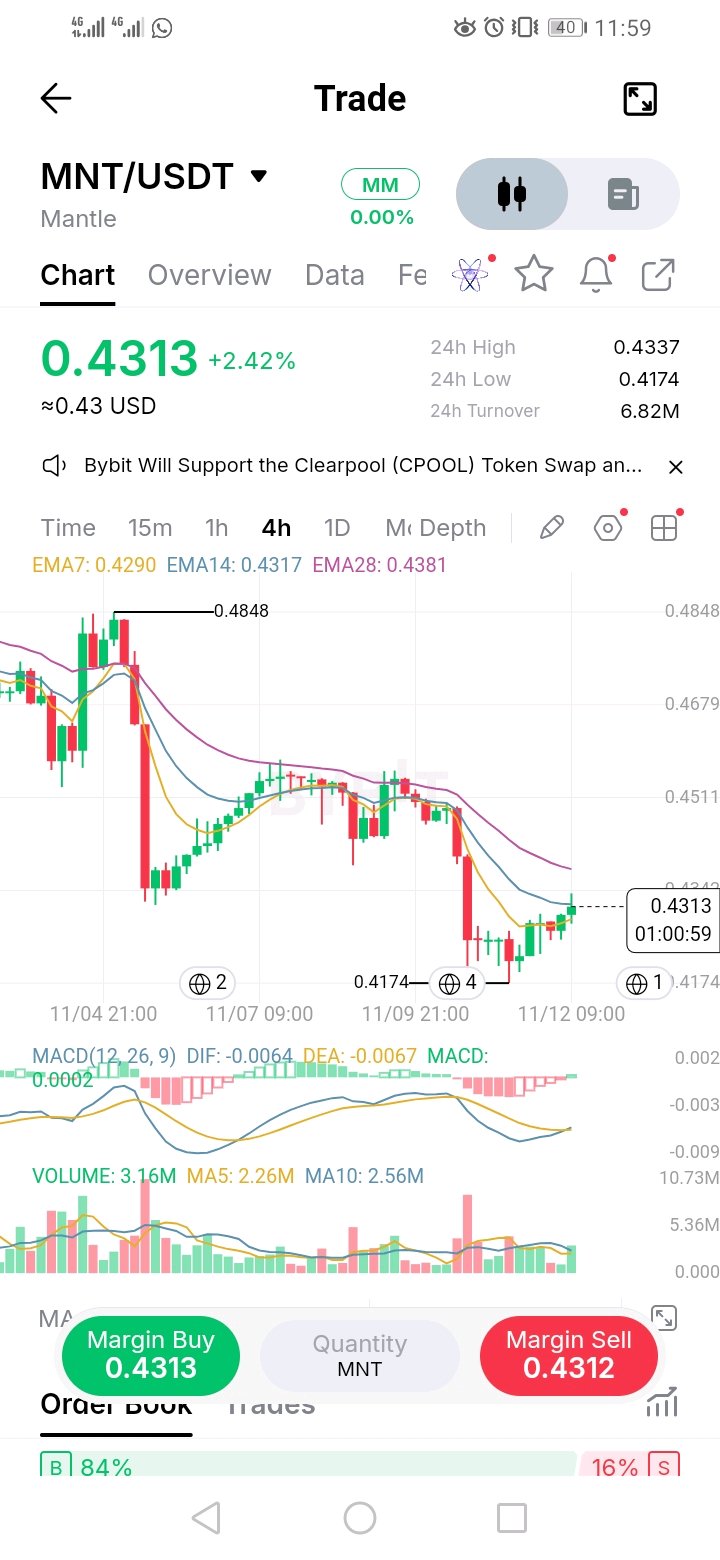
First bounce off 0.4174 is running into the averages. This is where it gets decided. MNT slid from the 0.4511 area down to a low of 0.4174, then recovered in small steps. Price is now at 0.4313, sitting right on EMA14 (0.4317), with EMA7 (0.4290) just below and EMA28 (0.4381) overhead. All three averages are still pointing down, so this is a test, not a reversal. There is some support behind the bounce. Current volume (3.16M) is above its 5 and 10 period averages (2.26M and 2.56M), and MACD is about to cross up near its signal line. But MACD is still below zero, so momentum is only just turning. Support: 0.4290 (EMA7), 0.4174 (24h low and swing low) Resistance: 0.4317 (EMA14), 0.4337 (24h high), 0.4381 (EMA28), 0.4511, 0.4679, 0.4848 (swing high) Bearish plan A: sell the rejection Entry: 0.4375 to 0.4385, if price gets rejected at EMA28 Stop loss: 0.4430 Take profit: 0.4290, then 0.4174 (about 1.8R and 4R) What it means: sellers still control the averages, and the low gets retested. Bearish plan B: breakdown Trigger: 4H close below 0.4174 Entry: retest of 0.4180 from below Stop loss: 0.4225 Take profit: 0.4100, then 0.4050 (about 1.8R and 2.9R) Note: there's no support under 0.4174 on this chart, so these targets are estimates. Trail your stop. What it means: the floor is gone, and the slide continues. Bullish plan A: reclaim the averages Trigger: 4H close above 0.4381, which clears all three averages Entry: retest of 0.4370 Stop loss: 0.4320 Take profit: 0.4511, then 0.4679 (about 2.8R and 6R) What it means: buyers take control back, and sellers who shorted the drop have to cover. Bullish plan B: dip scalp (high risk) Entry: 0.4220 to 0.4180 Stop loss: 0.4140 Take profit: 0.4290, then 0.4317 (about 1.5R and 1.9R) What it means: if buyers defend the low again, a quick bounce back to the averages is possible. It's a trade, not a trend change. Invalidation: bulls are wrong below 0.4174. Bears are wrong on a 4H close above 0.4381. Risks - The trend is still down, so counter-trend longs have the lower odds. - MACD is still below zero, so the upturn is early and unproven. - The order book leans heavily to buyers (84/16), but that can flip in seconds and isn't a signal. - MNT follows BTC. A BTC dip can break 0.4174 quickly. Recommendation: don't buy into the averages. Sell the rejection at EMA28 with a defined stop, or wait for a close above 0.4381. If you scalp the low, use a small size and a hard stop. Does MNT clear EMA28, or is this just a pause before another leg down? Not financial advice. Before posting: Tag: add thetag or a trading widget. Open candle: about 1 hour was left on the 4H candle in your screenshot, so recheck the levels against the live chart. Similar posts: your last MNT post was three days ago. This one has different levels, a different structure and a different setup, so it should count as independent. Gridline levels: 0.4511 and 0.4679 come from the price axis, so treat them as soft levels. $MNTUSDT $ETHUSDT #ByXIMPACT