
S T E P H E N
7643Лайк0Акциялар545Жанкүйерлер646Жазылу
I M crypto signal provider 100 parsent right signals lets go
I M crypto signal provider 100 parsent right signals lets go
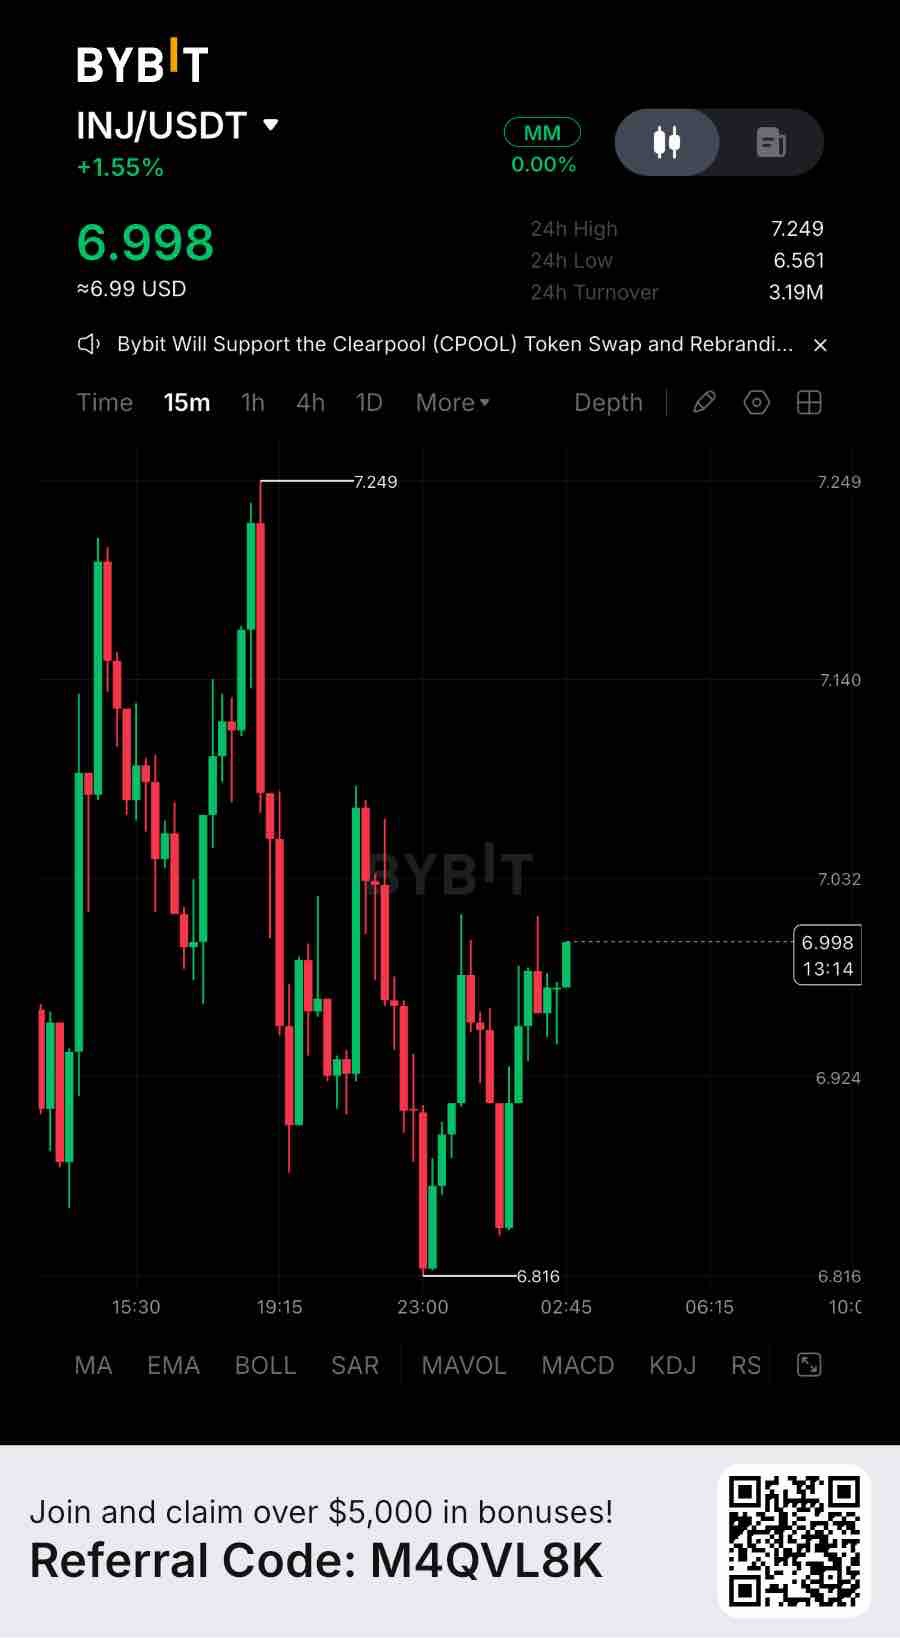
Injective now reports more than $11B in assets issued through its tokenization infrastructure, while its on-chain orderbook processed $12.86B in trading volume between November 2025 and November 2026. RWA perpetuals alone generated nearly $1.8B in volume. That’s real usage, not narrative. But valuation tells a different story. INJ carries a reported circulating market cap of approximately $690M against just $16.36M in DeFi TVL, putting its market-cap-to-TVL multiple around 42.2x. For comparison, Maple trades around 0.052x and Pendle around 0.255x on the same metric. INJ therefore screens roughly 814x richer than Maple and 165x richer than Pendle. These are not perfectly comparable businesses, since Injective is a Layer 1 rather than a standalone yield protocol, but the difference highlights how much future ecosystem growth is already reflected in its valuation. The underlying expansion is meaningful. Tokenized stocks established new monthly volume records from July through October, while RWA perpetuals expanded into equities, foreign exchange, commodities and indices. Pineapple Financial has also migrated more than $1B in residential mortgage records onto Injective, with 2,079 records visible on its public dashboard. Importantly, these mortgage records represent tokenized data infrastructure, not $1B of liquid collateral or traditional mortgage securities. Injective has additionally secured SEC transfer-agent registration and expanded INJ access to Solana. There is also a supply consideration. SEC filings show total INJ supply reached approximately 122.9M by September 15, 2026, against the commonly reported 100M initial supply. Annualized issuance stood at 4.4%. The Supply Squeeze proposal strengthens the deflationary mechanism, but actual supply reduction still depends on ecosystem revenue and buyback activity exceeding issuance. From a market perspective, INJ is trading around $6.89. Immediate support sits near $6.44, with resistance around $7.15. I would avoid chasing the current movement without confirmation. A 4H close above $7.15 followed by a successful retest could open $7.85 and eventually $8.76. However, losing $6.44 on a confirmed 4H breakdown would weaken the structure and expose $6.01, followed by $5.18. The short-term trend remains under pressure despite stronger higher-timeframe momentum. None of this says the token is wrong. It says the on-chain growth story and the price story are running on separate clocks right now. Worth asking which one catches up to the other first — and whether more chains, institutional products and tokenized assets alone are enough to close a valuation gap that size. #ByXIMPACT $INJUSDT

Hedera continues to process significant network activity, with approximately $20.65M in DeFi TVL and $493M in bridged TVL. Daily transactions remain around 679K. That’s real network usage, not just narrative. But the valuation question is more complicated. HBAR carries a circulating market capitalization of approximately $2.5B, while its DeFi ecosystem remains relatively small. This creates a gap between the valuation investors are assigning to the network and the capital currently deployed in its DeFi applications. The RWA opportunity remains an important part of Hedera’s longer-term positioning. Institutional tokenization, asset issuance and enterprise infrastructure could expand its economic footprint. However, adoption needs to translate into sustained capital inflows, deeper liquidity and recurring network revenue before it can justify a significantly higher valuation. One metric deserves attention: Hedera generates relatively modest daily network fees compared with its market capitalization. High transaction counts do not automatically translate into equivalent economic value for HBAR holders. From a trading perspective, HBAR is currently around $0.057–$0.058. Immediate support sits near $0.0550, while resistance is around $0.0595–$0.0605. A 4H close above $0.0605 followed by a successful retest could open the way toward $0.0620 and $0.0645. However, losing $0.0550 on a confirmed 4H breakdown would weaken the structure and expose $0.0525, followed by $0.0500. None of this says HBAR is fundamentally weak. It says the network adoption story and the token valuation story are moving on different clocks. The real question is whether institutional adoption eventually translates into measurable economic value for the token. #ByXIMPACT $HBARUSDT

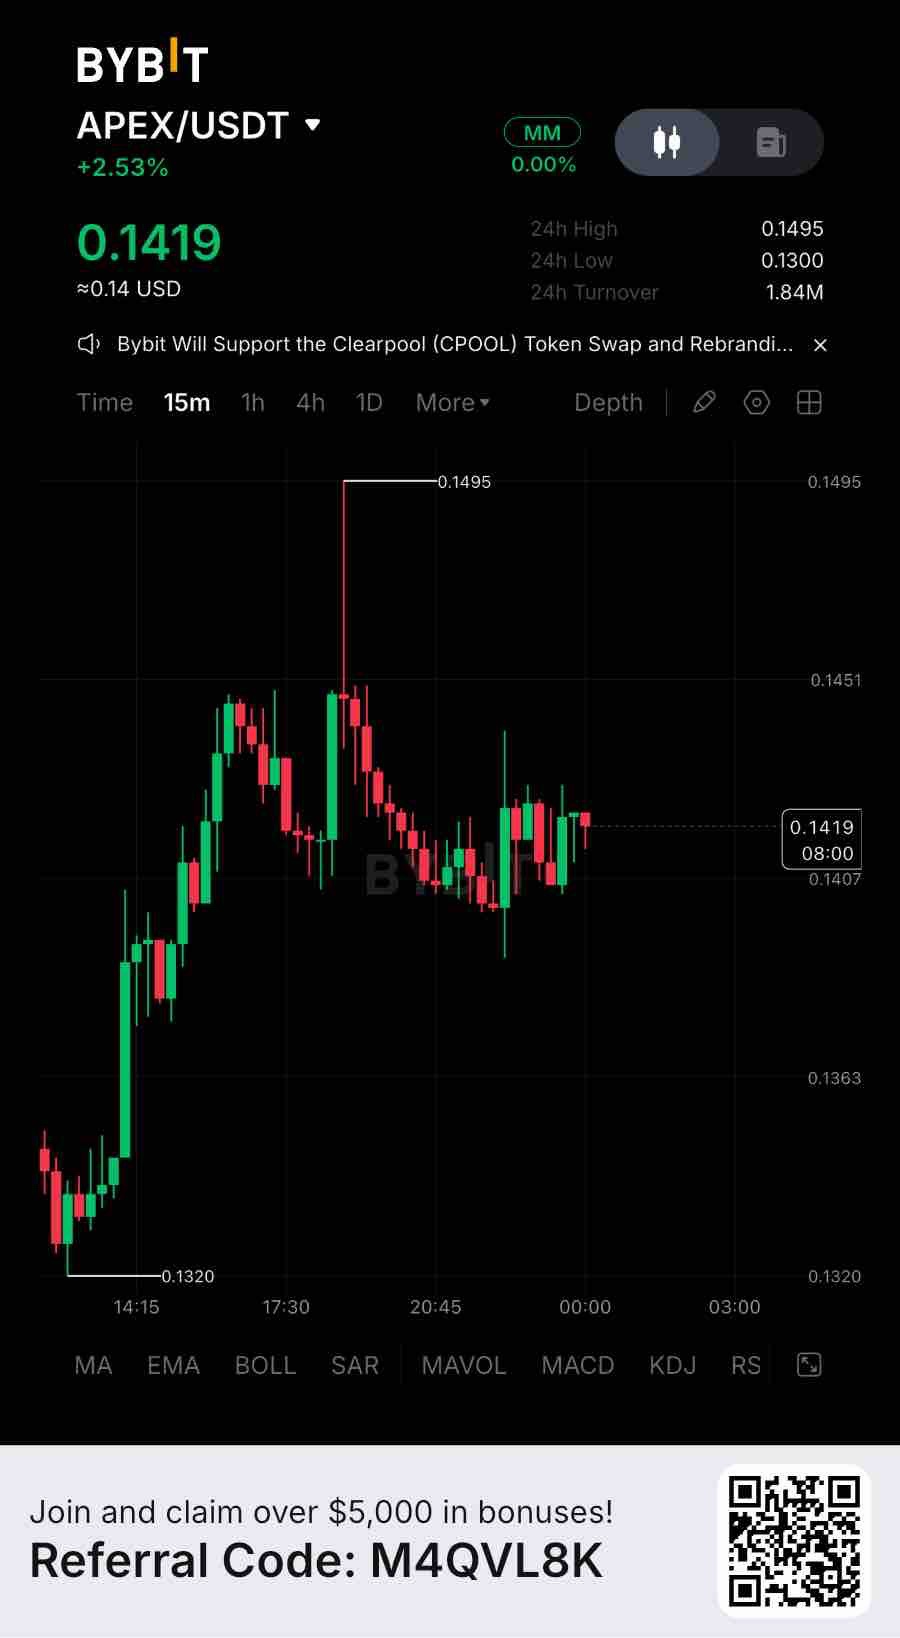
ApeX Protocol currently holds approximately $28.58M in TVL and processed $9.482B in perpetual trading volume over the last 30 days. That’s real usage, not narrative. The valuation is where things become interesting. APEX carries a circulating market cap of approximately $22.27M, equivalent to 0.78x TVL. Compared with GMX, which trades around 0.37x TVL, APEX carries roughly 2.1x the valuation multiple. The difference becomes more important when comparing actual holder revenue rather than trading activity alone. The underlying footprint is not insignificant. ApeX operates across eight chains, with approximately $12.85M on Arbitrum, $8.87M on Ethereum, $3.06M on Base, $2.63M on BSC and $1.17M on Mantle. Its combined products, ApeX Pro and ApeX Omni, have generated $41.62M in cumulative fees. The latest 30-day figures show approximately $326,641 in fees and $163,320 in reported holder revenue. ApeX Omni also directs 50% of trading fees toward APEX buybacks, creating a direct mechanism connecting protocol activity with token demand. The quiet concern is that trading activity has not translated into expanding TVL. A $9.48B notional volume figure looks substantial, but leveraged turnover is not the same as capital retained in the protocol. If TVL continues declining while fee generation remains dependent on trading activity, the current valuation premium becomes harder to justify. For the trade, APEX is hovering around $0.1413, with immediate support near $0.1380 and stronger downside support around $0.1310–$0.1280. Recovery resistance sits near $0.1420, followed by $0.1490. I’m watching this zone closely and would not chase a bounce without confirmation. The bullish setup becomes more interesting after a confirmed 4H close above $0.1420 and a successful retest, potentially opening the way toward $0.1490 and $0.1520. A 4H breakdown below $0.1310 would weaken the recovery structure, with the broader $0.1280 area becoming the next reference zone. None of this says the token is wrong. It says the on-chain growth story and the price story are running on separate clocks right now. Worth asking which one catches up to the other first — and whether more chains, higher volume and continued buybacks are enough to close a valuation premium that large. #ByXIMPACT $APEXUSDT

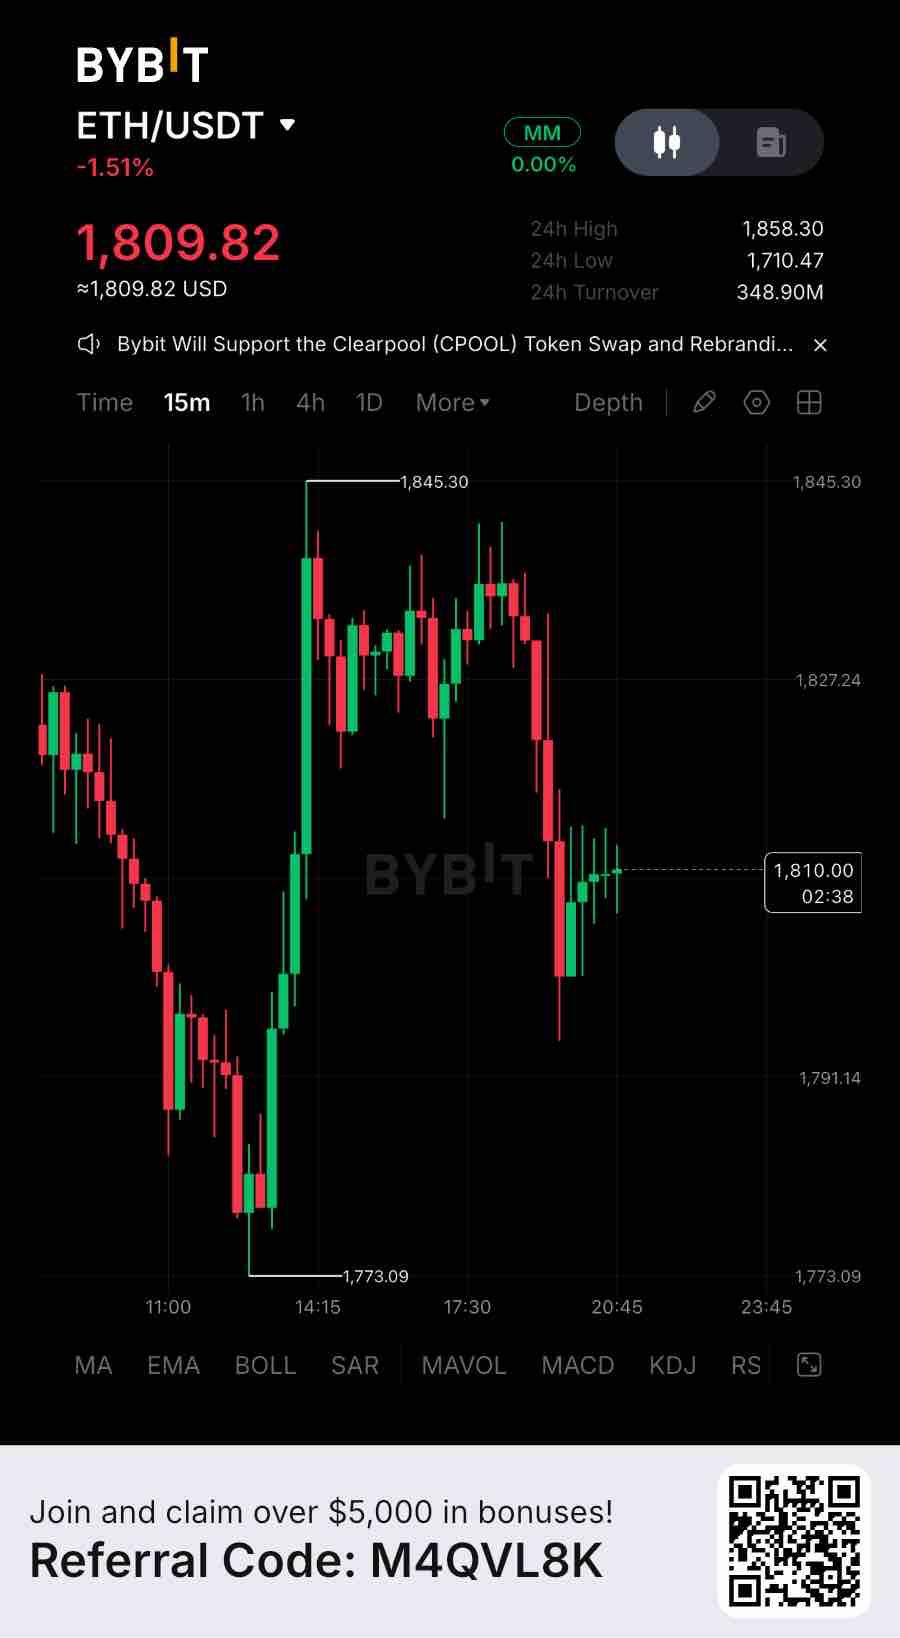
Ethereum currently holds approximately $11.86B in active RWA AUM, while its DeFi ecosystem maintains $37.94B in total value locked. However, Ethereum’s RWA AUM has contracted by approximately $3.2B, or 22.3%, over the past 30 days. That’s real usage, not narrative. The valuation picture deserves closer attention. ETH carries an estimated $222.2B market capitalization, equivalent to approximately 5.9x Ethereum’s DeFi TVL. Against its active RWA AUM alone, the multiple rises to roughly 18.7x. These are different valuation proxies, not direct revenue multiples, but they highlight an important distinction: Ethereum’s market valuation already reflects expectations of substantial future economic activity. The underlying ecosystem remains significant. Ethereum supports approximately $132.1B in stablecoin liquidity, $2.69B in daily DEX volume and around 2.07 million daily transactions. Chain fees reached approximately $641K over the latest 24-hour reporting period, while application-level revenue stood near $2.92M. The network continues to facilitate meaningful financial activity, but transaction volume and application revenue do not automatically translate into equivalent value accrual for ETH holders. The quieter concern is capital contraction. Despite Ethereum’s established position in tokenized assets and decentralized finance, the recent decline in RWA AUM suggests that institutional and on-chain capital deployment is not moving in one direction. Growing infrastructure does not guarantee continuously expanding capital commitments. For the trade, ETH is hovering around $1,830, with immediate support around $1,732 and recovery resistance near $1,839. I’m watching this zone closely and would not chase a bounce without confirmation. The bullish setup becomes more interesting after a confirmed 4H close above $1,839, followed by a successful retest. This could open the way toward $1,892 and potentially $2,110. However, the broader technical structure remains bearish, with the 4H, daily and weekly indicators all showing bearish conditions. A 4H breakdown below $1,732 would weaken the recovery structure, bringing $1,666 and $1,600 into focus as the next downside reference zones. None of this says the token is wrong. It says the on-chain growth story and the price story are running on separate clocks right now. Worth asking which one catches up to the other first — and whether more liquidity, tokenized assets and network activity alone are enough to justify ETH’s current valuation. #ByXIMPACT $ETHUSDT
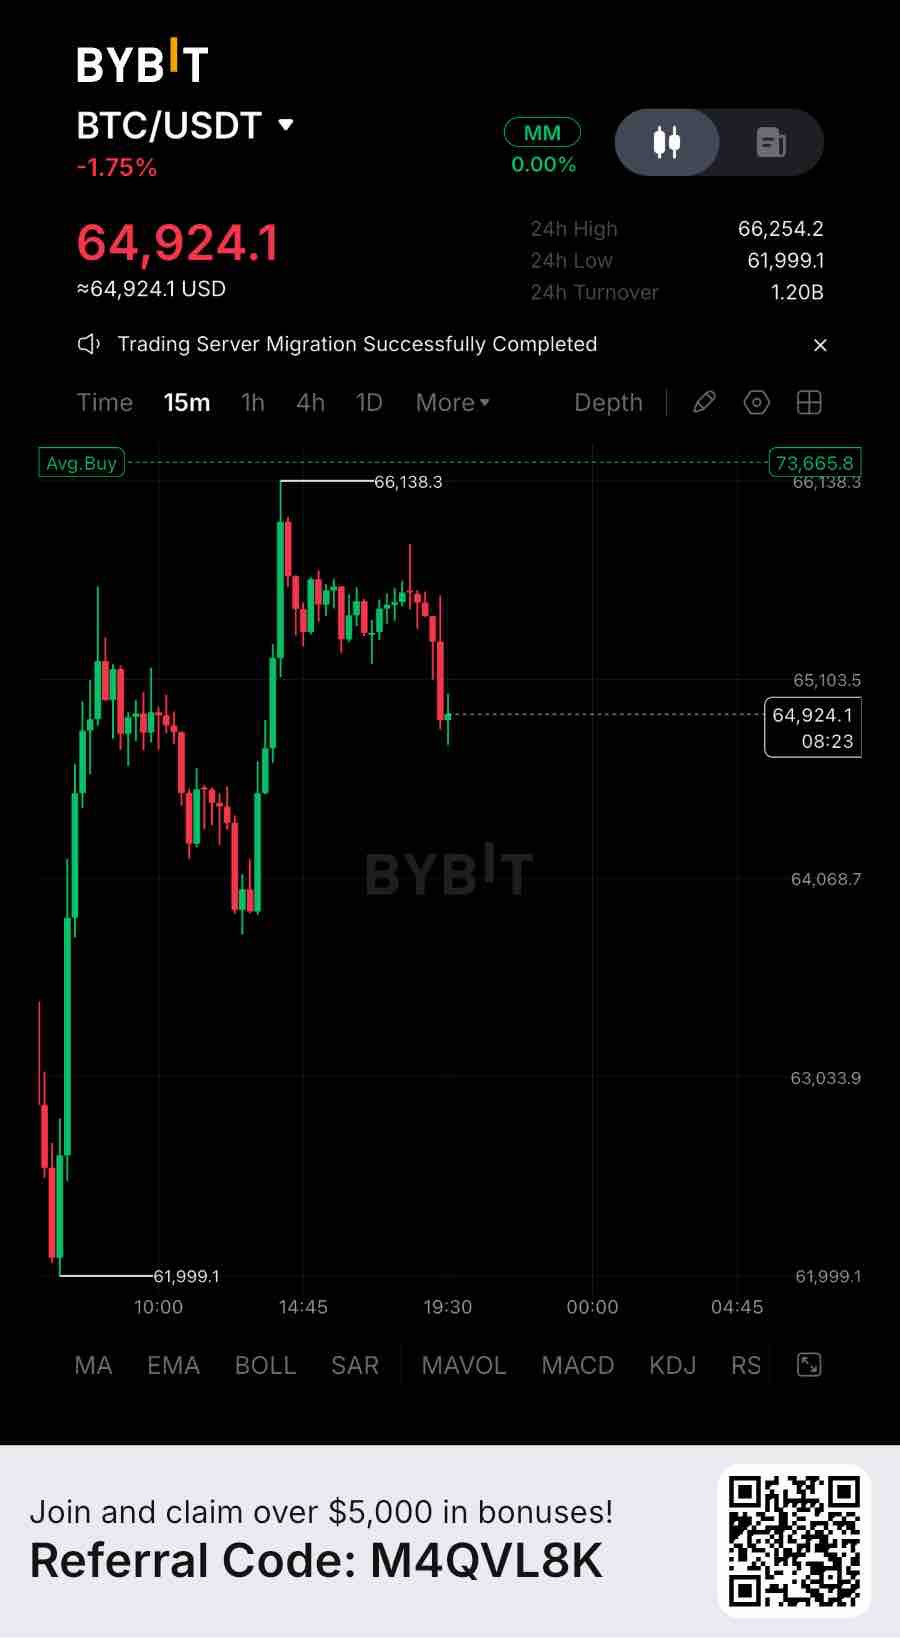
BTC MARKET ANALYSIS 15M TIMEFRAME Bitcoin is trading around $64,924 after recovering from the recent low of $61,999 and pushing toward $66,138 before facing another rejection. I am not treating the current stabilization as a recovery yet. The bigger concern remains institutional selling pressure, inconsistent spot demand and elevated long-side exposure in derivatives. The key question is whether genuine spot demand can absorb selling pressure or whether another downside liquidity sweep is still ahead. Price Action & Market Structure BTC is down approximately 1.75% over 24 hours. The move from $61,999 to $66,138 produced a meaningful rebound, but sellers appeared near $66,000 and pushed price back below $65,103. Immediate resistance sits around $65,100–$65,500, followed by stronger supply near $65,800–$66,138. On the downside, $64,068 is the first important support visible on the chart. Reclaiming $65,100 would improve the short-term structure, but the broader recovery would still require stronger confirmation. Institutional & Large Capital Picture Spot ETF flows remain an important factor in Bitcoin’s demand structure. Recent negative flows indicate that institutional spot demand has not provided consistent support for the recovery attempt. This does not mean every large investor is selling, but it does highlight the lack of confirmation from an important source of capital. Until spot demand improves, a derivatives-driven bounce carries limited conviction. Liquidity & Range Conditions The chart shows a sharp rebound from $62,000, followed by consolidation below $66,000 and another rejection toward $64,900. A narrow range after a substantial decline is not automatically accumulation. Buyers need to demonstrate stronger participation and absorb available selling liquidity before this structure can be considered constructive. Derivatives Positioning Bitcoin futures open interest is approximately $42.2B, with a reported 24H decline of around 7.9%. This suggests meaningful position unwinding. Weighted funding is approximately +0.0012%, indicating a slight long-side premium. Long positioning remains a potential vulnerability, particularly if price loses its immediate support. Approximately $781M in BTC positions were liquidated over 24 hours, with roughly 74% attributed to longs. This shows that leveraged buyers have already experienced considerable pressure. Key Figures Current Price: $64,924 24H Change: -1.75% 24H High: $66,254 24H Low: $61,999 Immediate Resistance: $65,100–$65,500 Major Resistance: $65,800–$66,138 First Support: $64,068–$64,000 Major Support: $61,999 Futures Open Interest: ~$42.2B 24H OI Change: -7.9% Weighted Funding: +0.0012% 24H Liquidations: ~$781M Trading Plan & Confirmation Levels For the trade, BTC is hovering around $64,924, with immediate support around $64,000–$64,070 and recovery resistance near $65,100. I’m watching this zone closely and would not chase a bounce without confirmation. The bullish setup becomes more interesting after a confirmed 15M close above $65,100 and a successful retest, potentially opening the way toward $65,500, $65,850 and $66,138. A sustained breakout above $66,138 would further strengthen the short-term structure. On the downside, a confirmed 15M breakdown below $64,000 would weaken the current stabilization, exposing $63,030 as the next reference zone, followed by the broader $62,000 support area. Bullish Confirmation: Reclaim $65,100 → $65,500 → $65,850 → $66,138. Bearish Confirmation: Breakdown below $64,000 → $63,030 → $62,000. Closing Perspective Bitcoin is showing temporary stability after a substantial downside move, but stability alone is not evidence of recovery. Institutional demand, derivatives positioning and liquidity conditions remain important obstacles. The decisive signal is whether spot buyers return while leverage remains controlled, or whether another support breakdown triggers fresh long liquidations. Until that confirmation arrives, preserving capital matters more than chasing short-term momentum. #ByXIMPACT $BTCUSDT
World Liberty Financial has made meaningful progress in building an ecosystem around USD1, its dollar-backed stablecoin. The project is no longer dependent solely on governance-token speculation; it has an economic activity layer connected to stablecoin reserves, partnerships and DeFi infrastructure. Yet one number deserves more attention: how much of this economic activity actually translates into recurring value for $WLFI holders? The distinction between revenue generation and token-holder value capture is particularly important here. DeFiLlama’s financial data records approximately $34.24 million in gross protocol revenue for Q3 2026, classified as asset yields. However, its reported token-holder net income remains at $0. This highlights a fundamental difference: generating income through the ecosystem does not automatically establish an economic entitlement for people holding its governance token. There has been an important development on this front. On November 6, WLFI announced a new token buyback programme that could use income generated from USD1 reserves and other sources. More importantly, on November 12, the team reported completing its first $1 million in buybacks within 72 hours, with transactions intended to be independently traceable on-chain. This is tangible progress beyond simply announcing a future mechanism. However, the team has also clarified that a substantial portion of USD1 gross revenue goes to partners and service providers. Consequently, the resources available for buybacks depend on what remains after distributions, direct costs and other obligations. Tokenomics have also undergone a structural change. The insider vesting proposal introduced a permanent 10% burn for participating founder, team, advisor and partner allocations, with the remaining tokens subject to a two-year cliff followed by three years of linear vesting. This improves long-term supply discipline, although reducing supply does not independently create sustainable buying demand. Future unlocks remain an important consideration. The token’s utility is expanding through governance and staking. Holders can stake unlocked WLFI for 180 days and potentially receive variable USD1 rewards, subject to participation requirements. This creates an additional incentive to hold and participate, but promotional staking rewards are not equivalent to permanent rights over protocol profits. The strongest long-term argument for WLFI is its connection to USD1. If stablecoin adoption expands, reserve-related earnings could create a larger financial base for recurring token purchases. That would establish a stronger relationship between ecosystem growth and WLFI demand. Nevertheless, one $1 million execution does not yet establish a sustainable revenue-distribution model, particularly when buybacks can be adjusted or discontinued. Going forward, the most important metrics are recurring buyback volume, actual revenue retained after partner distributions, transparency around purchased tokens, and whether those tokens are permanently burned or retained in treasury. WLFI has started building a connection between ecosystem economics and token demand. The next challenge is proving that this connection can operate consistently rather than depending on occasional treasury decisions. #IMPACTbyTrade $WLFIUSDT


GRAM’s strongest advantage is its distribution. As the native asset of The Open Network, it benefits from Telegram’s ecosystem, with TON recording approximately 4.24 million transactions and 215,311 active addresses in 24 hours. Stablecoin market capitalization also stands near $578.6 million. Yet one number deserves considerably more attention: actual network revenue. According to DefiLlama, TON generated approximately $2,112 in chain fees and $1,056 in chain revenue over 24 hours. In other words, only 50% of transaction fees are retained at the network level, with the remainder accounted for through the burn mechanism. The distinction becomes more interesting at the application layer. TON applications generated around $1.23 million in daily fees and $266,511 in application revenue. Fragment alone contributed approximately $1.21 million in fees and $259,128 in revenue. That demonstrates real commercial activity, but application revenue is not automatically GRAM token revenue. Payments generated by applications primarily belong to those businesses. The blockchain capturing economic value from their activity is a separate question. The token value-accrual mechanism GRAM does have an identifiable economic mechanism. DefiLlama attributes 50% of TON transaction fees to token burning. This creates recurring supply reduction rather than direct cash distributions to holders. However, burning tokens and generating sustainable demand are two different things. Validators also receive staking rewards and transaction fees for securing the network. Staking therefore provides another utility for GRAM, although its long-term economic benefit needs to be evaluated against token issuance and dilution. One additional consideration is supply. Current reported figures show approximately 2.857 billion GRAM circulating against 5.284 billion total supply. That means roughly 54% of the reported supply is circulating, making future supply expansion an important variable. The bullish argument The strongest argument for GRAM is distribution. Telegram provides a substantial user-acquisition advantage, while the existing application ecosystem demonstrates that commercial activity is already happening. If this activity increasingly translates into on-chain transactions, higher network fees, staking demand and sustained token burns, the economic relationship between ecosystem growth and GRAM could improve considerably. But there is an important distinction: the June 2026 transition from TON to GRAM was a rebranding, not a fundamental change in token economics. The underlying blockchain and token balances remained unchanged. What matters next I would focus on three metrics: Growth in actual network fees and retained revenue. GRAM burned relative to new token issuance. Whether Telegram’s application growth translates into recurring demand for the native asset. GRAM has considerable distribution and application-level monetization. The unanswered question is whether that economic activity can translate into meaningful, sustainable value accrual for the token itself. That is the metric worth watching, not transaction counts alone. #IMPACTbyTrade $GRAMUSDT

Solstice has established meaningful scale, with approximately $201M in TVL across its Solana-based yield ecosystem. Its institutional-style yield strategies and expanding product stack are genuine strengths. Yet one number deserves more attention: protocol revenue. DeFiLlama currently reports approximately $14,265 in 30-day fees, but $0 in protocol revenue and $0 in earnings. The distinction matters: its methodology classifies these fees as USX distributed into the eUSX backing account for yield holders. In other words, this is yield being passed to users, not revenue retained by the protocol. Strong capital deployment does not automatically translate into a profitable business model. There is also a change in the growth picture. Solstice’s TVL reached approximately $523M in July 2026, but now stands near $201M — a decline of roughly 62% from its peak. The remaining capital is substantial, but sustained deposits and recurring yield demand matter more than historical TVL highs. The broader business model does offer potential. Solstice identifies YieldVault performance fees, Instant Unlock fees, credit-market spreads and OTC execution fees as possible revenue streams. These could create a stronger economic foundation as the ecosystem expands. However, the important question is whether these activities eventually translate into measurable, recurring revenue rather than simply generating more user yield. SLX introduces another important distinction. Staking into stSLX provides ecosystem access, governance weight, credit-market eligibility and other privileges. These mechanisms can create genuine utility-driven demand and remove tokens from circulation. But Solstice explicitly states that SLX does not represent ownership and gives holders no direct entitlement to protocol fees, profits, dividends or guaranteed financial returns. Therefore, even if protocol revenue increases, that value is not automatically distributed to SLX holders. The token’s long-term thesis depends primarily on growing utility, staking demand and ecosystem participation. Supply dynamics deserve attention as well. SLX has a fixed maximum supply of 1 billion tokens. However, only around 243 million are currently circulating. Solstice also brought forward 75 million tokens into its September 2026 release to support liquidity and ecosystem incentives, while keeping the final allocation and May 2029 completion date unchanged. A tokenomics tracker lists another approximately 17.3 million SLX scheduled for November 25. This represents potential additional supply, although an unlock does not automatically mean immediate selling pressure. The strongest bull argument is that Solstice is building infrastructure around institutional yield rather than relying exclusively on speculative DeFi activity. Its existing capital base, expanding strategies and utility-based staking model provide a credible foundation. Fixed supply and the absence of perpetual emissions are also positive structural features. My conclusion: Solstice has demonstrated that it can attract meaningful capital, but the connection between protocol economics and SLX holder value remains incomplete. I would watch three things next: sustained TVL recovery, measurable revenue retained from the newer fee streams, and evidence that SLX staking creates durable demand capable of absorbing scheduled supply releases. For SLX, the next major milestone is not simply higher TVL. It is proving that ecosystem growth creates recurring economic value that translates into sustainable token demand. #IMPACTbyTrade $SLXUSDT

NAVX Strong Protocol Activity, but Token Value Accrual Remains the Key Question NAVI Protocol has established a meaningful position in the Sui DeFi ecosystem. Its lending markets, liquidity infrastructure and Volo products create genuine utility, with more than $100M in TVL and approximately $57M in active loans. Yet one number deserves more attention: how much of that economic activity actually reaches token holders? According to DeFiLlama, NAVI generated approximately $437,255 in fees over the last 30 days, while reported protocol revenue was around $138,132. That means only about 31.6% of reported fees appeared as protocol revenue. The distinction matters: fees represent the economic activity generated by the platform, while protocol revenue reflects the portion captured by the protocol. The bigger question is what happens to that captured revenue. NAVI’s tokenomics documentation describes revenue sharing for users who lock dynamic liquidity (dLP). However, DeFiLlama currently reports $0 in tracked holders’ revenue, including over the last 30 days. This creates a meaningful gap between the revenue-sharing mechanism described in the documentation and measurable distributions to token holders. Supply dynamics also deserve attention. NAVX has a maximum supply of 1 billion tokens, with 45.8% allocated to ecosystem incentives and airdrops, 20% to the team and 16% to investors and advisors. Tokenomist lists another ecosystem and airdrop unlock for November 18, 2026. Incentive-driven growth can attract liquidity, but it does not automatically create sustainable demand for the token. The bull case is still credible: NAVI has real lending demand, an established Sui presence and multiple products that could expand its revenue base. If protocol activity stabilizes and revenue sharing becomes transparent, NAVX could develop a stronger economic connection to the business it represents. But TVL alone is not enough. DeFiLlama also reports that NAVI’s TVL declined approximately 39.5% over the past 30 days, making sustained capital retention another important test. My focus going forward: whether NAVI can stabilize TVL, grow recurring protocol revenue and demonstrate verifiable distributions to dLP participants. Until those connections become clearer, NAVI’s protocol activity looks more established than NAVX’s direct value-accrual model. #IMPACTbyTrade $NAVXUSDT

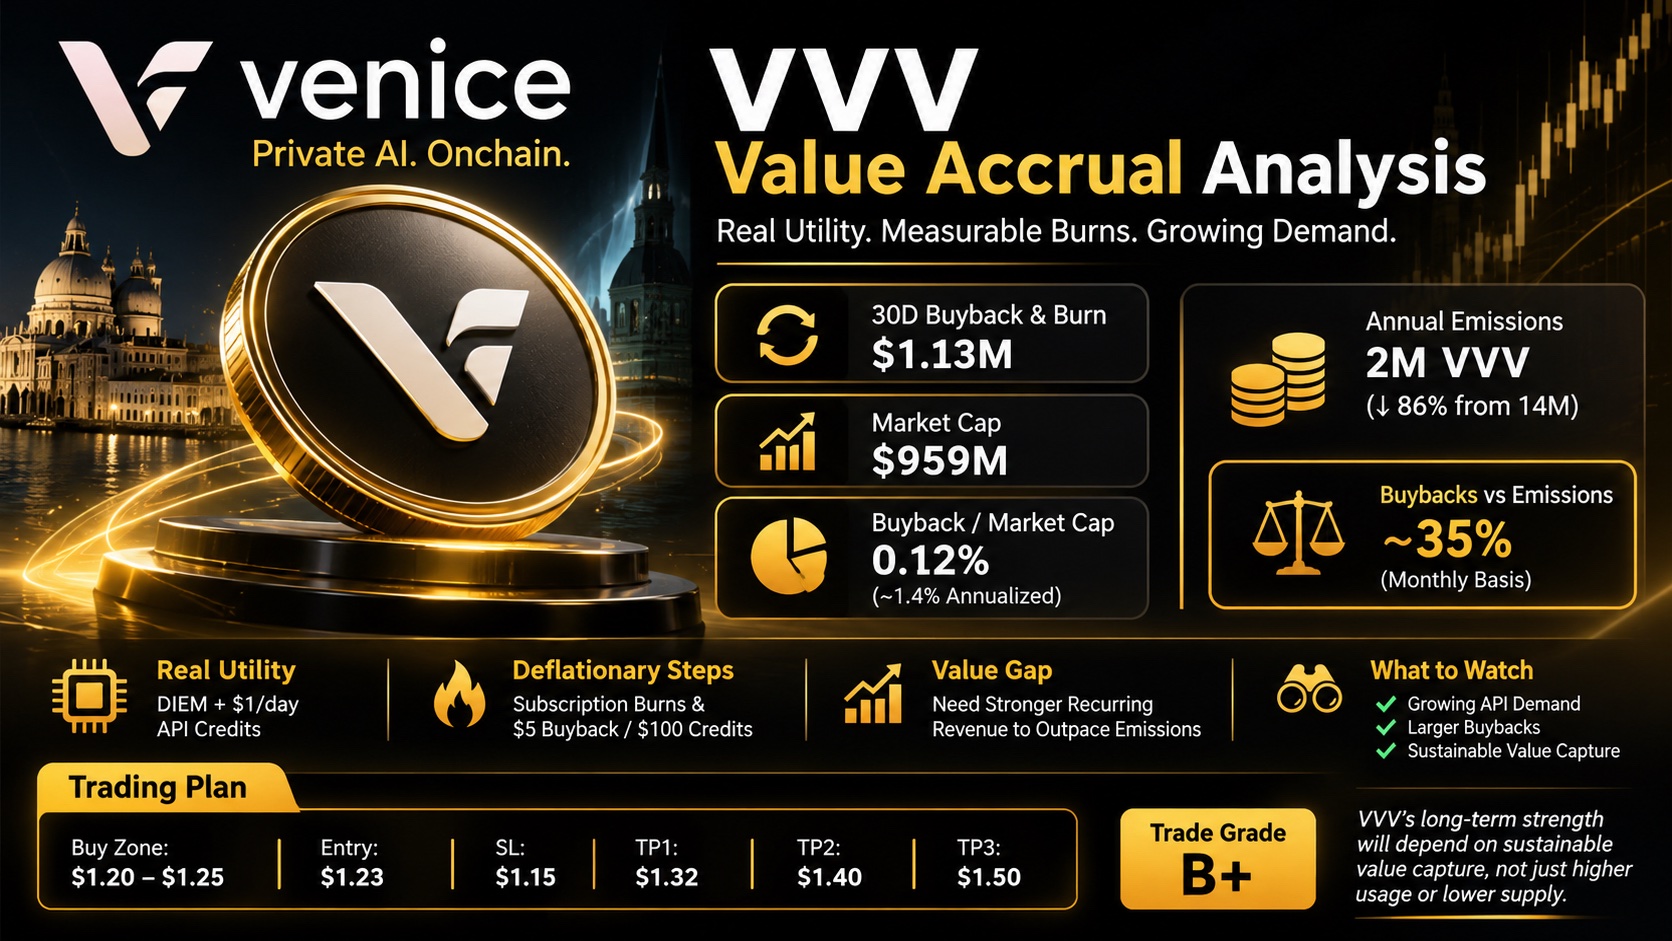
Venice has built something more substantial than a typical AI token narrative. VVV connects staking with actual platform utility through DIEM, a transferable compute asset that provides $1 per day in Venice API credits when staked. Yet one number deserves more attention: how much of Venice’s business activity is actually translating into sustainable value for VVV holders? The distinction is between revenue generated by users and value retained for token holders. Venice earns from subscriptions, API usage and credit purchases. A portion of that activity is converted into VVV buybacks and permanent burns. However, the full subscription and API revenue settles off-chain, meaning publicly tracked on-chain figures do not represent the platform’s complete revenue or operating profit. The available numbers are encouraging, but require context. 30-day VVV buyback and burn value: approximately $1.13M Market capitalization: approximately $959M Monthly buyback value relative to market cap: approximately 0.12%. If that pace continues, it represents roughly 1.4% of market capitalization annually, before accounting for new token emissions. This is measurable value flowing toward supply reduction, but it is not equivalent to cash distributions received by holders. The tokenomics have also improved considerably. Annual VVV emissions have fallen from 14M to 2M tokens, an approximately 86% reduction. Venice has introduced subscription-based burns of $2, $5 and $10, depending on the subscription tier, alongside a $5 buyback for every $100 of API credits purchased. However, 2M annual emissions still represent approximately 166,700 new VVV every month. At the current price snapshot, the latest $1.13M in monthly buybacks would represent roughly 58,000 VVV if purchased at that price. That is approximately 35% of monthly emissions. This comparison is illustrative, since actual burn quantities depend on execution prices. Nevertheless, it highlights an important point: reducing inflation is positive, but the real test is whether recurring burns can consistently exceed new issuance. There is another distinction worth watching. VVV staking rewards are paid in VVV emissions, not directly from platform profits. Locking staked VVV to mint DIEM provides an additional utility pathway, but locked positions receive 80% of the standard staking yield. This creates demand for locking, although staking yield alone should not be mistaken for organic revenue generation. The strongest bull case is that Venice can turn growing demand for private AI inference into recurring API credit purchases, stronger DIEM demand and increasingly large market buybacks. If that activity grows faster than emissions, VVV’s supply economics could become substantially stronger. What matters next: not simply how many tokens are staked or burned, but whether paid API usage, recurring buybacks and DIEM demand grow consistently enough to create sustainable value beyond staking incentives. VVV has established a credible connection between platform usage and token supply reduction. The next challenge is proving that this connection can generate lasting economic value at its current valuation. #IMPACTbyTrade $VVVUSDT
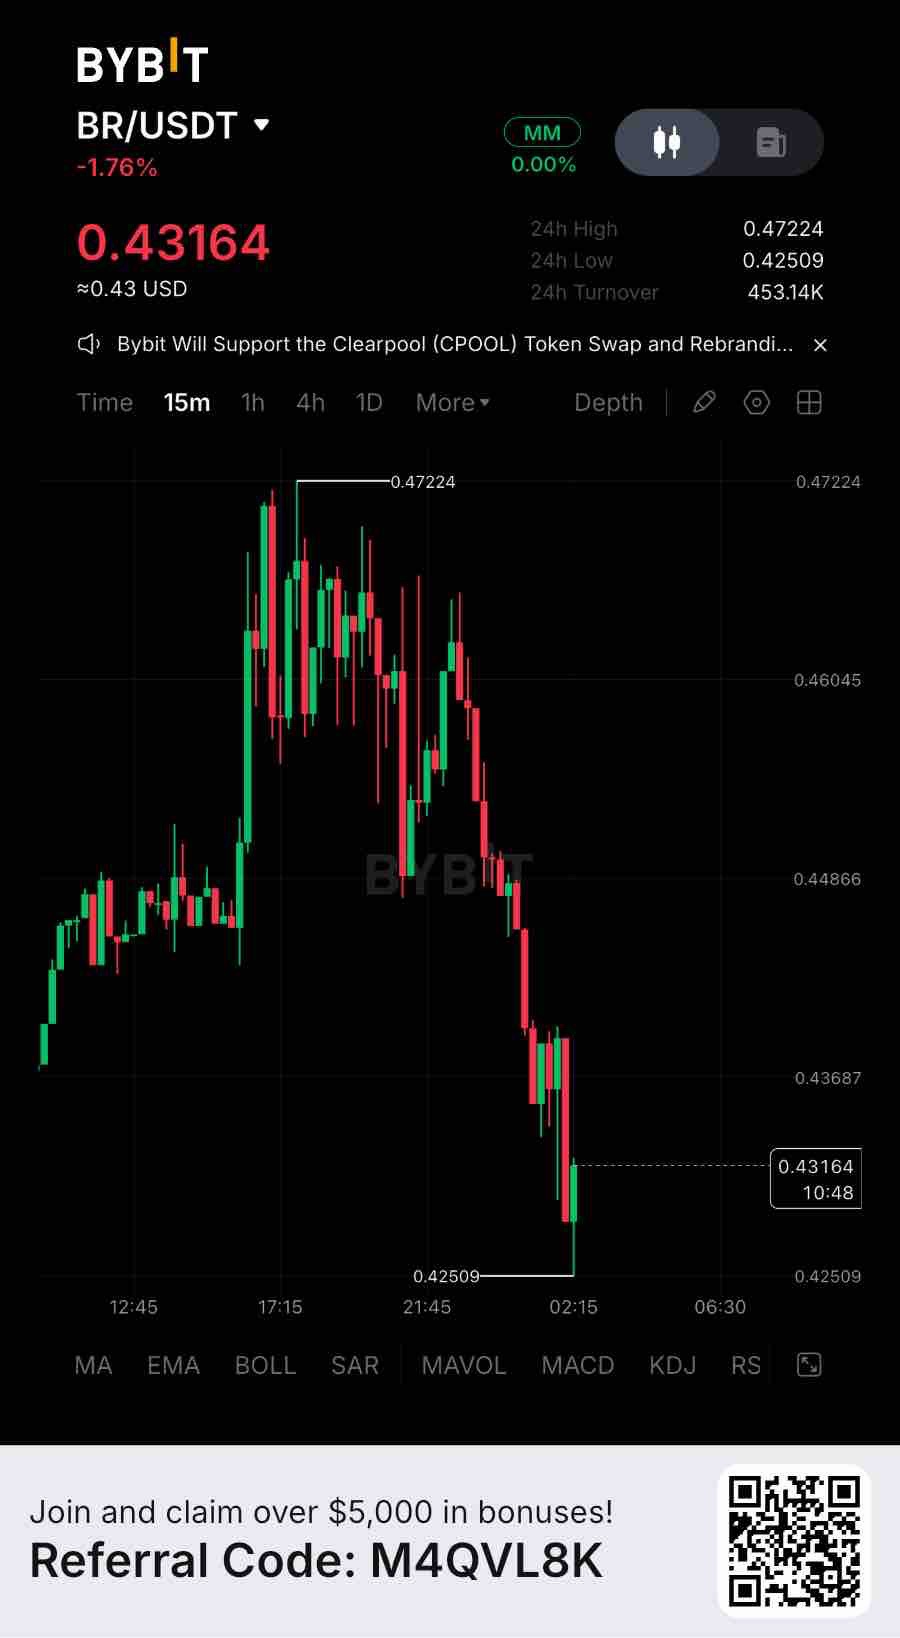
Bedrock currently holds approximately $272M in TVL, although that figure has contracted roughly 28% over the past 30 days. That’s real usage, not narrative — but the latest direction is contraction rather than expansion. At roughly $137M in circulating market cap, BR trades around 0.50x TVL. On the same valuation basis, that is approximately 3.6x richer than Ether.fi at 0.14x and 1.5x richer than Renzo at 0.34x. These are market-cap-to-TVL comparisons, not direct earnings multiples. Bedrock’s footprint extends across 19 chains, with approximately $134M on Ethereum and $116M on Bitcoin. However, roughly $71K in fees over 30 days translated into only $7.7K in protocol revenue. That distinction matters. Growing deposits do not automatically translate into stronger token value capture. There is also a supply consideration. Only around 30% of the maximum 1B BR supply is circulating, putting FDV near $456M. More protocol activity will need to translate into stronger retained revenue and clearer token value capture to justify the valuation. For the trade, BR is hovering around $0.456, with the preferred accumulation zone around $0.432–$0.442 and immediate recovery resistance near $0.461. I’m watching this area closely and would not chase a bounce without confirmation. The bullish setup becomes more interesting after a confirmed 4H close above $0.461 and a successful retest, potentially opening the way toward $0.469 and $0.476. A 4H breakdown below $0.432 would weaken the recovery structure, while $0.423 remains the key invalidation level. None of this says the token is wrong. It says the on-chain growth story and the price story are running on separate clocks right now. Worth asking which one catches up to the other first — and whether more chains, AUM or products alone are enough to close a valuation gap that size. #ByXIMPACT $BRUSDT

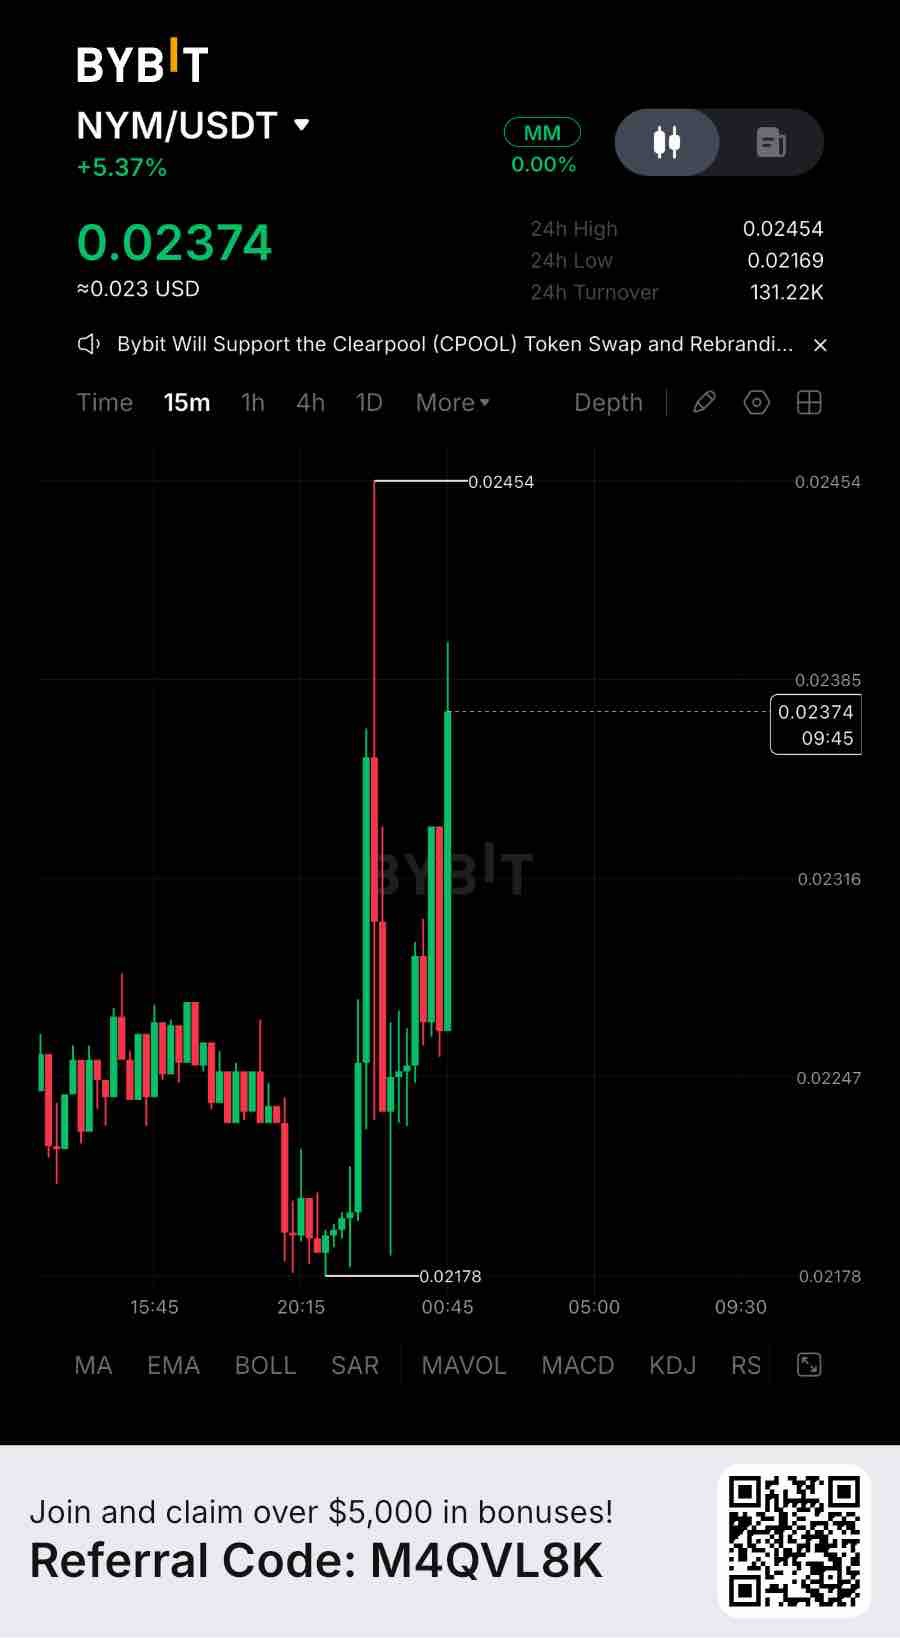
Nym’s production mixnet recorded 10.31B packets received and 13.76B sent in the 24-hour sample ending November 13. Bonded nodes also increased from 1,127 to 1,162 between November 1 and November 13. That’s real network use, not narrative. But valuation tells a different story. At approximately $0.02234, NYM carries an $18.87M circulating market cap against a $22.34M FDV, with 844.75M tokens in circulation. Nym is privacy infrastructure, not an AUM-based yield issuer, so a conventional Mcap/AUM comparison with RWA platforms would be misleading. Its documented staking target is 62.03M NYM, worth approximately $1.39M at current prices. That puts market cap at roughly 13.6x the target’s dollar value, although this is a staking-security ratio, not a genuine AUM valuation multiple. The underlying product footprint is expanding. Nym has brought mixnet privacy into Zcash wallets, continued developing its SDK integrations, and released NymVPN v2026.15 with adaptive anti-censorship bridges on November 9. The network also maintains a 240-node rewarded active set. These are meaningful infrastructure milestones, but they do not automatically translate into proportional token demand. The important variable is monetization. Nym’s own roadmap acknowledges that more paying NymVPN subscribers are necessary to make its perpetual NYM buyback mechanism materially effective. Meanwhile, 155.25M NYM remain allocated to the mixmining reserve for operator rewards. Network activity, subscription revenue and actual token buybacks are three different measurements. For the trade, NYM is hovering around $0.0223, with immediate support around $0.0218–$0.0222 and recovery resistance near $0.0227. I’m watching this zone closely and would not chase a bounce without confirmation. The bullish setup becomes more interesting after a confirmed 4H close above $0.0227 and a successful retest, potentially opening the way toward $0.0238, $0.0242 and $0.0254. A 4H breakdown below $0.0215 would weaken the recovery structure, with $0.0209 and $0.0195 becoming the next downside reference levels. None of this says the token is wrong. It says the network-growth story and the price story are running on separate clocks right now. Worth asking which one catches up first — and whether more integrations, network traffic and paying subscribers will be enough to close the gap between real usage and token value. #ByXIMPACT $NYMUSDT

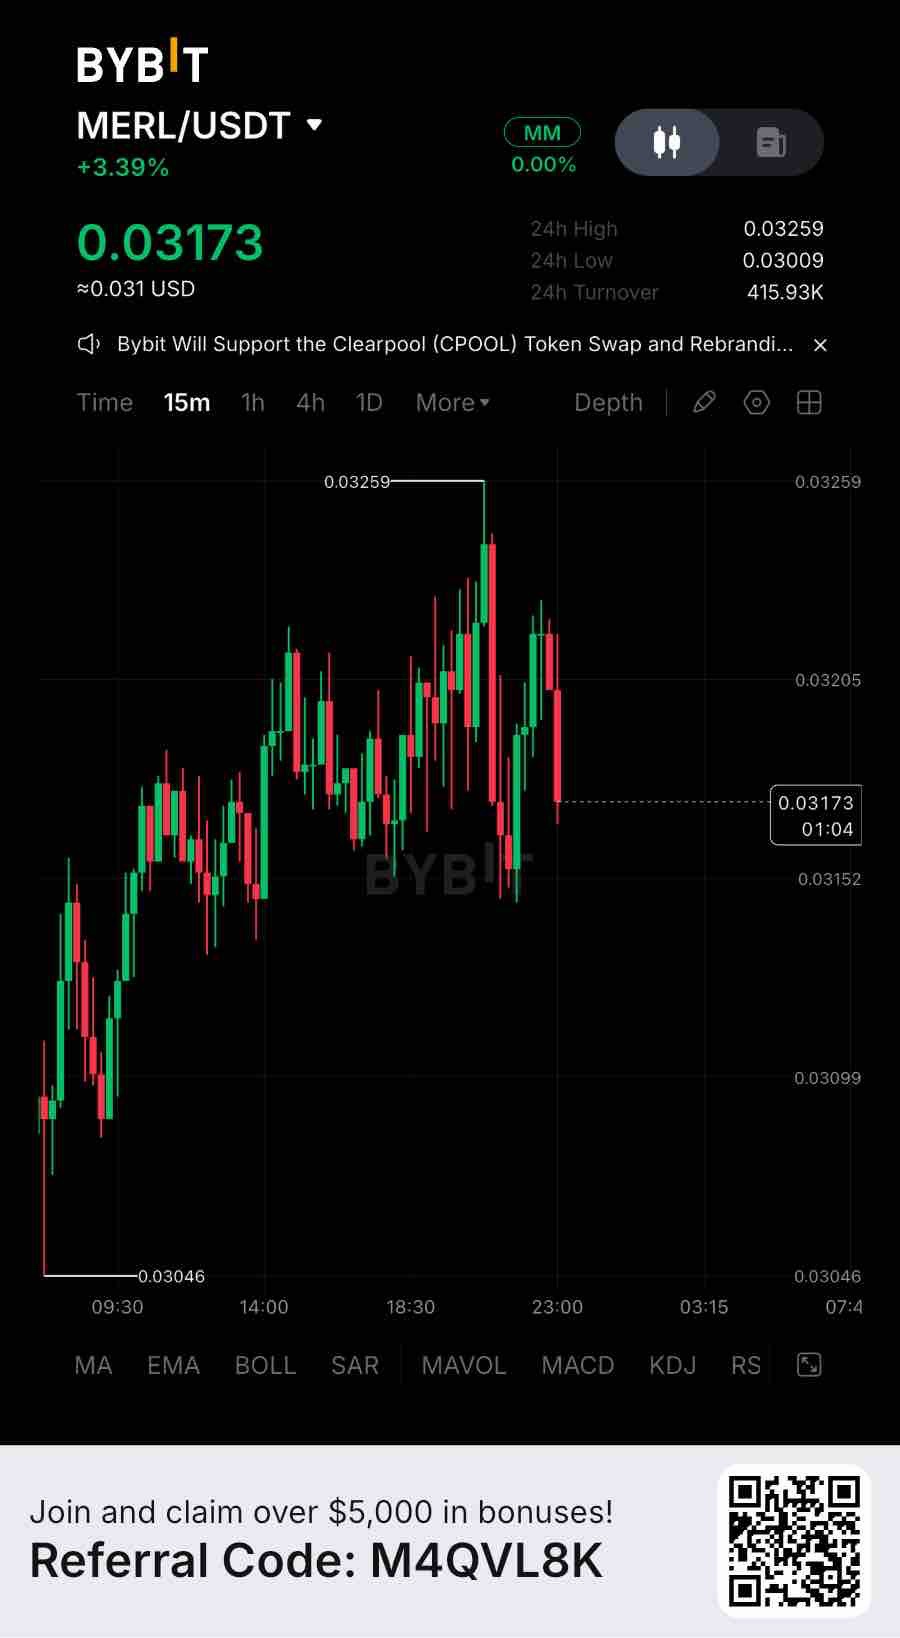
Merlin Chain currently has approximately $7.88M in active DeFi TVL and a $688M bridged-asset footprint, but recorded $0 in net inflows over the past 24 hours. That’s a real on-chain footprint, not narrative. At a circulating market cap of roughly $45.6M, MERL trades at approximately 5.8x active DeFi TVL. No verified Allium-specific valuation multiple is available. Using Bitcoin sidechains as the closest comparable group, Merlin trades at around 6.3x Rootstock’s 0.93x multiple, but approximately 41% below Stacks’ 9.8x. These are infrastructure comparisons, not direct yield-platform peers. The asset footprint is substantial but concentrated. BTC represents roughly $352M and M-BTC another $333M of bridged assets. Yet only $7.88M is reflected in active DeFi TVL, with 24-hour DEX volume around $138K. Bridged capital and productive DeFi liquidity are two very different things. The quieter concern is value capture. Merlin generated just $37 in chain fees and revenue over 24 hours, against approximately $1,502 in application fees. MERL has governance and staking utility, while Layer3 transaction-fee utility remains a prospective use case. More ecosystem activity does not automatically translate into token-holder revenue. For the trade, MERL is hovering around $0.0318, with immediate support around $0.0296–$0.0306 and recovery resistance near $0.0326. I’m watching this zone closely and would not chase a bounce without confirmation. The bullish setup becomes more interesting after a confirmed 4H close above $0.0326 and a successful retest, potentially opening the way toward $0.0345 and $0.0394. A 4H breakdown below $0.0296 would weaken the recovery structure, with $0.0275 becoming the next reference zone. None of this says the token is wrong. It says the on-chain growth story and the price story are running on separate clocks right now. Worth asking which one catches up to the other first — and whether more BTC liquidity, productive TVL, and ecosystem expansion alone are enough to justify the current valuation multiple. #ByXIMPACT $MERLUSDT
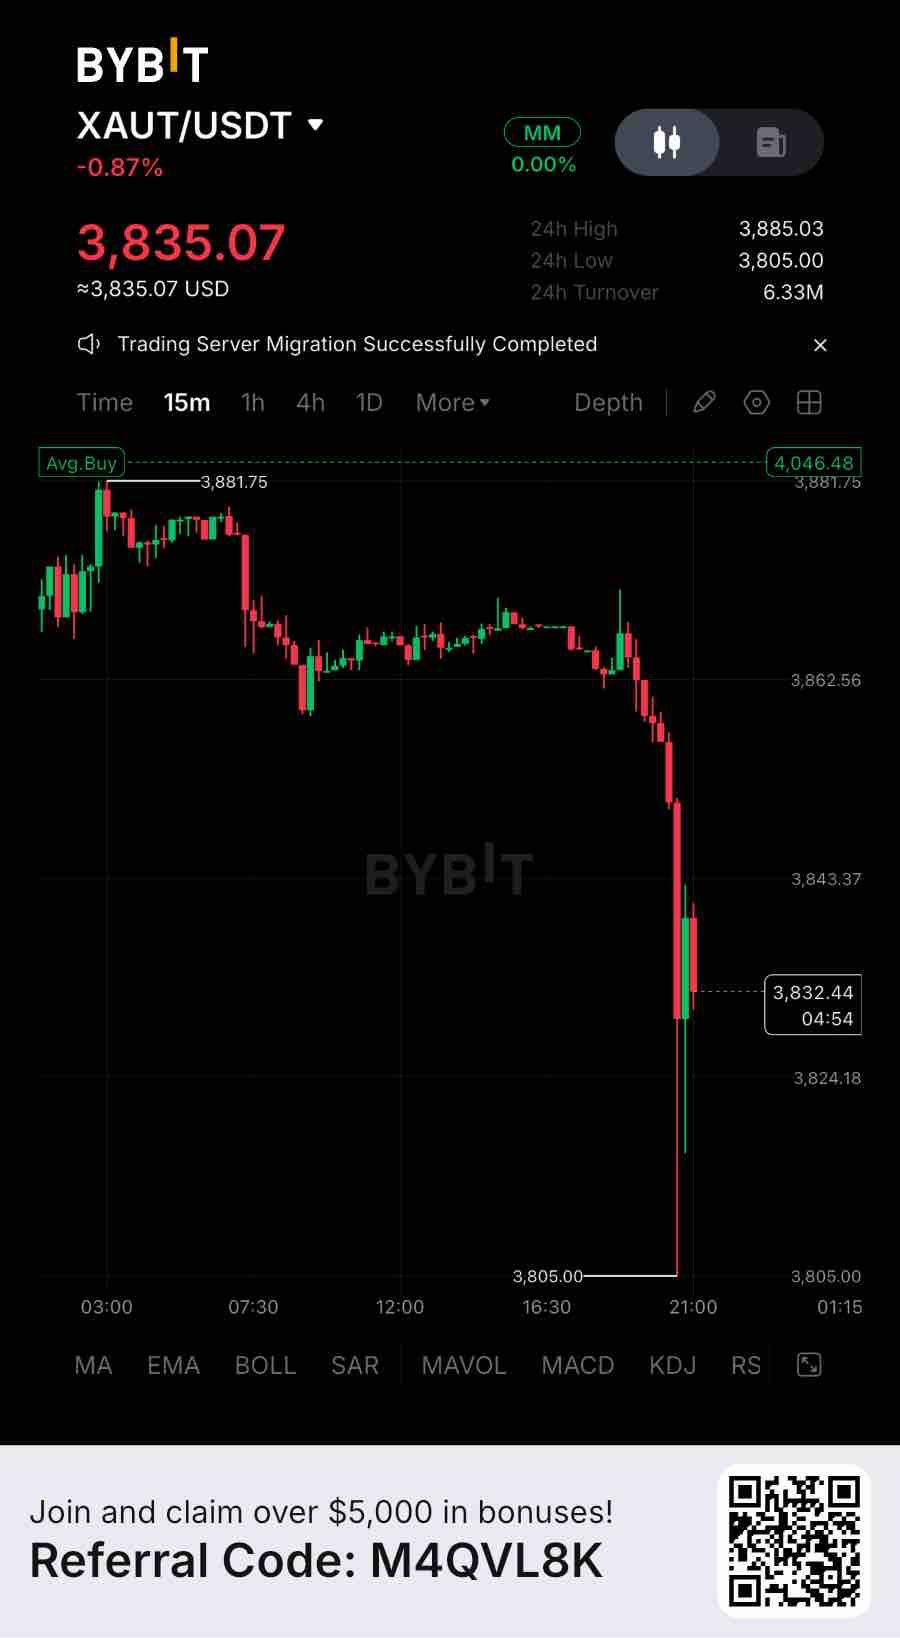
Tether Gold’s latest reserve attestation shows $3.44B in physical gold backing 827,418 fine troy ounces, with customer holdings increasing 73% since the beginning of 2026. That’s real usage, not narrative. But the valuation is already close to the value of the underlying assets. CoinGecko puts XAUT’s circulating market cap at approximately $3.11B against $3.04B in TVL, or roughly 1.02x Market Cap/TVL. PAX Gold trades around 0.93x on the same metric, making XAUT approximately 1.1x richer. This is an asset-backed valuation comparison, not a cash-flow multiple. Allium’s cross-chain RWA research placed the entire tokenized commodities category at $4.3B in August 2026; it does not provide a standalone XAUT valuation multiple in that report. The expansion is measurable. XAUT-backed reserves increased 59% from year-end 2025 to September 2026, reaching approximately 25.7 tonnes of gold. Distribution extends across Ethereum, TON and BNB Smart Chain, while collateral utility is expanding: the World Gold Council reported that demand to borrow against XAUT repeatedly reached Aave’s supply cap in early 2026. Arch Lending also added XAUT as loan collateral in September. The quieter risk is that XAUT does not generate an inherent staking yield or cash flow. Its value depends primarily on gold prices, custody, redemption access and market liquidity. When interest rates make yield-bearing assets more attractive, holding non-yielding gold carries an opportunity cost. Trading plan: Current technical structure remains bearish, with $3,895 acting as an important reclaim level. Sell zone: $3,860–$3,895 on rejection. Entry: $3,875. Stop-loss: $3,935. TP1: $3,808. TP2: $3,766. TP3: $3,706. A sustained move above $3,895 weakens the short setup; avoid chasing price into support. None of this says the token is wrong. It says the on-chain growth story and the price story are running on separate clocks right now. Worth asking which one catches up to the other first — and whether more distribution, collateral demand and gold-backed AUM alone are enough to justify a premium over comparable products. #ByXIMPACT $XAUTUSDT

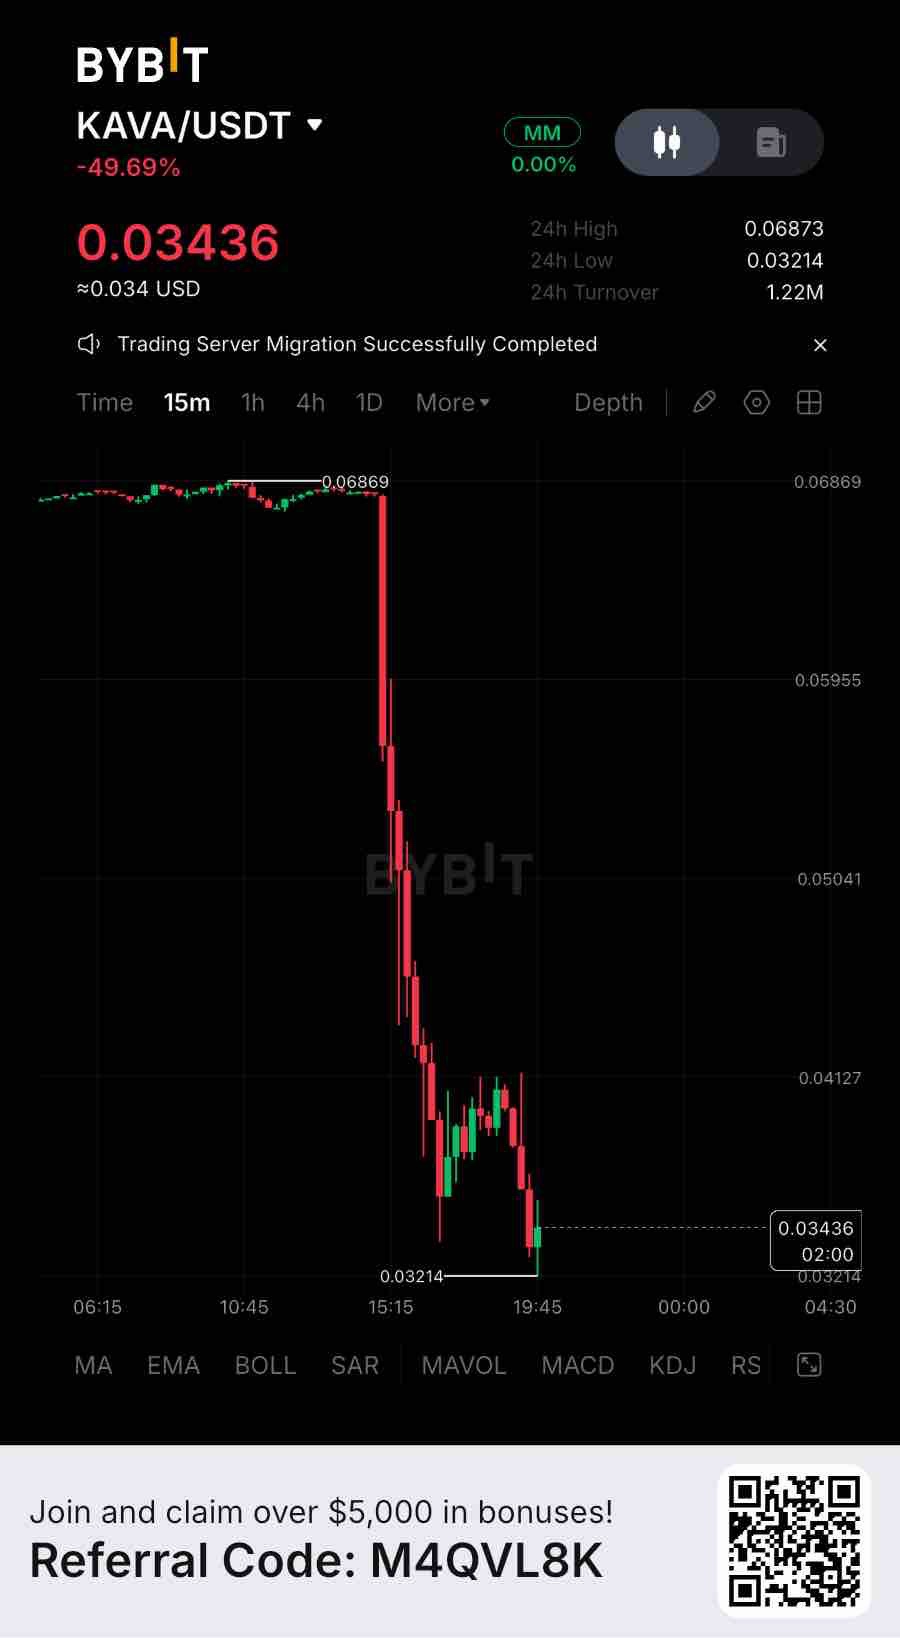
KAVA currently holds approximately $15.18M in DeFi TVL, with $63.9K in reported 24-hour inflows. However, TVL is down 20.09% over the same period. That’s real usage, not narrative. At a circulating market cap of approximately $42.78M, KAVA trades at roughly 2.8x its current DeFi TVL. There is no verified Allium Research peer-valuation multiple for Kava, making direct comparisons with established RWA yield platforms difficult. The underlying footprint remains concentrated. Kava Mint holds approximately $9.22M and Kava Lend $5.89M. Stablecoin supply stands at $36.85M, down 20.87% over seven days and 44.72% over 30 days. The RWA expansion narrative still needs measurable on-chain traction. There is also a trust factor to consider. Recent abnormal cross-chain transfers and selling activity originating within Kava Lend created additional uncertainty around liquidity and ecosystem confidence. For the trade, KAVA is hovering around $0.0537, with immediate support around $0.0505–$0.0510 and recovery resistance near $0.0563. I’m watching this zone closely. I would not chase a bounce without confirmation. The bullish setup becomes more interesting after a confirmed 4H close above $0.0563 and a successful retest, potentially opening the way toward $0.0613 and $0.0664. A 4H breakdown below $0.0505 would weaken the recovery structure, with the broader $0.0491 area becoming the next reference zone. None of this says the token is wrong. It says the on-chain growth story and the price story are running on separate clocks right now. Worth asking which one catches up to the other first — and whether more AUM, products and liquidity are enough to close the valuation gap. #ByXIMPACT $KAVAUSDT
SHIB has evolved beyond its original meme-coin identity, building an ecosystem around Shibarium, ShibaSwap, decentralized governance and a transaction-linked token-burning mechanism. The fixed-supply structure is also a positive, as SHIB has no ongoing minting mechanism. Yet one number deserves considerably more attention: the actual economic activity generated by Shibarium. There is an important distinction between network activity and value captured by SHIB holders. Shibarium transactions pay gas fees in BONE, not SHIB. Under the ecosystem’s tokenomics, 70% of eligible base transaction fees are intended to be converted into SHIB and permanently burned. This creates a potential supply-reduction mechanism, but it does not generate distributable income for SHIB holders. The latest DeFiLlama snapshot presents a particularly weak picture. As of November 14, 2026, Shibarium reports approximately $39,346 in DeFi TVL, just $0.02 in daily chain fees and revenue, and virtually no decentralized exchange activity. Seven-day DEX volume stands at approximately $10.34. These figures suggest that the ecosystem’s economic footprint remains extremely limited relative to the expectations attached to its broader ambitions. Having infrastructure is one achievement; generating consistent economic demand through that infrastructure is another. The burning mechanism also requires closer examination. Approximately 410.85 trillion SHIB has been burned historically, representing around 41.08% of the original supply. However, almost all of that reduction came from Vitalik Buterin’s extraordinary one-time burn in May 2021. More importantly, only approximately 261.8 million SHIB was burned during the 30 days ending November 14, 2026. Against an estimated circulating supply of 589.24 trillion, that represents roughly 0.000044% of circulating supply. At this pace, the deflationary effect is economically insignificant. Reducing supply is directionally positive, but the scale must become substantially larger before it can materially change SHIB’s supply dynamics. There is another structural concern. Shibarium’s burn mechanism has faced operational difficulties following the September 2025 bridge exploit. Recent burn-tracking reports indicate that ShibTorch remains under maintenance and that its SHIB bridge route has not resumed normal operation. This means the intended connection between network usage and SHIB burns cannot simply be assumed to be functioning as designed. The strongest bull argument remains the ecosystem’s ability to convert its established community and brand recognition into sustainable on-chain demand. Shibarium, ShibaSwap, governance infrastructure and the broader product ecosystem provide a foundation that did not exist when SHIB was purely a speculative meme asset. But infrastructure alone does not create token value. SHIB currently offers holders exposure to ecosystem growth and a potential supply sink, not a contractual claim on protocol revenue, dividends or recurring fee distributions. My focus going forward is not simply the number of SHIB burned or the number of transactions announced. I want to see sustained growth in Shibarium TVL, meaningful DEX volume, measurable fee generation, restoration of the burn mechanism and a transparent increase in actual SHIB burns. SHIB has demonstrated remarkable community strength and longevity. The next challenge is proving that this attention can become a functioning economic model. Sustainable demand and measurable value capture will matter considerably more than headline burns or ecosystem announcements. #IMPACTbyTrade $SHIBUSDT

Injective has made meaningful progress in positioning itself as a finance-focused blockchain. Its native EVM, on-chain orderbook, tokenized asset infrastructure and growing institutional integrations are genuine developments. According to Injective’s November 2026 anniversary report, its on-chain orderbook processed approximately $12.86 billion in trading volume over the preceding year, including nearly $1.8 billion in real-world asset perpetuals. Yet one number deserves considerably more attention: how much of this economic activity actually translates into recurring value for INJ holders? Trading volume and protocol revenue are fundamentally different metrics. Traders generate volume and pay transaction fees, but applications, liquidity providers and infrastructure providers may retain portions of those fees. Only the economic value ultimately directed toward the network’s token mechanisms can support a meaningful value-accrual argument. DefiLlama currently reports approximately $14,283 in tracked application fees over 30 days, compared with $5,538 in retained protocol revenue. That represents approximately 38.8% of the reported fees. These figures cover tracked applications rather than necessarily capturing every source of Injective’s native orderbook revenue, but they illustrate why headline trading volume should not be confused with retained economic value. The tokenomics framework is nevertheless one of Injective’s strongest differentiators. Its Community BuyBack replaced the traditional Burn Auction in October 2025. Participants commit INJ and receive a proportional share of an accumulated basket containing ecosystem-generated revenue, including stablecoins and other digital assets. The committed INJ is permanently burned. This creates a direct connection between ecosystem revenue and token supply reduction. However, participation is subject to limited monthly slots, and the mechanism does not automatically distribute revenue to every INJ holder. It is a meaningful value-accrual mechanism, but participation conditions matter. The January 2026 INJ Supply Squeeze, approved through IIP-617, further tightened issuance parameters, with the stated objective of doubling the rate of supply reduction. More than 7.1 million INJ had already been permanently removed through the network’s burn mechanisms by June 2026. However, an important distinction remains. A November 2026 SEC filing reports total INJ supply of approximately 122.9 million as of September 15, 2026, around 22.9% above its original 100 million supply. Approximately 47.2% was staked, while the prevailing annualized issuance rate was at its 4.4% upper bound. In other words, cumulative burns have not yet outweighed cumulative issuance since launch. Calling INJ structurally deflationary does not eliminate the need to measure its actual net supply change. The strongest bull argument is that Injective is building infrastructure for markets that extend beyond conventional crypto trading. Tokenized equities, commodities, institutional asset issuance, native EVM and shared liquidity could create considerably more recurring economic activity. The $12.86 billion annual orderbook volume demonstrates meaningful market usage, although future revenue conversion remains the critical test. My focus going forward would be the relationship between application fees, Community BuyBack revenue, actual INJ burned and newly issued tokens. I would also watch whether tokenized asset markets generate sustained demand rather than temporary trading spikes. Injective has built a credible financial infrastructure narrative. The next challenge is proving that this infrastructure can generate enough recurring economic value to consistently outweigh token issuance. For INJ, sustainable value capture matters more than impressive volume figures. #IMPACTbyTrade $INJUSDT

MegaETH has established a meaningful technical foundation, particularly around transaction throughput and low-latency execution. As of November 14, the network recorded approximately 2.03 million transactions in 24 hours, supported by $22.91 million in stablecoin liquidity and around $8.8 million in DeFi TVL. These figures demonstrate that the infrastructure is attracting real economic activity. Yet one number deserves considerably more attention: the network generated only $1,620 in chain revenue over the same 24-hour period. The distinction between activity and monetization is important here. Users paid approximately $1,634 in chain fees, meaning roughly 99% of those fees were retained as chain revenue. However, the absolute amount remains relatively small. More than two million transactions produced less than $1,700 in daily revenue. That translates to roughly $0.0008 in revenue per transaction. Low fees are an important competitive advantage, but high throughput does not automatically create a strong economic business model. There is another detail worth examining. MegaETH recorded approximately 1,667 active addresses alongside those 2.03 million transactions. That represents more than 1,200 transactions per active address on average. This does not establish how much activity is automated, but it does show why transaction counts should not be treated as equivalent to independent users or sustainable demand. Meanwhile, approximately $446,934 in daily DEX volume provides evidence of an emerging application economy, although trading volume alone does not establish recurring token-holder revenue. The more interesting development is MegaETH’s USDm-based buyback mechanism. The Foundation has committed to using rewards generated through USDm to purchase and accumulate MEGA. Its first buyback was announced on May 7, 2026, using accumulated net rewards from the USDm issuer. However, the amount purchased was not disclosed publicly in that announcement. This mechanism creates a potential connection between stablecoin adoption and token demand, but accumulated treasury holdings are not the same as direct revenue distributions to token holders. The token’s regulatory whitepaper explicitly states that MEGA holders have no contractual revenue-distribution or redemption rights. Supply dynamics also deserve attention. MEGA has a fixed total supply of 10 billion tokens, with approximately 53.3% allocated to KPI-based rewards. Linking these distributions to measurable network milestones is structurally better aligned with performance than relying entirely on calendar-based emissions. Nevertheless, only around 11.3% of the total supply had been released by November 14. The difference between its approximately $50.9 million market capitalization and $450.75 million fully diluted valuation highlights the potential dilution ahead. Furthermore, fee burning remains a potential future mechanism, not an established supply-reduction policy. The strongest bullish argument is that MegaETH could develop into a specialized execution layer for applications that genuinely require real-time performance. Its native stablecoin, future proximity markets, and planned sequencer rotation could create additional reasons to use and lock MEGA. These developments could strengthen token utility beyond speculation. However, the next phase needs to demonstrate measurable economic results. I would focus on recurring USDm-funded buybacks, stablecoin supply growth, sustainable application revenue, genuine user expansion, and the relationship between KPI-based emissions and economic demand. MegaETH has demonstrated technical activity. The more important question is whether that activity can become recurring economic value that meaningfully benefits MEGA. Sustainable value capture, rather than transaction-count records, will ultimately determine the strength of its token economics. #IMPACTbyTrade $MEGAUSDT
Midnight is showing meaningful progress beyond its original development narrative. Permissionless smart contract deployment went live on September 28, 2026, and the network crossed one million mainnet transactions in October. A more recent Subscan snapshot reports approximately 1.81 million transactions and 1,510 deployed contracts. This points to growing network activity. Yet one number deserves more attention: how much of that activity actually translates into recurring economic value for NIGHT holders? The critical distinction is between network usage and token value capture. Midnight uses a dual-component economic model. NIGHT is the transferable capital and governance token, while DUST is the resource consumed to execute transactions. Holding one NIGHT can generate up to five DUST over seven days. DUST is non-transferable and consumed when used, but NIGHT itself is never spent on transaction fees. This architecture has a genuine advantage: it separates operational costs from NIGHT’s market price, making transaction costs more predictable for developers and businesses. However, it also creates an important economic limitation. A transaction does not automatically create a NIGHT payment, NIGHT burn, or direct fee distribution to token holders. Users consume DUST, not the underlying asset. Therefore, increasing transaction volume does not necessarily translate into proportional demand for NIGHT. The growth figures deserve context. Daily transactions reportedly increased from 128 on September 27 to 47,714 on October 26, approximately 373 times higher. That is substantial progress, but transaction counts alone cannot establish the number of organic users, meaningful application activity, DUST consumption, or actual economic value generated. Those metrics need to be evaluated separately. Supply economics also matter. NIGHT has a fixed total supply of 24 billion tokens, while a recent Subscan snapshot shows approximately 16.61 billion circulating, around 69.2% of the total. The remaining non-circulating supply makes distribution and future reserve releases important variables to monitor. There are positive developments. Midnight’s roadmap places block-production rewards in Q4 2026 and NIGHT staking in Q1 2027. The proposed reward structure uses an existing token reserve rather than creating additional NIGHT, with block utilization influencing how rewards are divided between producers and the Treasury. These mechanisms could strengthen participation, but the published reward proposal is still marked as proposed. DUST consumption should also not be confused with a NIGHT supply burn. The bull case is credible: programmable privacy, selective disclosure, institutional applications, and cross-chain integrations could give Midnight a meaningful position in regulated finance and private DeFi. If these applications attract sustained demand, NIGHT’s role as the asset generating DUST could become increasingly important. But potential utility is not the same as demonstrated value accrual. Going forward, I would watch organic application usage, DUST consumption, NIGHT balances registered for DUST generation, block utilization, and the actual implementation of staking and reward distribution. The important question is not simply whether Midnight processes more transactions. It is whether that activity creates persistent demand for NIGHT and a transparent economic benefit for its holders. #IMPACTbyTrade $NIGHTUSDT

PEPE has established itself as one of the largest and most liquid meme tokens in the market. Its market capitalization is approximately $1.9 billion, with reported daily trading volume above $500 million. That level of activity reflects substantial market recognition and strong exchange participation. Yet one number deserves more attention: how much of this economic activity actually reaches PEPE holders? The distinction is important. Trading volume represents how much PEPE changes hands, not how much economic value the token generates. Traders pay exchange fees to trading platforms, liquidity providers may earn swap fees, and Ethereum transaction costs are paid in ETH. None of these automatically becomes revenue for PEPE or recurring income for its holders. This is the central weakness in PEPE’s economic model. It has a large and active market, but it does not operate a revenue-generating protocol with a transparent mechanism that distributes earnings, buys back tokens, or shares fees with holders. The derivatives market also deserves attention. CoinGlass reported approximately $552 million in PEPE futures volume against $144 million in spot volume on November 14, 2026, across its tracked markets. That represents roughly 3.8 times more futures activity than spot activity. This suggests that leveraged positioning is a significant part of market participation. It does not necessarily indicate equivalent demand from investors accumulating and holding the underlying token. On the supply side, PEPE has a meaningful advantage: its original supply was fixed at 420.69 trillion tokens, with no conventional vesting schedule or ongoing inflation. The October 24, 2023 burn removed approximately 6.9 trillion tokens, or 1.6% of the original supply. This reduced available supply and addressed concerns surrounding the team’s remaining allocation. However, it was a one-time event, not a recurring mechanism funded by economic activity. A smaller supply does not automatically create sustainable demand. The value-accrual gap therefore remains substantial. PEPE holders primarily depend on market demand, liquidity, community engagement, exchange access, and the continued relevance of its cultural identity. There is currently no clearly established, recurring cash-flow mechanism connecting the token’s market activity to holder returns. The SEC filing also notes that no particular blockchain-based utility beyond branding and cultural associations has been announced. The strongest bullish argument is still credible: PEPE has survived multiple market cycles, built significant brand recognition, secured deep exchange liquidity, and avoided the conventional inflation and unlock pressures found in many newer tokens. Its community and cultural relevance could continue attracting speculative capital. But market relevance and economic value capture are different things. Going forward, I would watch sustained spot demand, large-holder distribution, supply concentration, and—most importantly—whether PEPE develops a transparent mechanism that connects its growing market activity to recurring value for holders. Until then, PEPE remains a powerful speculative asset, but not a token with a clearly established value-accrual model. #IMPACTbyTrade $PEPEUSDT