MIDAN
14554Лайк0Акциялар246Жанкүйерлер14Жазылу
* Bybit Crypto Trader ⚡ | Daily Insights & Market Updates | Market research updates every day | FOLLOW ME FOR MORE INFO | (DYUR)😊💯✅️
* Bybit Crypto Trader ⚡ | Daily Insights & Market Updates | Market research updates every day | FOLLOW ME FOR MORE INFO | (DYUR)😊💯✅️
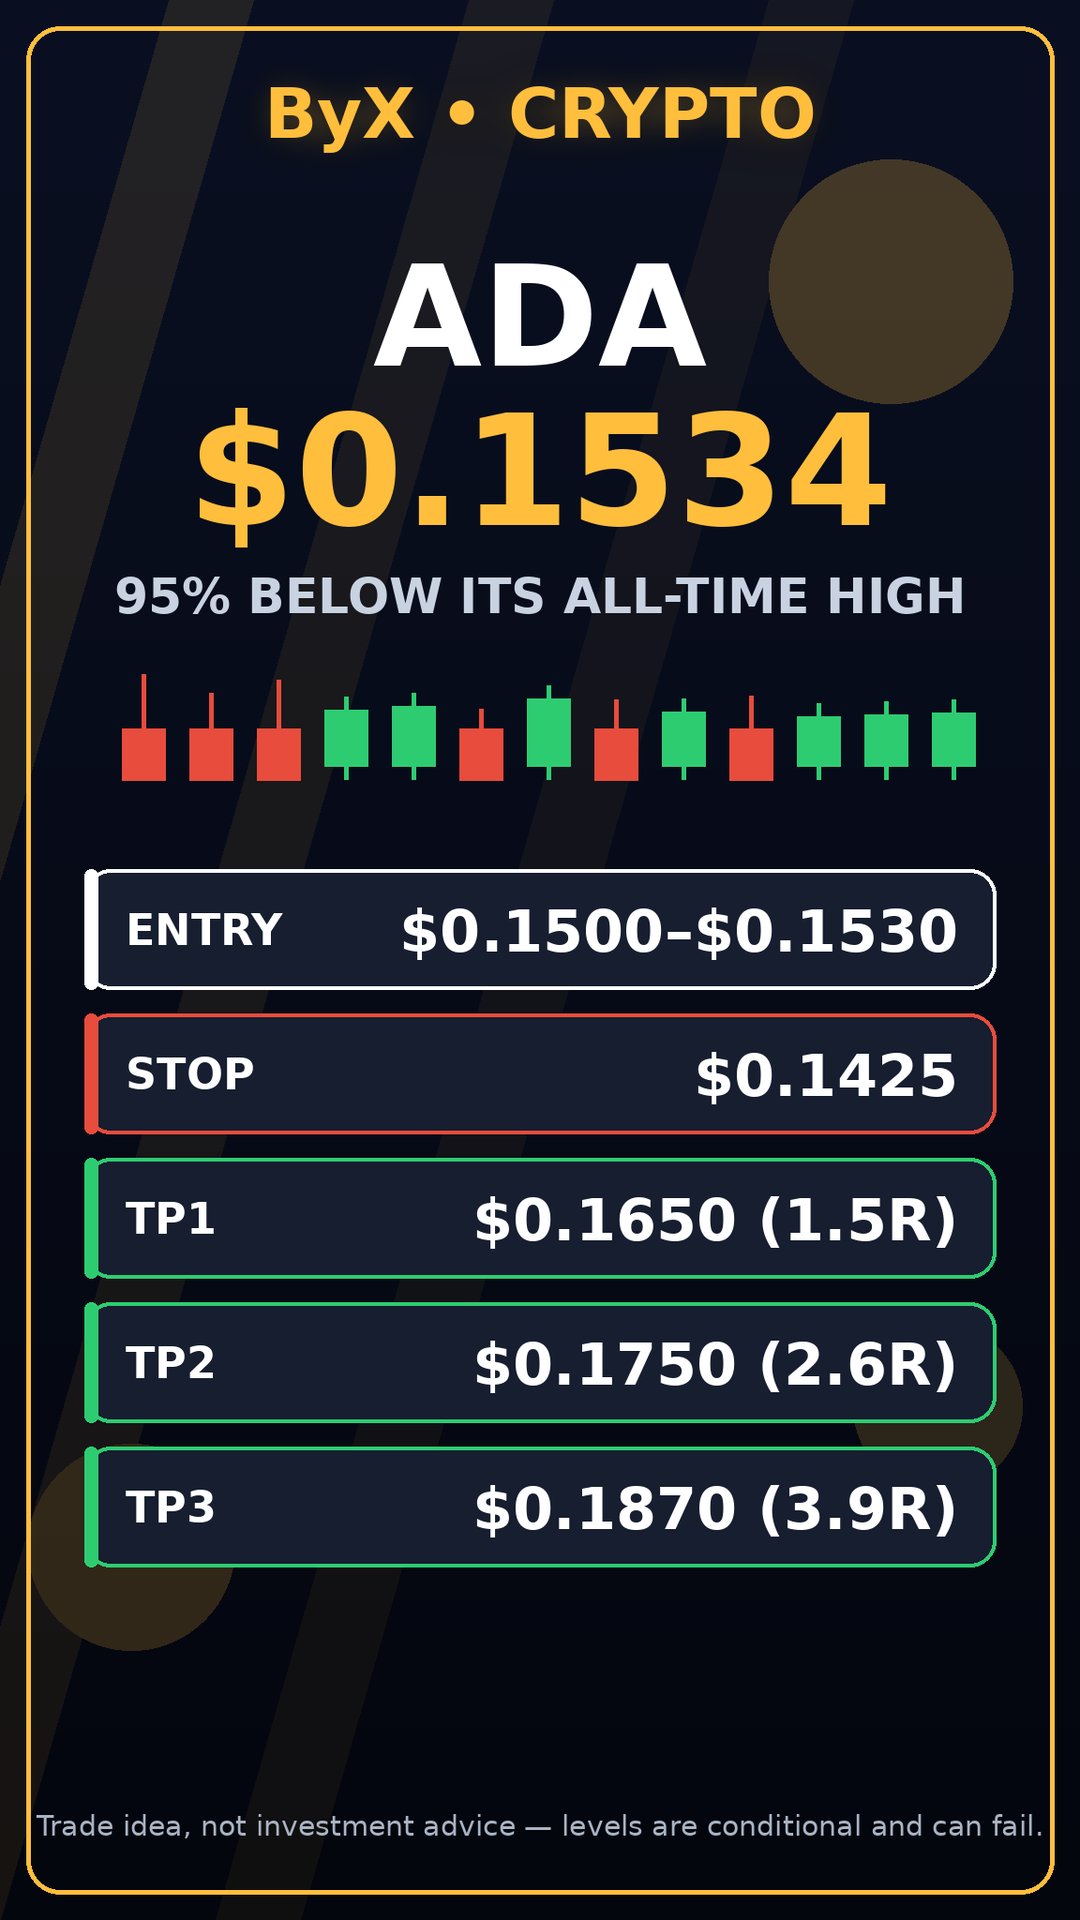
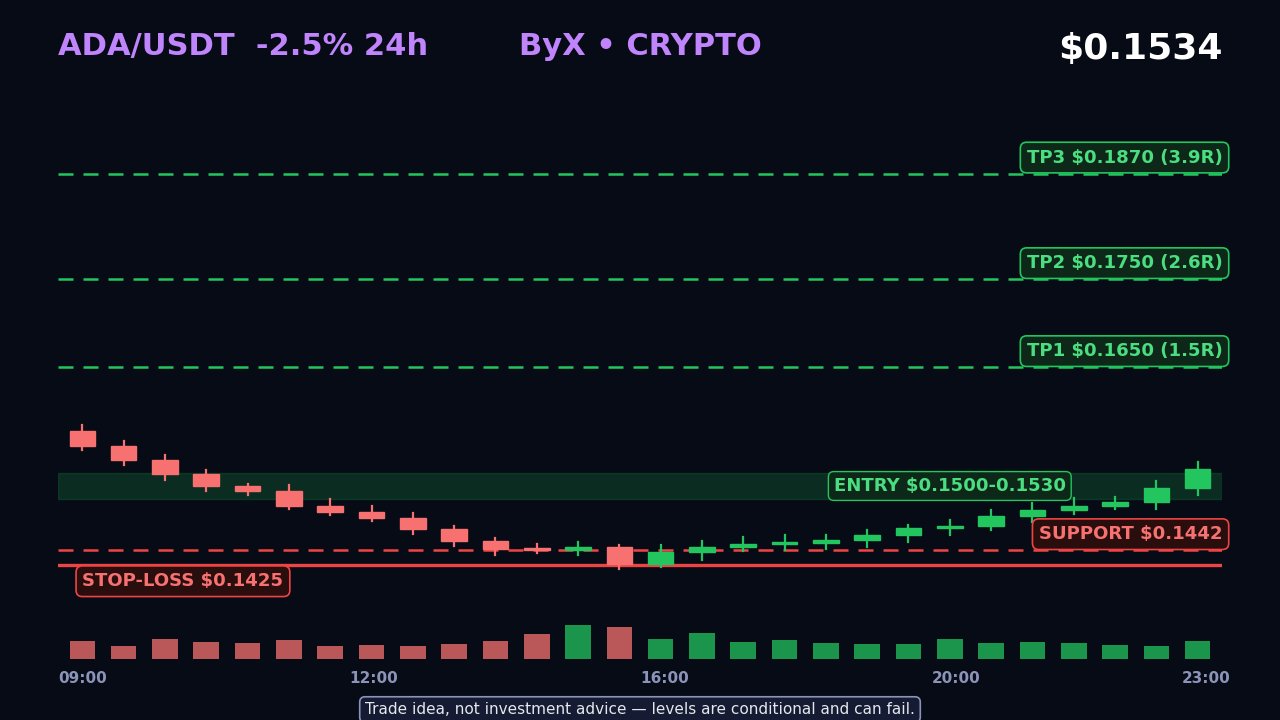
Cardano's founder just declared the roadmap "finished" — the same week ADA crashed to $0.1429, 95% below its all-time high. Cardano is the peer-reviewed proof-of-stake Layer-1. On November 13, founder Charles Hoskinson said in a livestream titled "Finishing Cardano" that the original roadmap is complete. The market answered within a day: ADA lost 12.3% on November 14, closed at $0.1478, its lowest close since June 30, and tagged $0.1429 intraday. A year ago it was $0.5033 — over 3x today's price. The catalyst goes beyond that. A treasury request for a Copper strategic reserve of 22 million ADA closes today — a live vote on Cardano stockpiling its own token. Behind it: the Dijkstra hard fork with Leios scaling, testnet live since October, and Peras, due Q2 2027. Macro is hostile: the Fed has an 88.5% hike chance on December 8–9, Bitcoin trades near $65,000 after $1.91 billion left the spot ETFs in seven sessions, and Fear & Greed sits at 12. ADA fell more than twice as hard as Bitcoin. The squeeze setup is in the numbers: ADA is down 16.6% in seven days and 67.9% in a year, market cap $5.5 billion. Daily RSI hit 25.7 on November 14 — deep oversold. Open interest unwound to $284 million, down 13% in 24 hours, and funding is -0.0139% per 8 hours, about -15.2% annualised: shorts pay longs to stay short. Futures volume jumped 79% to $726 million; $6.3 million was liquidated in 24 hours, 95% longs. Weak hands are gone; the short book sits on the year's low. Technically, ADA sits 30% below its 50-day and 27% below its 200-day average — a stretched rubber band. The $0.1426–$0.1442 zone is the line: today's low and the June 30 close. Hold it and the bounce has room; lose it and $0.13s is next. Trade: LONG ADA $0.1500–$0.1530, stop $0.1425, below today's low. TP1 $0.1650 (1.5R), TP2 $0.1750 (2.6R), TP3 $0.1870 (3.9R). 24–48 hour swing; daily RSI, 50/200-day averages, funding, open interest. Bull case: RSI 25.7 with deeply negative funding is the classic squeeze setup — shorts pay to hold at the year's low, and stabilisation above $0.1500 forces covering into thin liquidity. If the Copper vote passes today, "finished" flips from surrender to completion. Bear case: the founder declaring victory with the token 95% below its high reads as capitulation. The Ethiopia rollout never happened, the Fed is about to hike, and ADA has shown zero relative strength. A daily close under $0.1425 invalidates everything and opens a fresh leg down. A: ADA squeezes back above $0.1650 this week — "finished" marks the bottom. B: $0.1425 breaks and ADA grinds toward $0.13 — the roadmap is done and so is the bid. Which side are you on? $ADAUSDT #ByXIMPACT #IMPACTbyTrade Trade idea, not investment advice — levels are conditional and can fail.
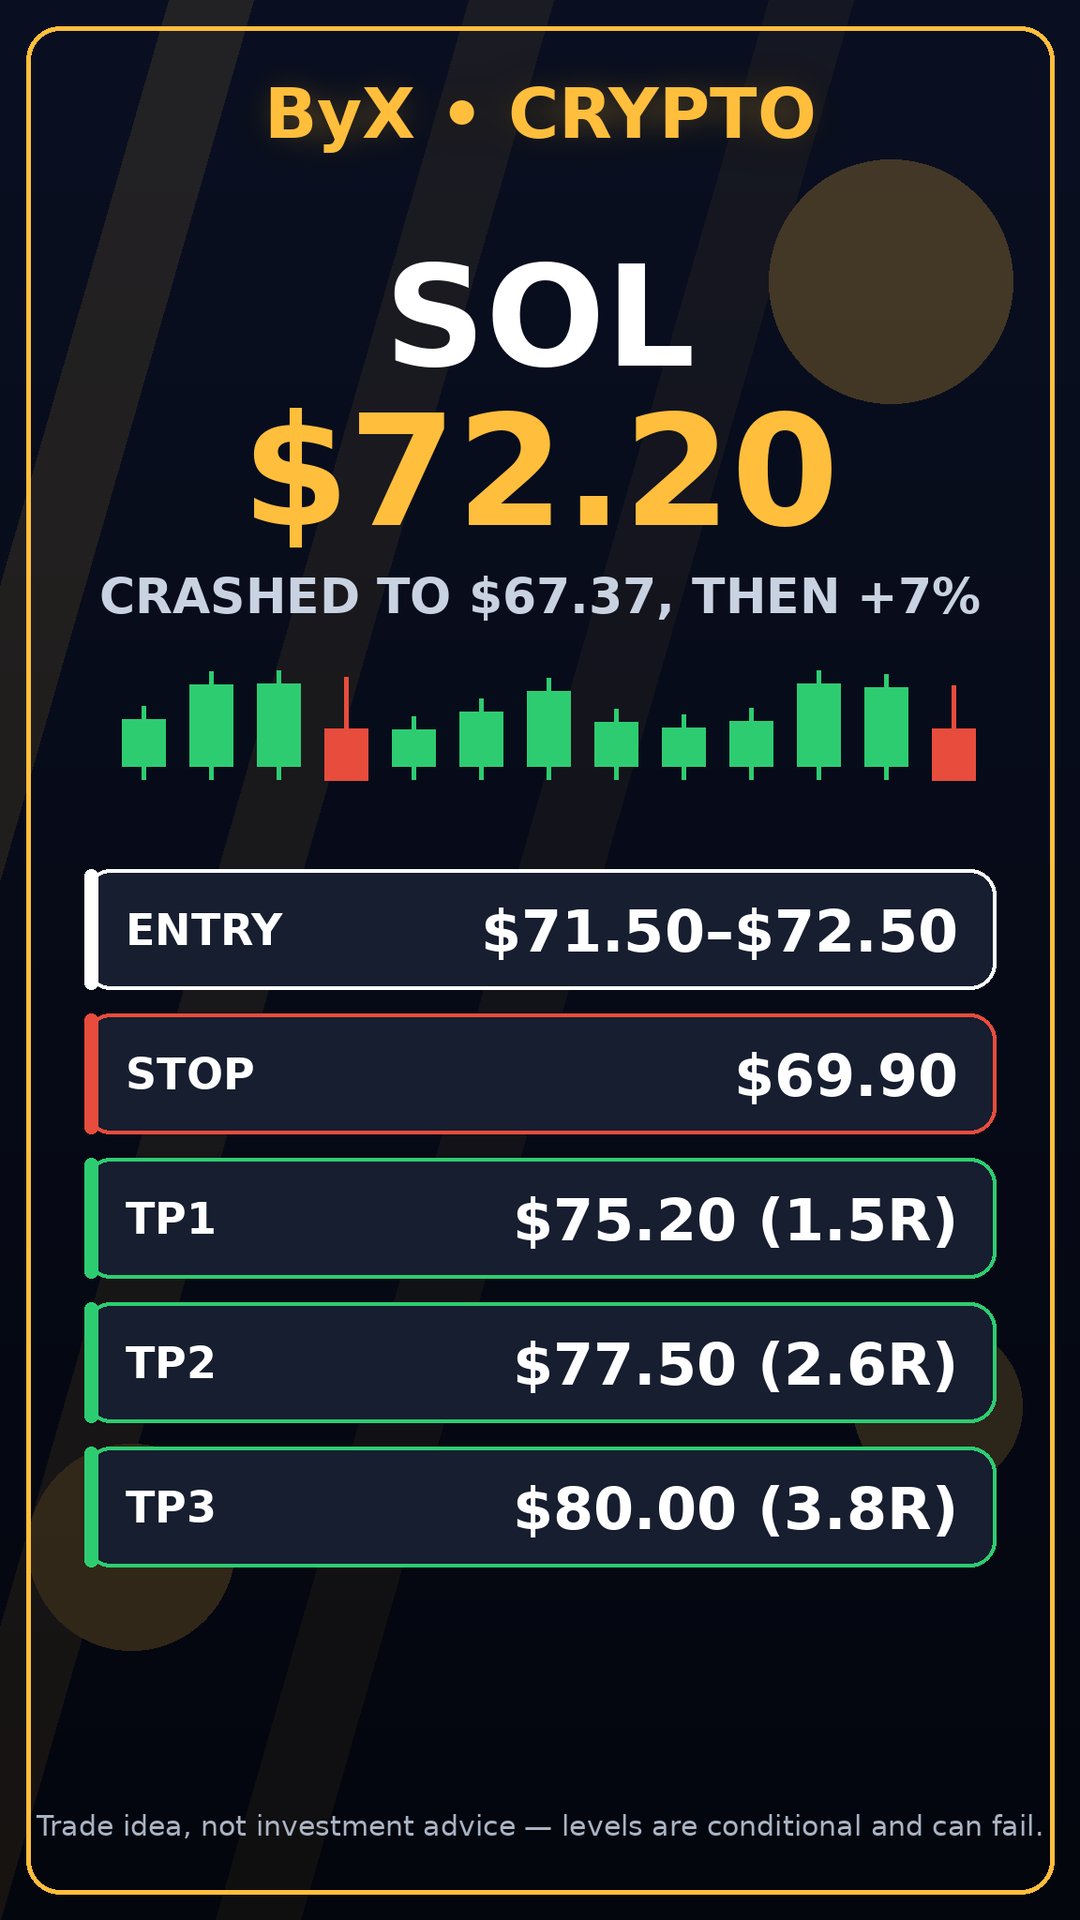
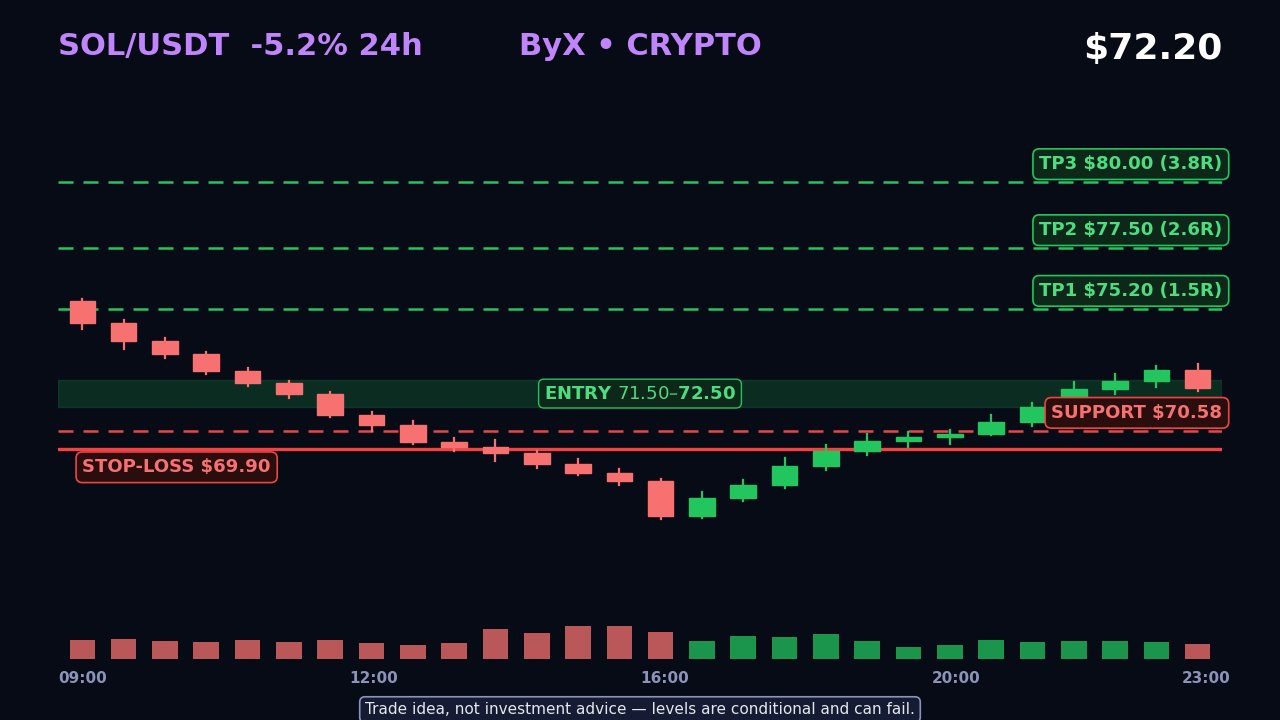
Solana crashed to $67.37 as 8,000 people walked into Breakpoint London — then ripped 7% in hours while its RSI printed 14.6. Solana settles thousands of transactions a second for pennies, and today it hosts its biggest stage of the year: Breakpoint, November 15–17 at Olympia London — first time in Europe, 8,000+ attendees from 100+ countries, themed the "Token Supercycle." The doors opened, SOL printed $67.37 overnight — the lowest of the slide — then buyers carried it back above $72. The catalyst is live, not rumoured. Day one is institutions already onchain — DTCC, BNY, Mastercard, Barclays, Zelle, MoneyGram — sharing the stage with Yakovenko, Lily Liu and Raoul Pal. No big announcement dropped at the open, so the next two days are the trade: any tokenisation or payments headline out of Olympia lands on a washed-out coin. Macro is hostile: Bitcoin sits near $65,449 after $1.07B left the US spot BTC ETFs in November 9–13, Fear & Greed reads 12, and traders price a Fed hike on December 9. Solana is falling harder — down 20.2% in 7 days, 33.6% in 30 days, 76% below its $293.31 January 2025 high. But the leverage data says the flush already happened: open interest $1.98B, down 22% in 7 days and 8.1% in 24 hours; funding -0.0088% per 8 hours, so shorts now pay longs. $61.14M of SOL positions were liquidated in 24 hours, 92% longs, and $183.58M over 7 days. SOL ETFs have bled 7 straight sessions, about $58.3M, with assets under management down to $1.137B. The chain has not stopped: TVL $4.687B, stablecoins $13.96B, $1.616B of DEX volume in 24 hours. Technically SOL is stretched further than almost any large cap: 14-day RSI 14.6, 31.5% below its 50-day average of $101.79 and under its 200-day at $88.77. The bounce off $67.37 reclaimed $70.58 support and the $70 psychological level; resistance stacks at $75.35, then the November 13 low near $77.19. Trade: LONG SOL $71.50–$72.50, stop-loss $69.90 below $70. TP1 $75.20 (1.5R), TP2 $77.50 (2.6R), TP3 $80.00 (3.8R). The $80 level is the round-number magnet overhead. Bull case: Breakpoint delivers a real tokenisation or payments headline while positioning is this clean — open interest flushed, funding negative, RSI 14.6 — and the bounce squeezes toward $80 as shorts cover. A 7% recovery off the low in hours shows buyers defending $67. Bear case: no headline comes, Fed-hike fear keeps draining risk, and $70 fails. A daily close under $69.90 breaks the bounce and reopens the $67.37 low, with ETF outflows still running 7 sessions straight. The stop exists for exactly that reason. Breakpoint runs two more days. Does SOL close the conference above $80, or does the $67 low get retested first — A or B? $SOLUSDT #ByXIMPACT #IMPACTbyTrade Trade idea, not investment advice — levels are conditional and can fail.
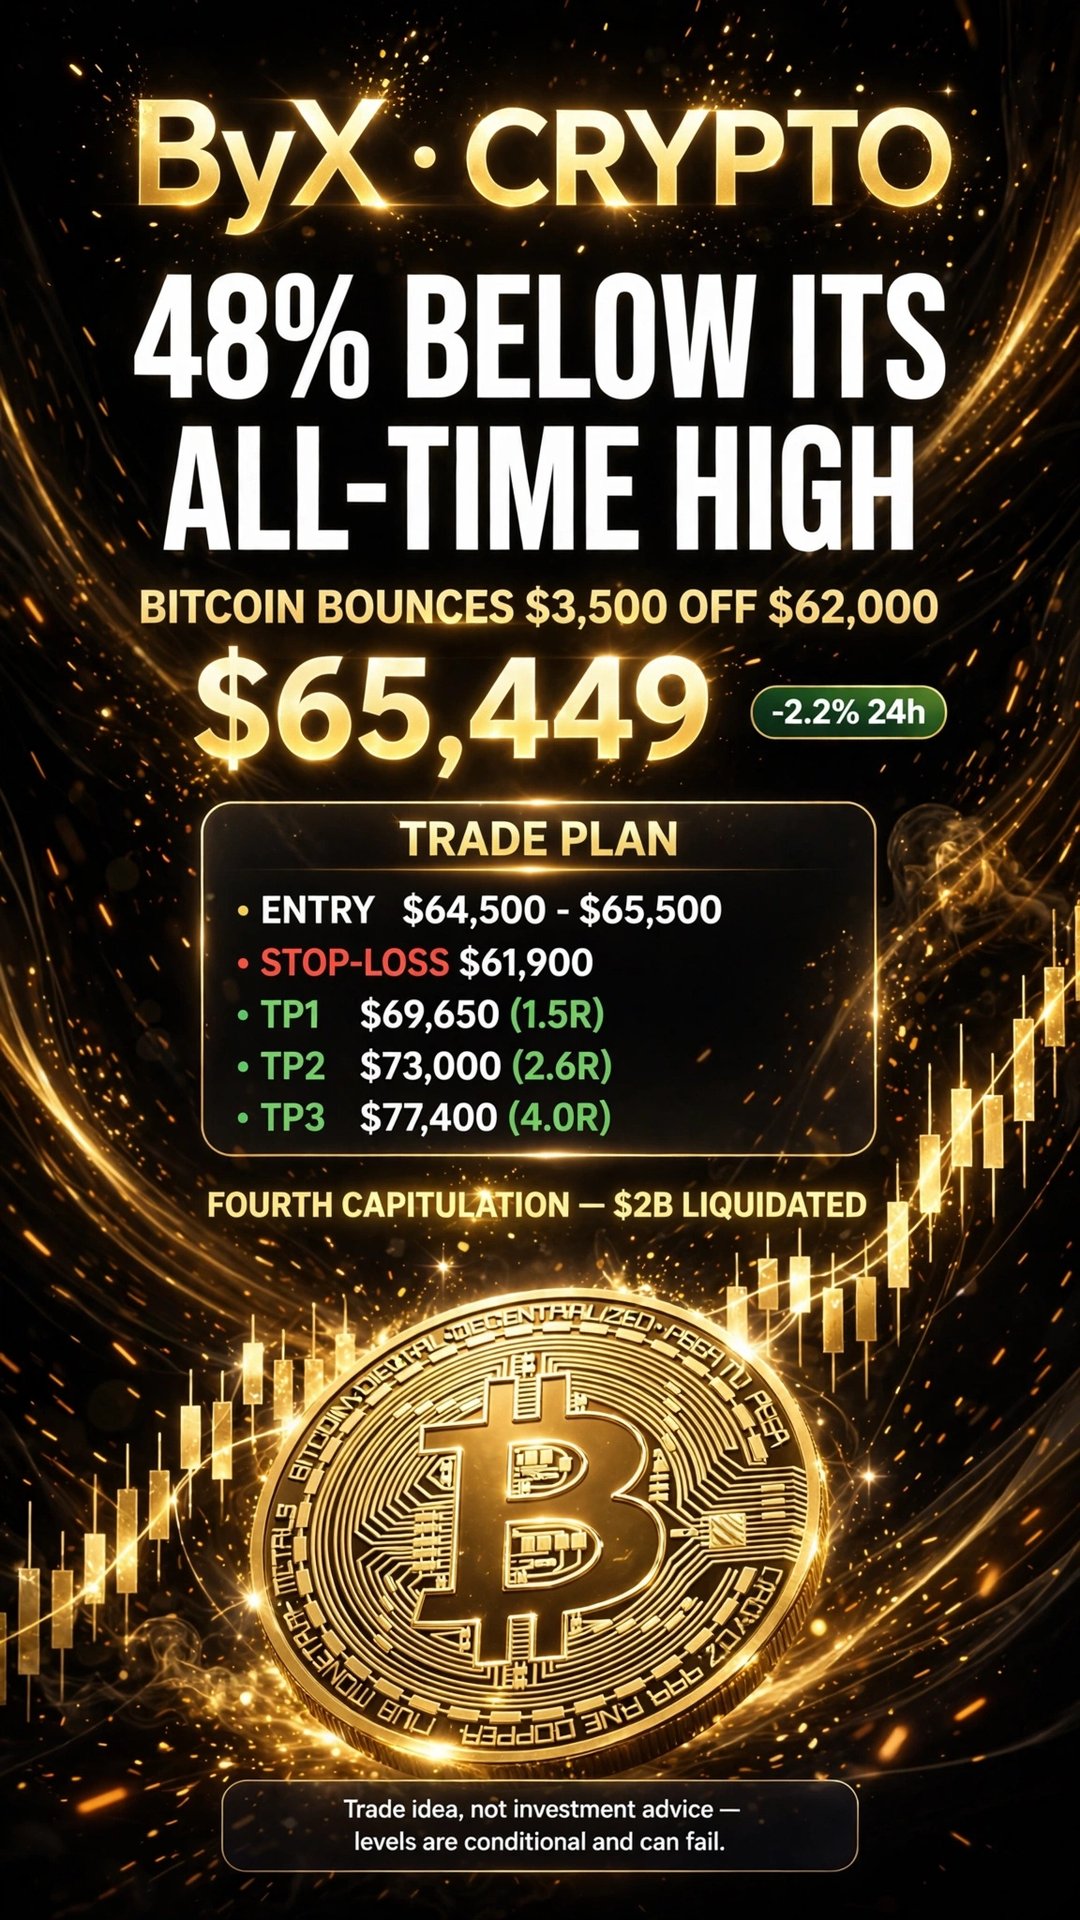
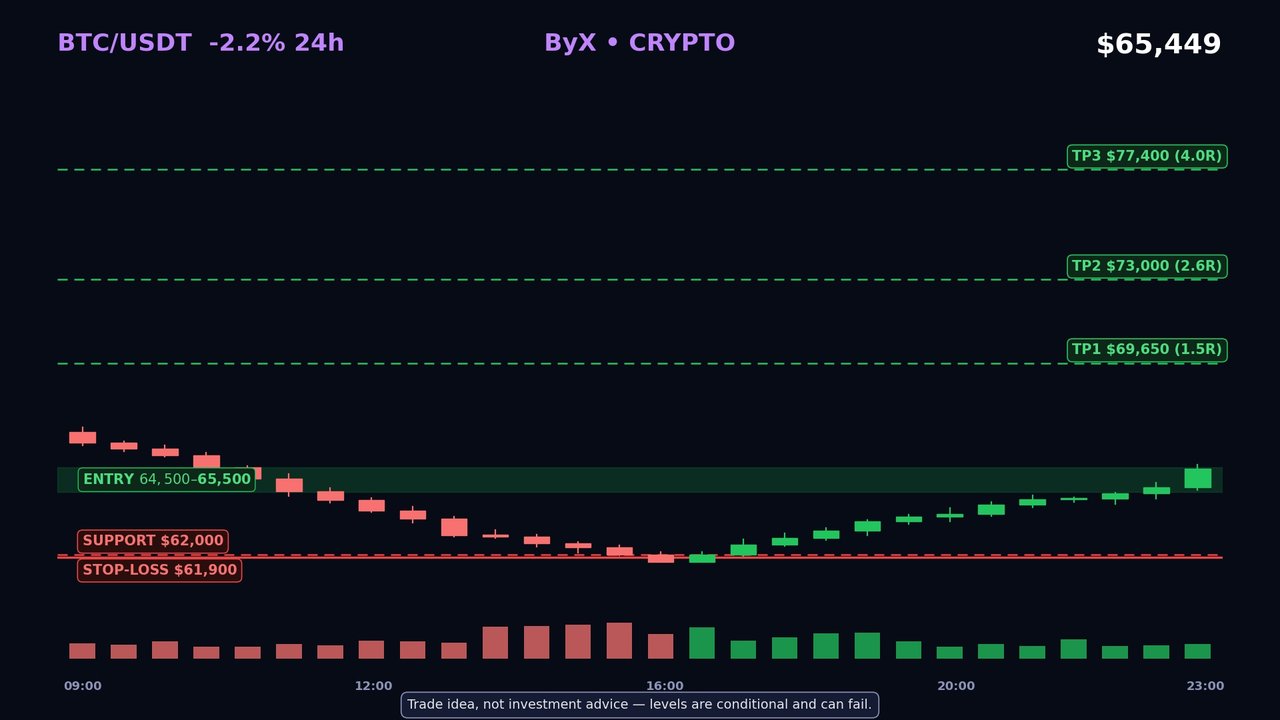
Bitcoin is 48% below its all-time high — and it just bounced $3,500 off a four-month low while $1.91 billion walked out of the ETFs. Bitcoin is telling two stories at once. BTC fell to $62,000 this morning, its lowest since July, down 25% since the October 21 peak and 48% below its $126,080 all-time high. Yet buyers stepped in hard at that low and pushed price back to $65,449 — a 5.7% bounce in hours. Panic selling met by aggressive dip-buying at the exact same level. The catalyst is a capitulation. Roughly $2 billion of leveraged positions were liquidated in 24 hours, about $774 million of it in Bitcoin, with longs making up around 80% of the damage. On-chain analyst James Check called it the fourth capitulation event since Bitcoin's all-time high. US spot Bitcoin ETFs have bled for seven straight trading days — $1.91 billion in total, including $185.5 million on Friday. This is a forced unwind, not a quiet drift lower. The macro backdrop explains the pressure: October CPI printed 0.4% month-on-month on November 10, hotter than expected, lifting rate-hike expectations for the Fed's December 9 meeting. But derivatives say the flush may be mostly done. Funding on OKX perpetuals has collapsed to essentially zero — about 0.00015% per 8 hours — so the market is no longer crowded long. 24-hour volume ran near $57 billion, and the Fear & Greed Index reads 12, extreme fear, a reading that has marked local bottoms far more often than the start of a straight fall. Technically, Bitcoin broke its 200-day moving average near $73,000 on the way down. But the hourly RSI has recovered from 23 to around 45, and the $62,000 low held on the first test with a sharp V-shaped recovery. Resistance stacks up fast: $65,600, then the $68,000–$70,000 zone, then the 200-day average. The 2026 low at $57,742 sits less than 10% below current price. The trade: LONG on the bounce, buying the $64,500–$65,500 zone, with a stop at $61,900, just below the $62,000 low. TP1 $69,650 (1.5R), TP2 $73,000 (2.6R), TP3 $77,400 (4.0R). TP2 sits exactly on the 200-day moving average. Bull case: the leverage flush is complete, funding is flat, and past capitulation events have been followed by multi-week recoveries. A reclaim of $68,000 would force shorts to cover. Bear case: ETF outflows are still running at over $1 billion a week, the Fed is leaning hawkish into December, and $62,000 was only tested once — a break opens the door straight to the $57,742 yearly low. This trade only works if $62,000 holds. Is this the capitulation bottom — or just a dead-cat bounce before $57,742? A) Bottom is in, the flush is over. B) One more leg down is coming. $BTCUSDT #ByXIMPACT #IMPACTbyTrade Trade idea, not investment advice — levels are conditional and can fail.
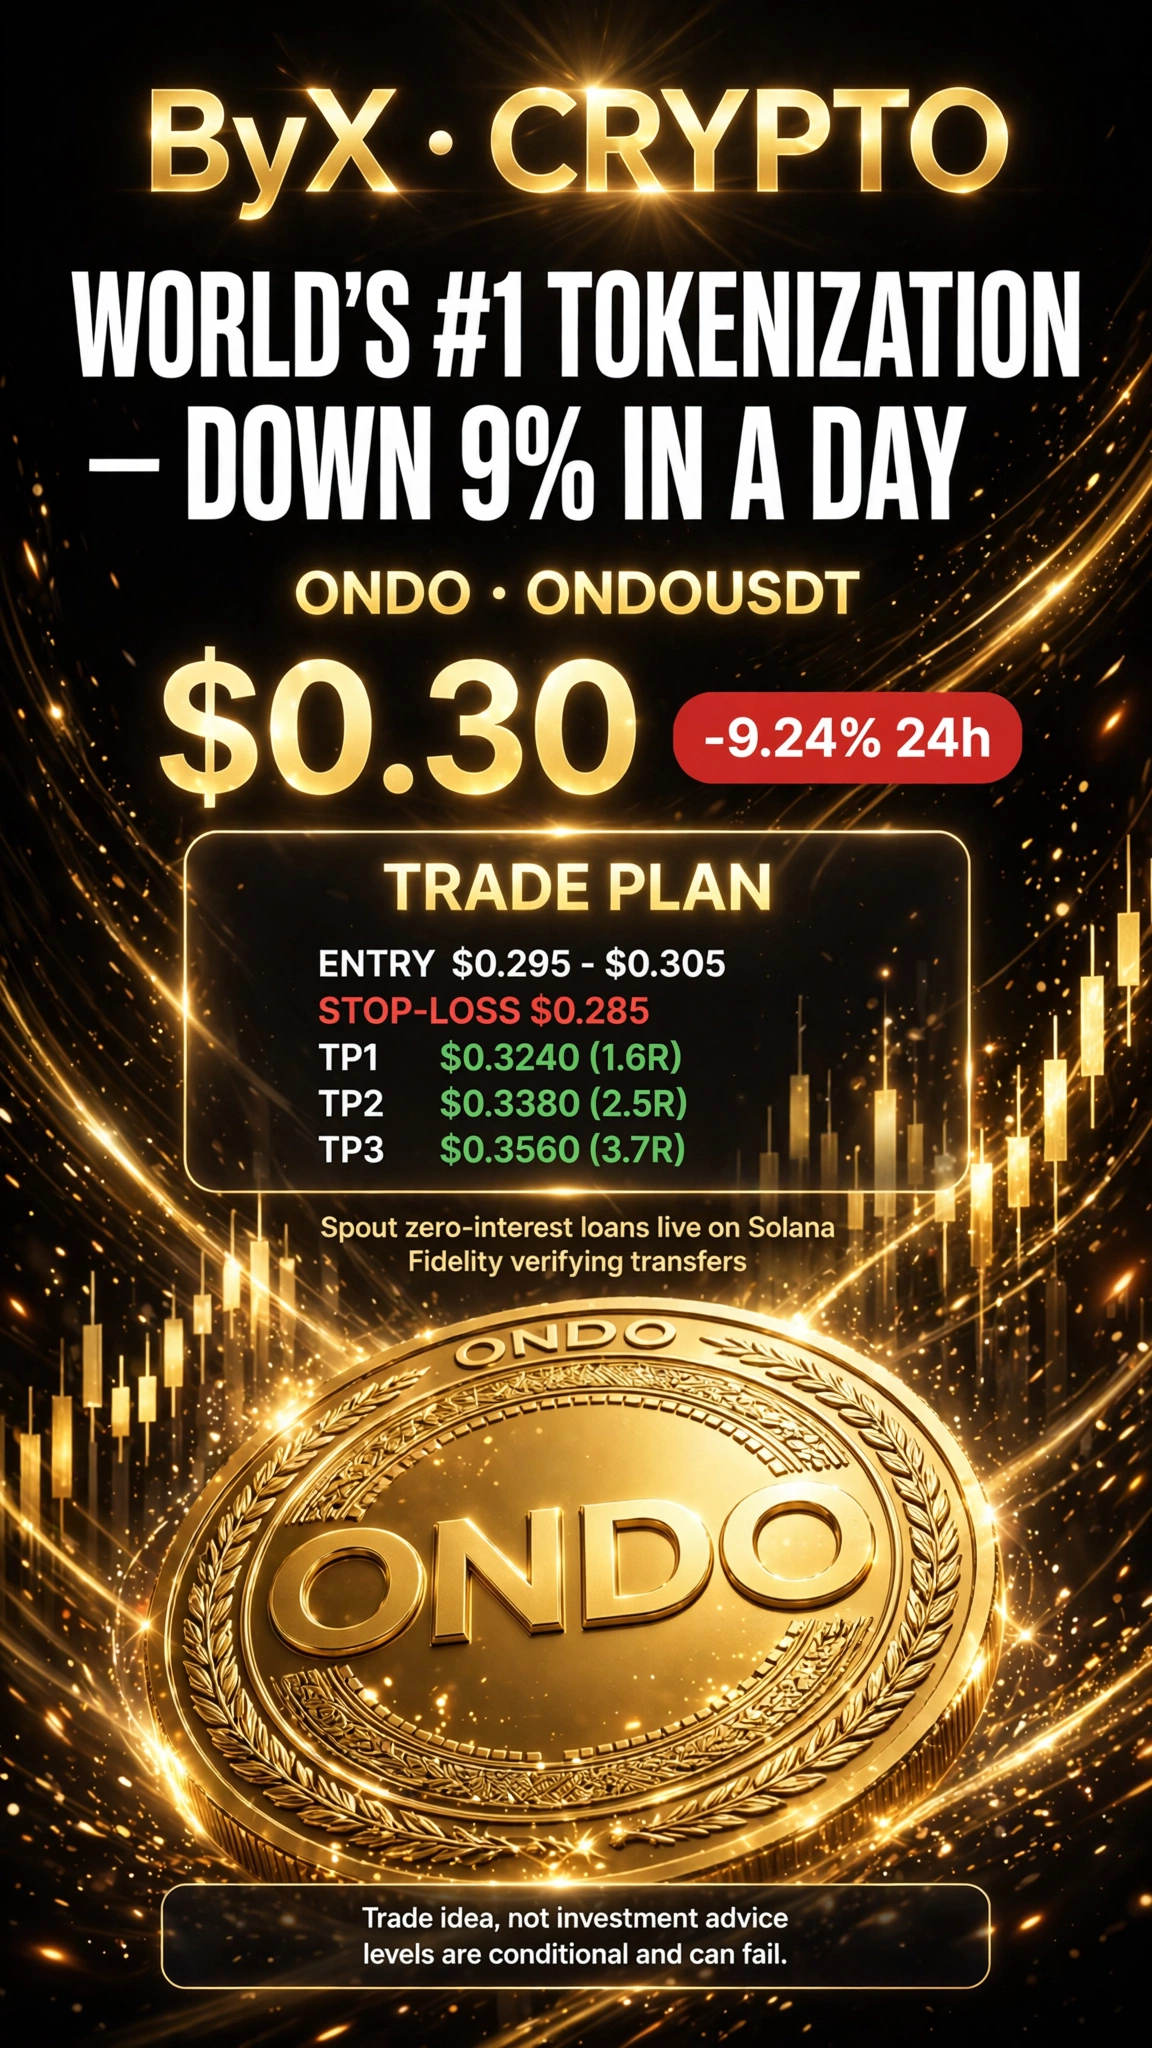
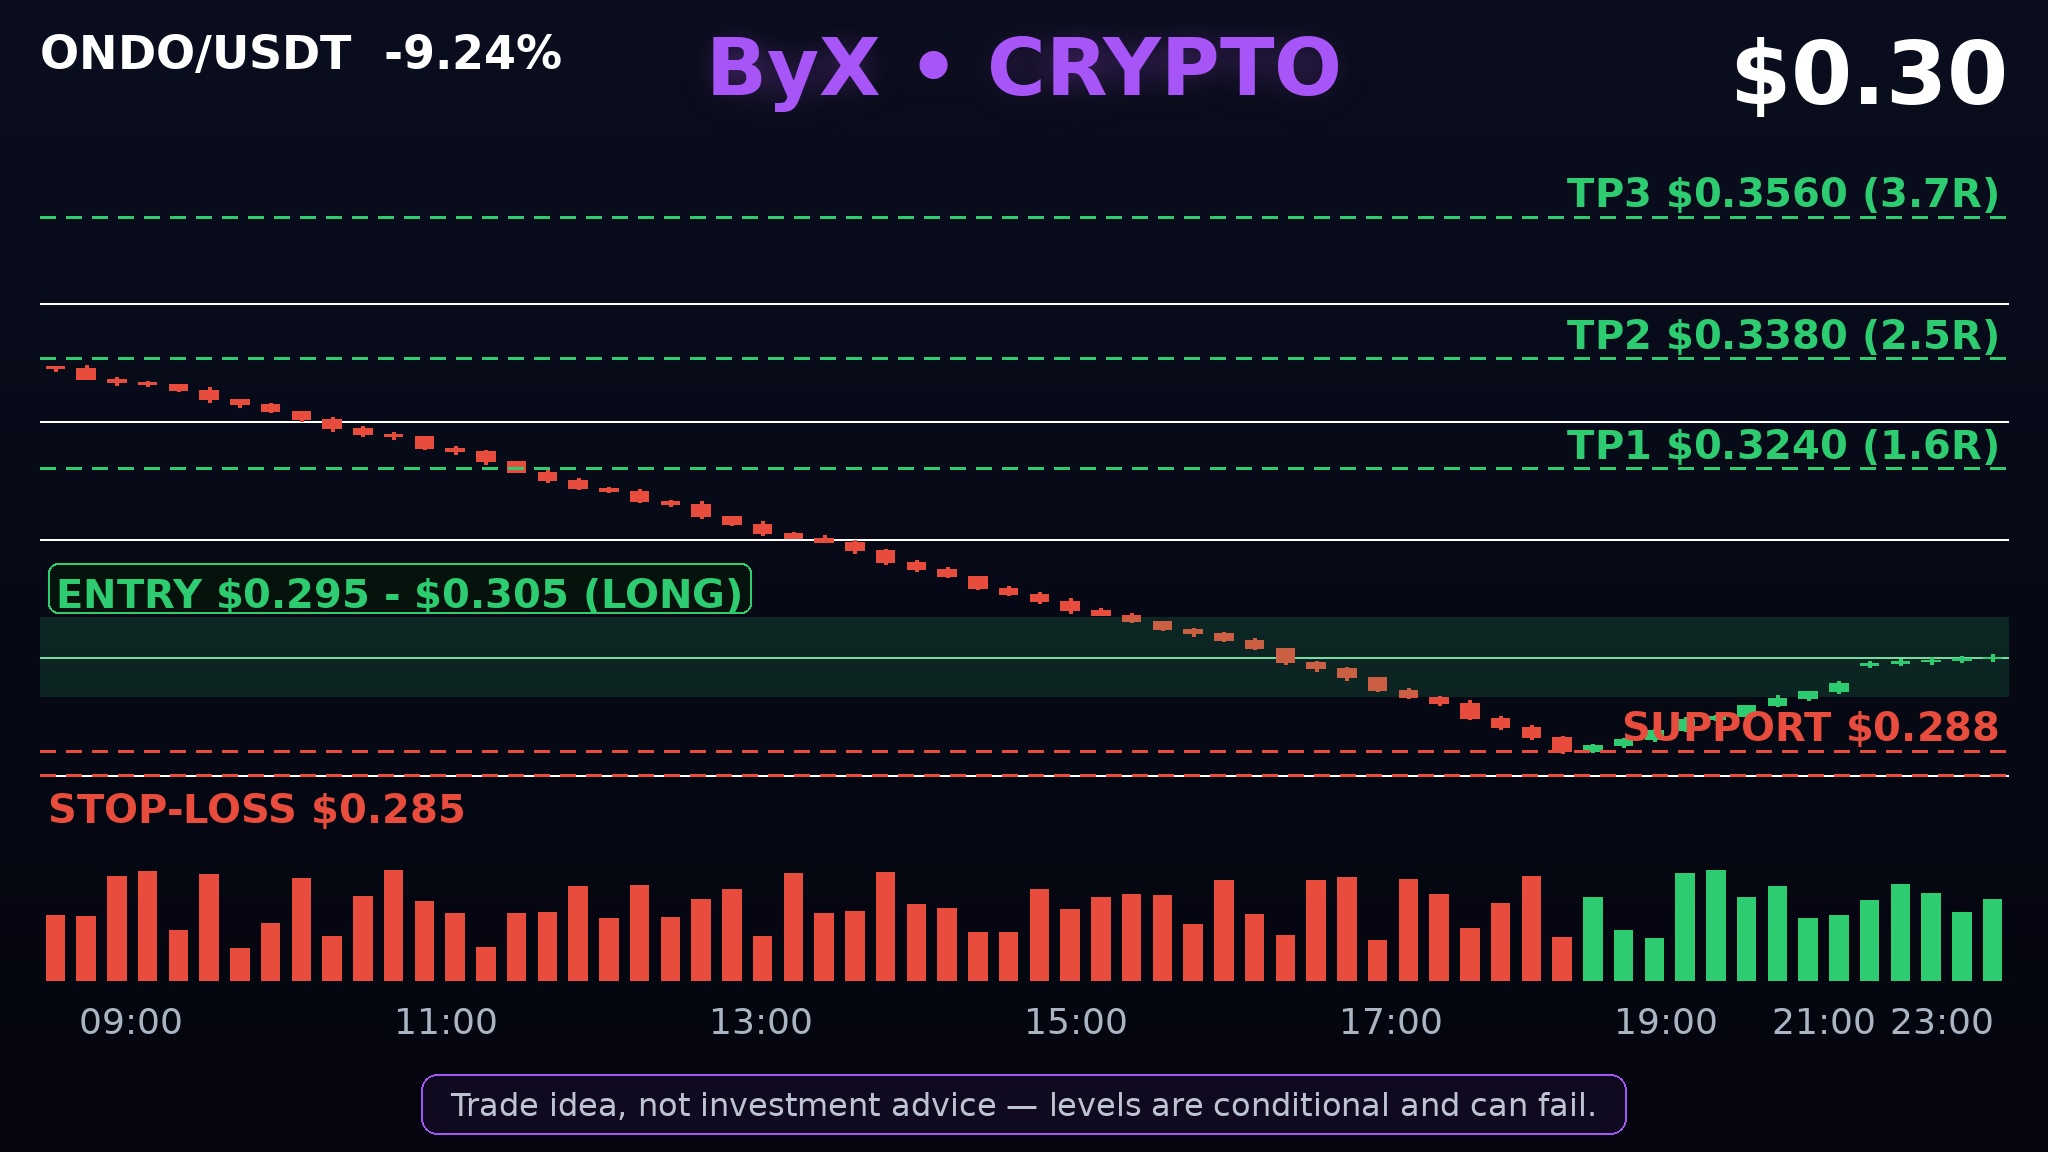
Ondo just became the world's biggest tokenization platform — $4.07 billion in real assets — and its token still fell 9% in a single day. Ondo Finance puts Wall Street on-chain: tokenized US stocks, Treasuries and ETFs. On November 5 it passed $4 billion in tokenized real-world assets and took the #1 spot out of 203 platforms tracked by RWA.xyz — 484 assets, about 10% of all non-stablecoin tokenized value. Yet ONDO trades at $0.30 — down 9% in 24 hours, down 20% in a week, 86% below its $2.14 high. The catalyst landed three days ago. On November 12, Spout Finance announced it will let investors outside the US borrow USDC against Ondo Stocks on Solana — zero interest from Spout, up to 50% of collateral value. Two days earlier, Fidelity's tech arm became an official verifier for Ondo Bridge stock transfers. Institutional-grade rails, bleeding token. That gap is the trade. Macro is brutal: Bitcoin slid toward $71,800 on November 12 and Fear & Greed sat at 20 — extreme fear. But ONDO's own numbers are cleaner. Open interest flushed 16.4% in 24 hours to $154 million. Funding is negative at -0.0124% per 8 hours, about -13.6% annualized: shorts now pay longs to hold. And $4.06 million of longs were liquidated in a day, 99% of them longs. The flush already happened. Technically, ONDO closed November 14 at $0.2976, down 12.2% on the day, below all its daily moving averages. The 1-hour RSI reads 25 — deeply oversold. The 24-hour range is $0.288 to $0.337, so the $0.288 low is the line: hold it and this is a washout; lose it and there is air below. THE TRADE — LONG ONDO, 4-hour swing: Entry $0.295–$0.305. Stop-loss $0.285, below the 24-hour low. TP1 $0.3240 (1.6R), TP2 $0.3380 (2.5R), TP3 $0.3560 (3.7R). Size it small — a counter-trend bounce, not a reversal. BULL CASE: the business is winning while the token capitulates — #1 in tokenization, Fidelity verifying transfers, zero-interest borrowing live on Solana. Negative funding means shorts pay you to wait, and the 16% open-interest flush means forced sellers are done. BEAR CASE: the token has no claim on Ondo's fees or reserves, and the overhang is real — only 49% of the 10 billion supply circulates, and 1.94 billion tokens, 19.4% of max supply, unlock on January 18, 2027. If Bitcoin keeps bleeding, a $0.288 break turns this bounce into a trap. Ondo runs the world's biggest tokenization platform, yet ONDO is 86% below its high. A) The token finally catches up to the business. B) The business doesn't matter — it's just a governance chip with a 1.94 billion-token unlock coming in January. Which side are you on? $ONDOUSDT #ByXIMPACT #IMPACTbyTrade Trade idea, not investment advice — levels are conditional and can fail.
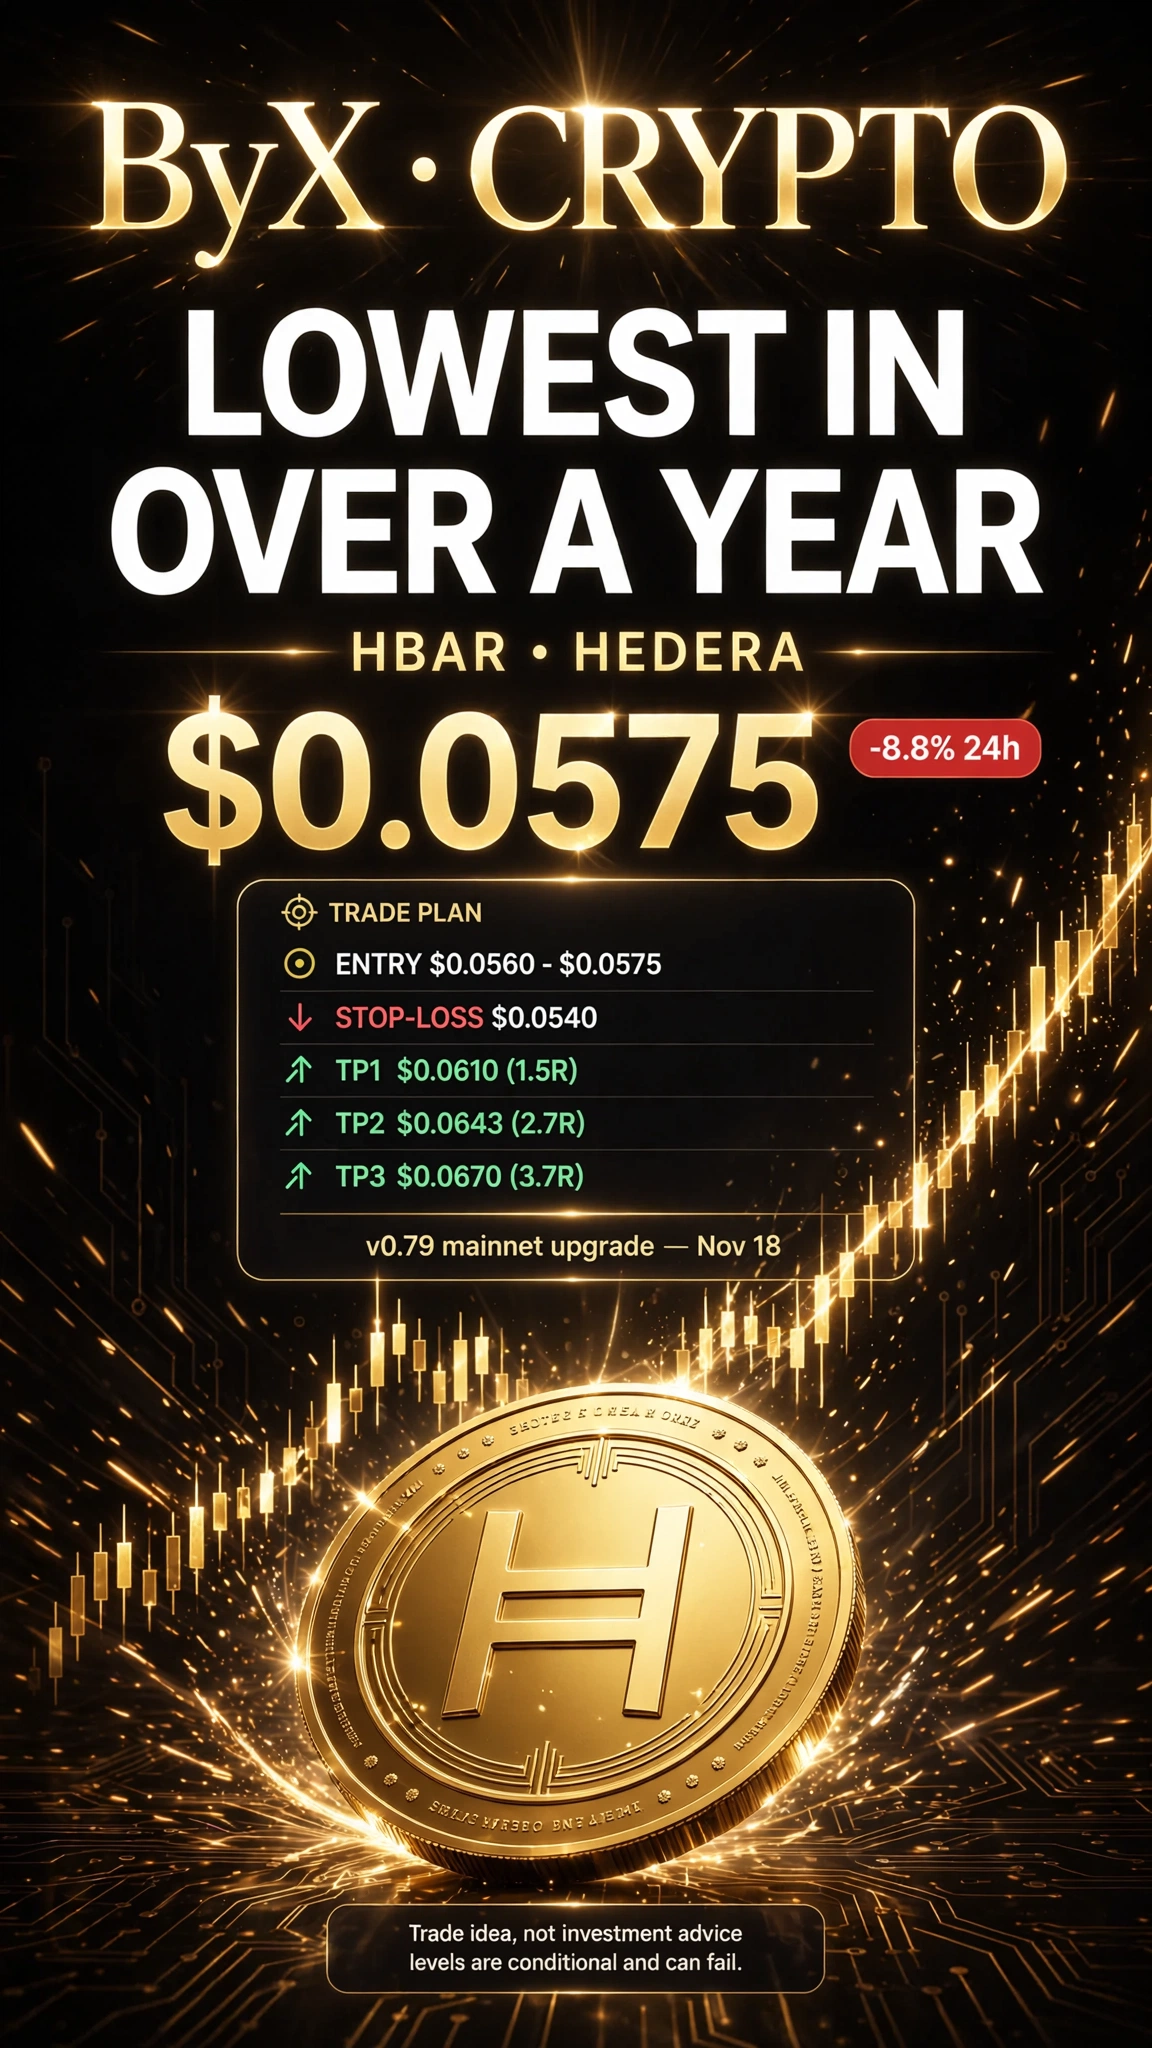
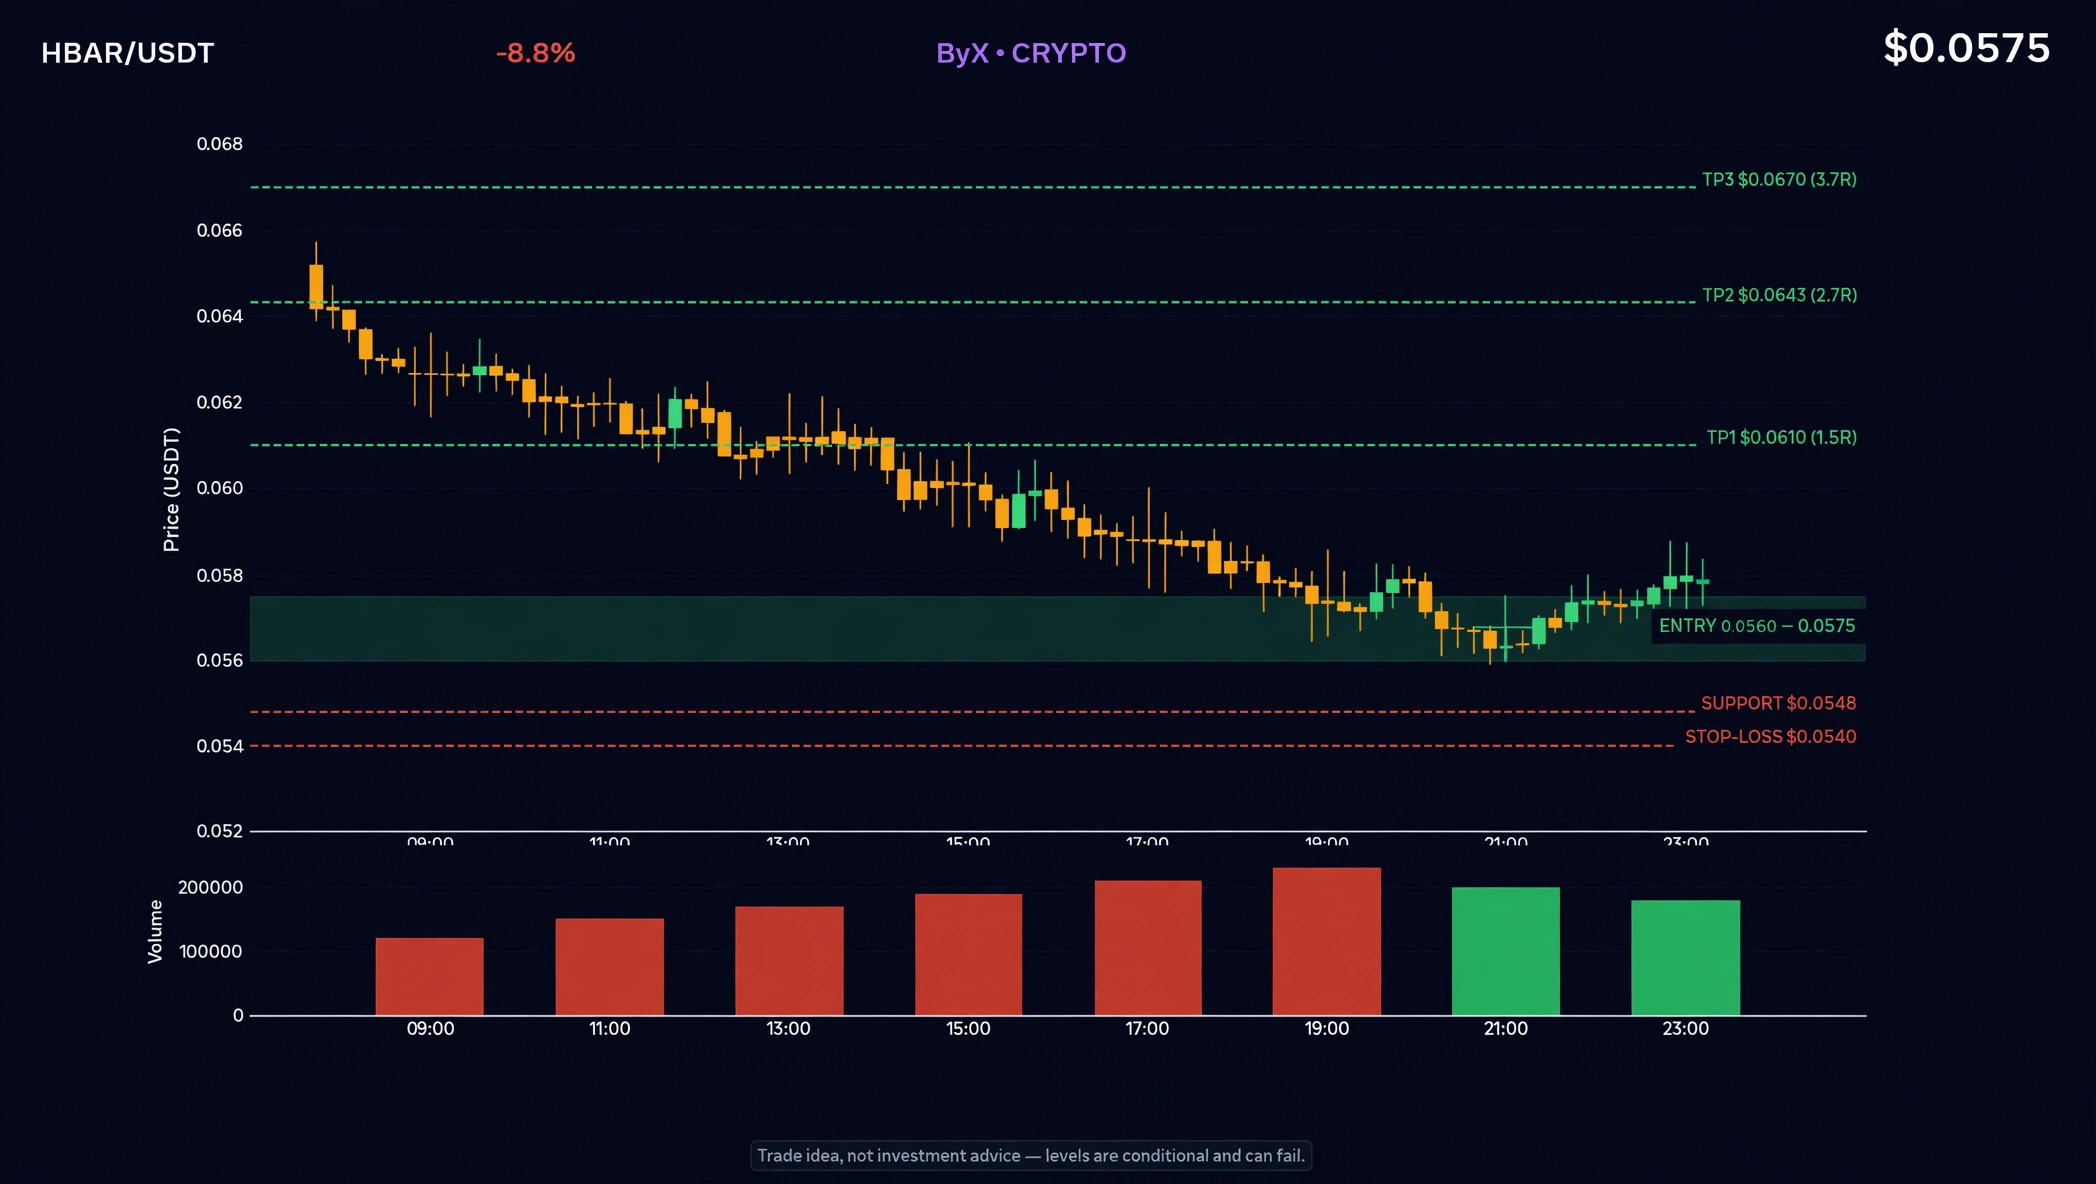
HBAR just fell to $0.0548 — its lowest price in more than a year — while Hedera processed 20 million transactions in a single month. Hedera is the enterprise-grade hashgraph network behind tokenised real-world assets, FX settlement and carbon markets — the chain banks and asset servicers actually test on. And right now the network and the token are telling two completely different stories. The catalyst is dated, not rumoured. Hedera moves its mainnet to v0.79 on Wednesday, November 18 at 18:00 UTC, a 40-minute upgrade that finished testnet on November 6. On November 14, Hedera announced YieldFX, a foreign-exchange partnership for tokenised deposits in emerging markets. And on November 11, Apex Group — a financial-services firm servicing over $3.5 trillion in assets — joined Hedera's governing council to explore tokenisation on the network. Yet the token keeps falling. HBAR is down 8.8% in 24 hours, 13.8% in seven days and 32.4% in thirty days, trading 90% below its $0.5692 all-time high from September 2021. The macro backdrop is brutal: Bitcoin broke below $63,000, the Fed is priced at an 88.5% chance of a December hike, the Fear & Greed Index printed 10 in extreme fear, and spot Bitcoin ETFs have bled for seven straight sessions. The derivatives tape shows capitulation, not calm. HBAR open interest is $122 million, down 8.7% in a day, funding is negative at −0.0050% per 8 hours — shorts are paying longs — and $1.7 million of liquidations in 24 hours were 96% longs. Futures volume jumped 24% to $163 million while spot did $155 million: traders are fighting over this level, not ignoring it. Technically, HBAR broke below its August 17 low of $0.0643 on Thursday and closed Friday near $0.0615, its lowest daily close in over a year. It trades below every major moving average, with the 200-day near $0.080. Today's low of $0.0548 is the line in the sand — a daily close back above $0.0601 would be the first sign the sellers are exhausted. The trade: long the $0.0560–$0.0575 zone, stop-loss $0.0540 below today's low, TP1 $0.0610 (1.5R), TP2 $0.0643 (2.7R, the broken August low), TP3 $0.0670 (3.7R). Bull case: the Nov 18 upgrade plus the YieldFX launch and Apex Group's $3.5 trillion of serviced assets give buyers a dated reason to step in at a 1-year low, and negative funding means shorts are already paying to stay short — a squeeze above $0.0601 could run fast. Bear case: in a market where Bitcoin just lost $63,000 and ETFs bleed daily, a network upgrade is not a floor. If $0.0548 breaks with volume, there is no clear support until the 2026 low near $0.05, and roughly 4 billion HBAR of treasury supply due by Q4-end keeps overhanging the price. A: HBAR bottoms here and reclaims $0.0643 before the Nov 18 upgrade. B: it breaks $0.0548 and slides toward $0.05 while Bitcoin hunts $60,000. $HBARUSDT #ByXIMPACT #IMPACTbyTrade Trade idea, not investment advice — levels are conditional and can fail.
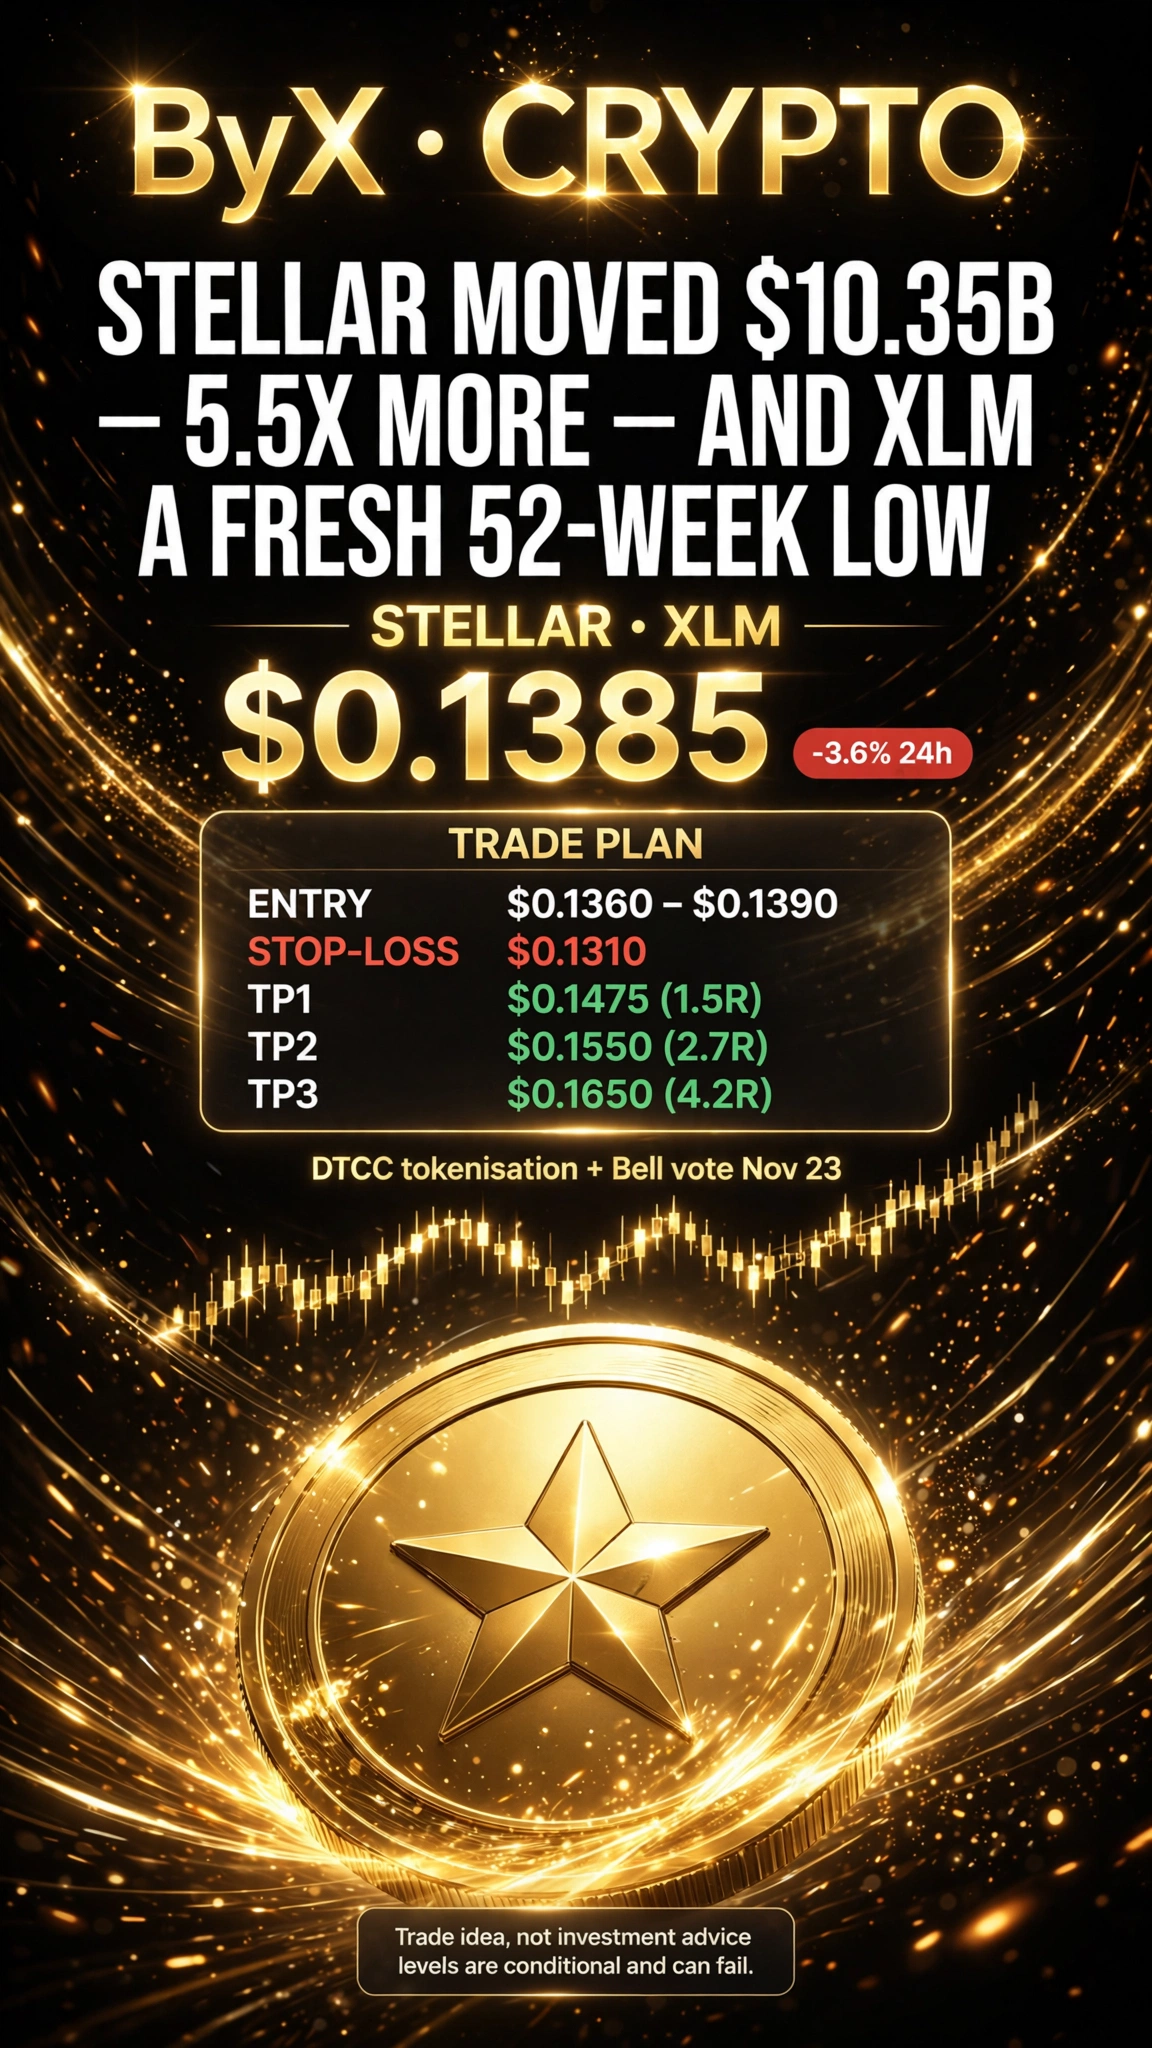
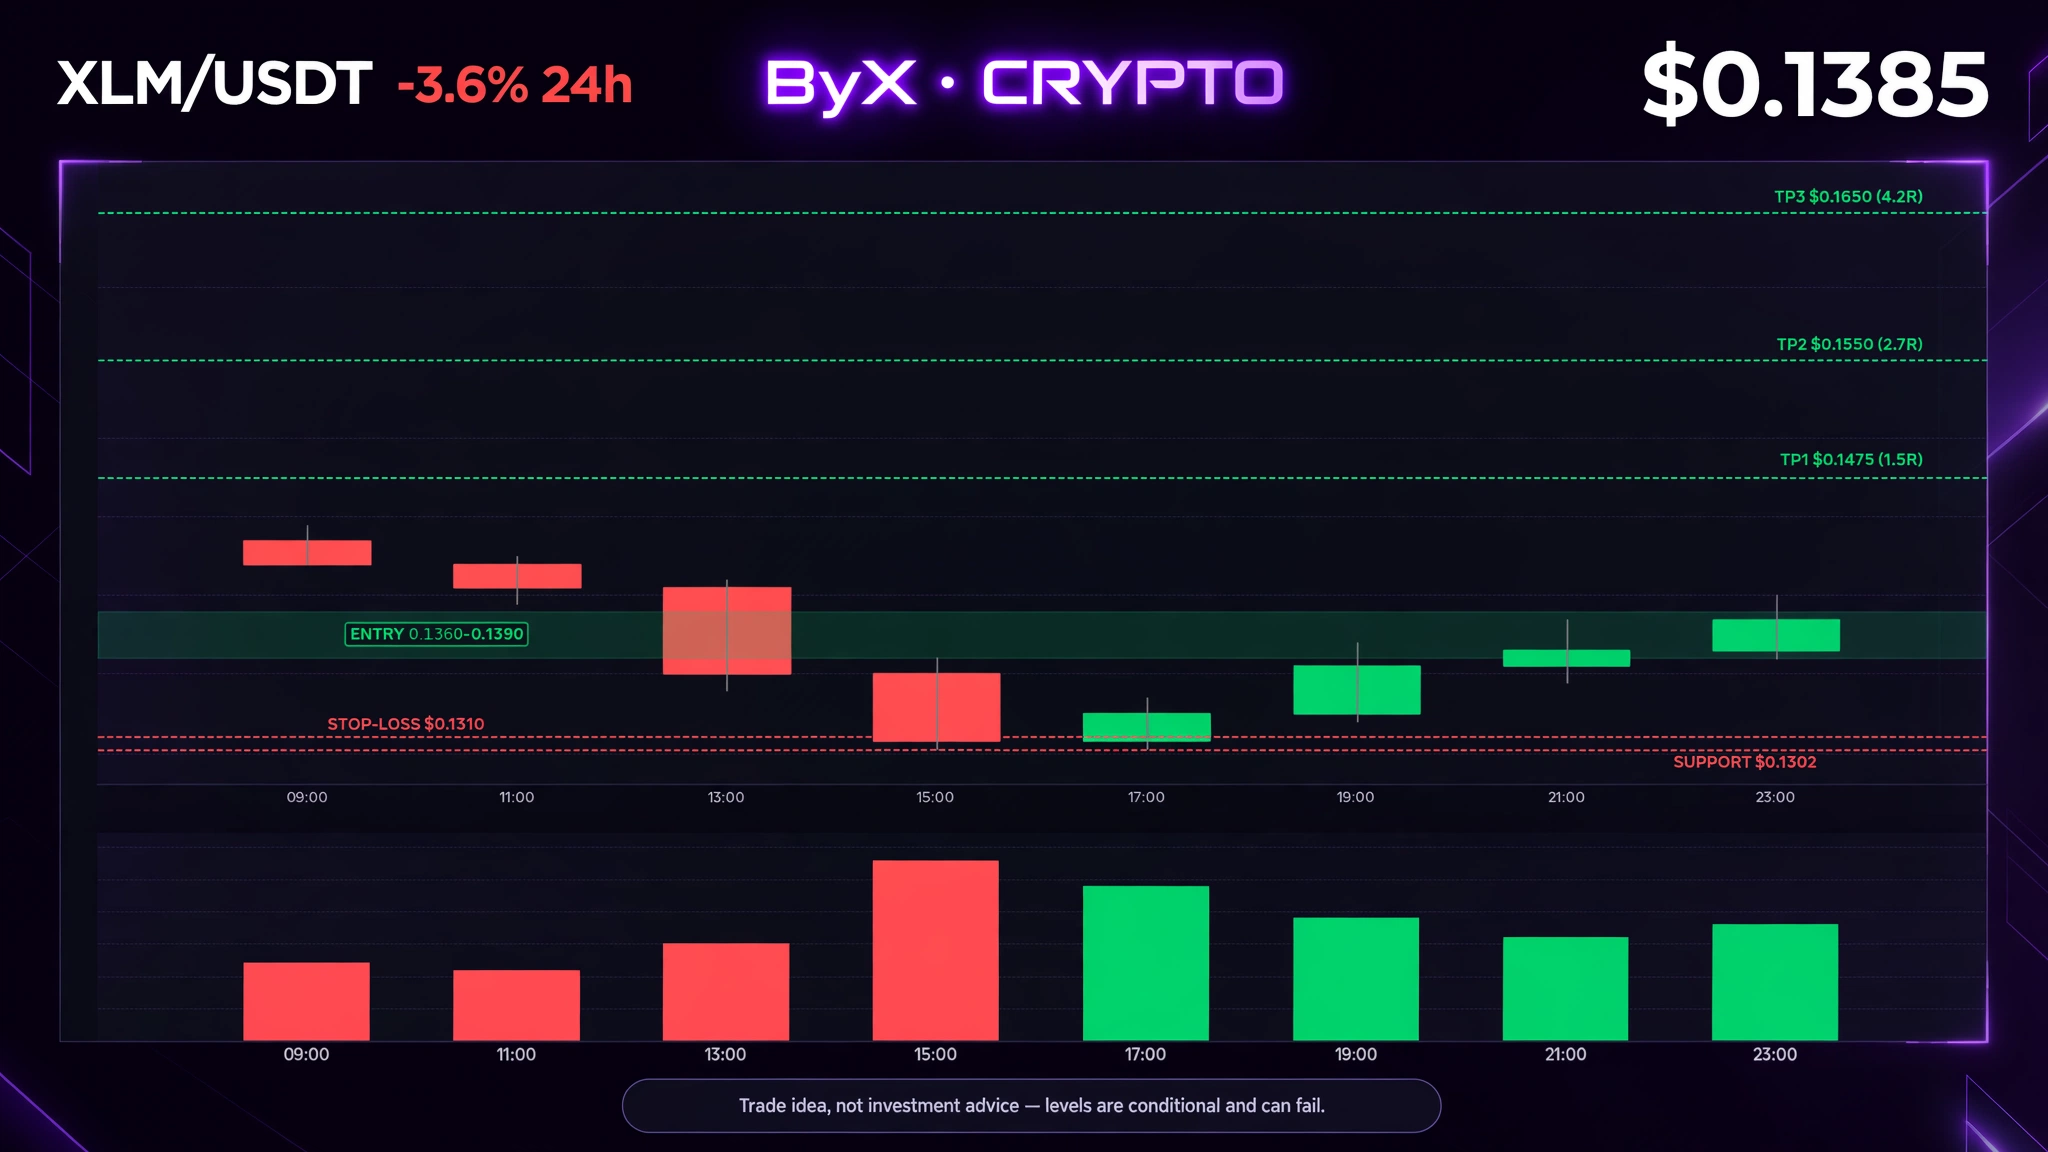
Stellar moved $10.35 billion in September — 5.5x more than a year ago — and XLM just printed a fresh 52-week low. The network has never been busier, the token has never been cheaper in a year — and the market just gave us a $0.1302 wick to decide on. Stellar is the payments chain the old financial system keeps choosing. The DTCC picked Stellar in May as only the second public chain to carry DTC-tokenised securities, live in H1 2027. MetaMask made it a default network on October 29, CME launched XLM futures in February, and US regulators named XLM a digital commodity in March. The numbers are not small. September stablecoin transfer volume hit $10.35 billion, up from $1.89 billion a year earlier, and transactions jumped from 7.7 million to 21.7 million. Tokenised assets reached $4.12 billion, up from $674 million — a sixfold rise. The next catalyst is close: the Protocol 30 "Bell" mainnet vote lands November 23 at 17:00 UTC. The macro tape is brutal, and that is why the entry is here. Bitcoin wicked to $62,000 overnight, its lowest since July, and $2.02 billion of positions were liquidated in 24 hours — 86.7% longs, 318,349 traders wiped. Bitcoin ETFs have bled for seven straight sessions, and the market prices an 88.5% chance the Fed hikes on December 9. Technically, XLM flushed to $0.1302, then reclaimed $0.138 within hours — a 6% snap off the low. The 14-day RSI sat near 29 before the flush, deep oversold, and funding is negative at -0.02% per 8 hours — shorts paying longs. Both moving averages sit near $0.18, far overhead, so this is a counter-trend bounce trade, not a reversal call. The trade: long XLM, entry $0.1360–$0.1390, stop $0.1310 under today's low. TP1 $0.1475 (1.5R) takes back the November 13 level. TP2 $0.1550 (2.7R) clears the November 11 high. TP3 $0.1650 (4.2R) starts the walk toward the averages. Timeframe 1–3 days on the 4h; invalidation is a 4h close under $0.1310. Bull case: usage is compounding — 5.5x transfer volume, 6x tokenised assets, a DTCC pipeline in H1 2027 and a Bell vote in eight days give buyers a real story once forced selling stops, and a negative-funding squeeze can carry XLM to $0.155 fast. Bear case: the macro tape owns everything — another Bitcoin leg toward $60,000 drags XLM through $0.1302, Coinbase suspends the XLM/BTC pair on November 25, and a coin 85% below its 2018 high has taught holders cheap can always get cheaper. So which side are you on — A) the network is winning and $0.13 was the bottom, or B) the macro tape wins and XLM makes a new low? $XLMUSDT #ByXIMPACT #IMPACTbyTrade Trade idea, not investment advice — levels are conditional and can fail.
UNI flushed to $4.72 overnight — then ripped 7% in four hours while Bitcoin kept bleeding. Uniswap is the biggest decentralised exchange in crypto, the venue where more than $4.5 trillion of swaps have settled since launch. Its token UNI trades at $5.03 this morning — down 9% on the day, down 29% in seven days and 89% below its $44.92 all-time high. Yet the protocol has never been busier: traders paid $2.14 million in Uniswap fees in the last 24 hours and $73.8 million in the last 30 days, and since the fee switch went live a slice of every fee buys UNI and burns it forever. The tape tells the story. UNI slid from $5.62 to $4.72 in a day — a 16% peak-to-trough flush — then buyers stepped in hard, lifting it from $4.72 to $5.06 in four hours on $669 million of 24-hour volume. Funding on OKX flipped negative at -0.0083% per 8 hours, so shorts are now paying longs to stay short, while open interest on OKX sits at just $30.5 million — the crowd has already left. The trade (24–48 hours, long the bounce): entry $4.95–$5.05, stop-loss $4.70 below the overnight low, TP1 $5.45 (1.5R), TP2 $5.75 (2.5R), TP3 $6.05 (3.5R). Timeframe 24–48 hours; indicators: 4-hour bounce structure, funding flip, 24-hour range $4.72–$5.62. Bull case: the $4.72 low holds, shorts keep paying, and a reclaim of the $5.62 daily high opens $6.05 fast. Bear case: Bitcoin loses $64,000, the $4.72 low gives way, and UNI slides back toward $4.00. A — UNI holds $4.70 and runs to $6.05. B — the bounce fails and $4.72 breaks. Which side are you on? $UNIUSDT #ByXIMPACT #IMPACTbyTrade Trade idea, not investment advice — levels are conditional and can fail.
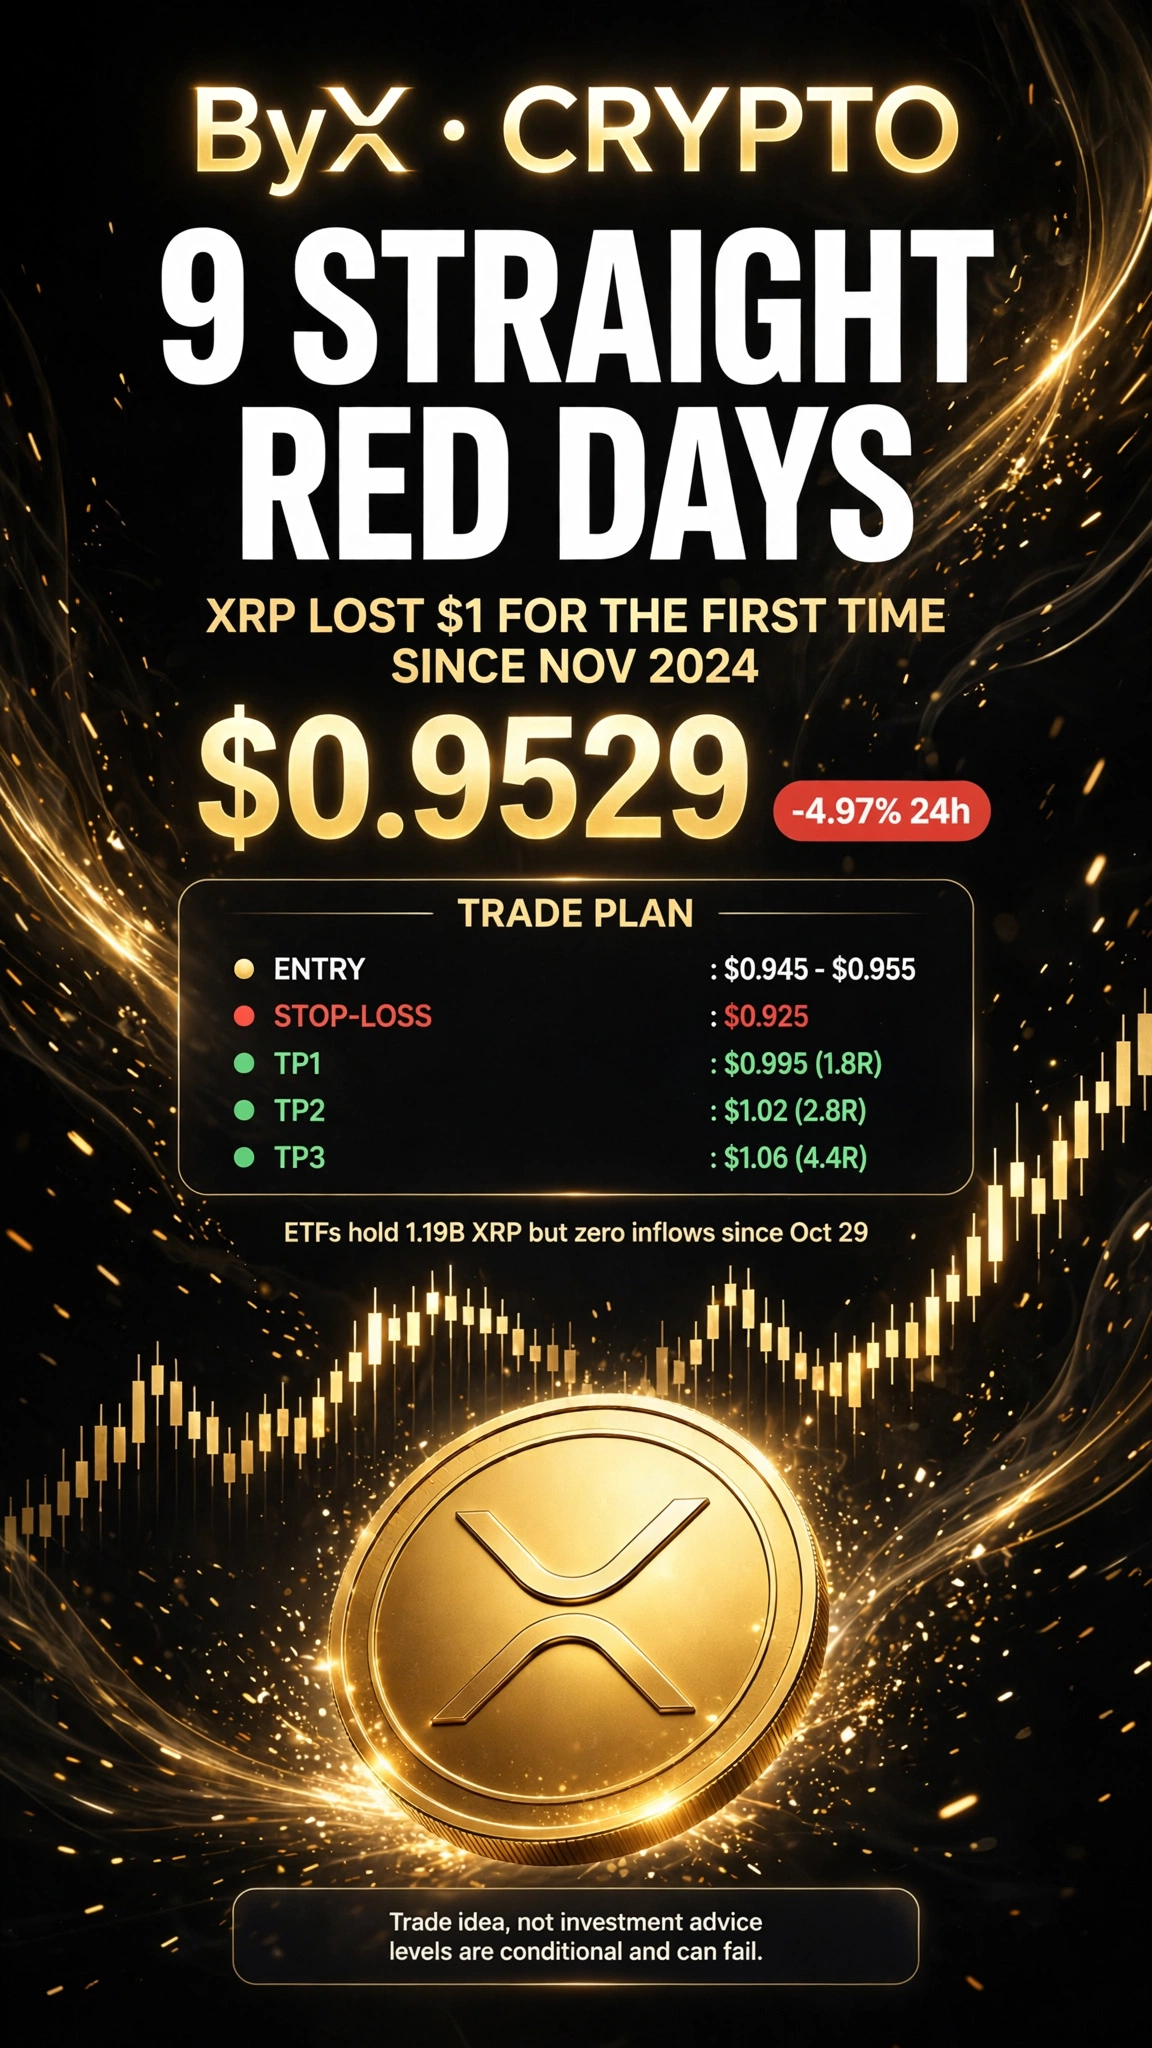
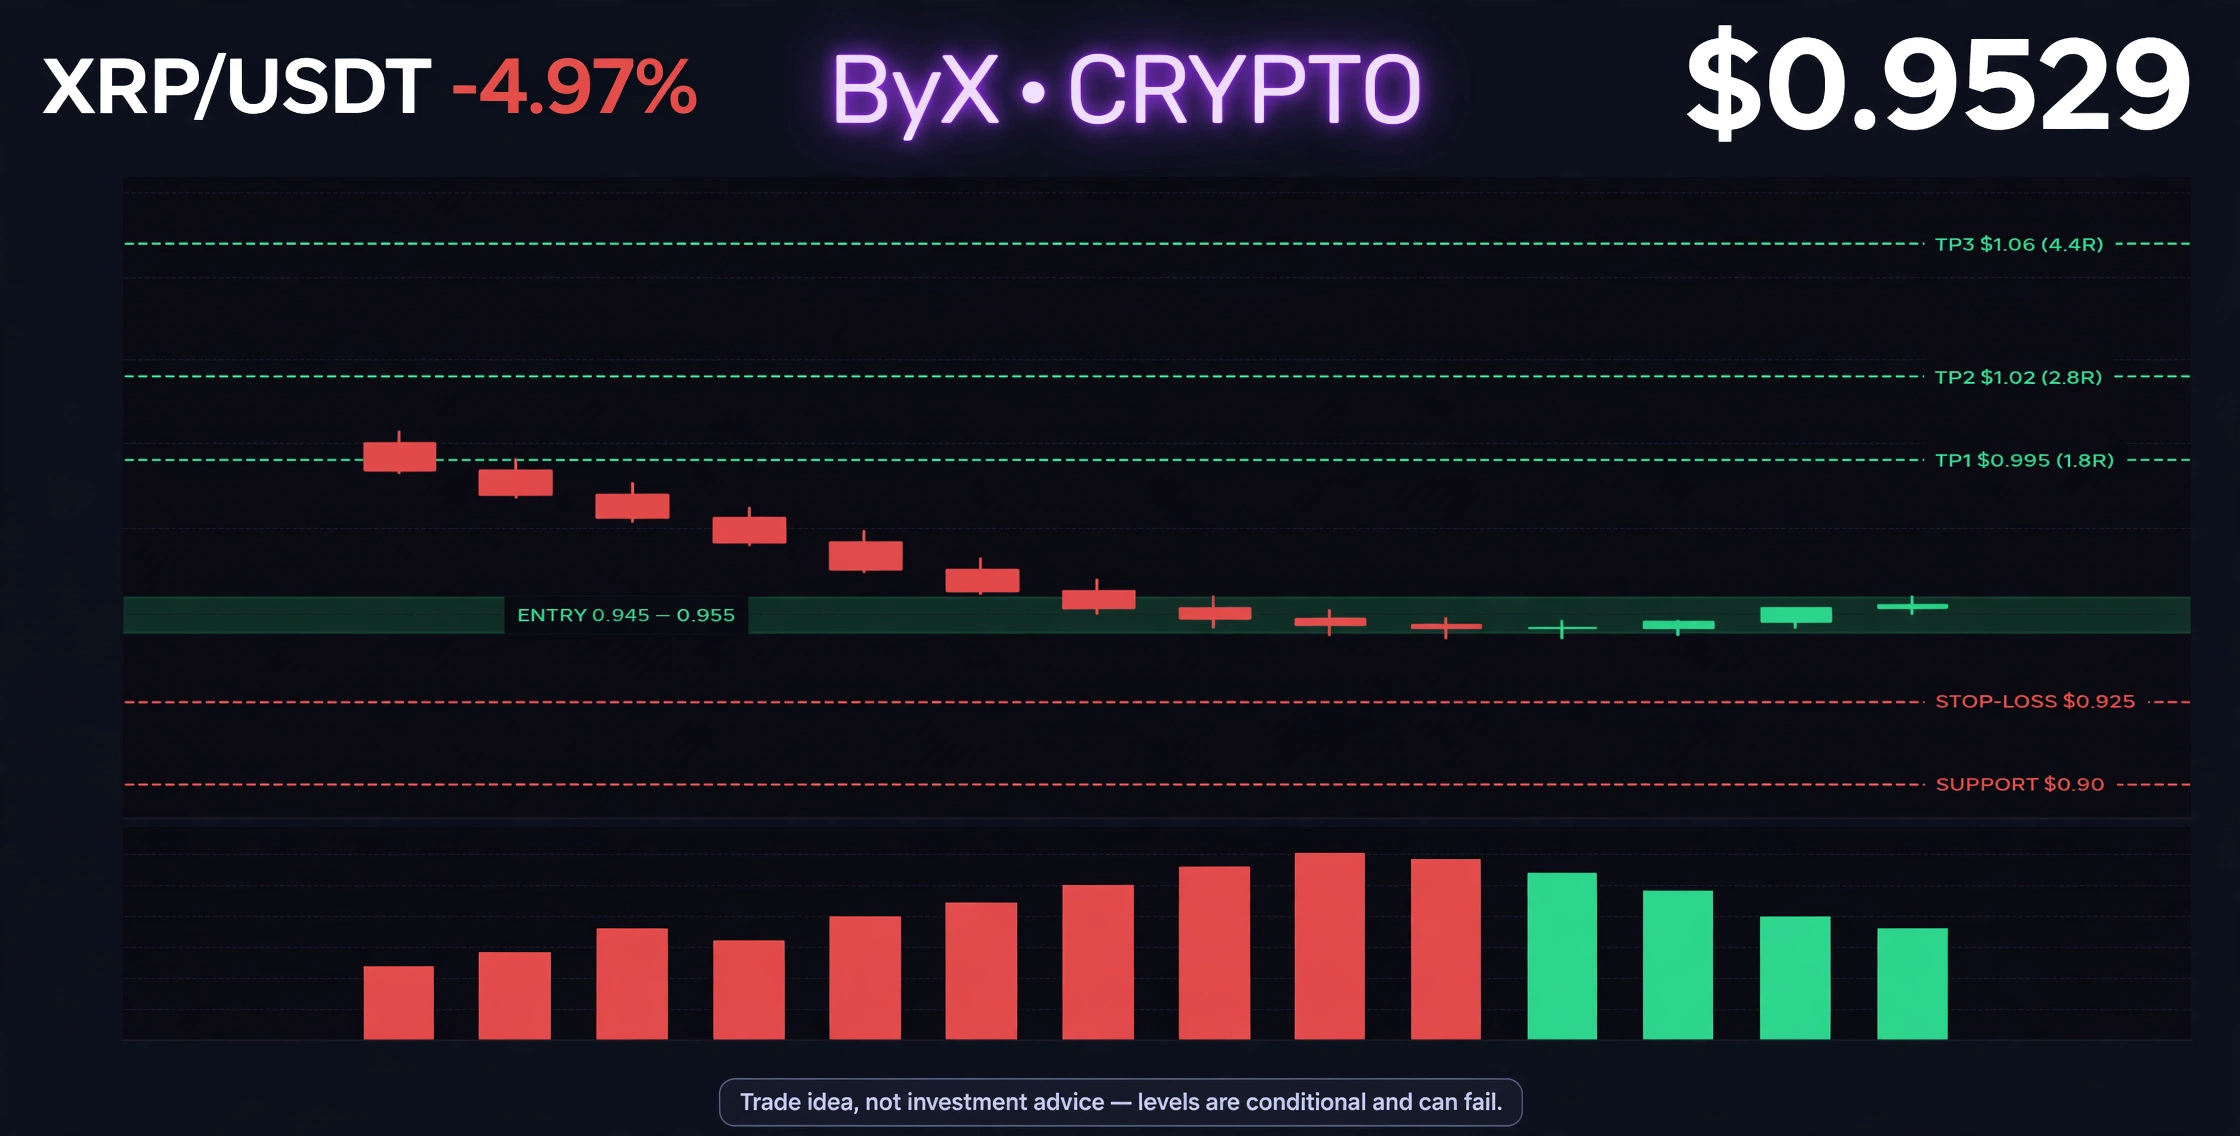
9 straight red days — and XRP just lost $1 for the first time since November 2024. XRP is Ripple's cross-border payments token, the coin banks and payment firms actually use to move money. This week it did something it has not done in two years: it closed below the $1 line and kept sliding, printing a low near $0.98 and trading at $0.9529 this morning, down 18% in seven days and 20% in thirty. The catalyst is a birthday nobody is celebrating. The US spot XRP ETFs turned one on November 13, holding 1.19 billion XRP worth about $1.16 billion — yet they have not taken a single dollar of net inflow since October 29. November alone has seen $19.1 million walk out, the largest weekly outflow in eight months, and $27 million of XRP derivatives were liquidated in 24 hours, 97% of them longs. XRP has even dropped out of the top five coins by market cap, overtaken by USDC. The trade: long the fear, not the bounce. Entry $0.945–$0.955, stop-loss $0.925 below Friday's low, TP1 $0.995 (1.8R), TP2 $1.02 (2.8R), TP3 $1.06 (4.4R). Timeframe: 24–48 hours, Bollinger Bands and the $1.00 psychological level. Bull case: nine red days is exhaustion, not strength — the lower Bollinger Band sits at $0.90, and a reclaim of $1.00 flips every short seller into a buyer. Bear case: ETF outflows keep bleeding, and Ripple's final 1 billion XRP escrow unlock lands December 1. If $0.90 breaks, $0.85 comes fast. A — $1.00 is reclaimed by Monday. B — $0.90 breaks first. Which side are you on? $XRPUSDT #ByXIMPACT #IMPACTbyTrade Trade idea, not investment advice — levels are conditional and can fail.
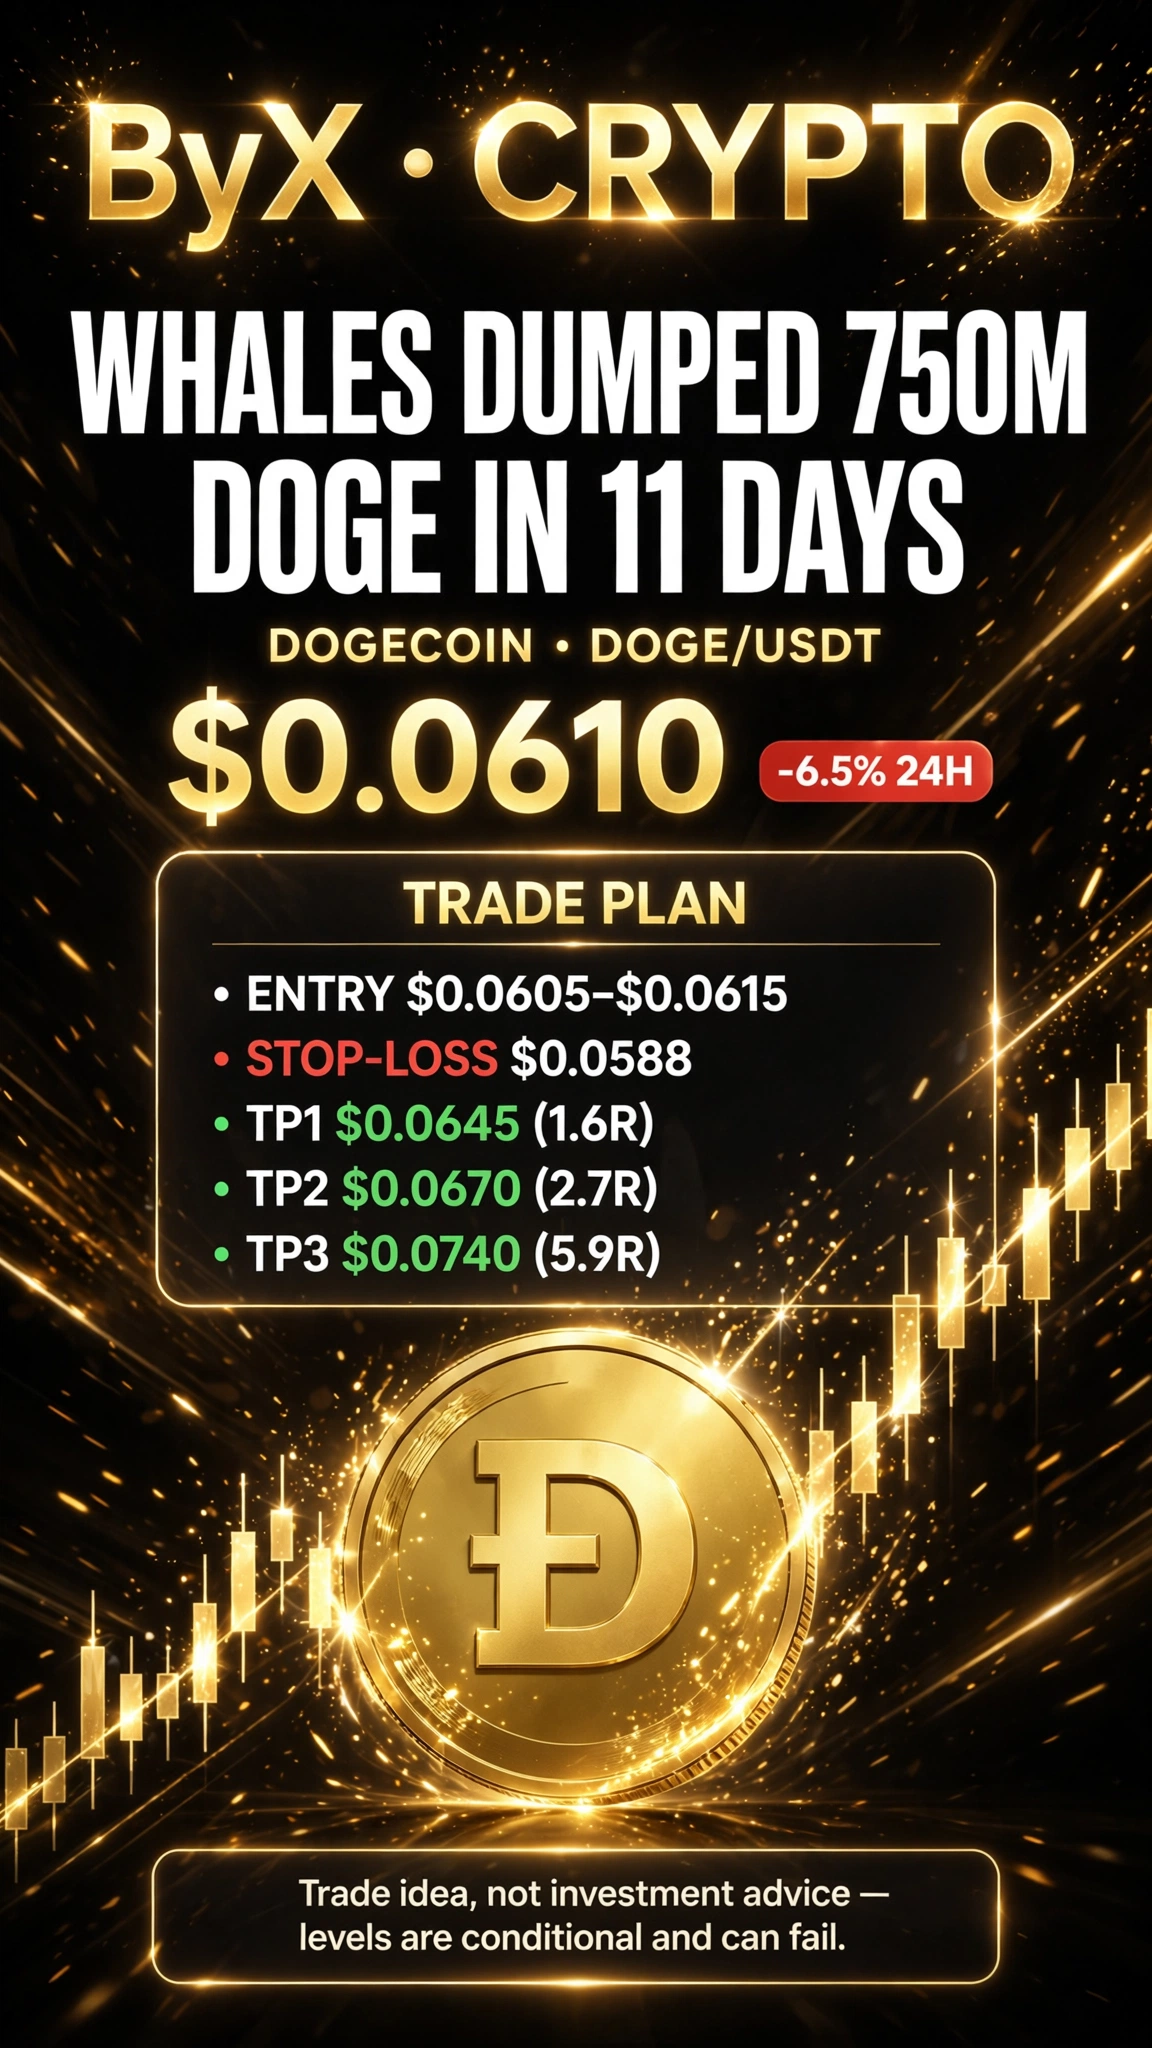
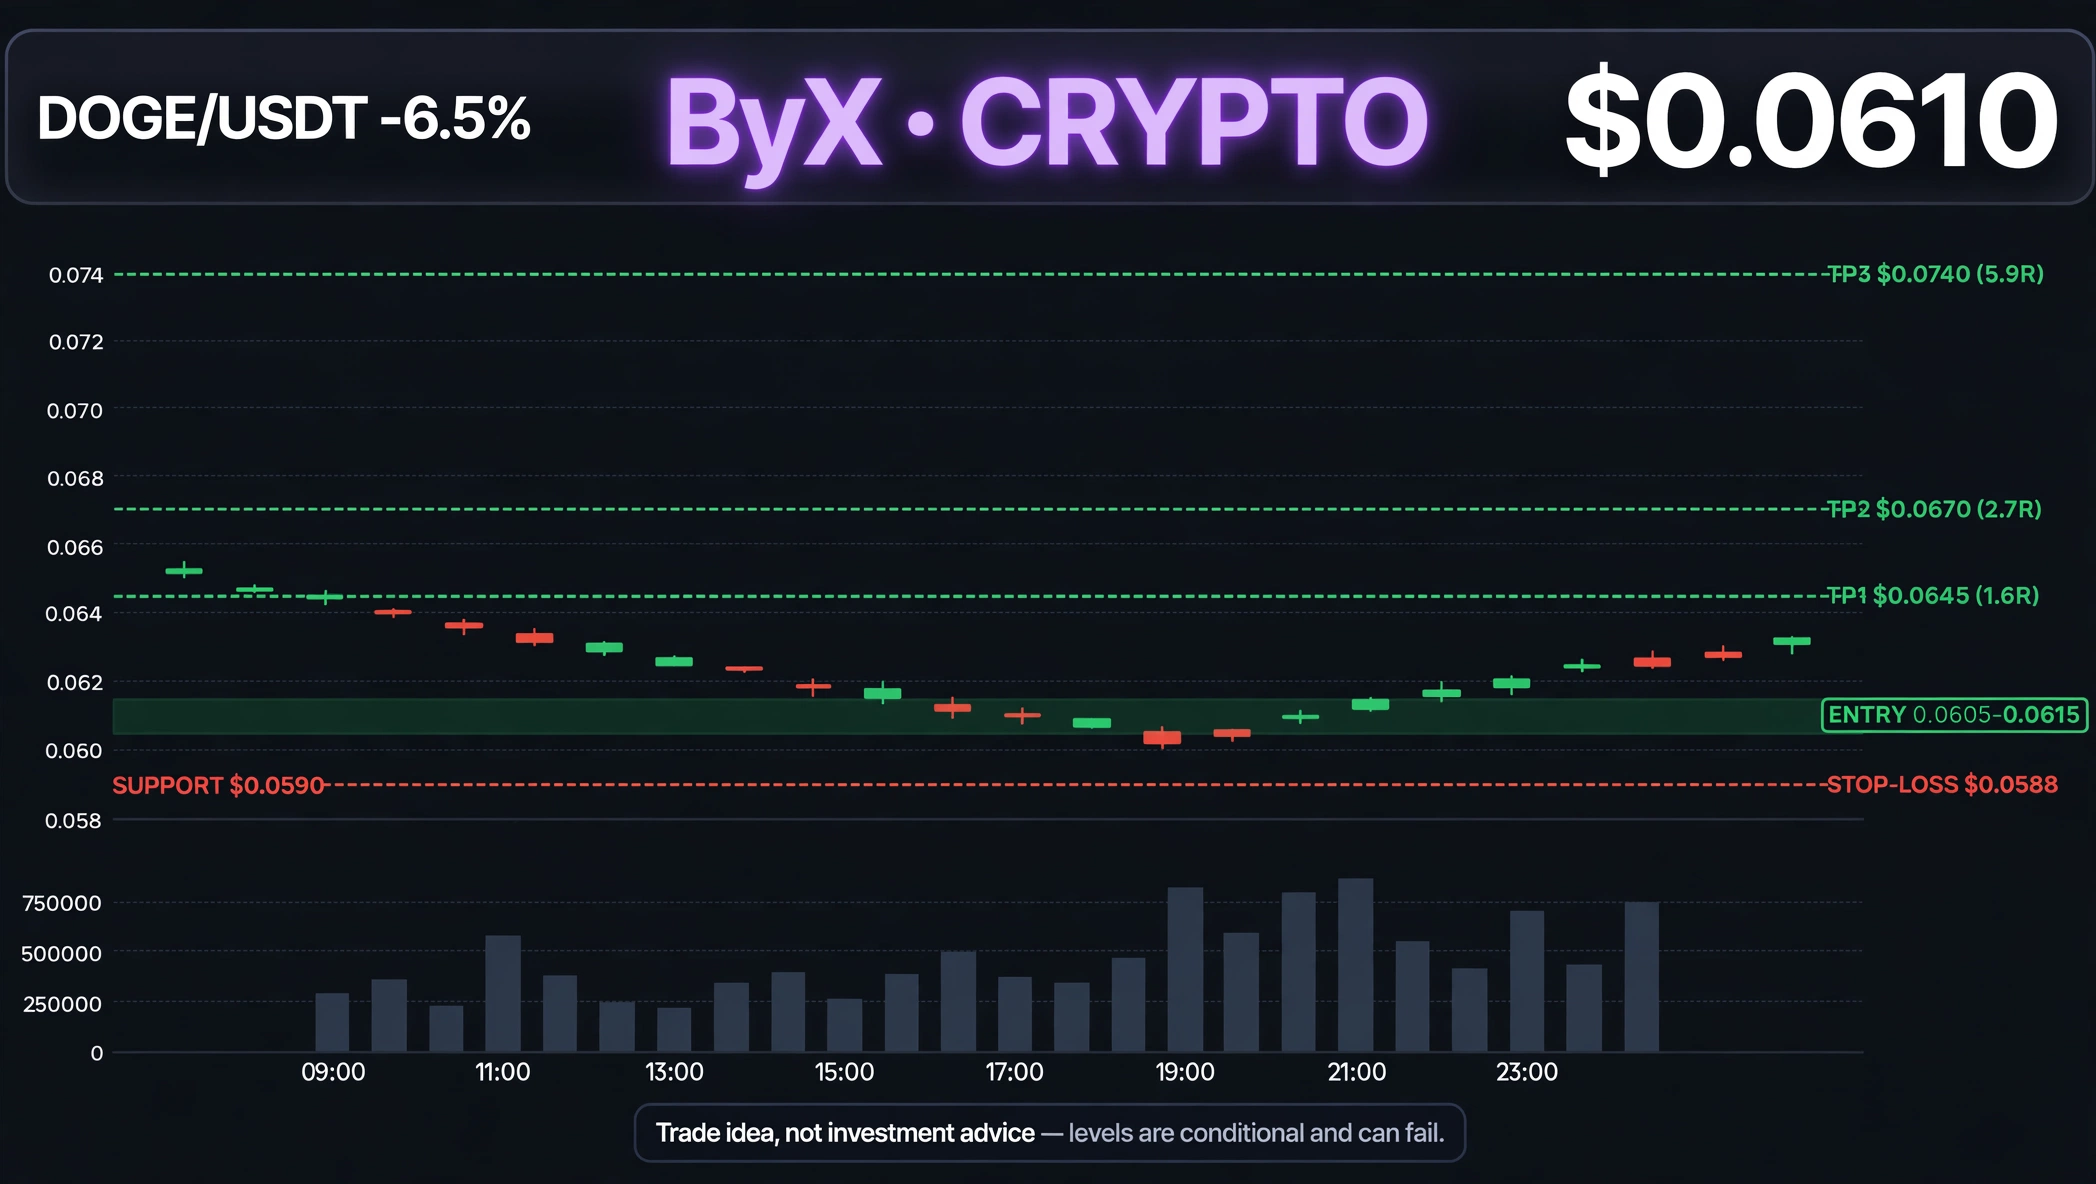
Whales dumped 750 million DOGE in 11 days — and Dogecoin's new app layer just finished its audits anyway. Dogecoin is the original memecoin, a 2013 joke now crypto's 12th-largest asset at a $9.8 billion market cap. It trades at $0.0610, down 6.5% today, about 12% this week, after printing $0.0604 — its lowest since October 2023. Santiment shows wallets holding 100,000–100 million DOGE sold about 750 million tokens since November 3. Open interest fell to $841.3 million, down 8.37% in two days, while $1.81 million in positions liquidated in 24 hours, 65.9% longs. RSI reads 24.6, and DOGE has fallen seven straight weeks — down 40% since September 22. But the building has not stopped. DogeOS, the EVM-compatible app layer bringing DeFi, prediction markets and games to Dogecoin — with DOGE paying the fees — finished version-one development and audits on November 12. Its public testnet has run since September 30 with 100-plus builders, and no mainnet date yet. The trade (swing, 1–3 days): LONG DOGE $0.0605–$0.0615, stop-loss $0.0588. TP1 $0.0645 (1.6R), TP2 $0.0670 (2.7R), TP3 $0.0740 (5.9R). The stop sits under Ali Martinez's $0.059 channel bottom; TP3 is his mid-channel target. Bull case: RSI 24.6 with a held $0.059 channel bottom is behind every DOGE bounce this year, and one DogeOS mainnet date could re-rate a coin 91% below its all-time high. Bear case: whales are still selling, DOGE ETFs have seen zero flows since mid-October, and a break below $0.059 opens $0.04. Which side wins — does DOGE bounce off $0.059 and ride DogeOS to $0.074, or do the whales keep selling it to $0.04? $DOGEUSDT #ByXIMPACT #IMPACTbyTrade Trade idea, not investment advice — levels are conditional and can fail.
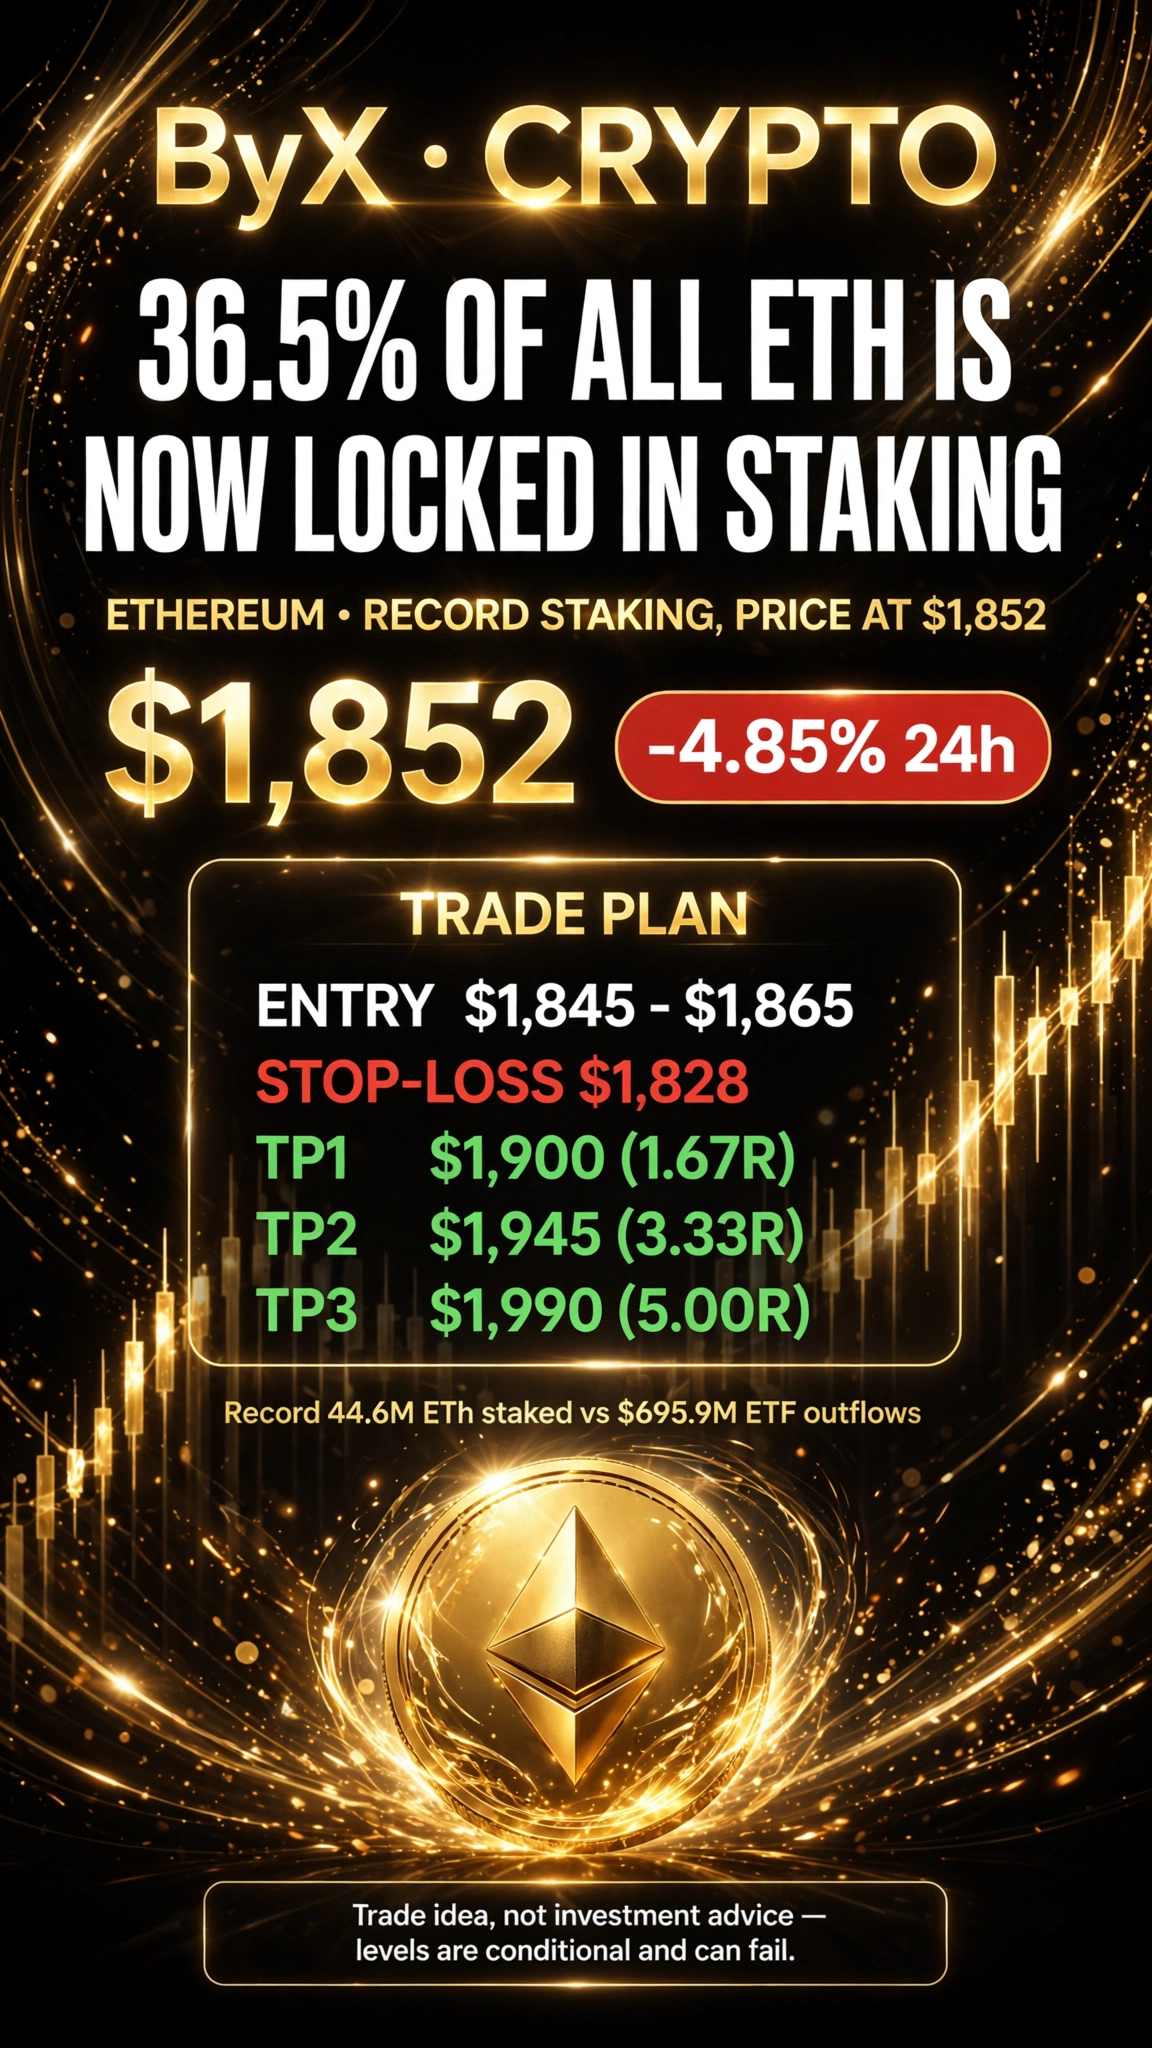
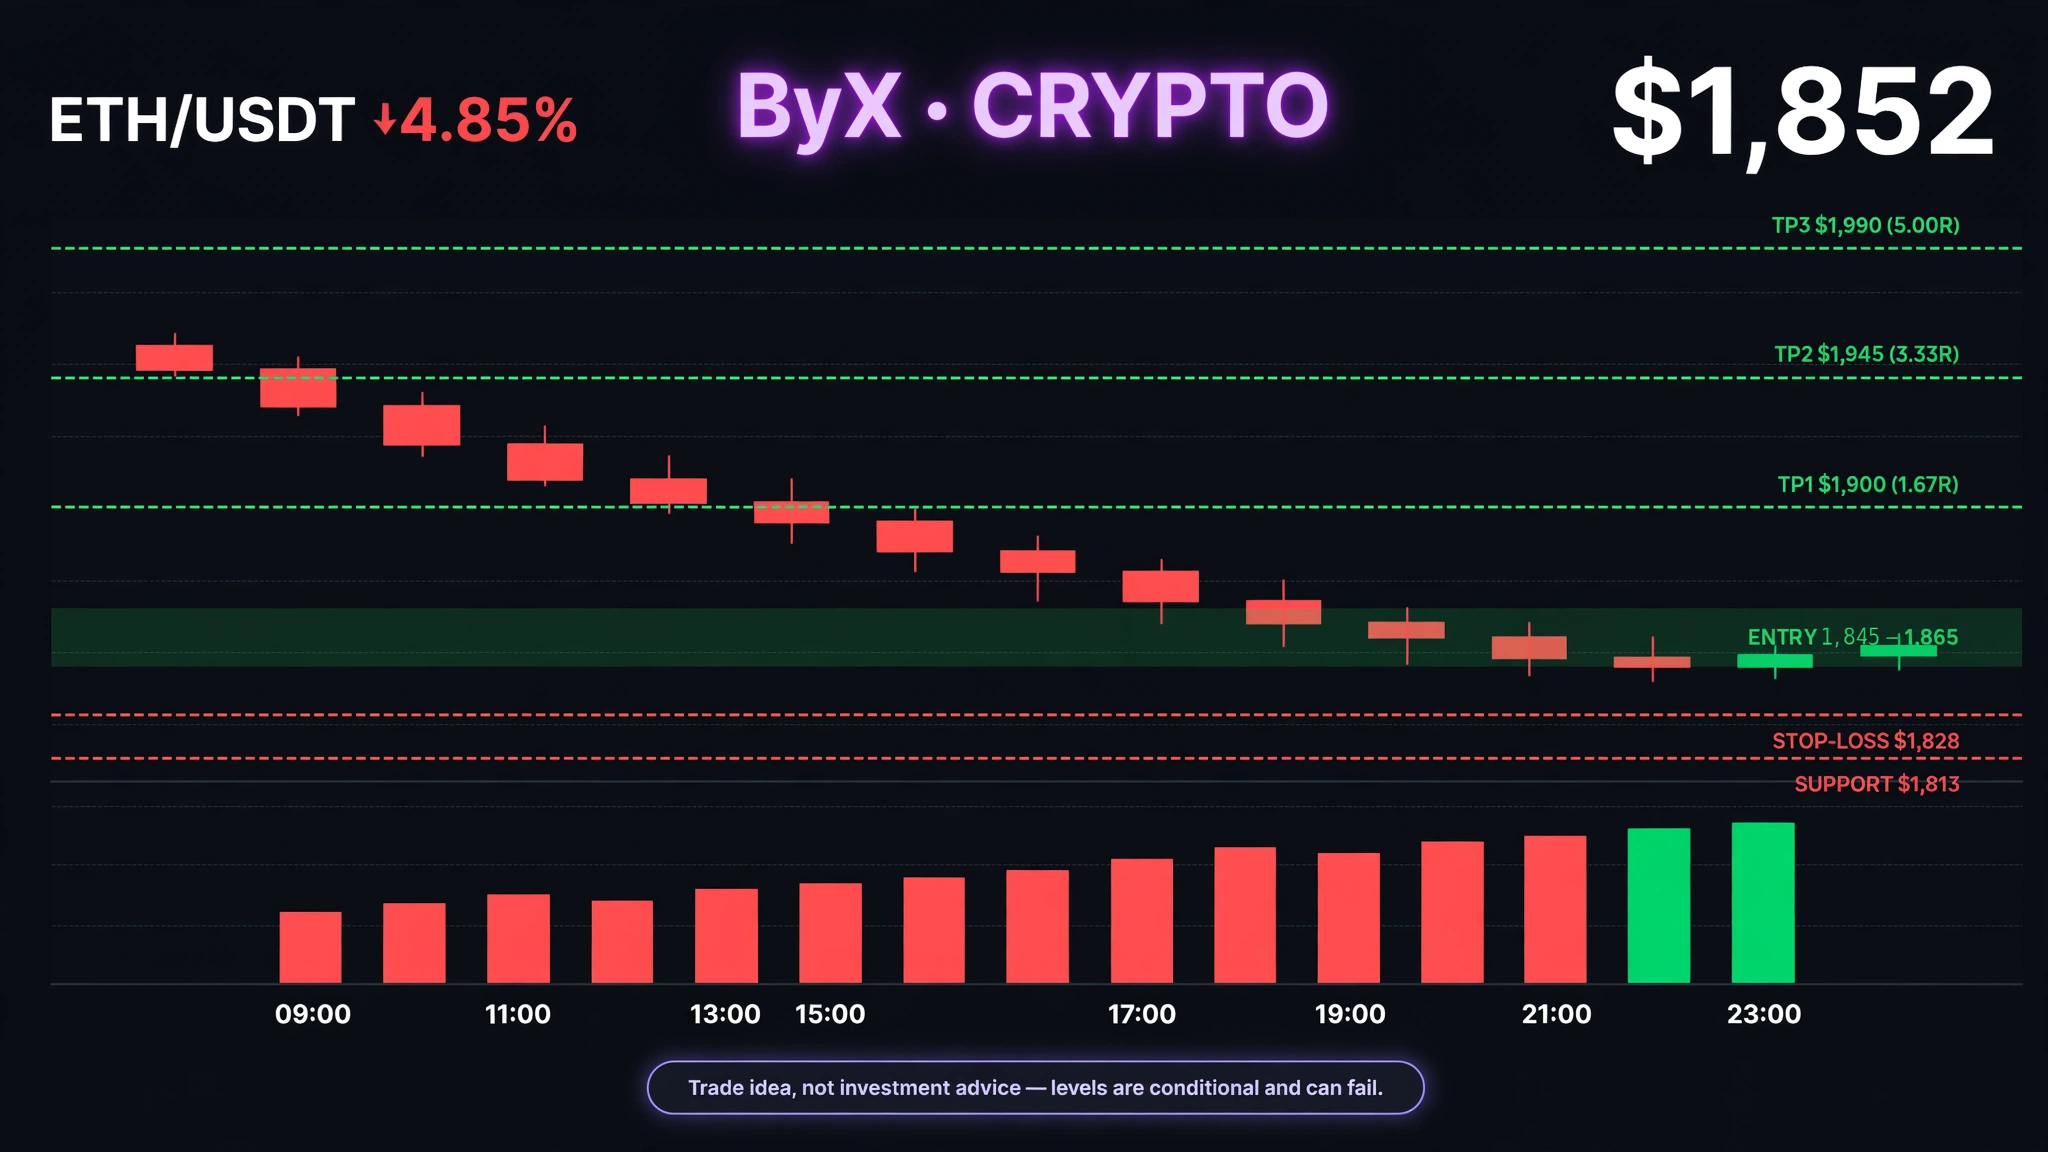
36.5% of all ETH is now locked in staking — a record high — and the price still crashed to $1,852. Ethereum is crypto's second-largest coin and the backbone of DeFi and tokenised assets. While Wall Street sold, its holders locked their coins away — both sides now fighting over the $1,850 line. The staking queue tells the story. A record 44.6 million ETH — 36.5% of supply — is staked, up from 32.4% in June, with 904,393 ETH waiting to enter. The selling is just as loud: US spot ETH ETFs bled $695.9 million in November, seven of eight sessions red, BlackRock alone shedding $274.1 million, and the Ethereum Foundation sold 2,000 ETH on November 13. Derivatives confirm the washout. Open interest fell to $23.08 billion, down 3.85% in 24 hours, $241.4 million in ETH positions liquidated in a day, 76% longs, and funding has gone flat at 0.0001%. The daily RSI sits at 23.34 — the most oversold print of the year — ETH below its 200-day average of $2,147, $1,859 the line in the sand. The trade: LONG ETH $1,845–$1,865, stop-loss $1,828. TP1 $1,900 (1.67R), TP2 $1,945 (3.33R), TP3 $1,990 (5.00R). Bull case: record staking removes supply every day, the ETF outflow streak finally broke with a $2.3 million inflow on November 13, and RSI 23 marked every local bottom so far. Bear case: ETFs still bled $400 million this week, the Foundation keeps selling, and below $1,828 the next support is $1,813. So which side wins — does the record staking lock-up hold $1,850 and send ETH back toward $2,000, or does the ETF bleed drag it to $1,813? $ETHUSDT #ByXIMPACT #IMPACTbyTrade Trade idea, not investment advice — levels are conditional and can fail.
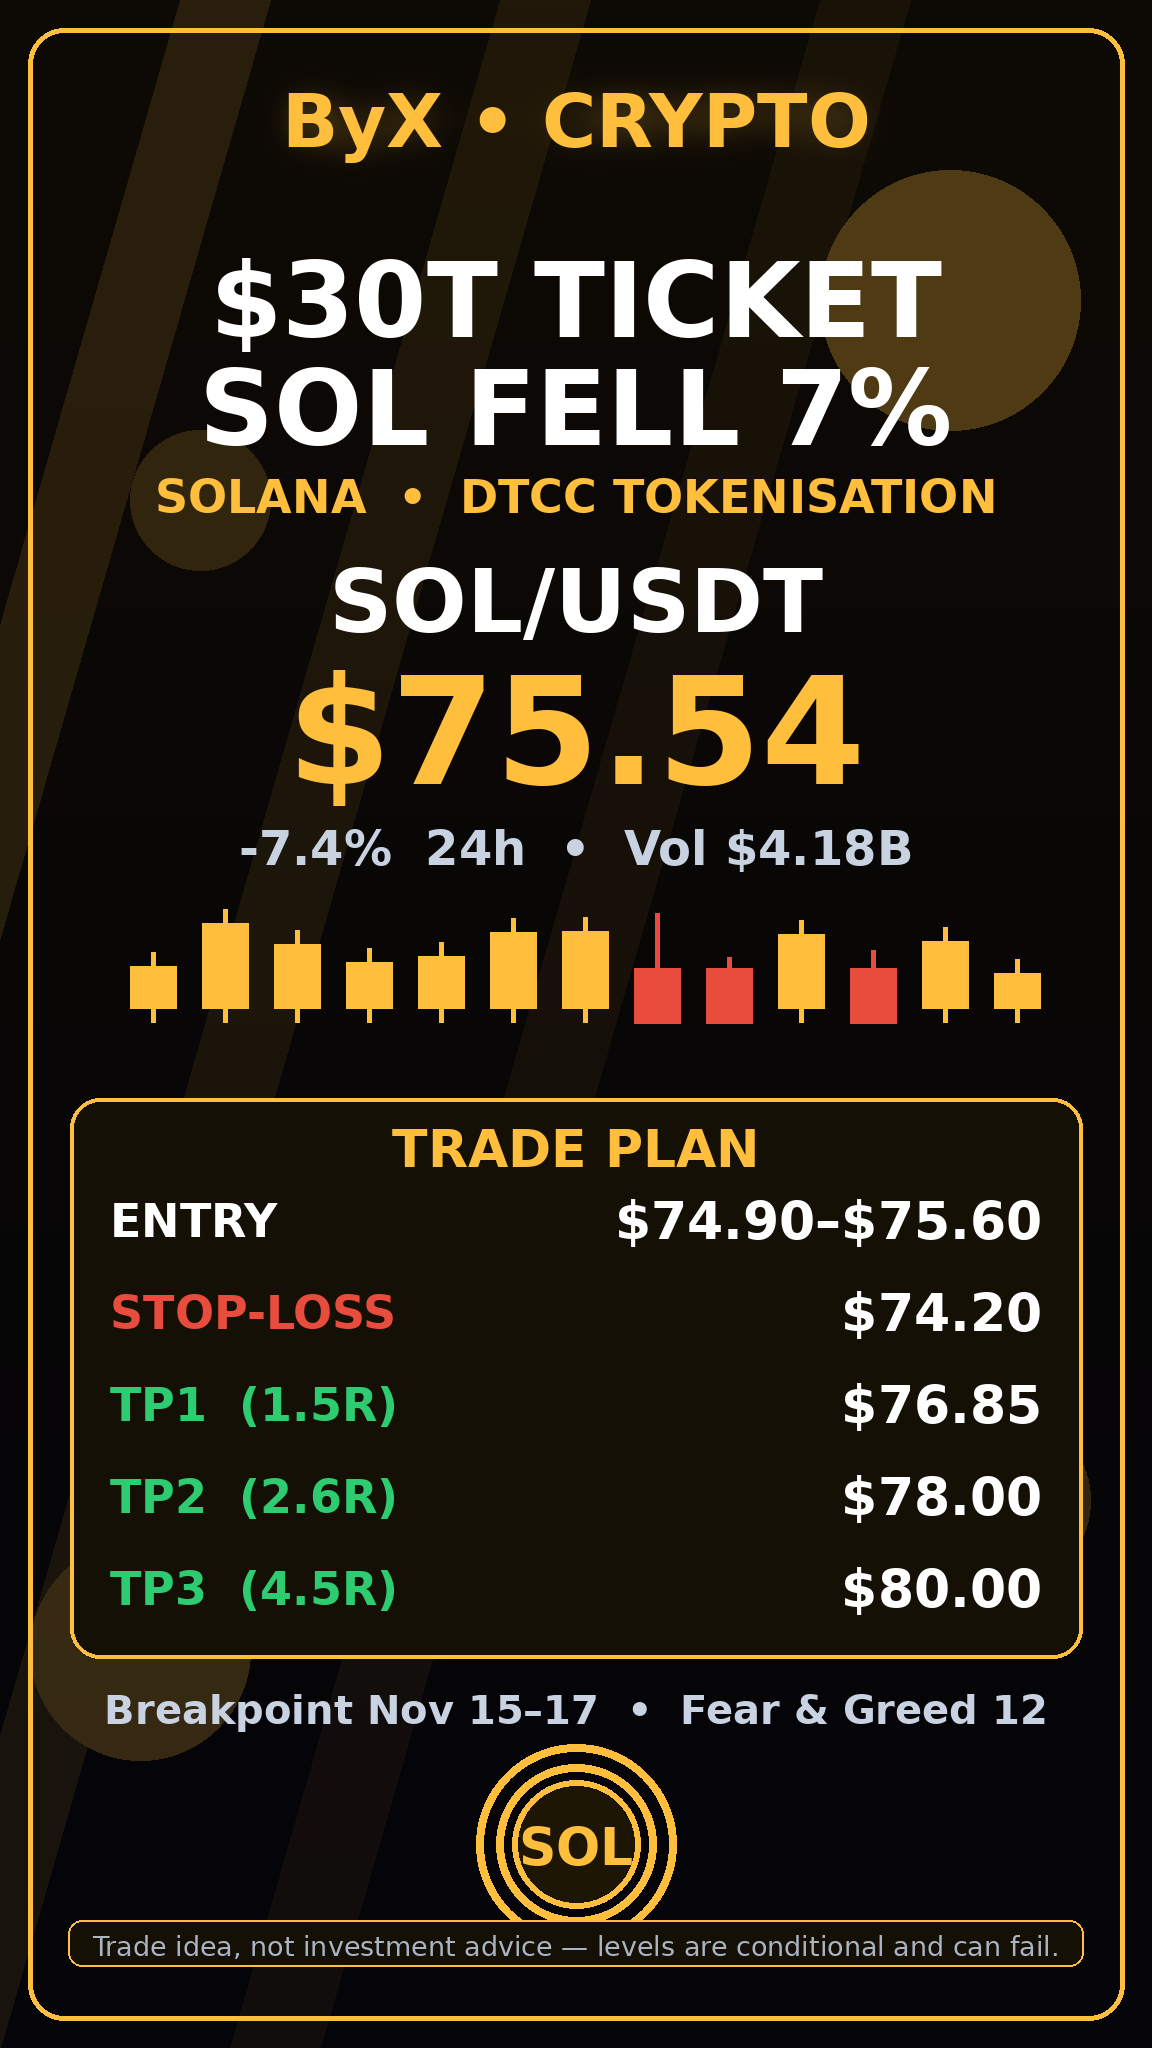
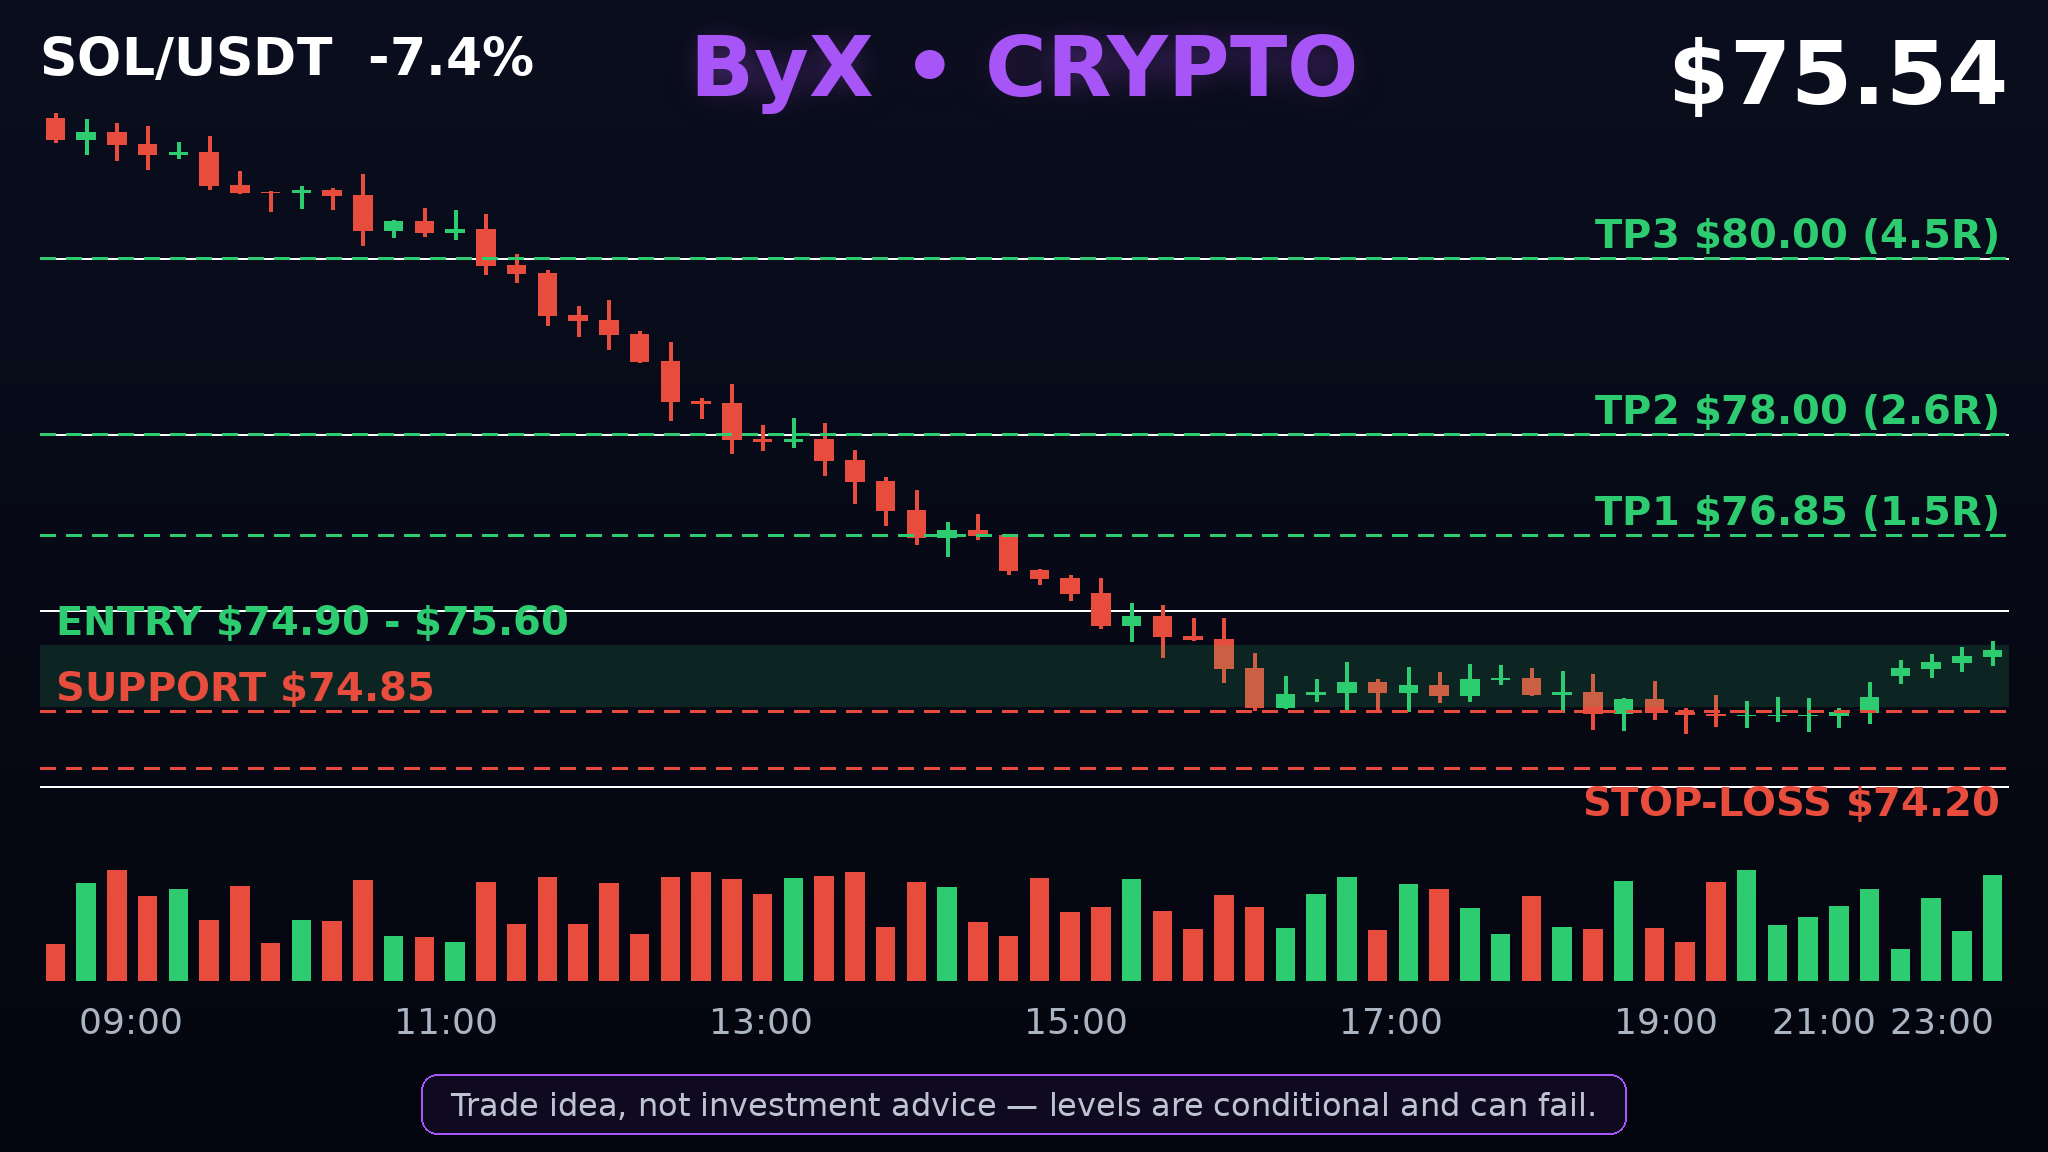
DTCC just handed Solana a $30 trillion tokenisation ticket — and SOL answered by falling 7% to $75. Solana is the high-speed layer-1 hosting $4.82B of DeFi. On November 12 the DTCC said its Tokenisation Service will connect to Solana, with DTC-custodied assets moving on-chain in H2 2027. CoinDesk put the eligible securities at roughly $30 trillion. The market yawned. SOL is down 7.4% today to $75.54, down 15.9% in a week and 74% below its $293.31 all-time high. US spot Solana ETFs have bled five straight days — $53.3M out, net assets down to $1.21B. Funding has flipped to -0.0033% per 8 hours, so shorts are paying longs. Open interest is $2.15B, down 15.2% in a week, and $28.23M of SOL was liquidated in 24 hours — 93% longs. The Fear & Greed Index reads 12, extreme fear. And tomorrow Breakpoint London opens — November 15–17, "Token Supercycle" — with the whole ecosystem in one room while the token sits at its lows. Panic at the lows is where bounces are born. The liquidation cluster sits just under today's $74.85 low — fuel for a squeeze if $74.20 holds. Trade — LONG SOL: entry $74.90–$75.60, stop $74.20. TP1 $76.85 (1.5R), TP2 $78.00 (2.6R), TP3 $80.00 (4.5R). 4h structure, support at today's $74.85 low. Bull: Breakpoint headlines land, shorts cover, $76.85 breaks first. Bear: ETF selling continues, $74.20 gives way toward $70.00. A — SOL bounces off $74.85 and reclaims $76.85. B — the bleed continues to $70.00 first. Which side are you on? $SOLUSDT #ByXIMPACT #IMPACTbyTrade Trade idea, not investment advice — levels are conditional and can fail.
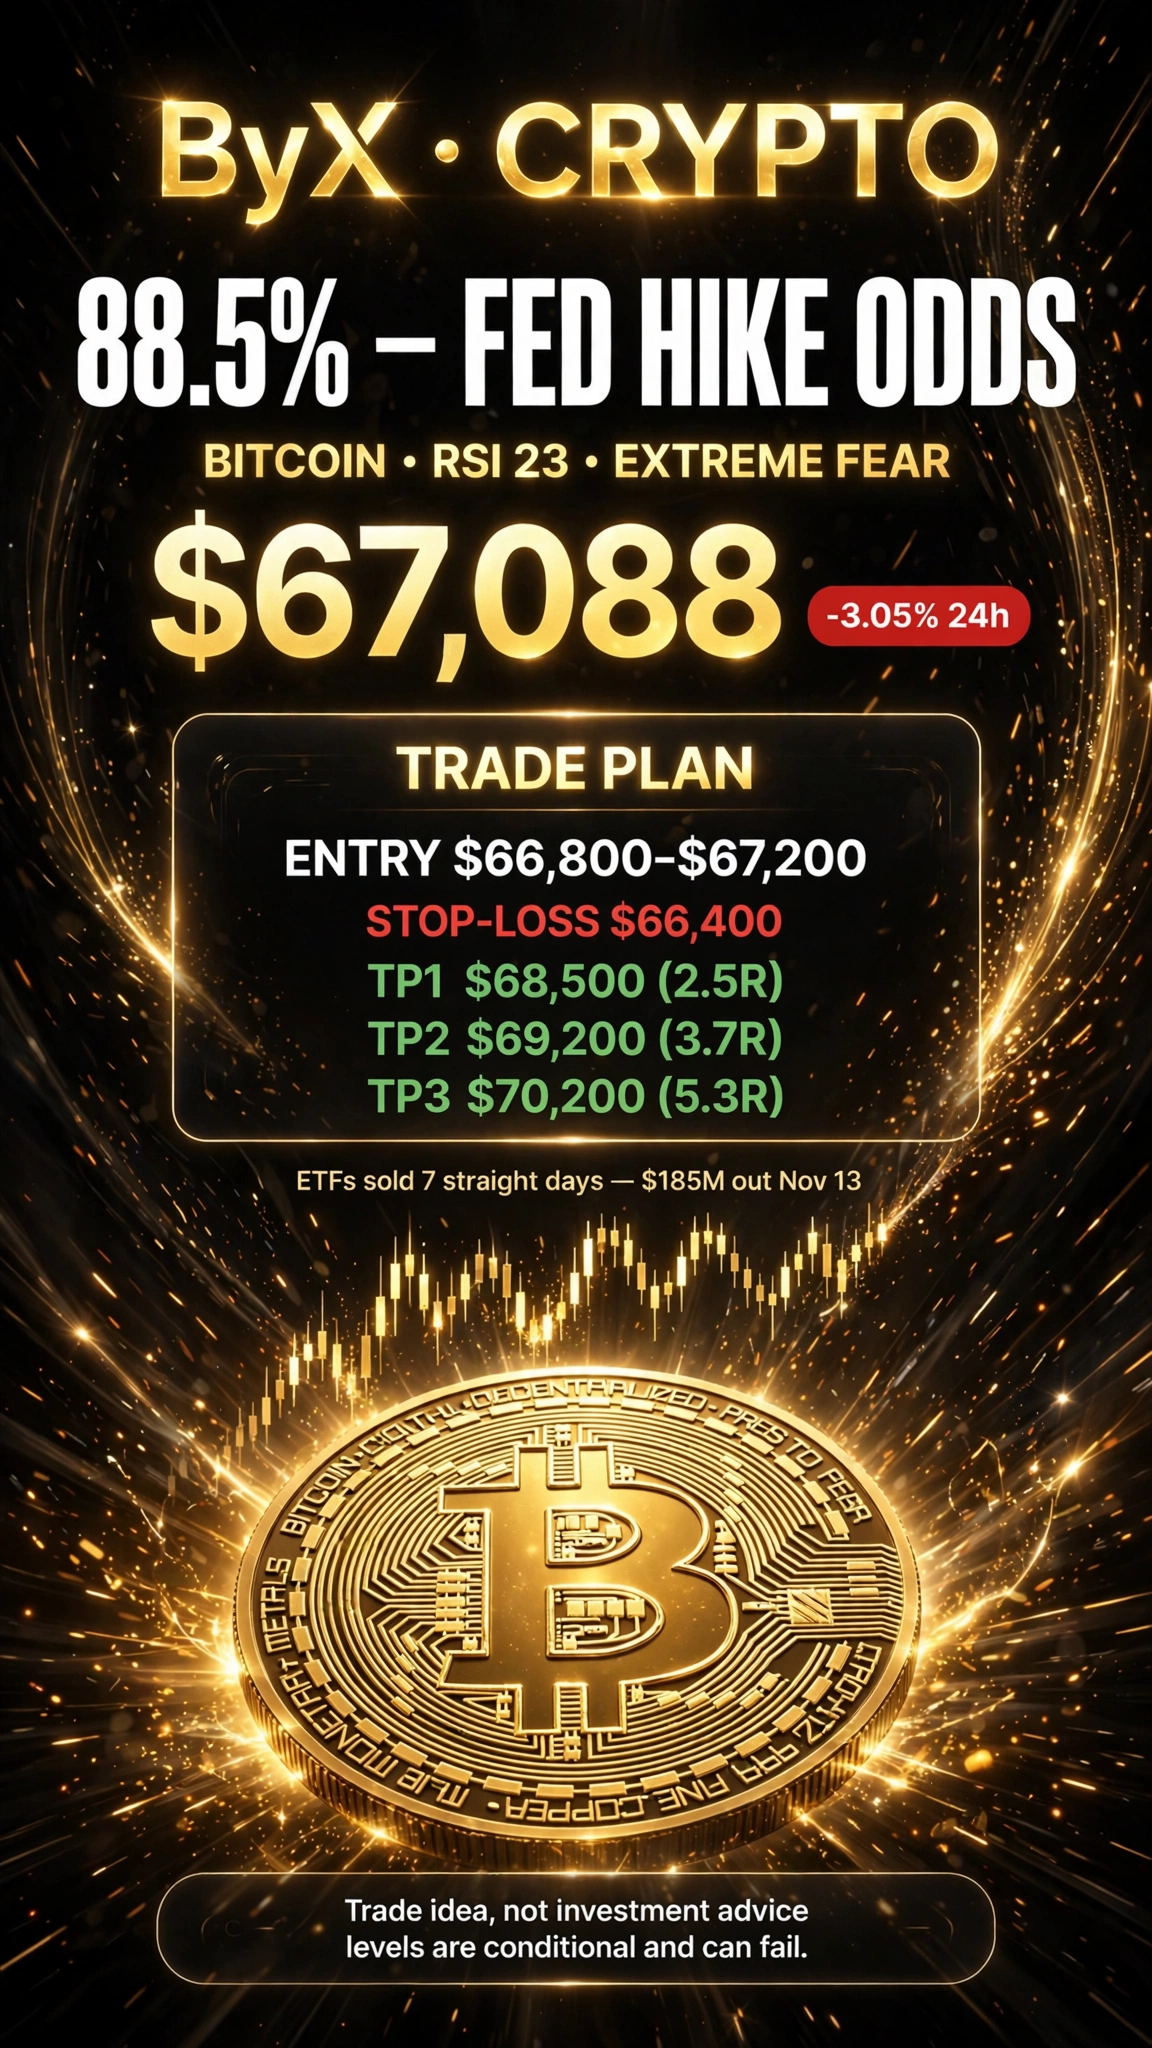
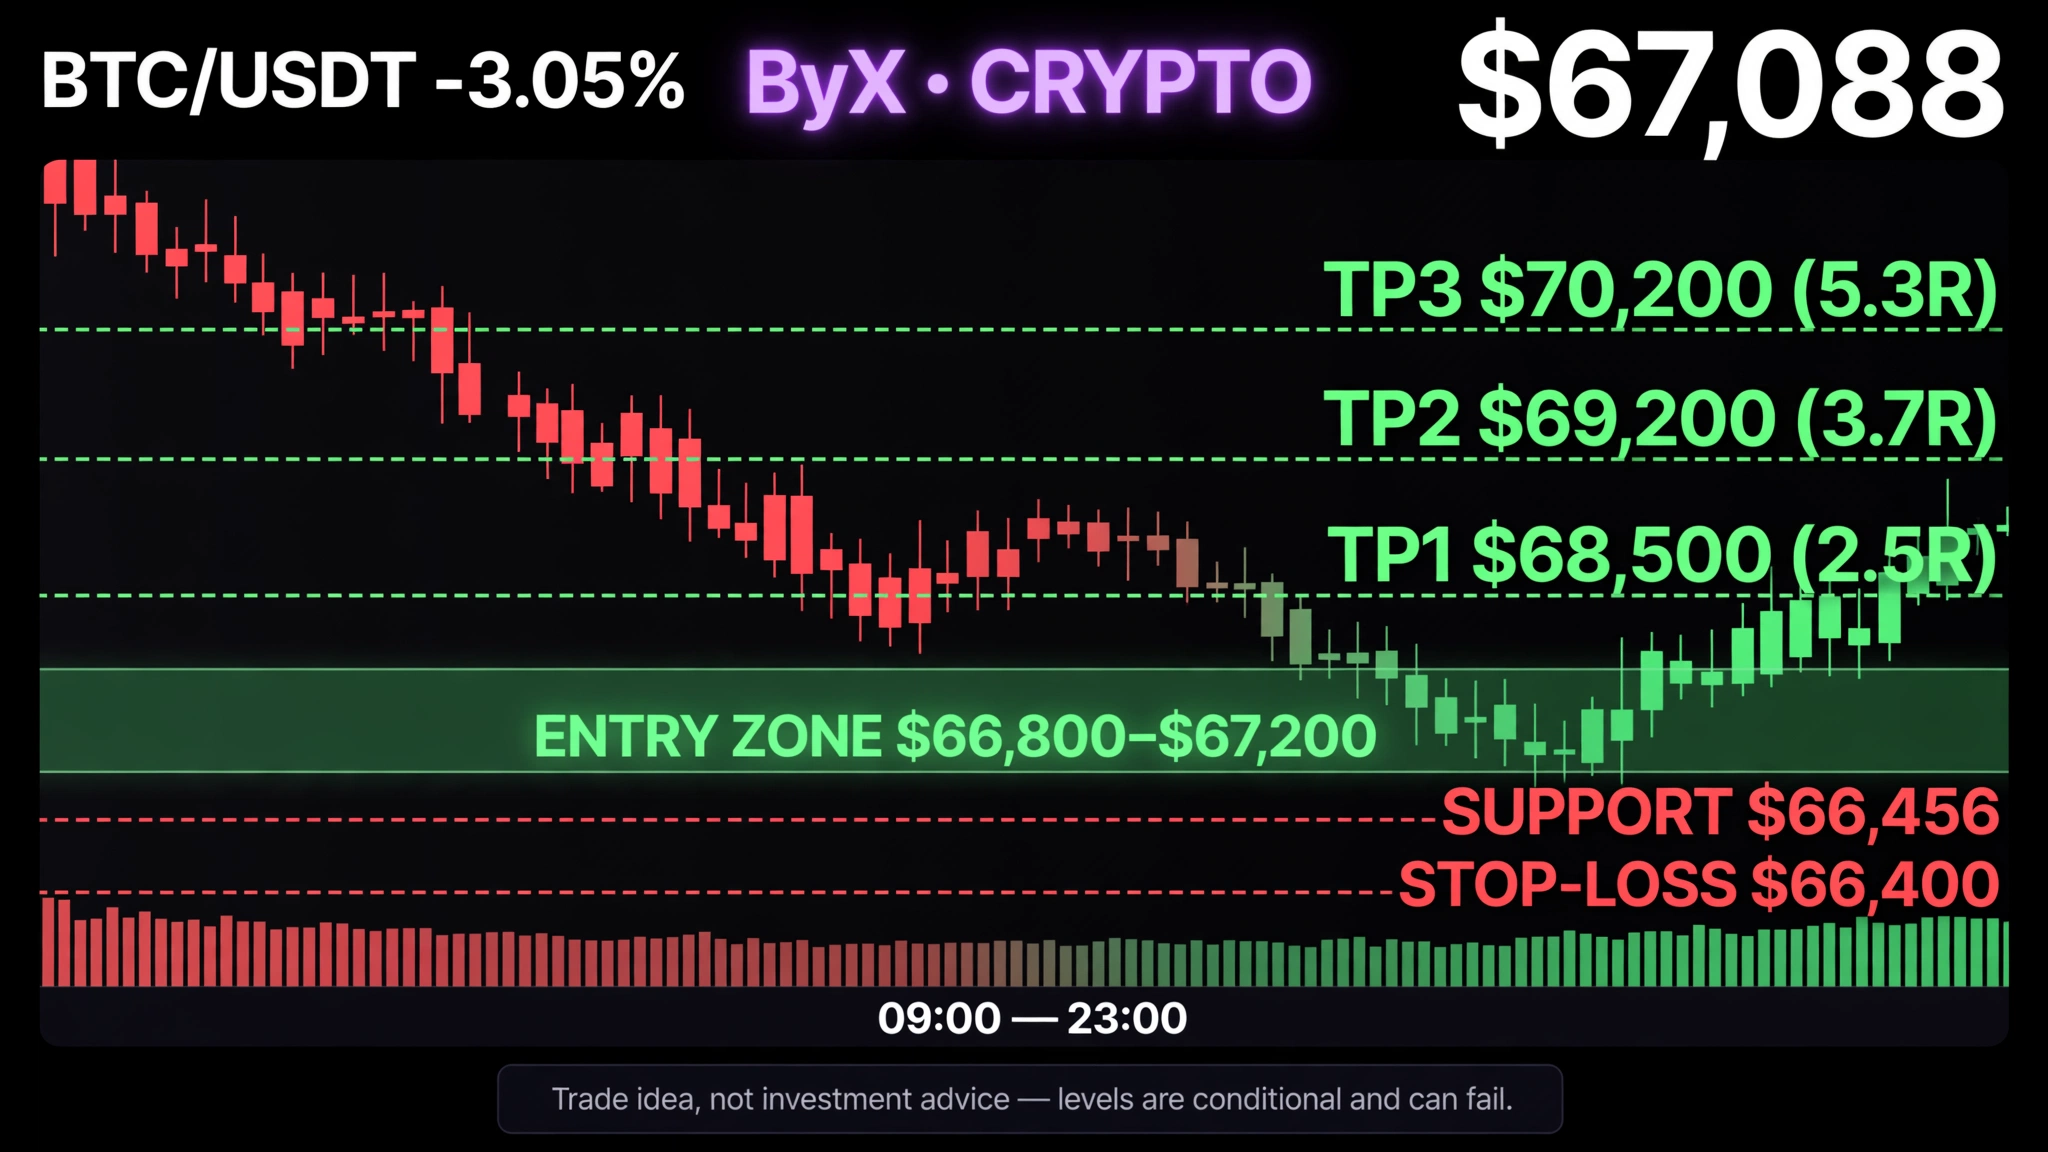
88.5% — the market now prices an 88.5% chance the Fed HIKES rates on December 9, while Bitcoin trades at $67,088 with an RSI of 23. Bitcoin is the benchmark the whole market trades against. The CME FedWatch tool puts a December 9 rate hike at 88.5%, a sharp repricing that is hammering risk assets. This is not retail panic — institutions are walking out. US spot Bitcoin ETFs posted $185M of net outflows on November 13, the seventh straight day of exits, after $284M left on November 12. Bitcoin is down 3.05% today to $67,088, its $66,456 low is the lowest since August and sits below its 200-week average of $67,893. The daily RSI reads 23, the Fear & Greed Index reads 12, and $260.5M of Bitcoin positions were liquidated in 24 hours, $227.8M of them longs. Binance open interest fell 7% in a day to $6.49B. The token is 46.7% below its $126,080 all-time high. Forced selling at RSI 23 is where bounces are born. The liquidation cluster sits at $66,350, just under today's low — fuel for a squeeze if $66,400 holds. Trade — LONG BTC: entry $66,800–$67,200, stop $66,400. TP1 $68,500 (2.5R), TP2 $69,200 (3.7R), TP3 $70,200 (5.3R). 4h structure, support at today's $66,456 low. Bull: oversold buyers step in, shorts cover, $68,500 breaks first. Bear: hike odds climb, ETF selling continues, $66,400 gives way toward $63,500. A — Bitcoin bounces off RSI 23 and reclaims $68,500. B — Fed hike fear drags it to $63,500 first. Which side are you on? $BTCUSDT #ByXIMPACT #IMPACTbyTrade Trade idea, not investment advice — levels are conditional and can fail.
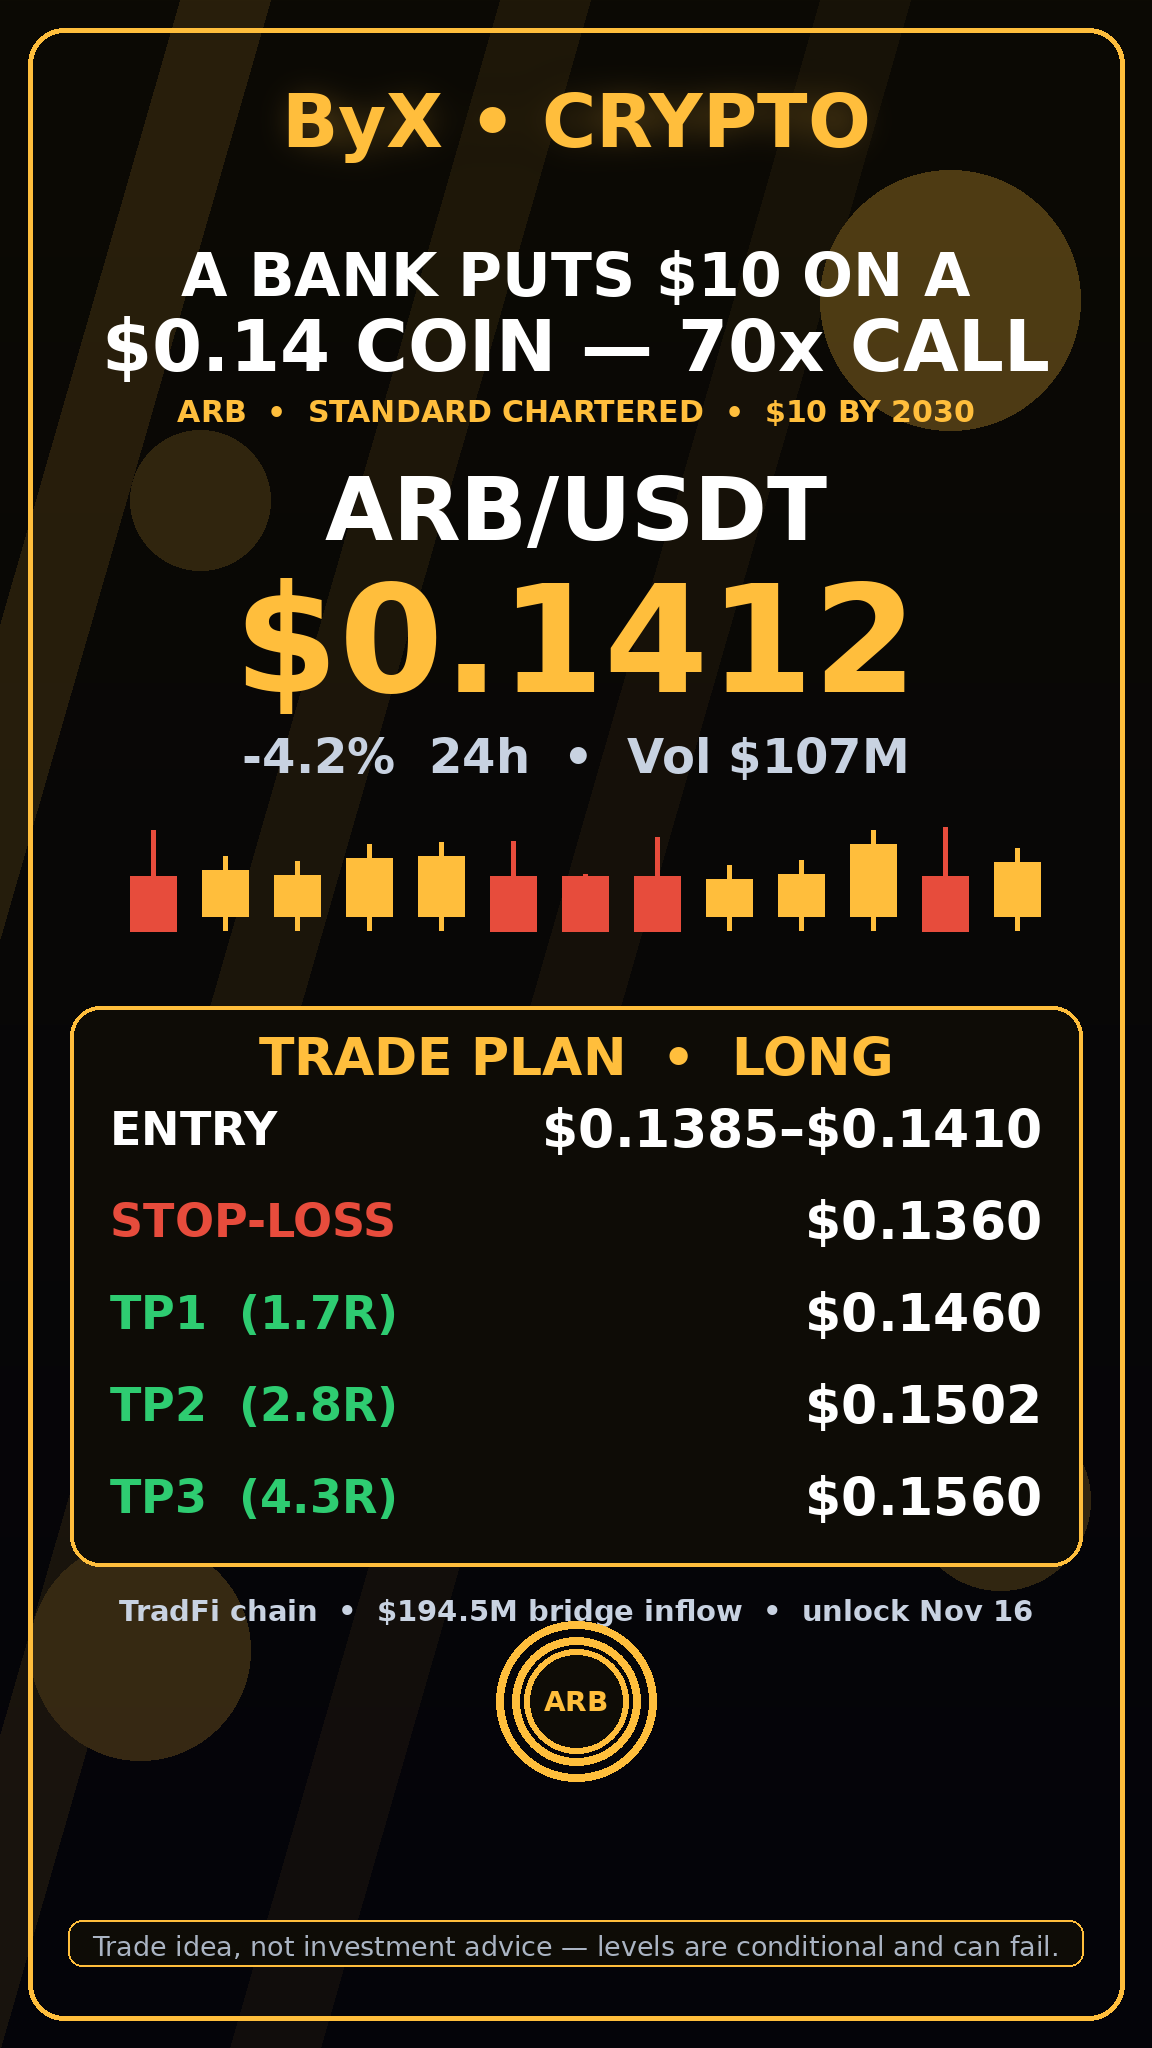
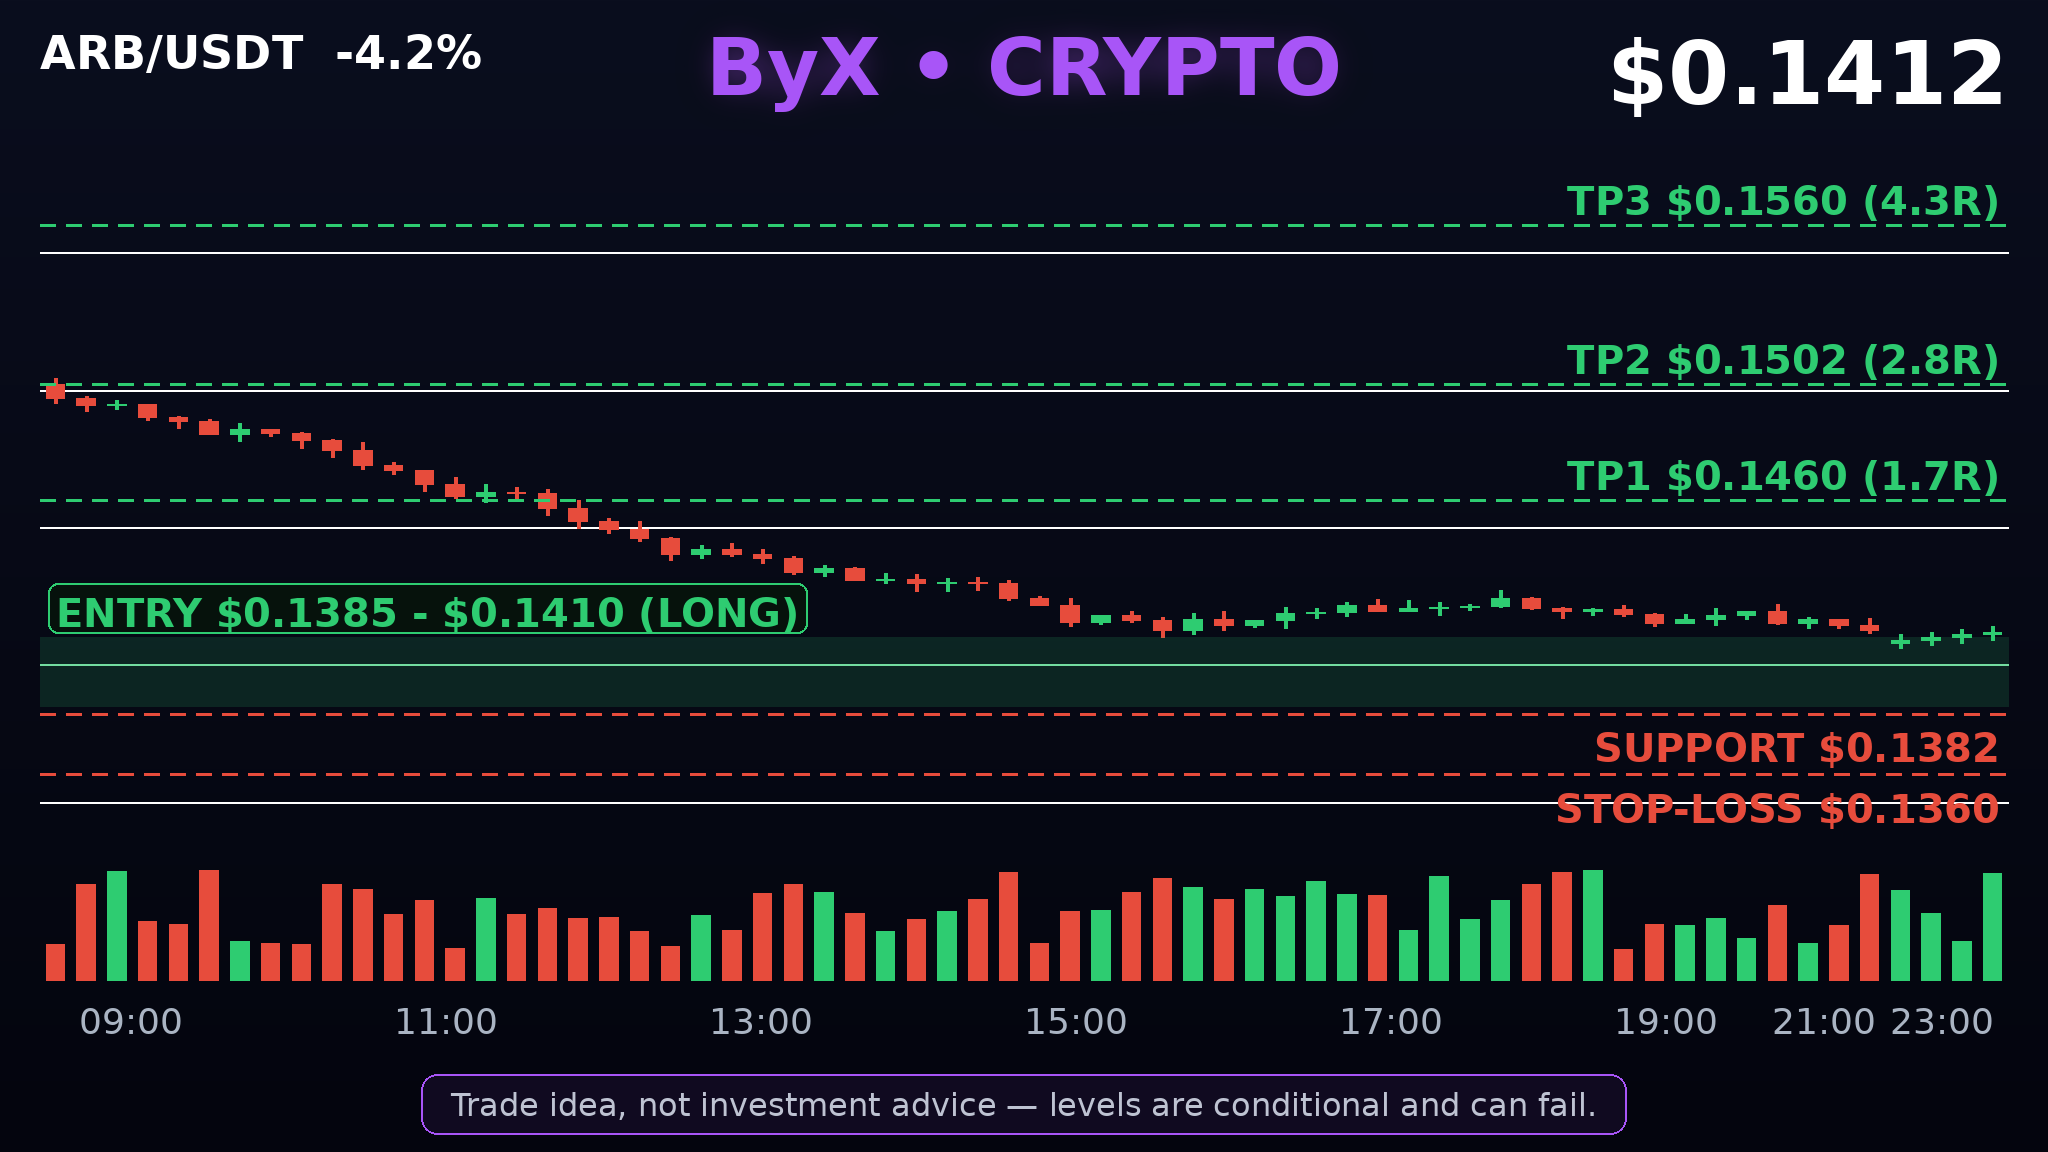
Standard Chartered just put a $10 target on a $0.14 coin — a 70x call — while 92.65M ARB tokens unlock in 48 hours. Arbitrum is the Ethereum layer-2 that Wall Street is building on. Robinhood launched its own chain on Arbitrum, Stripe added USDC payouts on Arbitrum on Nov 5, and Aave V3.8 deployed there. Standard Chartered's Geoff Kendrick calls Arbitrum "the blockchain for TradFi" and sees $10 by the end of 2030, as the tokenised-asset market grows from $340B today to $4T. The tension is real. ARB trades at $0.1412, down 4.2% today and 14.5% in a week, 94.1% below its $2.39 all-time high. The next unlock lands Nov 16: 92.65M ARB, about $13.1M, 1.3% of the 6.89B circulating supply. Funding sits at -0.0126% per 8 hours on OKX — shorts are paying longs, the crowd is leaning bearish into the unlock. But the flows tell a different story. Arbitrum posted the largest net bridge inflow of any major network at $194.52M for the week ending Nov 4, and it collected over $5M in fees in September alone. The chain is earning while the token bleeds. Trade — LONG ARB: entry $0.1385–$0.1410, stop $0.1360. TP1 $0.1460 (1.7R), TP2 $0.1502 (2.8R), TP3 $0.1560 (4.3R). 4h structure, support at today's $0.1382 low. Bull: the unlock gets absorbed, the bank target reprices the token, and $0.1502 breaks first. Bear: unlock selling meets a fearful market and $0.1360 gives way toward $0.13. A — ARB absorbs the unlock and starts the road to $10. B — the unlock dumps it toward $0.13 first. Which side are you on? $ARBUSDT #ByXIMPACT #IMPACTbyTrade Trade idea, not investment advice — levels are conditional and can fail.
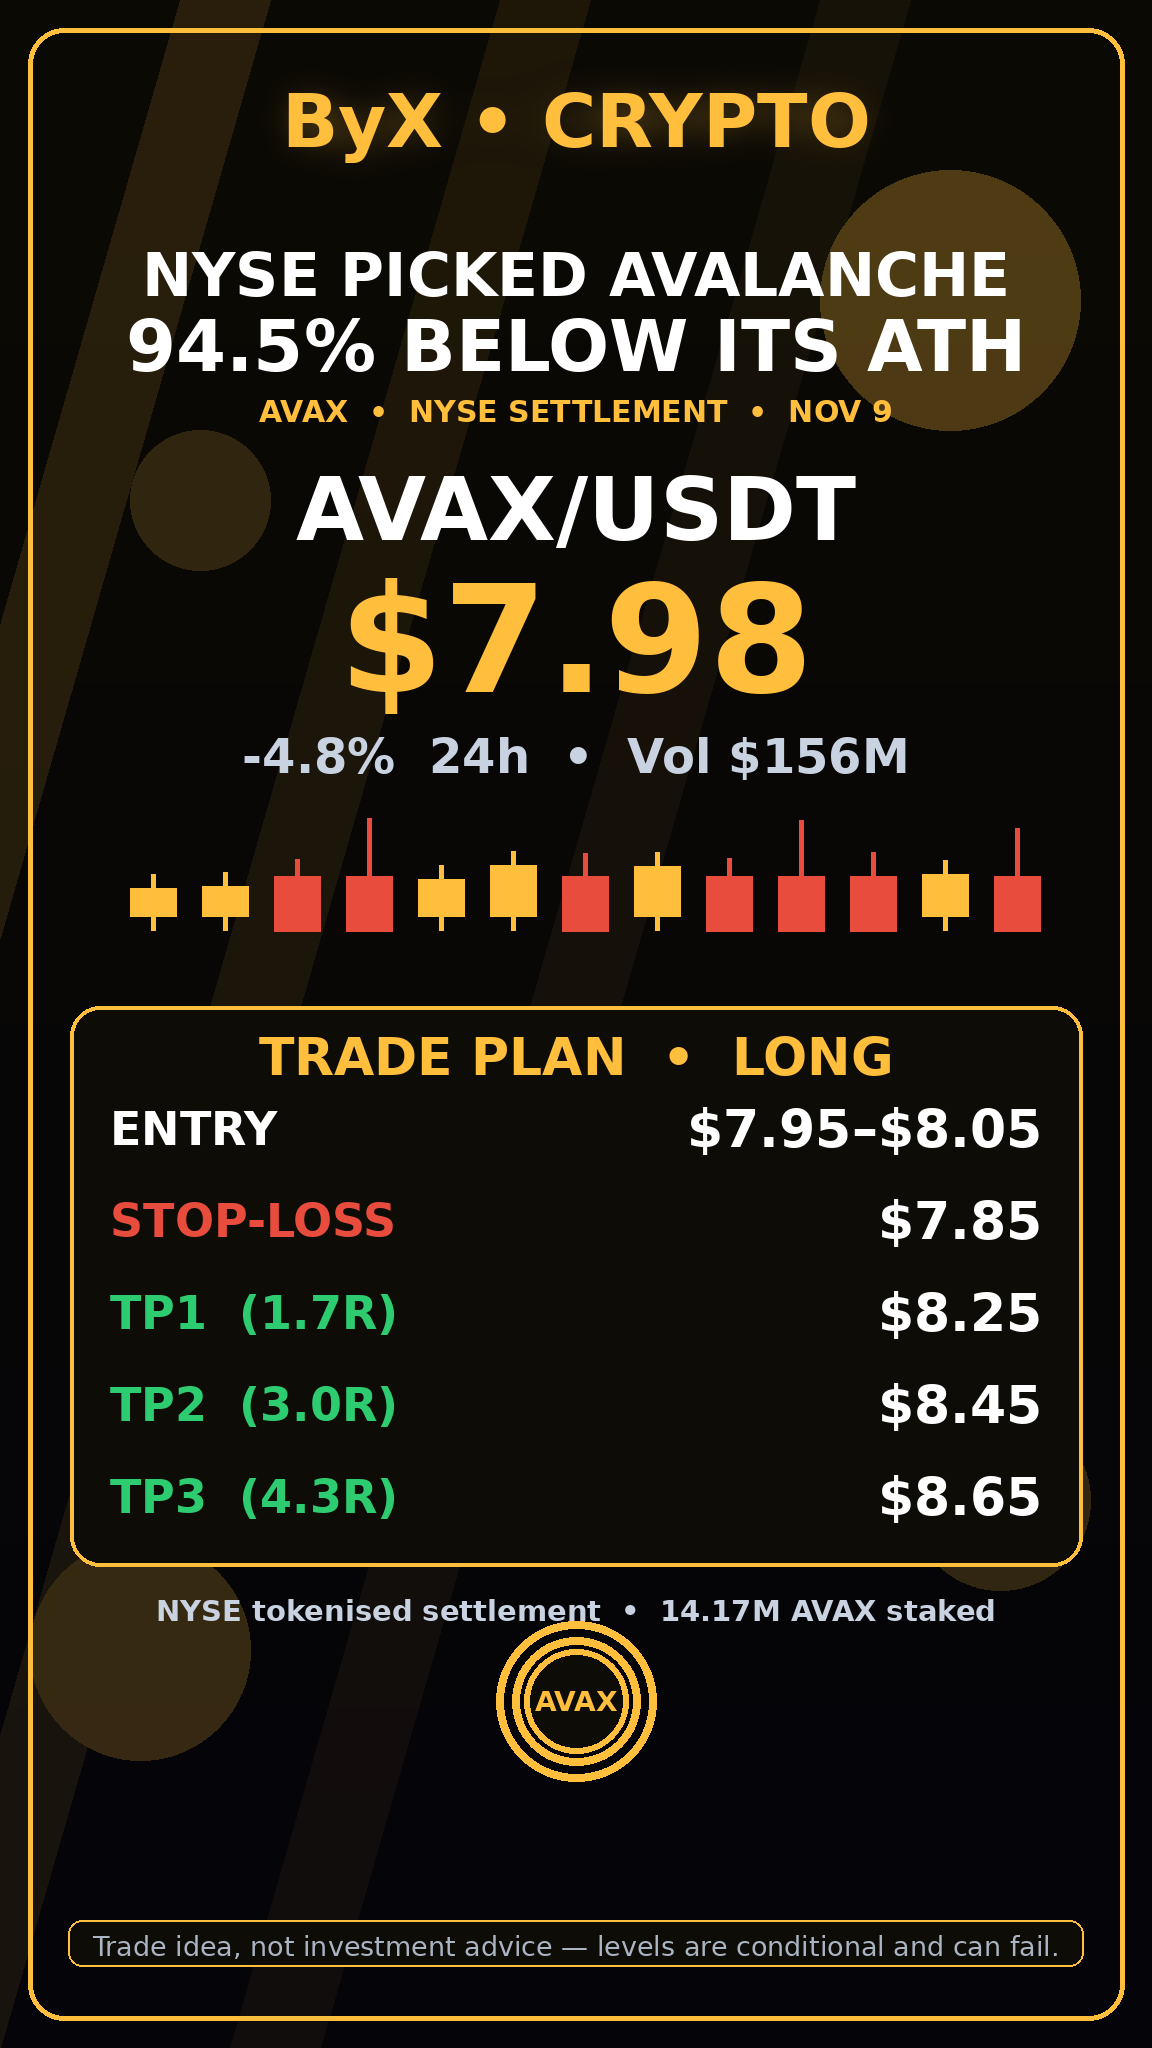
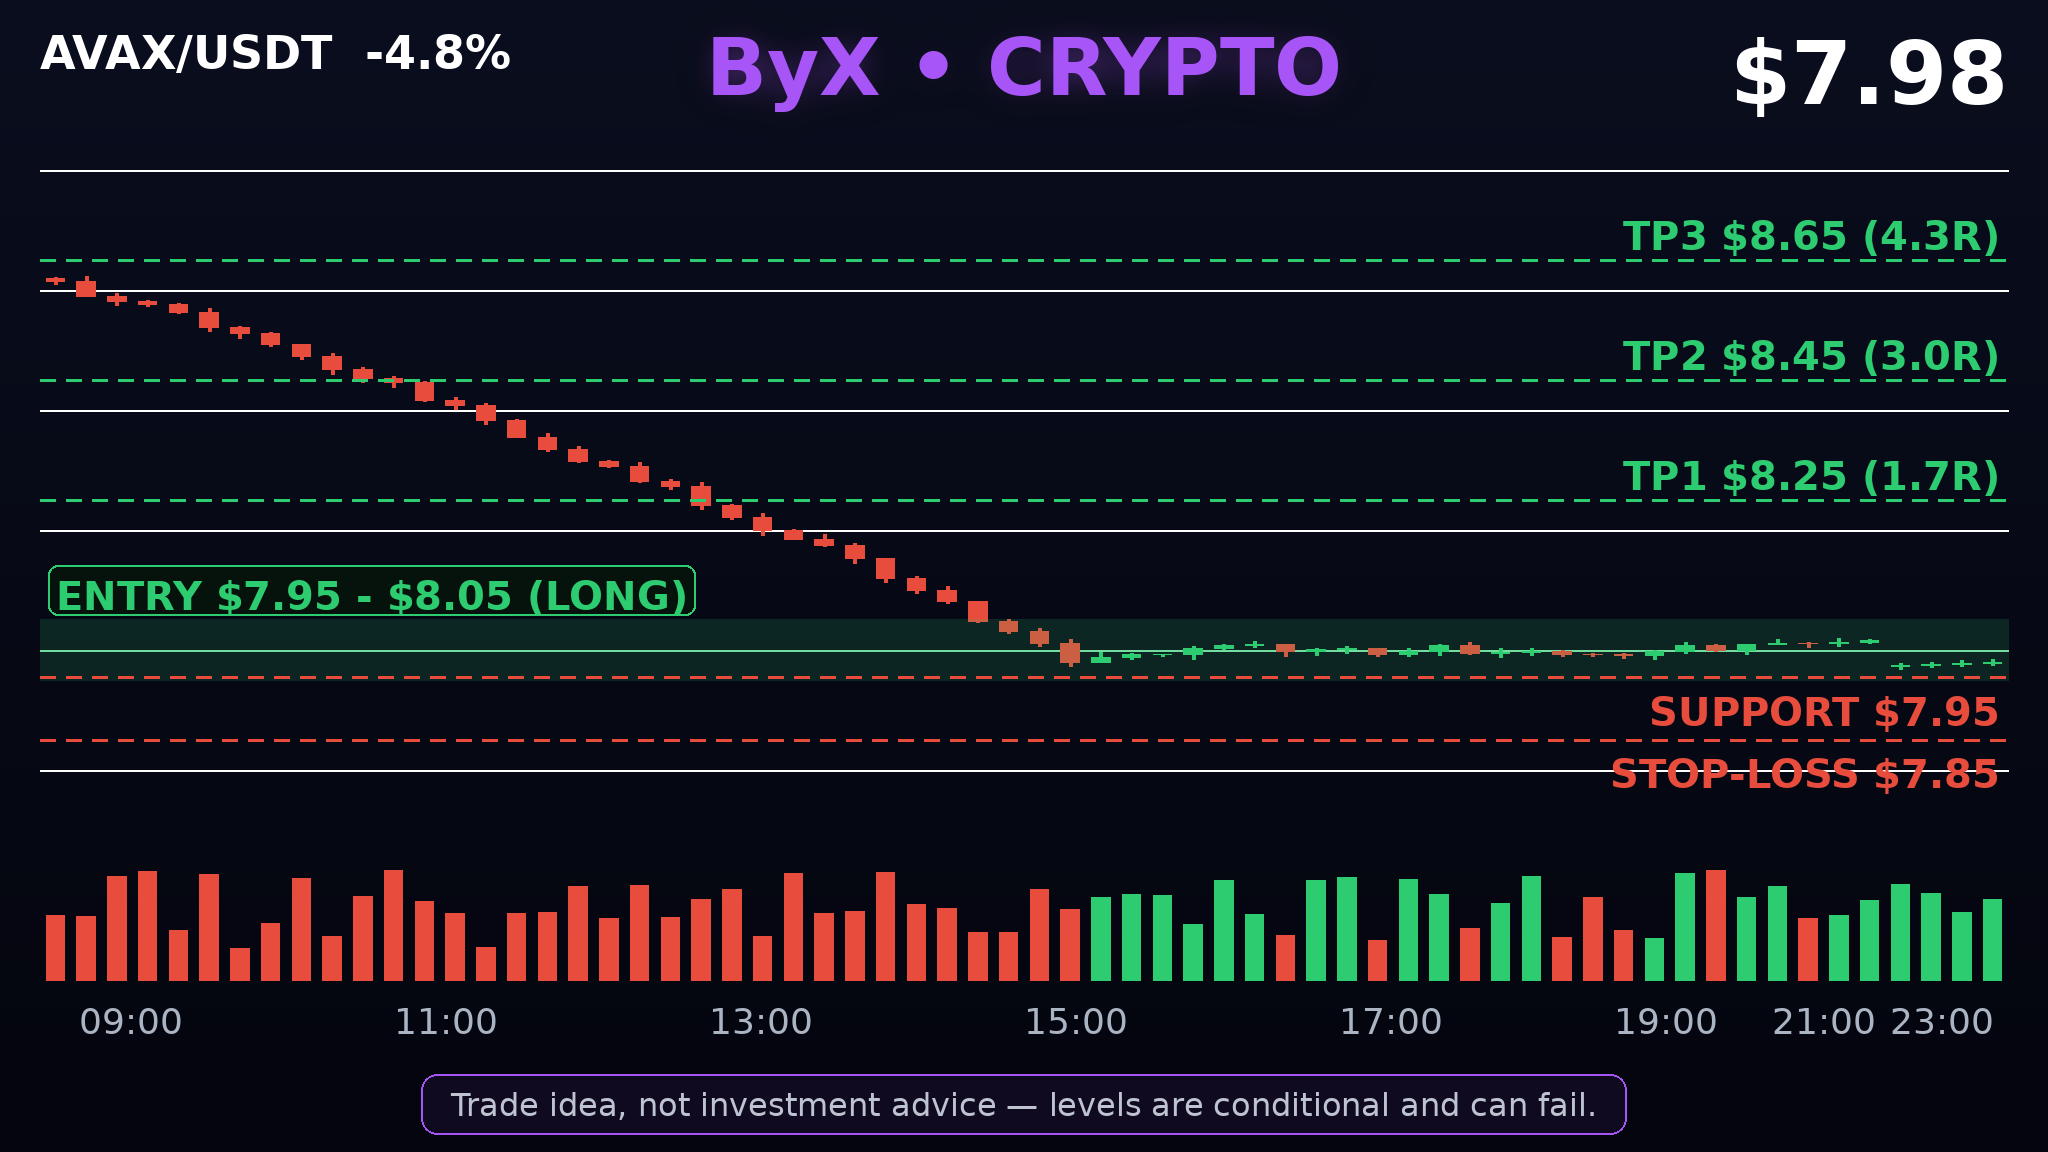
NYSE picked Avalanche to settle tokenised stocks — yet AVAX has fallen 9% since and now trades 94.5% below its $145.67 all-time high. Avalanche is the high-speed proof-of-stake chain with sub-second finality. On Nov 9, Ava Labs said a clearing firm affiliated with the New York Stock Exchange picked Avalanche as the core ledger for its planned 24/7 tokenised securities platform — pending regulatory approval. So far AVAX is down from $8.77 that day to $7.98 now, -4.8% in the last 24 hours. Behind it: chain TVL $587.7M, and treasury firm AVAX One holds 14.17M AVAX, 99.7% staked at ~5.85% yield. But AVAX is -22.4% over 30 days, with a 6.67M AVAX unlock due Jan 24, 2027. Trade — LONG AVAX: entry $7.95–$8.05, stop $7.85. TP1 $8.25 (1.7R), TP2 $8.45 (3.0R), TP3 $8.65 (4.3R). Bull: NYSE settlement turns Avalanche into Wall Street plumbing. Bear: no approval date yet, and every bounce keeps failing. A — AVAX reclaims $8.25 and the NYSE news reprices it. B — $7.95 breaks and it slides toward $7.50. Which side are you on? $AVAXUSDT #ByXIMPACT #IMPACTbyTrade Trade idea, not investment advice — levels are conditional and can fail.
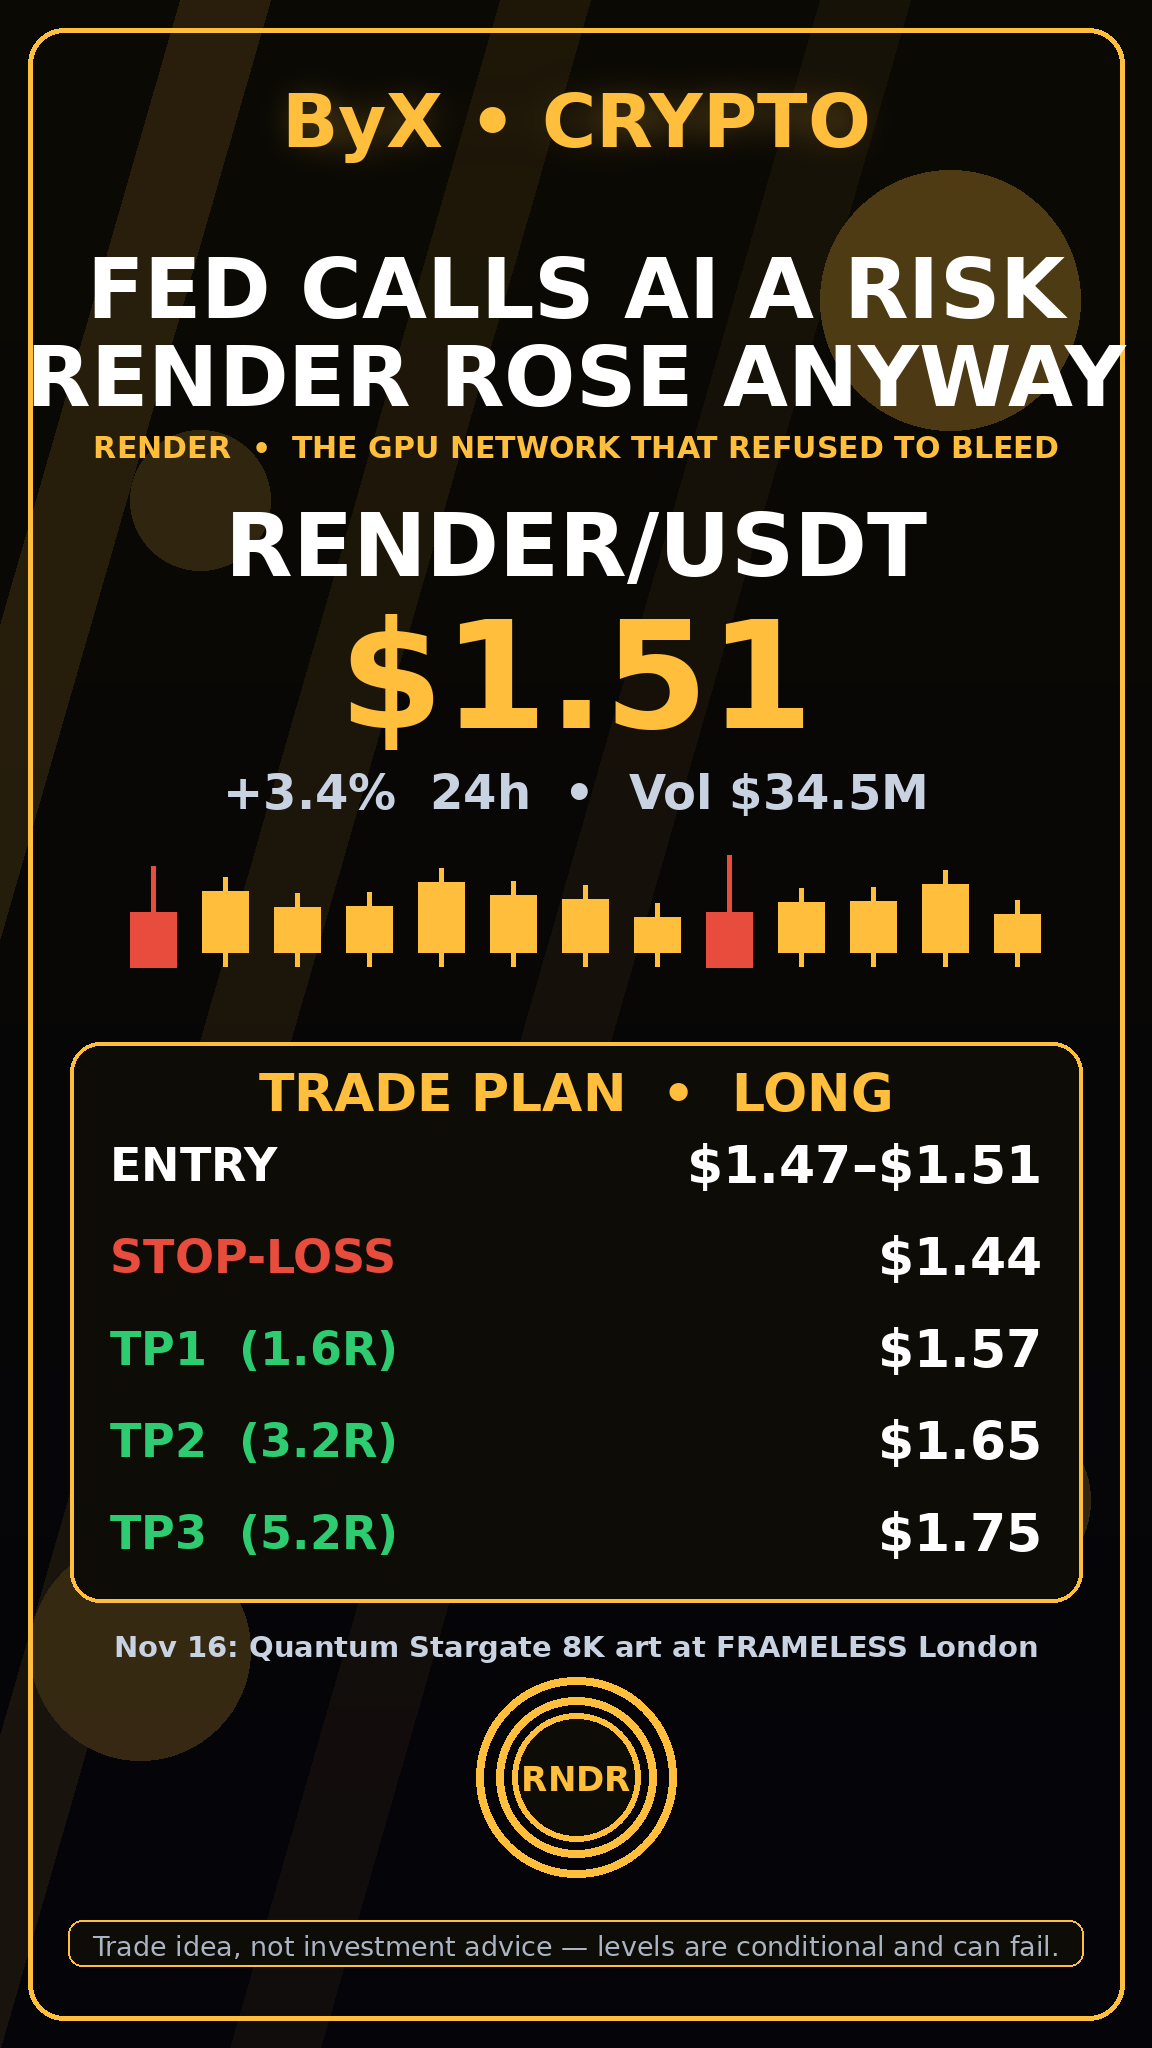
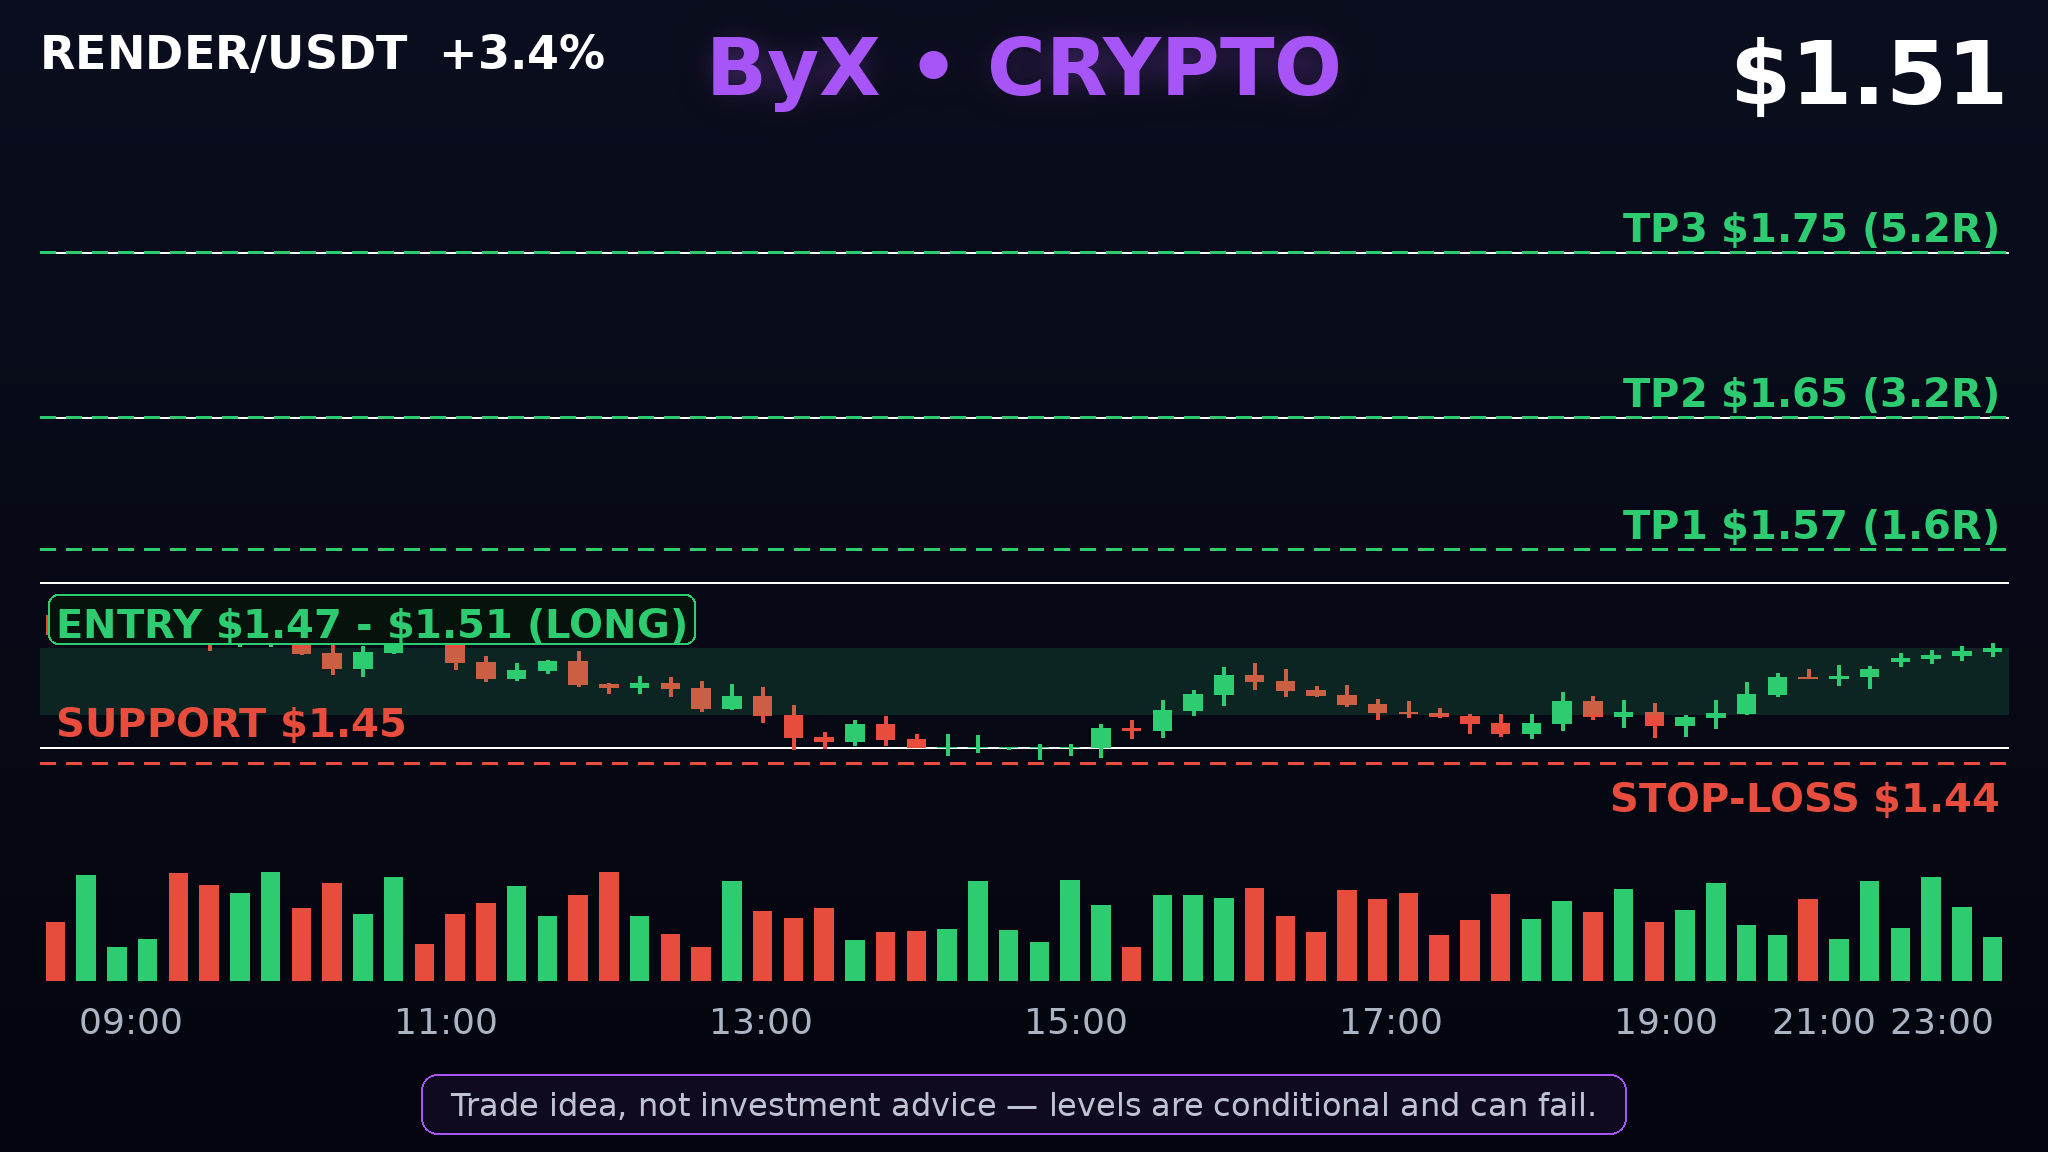
The Fed just called AI a major risk to the financial system — RENDER rose 3.4% anyway while Bitcoin bled 3%. Render Network rents spare GPUs for 3D rendering and AI work, paid in RENDER. The network just passed 82 million frames rendered, and on Monday Nov 16 it presents its Quantum Stargate 8K artwork at FRAMELESS London during Solana Breakpoint — work that would have taken 4.7 years on one RTX 5090. Today RENDER trades near $1.51, up 3.4% on $34.5M volume, while BTC fell 3% and fear sits at Extreme Fear (13). Funding is flat at +0.005% — no crowded long yet. Still 88.7% below its $13.53 all-time high. TRADE — LONG: Entry $1.47–$1.51. Stop $1.44. TP1 $1.57 (1.6R), TP2 $1.65 (3.2R), TP3 $1.75 (5.2R). Bull: Nov 16 event buzz and real GPU demand keep buyers above $1.45. Bear: hawkish Fed and AI-risk headlines drag the AI basket down with BTC. A or B: does RENDER hold $1.45 and run to $1.57 first — or does the Fed's AI warning drag it back under $1.45? $RENDERUSDT #MyByXTake #ByXIMPACT Trade idea, not investment advice — levels are conditional and can fail.
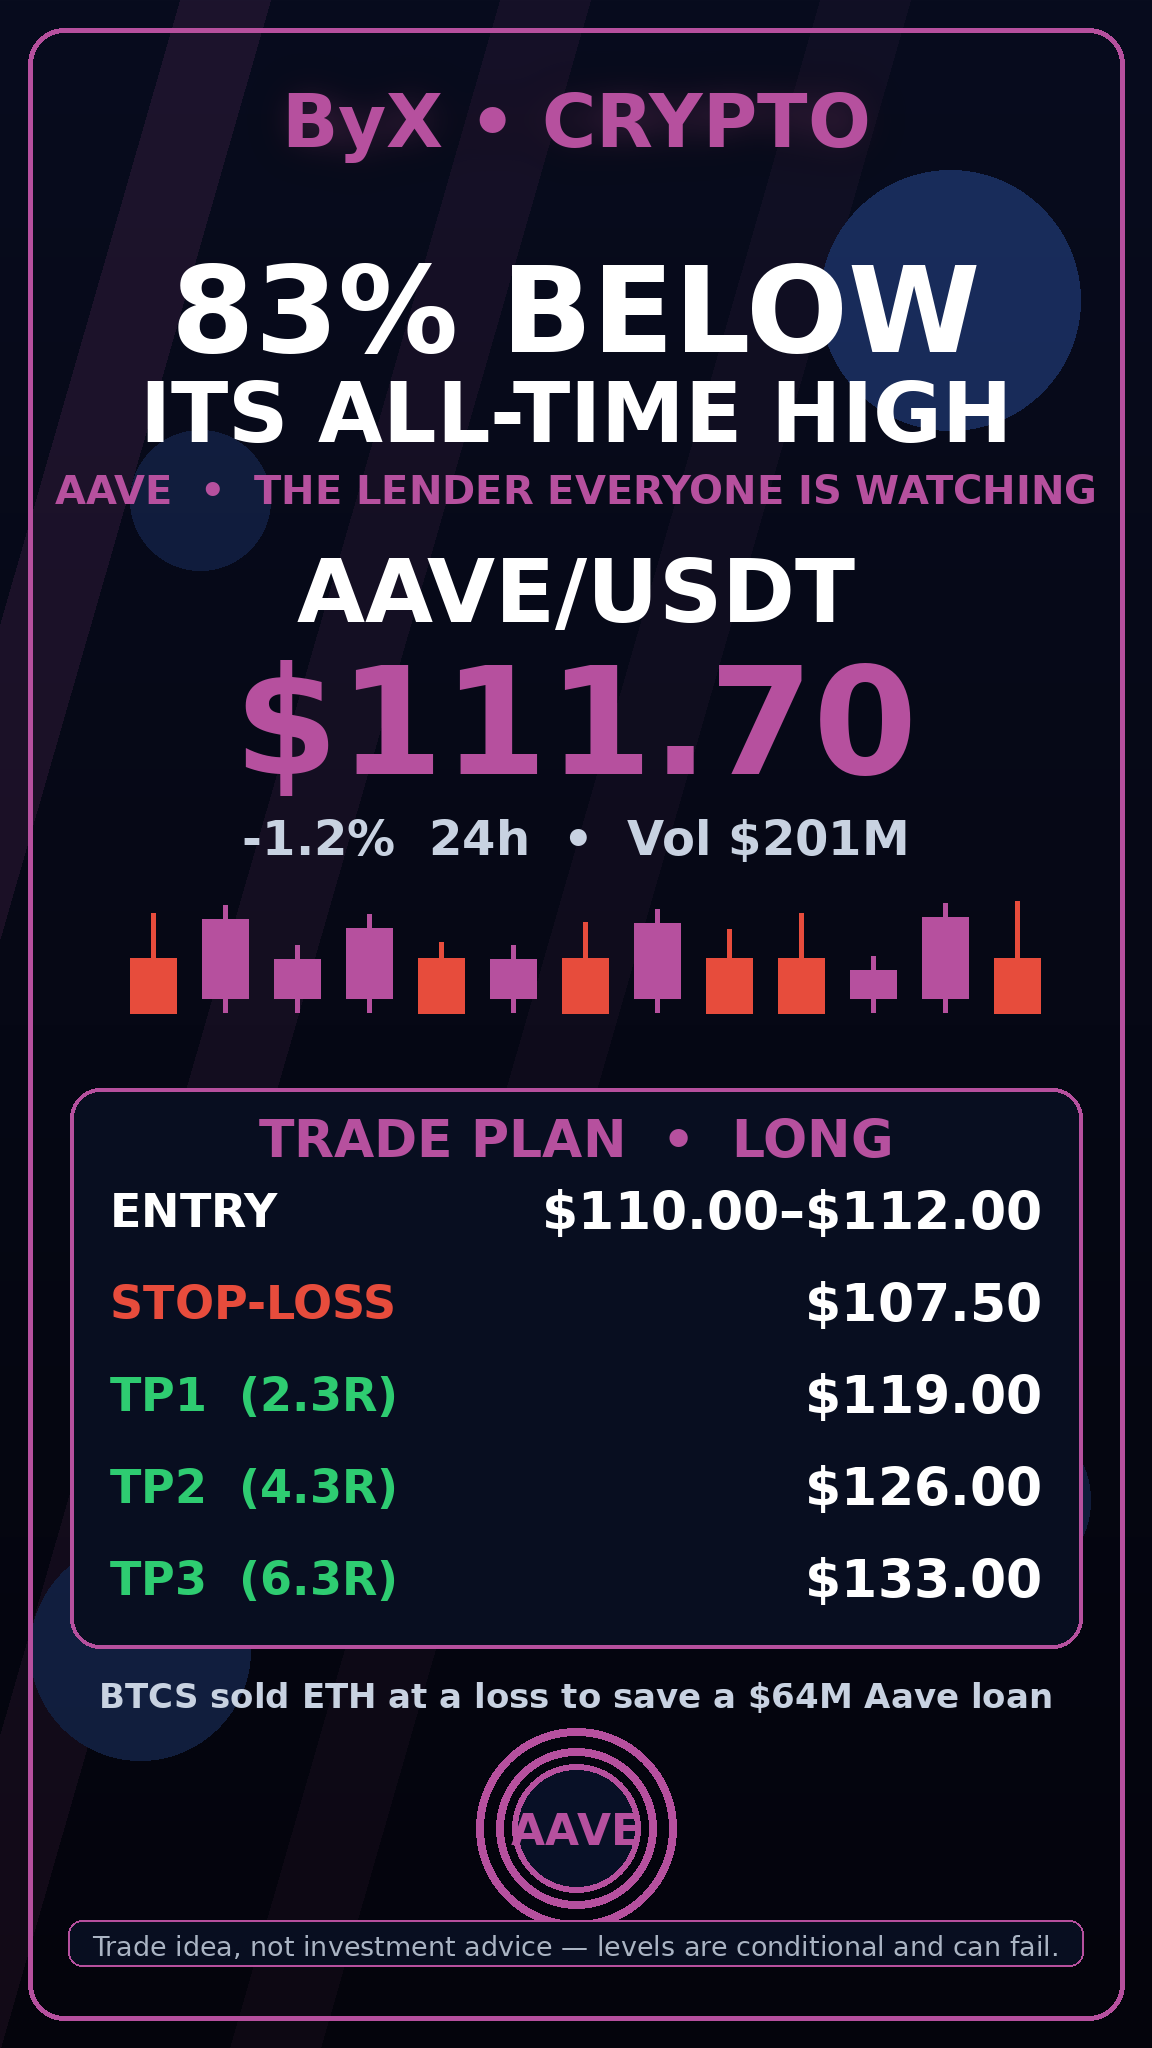
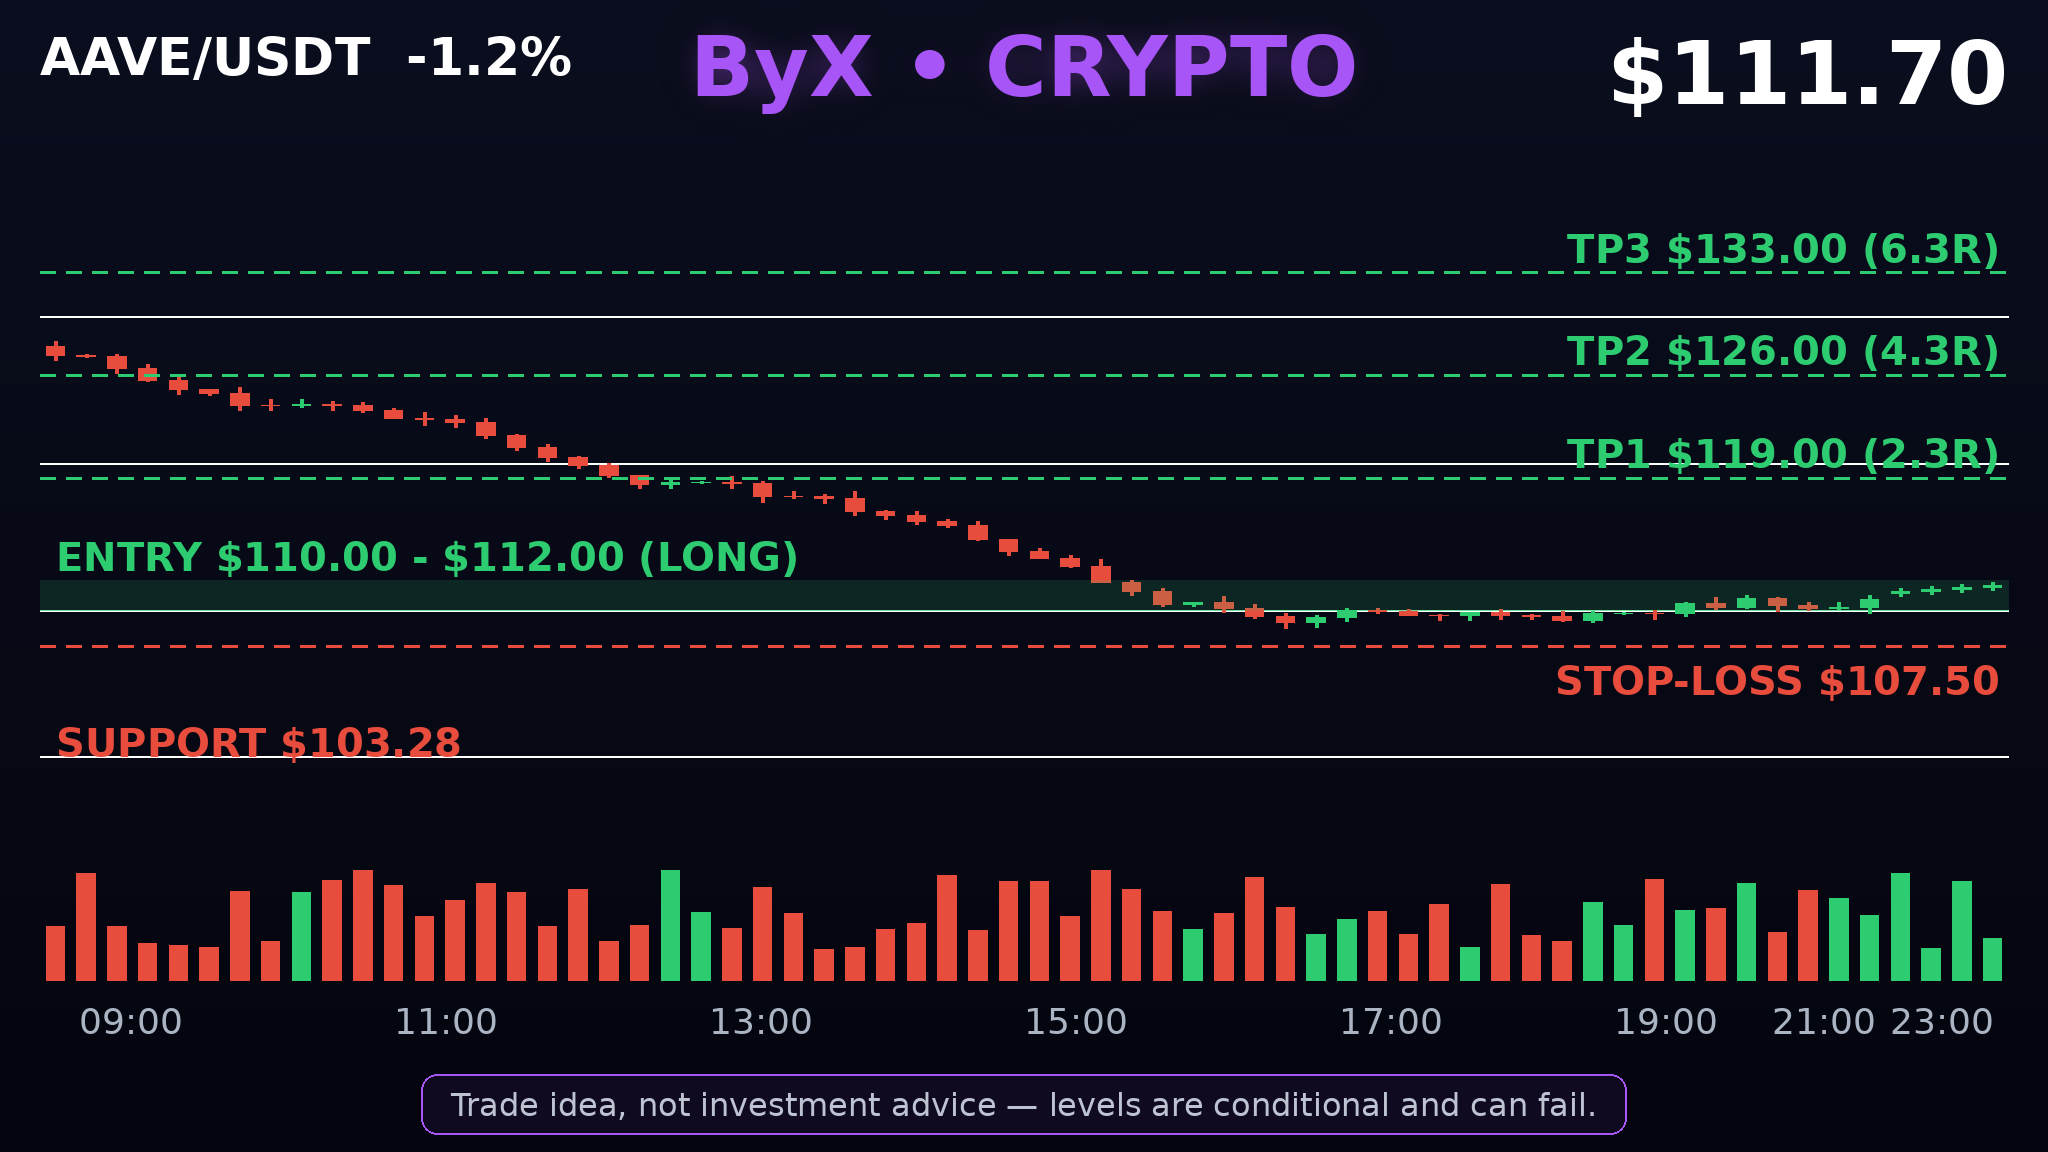
Aave secures $15.7 billion in loans — and its own token trades 83% below its all-time high. Aave is the largest lending protocol in DeFi: people deposit crypto, borrow against it, and Aave takes a cut of every loan. Right now $15.7 billion sits locked in its contracts, yet the AAVE token is worth $111.70 — down 83.1% from its $661.69 all-time high, with a market cap of just $1.72 billion. The protocol prints real usage while its token trades like a forgotten altcoin. The catalyst landed today. Nasdaq-listed BTCS sold ETH at a loss to protect a roughly $64 million loan on Aave, a loan CoinDesk calculates comes under threat near $1,717 per ETH. ETH is at $1,925 and falling, so the market is staring at the exact price where a public company's loan starts liquidating on-chain. The same day, Aave governance proposed freezing $279 million of osETH. Meanwhile Aave V4 just hit $25 million in deposits on Base. The macro backdrop is brutal. Bitcoin broke below $70,000 to $68,644, a 12-week low, and $1.6 billion in leveraged positions were wiped out in 24 hours, almost all longs. AAVE fell 13.1% this week and 29% this month, but held today's low at $109.54 and is back above $110. Funding is flat at 0.0021% per 8 hours, open interest is $286.95 million and shrinking, and $2.09 million of AAVE positions were liquidated in 24 hours — 96% of them longs. Technically, $103.28 is the support analysts are watching, and $119 is the first real resistance overhead. AAVE spent today chopping between $109.54 and $115.26. Holding $110 after a 29% monthly drop, with funding reset and longs flushed, is a base, not a breakdown. Lose $107.50 and that read is wrong — I am out. The trade is a long. Entry $110.00–$112.00, stop-loss $107.50, TP1 $119.00 (2.3R), TP2 $126.00 (4.3R), TP3 $133.00 (6.3R). TP1 is the $119 resistance; TP2 and TP3 sit in the September chop zone. Bull case: Aave absorbed a public company's distressed loan without breaking, V4 deposits are growing on Base, and the token sits in the $91–$120 zone analysts flagged as a buying area. If ETH holds $1,717 and BTC stabilises above $68,000, the funding reset plus the TVL-to-market-cap gap gives AAVE the sharpest snap-back in DeFi. Bear case: ETH breaks $1,717, the BTCS loan liquidates on-chain for everyone to watch, and AAVE tests $103.28 — then $91. A — AAVE reclaims $119 this week and the $91–$120 zone was the bottom. B — ETH breaks $1,717 and AAVE tests $103 next. Which side are you on? $AAVEUSDT #ByXIMPACT #IMPACTbyTrade Trade idea, not investment advice — levels are conditional and can fail.
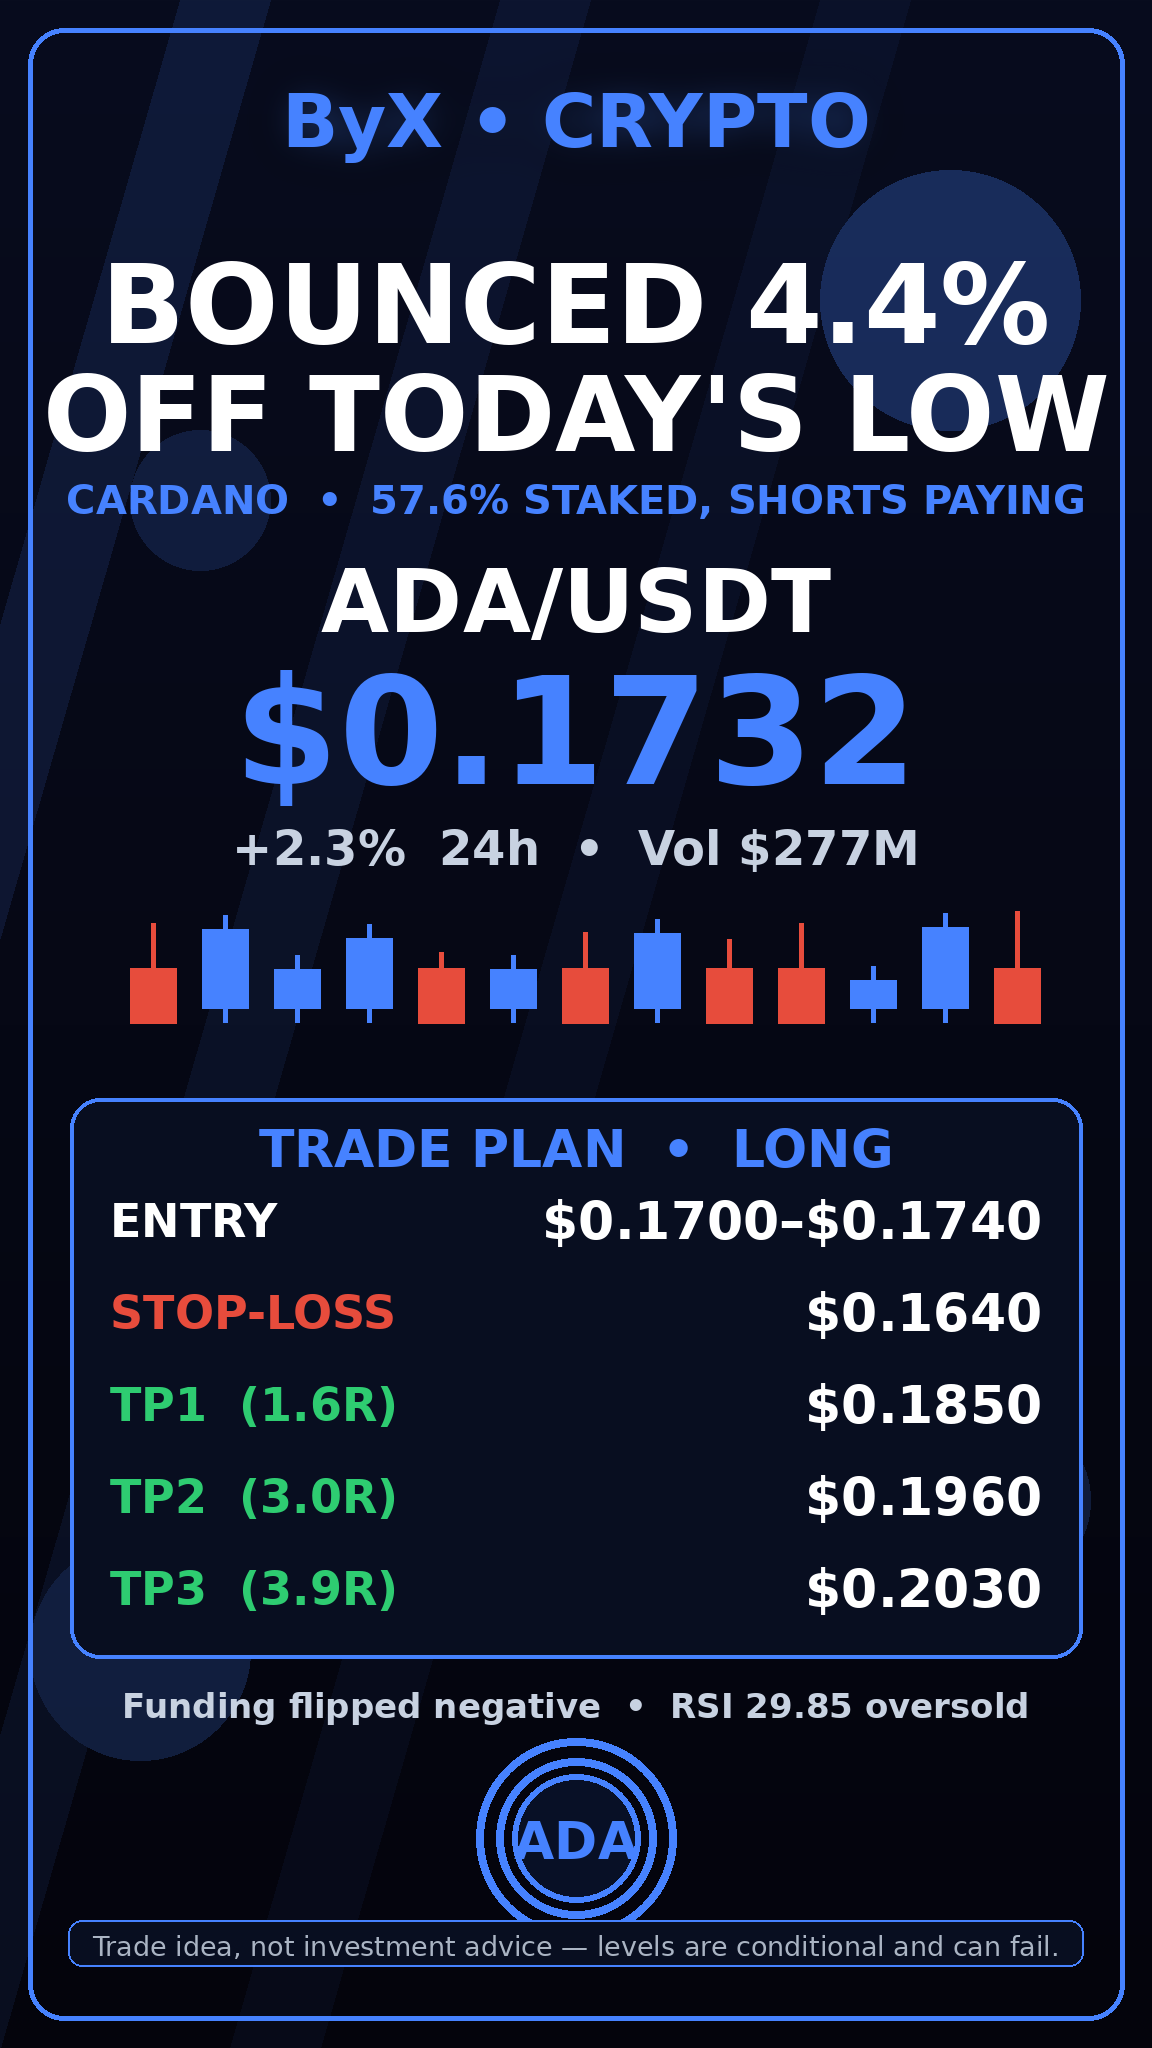
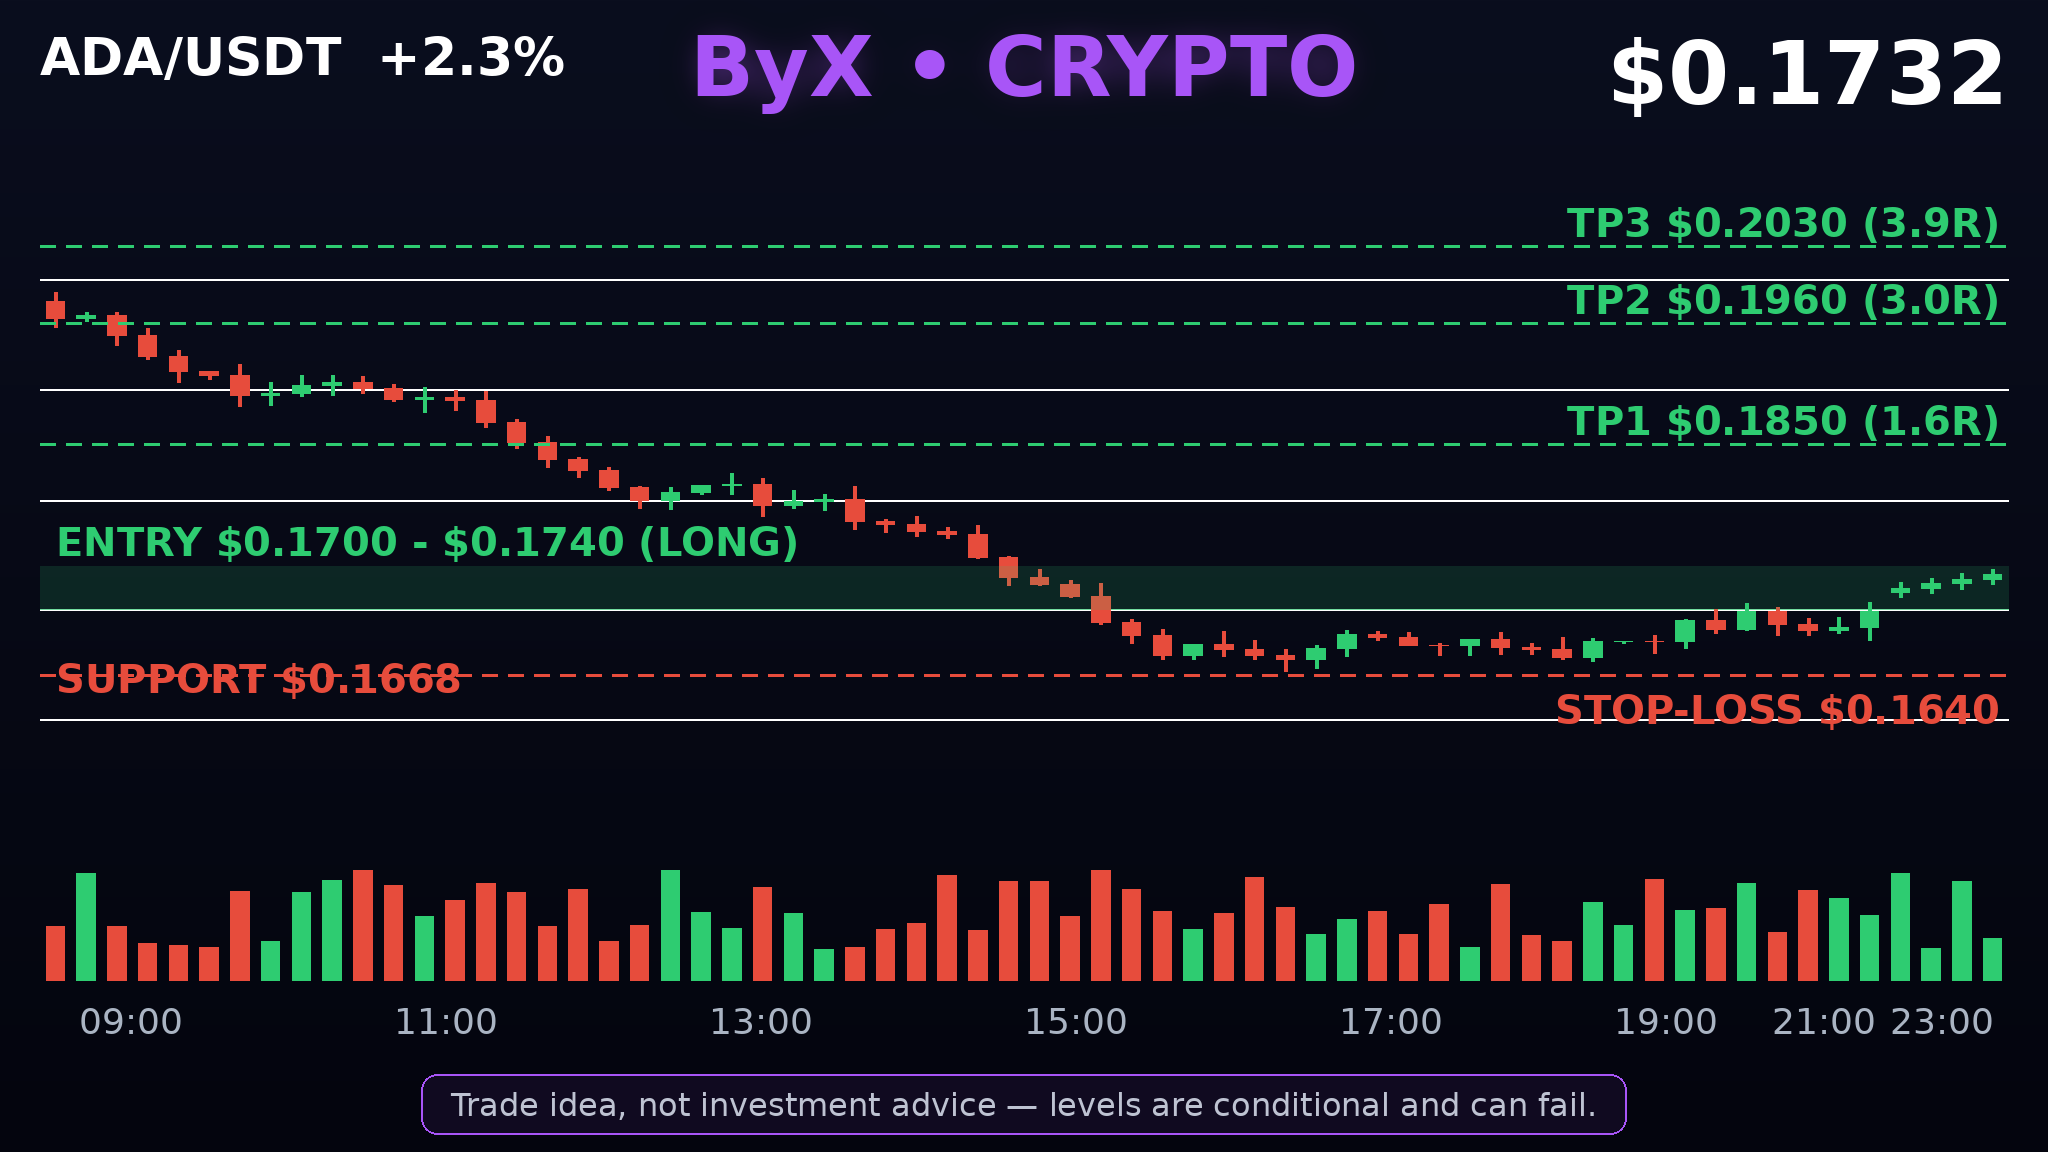
Cardano bounced 4.4% off today's low while Bitcoin bled another 3.7% — the most oversold top-20 coin just refused to make a new low. Cardano is the proof-of-stake Layer-1 that has survived every cycle by being slow and stubborn. ADA fell to $0.1659 this morning, then turned and reclaimed $0.173 while Bitcoin slid to $68,885. Up 2.3% in 24 hours while the market bled almost everywhere else — relative strength where capitulation usually lives. The fresh catalyst is real but quiet: on November 12 the Cardano Foundation announced a partnership with Andamio to push on-chain education and builder tooling. No ETF, no listing, no fireworks — and that is the honest part. This trade is not built on a headline. It is built on positioning: ADA funding flipped negative on Thursday and sat at -0.0015% on Friday, meaning shorts are now paying longs to stay short, and the CoinGlass long-to-short ratio is 0.86, near its lowest in a month. When the crowd is this short and this bearish, a bounce has fuel. The macro backdrop is still ugly. Bitcoin broke $70,000 and triggered $1.62 billion in liquidations in 24 hours, $1.46 billion of it longs — roughly 90% of the flush. Brent crude jumped 7% from its November 10 low to $96.60, the US 10-year yield climbed to 5.1%, and October CPI printed hot at 0.4%. ADA has now printed its sixth straight red week, down over 30% since early October and 38% below its October high near $0.275. Technically the damage is real: ADA lost $0.20, then $0.1898, and sits below all three major averages — 50-day $0.203, 100-day $0.208, 200-day $0.229 — with RSI at 29.85, inside oversold territory. But here is the tension: 57.6% of all ADA is staked, locked away, not sitting on exchanges waiting to be dumped. On-chain, Cardano still did 22,226 transactions in 24 hours with 16,768 active addresses, and DeFi TVL holds near $49.45 million. Holders are not selling. Traders are short. That gap is where squeezes are born. The trade is a long into the bounce, not a chase above $0.18. Entry $0.1700–$0.1740, the reclaimed zone. Stop-loss $0.1640, below today's low — if that breaks, the idea is wrong. TP1 $0.1850 (1.6R), TP2 $0.1960 (3.0R), TP3 $0.2030 (3.9R) at the 50-day average. Support sits at $0.1668; below that, $0.1545 and the June low at $0.1381 are the next shelves. Bull case: the oversold bounce becomes a reversal. Funding stays negative, shorts cover into a thin order book, and a reclaim of $0.1898 opens the road back to $0.20. A coin 94.4% below its all-time high with most of its supply staked does not need much buying to move fast. Bear case: the trend is still down and nothing has actually changed — six red weeks, price under every average, longs just lost $1.62 billion. A daily close under $0.1640 puts $0.1545 in play within days, and $0.1381 after that. So — A) you buy the oversold bounce here with $0.1640 as your line in the sand, or B) you short every rally until $0.20 is reclaimed? Pick a side. $ADAUSDT #ByXIMPACT #IMPACTbyTrade Trade idea, not investment advice — levels are conditional and can fail.
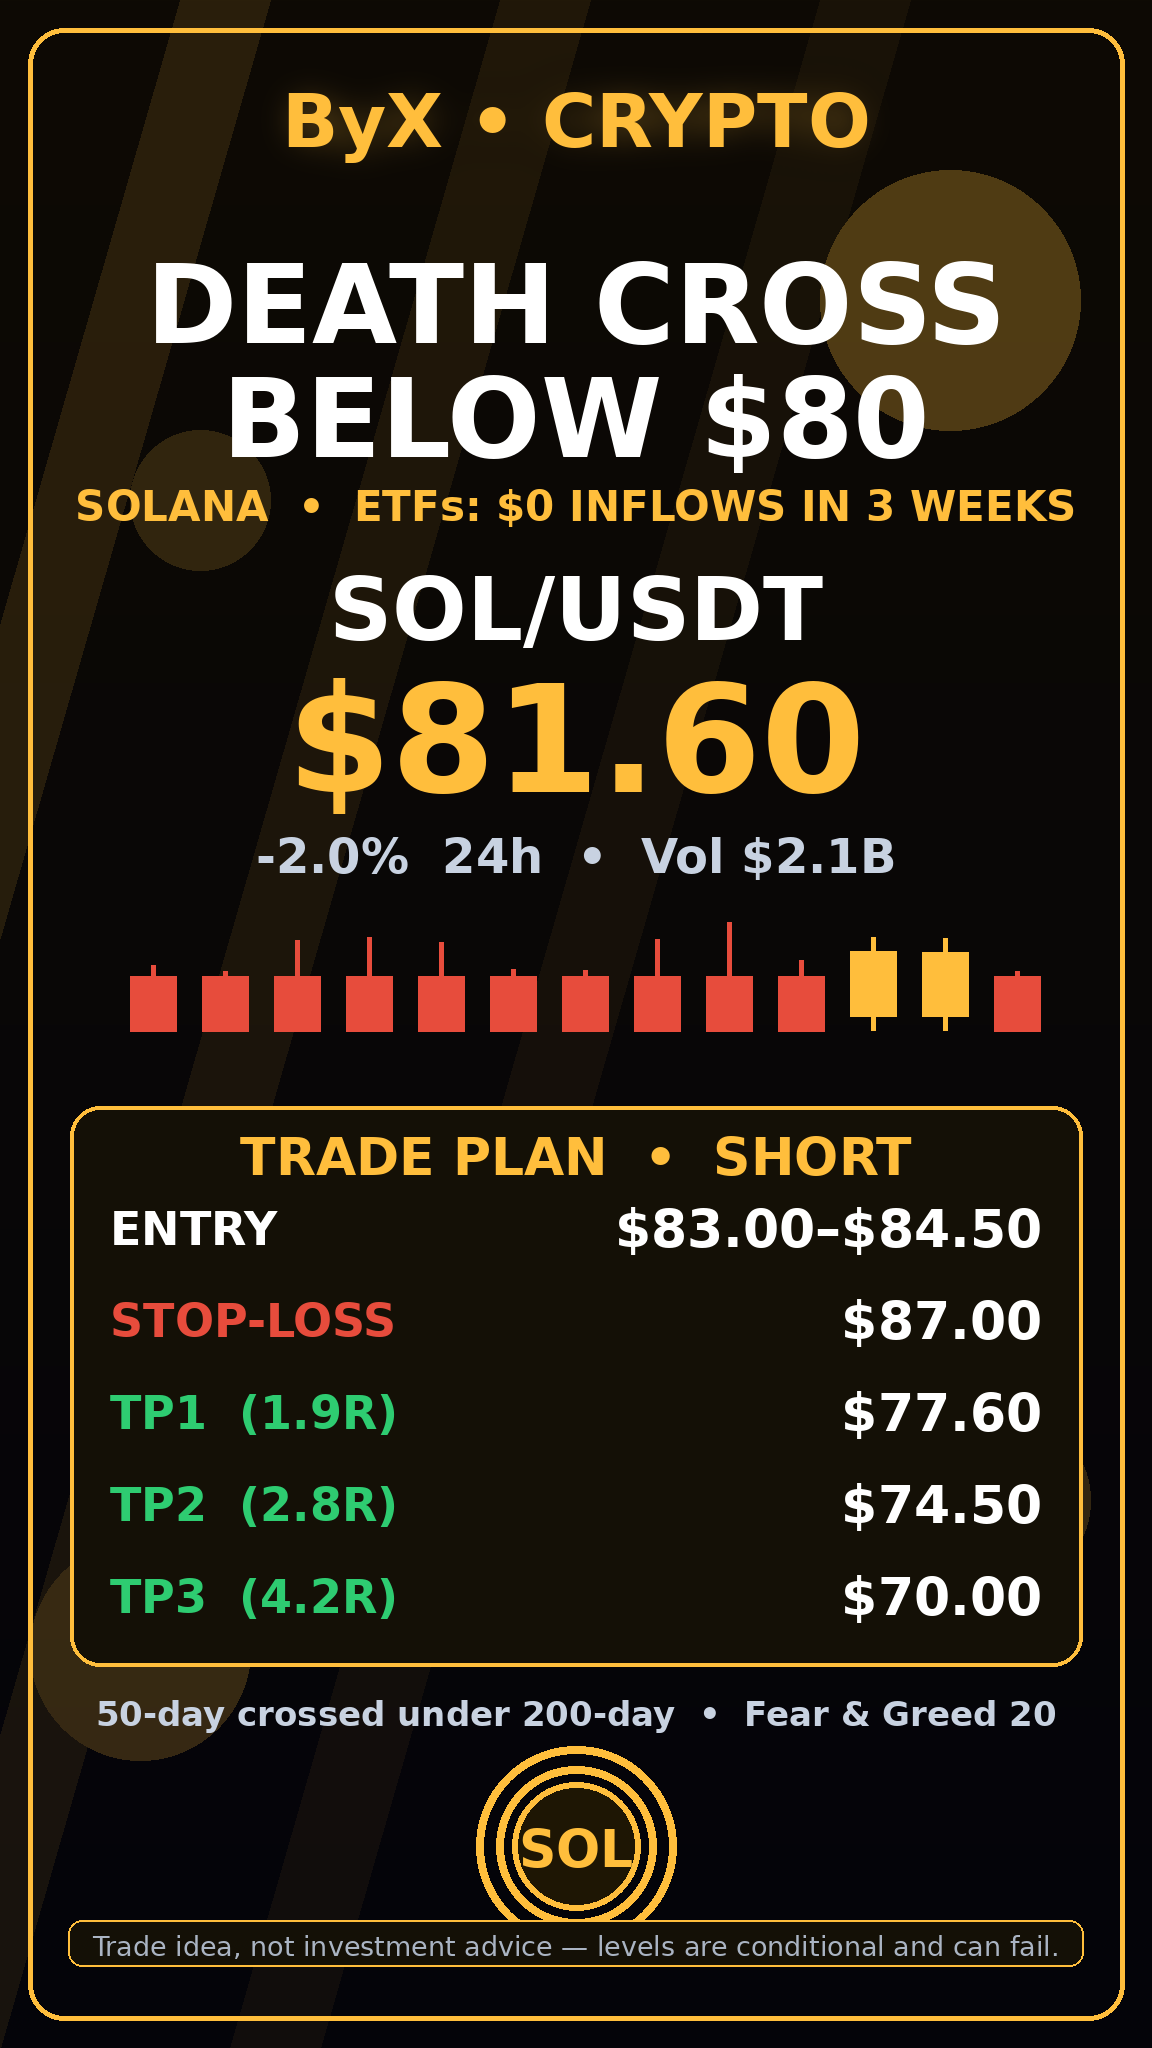
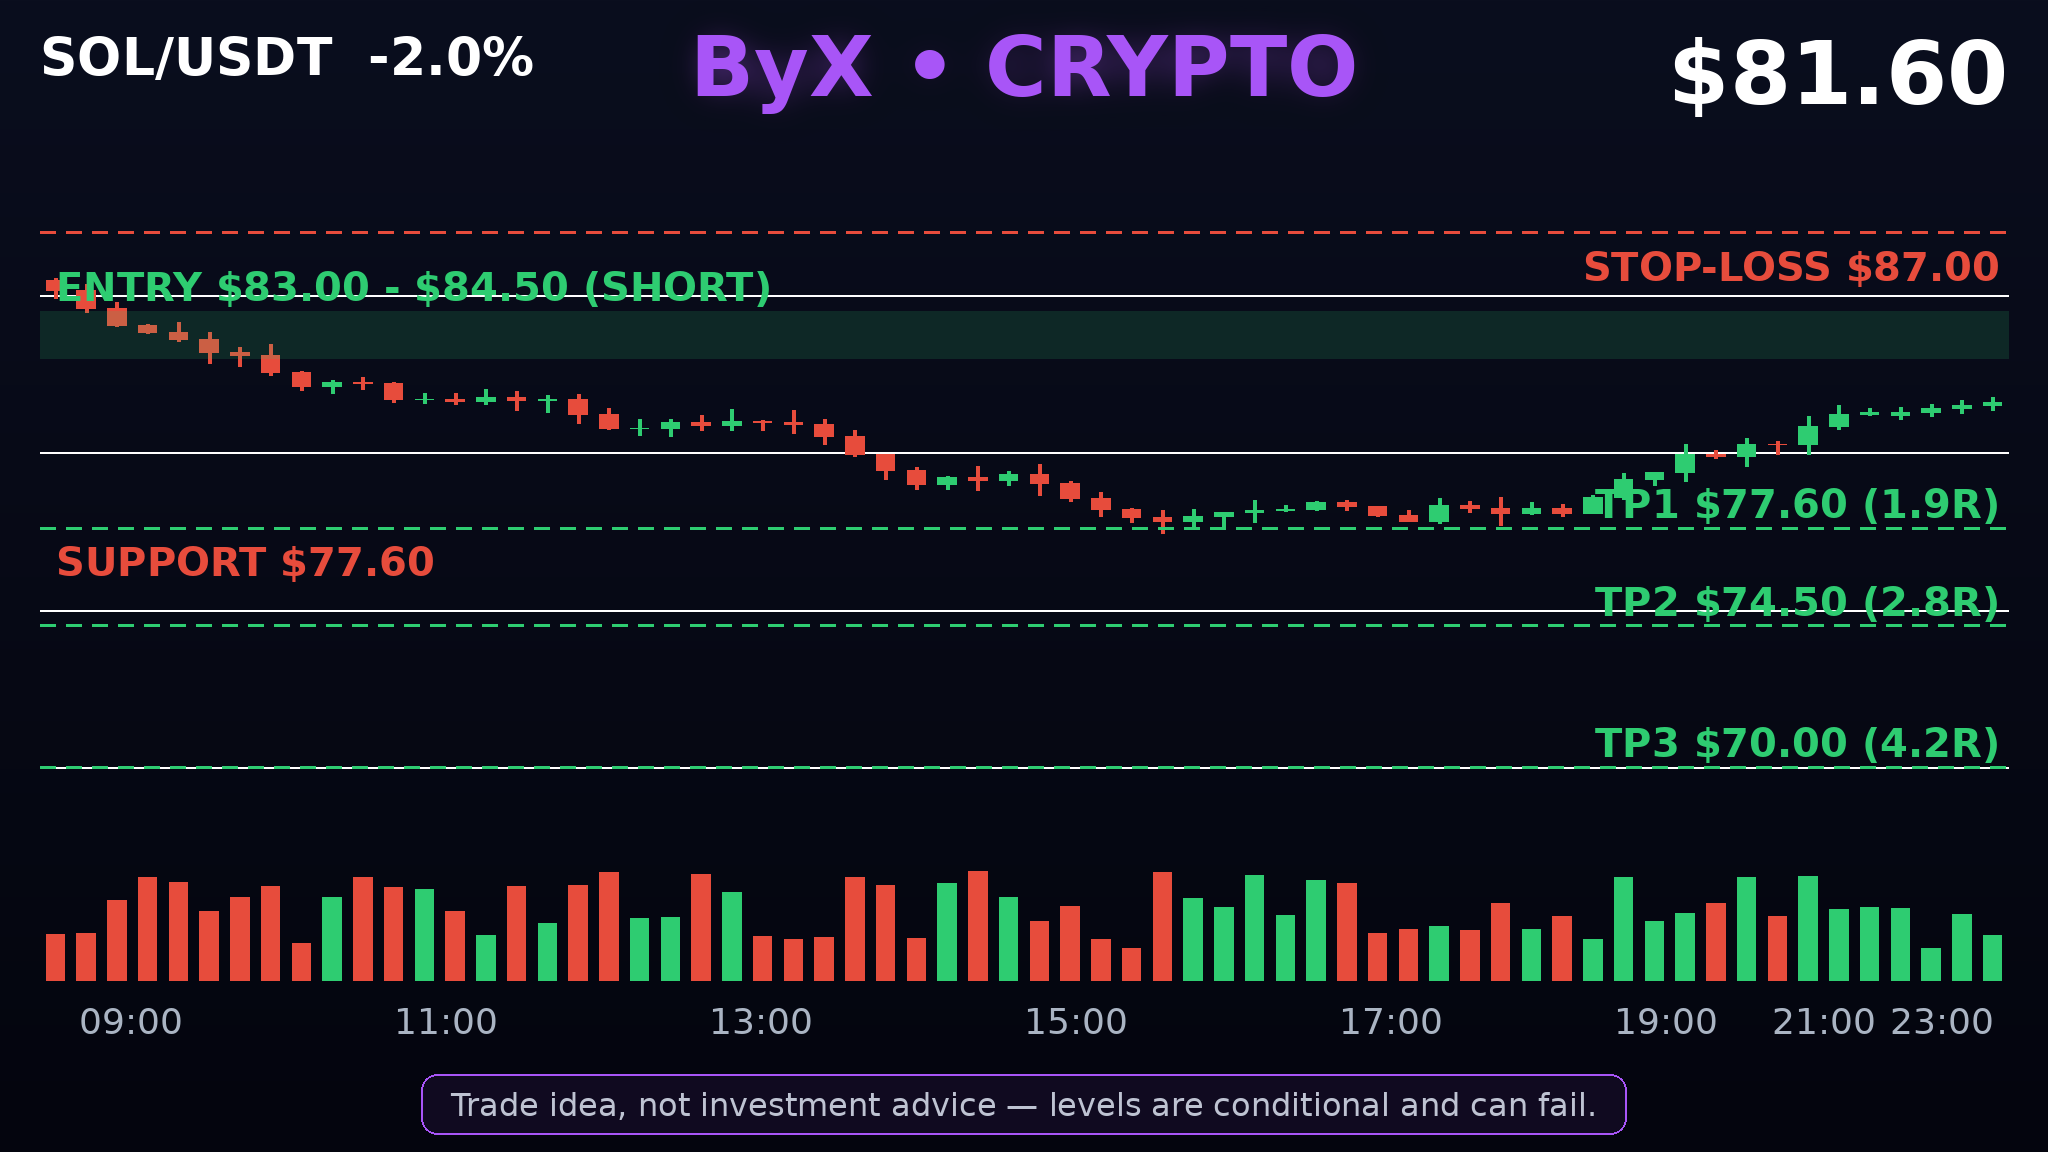
Solana just printed a death cross — and its ETFs haven't taken in a single dollar of new money in three weeks. Solana is the high-speed Layer-1. Its 50-day average ($97.55) crossed under its 200-day average ($98.62) today. SOL broke $80 intraday, swept $77.92 — its lowest since mid-August — and the bounce to $81.60 hasn't repaired the structure. Down 2.0% in 24 hours, 8.8% in a week, 23.6% in a month, and roughly 34% below the peak above $120 it held in early October. The ETF drought is the number that should worry holders most. US spot Solana ETFs have not posted a single daily net inflow since October 22 — nine straight outflow sessions worth $112.1 million, including $5.85 million on November 11. Net assets sit at $1.21 billion, down about 14% from $1.40 billion at the end of October. The buyers who were meant to catch this dip simply aren't showing up. Derivatives agree: SOL futures open interest fell 6.3% in 24 hours to $4.82 billion, futures saw $191 million in outflows on Friday, and the taker buy-to-sell ratio sits at 0.90. About $23 million of SOL longs were liquidated overnight in the $1.64 billion flush that took Bitcoin under $70,000 and pushed Fear & Greed to 20. CPI printed hot at 0.4% and traders are pricing a December Fed hike — every bounce this week has been sold. Technically, $85 decides everything — reclaim it and the breakdown fails. Below it, $80 is now resistance, not support. $77.60 is the immediate shelf; lose it and the August zone at $74.50–$77.00 opens up, with $70 behind that. The trade is a short into strength, not a chase. Entry $83.00–$84.50, the retest of the broken shelf just under $85. Stop-loss $87.00, above the resistance that would invalidate the idea. TP1 $77.60 (1.9R), TP2 $74.50 (2.8R), TP3 $70.00 (4.2R). No position if price never reaches the entry zone — a short at $81.60 pays under 1.5R at TP1 with the same stop. Bull case: the bounce is real. SOL reclaimed $80 within hours, Alpenglow went live October 21 with ~150ms finality, and tokenised assets hit a record $5 billion. If $85 reclaims with an ETF inflow breaking the drought, shorts get squeezed and $90–$95 comes back fast. Bear case: the death cross says the trend changed weeks ago; the ETF drought says no cavalry is coming. A daily close under $77.60 puts $70 in play within days — in a market where longs just lost $1.64 billion, the path of least resistance is still down. So which side are you on — A) SOL bounces from $77.60 and reclaims $85, or B) the death cross wins and $70 comes first? $SOLUSDT #ByXIMPACT #IMPACTbyTrade Trade idea, not investment advice — levels are conditional and can fail.
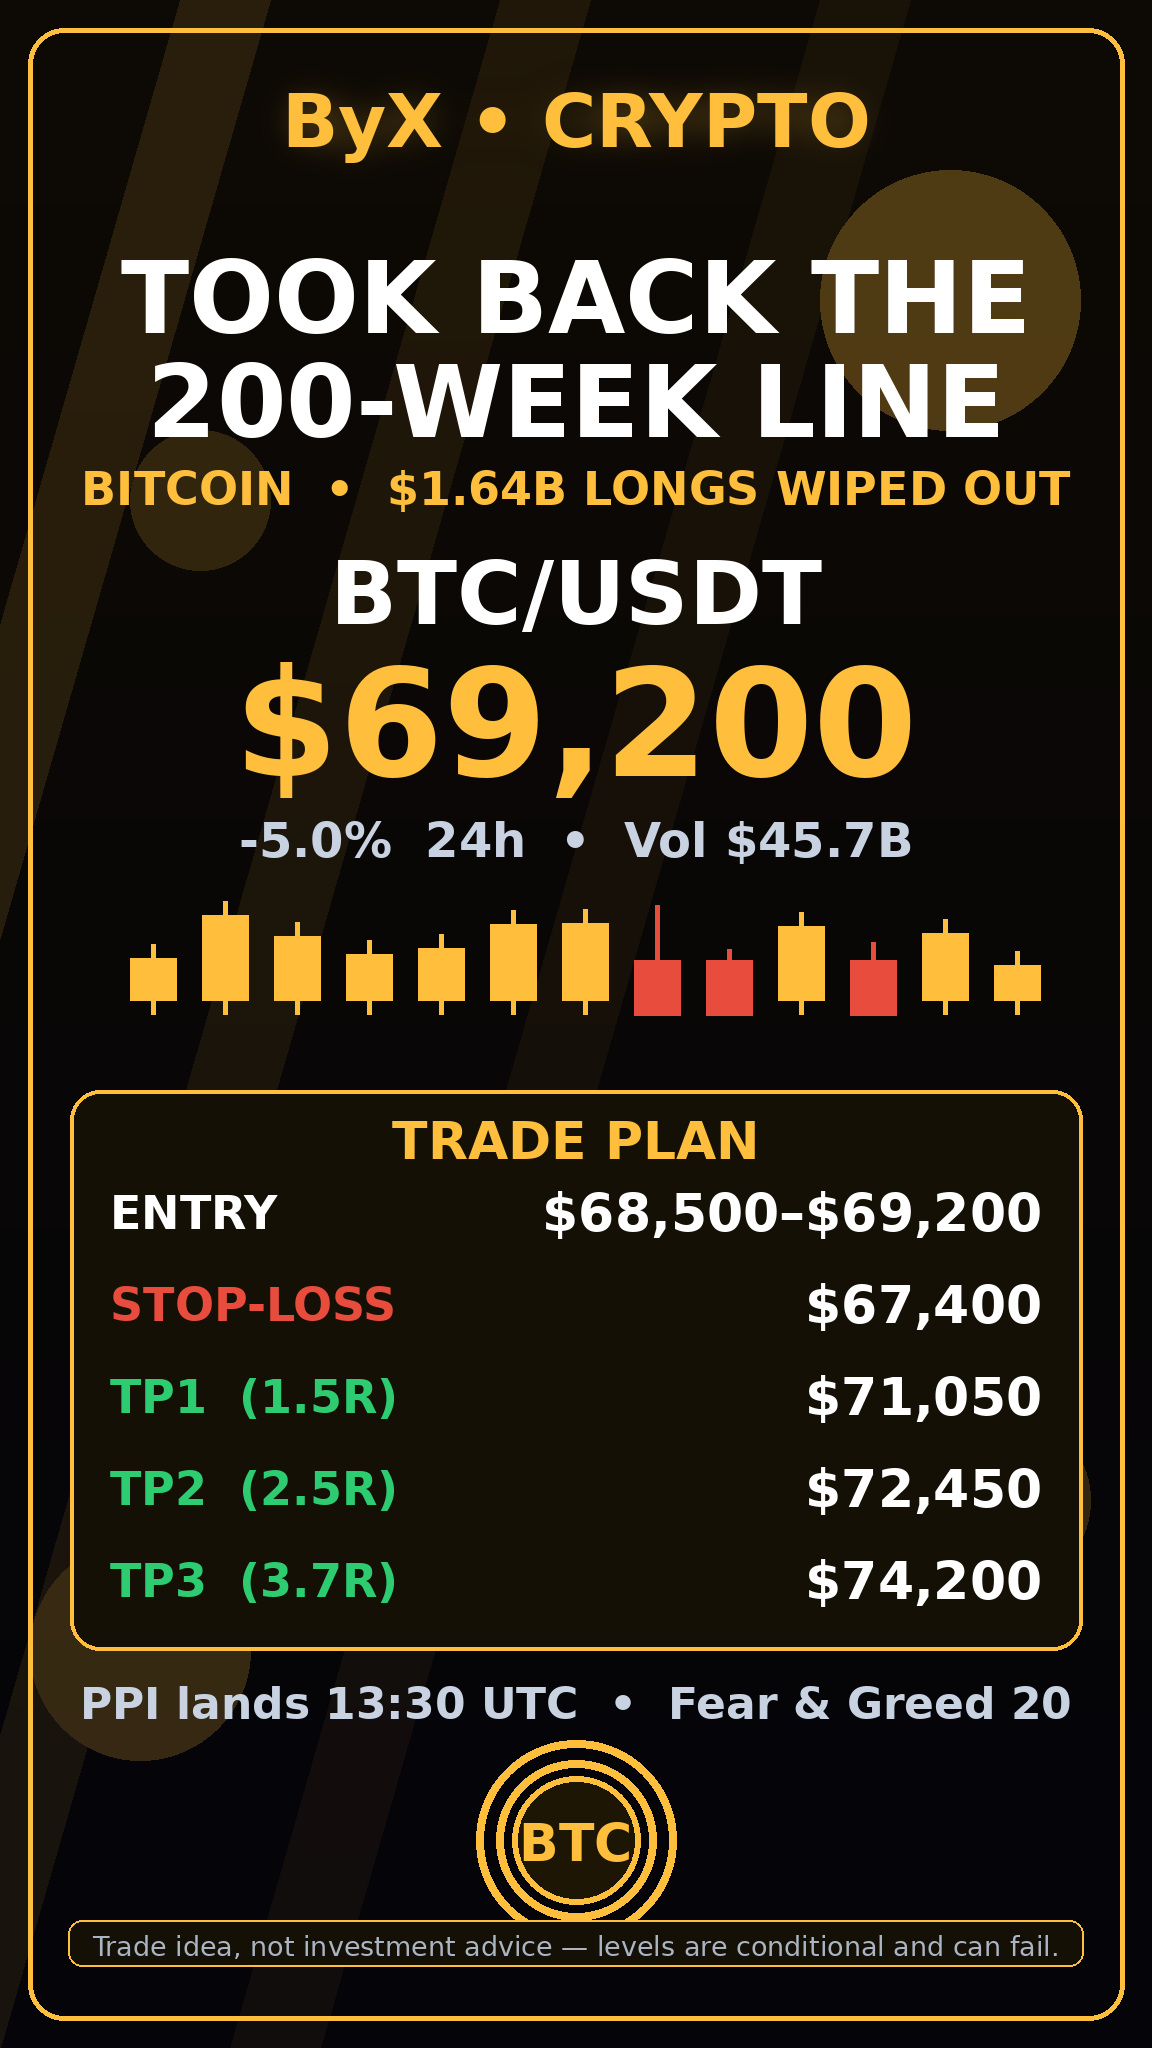
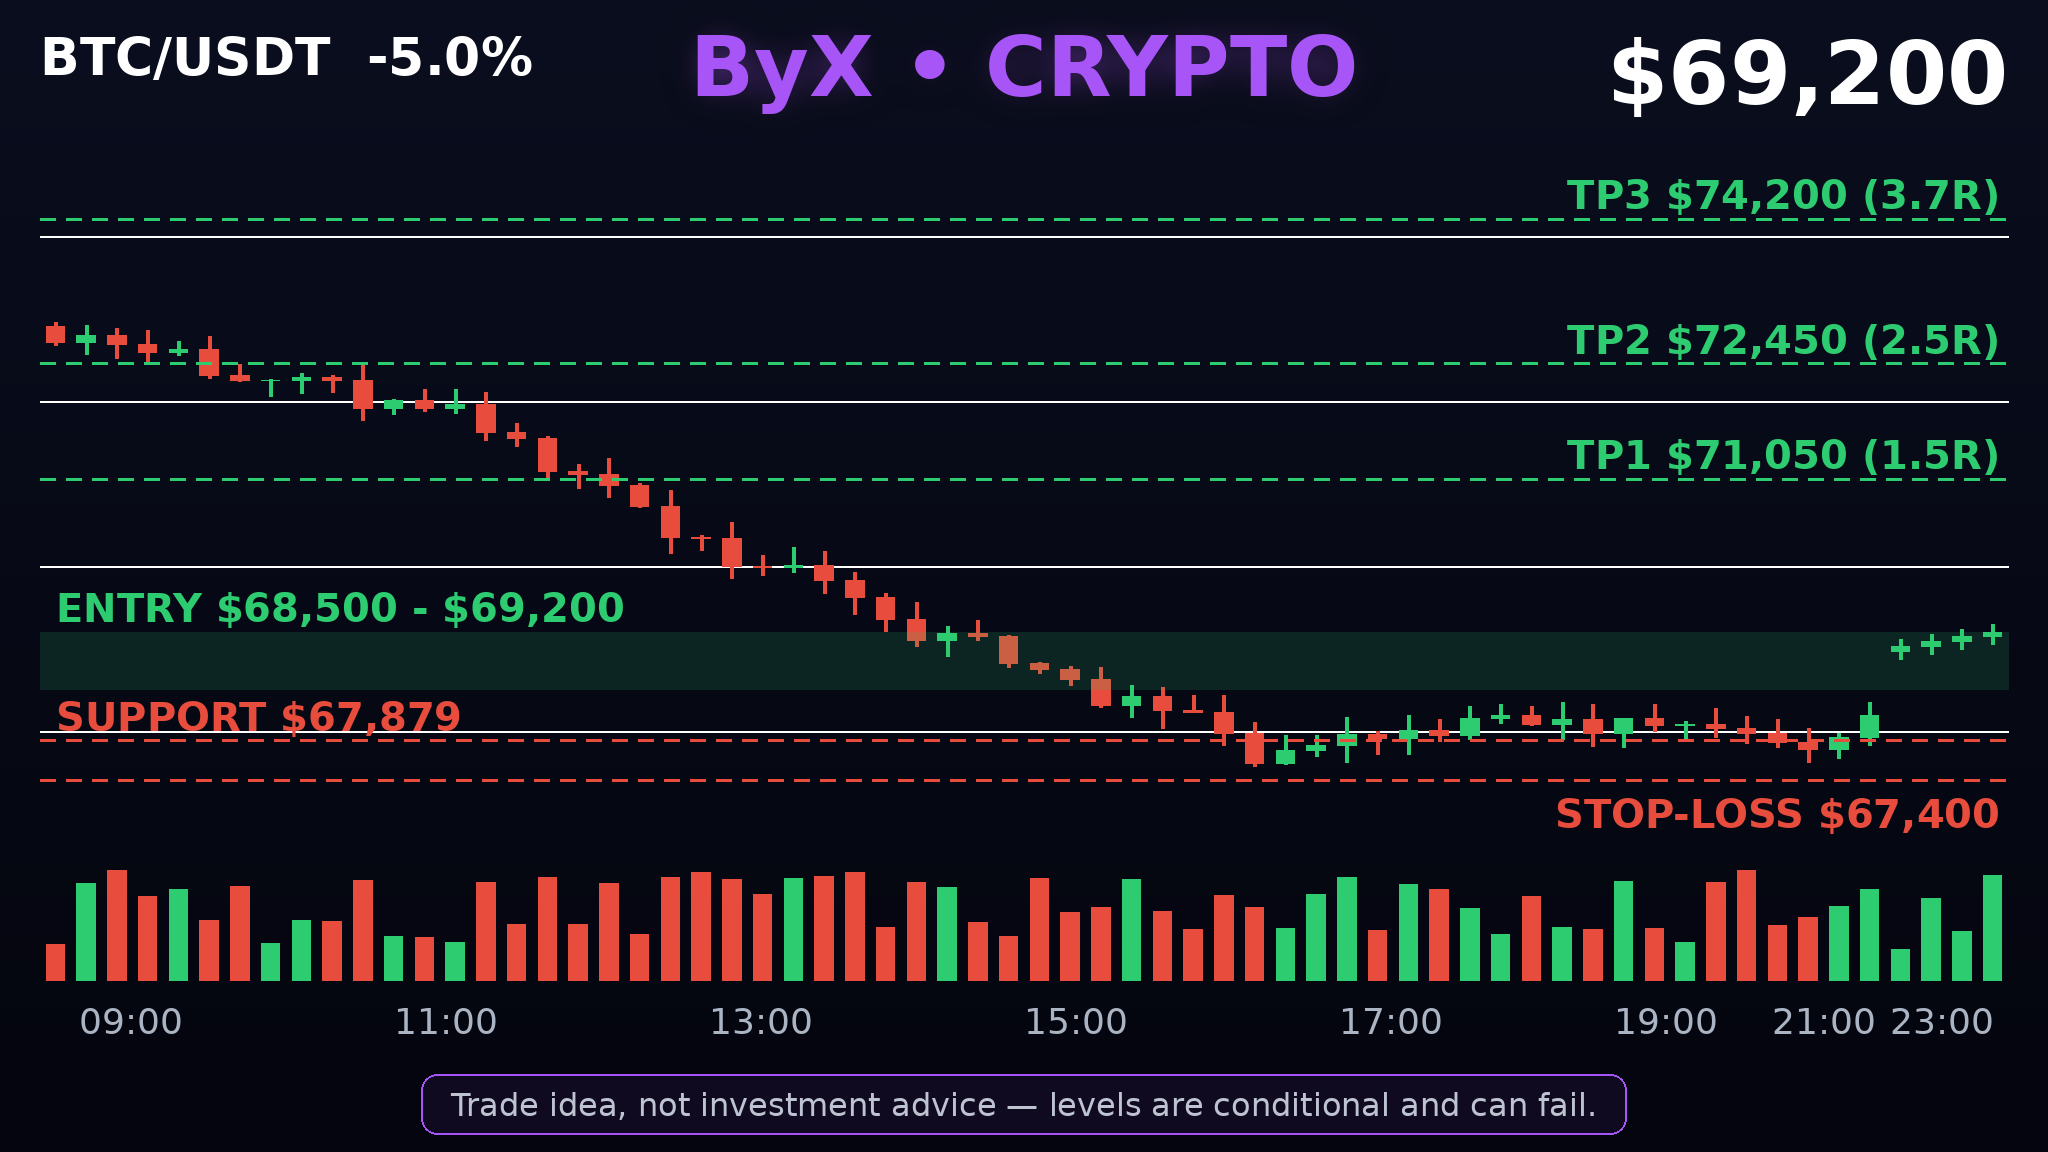
$1.64 billion in leveraged longs were liquidated in 24 hours — and Bitcoin dipped under its 200-week average, then took it straight back. Bitcoin trades at $69,200, down 5.0% in 24 hours after printing a $67,568 low — its lowest since August 19. That low sits just under the 200-week average near $67,879, the line that has marked the floor of major Bitcoin drawdowns for years. Bitcoin knifed through it, then reclaimed it within hours — a market testing whether anyone is left to sell. There is no single Bitcoin headline driving today. The pressure is macro: traders are pricing a Federal Reserve rate increase next month, the dollar index is at a 19-month high, the 10-year Treasury yield has pushed above 5.1%, and Nvidia's chief executive exited while a Microsoft outage rattled tech. October producer prices land at 13:30 UTC — about 30 minutes after this post — with economists expecting a 0.4% monthly rise. A soft PPI gives the whole tape room to breathe; a hot one hands the bears their next leg. The derivatives tape tells the real story. CoinGlass counts $1.64 billion liquidated across crypto in 24 hours, 88.7% of it longs, with Bitcoin alone accounting for $916 million — 95.2% of that longs. Bitcoin futures open interest fell to $47.79 billion, down 6.0% in a day, while futures volume exploded 116% to $101.5 billion. Funding has flipped negative on OKX at -0.0064%, the first time shorts pay longs since November 7, and the biggest short liquidation cluster sits at $72,445, worth $120.9 million — a magnet just above price. US spot Bitcoin ETFs have bled for six straight sessions, $1.44 billion in total, and the Fear & Greed Index reads 20 — its first Extreme Fear print since July. Bitcoin is down 9.1% on the week. Technically this is a capitulation wick, not a breakdown — yet. The 24-hour range runs $67,568 to $72,996, with resistance stacked overhead: $70,000, the psychological line lost overnight; $71,113, the November 12 low turned resistance; and $72,445, home of the short cluster. Support is the $67,879 200-week average and the $67,568 low beneath it. Hold above that zone and the flush looks like a washout; a daily close under $67,400 changes the picture. The trade: buy the reclaim into $68,500–$69,200, stop-loss $67,400 below the 200-week average and the day's low, invalidation on a daily close under $67,400. TP1 $71,050 (1.5R) reclaims the November 12 low, TP2 $72,450 (2.5R) runs into the $120.9 million short cluster, TP3 $74,200 (3.7R) targets the November 11 close near $74,015. Timeframe: 1–3 days. Bull case: if PPI comes in soft, negative funding, a cleaned-out long book and that short cluster overhead can squeeze Bitcoin back through $70,000 fast — survivors of a $1.64 billion flush usually lead the bounce. Bear case: if PPI runs hot and Fed-hike pricing hardens, $67,400 gives way, the 200-week average becomes resistance instead of support, and the next stop is the August lows. A) Bitcoin holds the 200-week average and reclaims $71,050 first, or B) $67,400 breaks and the flush extends? $BTCUSDT #ByXIMPACT #IMPACTbyTrade Trade idea, not investment advice — levels are conditional and can fail.
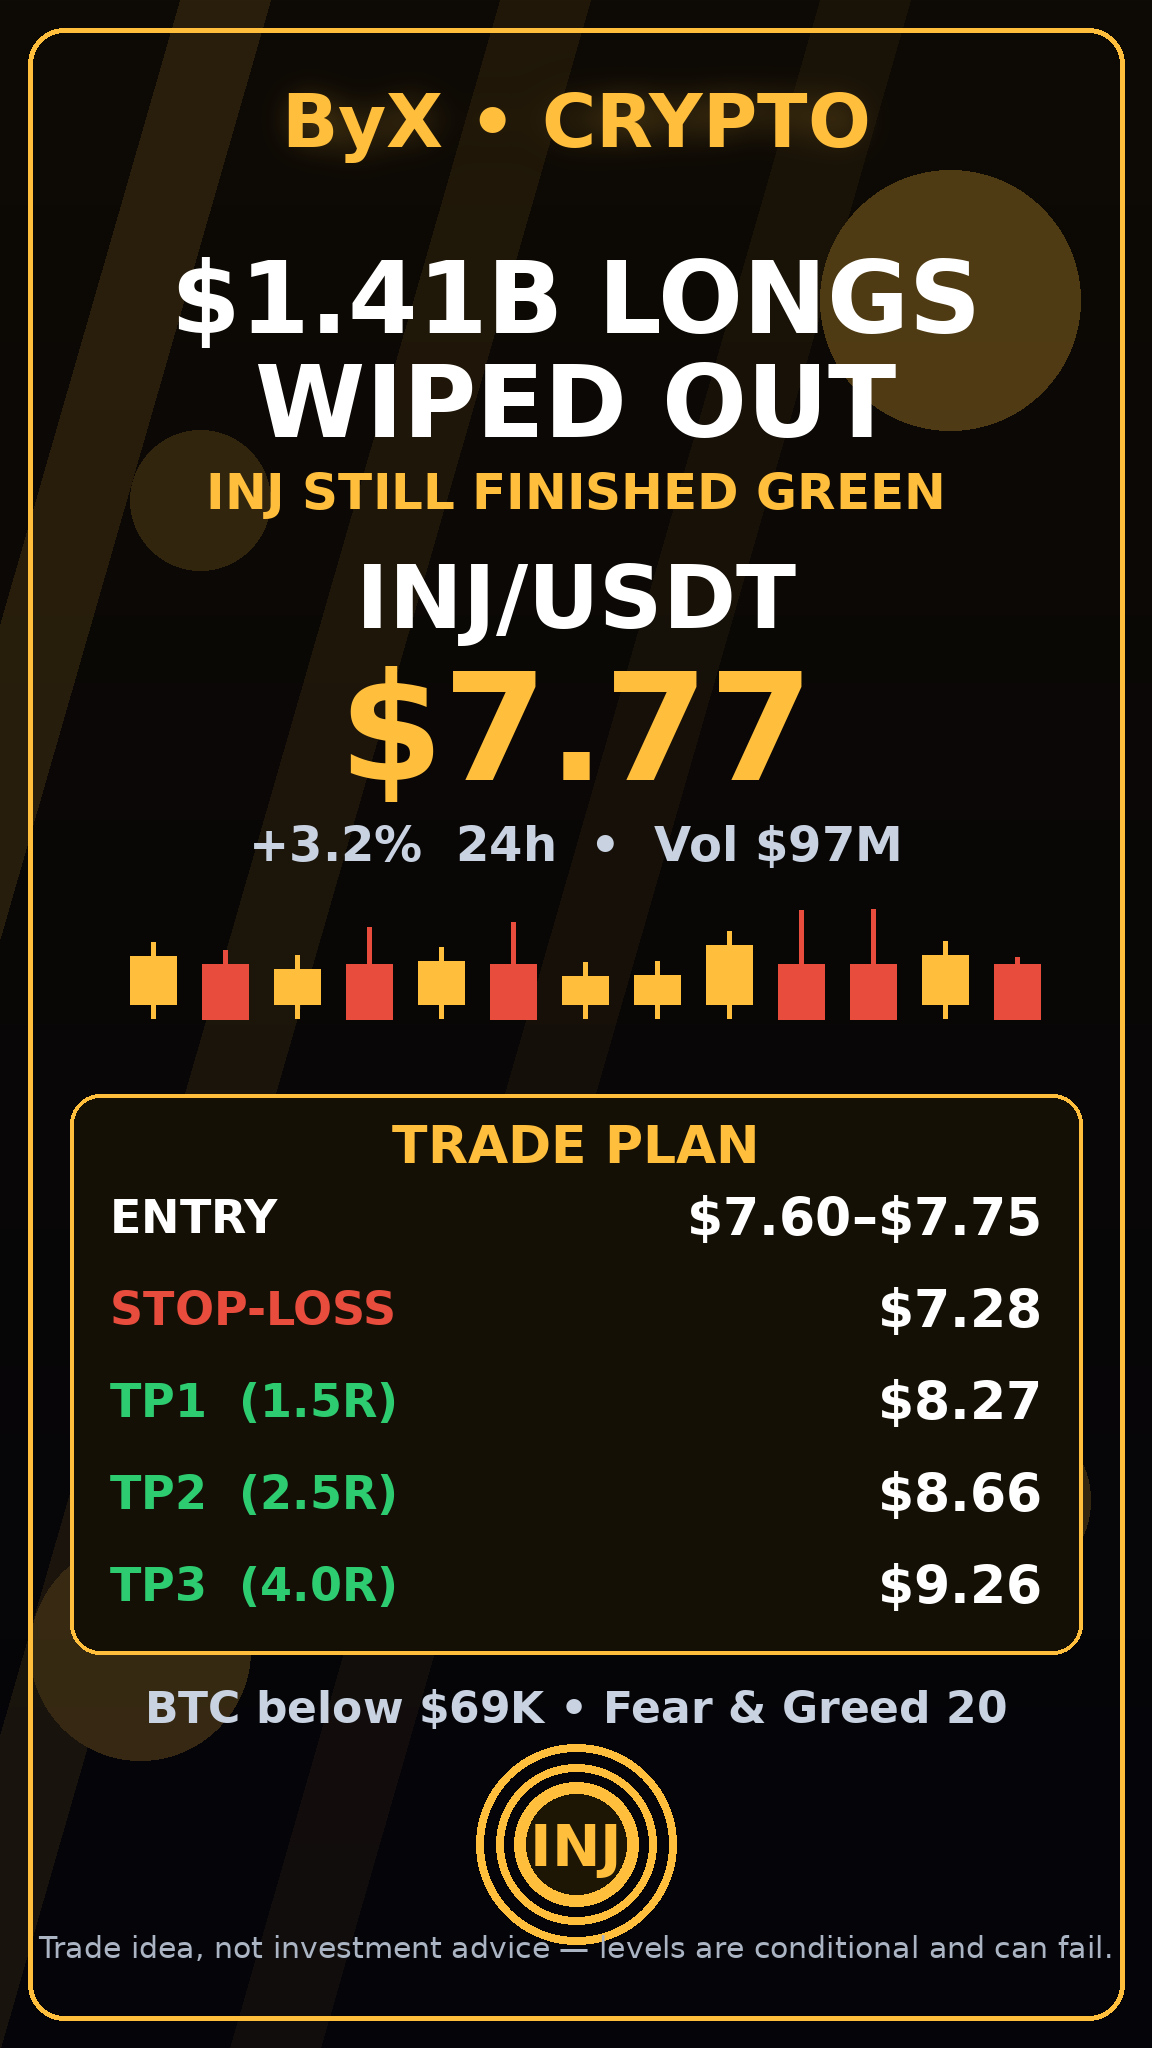
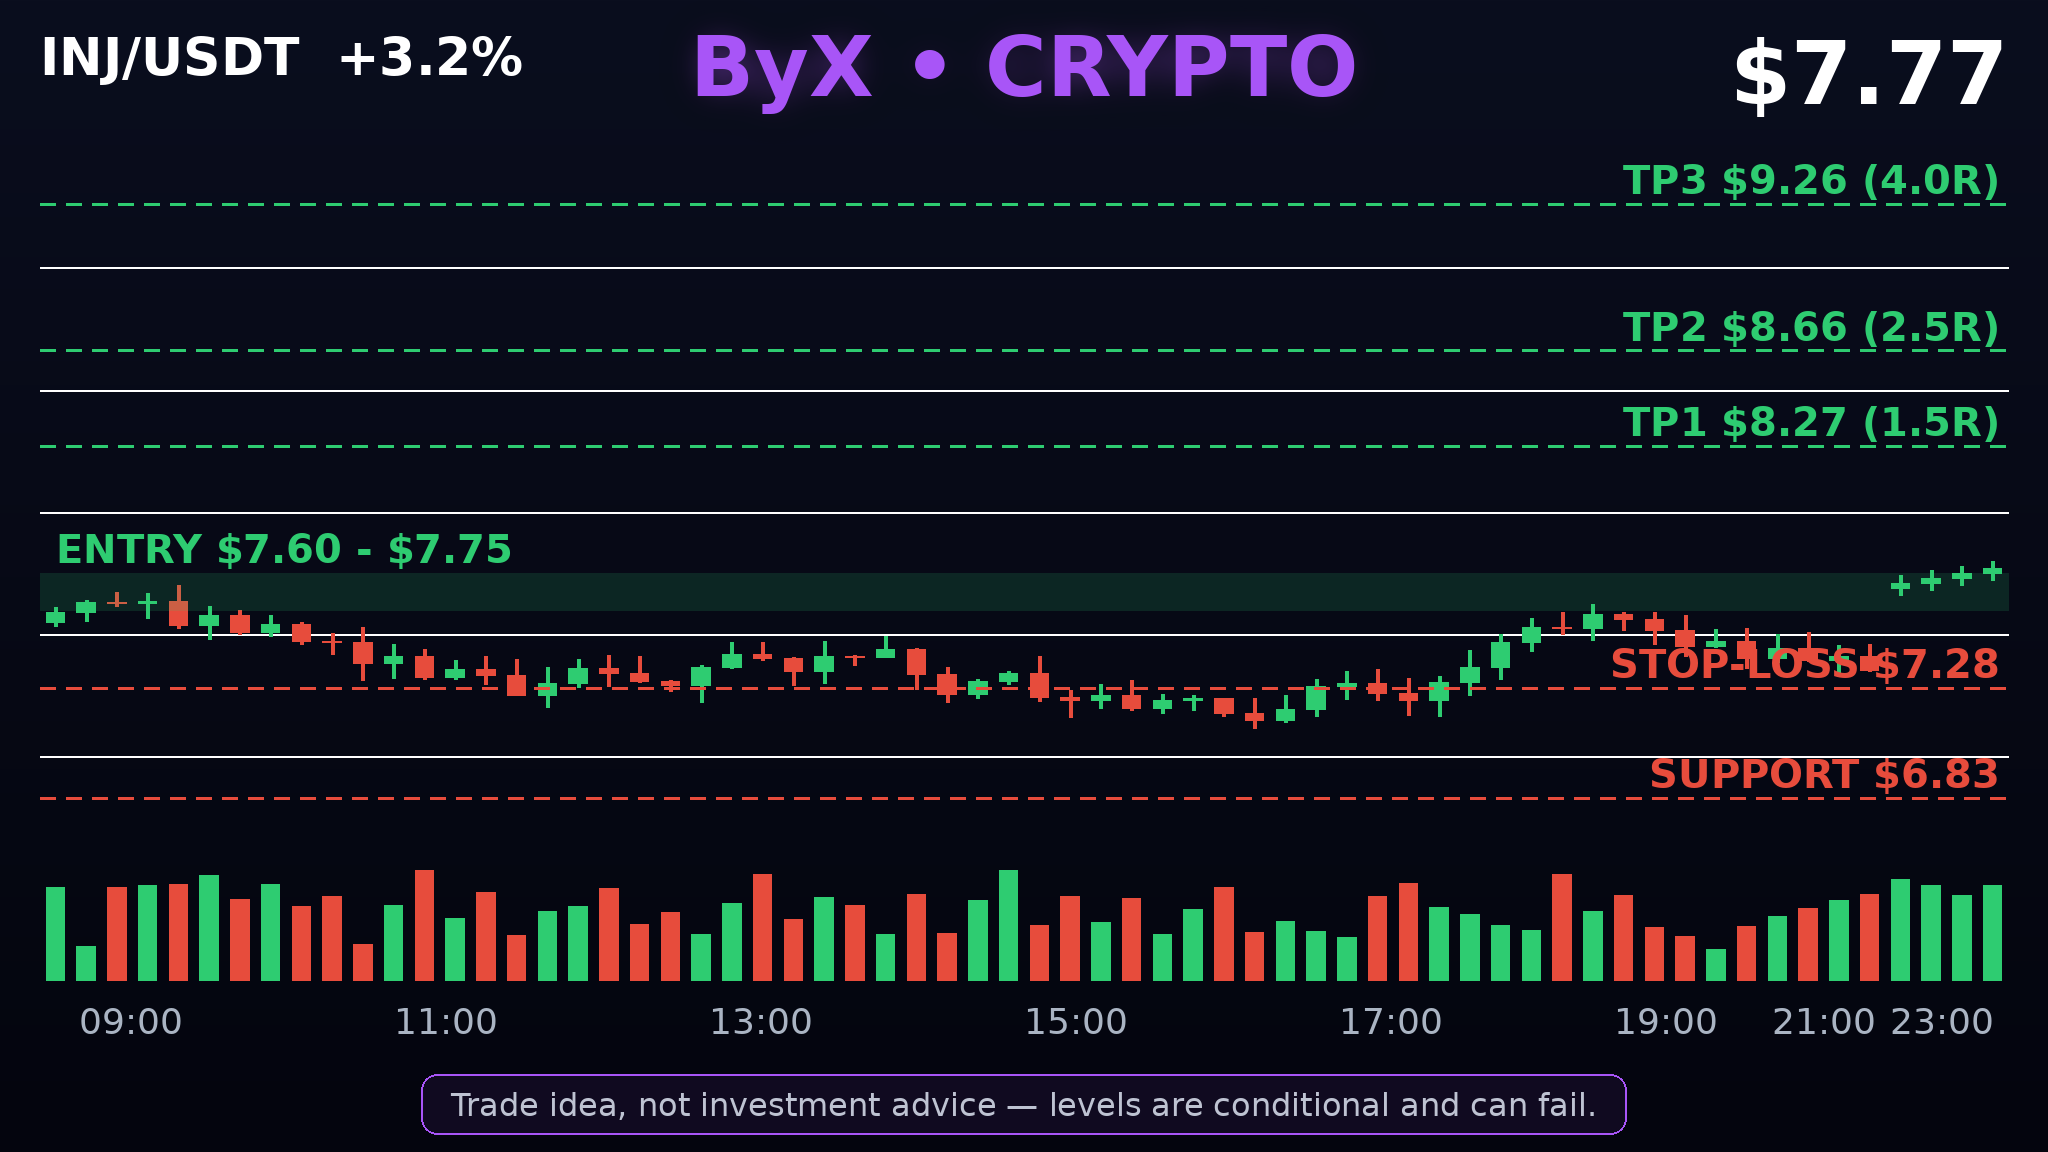
$1.41 billion in longs were liquidated in 24 hours — and Injective still finished the day green. While Bitcoin crashed below $69,000 for the first time since August, Injective is up 3.2% on the day. That is not a random bounce. That is a coin refusing to bleed while the rest of the market is getting flushed. Injective is a Layer 1 blockchain built for on-chain finance — decentralised exchanges, derivatives and tokenised real-world assets run natively on it, on a fully on-chain order book. There is no fresh Injective-specific headline today, and I will not invent one: the story is the divergence itself, plus a real catalyst still playing out — Injective's integration with Republic, announced on August 21, bringing its Layer 1 into Republic's on-chain investment infrastructure, with Republic already running as an INJ validator. The macro backdrop is brutal. Bitcoin sits at $69,345, down 4.8% in 24 hours and 46% below its $126,156 all-time high. US spot Bitcoin ETFs have bled $1.44 billion over five straight sessions. CoinGlass puts 24-hour liquidations at $1.41 billion, 89% of it longs, and the Fear & Greed Index has collapsed to 20 — its first Extreme Fear reading since July. US producer-price data lands at 13:30 UTC today, with traders braced for a hot print. Against that tape, INJ holding $7.77 on roughly $97 million of 24-hour volume is the market telling you something: sellers tried to drag it down with everything else and failed. Technically, INJ bottomed at $7.19 in the last 24 hours and has climbed back to $7.77. Resistance sits at $7.98, the level that capped the last two pushes, and support is $6.83. The coin is still 85.7% below its $52.62 all-time high from March 2024 and down 7.7% over the past week — a beaten-down coin bouncing off its lows, not one chasing a top. Funding on OKX is -0.045% per 8 hours, meaning shorts are paying longs, and Injective's DeFi TVL holds at $20.8 million. The trade: buy the dip into $7.60–$7.75, stop-loss $7.28 below the zone that must hold, invalidation on a close back under $7.30. TP1 $8.27 (1.5R) takes out the $7.98 resistance, TP2 $8.66 (2.5R) targets the next supply shelf, TP3 $9.26 (4.0R) plays the full mean-reversion leg toward double digits. Timeframe: 1–3 days, levels from today's 24-hour range and the $6.83 support / $7.98 resistance. Bull case: if the PPI print comes in soft and Bitcoin stabilises above $69,000, the coins that held up during the flush lead the rebound — and INJ is the clearest candidate, with negative funding squeezing shorts and the Republic RWA story giving buyers a reason to stay. Bear case: if PPI runs hot and Bitcoin loses $68,000, the divergence dies fast — INJ gives back the whole move, the $7.28 stop is hit, and $6.83 is next. A) INJ leads the relief rally and reclaims $8.27 first, or B) the flush resumes and $7.28 breaks first? $INJUSDT #ByXIMPACT #IMPACTbyTrade Trade idea, not investment advice — levels are conditional and can fail.