BYBKing
Alpha Traderz | Daily BTC, Gold XAUUSD & Crypto Signals. Technical + On-chain analysis. Learn, trade, grow together. Not financial advice.
JUST IN : 🇺🇲 Elon Musk announces he will give one of his SpaceX shares to " every kid in America" next year. $SPCXXUSDT This will be the first of many .


🇺🇲 US CPI DATA TODAY
Inflation is expected to rise from 3.4% to 3.6%. Previous: 3.4% Forecast: 3.6% If inflation comes in higher than expected, Bitcoin could come under pressure. If inflation is lower than expected, $BTCUSDT could get a boost. #ByXIMPACT

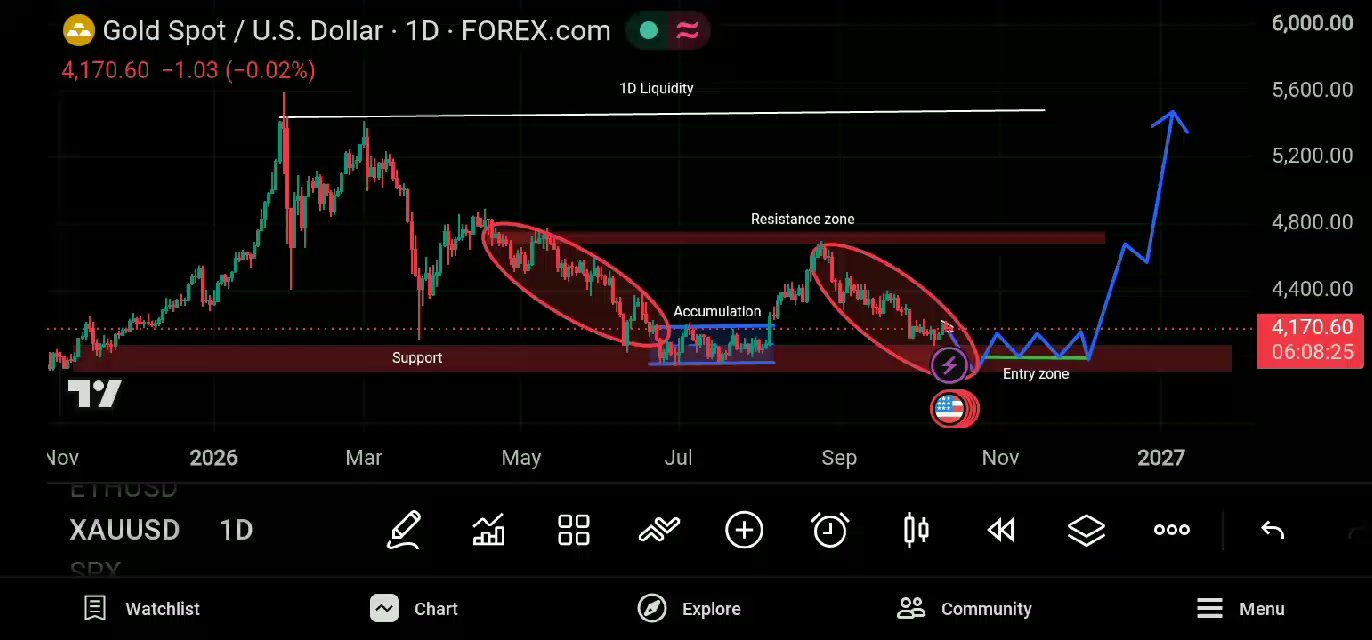
Gold repeat the same pattern. Gold drop form $4800 to $4100 and then start accumulate for Long time . After accumulate gold break the accumulation zone and reach again $4800 then face rejection from resistance and again back to support at $4100. The same pattern is repeating and now gold reverse at support 4100 - 4000 . After reach at support gold bounce and start to accumulate for a long time as happen in the previous $XAUTUSDT structure. Now there is highly chances Gold pump and again sweep the Bayside Liquidity at $5100. I planned buy setup Entry after sweep sell side liquidity and show the sign of reverse. Morever wait for the complete trend reversal and then enter buyside . stop Loss below the support. Take profit 1 at resistance 4800 and Target 2 buyside liquidity at 5100. If candle break the support this invalidates the setup and then plan sell set-up but highly chances of pump to sweep buyside liquidity. This is for educational purposes only not financial advice. Your BYBKing. #ByXIMPACT
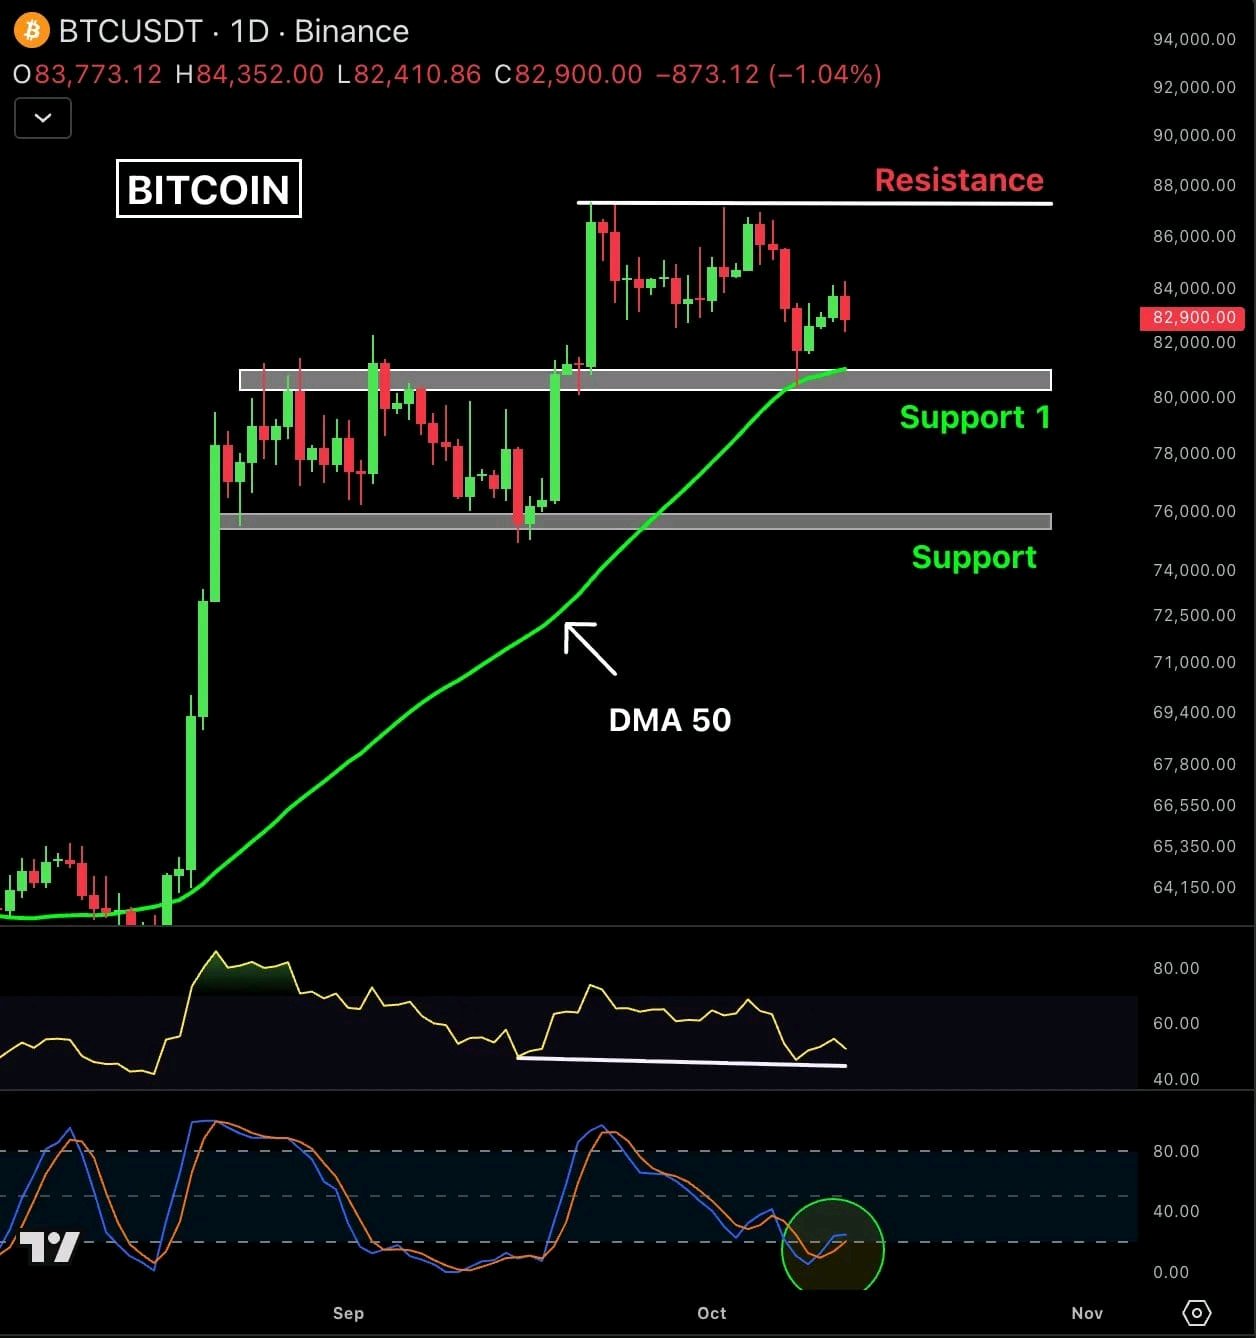
Bitcoin bounced from the Daily MA 50 support and trading near $83,000. Now, all eyes on the $80,960 support and $87,500 resistance. The next major test comes on October 14 with the US CPI report. #BybitOdds
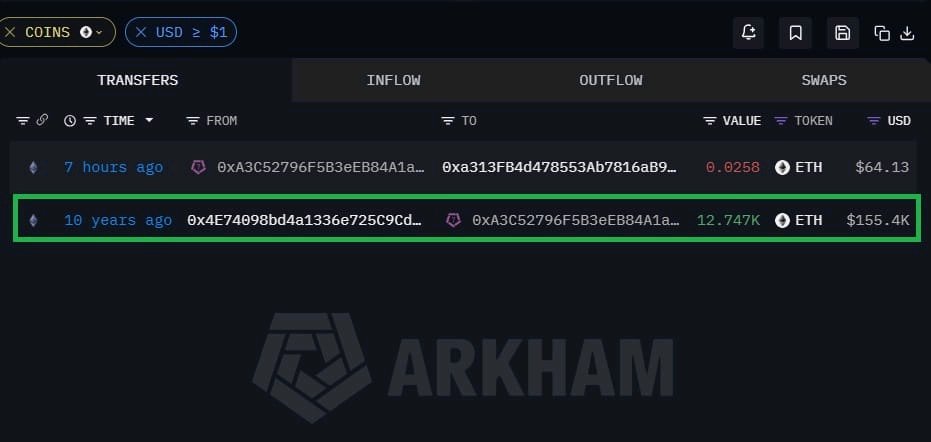
Someone bought 12,747 ETH at $12 in 2016. Held it for 10 years and survived multiple 80%+ crashes. Today, he moved his holding, which is now worth $31,860,000. A 20,400% return by simply believing.
BREAKING: 🇺🇸 Elon Musk says SpaceX reaching a $1 quadrillion valuation is a “possible” outcome.$SPCXXUSDT

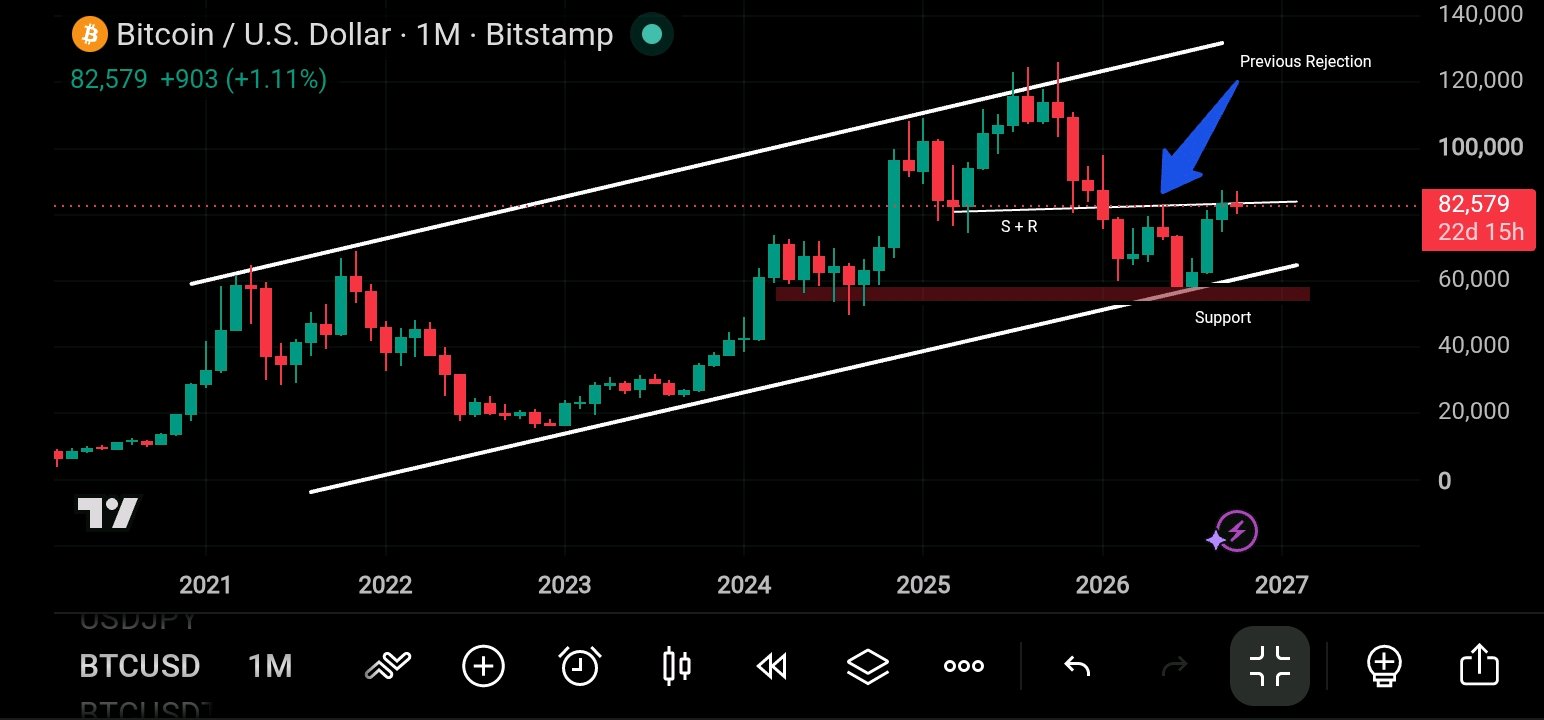
BTC Is At A Critical Decision Zone
$BTCUSDT is testing the $82K–$85K resistance area after bouncing from the $55K–$60K support zone. On the monthly chart, price is still holding inside the long-term ascending channel, but the previous rejection makes this level crucial. Bullish Case A strong monthly close above $85K–$90K could turn this resistance into support and open the door toward $100K and potentially a retest of the previous highs. Bearish Case Another rejection could push BTC back toward $75K–$70K. If selling pressure increases, the major $55K–$60K support zone becomes the level to watch. My Take: $BTCUSDT is at a make-or-break level. A confirmed breakout could bring bullish momentum back, but until resistance is cleared, another rejection remains possible. Would you buy the breakout or wait for a pullback?
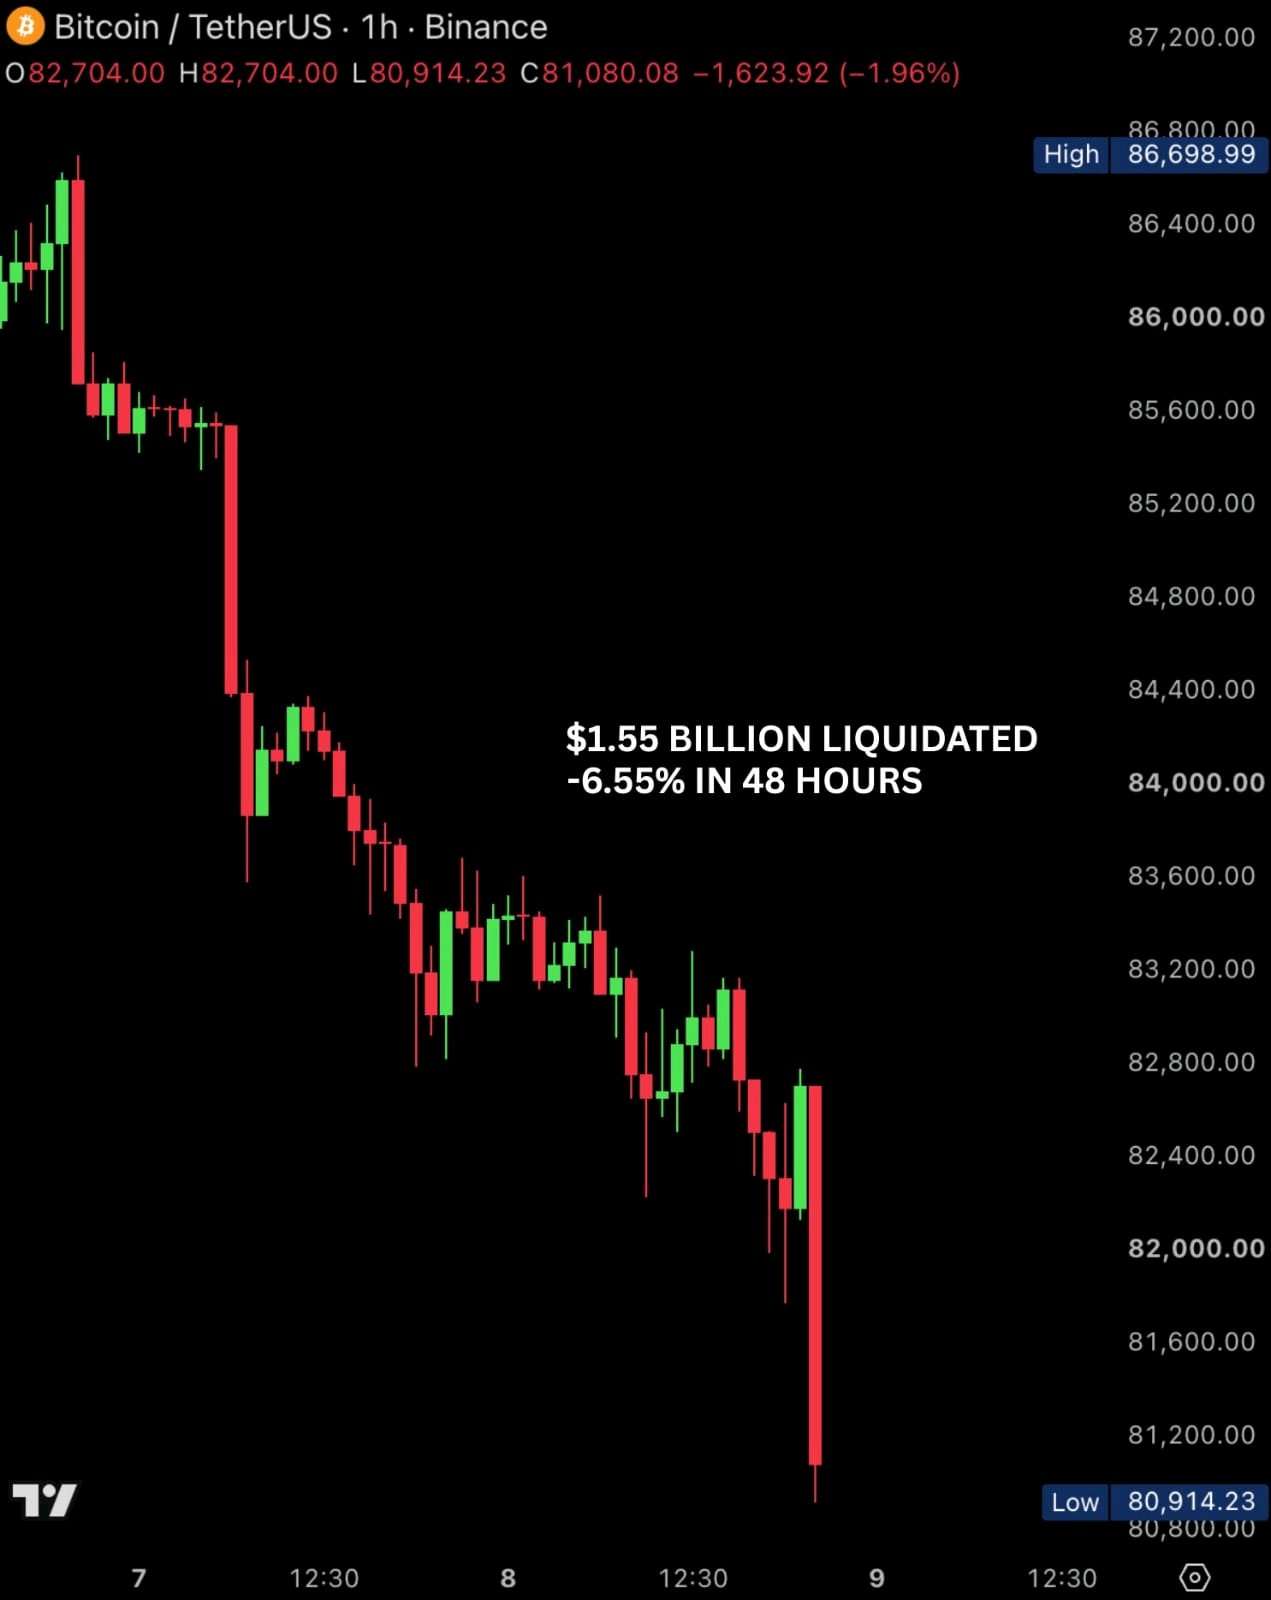
🚨 Over $215 billion has been wiped out from the crypto market in the last 48 hours. In the last hour alone, $410 million worth of longs were liquidated. $BTCUSDT has crashed below $81,000. Ethereum has crashed below $2,450. Here is why this is happening #BybitOdds
🇺🇸 Key takeaways from today’s Fed Minutes: • All 19 officials supported September’s rate hike • Most expect another hike in 2026 • Inflation risks remain tilted higher • Many saw risk-management reasons to raise rates • Several see rates as only mildly restrictive • Job market expected to remain stable • Economic outlook strengthened since July • AI investment continues to surprise to the upside but could drive inflation up #FOMC #FOMCMinutes

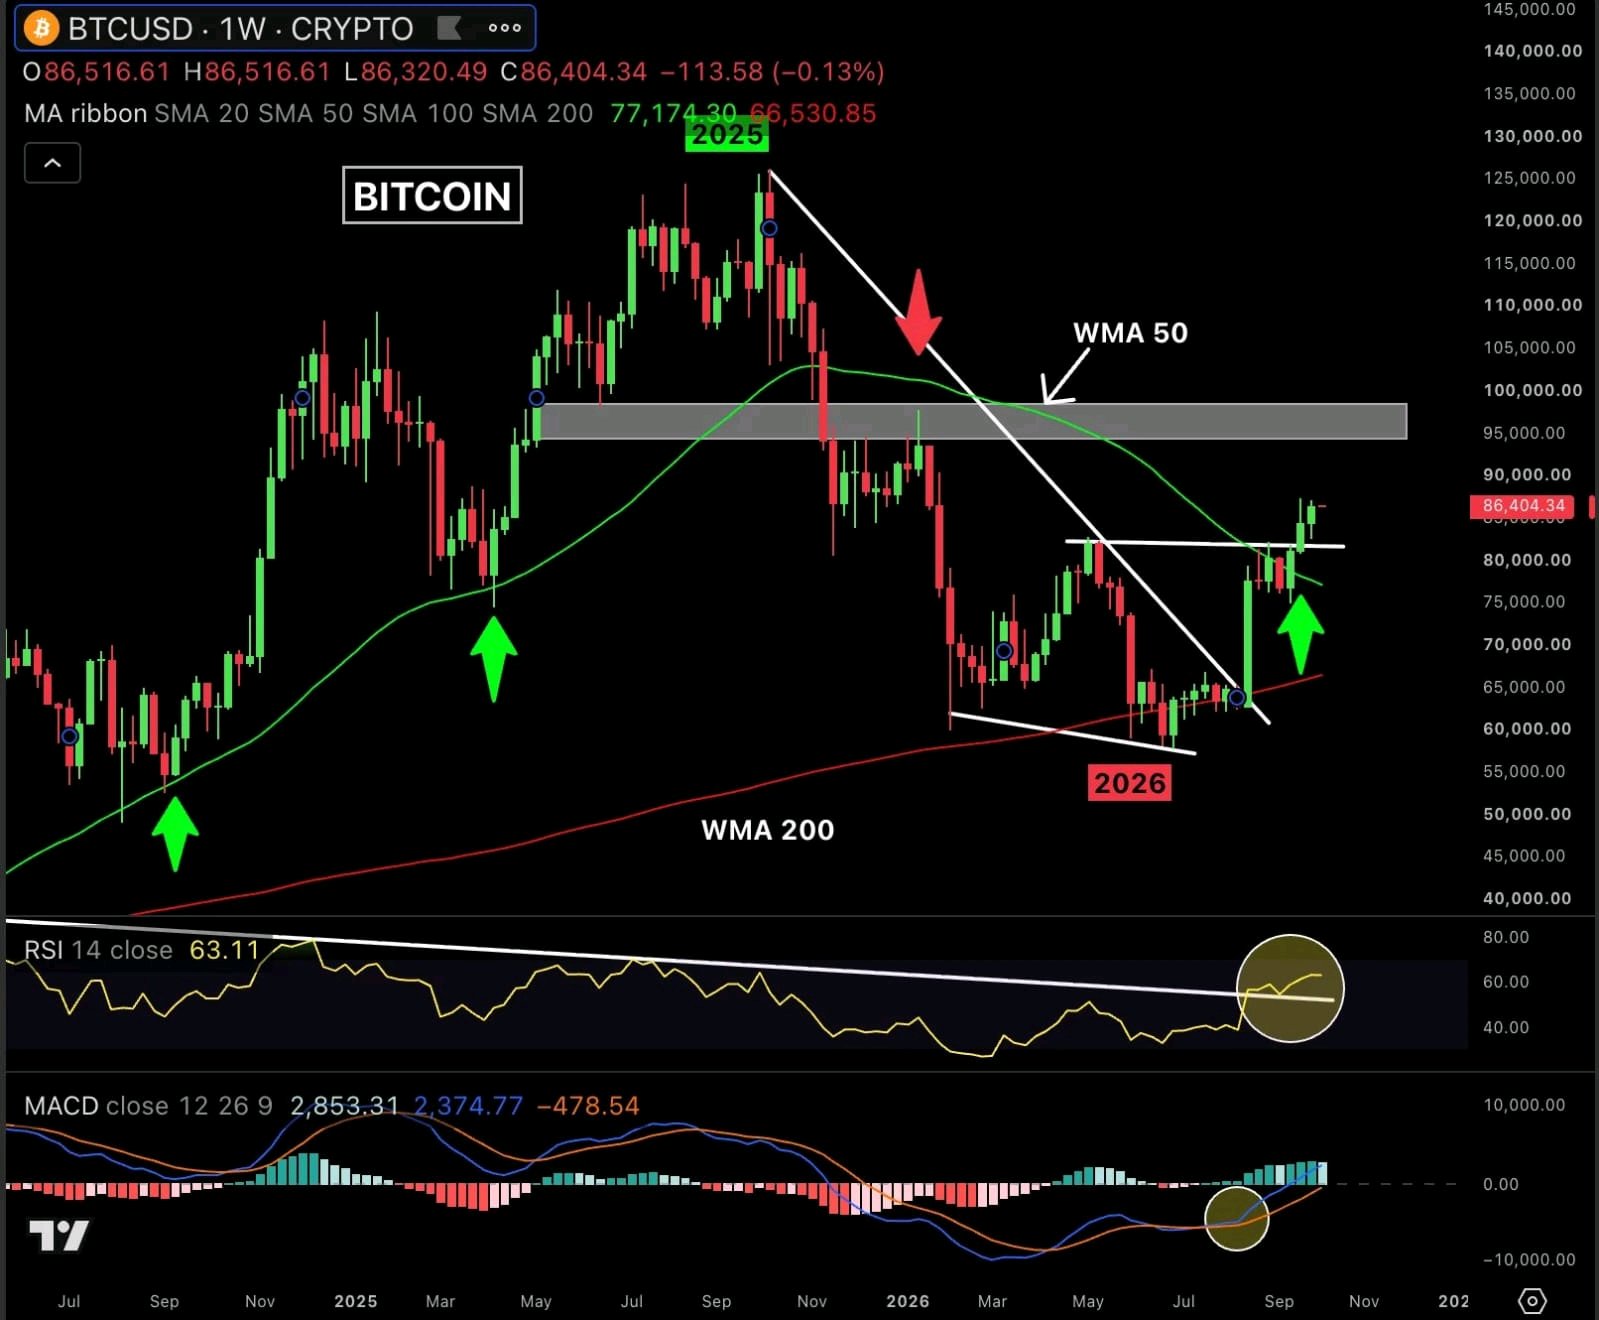
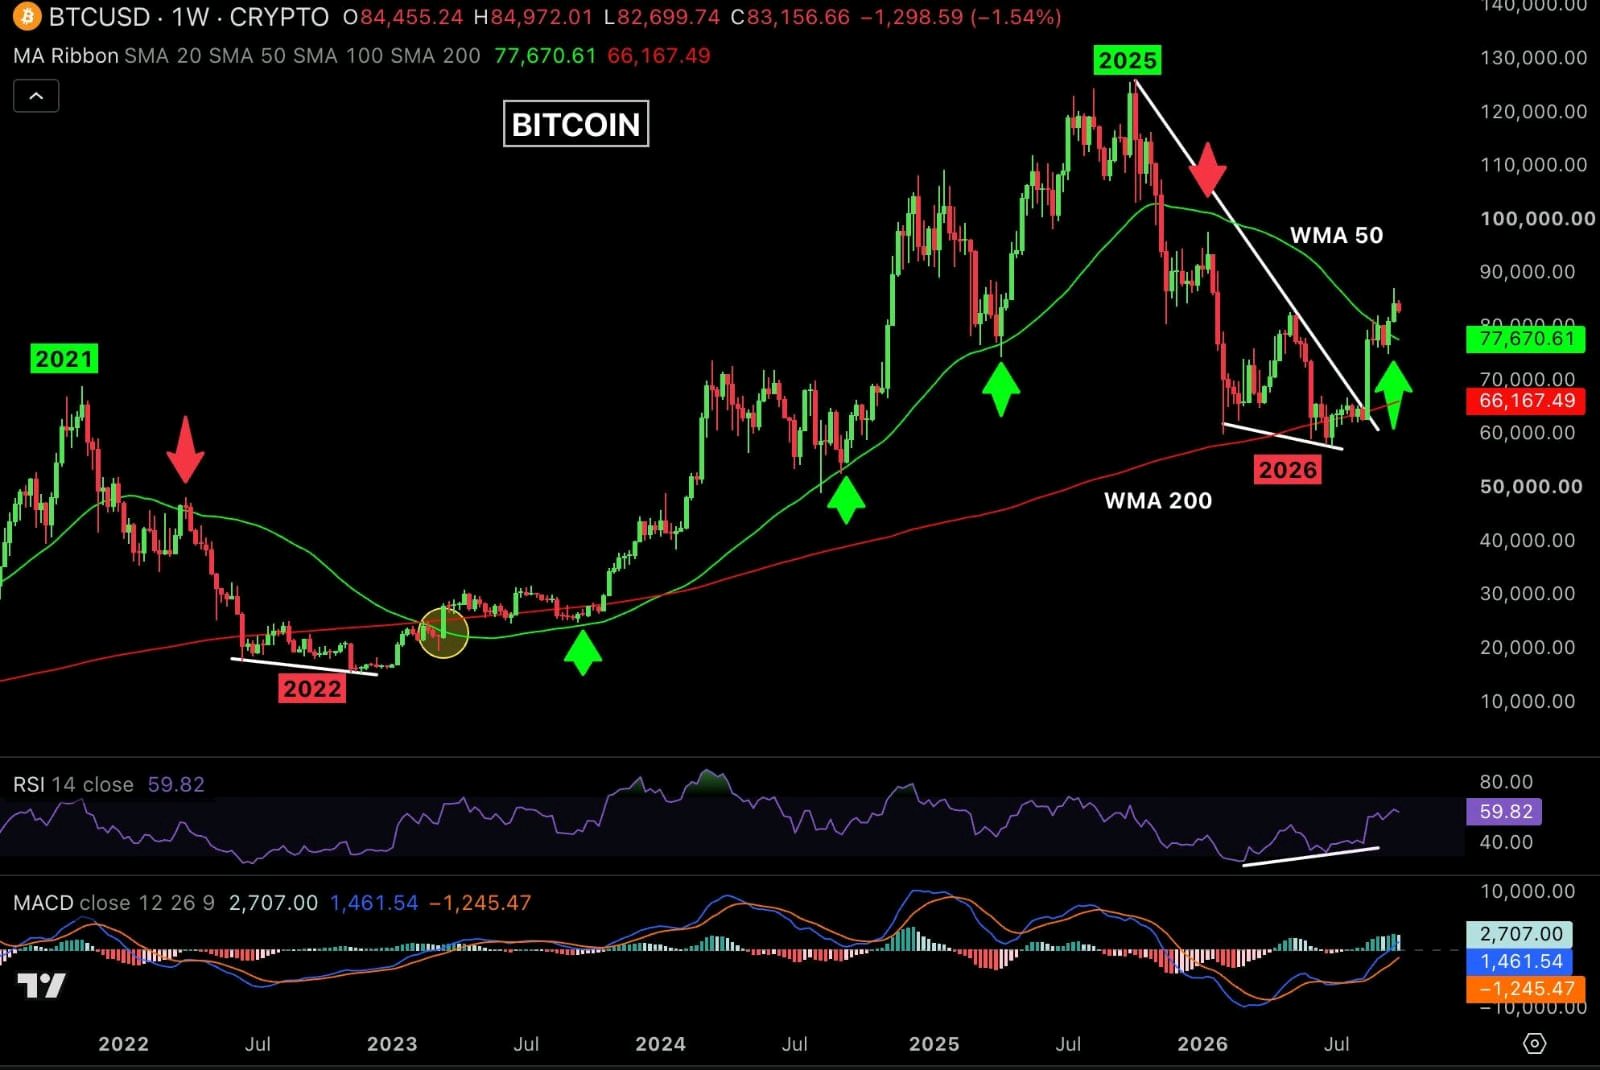
Bitcoin Weekly Analysis $BTCUSDT closed the week at $86,517, marking its highest weekly close since January 2026 and breaking the downtrend from the 2025 high. RSI and MACD are both turning bullish, and as long as BTC stays above the 50W MA, the trend remains positive. Two scenarios this week: - If it breaks above $87.4K, we could see $95K next. - If it loses $81K on the weekly close, the next support is $77.2K (50W MA). #ByXIMPACT
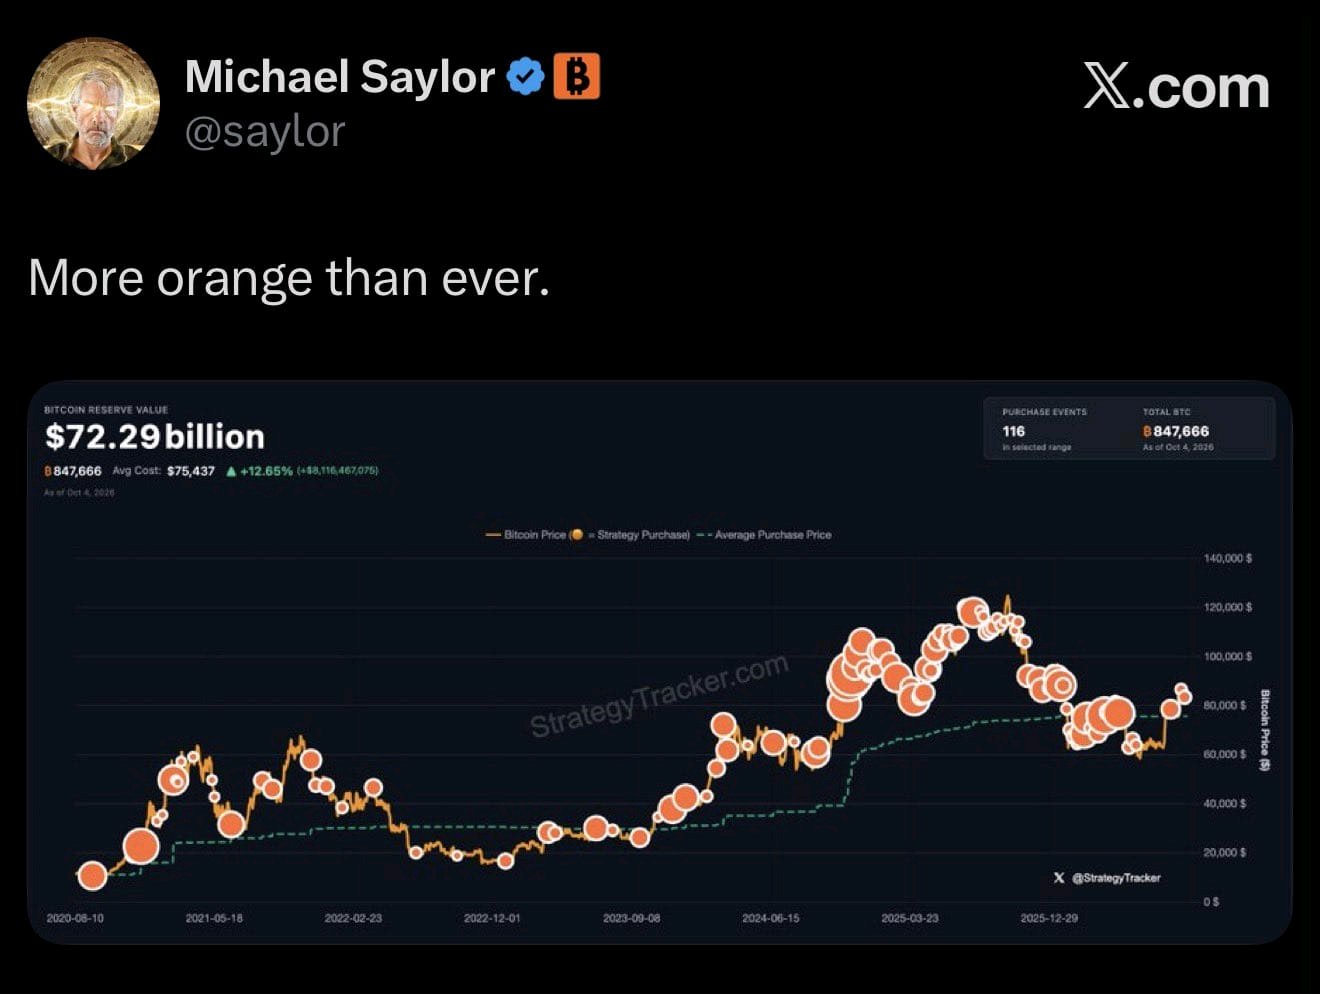
Saylor hints at buying more Bitcoin 🚀 #ByXIMPACT #BybitOdds $BTCUSDT
It's Q4 2029: 1. Bitcoin is at $200K, ETH is at $15K, and Solana is above $1K. 2. The US government now holds 1M BTC, and the Clarity Act has passed. 3. BlackRock's Altcoin ETF has been approved, and alts are up 30x-50x. 4. China has banned crypto again, and India still thinks crypto is a scam. 5. MSTR BTC holdings are worth $200B, and BitMine now owns 10% of the ETH supply. 6. Bears are still calling this rally a bull trap and expecting a drop to $40K. #BybitOdds
It's Q4 2029: 1. Bitcoin is at $200K, ETH is at $15K, and Solana is above $1K. 2. The US government now holds 1M BTC, and the Clarity Act has passed. 3. BlackRock's Altcoin ETF has been approved, and alts are up 30x-50x. 4. China has banned crypto again, and India still thinks crypto is a scam. 5. MSTR BTC holdings are worth $200B, and BitMine now owns 10% of the ETH supply. 6. Bears are still calling this rally a bull trap and expecting a drop to $40K. #BybitOdds
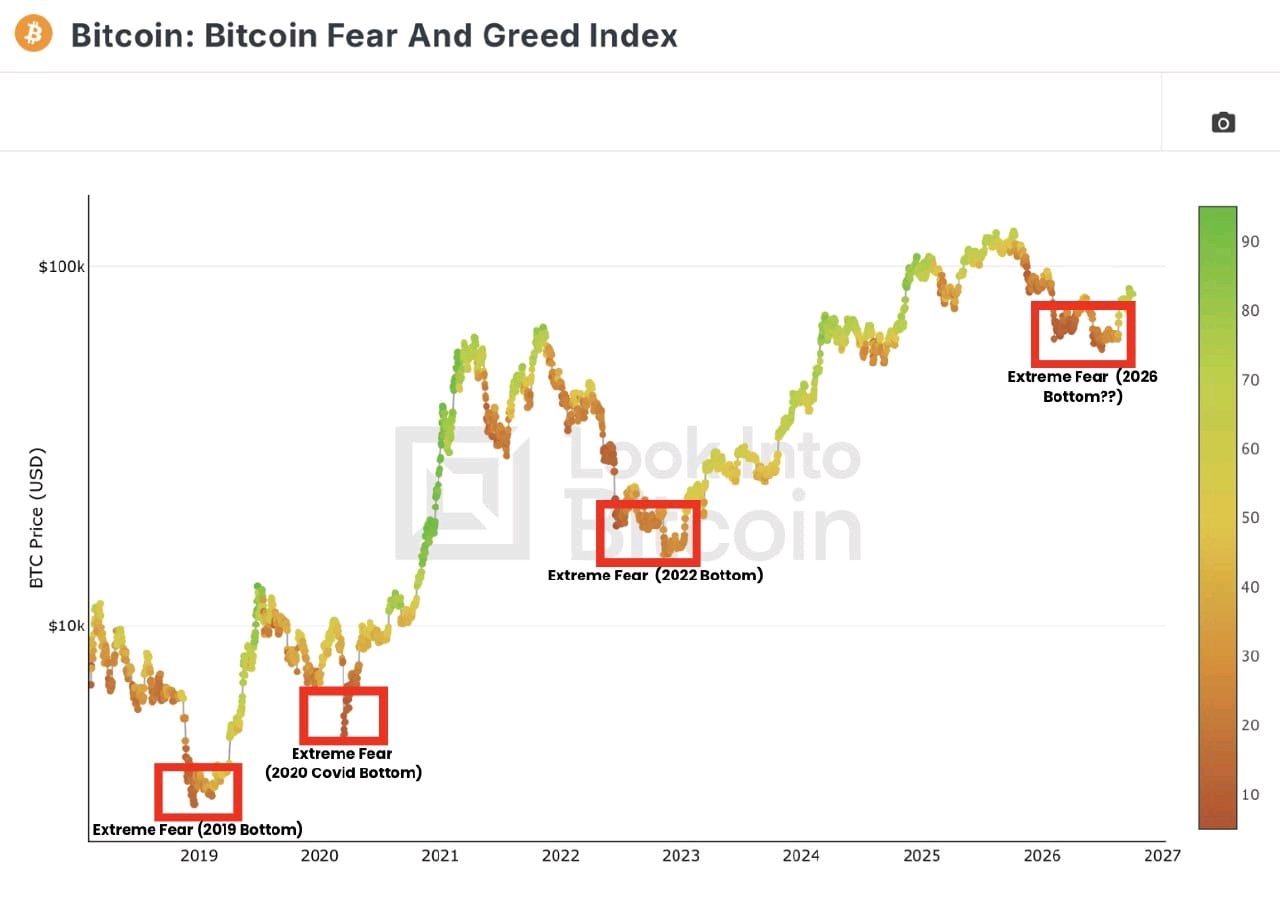
Bitcoin Fear Every Trader 😨
Bitcoin has bottomed every time fear hit this level. $BTCUSDT 2019: Extreme Fear at 5 2022: Extreme Fear at 6 2026: Extreme Fear at 5 Was $57,800 the bottom? #ByPickMakeYourPickCount
Breaking : Fed Rate Crash From 70% to 13%
Fed October rate hike odds crashed from 70% to 13.8% according to CME FedWatch Tool. Odds dropped after dovish comments from Fed Vice Chair Jefferson and NY Fed President Williams ahead of the jobs report. This is ultra bullish for crypto because falling Treasury yields ease financial conditions and support risk assets like $BTCUSDT & $ETHUSDT #ByPickMakeYourPickCount #BybitOdds #ByXIMPACT


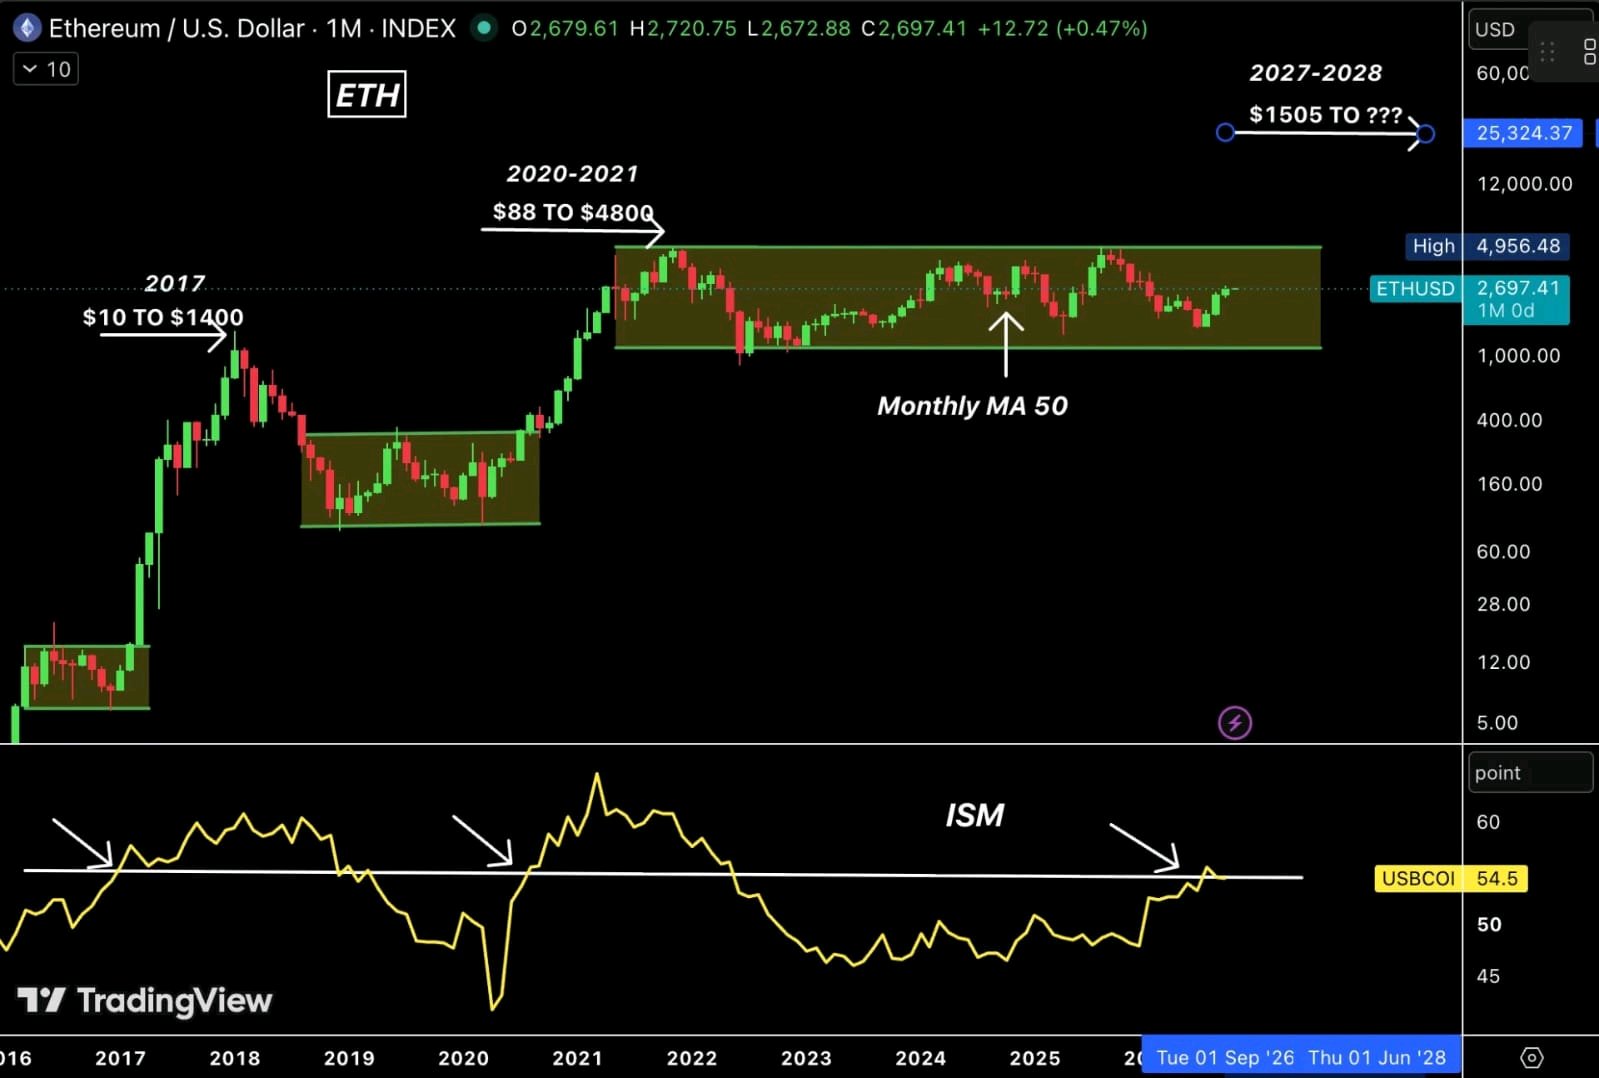
ETHEREUM IS STILL WAITING FOR ITS BIGGEST BULLISH SIGNAL. 2017: ISM broke above 56, and then ETH rallied from $10 to $1,400. 2020 to 2021: ISM broke above 56, and then ETH rallied from $88 to $4,800. Today, ISM came in at 54.5, slightly below the 54.8 forecast and 54.6 previous. So the setup is still alive, but 56 remains the key level that triggered the parabolic phase in the last 2 cycles. $ETHUSDT is currently around $2,695, sitting on the Monthly MA 50. If ISM continues moving higher toward 60 in the coming months, we could see another massive ETH and altcoin cycle in 2027 to 2028. #ByPickMakeYourPickCount #ByXIMPACT
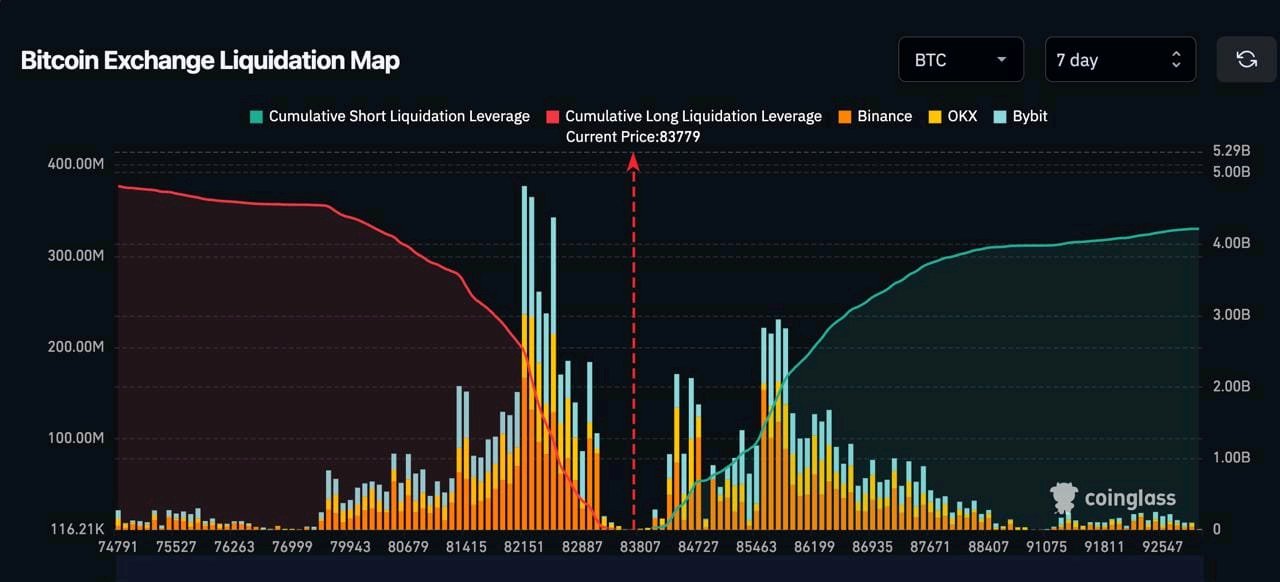
Bitcoin Liquidation Map
$BTCUSDT $2B Liquidation Pool on both the sides. Longs Liq @ $82K. Shorts Liq @ $86K. #ByXIMPACT #ByPickMakeYourPickCount
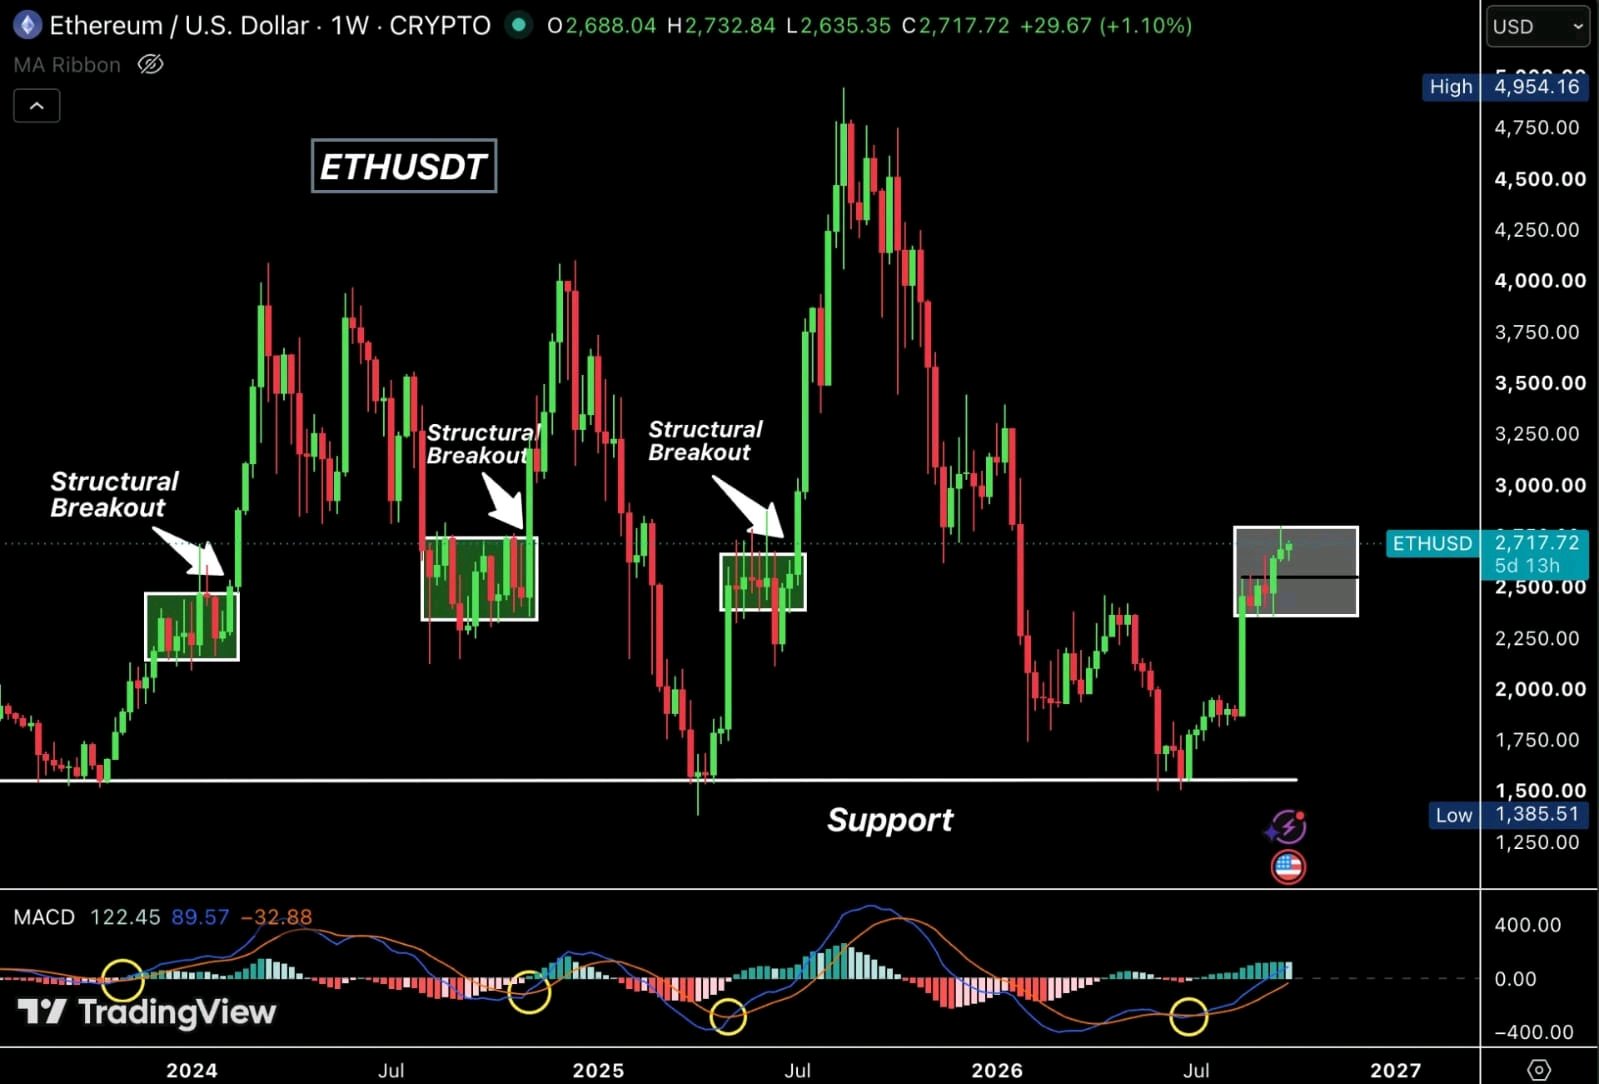
🚨 ETHEREUM IS GETTING READY FOR A BIG MOVE
$ETHUSDT held $2,550 and closed the week up 1.66%. The $2,300 to $2,800 range is what matters now. This same zone has produced 3 major breakouts on the weekly chart. Each time ETH broke out of this range, the next move was big. A confirmed break above $2,800 puts $3,600 to $4,500 as the next major zone. Support: $2,550 and $2,350 The key event this week is ISM on Thursday. Historically, when ISM pushes above 56, ETH and Alts tend to rally. #ByPickMakeYourPickCount
📊 BITCOIN WEEKLY UPDATE
$BTCUSDT gained 4% last week, closing at $84,445 — its highest weekly close in 8 months. After holding the 200-week MA, bullish momentum and a breakout above the 50-week MA fueled a rally toward $87K. Macro conditions are improving, adding strength to the move. Key Levels: 🟢 Support: $77,670 | $71,100 🔴 Resistance: $87K–$98K Upcoming: ISM data Thursday and Jobs Report Friday. #ByXIMPACT
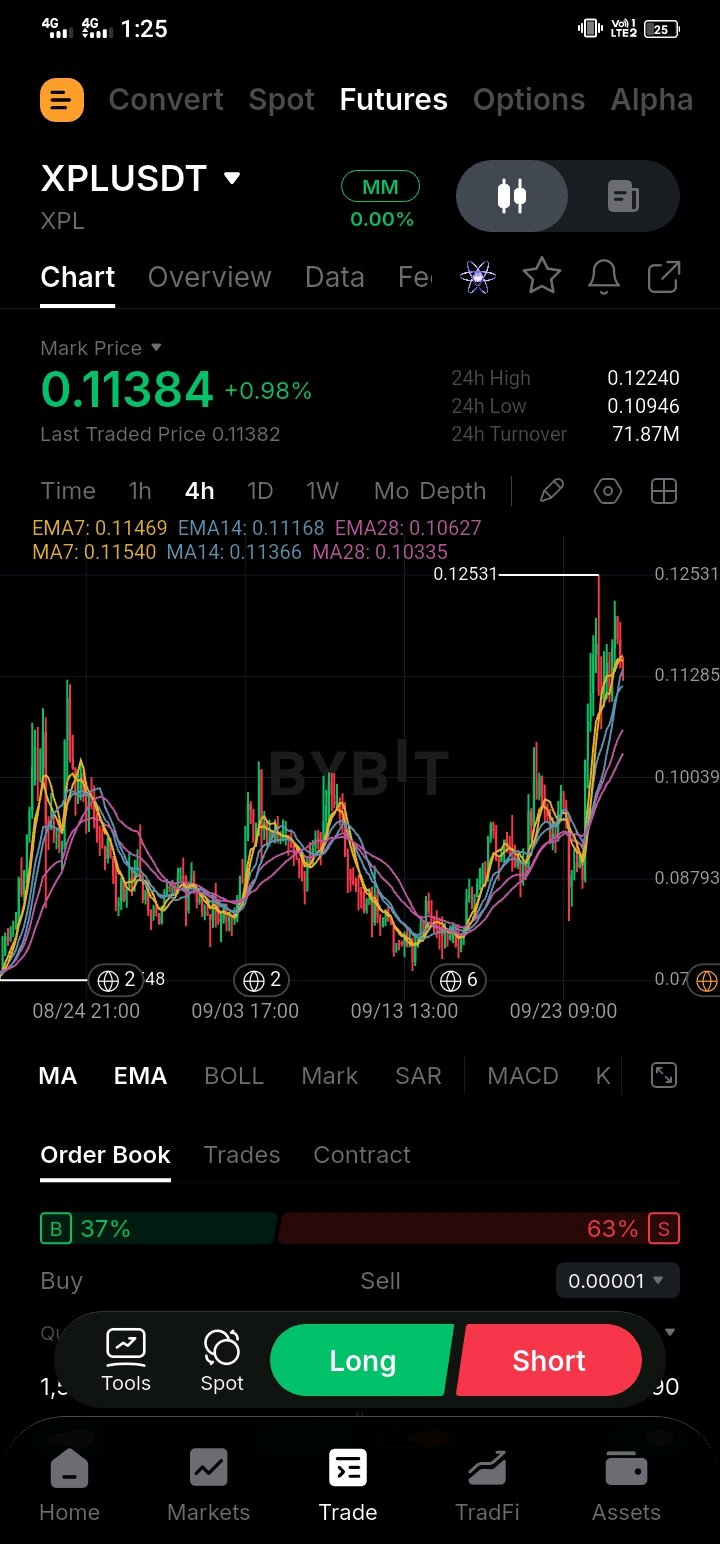
XPL is quietly coiling below local highs on the 4h chart as buyers work to establish a higher-low base after that aggressive push toward 0.12531. Currently up +0.98% at 0.11384, XPLUSDT recovered off a 24h low of 0.10946 to test 0.12240 before compressing under short-term averages. While EMA7 (0.11469) acts as immediate overhead friction, the broader trend structure remains protected by sloped dynamic support from EMA14 (0.11168) and EMA28 (0.10627). Turnover: 24h turnover has reached 71.87M, indicating solid liquidity and active order flow through this lower-timeframe consolidation phase. Volume: The 4h volume profile shows an initial expansion surge driving the rally toward 0.12531, easily pushing past 20-period baseline averages. While volume is currently normalizing, price moving averages — MA7 (0.11540), MA14 (0.11366), and MA28 (0.10335) — remain in a net bullish arrangement, supported by positive MACD histogram momentum confirming spot absorption across key support levels. Levels to watch: • 0.12240-0.12531 — 24h high and local peak resistance • 0.11469-0.11540 — Dynamic EMA7/MA7 resistance band • 0.11168-0.11366 — EMA14/MA14 structural support shelf • 0.10627-0.10335 — EMA28/MA28 baseline floor support • 0.10946 — 24h low reaction level Consideration: Consolidating near 0.11384 shows buyer resilience, but entering inside this tight 4h range between MA7 (0.11540) and EMA14 (0.11168) carries choppy range risk. Waiting for a clear 4h close above MA7 or a structured retest on dynamic EMA14 support offers a superior risk-to-reward entry profile. Trade plan: • Momentum path: a strong 4h close above 0.11540 opens space for a retest of 0.12240 and expansion toward 0.12531. • Patience path: a controlled dip into the 0.1110-0.1118 support pocket (EMA14 confluence) provides a structured long setup. • Use dynamic EMA14 (0.11168) as a primary risk boundary to maintain disciplined exposure. Support and resistance: Support: 0.11168 (EMA14 support) → 0.10627 (EMA28 base support) → 0.10335 (MA28 floor) Resistance: 0.11540 (MA7 resistance) → 0.12240-0.12531 (24h high/peak resistance) Invalidation and risk note: A 4h candle close below 0.10627 (EMA28) invalidates the bullish consolidation thesis, opening downside risk toward 0.0950. Furthermore, a drop in trading volume paired with a bearish MACD crossover signals buyer exhaustion, requiring immediate position de-risking. Range compression after sharp impulse moves can trigger chop — strictly manage risk rather than over-leveraging mid-range.$XPLUSDT #ByXIMPACT