AMBTC
3435Лайк0Акциялар187Жанкүйерлер231Жазылу
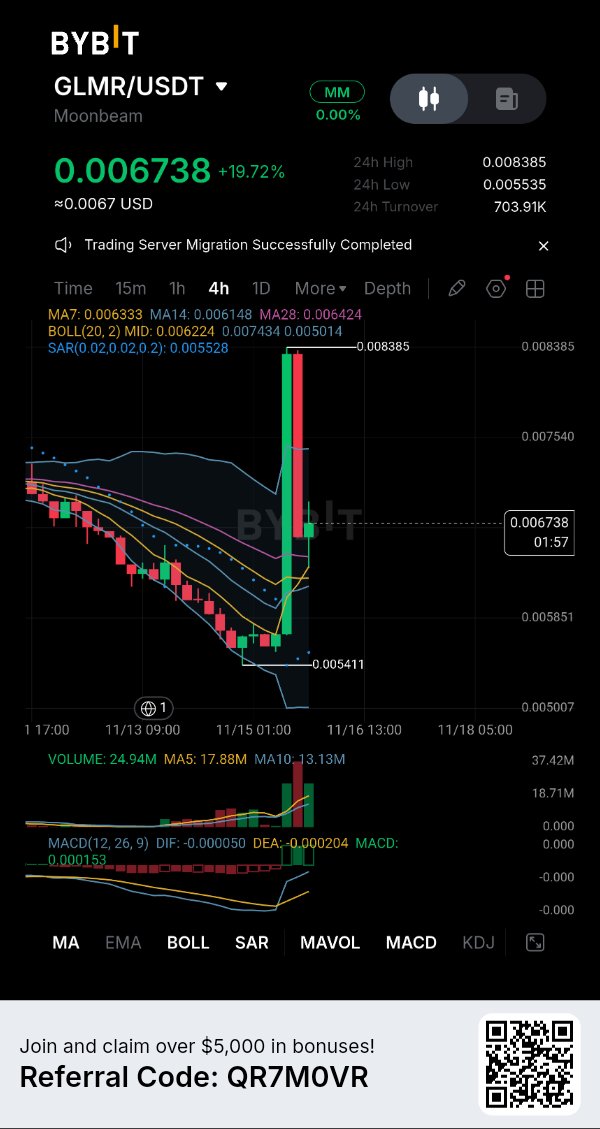
GLMR: Gave Back 58% of the Range, Now 0.006738
$GLMRUSDT — price is 9.4% under the upper Bollinger band, 0.007434, after a spike to 0.008385. Look at the 24h range: 0.005535 to 0.008385. Price gave back about 58% of it, and volume is still 1.4 times its five-bar average. Still unresolved: is this a pullback inside a bigger move, or the spike unwinding? Volume stays high after a big pullback. Is that buyers stepping in, or sellers leaving? 4H, GLMR/USDT on Bybit, 0.006738, +19.72% over 24h. Macro note Nov 14, 2026: US spot Bitcoin ETFs posted $2.35 billion in net outflows over two consecutive weeks (Cointelegraph). Background only, not the reason for this move. What the chart shows Price slid for days to a 24h low of 0.005535. Then it ran to 0.008385, a 51.5% swing from the low, and has pulled back to 0.006738. The spike high is 24% above the current price. Volume is visible. The current bar is 24.94M, 1.4 times the 17.88M five-bar average and 1.9 times the 13.13M ten-bar average. The tallest bar, about 37M, came during the spike. So the pullback is happening on busy volume, not on a quiet fade. Price is above MA7 (0.006333), MA14 (0.006148) and MA28 (0.006424). MACD has crossed up: DIF -0.000050 is above DEA -0.000204, both still below zero. SAR reads 0.005528, under price. These support short-term momentum. They do NOT prove a trend change. They are built from price, MA7 is still under MA28, and one spike pulls all of them up. Key levels Support: 0.006333 (MA7), then 0.006224 (middle Bollinger band). The 24h low is 0.005535. Resistance: 0.007434 (upper Bollinger band), then 0.008385 (24h high). What would strengthen it Price is 9.4% under the upper band, so I'm not asking for a break yet. First I want 4H closes that stay above 0.006333 and 0.006224. Then a 4H close above 0.007434 on volume above the 17.88M average. A higher low above 0.006224 on a pullback would help. Concern A 4H close below 0.006224 would put price back under the middle band and erase the bounce. The spike high of 0.008385 was rejected, and price gave back 58% of the range. Both are reasons for caution. What changes my mind A 4H close below 0.006224. The lesson A spike shows how far price can go. Closes show where it can stay. My view My read: the bounce is holding so far, so I lean slightly constructive while GLMR closes above 0.006224 on 4H. I could be wrong, and a 4H close below 0.006224 would prove me wrong. Take the levels, not my lean. This is a scenario, not a prediction. A reading at posting time, not a guarantee. Which matters more to you here, the 0.006224 hold or a close above 0.007434? #ByXIMPACT
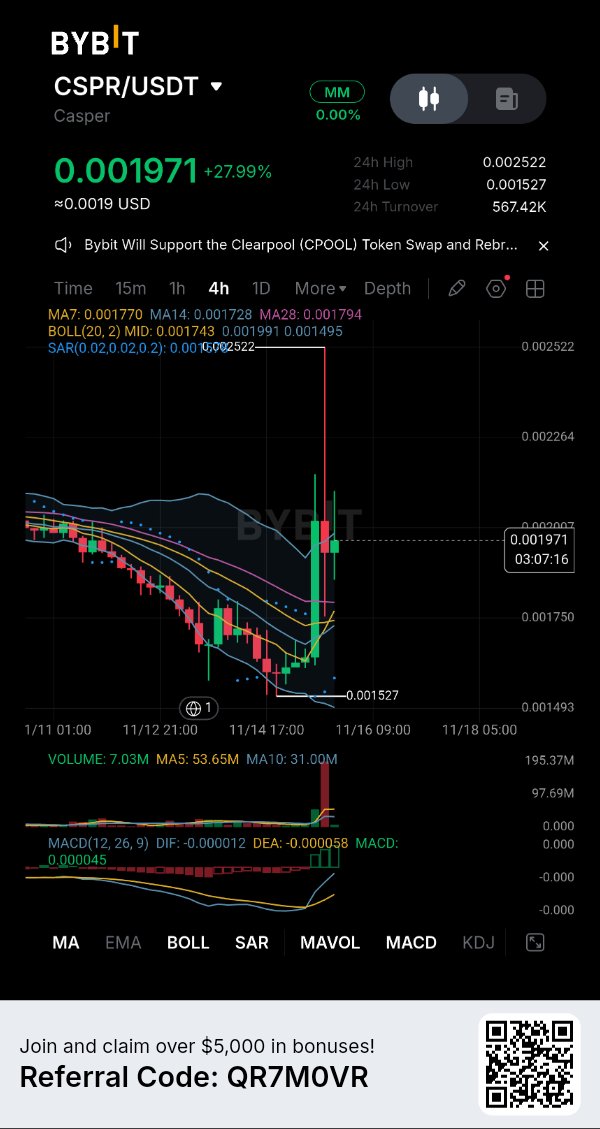
CSPR: Spike to 0.002522, Now at 0.001971
$CSPRUSDT — price is 1% under the upper Bollinger band, 0.001991, after a spike far above it. Look at the 24h range: 0.001527 to 0.002522. Price has already given back about 55% of it. Still unresolved: does 0.001991 turn from a ceiling into support? One giant volume bar and a 28% day: what would make you trust a spike like this, a retest, a close, or more volume? 4H, $CSPRUSDT on Bybit, 0.001971, +27.99% over 24h. Macro note Nov 15, 2026: Bitcoin dipped to about 62,081, its weakest level since July, before rebounding above 65,000 (Cointelegraph). Background only, not the reason for this move. What the chart shows Price slid for days to a 24h low of 0.001527. Then one candle spiked to 0.002522, about 65% above that low, and price has since pulled back to 0.001971. The 24h range is 0.000995. Price has given back about 55% of it. The spike high is 28% above the current price. Volume is visible. The spike bar is about 195M by eye, over six times the 31.00M ten-bar average. The current bar is 7.03M against a 53.65M five-bar average, but this candle is only about 22% done (3 hours 7 minutes left), so that comparison is not fair yet. The indicators agree with the bounce, but they come from price, so they are not independent proof. Price is above MA7 (0.001770), MA14 (0.001728) and MA28 (0.001794). MACD has crossed up: DIF -0.000012 is above DEA -0.000058, but both are still below zero. This supports short-term momentum. It does NOT prove a trend change. MA7 is still under MA28, and one spike candle can pull all these lines up. Key levels Support: about 0.00186 (low of this candle so far), then 0.001743 (middle Bollinger band). The 24h low is 0.001527. Resistance: 0.001991 (upper Bollinger band), then 0.002522 (24h high). What would strengthen it Price is under 0.001991, so this is a test, not a break. A touch proves little. I want a 4H close above 0.001991, then a retest that holds as support. A higher low above 0.00186 would help. A close above the band on volume well above the 53.65M average would show real participation. Concern A 4H close under 0.001743 would put price below the middle band and erase most of this bounce. Price was rejected at 0.002522 and has given back 55% of the range since. What changes my mind A 4H close above 0.001991. The lesson One loud candle is not a trend. A trend is a row of closes, each holding above the last. My view My read: this looks like a sharp spike followed by a pullback, not yet a base, so I lean cautious while CSPR stays under 0.001991 on 4H closes. I could be wrong, and a 4H close above 0.001991 would prove me wrong. Take the levels, not my lean. This is a scenario, not a prediction. A reading at posting time, not a guarantee. Do you trust the volume bar or the pullback more here? #ByXIMPACT #WSOT2026 #WSOTShowYourAITradeToEarn10USDT #JensenHuangExitTestsNvidiasAILeadership
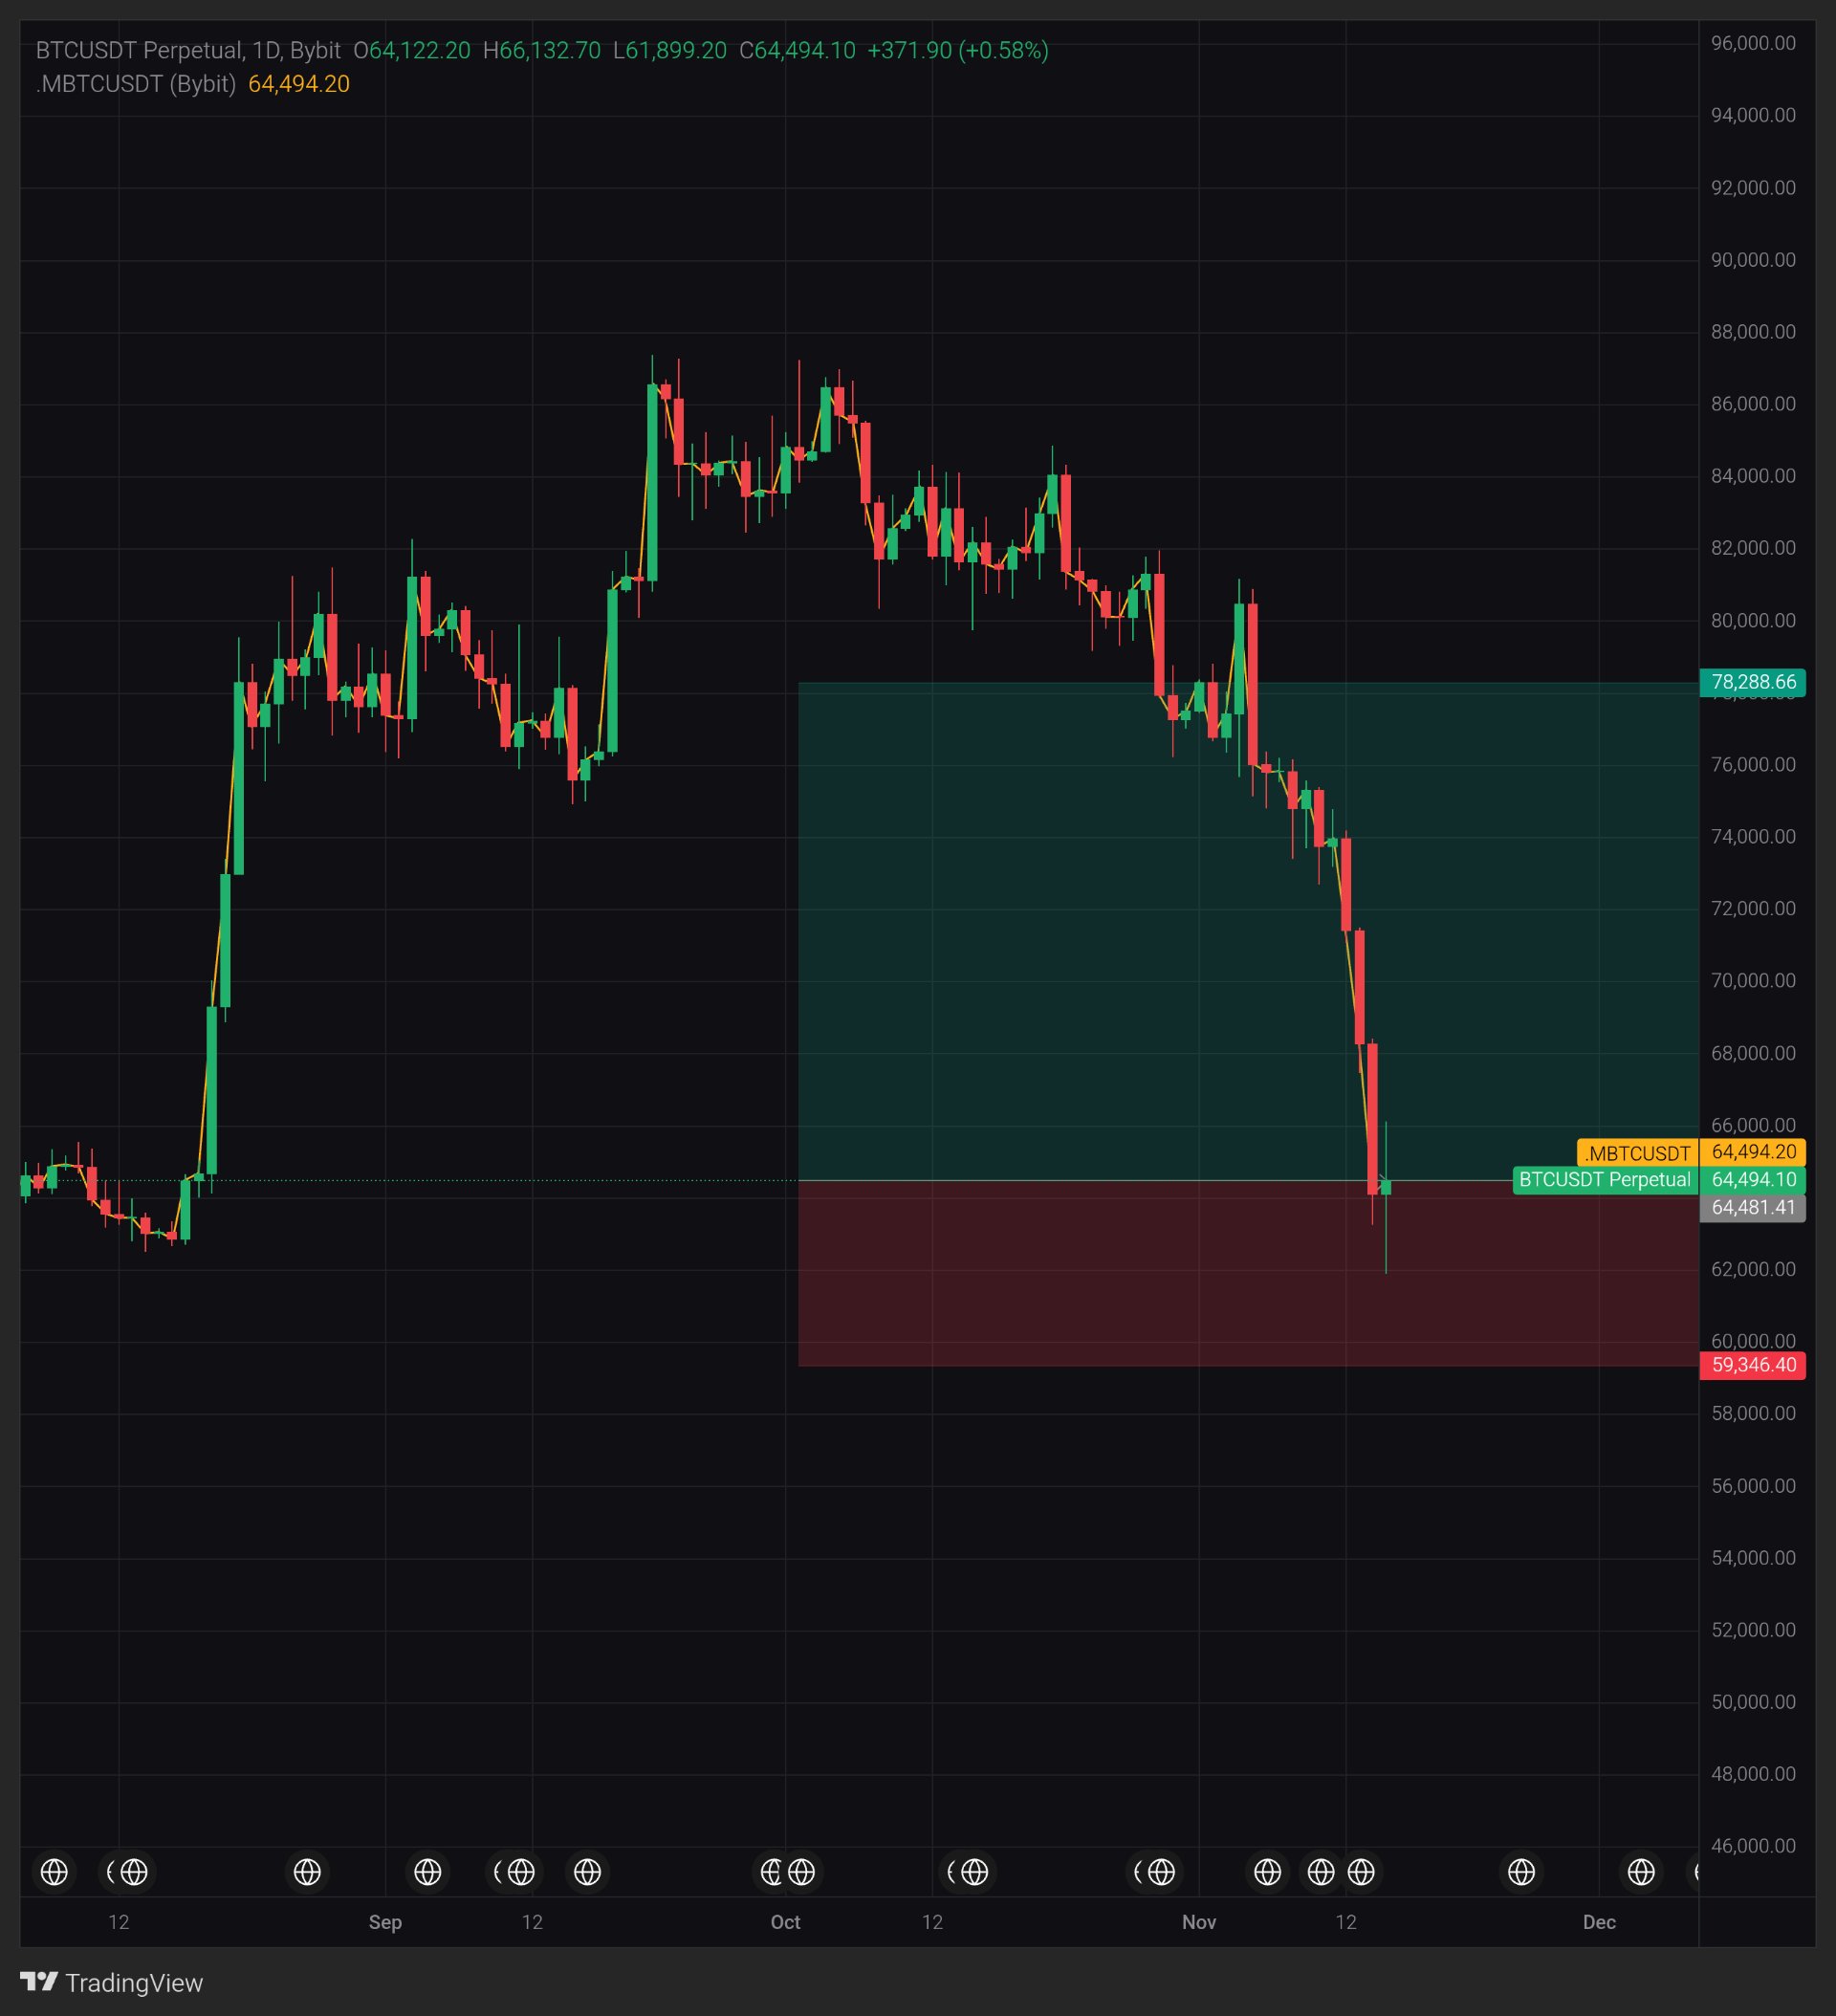
BTC 1D: Back at the August Base, 64,481
$BTCUSDT — price is back inside the August base, sitting on 64,481.41, the line between my two boxes. Look at today's daily candle. It dipped 2,223 under its open, then recovered, and its body is under a tenth of yesterday's. Still unresolved: does today close above 64,481.41, or is this just a pause? After three red days in a row, what does one small green candle prove? 1D, $BTCUSDT Perpetual on Bybit, 64,494.10, +0.58% on the current candle. Macro note Nov 14, 2026: US spot Bitcoin ETFs posted $2.35 billion in net outflows over two consecutive weeks (Cointelegraph). Background only, not the reason for this move. What the chart shows Price is about 29% below the September high near 87,300. Three red daily candles in a row, each bigger than the last (roughly 3.4%, 4.4% and 6.1%), took it from about 73,940 to 64,060, around 13%. Zoom out: before the rally, the August base sat near 62,500 to 65,500. Price is back inside it. Today's low of 61,899.20 went about 1% under that base, then price recovered to 64,494.10. Today's candle: open 64,122.20, high 66,132.70, low 61,899.20, close 64,494.10. The range is 4,233.50, about 6.6% of the open. The lower wick is 2,223, about 6 times the 371.90 body. Price is up 4.2% from the low. The yellow line is the Bybit index (.MBTCUSDT) at 64,494.20, just 0.10 from the perpetual. It follows price, so it is not independent proof. No volume panel is shown, so I can't compare today's volume with its average. This is a price-action reading. Key levels Support: 61,899.20 (low of today's candle), then 59,346.40 (bottom of my red box). Resistance: 66,132.70 (high of today's candle), then about 68,250 (where yesterday's big red candle started). The top of my green box is 78,288.66. What would strengthen it Price is only 12.69 above the 64,481.41 line, so nothing is settled. I want a 1D close above 64,481.41 first, then a 1D close above 66,132.70. A higher low above 61,899.20 on a retest would show the August base is working. Concern A 1D close below 61,899.20 would mean the August base failed on a close, with 59,346.40 as the next reference. Three red days in a row, each bigger than the last, show sellers had control until today. What changes my mind A 1D close above about 68,250. The lesson One daily candle is one vote. Today's wick is six times its body. That is a signal, not a trend. My view My read: this looks like a first sign of buyers after a sharp fall, not a confirmed bottom, so I lean cautious while BTC stays under about 68,250 on 1D closes. I could be wrong, and a 1D close above about 68,250 would prove me wrong. Take the levels, not my lean. This is a scenario, not a prediction. A reading at posting time, not a guarantee. Which matters more to you here, the 2,223 wick or the 371.90 body? #ByXIMPACT

BTC Sits on 64,917 After a 63,946 Wick
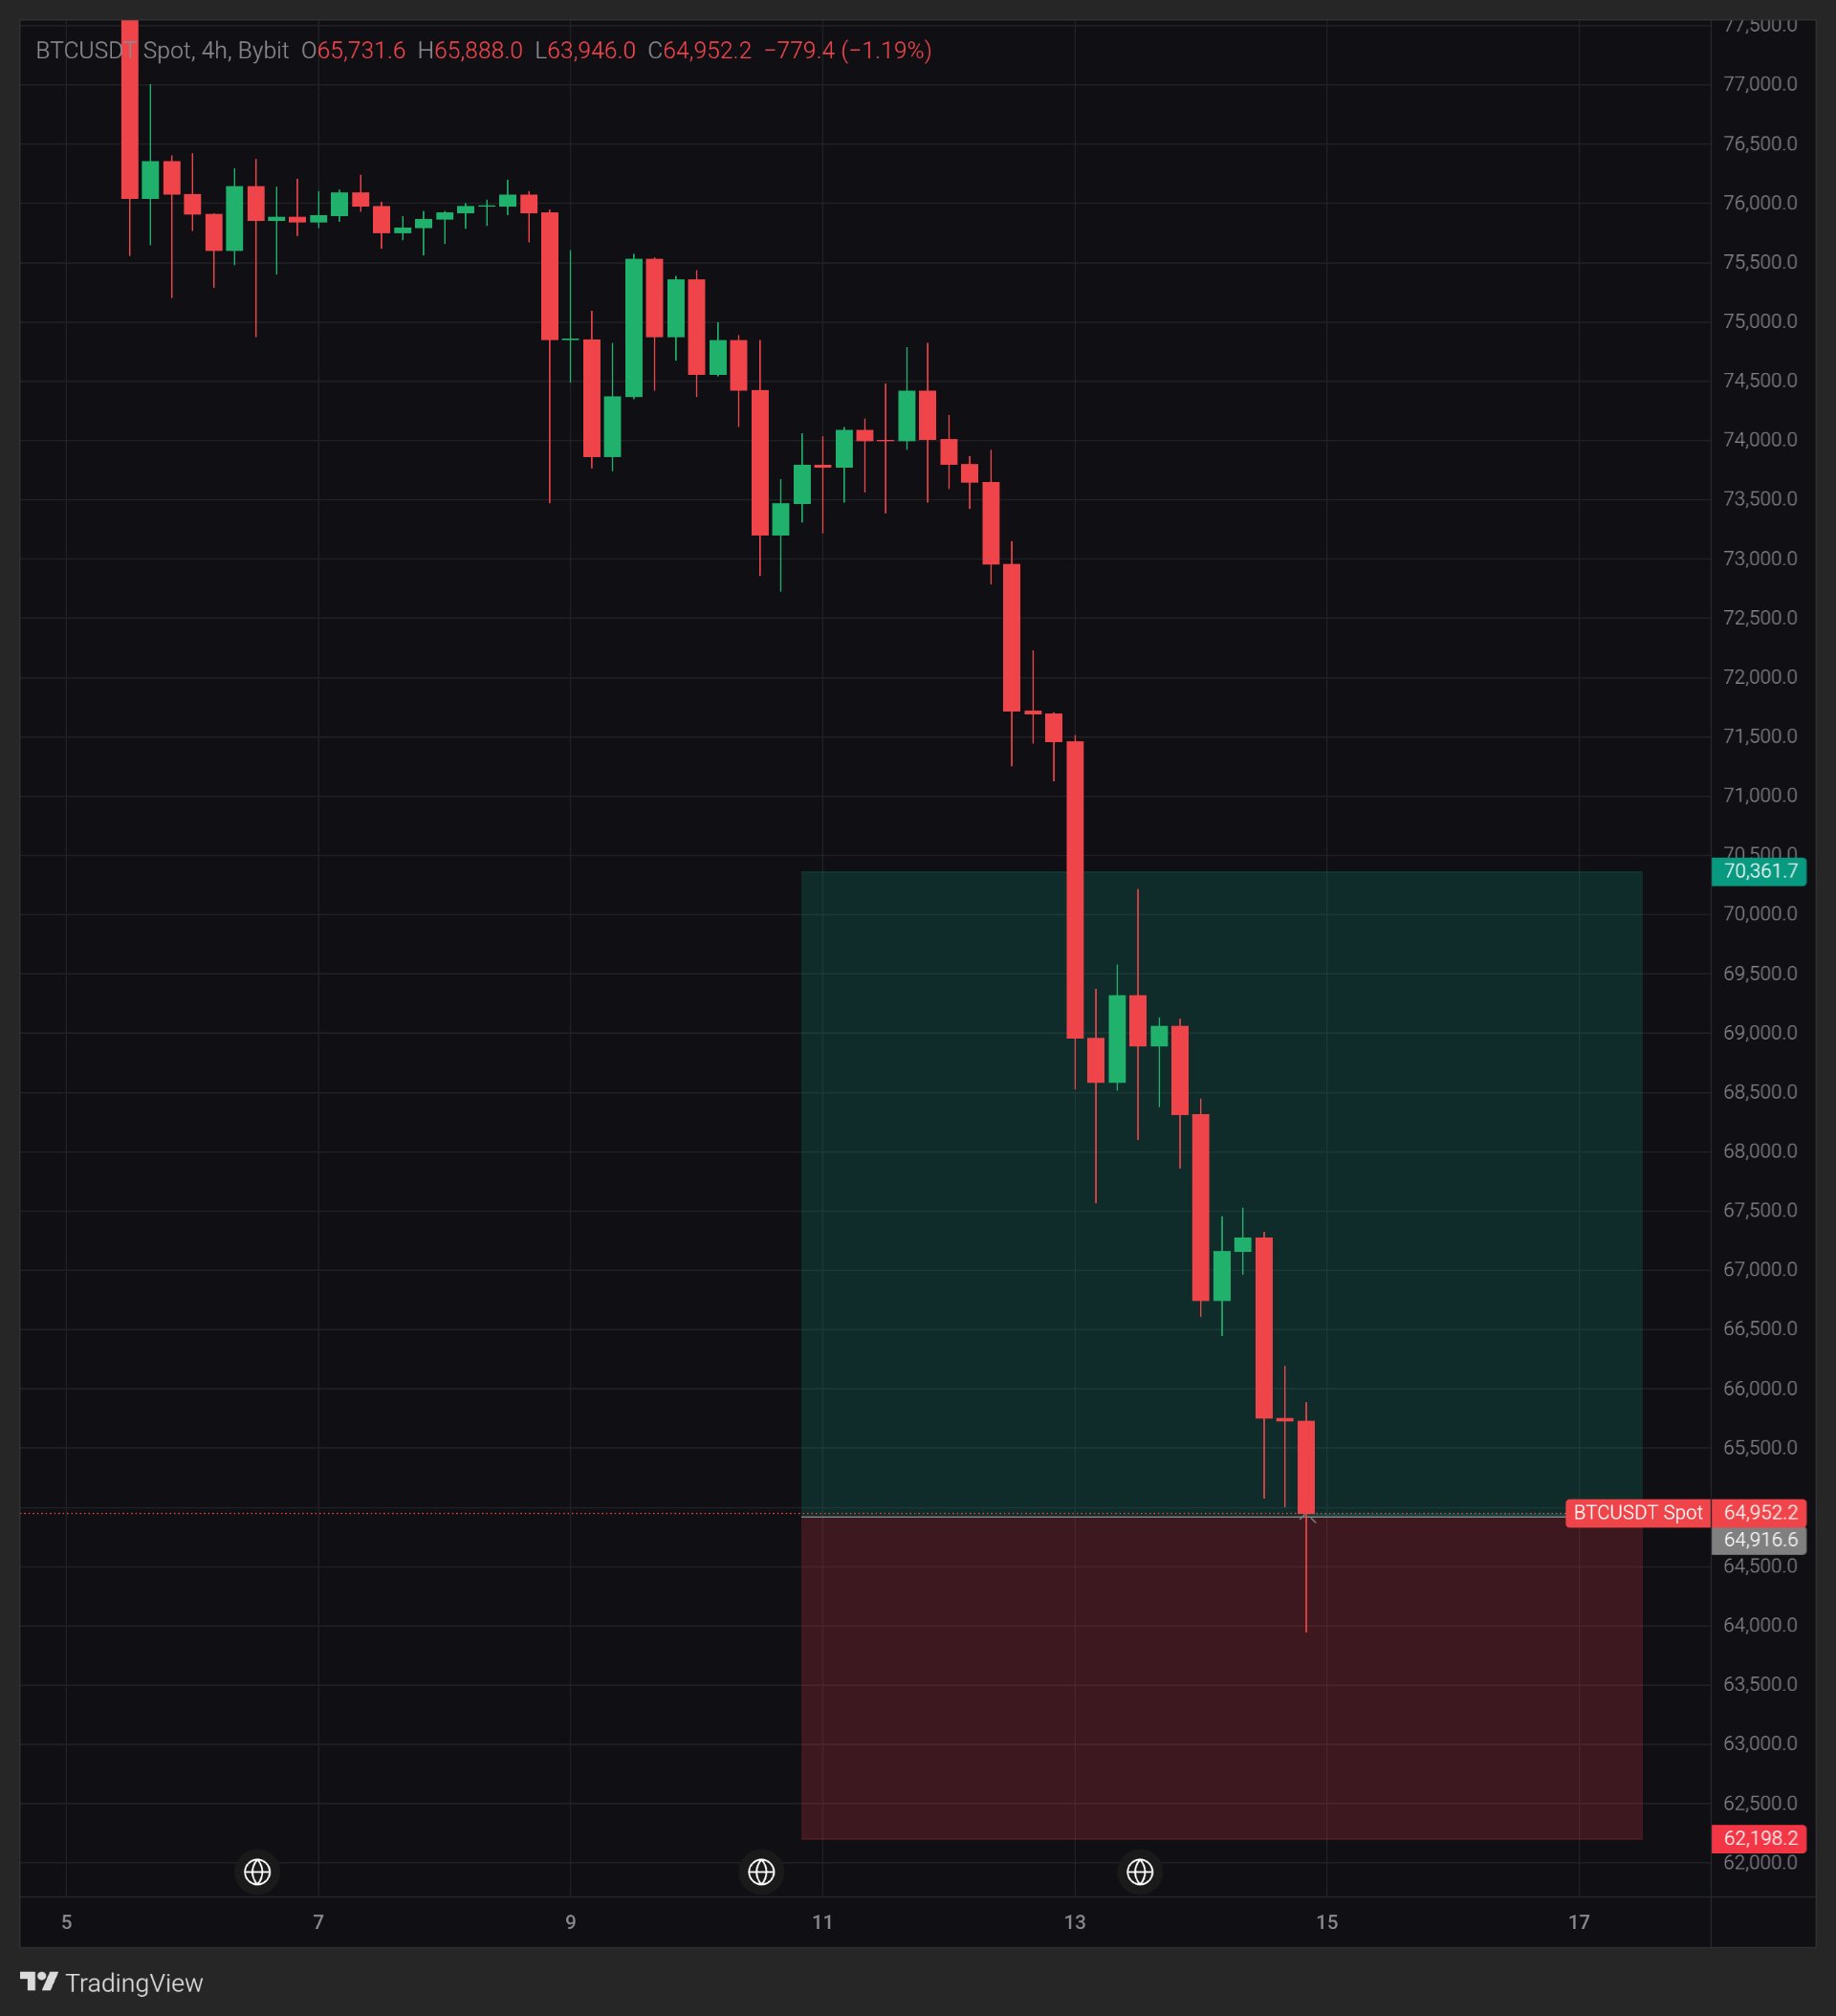
$BTCUSDT — the whole question is 64,916.6, and price is standing right on it. Look at the current candle. It dipped 1,786 below its open, then took back 1,006 from the low. Still unresolved: is this wick a floor, or the same pause price made on the way down? Every low on this slide looked like a bottom when it printed. What makes this one different, if anything? 4H, BTCUSDT Spot on Bybit, 64,952.2, -1.19% on the current candle. Macro note Nov 13, 2026: Treasury yields rose and bets on tighter Fed policy persisted (Kitco). Background only, not the reason for this move. What the chart shows Price fell from a high near 74,800 on the 11th to 64,952, about 13.2% in three days. The swing lows keep stepping down: roughly 67,566, 66,445, 65,029 and now 63,946. A wick like today's has shown up before. On the 13th, a candle dipped to about 67,566 and closed about 1,000 above its low. Price broke under that low a few candles later. The current candle: open 65,731.6, high 65,888.0, low 63,946.0, close 64,952.2. The range is 1,942, about 3%. The lower wick is 1,006.2, about 1.3 times the 779.4 body. The close sits in the middle of the range, 35.6 above the edge of my boxes at 64,916.6. Volume is not shown on this chart. There are no indicators, so this is a price-action reading. Key levels Support: 63,946 (low of this candle), then 62,198.2 (bottom of my red box). Resistance: 65,888 (high of this candle), then about 67,270 (where the last big red candle started). The top of my green box is 70,361.7. What would strengthen it Price is on the edge, so right now this is a touch, not a hold. I want a 4H close above 64,916.6 first, then above 65,888. A higher low above 63,946 on a retest would show the wick had buyers behind it. A close above about 67,270 would be the first real break of the pattern. Concern A 4H close below 63,946 would mean the wick low failed, with 62,198.2 as the next reference. Wicks like this one were undercut before. What changes my mind A 4H close above about 67,270. The lesson A falling staircase is lower highs and lower lows. A floor needs the first higher low, and a close to prove it. My view My read: this looks like a falling staircase, and this wick is not confirmed by a close, so I lean cautious while BTC stays under about 67,270 on 4H closes. I could be wrong, and a 4H close above about 67,270 would prove me wrong. Take the levels, not my lean. This is a scenario, not a prediction. A reading at posting time, not a guarantee. What do you see here, a floor or another step down? #ByXIMPACT #BitcoinHitsTwoMonthLowAfterUSMidterms #AITechSelloffErases2Point5TrillionFromNasdaq100
NYM: Wick to 0.02454, Now at 0.02251
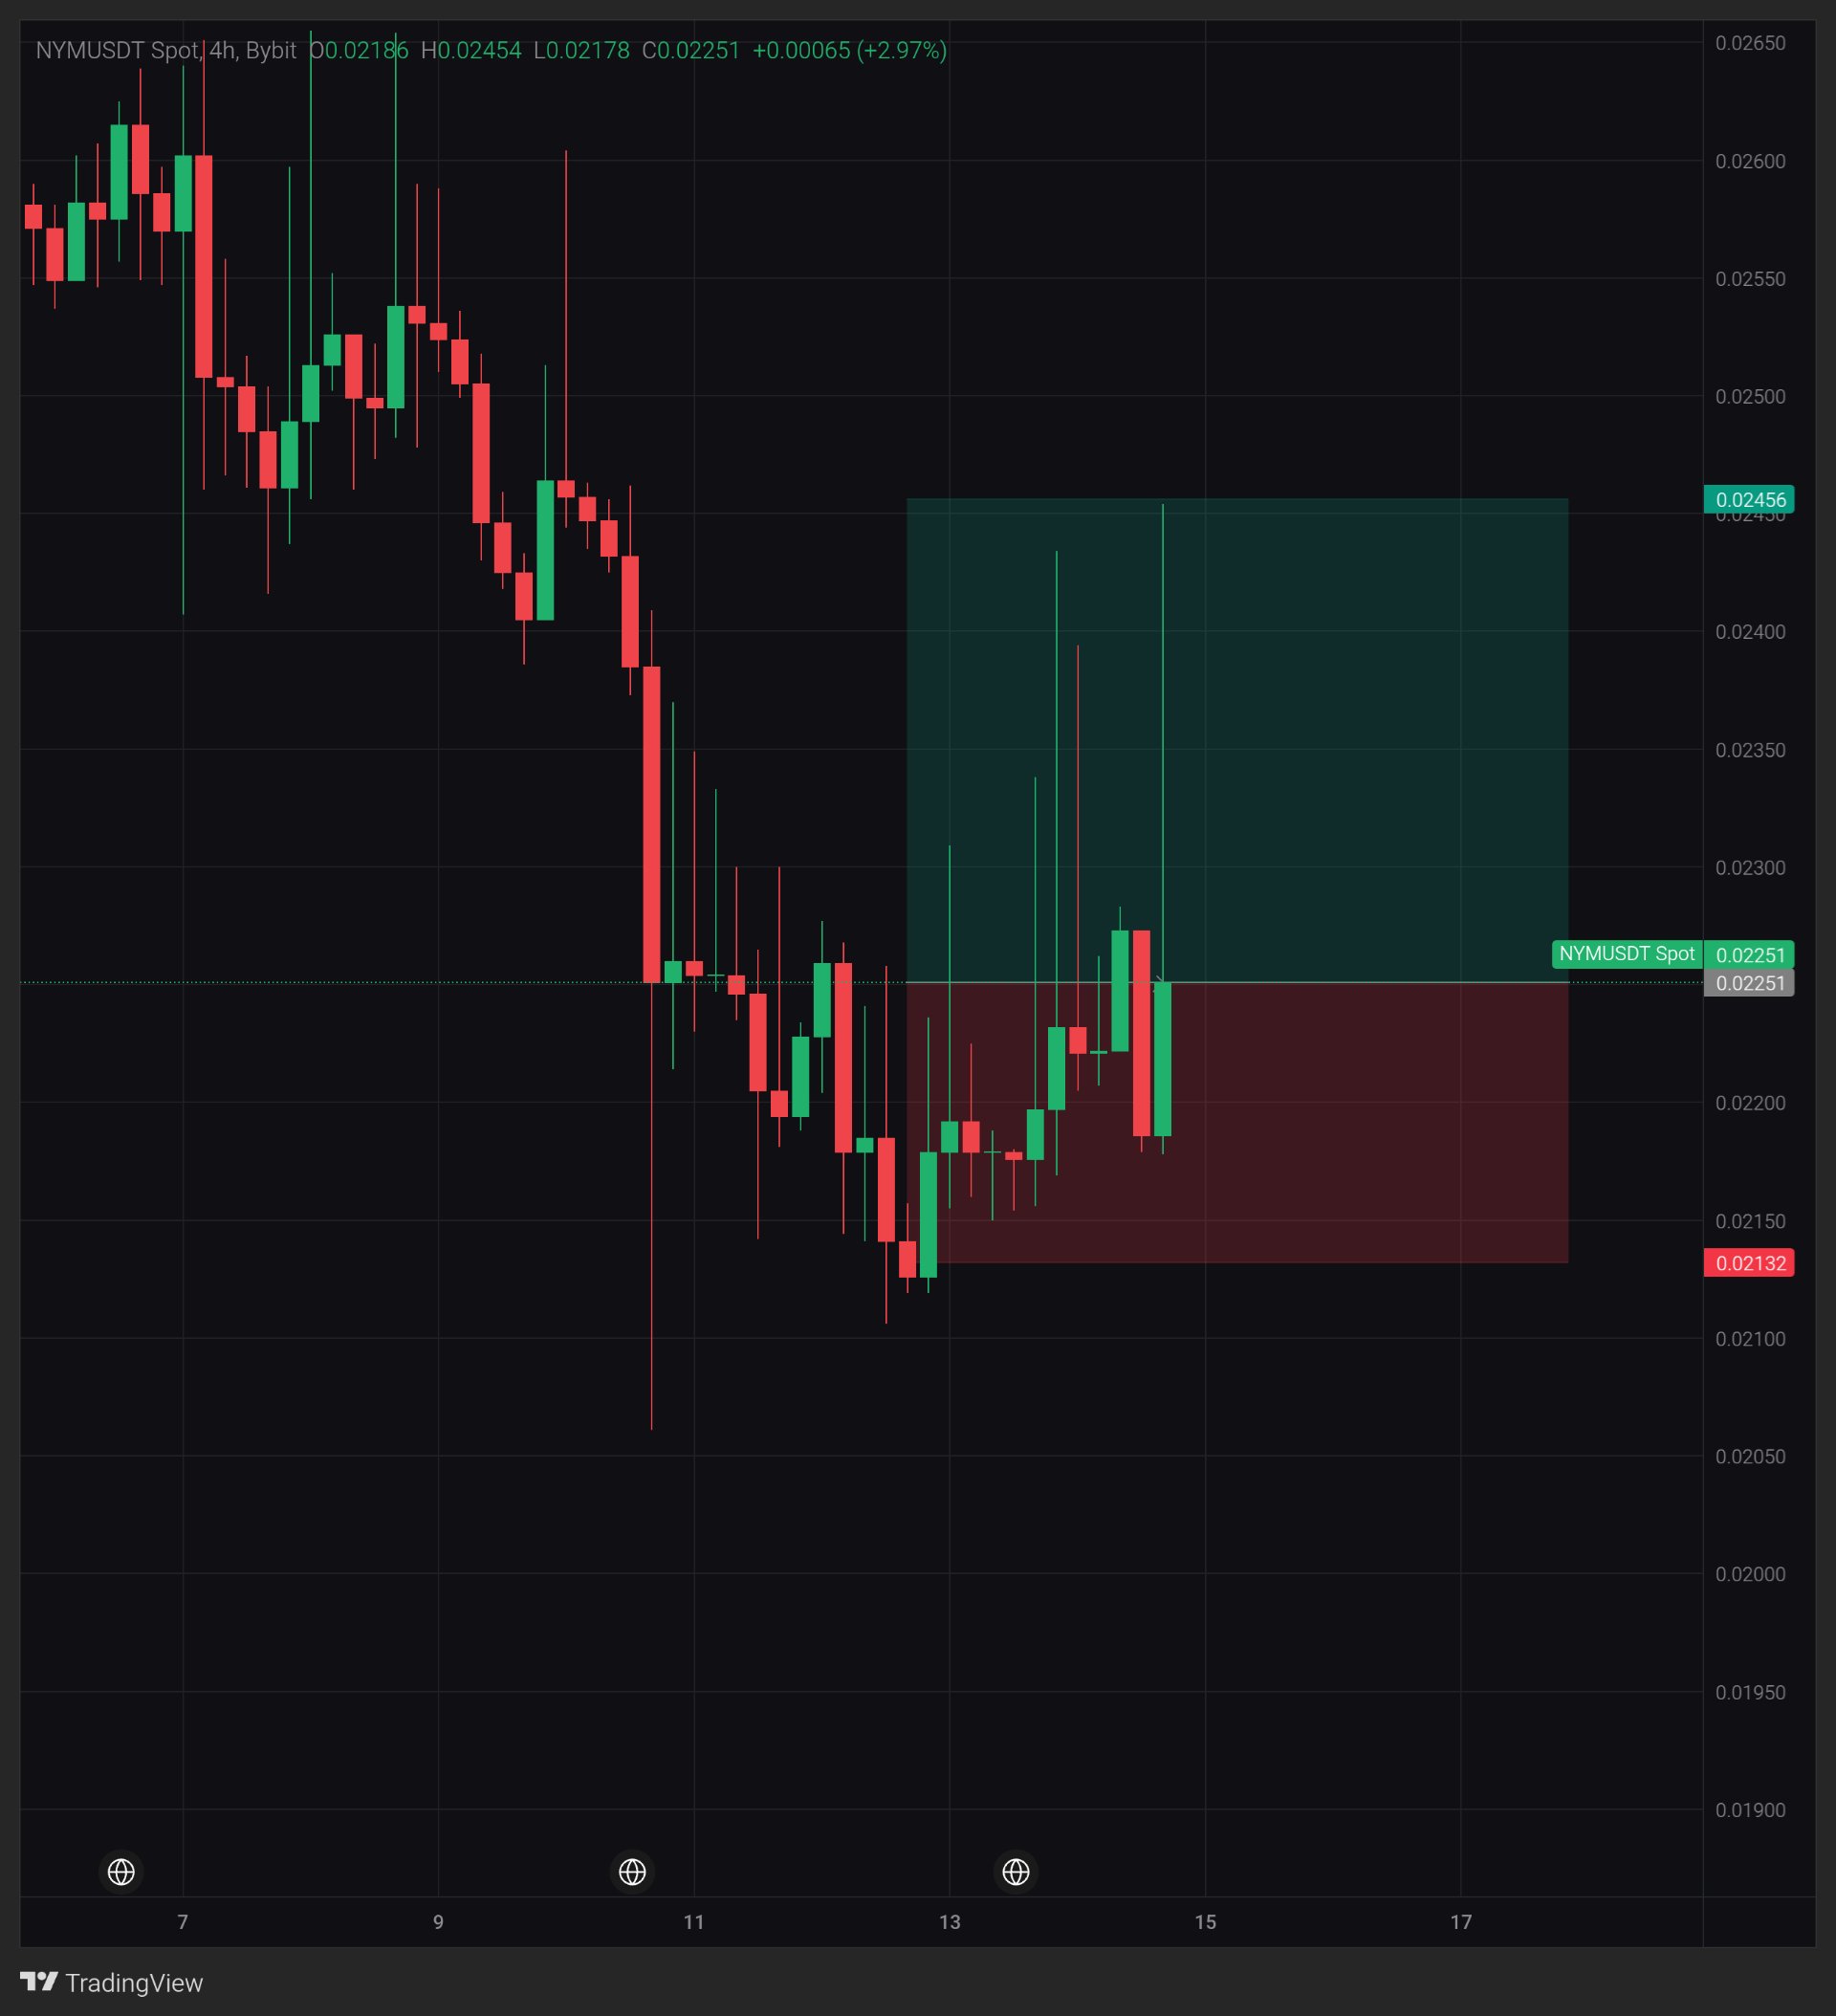
$NYMUSDT — price is back at about 0.02251, where the big red candle closed on the way down. Look at the current candle. It pushed 12.3% above its open, then gave back about three quarters of that push. Still unresolved: is 0.02251 a base, or another stop under the same ceiling? Five wicks above 0.0230, zero closes there. What would it take to change that? 4H, $NYMUSDT Spot on Bybit, 0.02251, +2.97% on the current candle. Macro note Nov 13, 2026: US producer prices rose 0.3% in October, below the 0.4% expected, with the yearly rate at 6.5%, the highest since November 2022 (US Bureau of Labor Statistics, via Kitco). Background only, not the reason for this move. What the chart shows Price fell about 20%, from the 0.0265 area to a low near 0.02107, and has bounced since. The lows have lifted: roughly 0.0212, then 0.0215, now 0.0218. Look at the wicks. Five 4H candles since the 13th wicked above 0.0230, the longest to 0.02454. None of them closed above about 0.02274, the highest close of this bounce. The current candle: open 0.02186, high 0.02454, low 0.02178, close 0.02251. The range is 0.00276, about 12.6% of the open. The upper wick is 0.00203, about 3.1 times the 0.00065 body. The close sits in the lower quarter of the range. From the low near 0.02107, price is up about 6.8% at this level. Volume is not shown on this chart. There are no indicators, so this is a price-action reading. Key levels Support: 0.02186 (open of this candle), then 0.02132 (bottom of my red box). The swing low is near 0.02107. Resistance: about 0.02274 (highest close of this bounce), then 0.02456 (top of my green box, tagged by the wick at 0.02454). What would strengthen it Wicks above 0.0230 have not counted so far, because nothing has closed there. Until a 4H candle closes above about 0.02274, those wicks are just wicks. A close above 0.0230 would be the first real change. A higher low above 0.02186 on a retest would help too. Concern A 4H close below 0.02186 would erase this candle's whole gain. A close below 0.02132 would put price under the base of this bounce, with 0.02107 as the next reference. Price was sold back five times above 0.0230. What changes my mind A 4H close above 0.0230. The lesson A wick is a question. A close is the answer. Five wicks asked about 0.0230, and no close has answered yet. My view My read: price is stuck under a ceiling, and I lean cautious while closes stay below 0.0230. I could be wrong, and a 4H close above 0.0230 would prove me wrong. Take the levels, not my lean. This is a scenario, not a prediction. A reading at posting time, not a guarantee. Do you trust the higher lows or the failed wicks more here? #IMPACTbyTrade
XAUT: Testing 3,828 After a 7% Drop
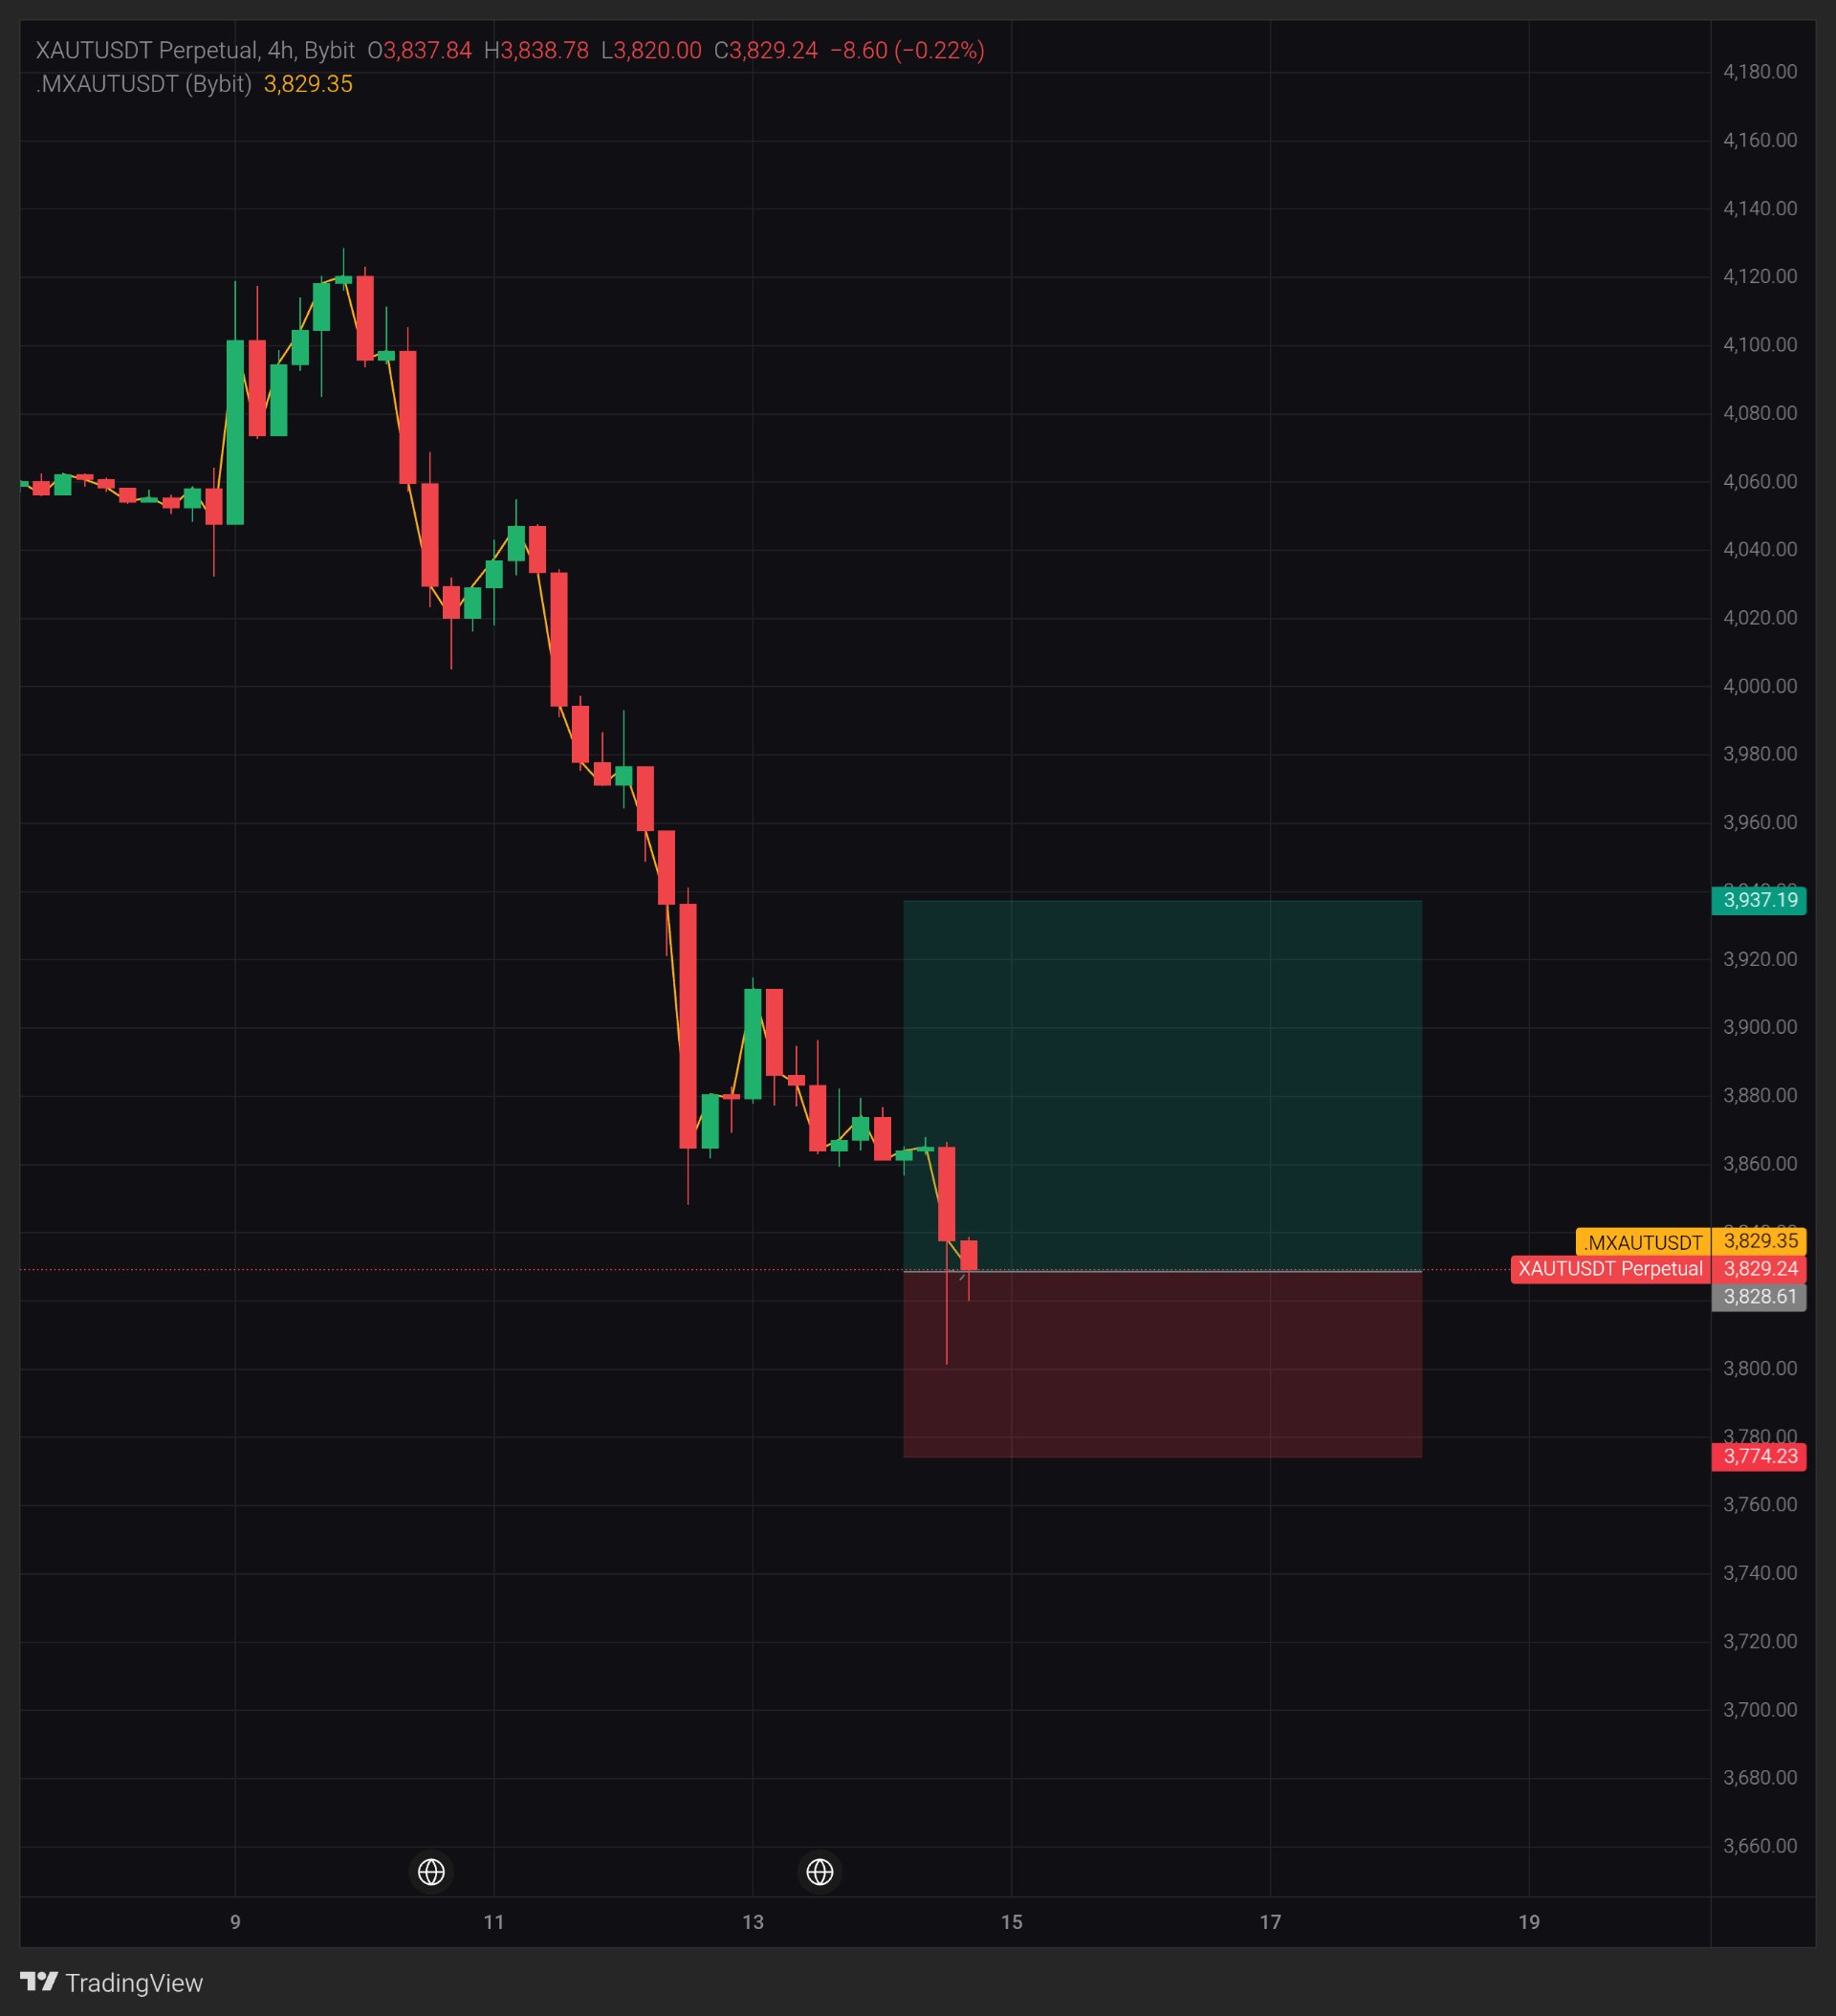
$XAUTUSDT — price is sitting right on 3,828.61, the line between my two boxes. Look at the current candle. It traded only 0.94 above its open, and 17.84 below it. Still unresolved: can the buyers who showed up on the last long wick hold a close? Who is more patient here, the ones who sold the bounces or the ones who bought the wick? 4H, XAUTUSDT Perpetual on Bybit, 3,829.24, -0.22% on the current candle. Macro note Nov 13, 2026: RoboForex's weekly gold outlook says markets are pricing a possible December Fed rate hike, with the FOMC minutes due Nov 18. Background only, not the reason for this move. What the chart shows Price fell from a high near 4,128 to 3,829, about 7.2%, in roughly five days. Since the old low near 3,848, the rebounds have made four lower highs in a row: about 3,915, 3,896, 3,879 and 3,867. The candle before this one closed at 3,837.84, under that old low. It also wicked down to about 3,801 before closing off its low. The current candle: open 3,837.84, high 3,838.78, low 3,820.00, close 3,829.24. The range is 18.78, about 0.5%. The upper wick is only 0.94 against an 8.60 body, so sellers held price under its open almost the whole time. The lower wick is 9.24, about the size of the body, so buyers did step in at 3,820. The index line ($XAUTUSDT) reads 3,829.35, just 0.11 from the perpetual. Volume is not shown here. The yellow line is the index price, which follows price, so it is not independent proof. This is a price-action reading. Key levels Support: 3,820.00 (low of this candle), then about 3,801 (the last wick low). The bottom of my red box is 3,774.23. Resistance: 3,838.78 (high of this candle), then about 3,848 (the old low, now overhead). The top of my green box is 3,937.19. What would strengthen it Price touched 3,820.00 and bounced, but a touch proves little. I want a 4H close above 3,838.78, then a 4H close above about 3,848 to show the old low is reclaimed. A higher low above 3,820.00 on a retest would help more. Concern A 4H close below 3,820.00 would mean the dip buyers failed. Four lower highs in a row show sellers have had the upper hand on every bounce. A close below about 3,801 would leave 3,774.23 as the next reference. What changes my mind A 4H close above about 3,867. The lesson A long wick shows buyers showed up. It does not show they stayed. Only closes do that. My view My read: this is a downtrend of lower highs, and the long wick below is not yet confirmed by a close, so I lean cautious while XAUT stays under about 3,867 on 4H closes. I could be wrong, and a 4H close above about 3,867 would prove me wrong. Take the levels, not my lean. This is a scenario, not a prediction. A reading at posting time, not a guarantee. Which level are you watching on this one, 3,820 or 3,848? #ByXIMPACT
ARX: Back at 0.2092, Where the Spike Began
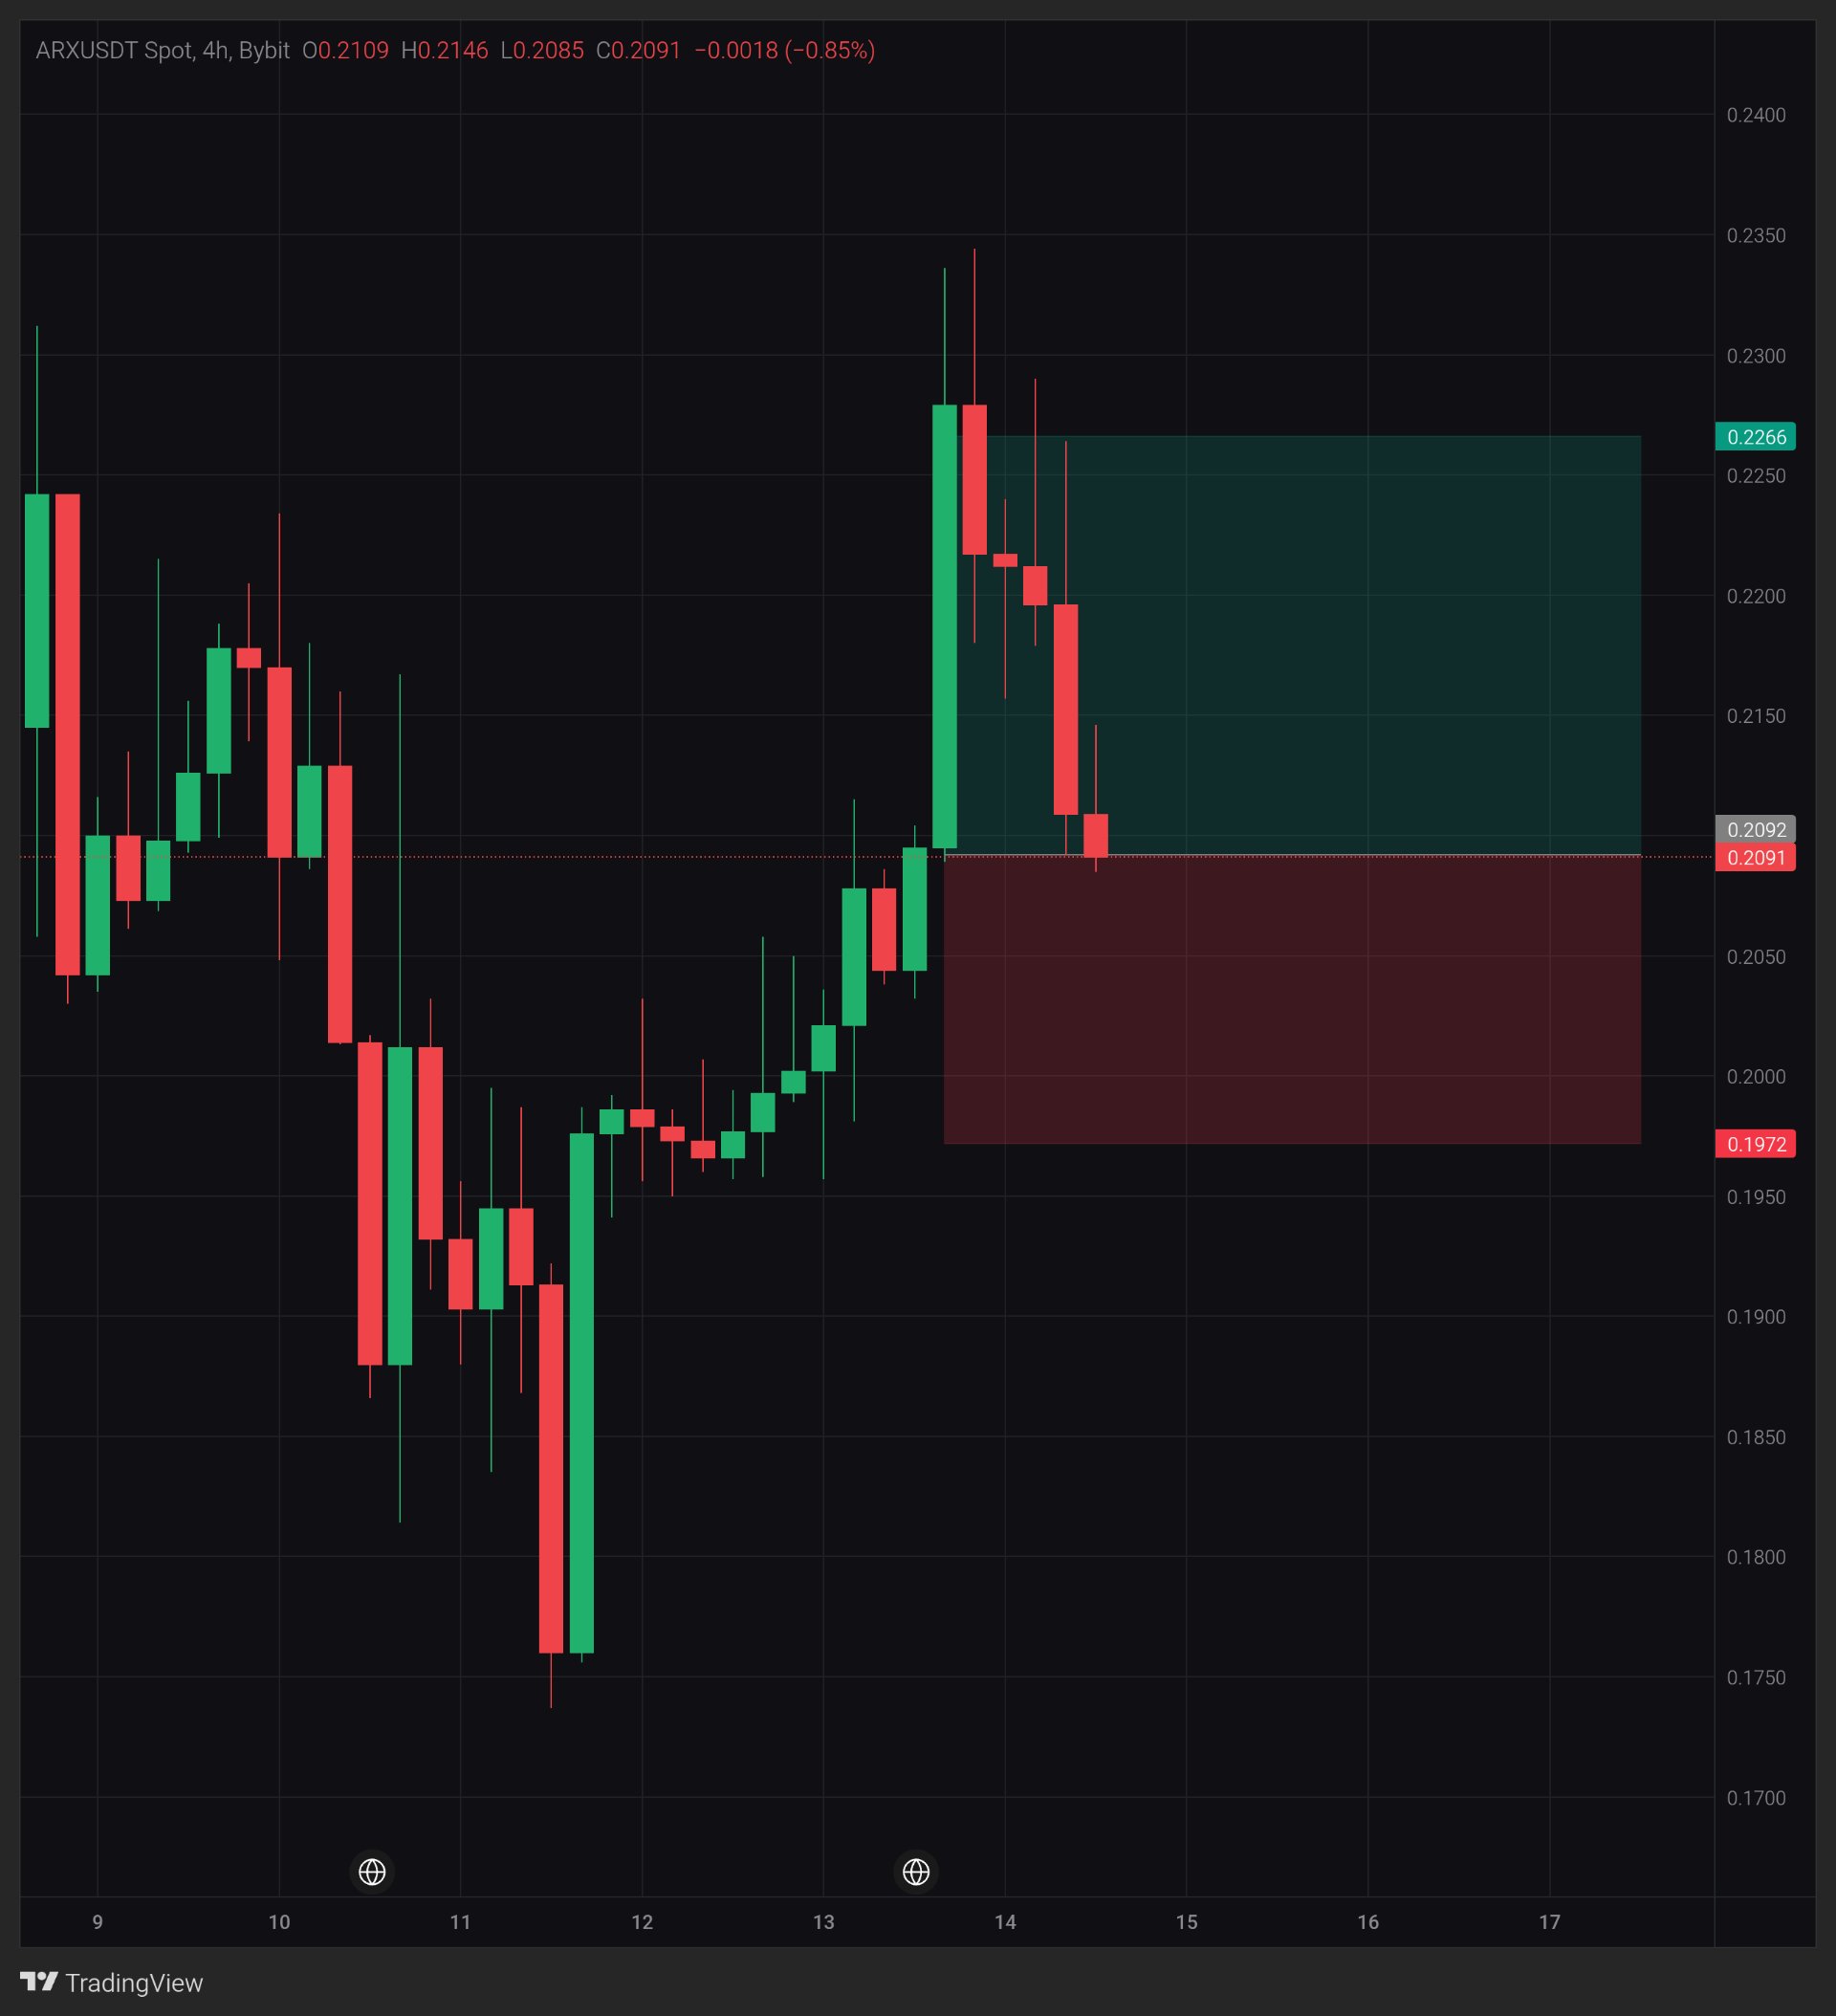
$ARXUSDT — price is back on the base of the big green candle, 0.2092. Look at the last five closes. That green candle added about 8.8%, and five lower closes in a row have taken it all back. Still unresolved: does 0.2092 hold on a 4H close, or is it just the next stop on the way down? What does a rejected push tell you that a green candle can't? 4H, ARXUSDT on Bybit, 0.2091, -0.85% on the current candle. What the chart shows One big green candle ran from about 0.2095 to a close near 0.2279. The next candle wicked up to about 0.2345, then closed lower. Every close since has been lower: 0.2217, 0.2212, 0.2196, 0.2108, and 0.2091 now. Look at the current candle. Open 0.2109, high 0.2146, low 0.2085. The range is about 2.9%. The upper wick is 0.0037, about twice the 0.0018 body. Price pushed 1.75% above its open and sold back. Zoom out: the climb from about 0.1738 to 0.2345 was roughly +35%. Price has given back about 42% of that range. Volume is not shown on this chart, so I can't say how much weight was behind the selling. There are no indicators, so this is a price-action reading. Key levels Support: 0.2092 (base of the big green candle, the edge between my two boxes), then 0.1972 (bottom of my red box). Resistance: 0.2146 (high of the current candle), then 0.2266 (top of my green box). What would strengthen it Price has already touched 0.2092 and dipped to 0.2085, so a touch proves little. I want a 4H close back above 0.2092, then a close above 0.2146. A higher low above 0.2092 on a retest would help more. The midpoint of the big green body, near 0.2187, is where the pullback would start to look absorbed. Concern A 4H close below 0.2092 would mean the base of the spike failed. The next reference below is 0.1972, the edge of my red box. Five lower closes in a row show sellers have had control so far. What changes my mind A 4H close above 0.2187. The lesson Touching a level is a visit. A close is a decision. Price has visited 0.2092 but has not decided yet. My view My read: this looks like a failed spike with price back at its starting point, so I lean cautious while ARX stays under 0.2187 on 4H closes. I could be wrong, and a 4H close above 0.2187 would prove me wrong. Take the levels, not my lean. This is a scenario, not a prediction. A reading at posting time, not a guarantee. Where do you want the next 4H close to land, above 0.2092 or under it, and why? #ByXIMPACT #WSOTShowYourAITradeToEarn10USDT #JensenHuangExitTestsNvidiasAILeadership

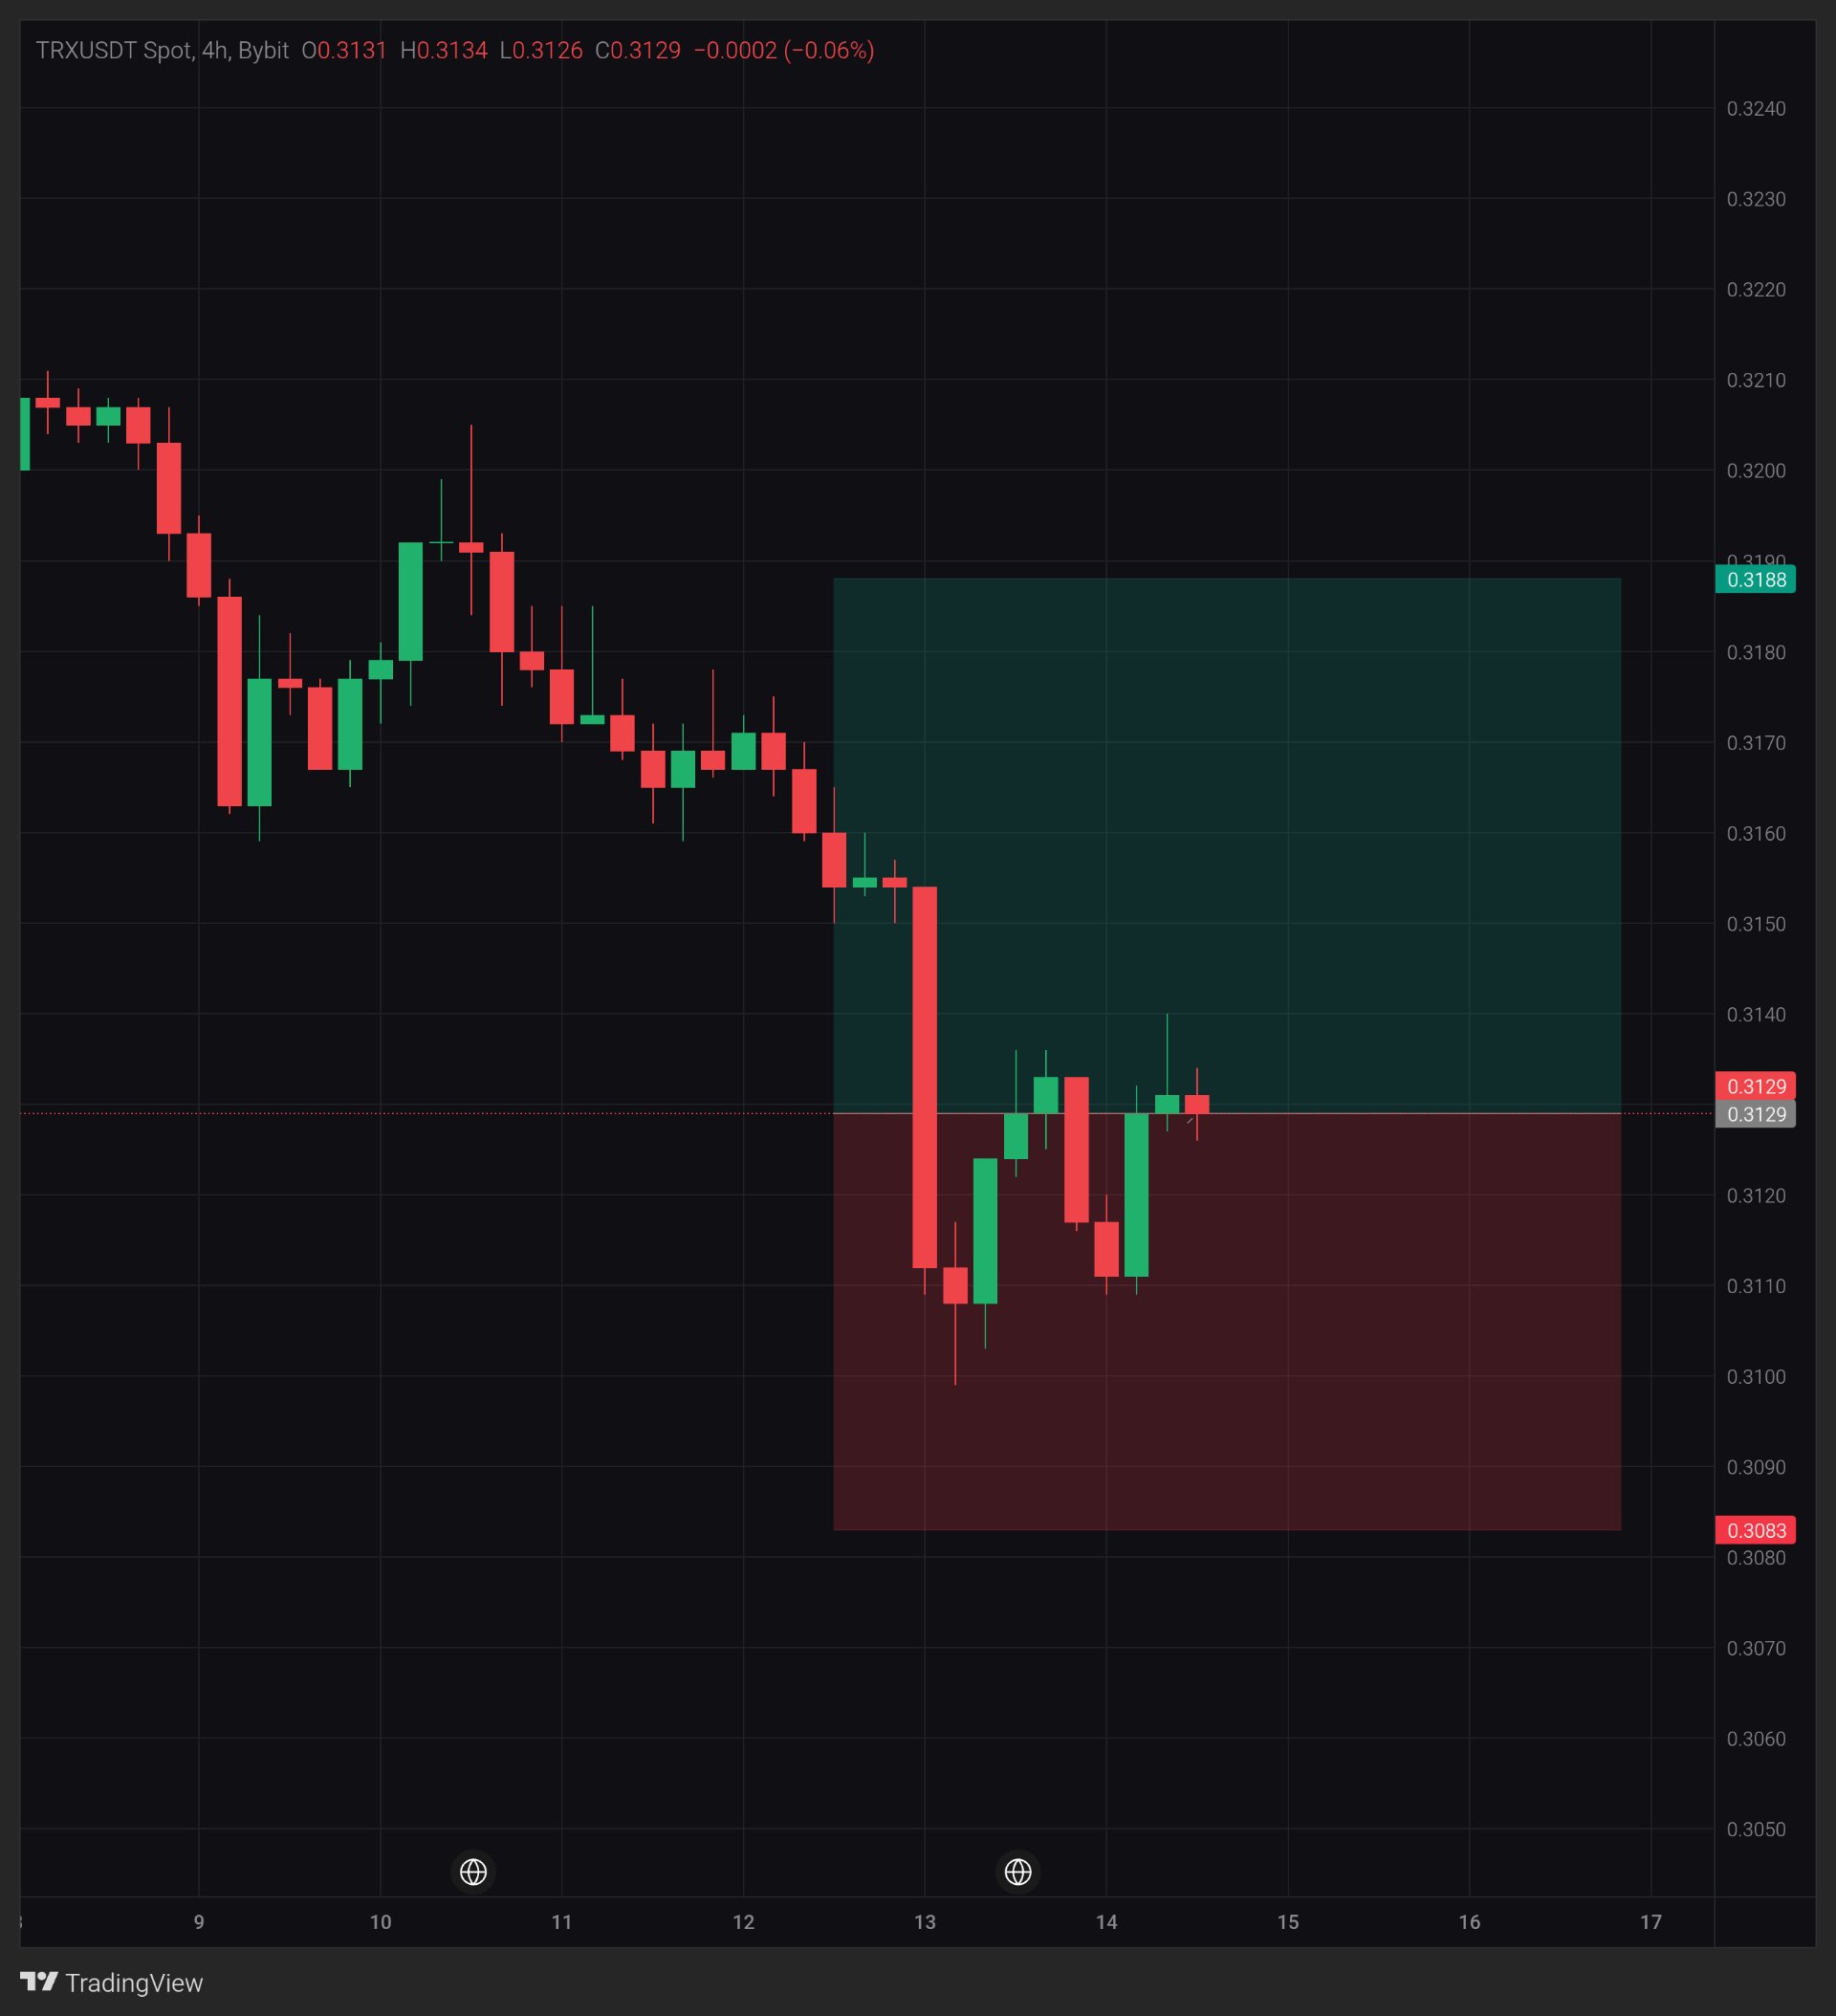
TRX: 0.3133 capped two bodies. Will it break?
$TRXUSDT — 0.3133 has stopped the last two candle bodies. Look at the range: nine candles since the drop, all inside about 1.3%. That cap is also the midpoint of the big red candle, and price has failed there twice. Will it break up, or does the 0.3110 floor give first? 4H chart, $TRXUSDT Spot on Bybit, price 0.3129 (-0.06% on the current candle). Macro note Nov 13: US producer prices rose 6.5% in October from a year earlier, the biggest annual gain in four years (The Standard). Background only, not the reason for this move. What the chart shows One big red 4H candle took price from 0.3154 to 0.3112, about 1.3%. Since then price has bounced to a 0.3140 wick high, but the candle bodies keep stopping at 0.3133, exactly the middle of that red candle. The lows keep landing at 0.3109 to 0.3111. So price is squeezed between a floor and a cap, and the whole range is narrower than that one red candle. Volume and indicators are not shown on this chart, so this is price action only. Key levels Support: 0.3126 (low of the current candle), then 0.3109 to 0.3111 (repeated lows), then 0.3098 (wick low) and 0.3083 (bottom of my box). Resistance: 0.3133 (body cap), then 0.3136 to 0.3140 (wick highs), then 0.3154 (open of the big red candle) and 0.3188 (top of my box). What would strengthen it Touching 0.3140 proves nothing, it has been touched. A 4H close above it would be the first real step, because wicks above 0.3133 have not held so far. Concern A 4H close below 0.3109 would break the floor that caught the last dips, with 0.3098 next. Another rejection at 0.3133 would make that cap harder to ignore. What changes my mind A 4H close above 0.3154, which would erase the whole red candle. The lesson A tight range after a drop is a pause. The side that wins the close decides what kind of pause it was. My view My read: this looks like a pause after the drop, not a reversal yet, and I lean cautious until 0.3140 closes. I could be wrong, and a 4H close above 0.3154 would say so. Take the levels, not my lean. This is a scenario, not a prediction. A reading at posting time, not a guarantee. Look at the cap and the floor. Which one do you think gives first? #ByXIMPACT #AnthropicIPOTestsTheAIBoom #BitcoinHitsTwoMonthLowAfterUSMidterms
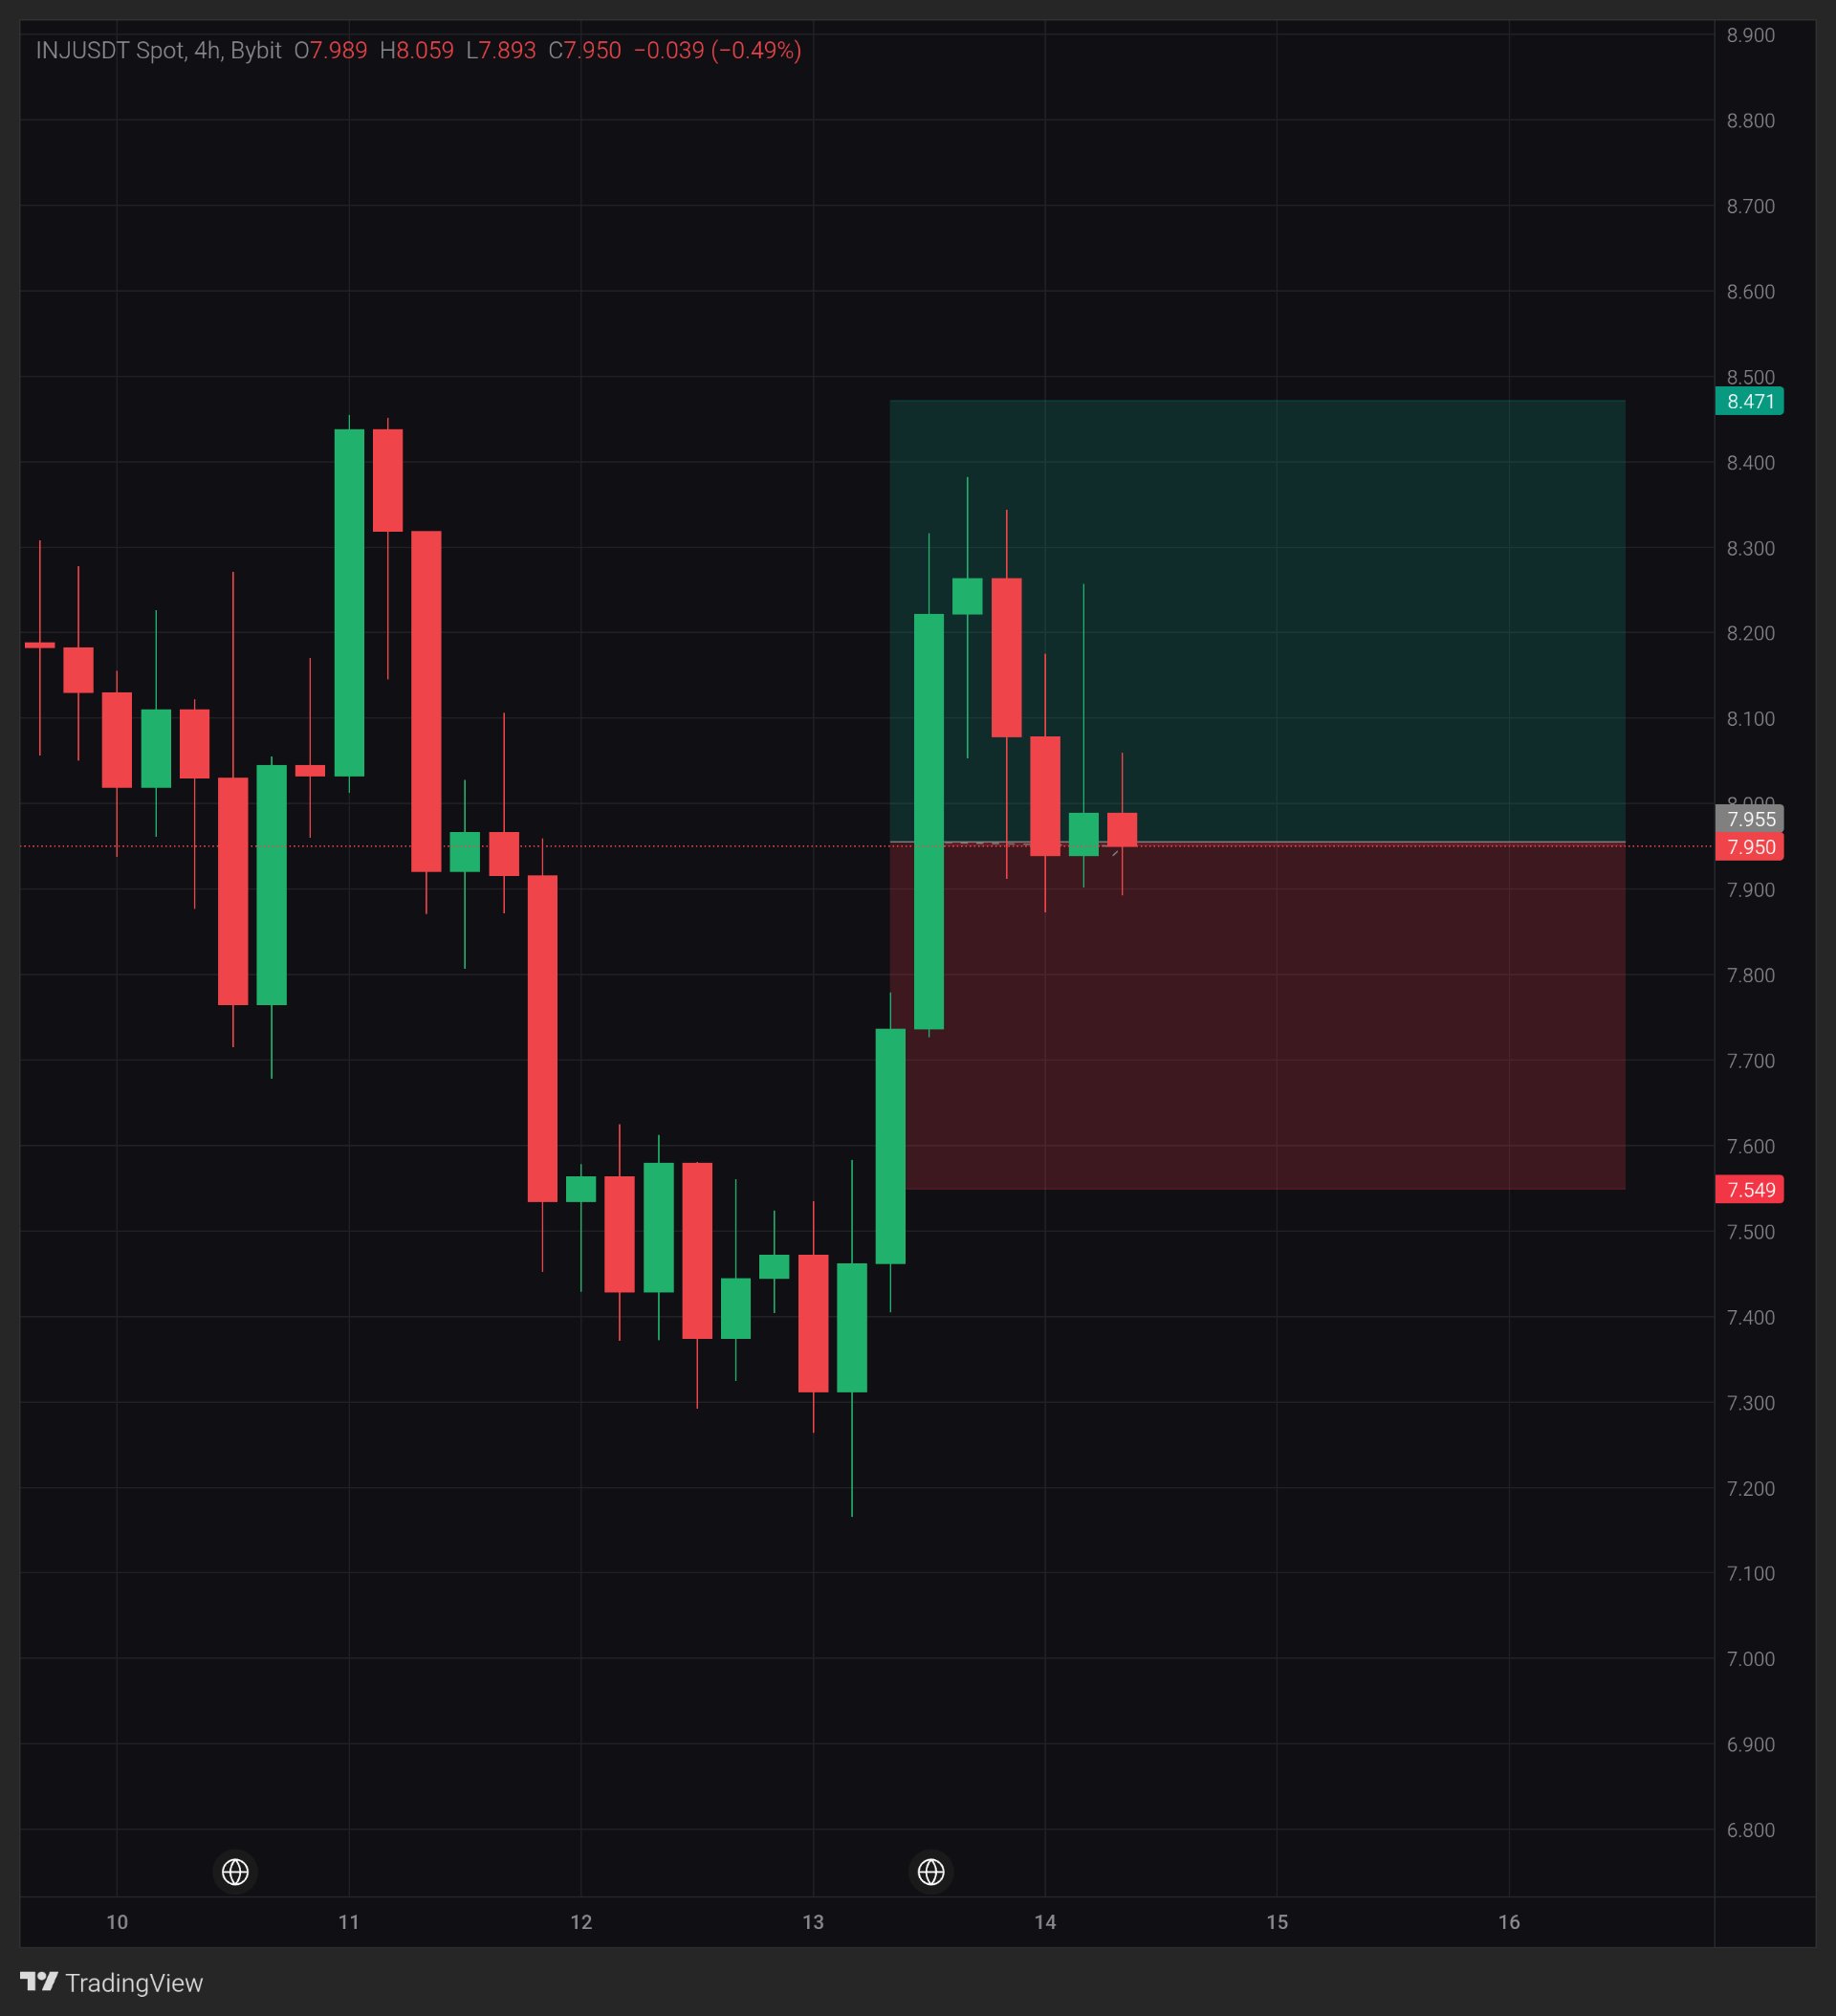
INJ: 7.87 floor, lower highs. Which breaks?
$INJUSDT — 7.87 to 7.90 keeps catching every dip. The highs have faded from 8.385 to 8.059 over five candles. Price is also sitting at the midpoint of a 6% surge candle. Does the floor hold, or does the squeeze break down first? 4H chart, $INJUSDT Spot on Bybit, price 7.950 (-0.49% on the current candle). Macro note Nov 13: US October producer prices rose 6.5% year-on-year, the largest annual gain in four years, adding to expectations of more Fed rate hikes (The Standard). Background only, not the reason for this move. What the chart shows INJ bounced from the 7.17 wick low to the 8.385 high, about 17%, led by one big green candle (7.735 to 8.225, about 6%). Since then price has faded back to 7.95, right at that candle's midpoint, about 7.98. The recent candles keep repeating lows at 7.87 to 7.90 while the highs fade, so price is squeezing between a flat floor and lower highs. A small green candle also left a wick up to about 8.265, where sellers showed up. Volume and indicators are not shown on this chart, so this is price action only. Key levels Support: 7.87 to 7.90 (repeated lows), then 7.735 (base of the surge candle), then 7.549 (bottom of my box). Resistance: 8.06 (current candle high), then 8.18 to 8.27 (wick highs), then 8.385 and 8.471 (top of my box). What would strengthen it Touching 8.06 proves nothing. A 4H close above it would end the lower-high pattern, and a close above 8.27 would clear the last wick high. Holding 7.87 on another dip would also help. Concern A 4H close below 7.87 would break the floor that caught the last dips, with 7.735 next. A bounce that fades back to the midpoint of its own biggest candle is losing strength. What changes my mind A 4H close below 7.735, which would erase the whole surge candle. The lesson A bounce that gives back half of its biggest candle is asking a question. The floor under it decides the answer. My view I'm watching the 7.87 floor and the 8.06 cap. A squeeze like this resolves one way or the other, and a close shows which side won. This is a scenario, not a prediction. A reading at posting time, not a guarantee. Which gives first, the 7.87 floor or the 8.06 cap? #ByXIMPACT

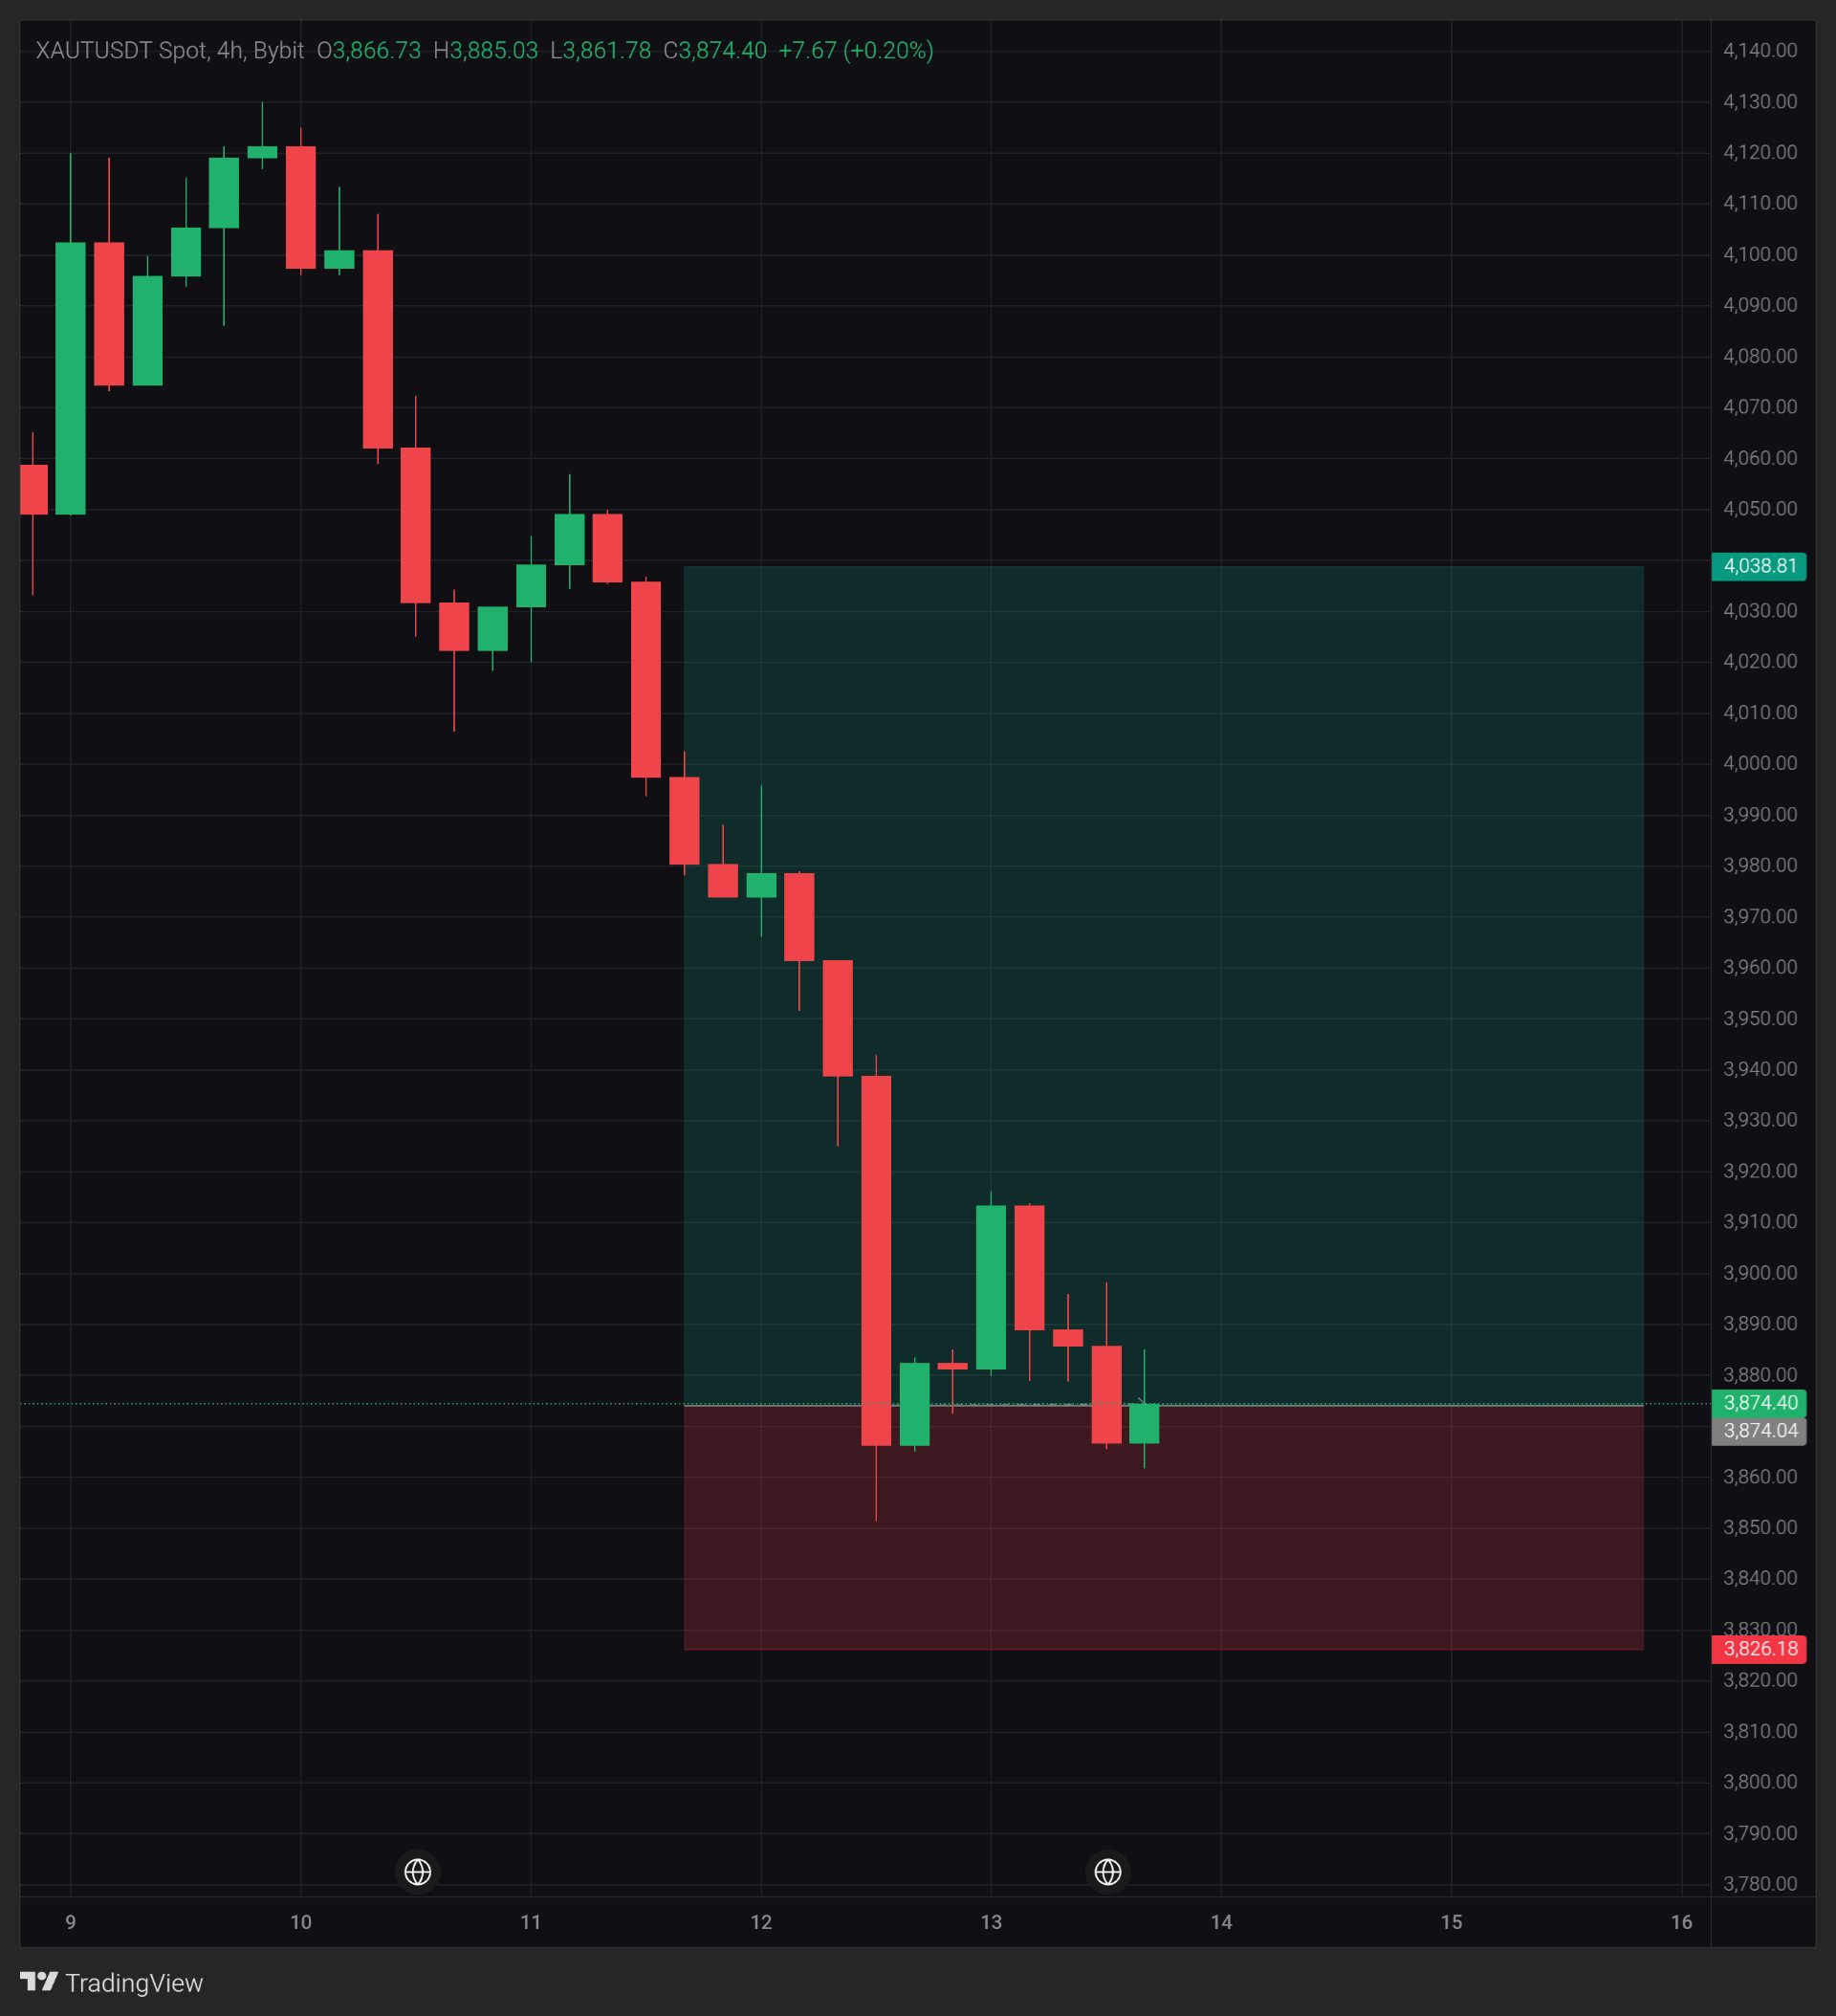
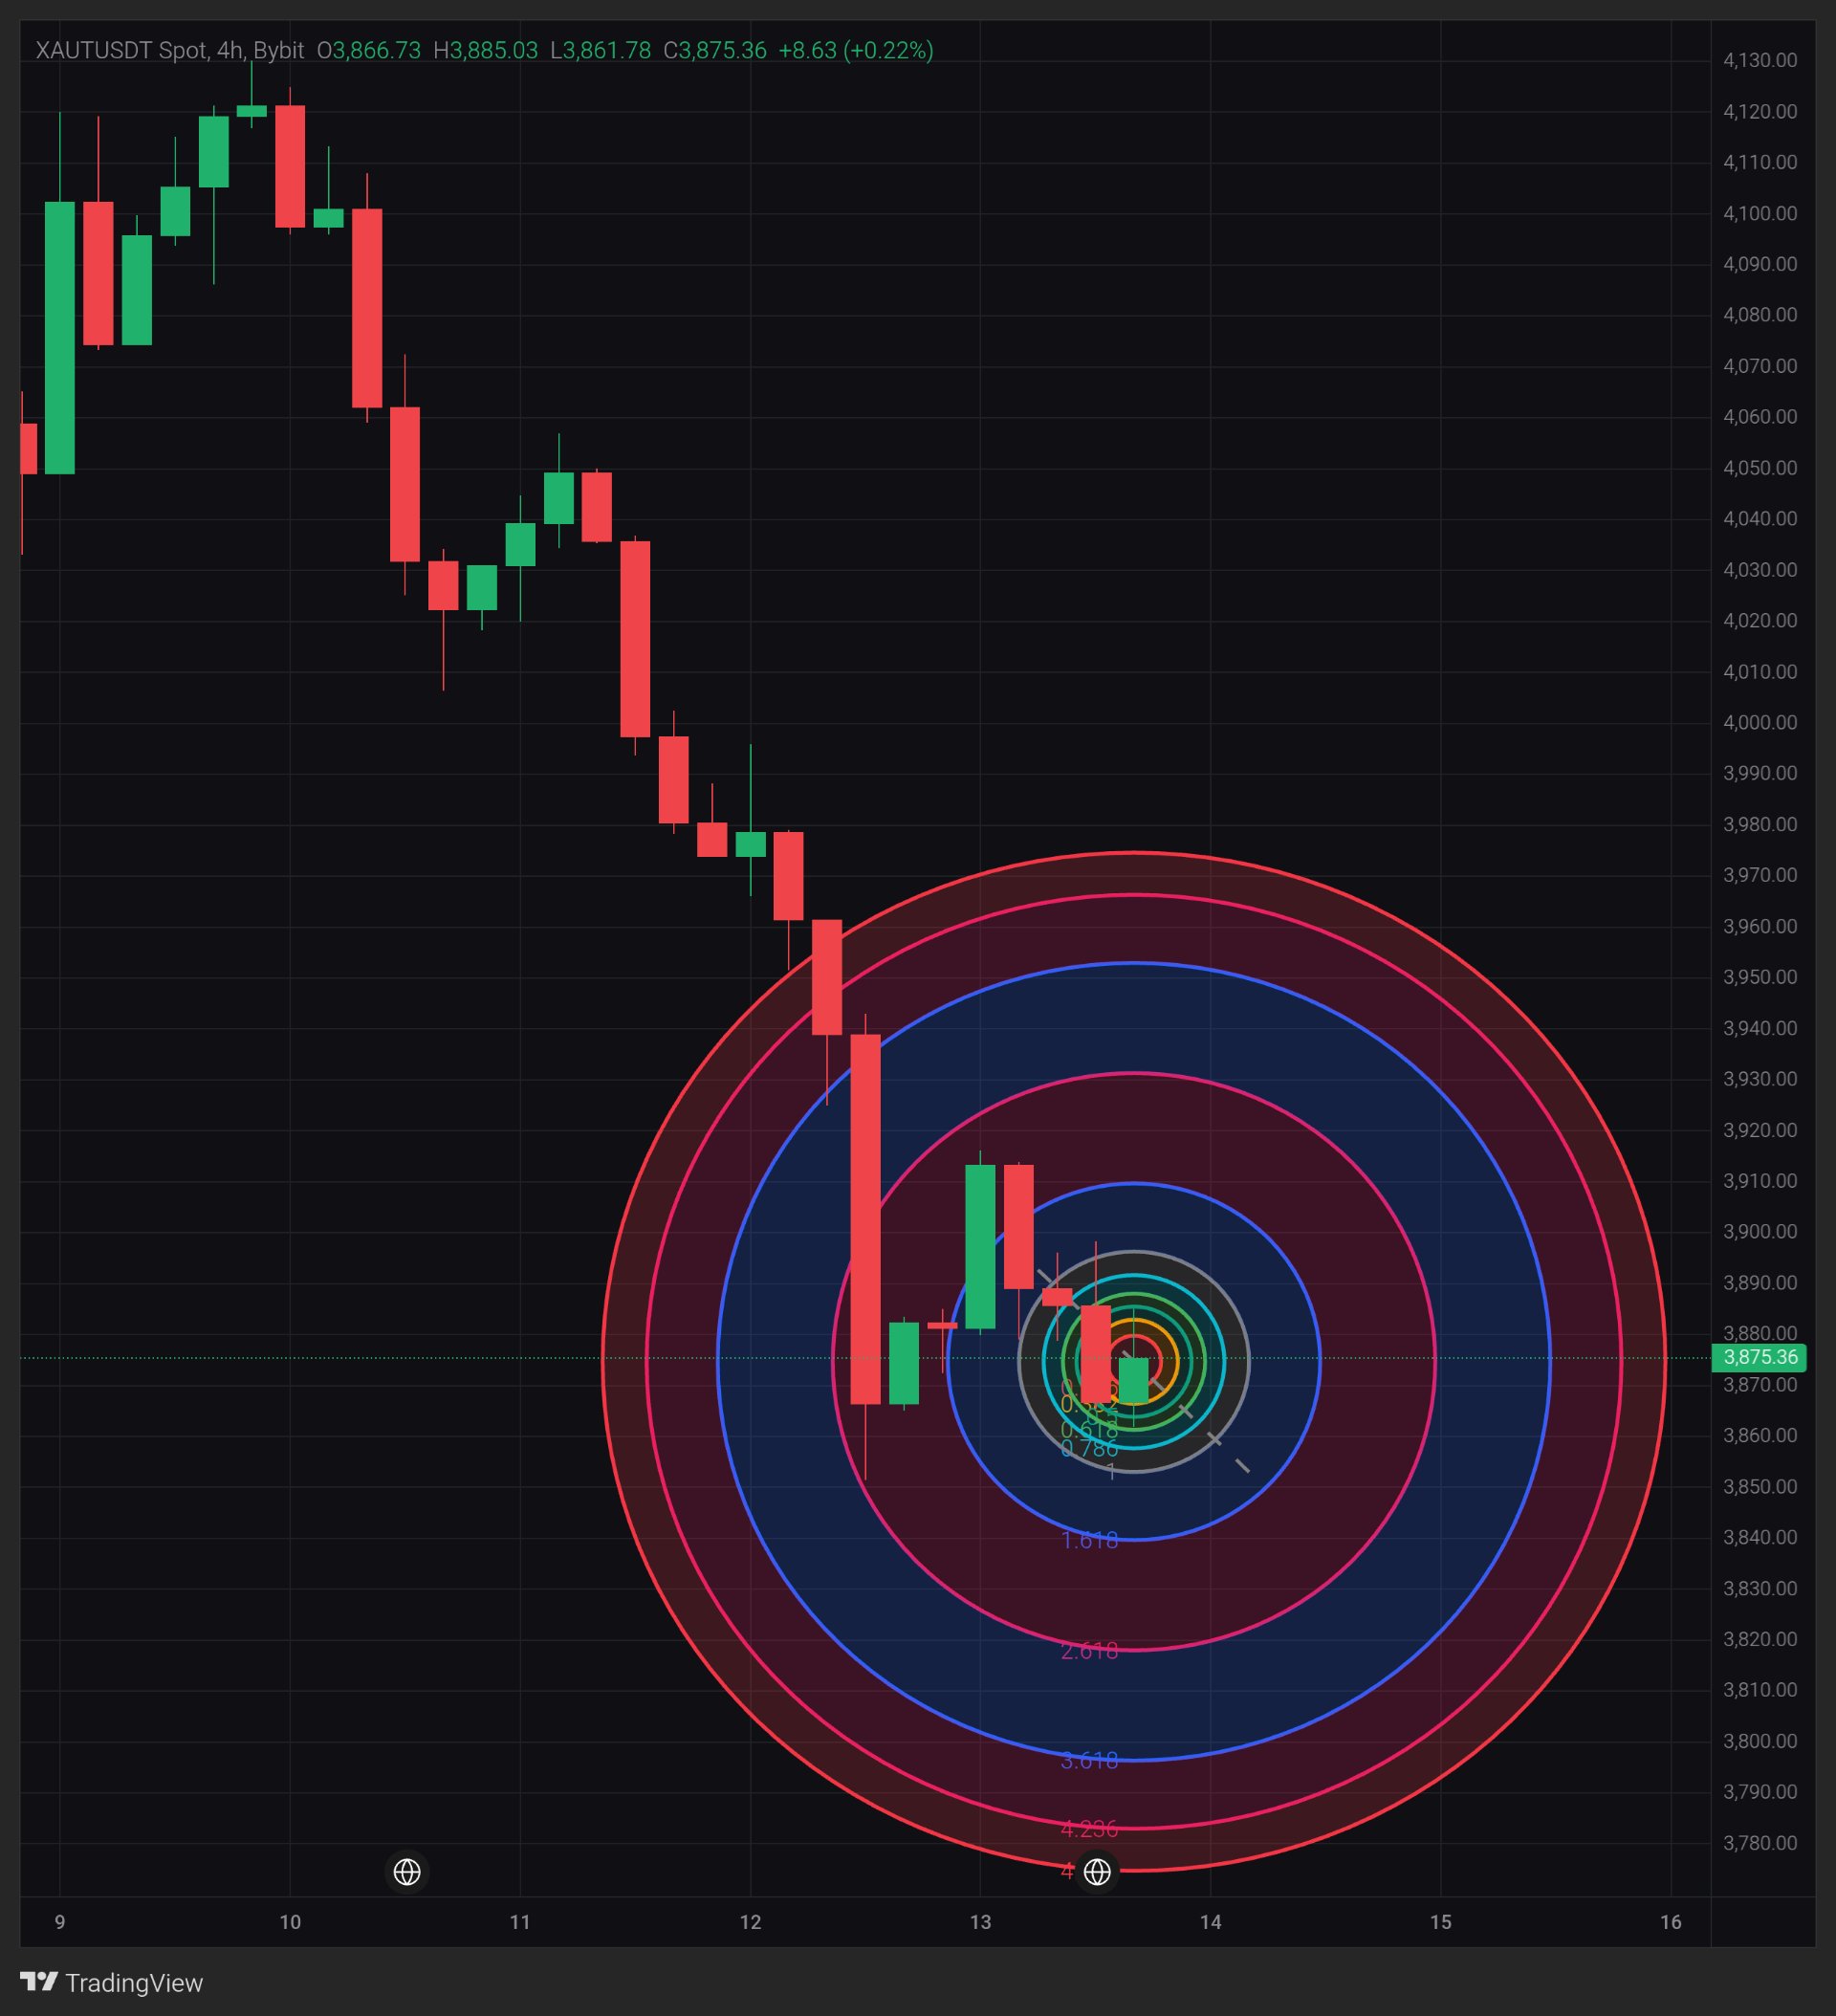
XAUT: Is Gold Preparing for a Recovery?
Gold has suffered a sharp sell-off, but XAUT is now testing an important support area around $3,860–$3,875. The interesting part is that while gold is facing macroeconomic pressure, Tether Gold has just received an important development on the transparency side. Could this create a different market narrative as buyers attempt to defend current levels? My Bybit 4H chart shows $XAUTUSDT at $3,874.40, up 0.20% on the current candle. Price opened at $3,866.73, reached $3,885.03 and tested $3,861.78. WHAT IS DRIVING GOLD? Gold has been under pressure following stronger inflation concerns, a firmer US dollar and rising Treasury yields. These factors have increased expectations of tighter Federal Reserve policy, which generally weighs on non-yielding assets such as gold. However, Friday's producer-price data offered some relief. US PPI rose 0.3% in October, below the 0.4% forecast, helping gold recover part of its recent losses. XAUT FUNDAMENTALS There is also an important development specific to Tether Gold. On November 12, Tether announced that KPMG U.S. completed an independent audit of TG Commodities' 2025 financial statements. The audit included physical inspection and identification checks of the gold bars backing XAUT. This is a meaningful transparency milestone for a token designed to provide blockchain-based exposure to physical gold. Still, stronger reserve transparency does not automatically mean higher market prices. XAUT remains closely tied to the underlying gold market. TECHNICAL STRUCTURE The 4H chart continues to show a bearish short-term structure, with lower highs and strong selling pressure from the $4,130 area. Price is now attempting to stabilize around $3,860–$3,875. Key levels I'm watching: Immediate support: $3,860 Secondary support: $3,850 Major support: $3,826 First resistance: $3,885–$3,900 Next resistance: $3,940 Higher resistance: $3,980 Major recovery target: $4,038 BULLISH SCENARIO If buyers continue defending $3,860 and price reclaims $3,900, I would watch for a move toward $3,940. A stronger recovery above $3,980 could open the way toward $4,038. My chart setup marks a potential entry near $3,874, with a target at $4,038.81 and a stop-loss at $3,826.18. However, I would prefer a confirmed 4H recovery rather than entering simply because price is near support. BEARISH SCENARIO If XAUT loses $3,860 on a confirmed 4H close, the recovery attempt could fail. I would then monitor $3,850 and $3,826 as the next downside areas. A sustained break below $3,826 would invalidate the bullish setup shown on my chart. MY TRADING PLAN I am watching the $3,860–$3,900 range closely. A successful reclaim of resistance would improve the recovery outlook, while another rejection could create further downside risk. I would rather wait for confirmation than try to catch a falling market. MY INTERPRETATION What makes XAUT interesting right now is the contrast between its improving transparency story and the weakness in the underlying gold market. The KPMG audit is a positive fundamental development, but the dollar, Treasury yields and Federal Reserve expectations remain important drivers. For me, the next 4H reaction around $3,860–$3,900 is the key to understanding whether this is the beginning of a recovery or simply a pause in the broader decline. $XAUTUSDT #ByXIMPACT
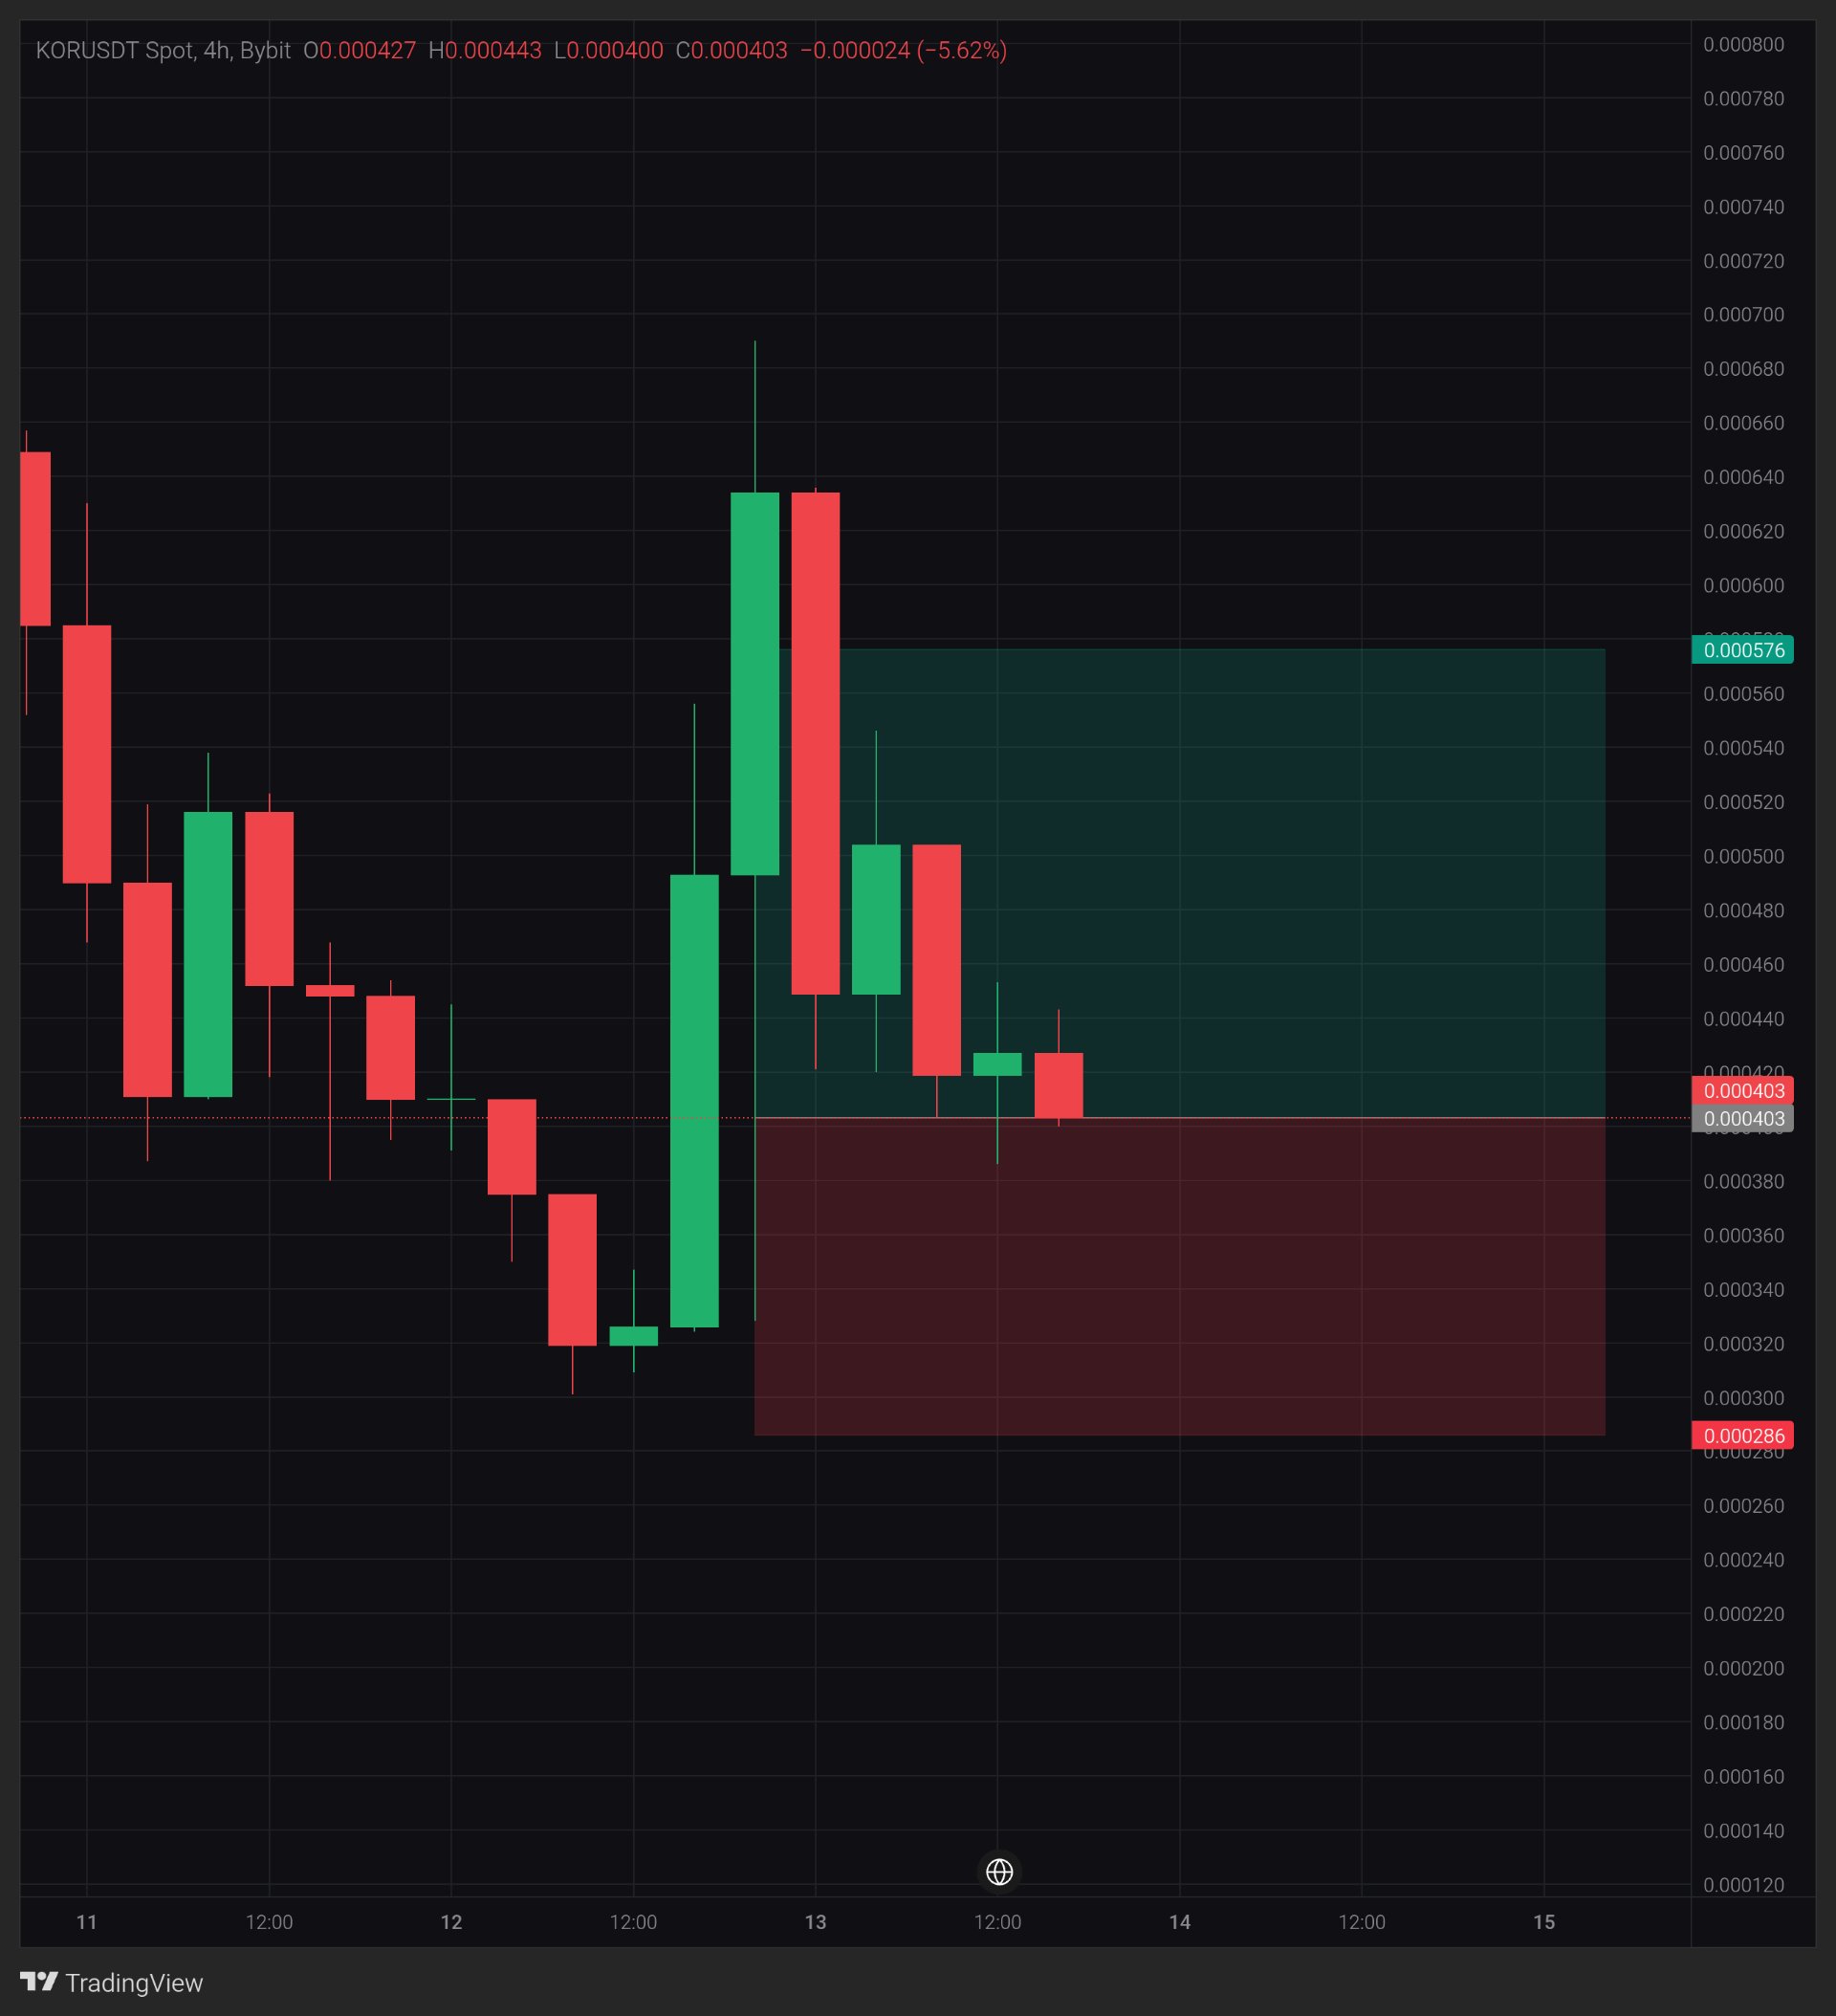
KOR: Can Buyers Defend $0.00040?
$KORUSDT is approaching a critical level, and the next 4H candles could reveal whether buyers are preparing another recovery or whether sellers still control the market. After a sharp rebound from around $0.00032 toward $0.00063, KOR has lost momentum and returned to the $0.00040 area. This is where I want to see whether buyers can step back in. My Bybit 4H chart shows KORUSDT at $0.000403, down 5.62% on the current candle. The candle opened at $0.000427, reached $0.000443 and tested a low of $0.000400. PROJECT FUNDAMENTALS KOR Protocol is built on Base and focuses on managing creative rights, licensing and payment settlements on-chain. Its goal is to give artists, producers, publishers and intellectual property owners a more transparent way to manage and monetize creative assets. The project recently entered a new exchange-listing phase, with KuCoin and Gate announcing KOR spot trading on November 4. Gate also introduced a Launchpool campaign. This brings additional market exposure, but exchange listings alone do not guarantee sustainable demand or price appreciation. MARKET STRUCTURE The previous rally showed strong buying interest, but the rejection near $0.00063 changed the short-term picture. The $0.00040 area is now the immediate level to watch. Key levels: Support: $0.000400 Secondary support: $0.000380 Major support: $0.000320 Resistance: $0.000443 Higher resistance: $0.000500 Major upside target: $0.000576 BULLISH SCENARIO If buyers defend $0.00040 and KOR reclaims $0.000443 with a convincing 4H close, I would watch for a move toward $0.00050. A stronger continuation could bring $0.000576 into focus. I would prefer confirmation and a successful retest rather than entering simply because the price has fallen. BEARISH SCENARIO If KOR loses $0.00040 on a confirmed 4H close, the next areas I would monitor are $0.000380 and $0.000320. A break below $0.000320 would significantly weaken the recovery structure. The $0.000286 area is an additional downside invalidation reference from my chart setup. MY TRADING PLAN I am watching the reaction around $0.00040 rather than chasing the market. A confirmed reclaim of $0.000443 would improve the bullish case. A breakdown below support would make me reconsider the setup. Because KOR is a newly listed and highly volatile token, position sizing and risk control are especially important. MY INTERPRETATION What interests me here is not simply the percentage decline. It is the fact that price has returned to an area where buyers previously showed interest. The next 4H reaction should tell us more than any prediction. I want confirmation from price action before taking a position. #ByXIMPACT #JensenHuangExitTestsNvidiasAILeadership
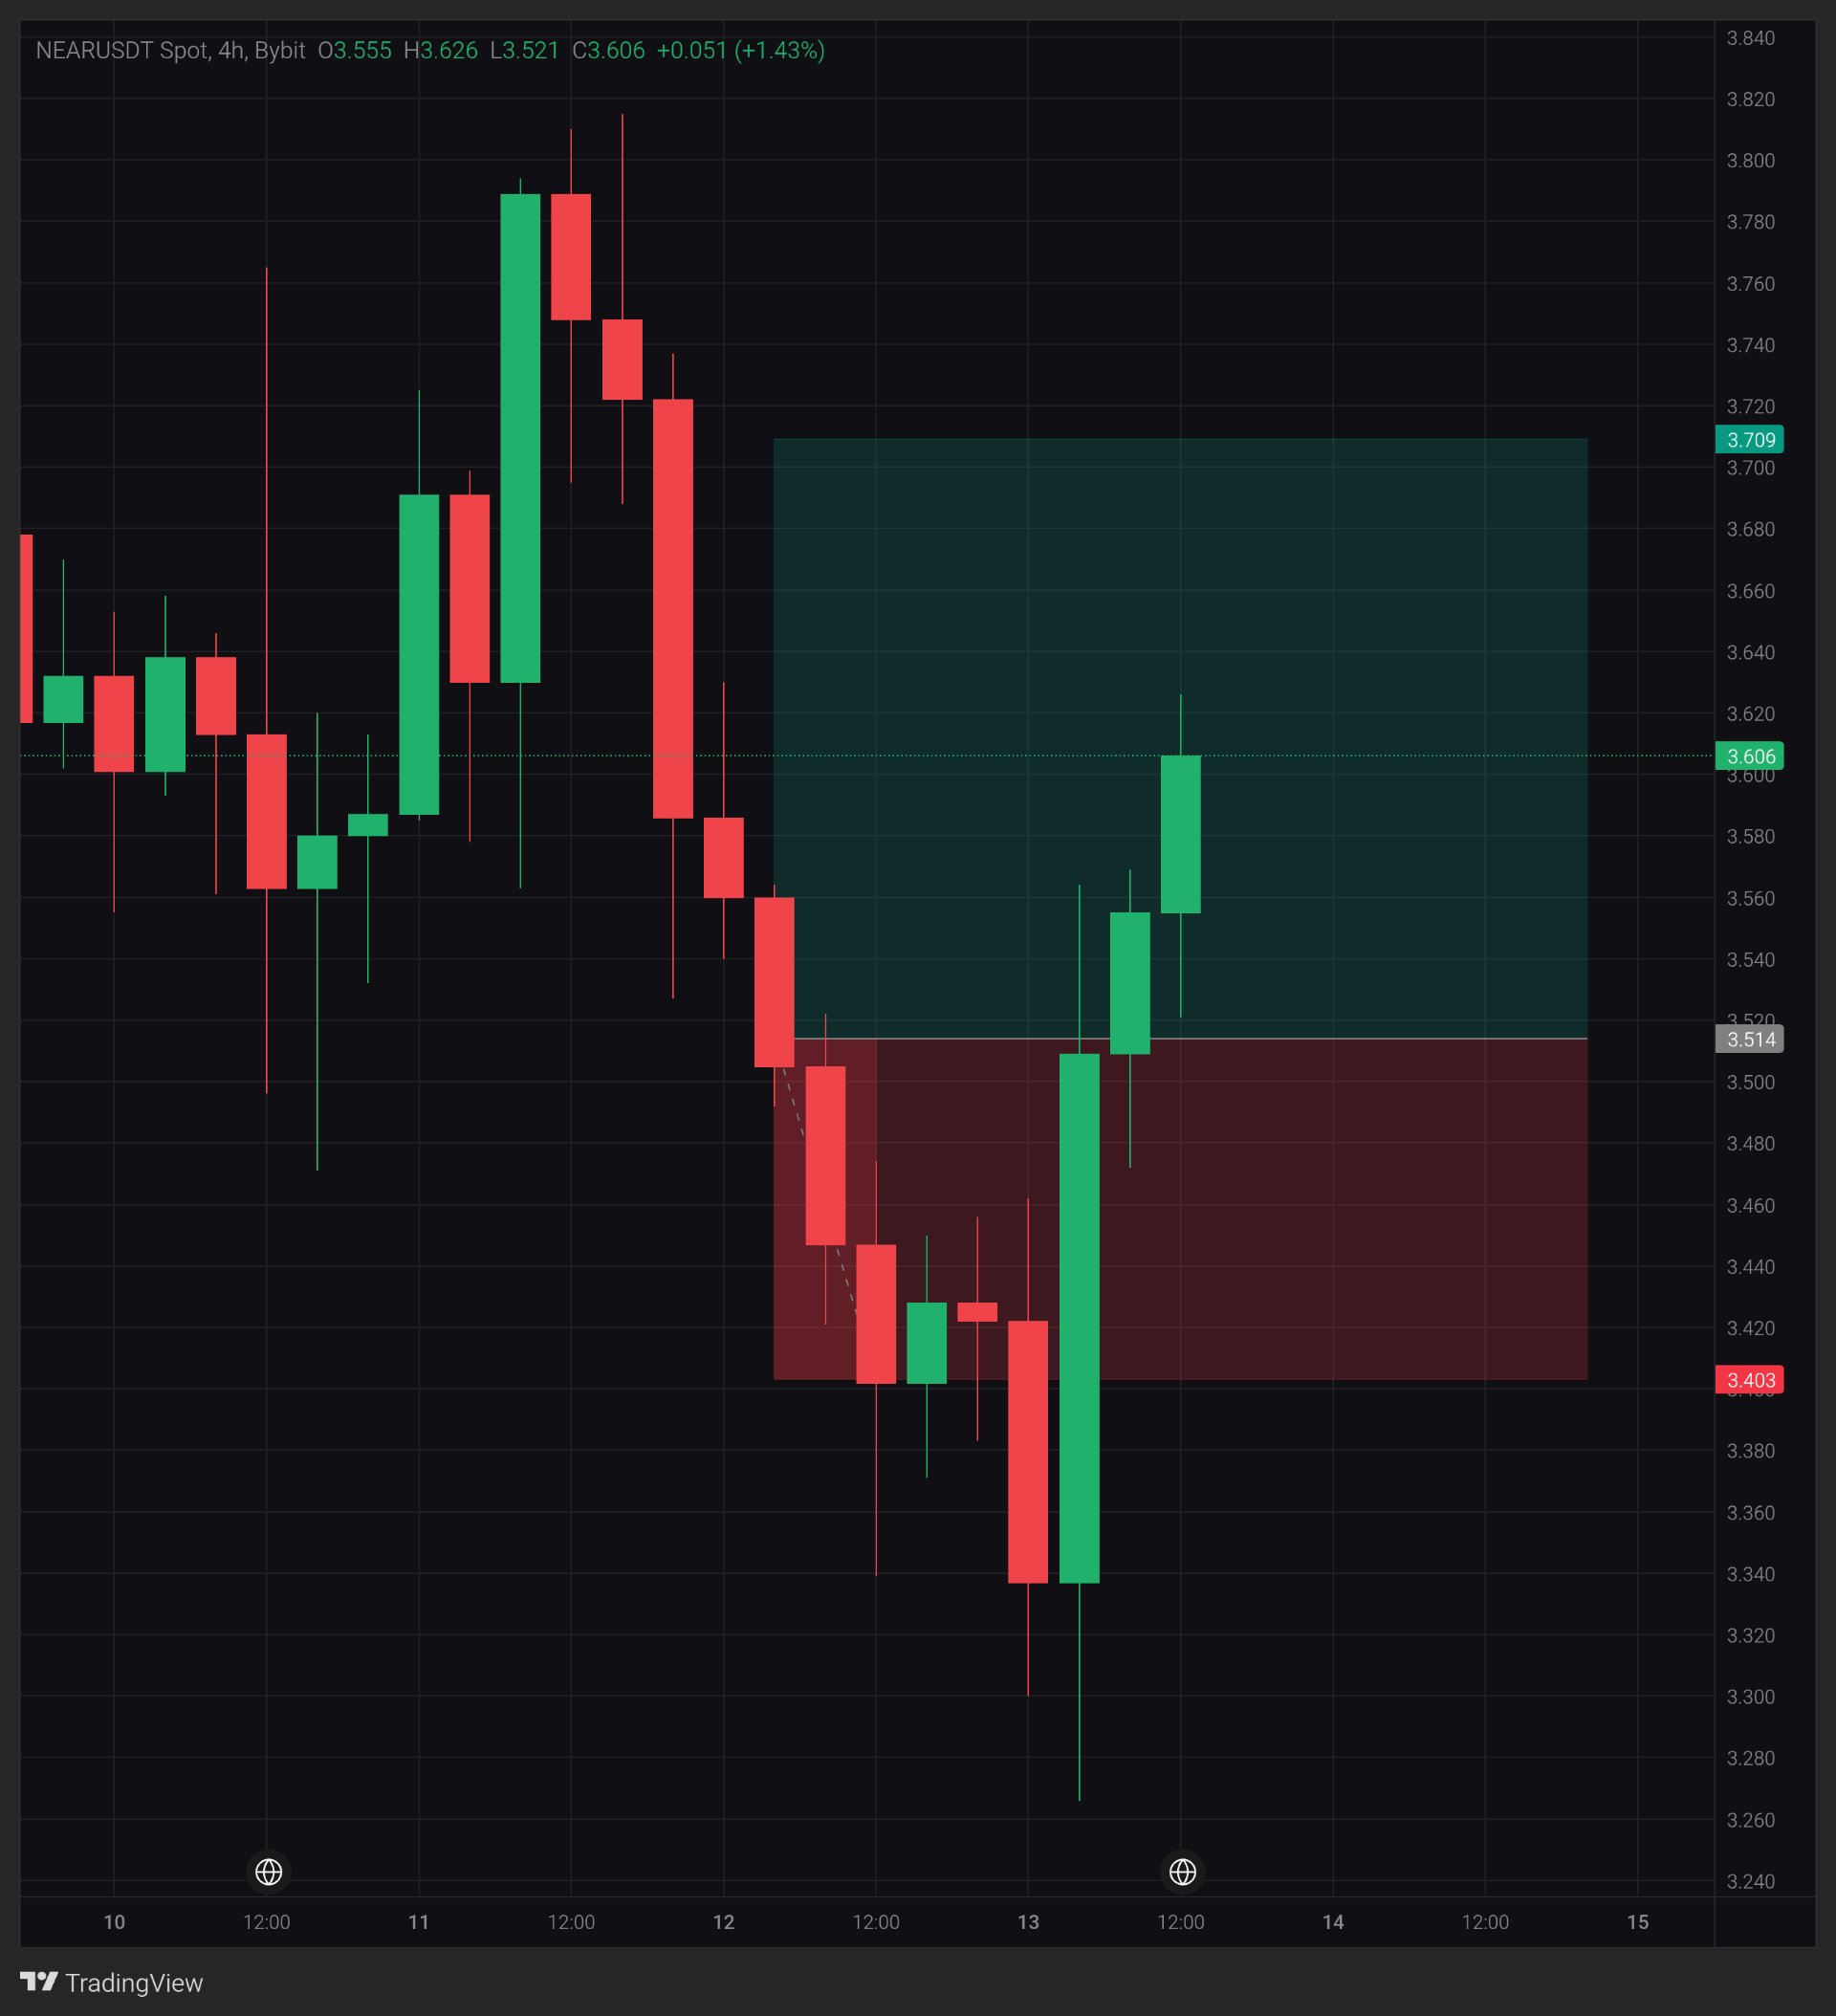
Our expectation was spot on The $NEARUSDT coin has broken through the resistance level, opening up a new path and higher price levels... #WSOT2026 #WSOTShowYourAITradeToEarn10USDT
NEAR: Price is back at the 3.514 breakdown
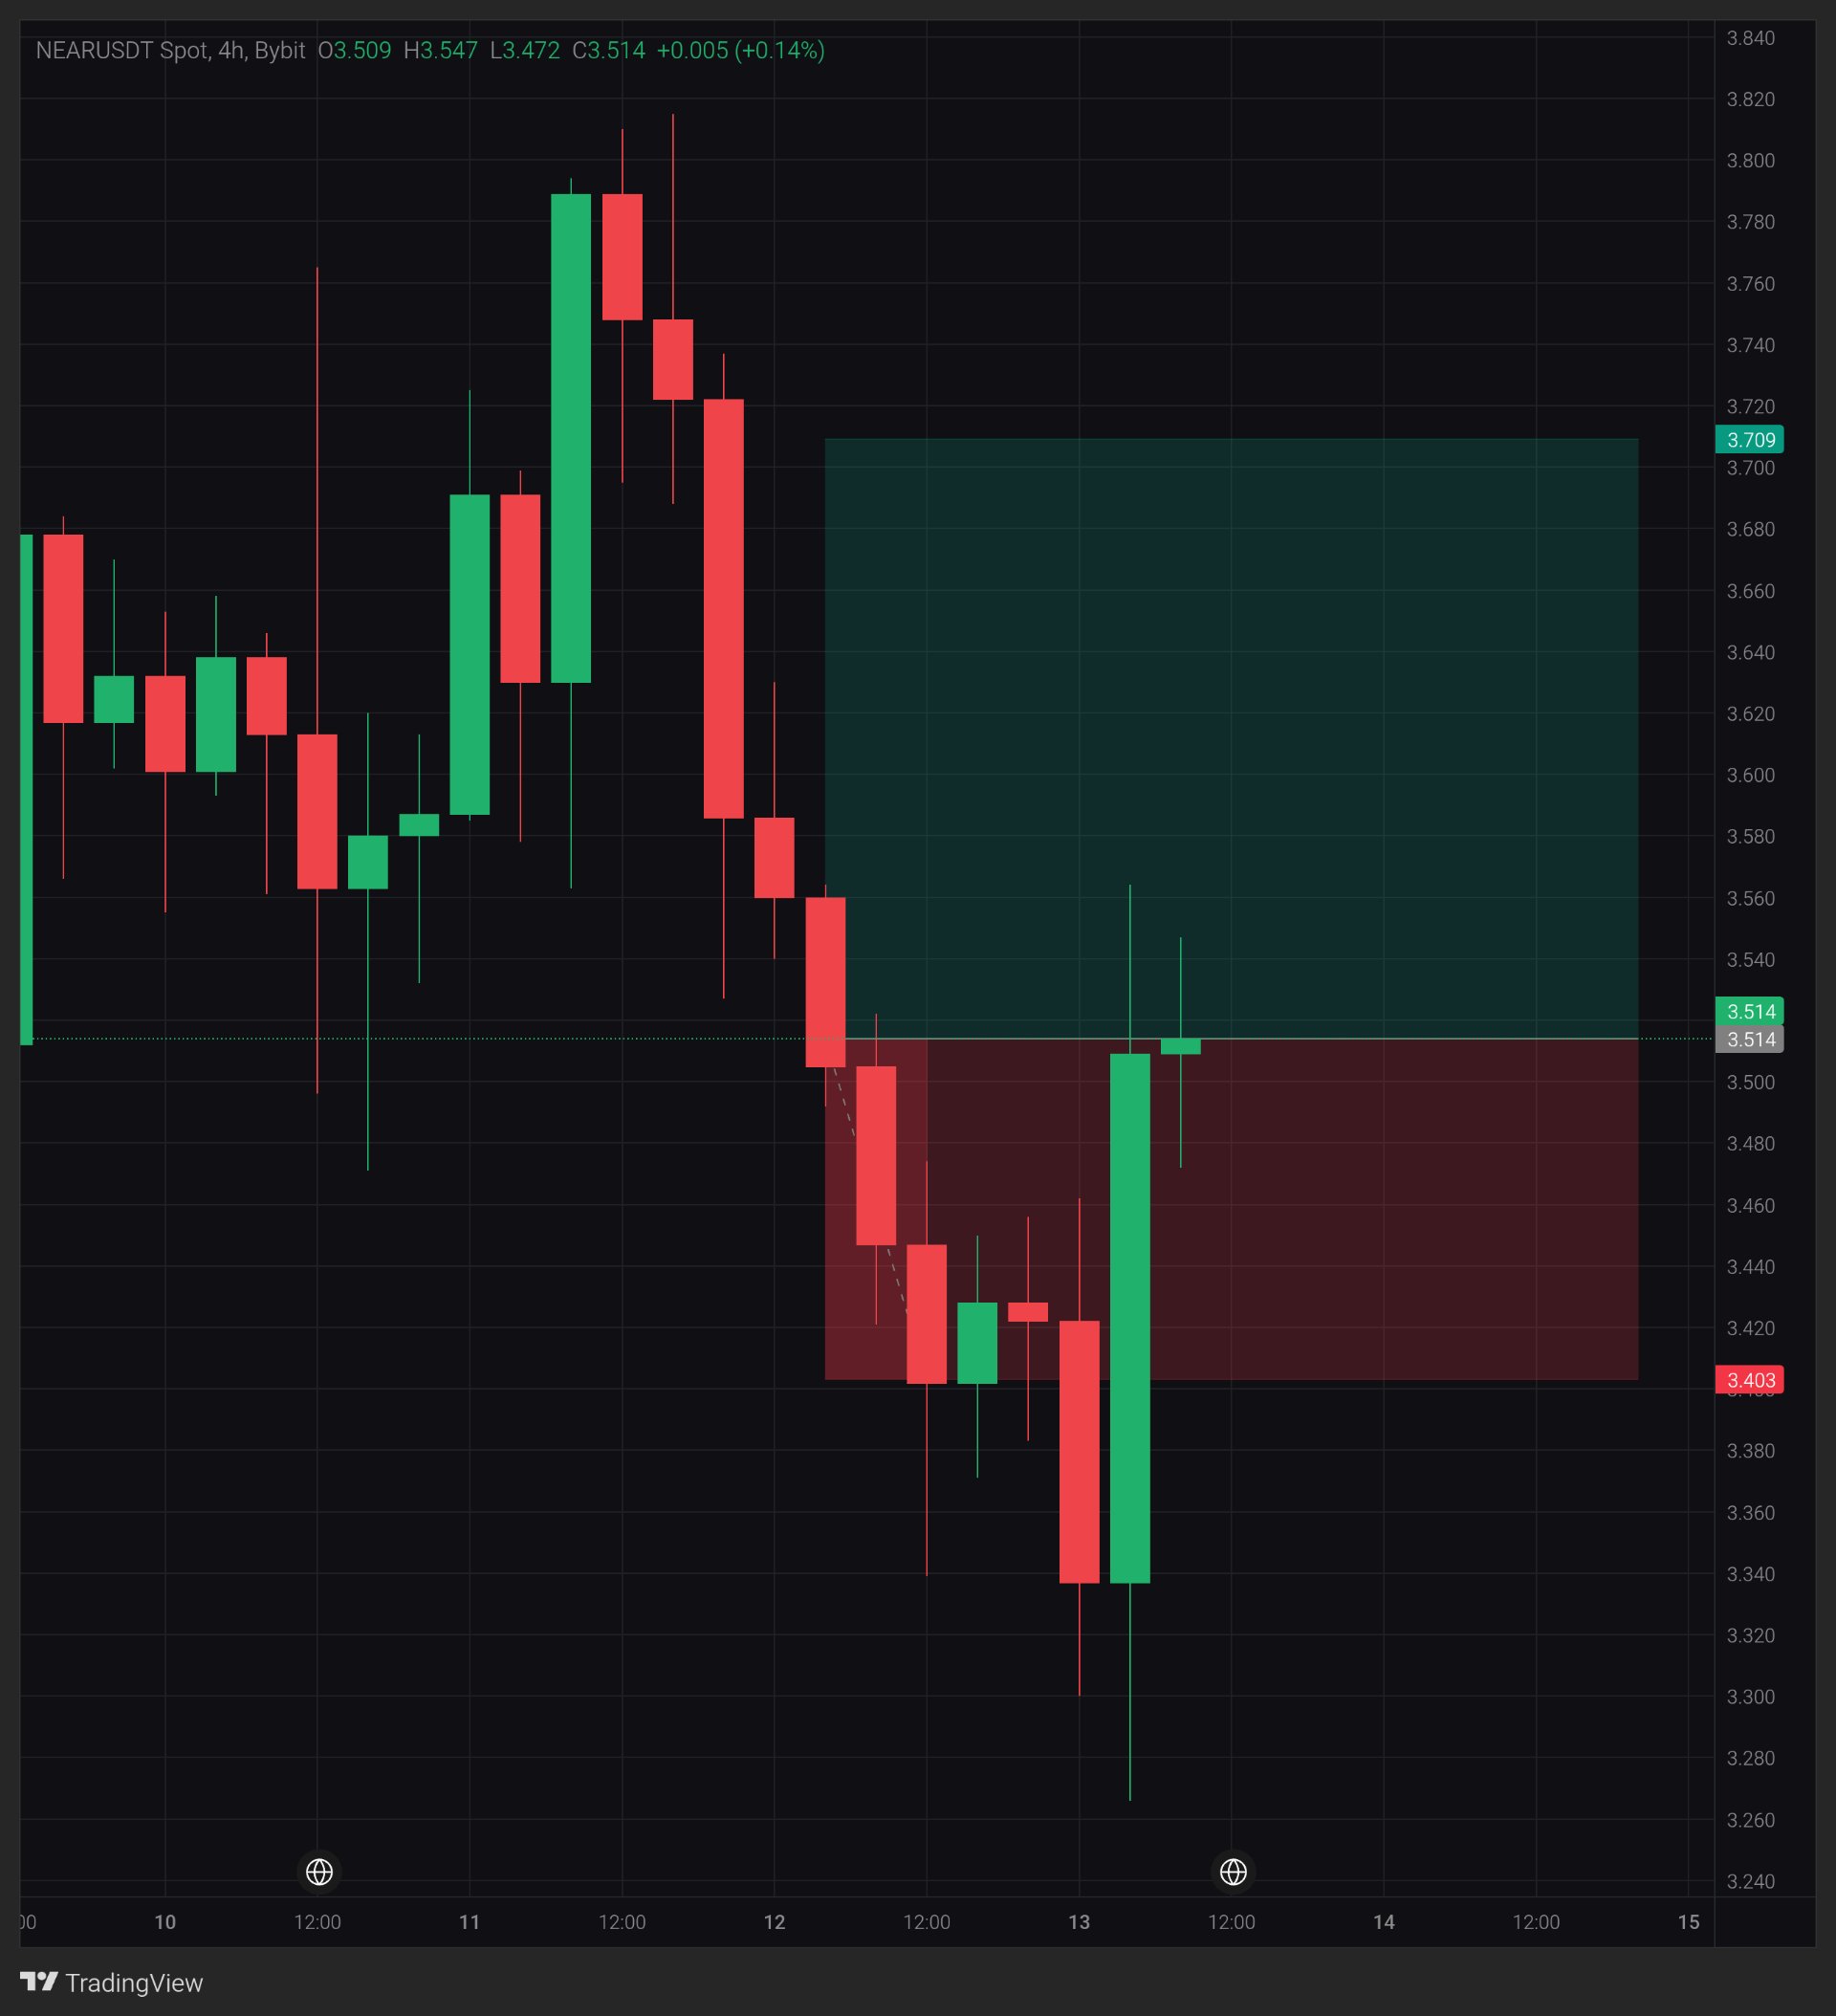
$NEARUSDT — 3.514 is the level price fell through on the way down. One green 4H candle just engulfed the last red one, at about twice its size. Price is back at that line, with a wick down to 3.265 behind it. Is this a real recovery, or just a visit to resistance? 4H chart, $NEARUSDT Spot on Bybit, price 3.514 (+0.14% on the current candle). Macro note Nov 11: after a hot US CPI print, markets leaned further toward a December Fed hike, and 2-year Treasury yields had their biggest jump since April 2025 (Bloomberg). Background only, not the reason for this move. What the chart shows NEAR fell from the 3.82 area to the 3.265 wick low, roughly 15%, then bounced about 9% to the 3.547 high. The big green candle left a long lower wick, so buyers reacted hard at the low. But the current candle is small: its body is 0.005 inside a 0.075 range, under 7% of the range, with wicks on both sides. That is indecision right at the old breakdown area. Volume is not shown on this chart, so this is price action only. Key levels Support: 3.472 (low of the current candle), then 3.403 (bottom of my box), then 3.340 and the 3.265 wick low. Resistance: 3.547 to 3.560 (wick highs), then about 3.585, then 3.709 (top of my box) and the 3.82 area. What would strengthen it Touching 3.560 again proves nothing. A 4H close above it would be the first real step. Holding 3.472 on a pullback would also help. Concern A 4H close below 3.472 would say the bounce is stalling at resistance, with 3.403 next. A bounce that only reaches the breakdown area is still a bounce, not a trend change. What changes my mind A 4H close below 3.403. The lesson A long lower wick shows buyers reacted. It does not show they can hold the next test. My view I'm watching how price behaves around 3.56 before treating this as more than a bounce into resistance. Closes matter more than wicks here. This is a scenario, not a prediction. A reading at posting time, not a guarantee. Which matters more to you here, a close above 3.560 or a hold above 3.472? Not financial advice. Always manage your risk. 📊 #ByXIMPACT
NEAR: Price is back at the 3.514 breakdown
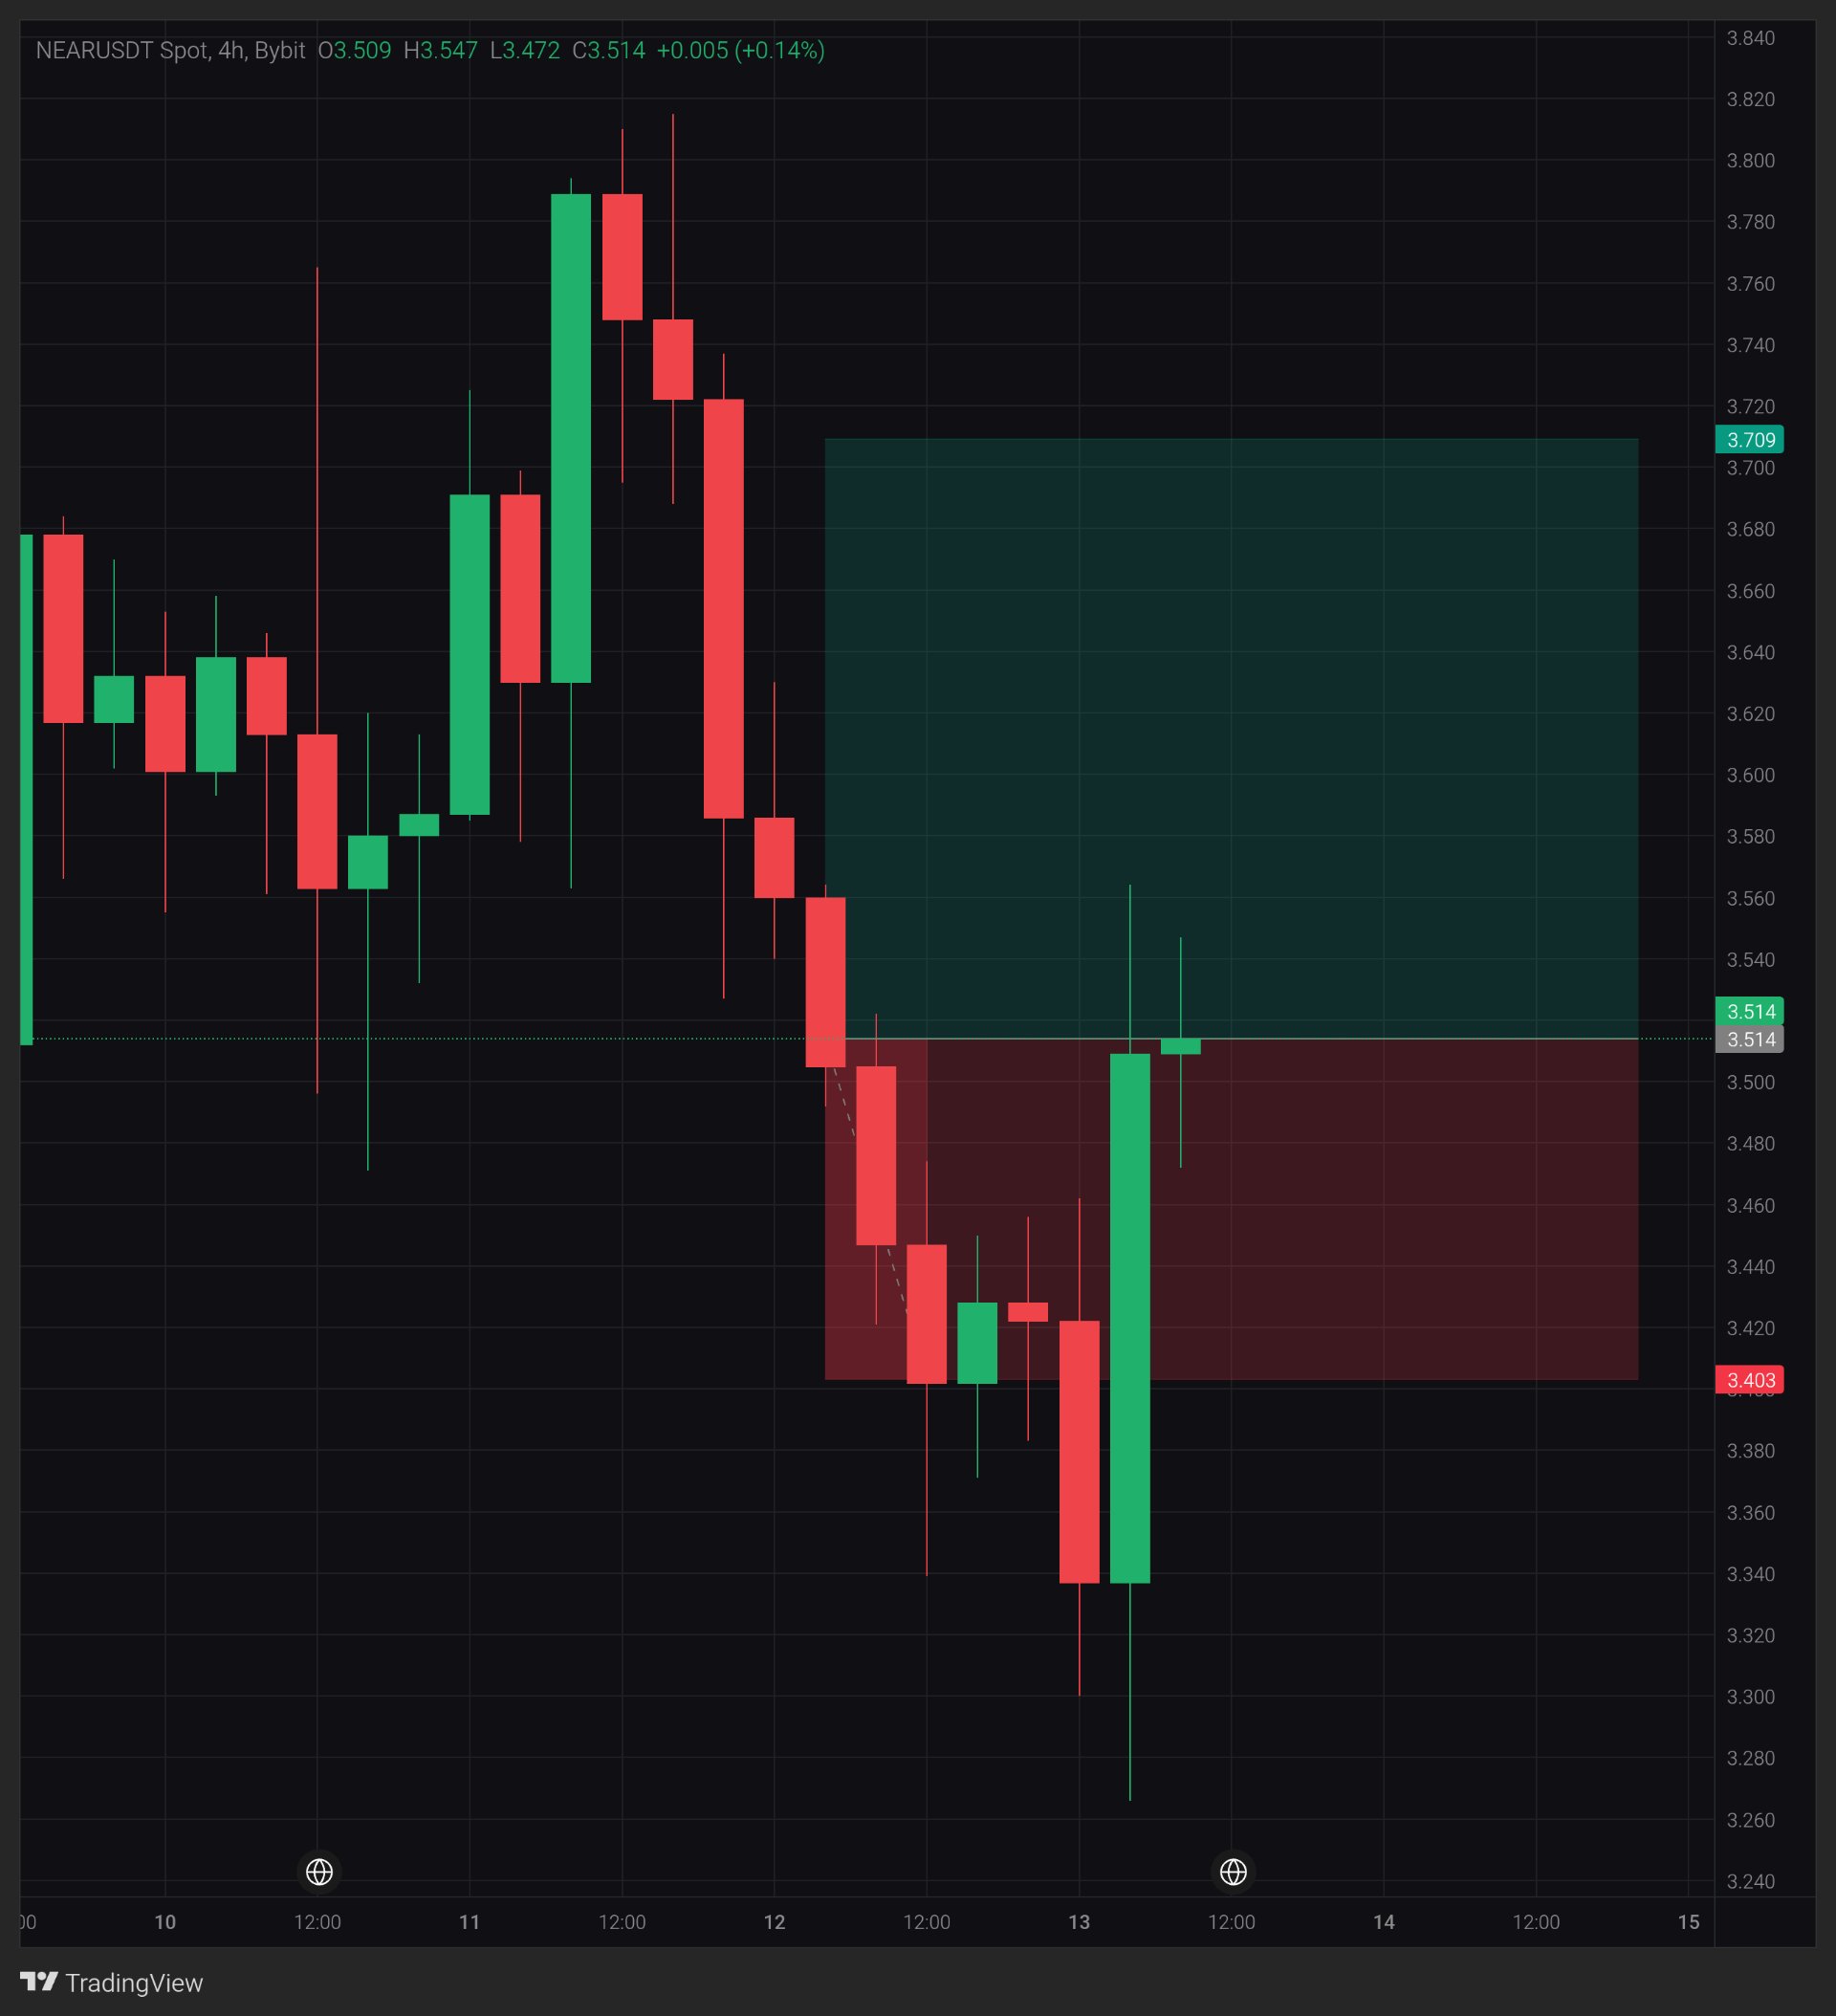
$NEARUSDT — 3.514 is the level price fell through on the way down. One green 4H candle just engulfed the last red one, at about twice its size. Price is back at that line, with a wick down to 3.265 behind it. Is this a real recovery, or just a visit to resistance? 4H chart, $NEARUSDT Spot on Bybit, price 3.514 (+0.14% on the current candle). Macro note Nov 11: after a hot US CPI print, markets leaned further toward a December Fed hike, and 2-year Treasury yields had their biggest jump since April 2025 (Bloomberg). Background only, not the reason for this move. What the chart shows NEAR fell from the 3.82 area to the 3.265 wick low, roughly 15%, then bounced about 9% to the 3.547 high. The big green candle left a long lower wick, so buyers reacted hard at the low. But the current candle is small: its body is 0.005 inside a 0.075 range, under 7% of the range, with wicks on both sides. That is indecision right at the old breakdown area. Volume is not shown on this chart, so this is price action only. Key levels Support: 3.472 (low of the current candle), then 3.403 (bottom of my box), then 3.340 and the 3.265 wick low. Resistance: 3.547 to 3.560 (wick highs), then about 3.585, then 3.709 (top of my box) and the 3.82 area. What would strengthen it Touching 3.560 again proves nothing. A 4H close above it would be the first real step. Holding 3.472 on a pullback would also help. Concern A 4H close below 3.472 would say the bounce is stalling at resistance, with 3.403 next. A bounce that only reaches the breakdown area is still a bounce, not a trend change. What changes my mind A 4H close below 3.403. The lesson A long lower wick shows buyers reacted. It does not show they can hold the next test. My view I'm watching how price behaves around 3.56 before treating this as more than a bounce into resistance. Closes matter more than wicks here. This is a scenario, not a prediction. A reading at posting time, not a guarantee. Which matters more to you here, a close above 3.560 or a hold above 3.472? Not financial advice. Always manage your risk. 📊 #ByXIMPACT
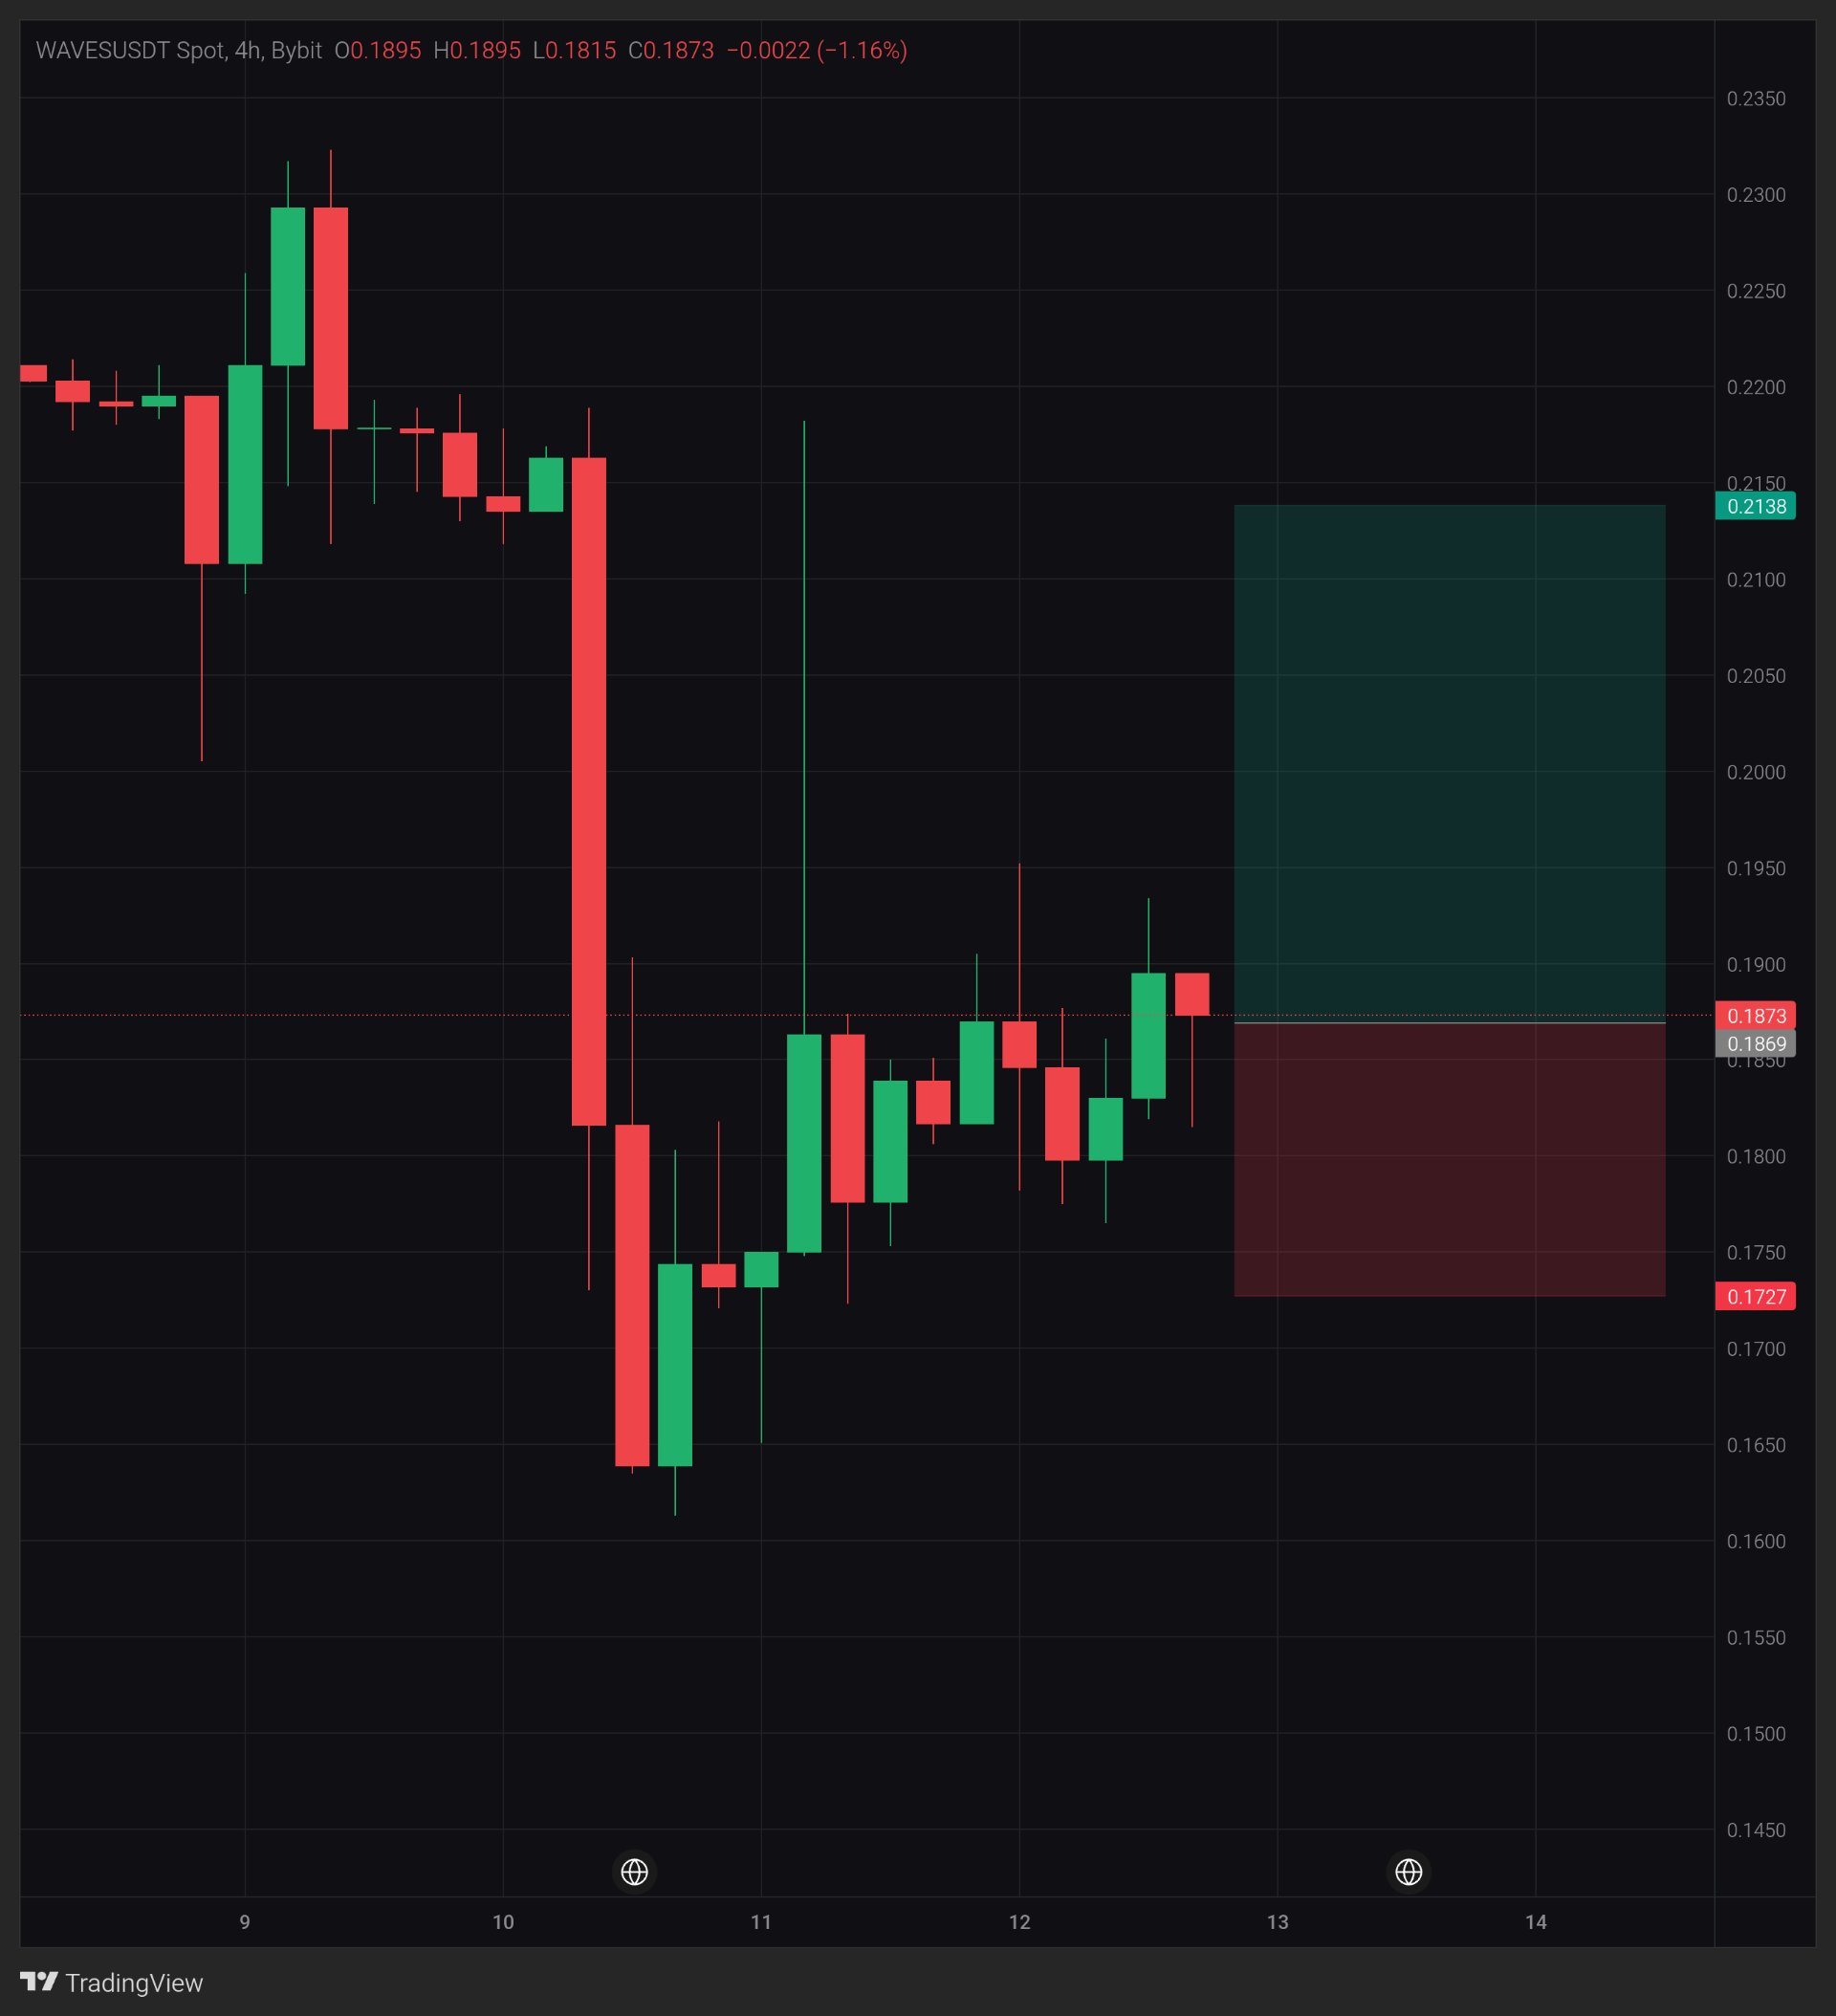
WAVES: Can 4H close above 0.1895?
$WAVESUSDT — 0.1895 stopped the last two candle bodies. The wicks went higher, but the closes did not follow. That is a 20% bounce off the low, now stuck under one line. Is this a base forming, or a pause before another drop? 4H chart, $WAVESUSDT Spot on Bybit, price 0.1873 (-1.16% on the current candle). Macro note Nov 10: US October CPI rose 0.4% m/m, above forecasts, and CME FedWatch showed roughly 89% odds of a 25 bp Fed hike in December (BLS; CME FedWatch via AFP). Background only, not the reason for this move. What the chart shows One big red 4H candle took roughly 16% off, down to the 0.1615 area. Since then price has bounced about 20% to 0.1935 and slipped back. The detail I care about is the huge wick to about 0.2180, roughly 16% above where that candle closed, fully rejected. It tells me sellers were waiting up there. There are no indicators or volume on this view, so this is price action only. Key levels Support: 0.1815 (low of the current candle), then about 0.1775, then 0.1727 (bottom of my box). Resistance: 0.1895, then 0.1935 to 0.1950 (wick highs), then 0.2138 (top of my box). What would strengthen it Touching 0.1895 again proves nothing. A 4H close above it would be the first real step, and a close above 0.1950 would clear the recent wick highs. Concern A 4H close below 0.1815 would say the bounce is losing ground, with 0.1775 and 0.1727 next. The 0.2180 wick already showed how sellers reacted when price ran higher. What changes my mind A 4H close below 0.1727. The lesson A wick shows where price went. A close shows where it was accepted. The wick to 0.2180 was not accepted. My view I'm watching for a close above 0.1895 before treating this as more than a bounce under resistance. This is a scenario, not a prediction. A reading at posting time, not a guarantee. Which do you trust more here, a wick above 0.1935 or a close above 0.1895? Not financial advice. Always manage your risk. 📊 #ByXIMPACT #WSOT2026

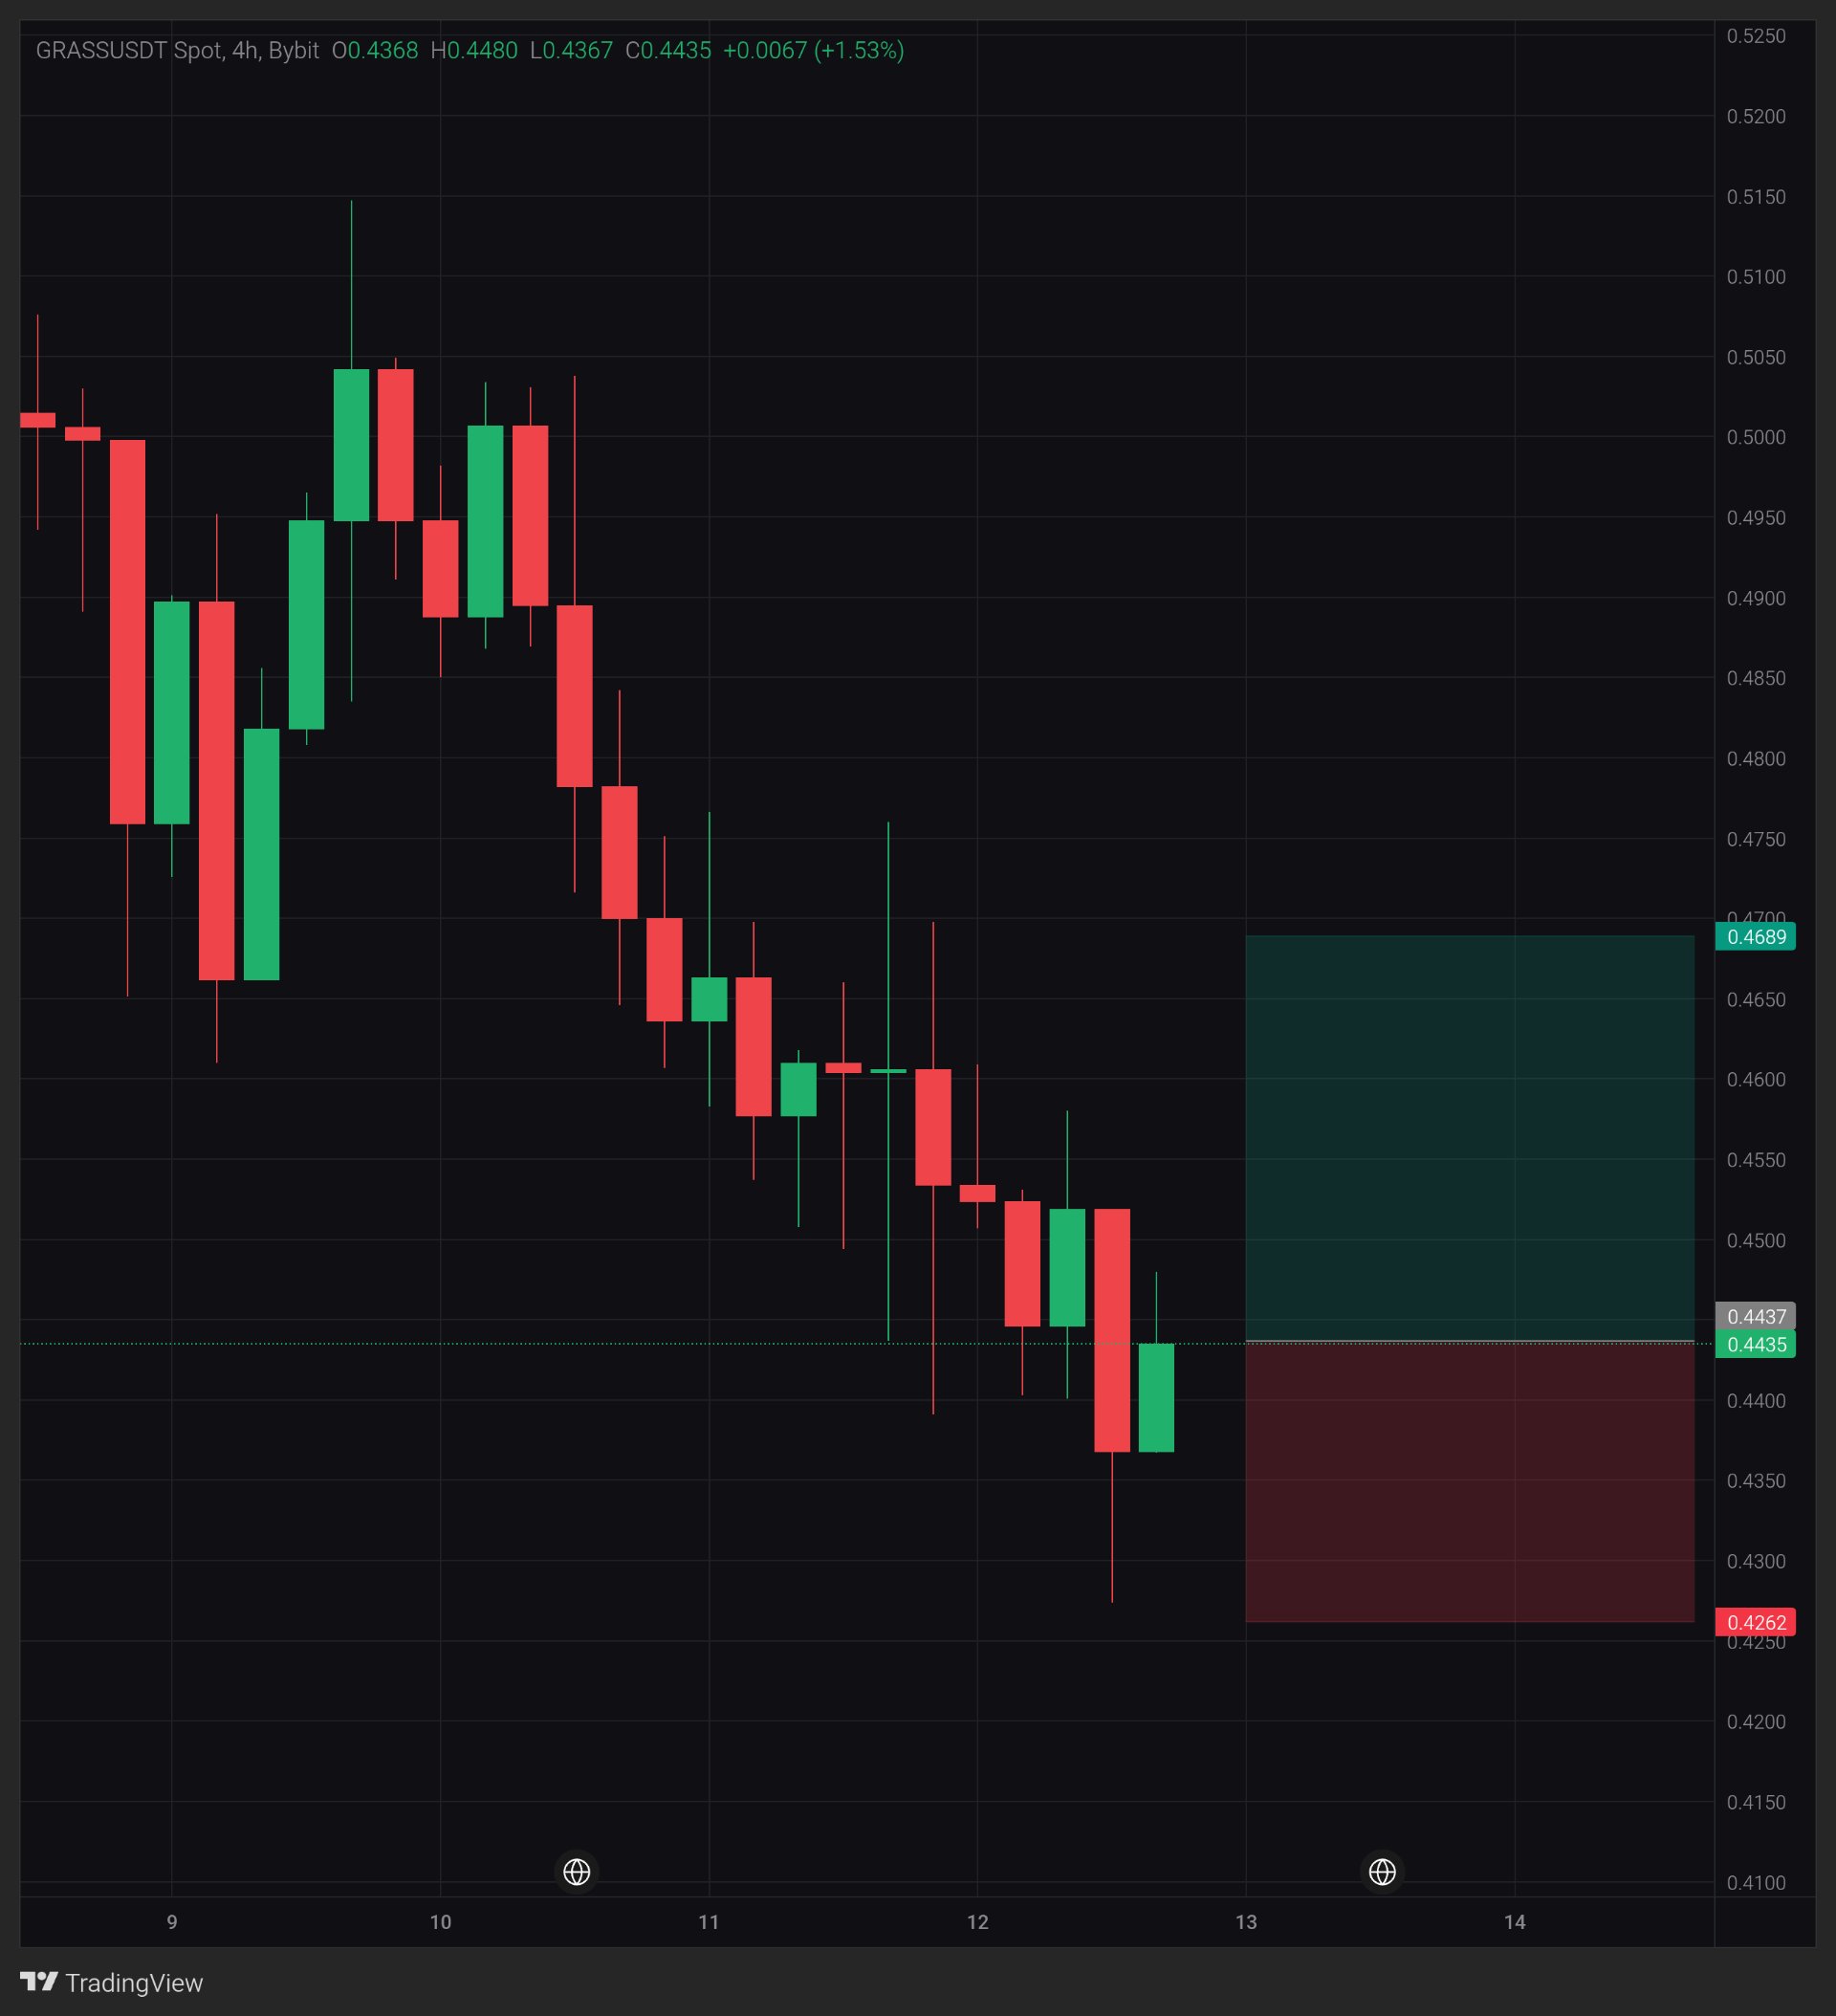
GRASS: Can buyers reverse the 4H downtrend?
$GRASSUSDT — GRASS is showing a small recovery around 0.4435 after another period of selling pressure. What's interesting is that price has fallen from the 0.5000 region, but the latest candle is attempting to recover after testing the 0.4367 area. The short-term structure remains bearish, and one green candle is not enough to confirm a reversal. Is this the first sign of a recovery, or just a temporary bounce? Timeframe: 4H | Pair: $GRASSUSDT Spot, Bybit | Price: 0.4435 | Latest candle: O 0.4368 / H 0.4480 / L 0.4367 / C 0.4435 (+1.53%). Candle close status not confirmed. Macro note November 12, 2026 — Reuters reported that Cleveland Fed President Beth Hammack supports gradual, smaller interest-rate increases to bring inflation back toward the Fed's 2% target. This is broader market background, not the reason for GRASS's price movement. What the chart shows GRASS has been moving through a clear short-term decline, falling from around 0.5050 toward the 0.4300 region. The latest candle has recovered 0.0067 from its open, but its high at 0.4480 shows that price is still facing nearby resistance. The important detail is whether buyers can turn this bounce into a sequence of higher lows. Key levels Support: 0.4367, then approximately 0.4270. Resistance: 0.4480, then 0.4550–0.4600. What would strengthen it A clean break above 0.4480 followed by a confirmed 4H close above that level would be the first positive signal. A successful retest and a higher low would provide additional confirmation. Concern The broader 4H structure still shows lower highs and lower lows. If 0.4367 fails and price closes below it, the current recovery attempt becomes much weaker. What changes my mind A 4H close below 0.4367 would make me more cautious about GRASS's short-term direction. The lesson In a downtrend, a green candle can be only a temporary bounce. A confirmed higher low and a break of the previous lower high provide stronger evidence of a reversal. My view I'm watching the 0.4367–0.4480 range closely. GRASS is showing its first signs of short-term recovery, but the bigger structure still needs confirmation. This is a scenario, not a prediction. A reading at posting time, not a guarantee. Can GRASS reclaim 0.4480 and challenge the current downtrend? Not financial advice. Always manage your risk. 📊 #WSOT2026 #AnthropicIPOTestsTheAIBoom #USInflationRunsHotAndRateHikeBetsRise #BitcoinHitsTwoMonthLowAfterUSMidterms
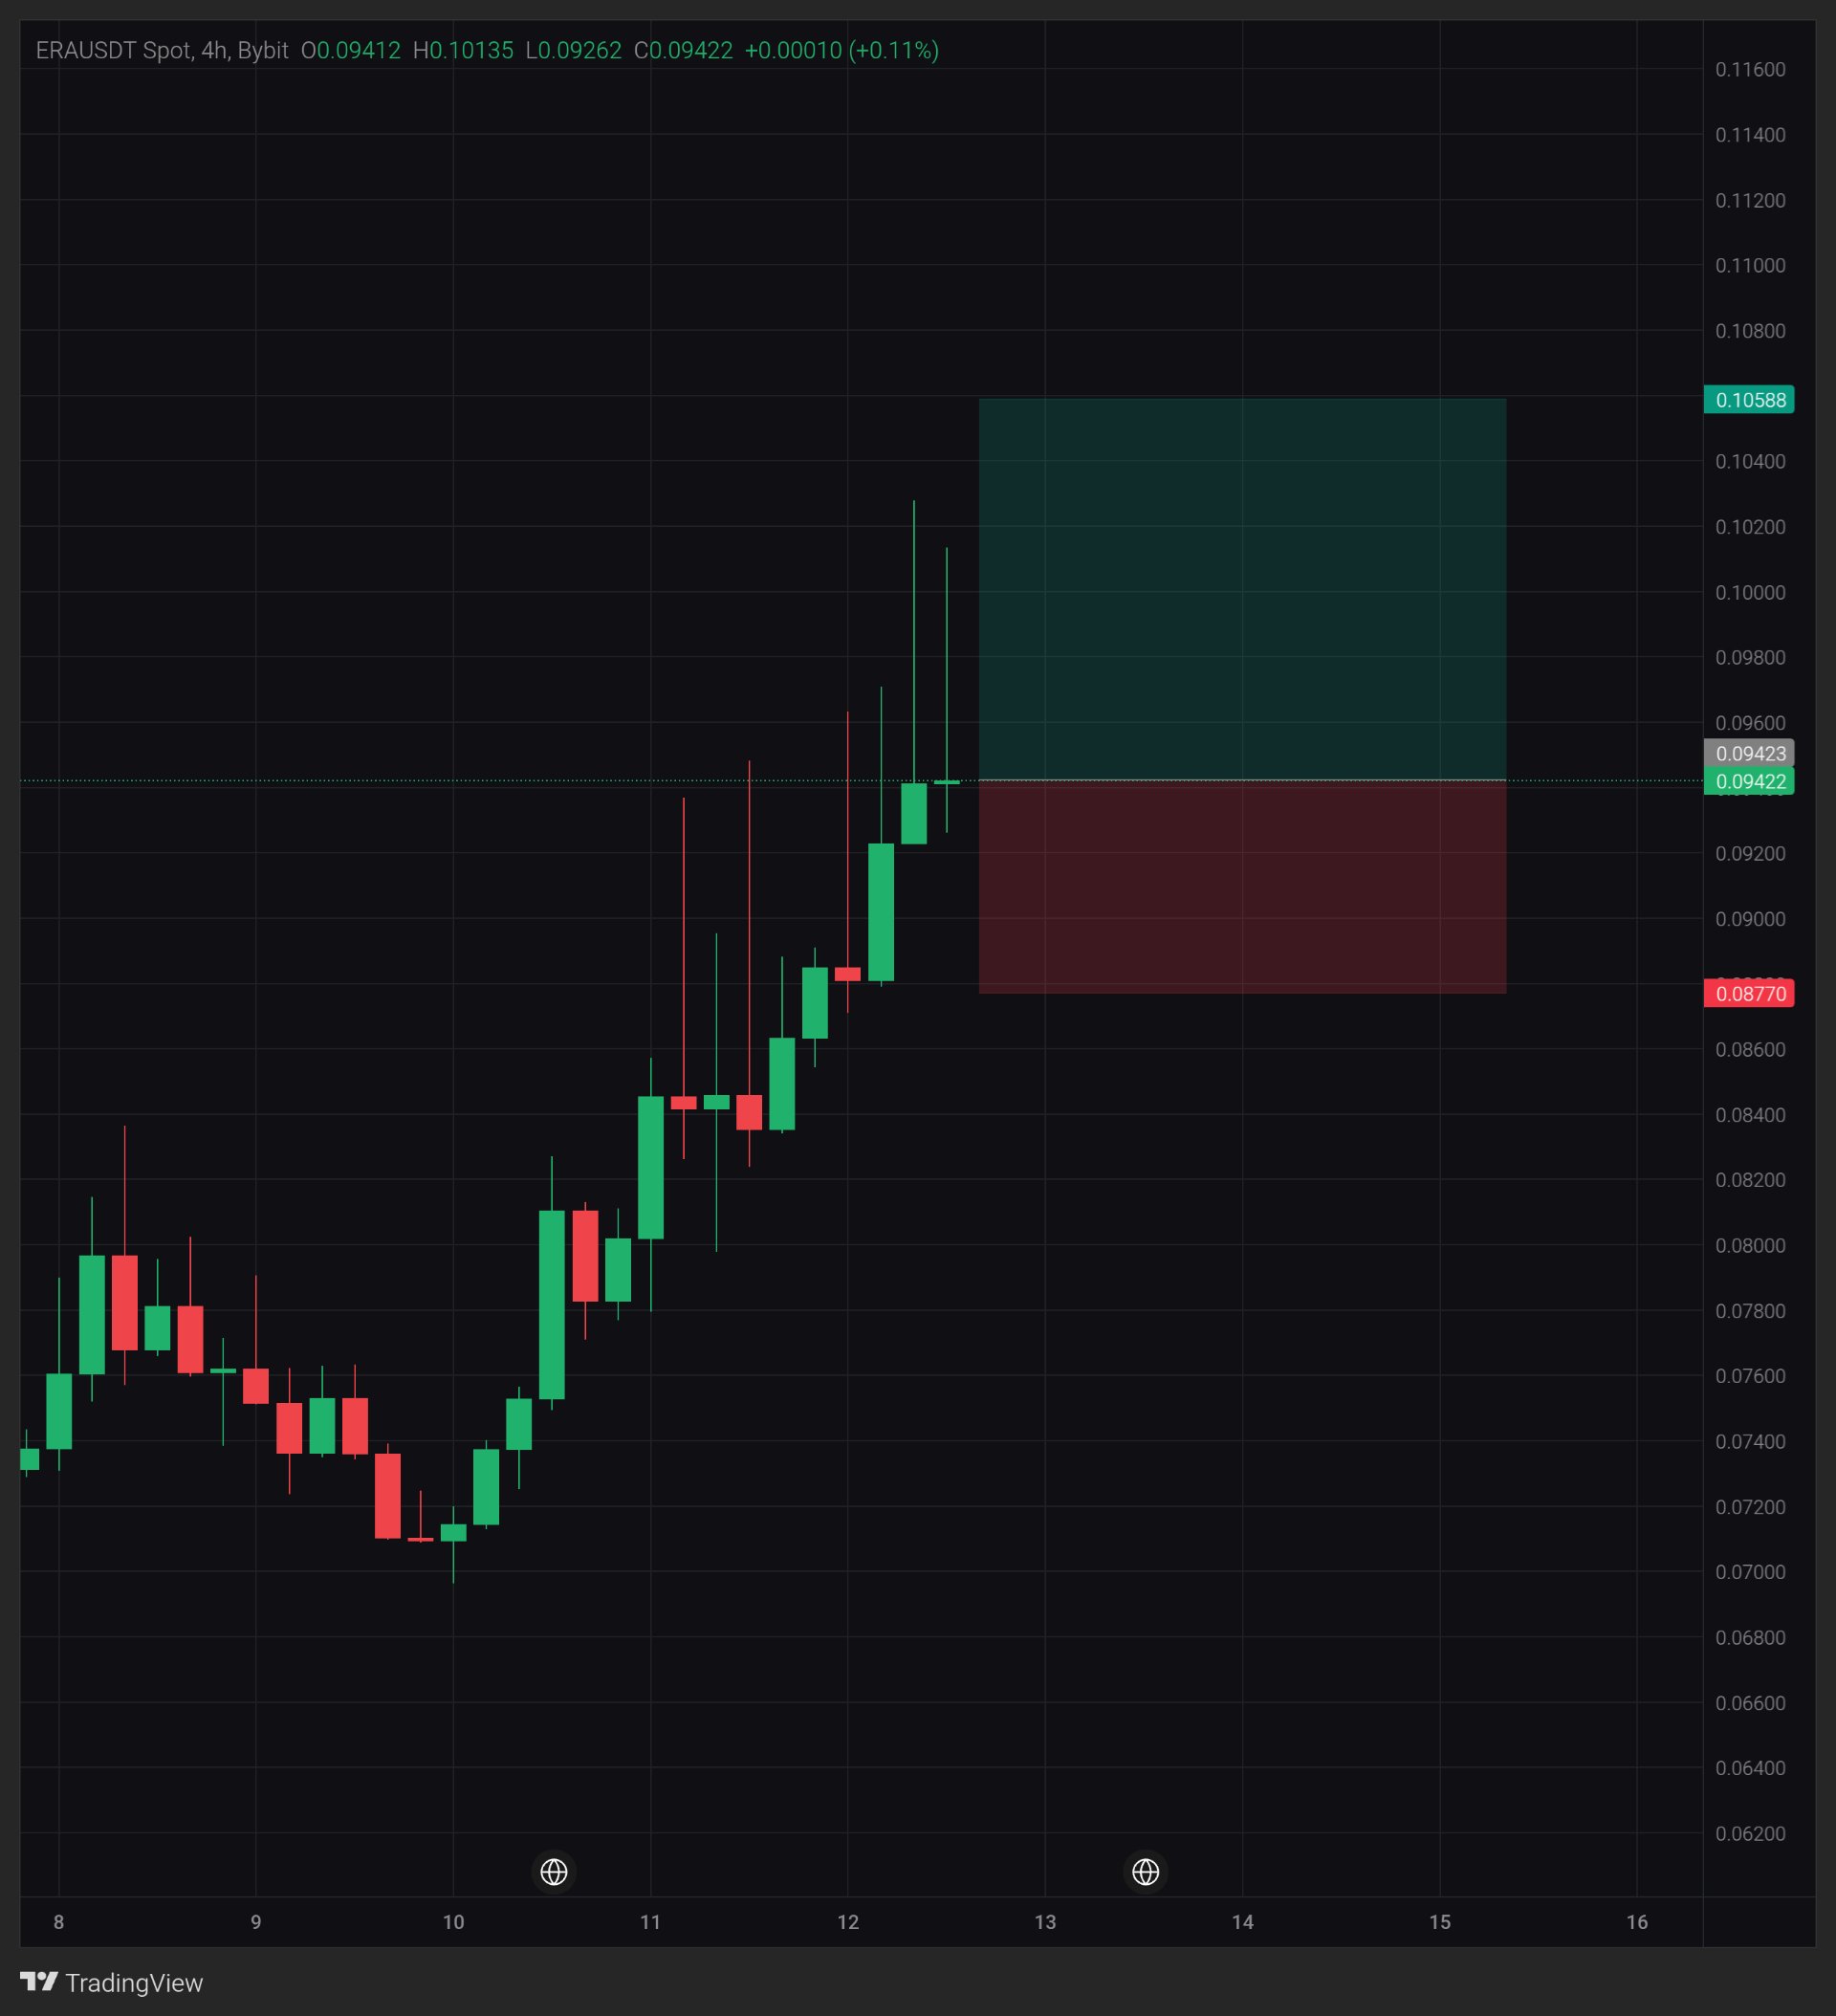
ERA: wicks near 0.10, will 4H close above?
$ERAUSDT — price is at 0.0942, with 0.10 rejected twice by long wicks. The coin is up about 35% since the Nov 10 low, yet the latest candle's upper wick is about 80% of its range. What is still unresolved is whether buyers can close above that wick zone or sellers keep selling into it. Is this a pause before another push, or buyers running out of room? Timeframe: 4H Pair: $ERAUSDT Spot, Bybit Price: 0.09422 Candle: O 0.09412 / H 0.10135 / L 0.09262 / C 0.09422 (+0.11%) Candle close not confirmed. Macro note Nov 12, 2026: the US 10-year Treasury yield is hovering near 5% as big banks raise their Fed rate hike calls after hot October inflation data (TipRanks). Background only, not the reason for the move. What the chart shows ERA climbed from about 0.0700 on Nov 10 to 0.0942, roughly 35%. One detail I noticed: since Nov 11, almost every 4H candle has an upper wick far above its body, reaching about 0.0948, 0.0963, 0.0971, and then 0.1028 and 0.1014. The bodies keep rising, but each push higher has been sold. These wicks show sellers were active at those prices. They do not prove a top, and I can't judge their size without volume. Key levels Support: 0.0900, then 0.0840. Resistance: 0.0970, then 0.1020. Levels are read by eye, so they are approximate. What would strengthen it Touching 0.10 again proves little, since the wicks already did that twice. A 4H close above 0.1020, then a retest that holds as support, would be a better sign. Shorter upper wicks on the next candles would also help. Concern A rise of about 35% in this short time, with long wicks at the top, can unwind fast. A 4H close back under 0.0900 would give up the base of the latest push. What changes my mind A 4H close above 0.1020. The lesson A wick shows where price was rejected, and a close shows who won the candle. My view I'm watching the 0.10 area. Until a 4H candle closes above it, I treat the wicks as a warning, not as a trend change. This is a scenario, not a prediction. A reading at posting time, not a guarantee. Do you give more weight to the candle bodies or the wicks here? Not financial advice. Always manage your risk. 📊 #BitcoinHitsTwoMonthLowAfterUSMidterms

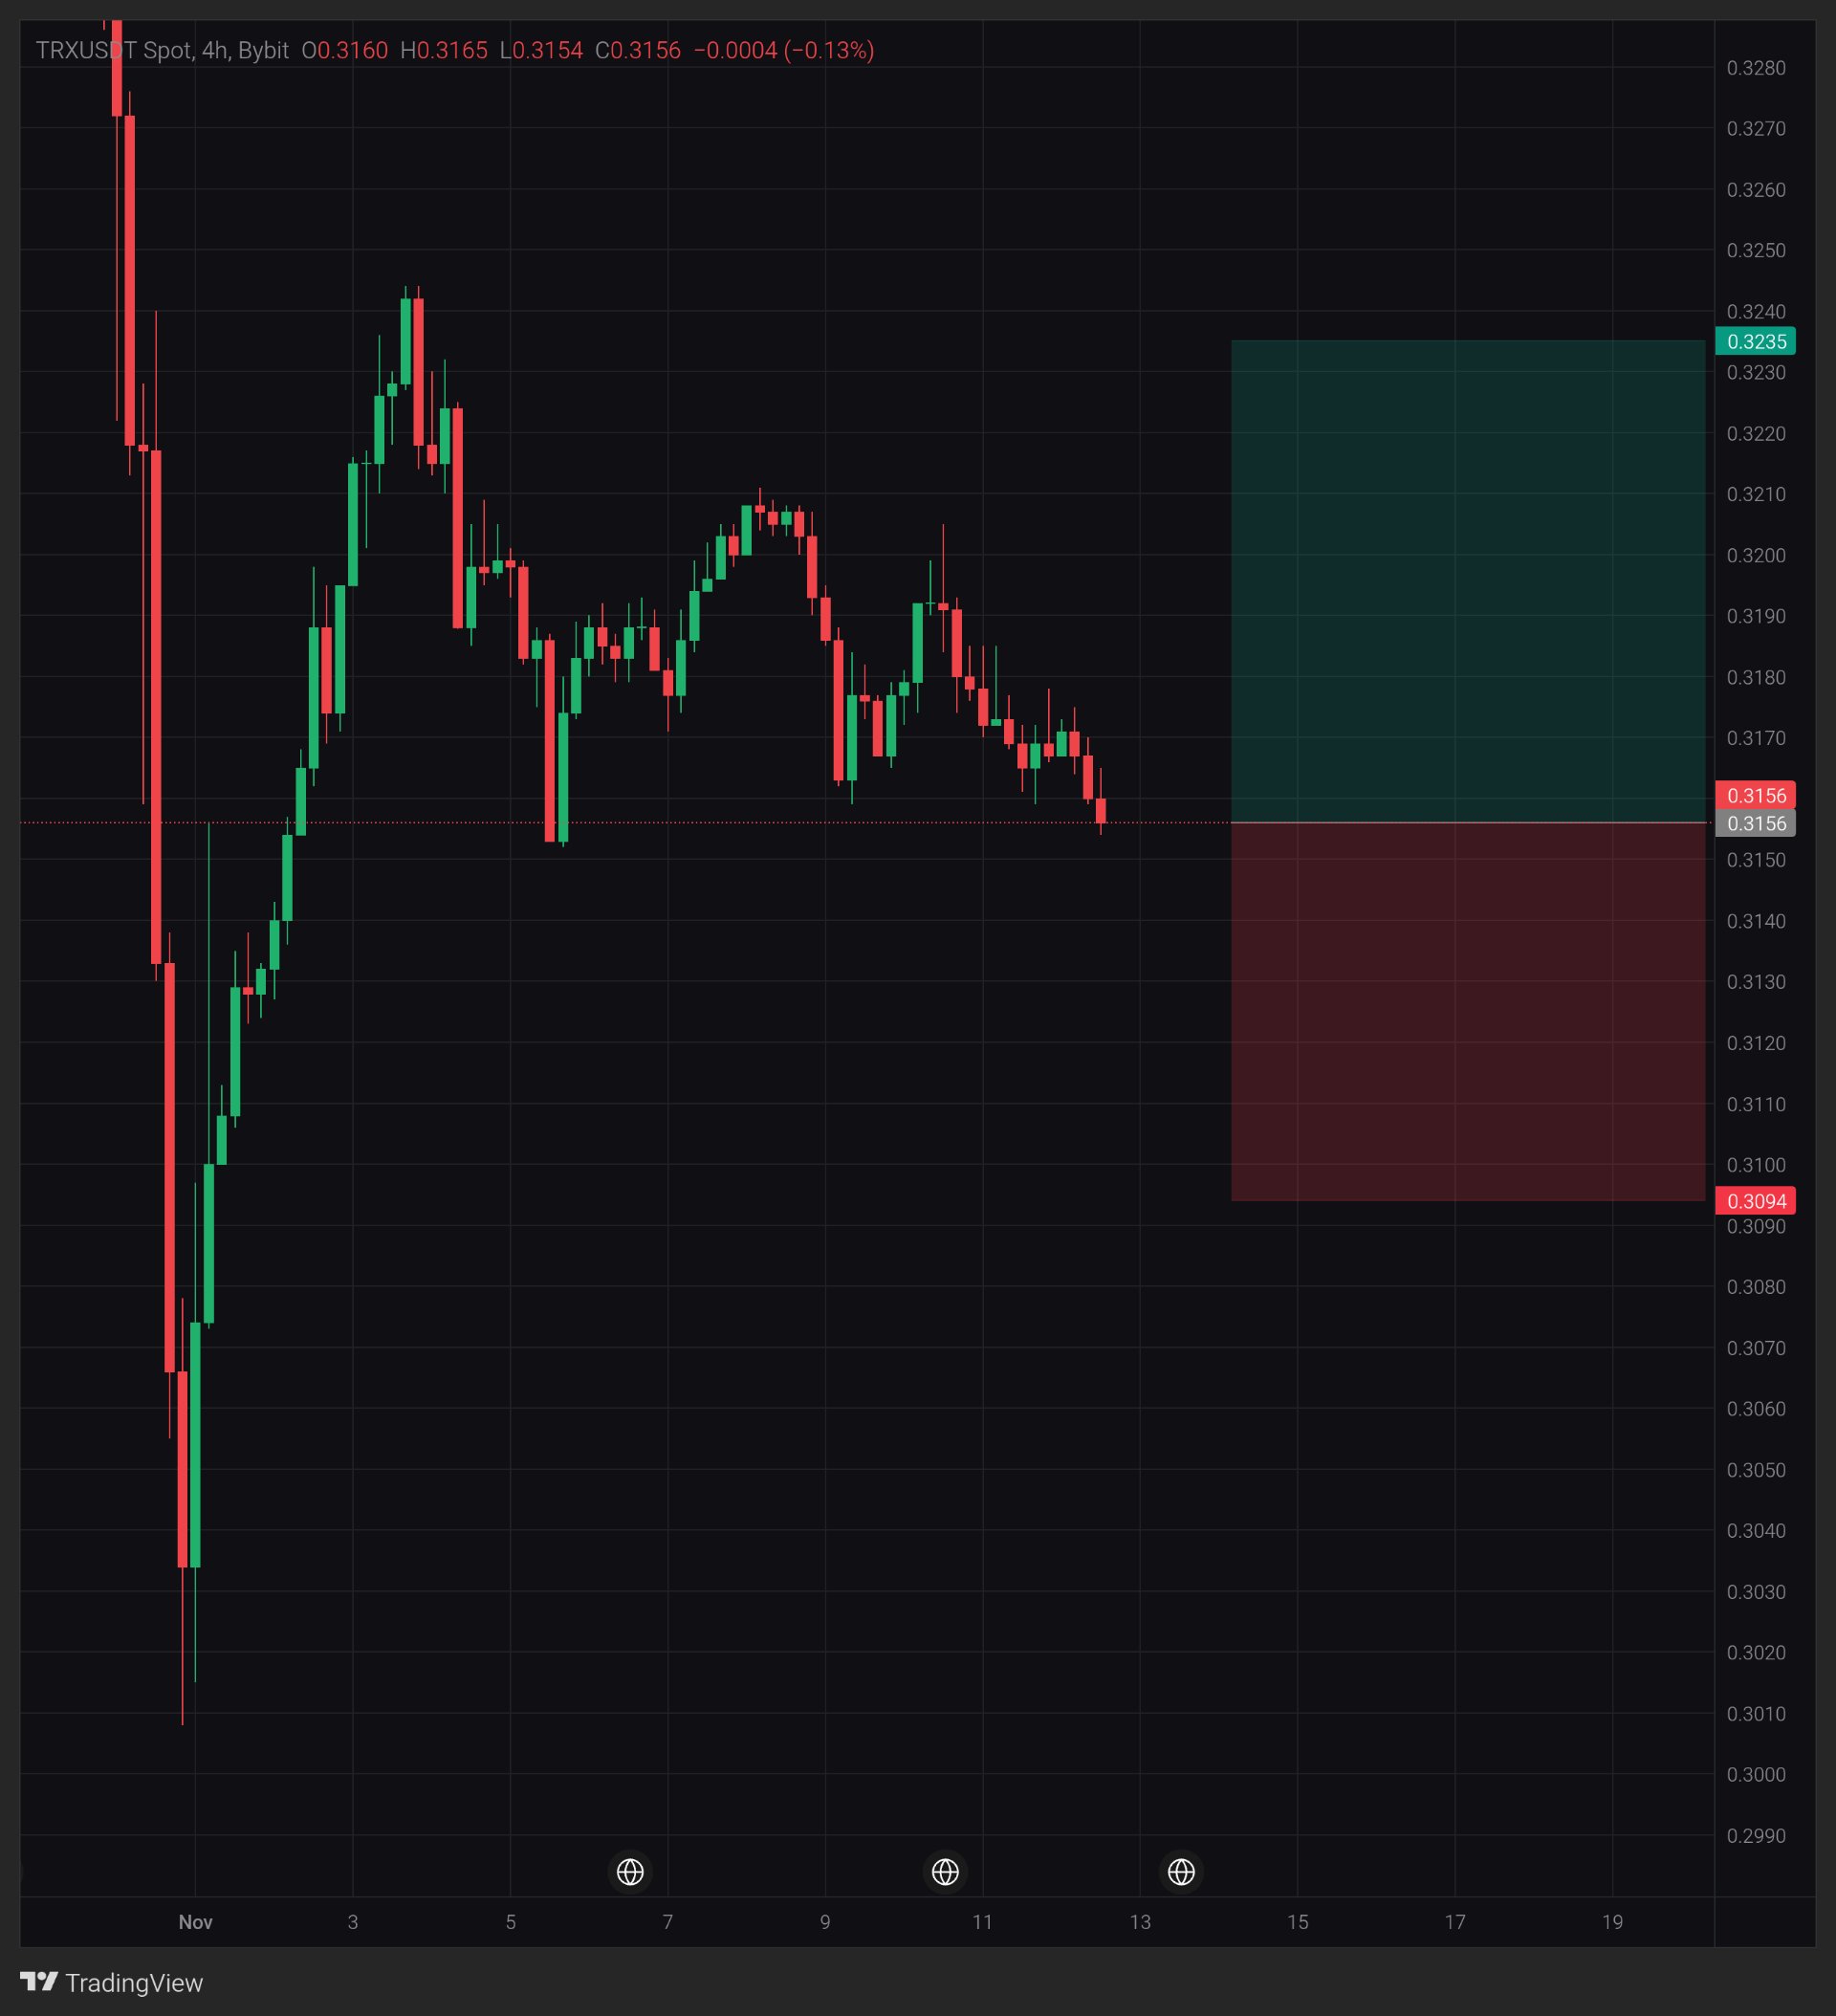
TRX: 0.3155 tested again, will 4H hold?
$TRXUSDT — price sits at 0.3156, right on the floor that has held since Nov 5. The highs keep falling (0.3243, then 0.3210, then about 0.3205), but the lows barely move. What is still unresolved is whether buyers keep defending this floor or a 4H close breaks it. When a range gets this tight, which side moves first? Timeframe: 4H Pair: $TRXUSDT Spot, Bybit Price: 0.3156 Candle: O 0.3160 / H 0.3165 / L 0.3154 / C 0.3156 (-0.13%) Candle close not confirmed. Macro note Nov 10, 2026: US October CPI rose 0.4%, more than expected, and Treasury yields jumped after the release (CNBC). Background only, not the reason for the move. What the chart shows TRX bounced from the sharp flush near 0.3010 at the start of November, topped near 0.3243, then drifted lower in small candles. One detail I noticed: for about a week, price has stayed between roughly 0.3155 and 0.3210, a range of only about 1.7%. Falling highs against a flat floor is a squeeze. It shows the range is narrowing, but it does not show which way it will break. Key levels Support: 0.3150, then 0.3100. Resistance: 0.3175, then 0.3210. Levels are read by eye, so they are approximate. What would strengthen it A touch of 0.3175 proves little, and a break above it is only a first step. A 4H close above 0.3175, then above 0.3210, would be a better sign. A retest that holds as support, or a higher low above 0.3154, would add weight. Concern The highs keep dropping, and the latest candle is closing in on the floor. A 4H close under 0.3150 would mean the floor has failed. What changes my mind A 4H close below 0.3150. The lesson A flat floor with falling highs tells you the range is shrinking, not which side will win. My view I'm watching 0.3150 as the line. While it holds, I read this as a squeeze, not a breakdown. This is a scenario, not a prediction. A reading at posting time, not a guarantee. Which do you trust more here: the flat floor or the falling highs? Not financial advice. Always manage your risk. 📊 #IMPACTbyTrade
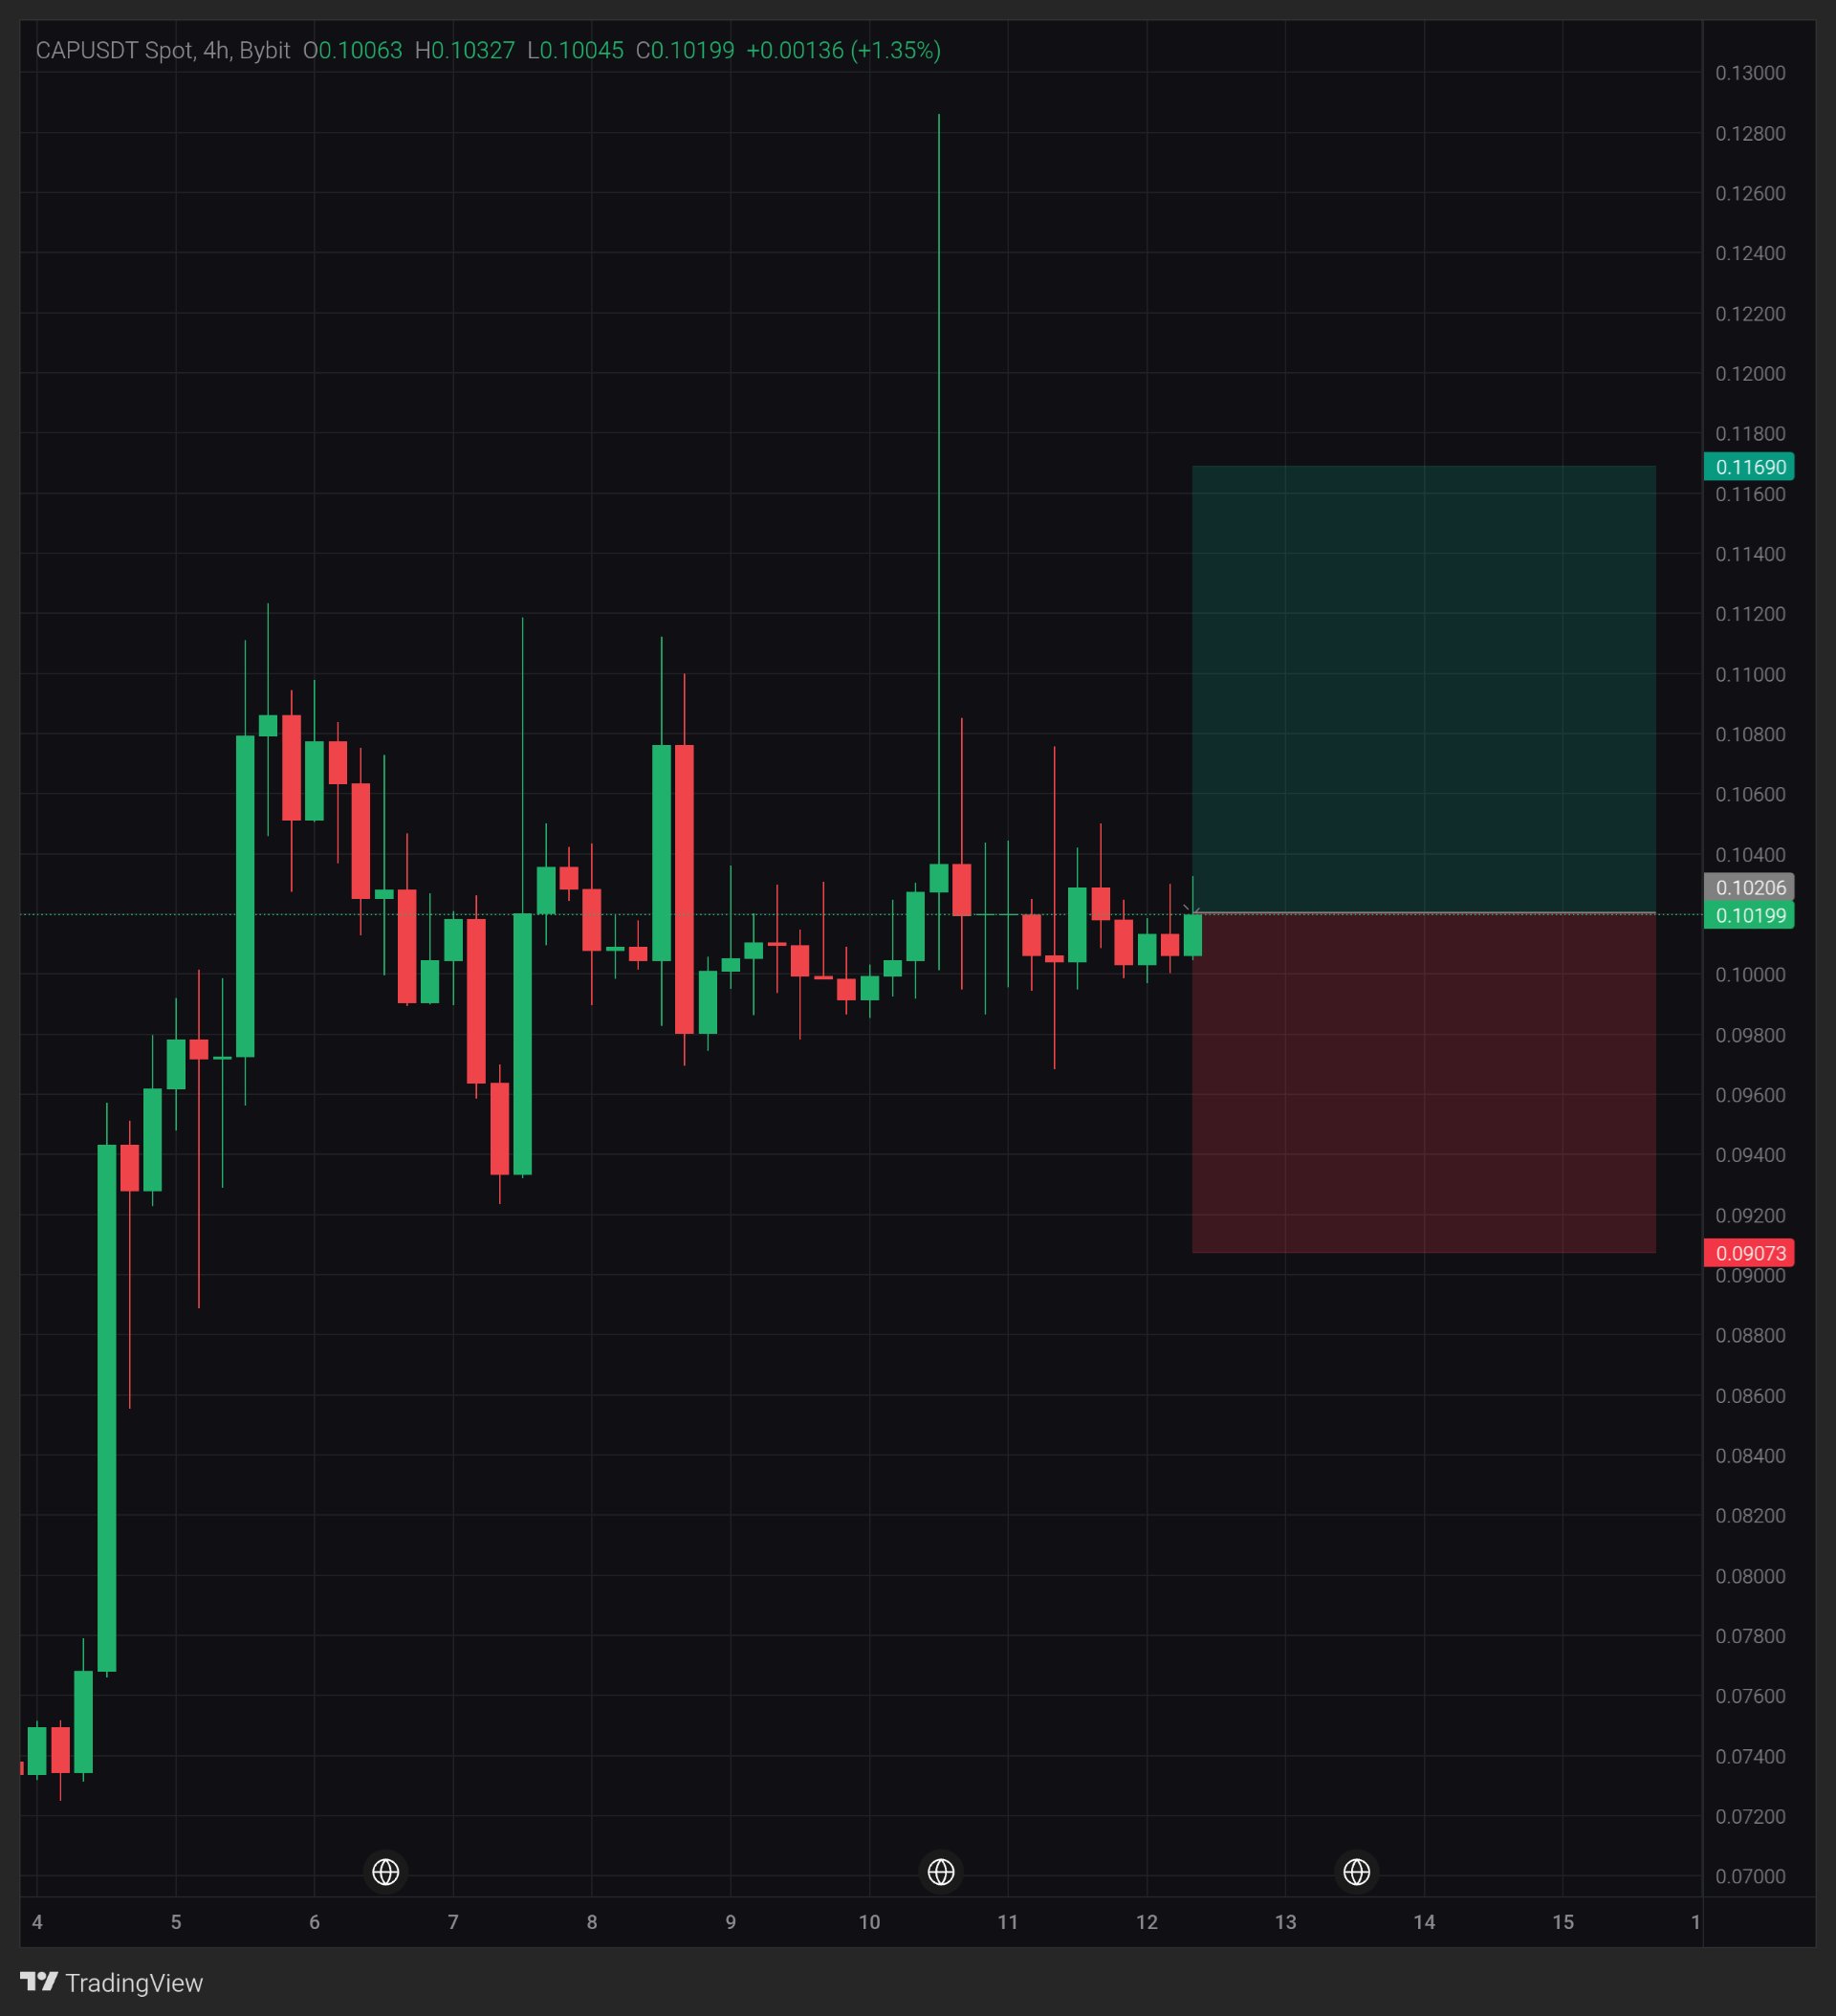
CAP: Can 0.1000 become a solid support?
$CAPUSDT — CAP is holding near 0.1020 after several 4H candles failed to establish a clear direction. What's interesting is the contrast between the earlier explosive rally and the current tight consolidation around 0.1000–0.1040. Buyers have managed to keep price above the recent lower range, but resistance is still limiting the recovery. Is this consolidation building strength for another move, or is momentum starting to fade? Timeframe: 4H | Pair: $CAPUSDT Spot, Bybit | Price: 0.10199 | Latest candle: O 0.10063 / H 0.10327 / L 0.10045 / C 0.10199 (+1.35%). Candle close status not confirmed. Macro note November 11, 2026 — Reuters reported that US October core CPI increased 0.3%, above the 0.2% forecast, while Federal Reserve officials discussed the possibility of larger interest-rate increases. This is broader market background, not the reason for CAP's price movement. What the chart shows CAP previously surged from around 0.0740 toward 0.1080, with an extreme upper wick reaching approximately 0.1285. Since that move, price has settled into a sideways range. The interesting detail is that despite the volatility, recent candles have repeatedly returned to the 0.1000 area rather than establishing a new direction. Key levels Support: 0.1004, then 0.0980–0.0960. Resistance: 0.1033, then 0.1075–0.1085. What would strengthen it Buyers need to push above 0.1033 first. A confirmed 4H close above this level, followed by a successful retest, would strengthen the recovery scenario. A break above 0.1085 would provide further confirmation. Concern The current consolidation has not produced a convincing higher-high structure. Losing 0.1000 and closing below the recent support area would weaken the bullish scenario. What changes my mind A 4H close below 0.0980 would make me more cautious about CAP's short-term direction. The lesson After a sharp rally, consolidation can represent either accumulation or distribution. The eventual breakout and candle close help distinguish between the two. My view I'm watching CAP around 0.1000–0.1033. The price is holding an important area, but I want to see a confirmed breakout before calling this a stronger recovery. This is a scenario, not a prediction. A reading at posting time, not a guarantee. Will CAP break out of this range, or continue moving sideways? Not financial advice. Always manage your risk. 📊 #ByXIMPACT
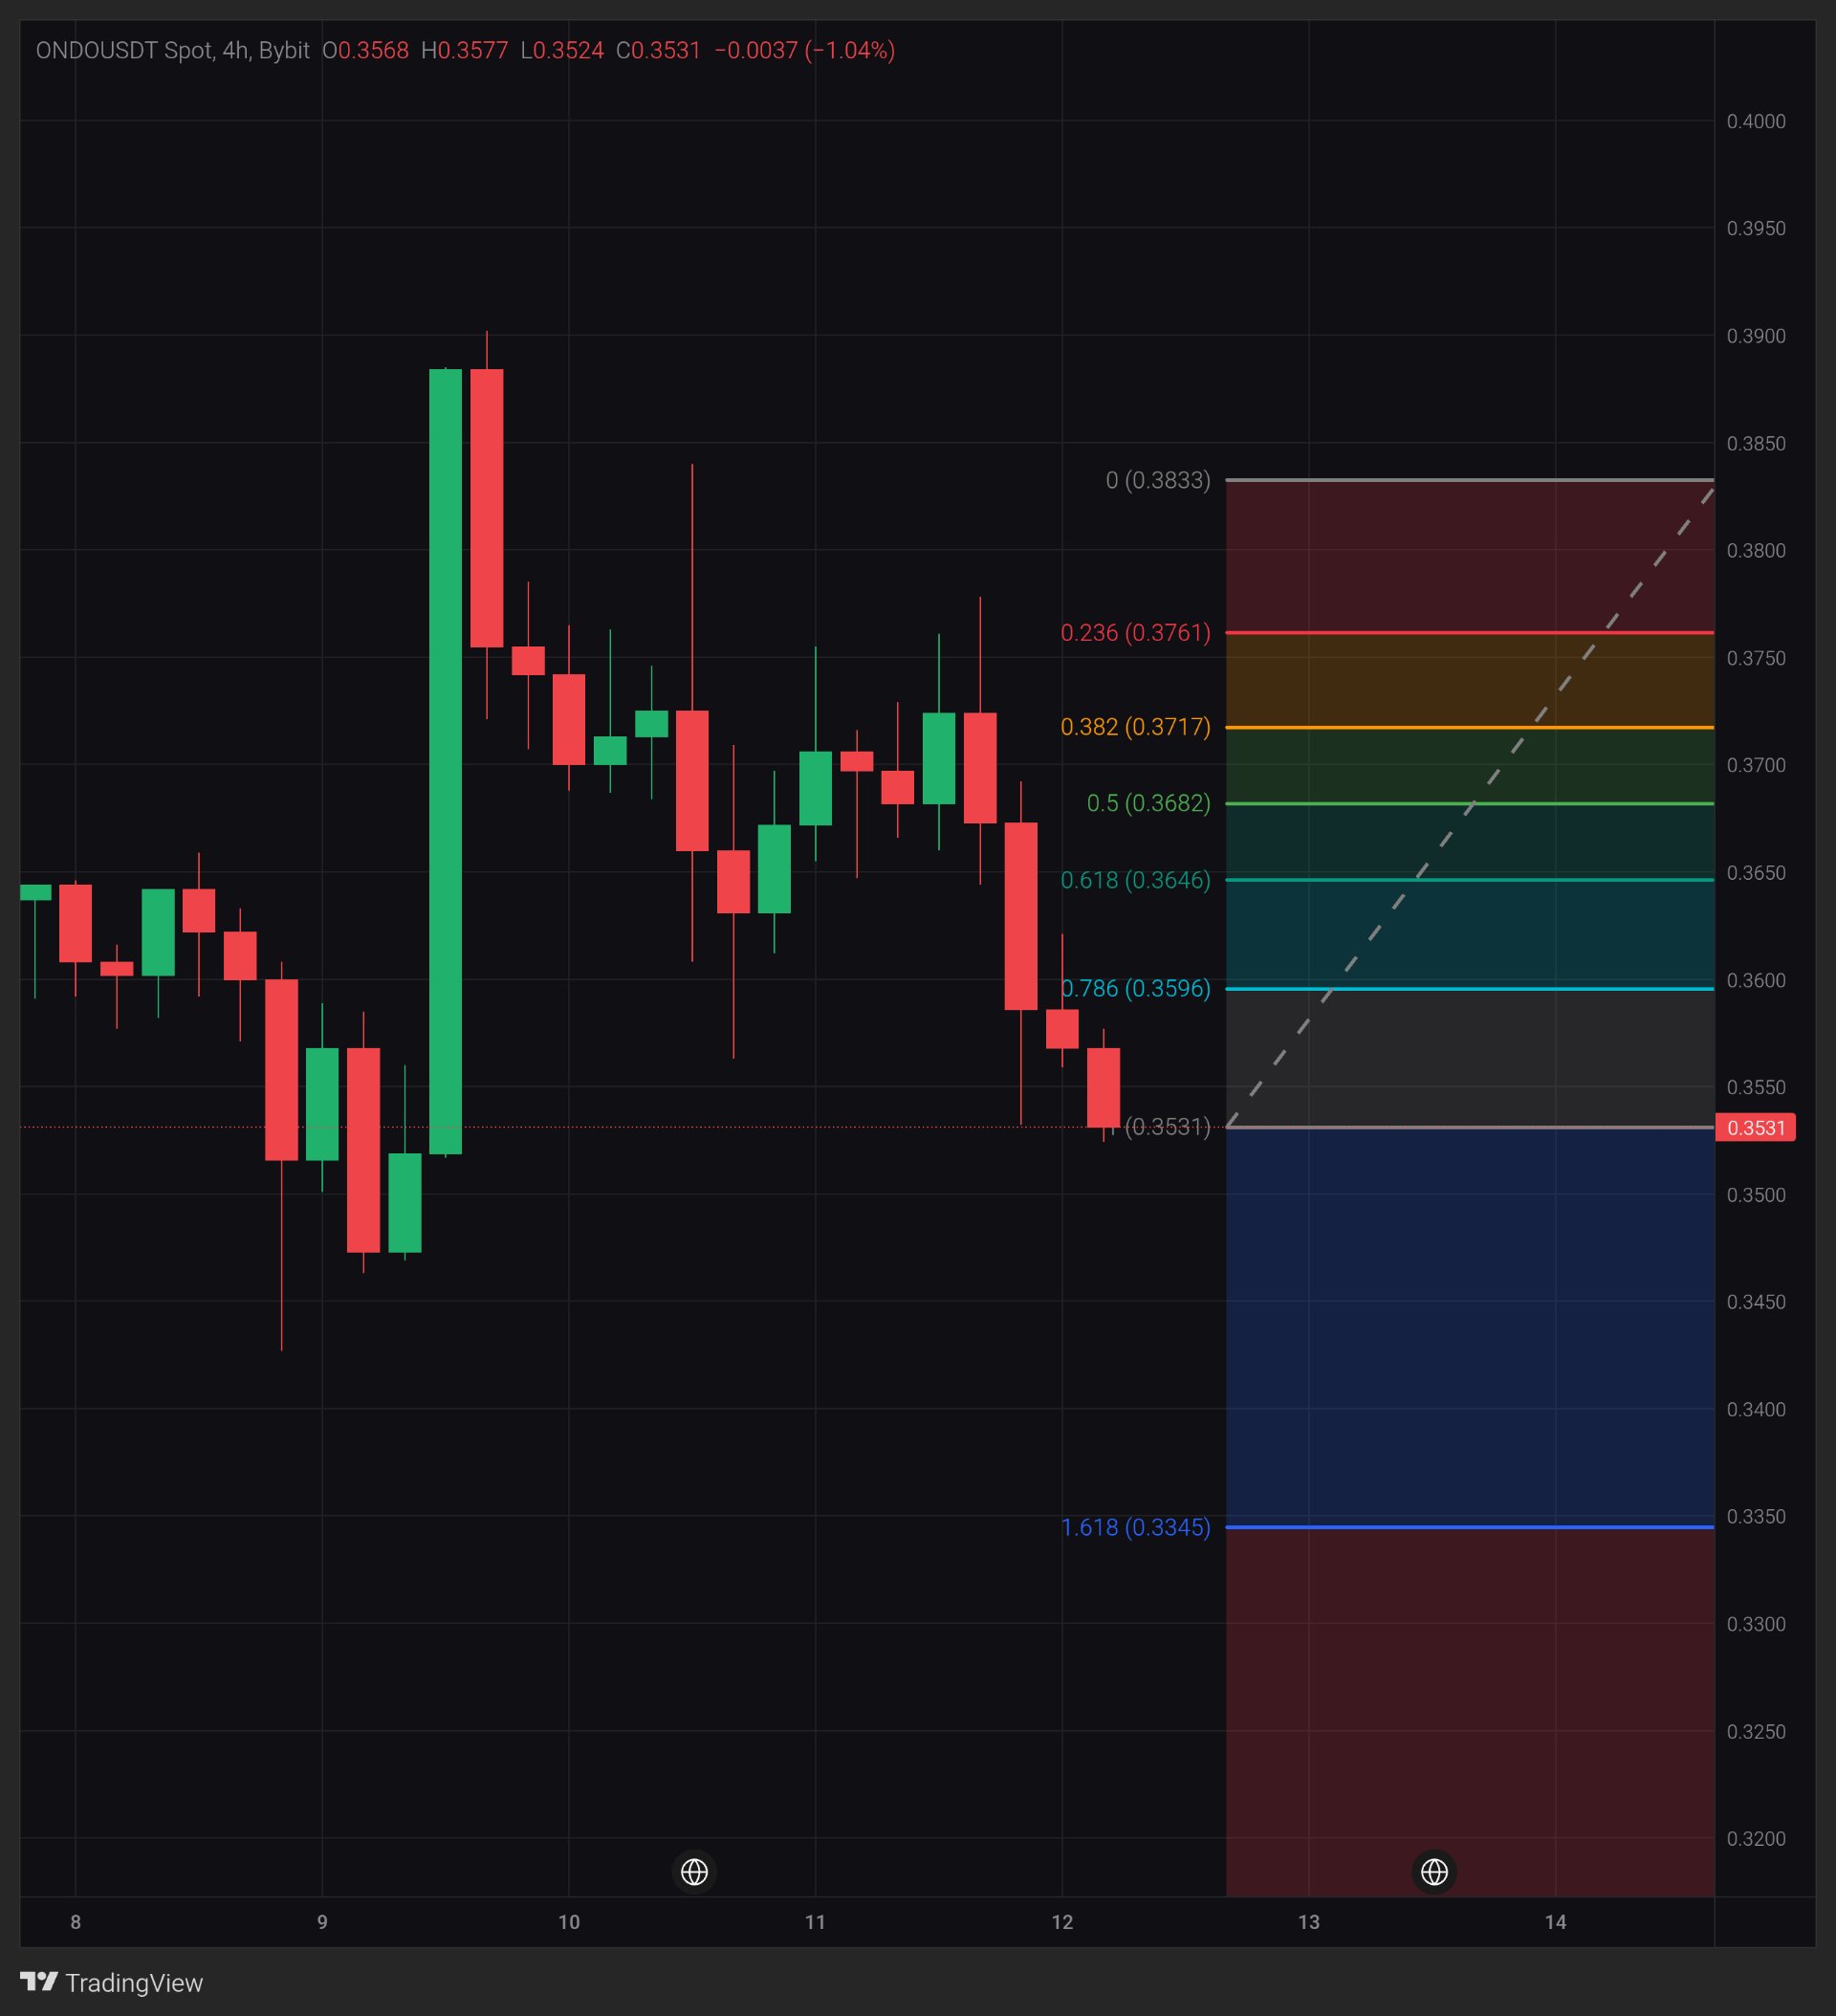
ONDO: Can 0.3530 support stop the decline?
$ONDOUSDT — ONDO is testing the 0.3530 area after several consecutive 4H candles showed increasing selling pressure. What stands out is the failed recovery toward 0.3900, followed by a sequence of lower highs and a gradual loss of momentum. Price is now sitting near an important Fibonacci reference level, while the next support area is becoming increasingly relevant. Will buyers defend this zone, or is ONDO preparing for another leg down? Timeframe: 4H | Pair: ONDOUSDT Spot, Bybit | Price: 0.3531 | Latest candle: O 0.3568 / H 0.3577 / L 0.3524 / C 0.3531 (-1.04%). Candle close status not confirmed. Macro note November 12, 2026 — Reuters reported that the US dollar strengthened to its highest level in months as hotter inflation revived expectations of further Federal Reserve rate increases. This is broader market background, not the reason for ONDO's price movement. What the chart shows ONDO experienced a strong upward move toward 0.3900 before facing a sharp rejection. Since then, the 4H structure has shifted toward lower highs. An important detail is that price has now fallen below the 0.3596 Fibonacci level (0.786), leaving the 0.3531 area as the next important reference. Key levels Support: 0.3524, then 0.3450–0.3425. Resistance: 0.3596, then 0.3646–0.3682. What would strengthen it Buyers need to defend 0.3524 first. A break above 0.3596 followed by a confirmed 4H close above it would be an initial sign of recovery. Holding that level on a retest would strengthen the bullish scenario. Concern The recent sequence of red candles and lower highs suggests that sellers still have control of the short-term structure. A confirmed 4H close below 0.3524 would increase concern about another downward move. What changes my mind A 4H close below 0.3524 would make me more cautious about ONDO's short-term outlook. The lesson Fibonacci levels can help identify important reaction zones, but losing a level on a candle close is different from simply testing it with a wick. My view I'm watching the 0.3524–0.3596 range closely. ONDO needs to show that buyers are willing to defend the current area before a stronger recovery becomes convincing. This is a scenario, not a prediction. A reading at posting time, not a guarantee. Will ONDO reclaim 0.3596, or will sellers push it toward the next support? Not financial advice. Always manage your risk. 📊 #BitcoinHitsTwoMonthLowAfterUSMidterms #USInflationRunsHotAndRateHikeBetsRise
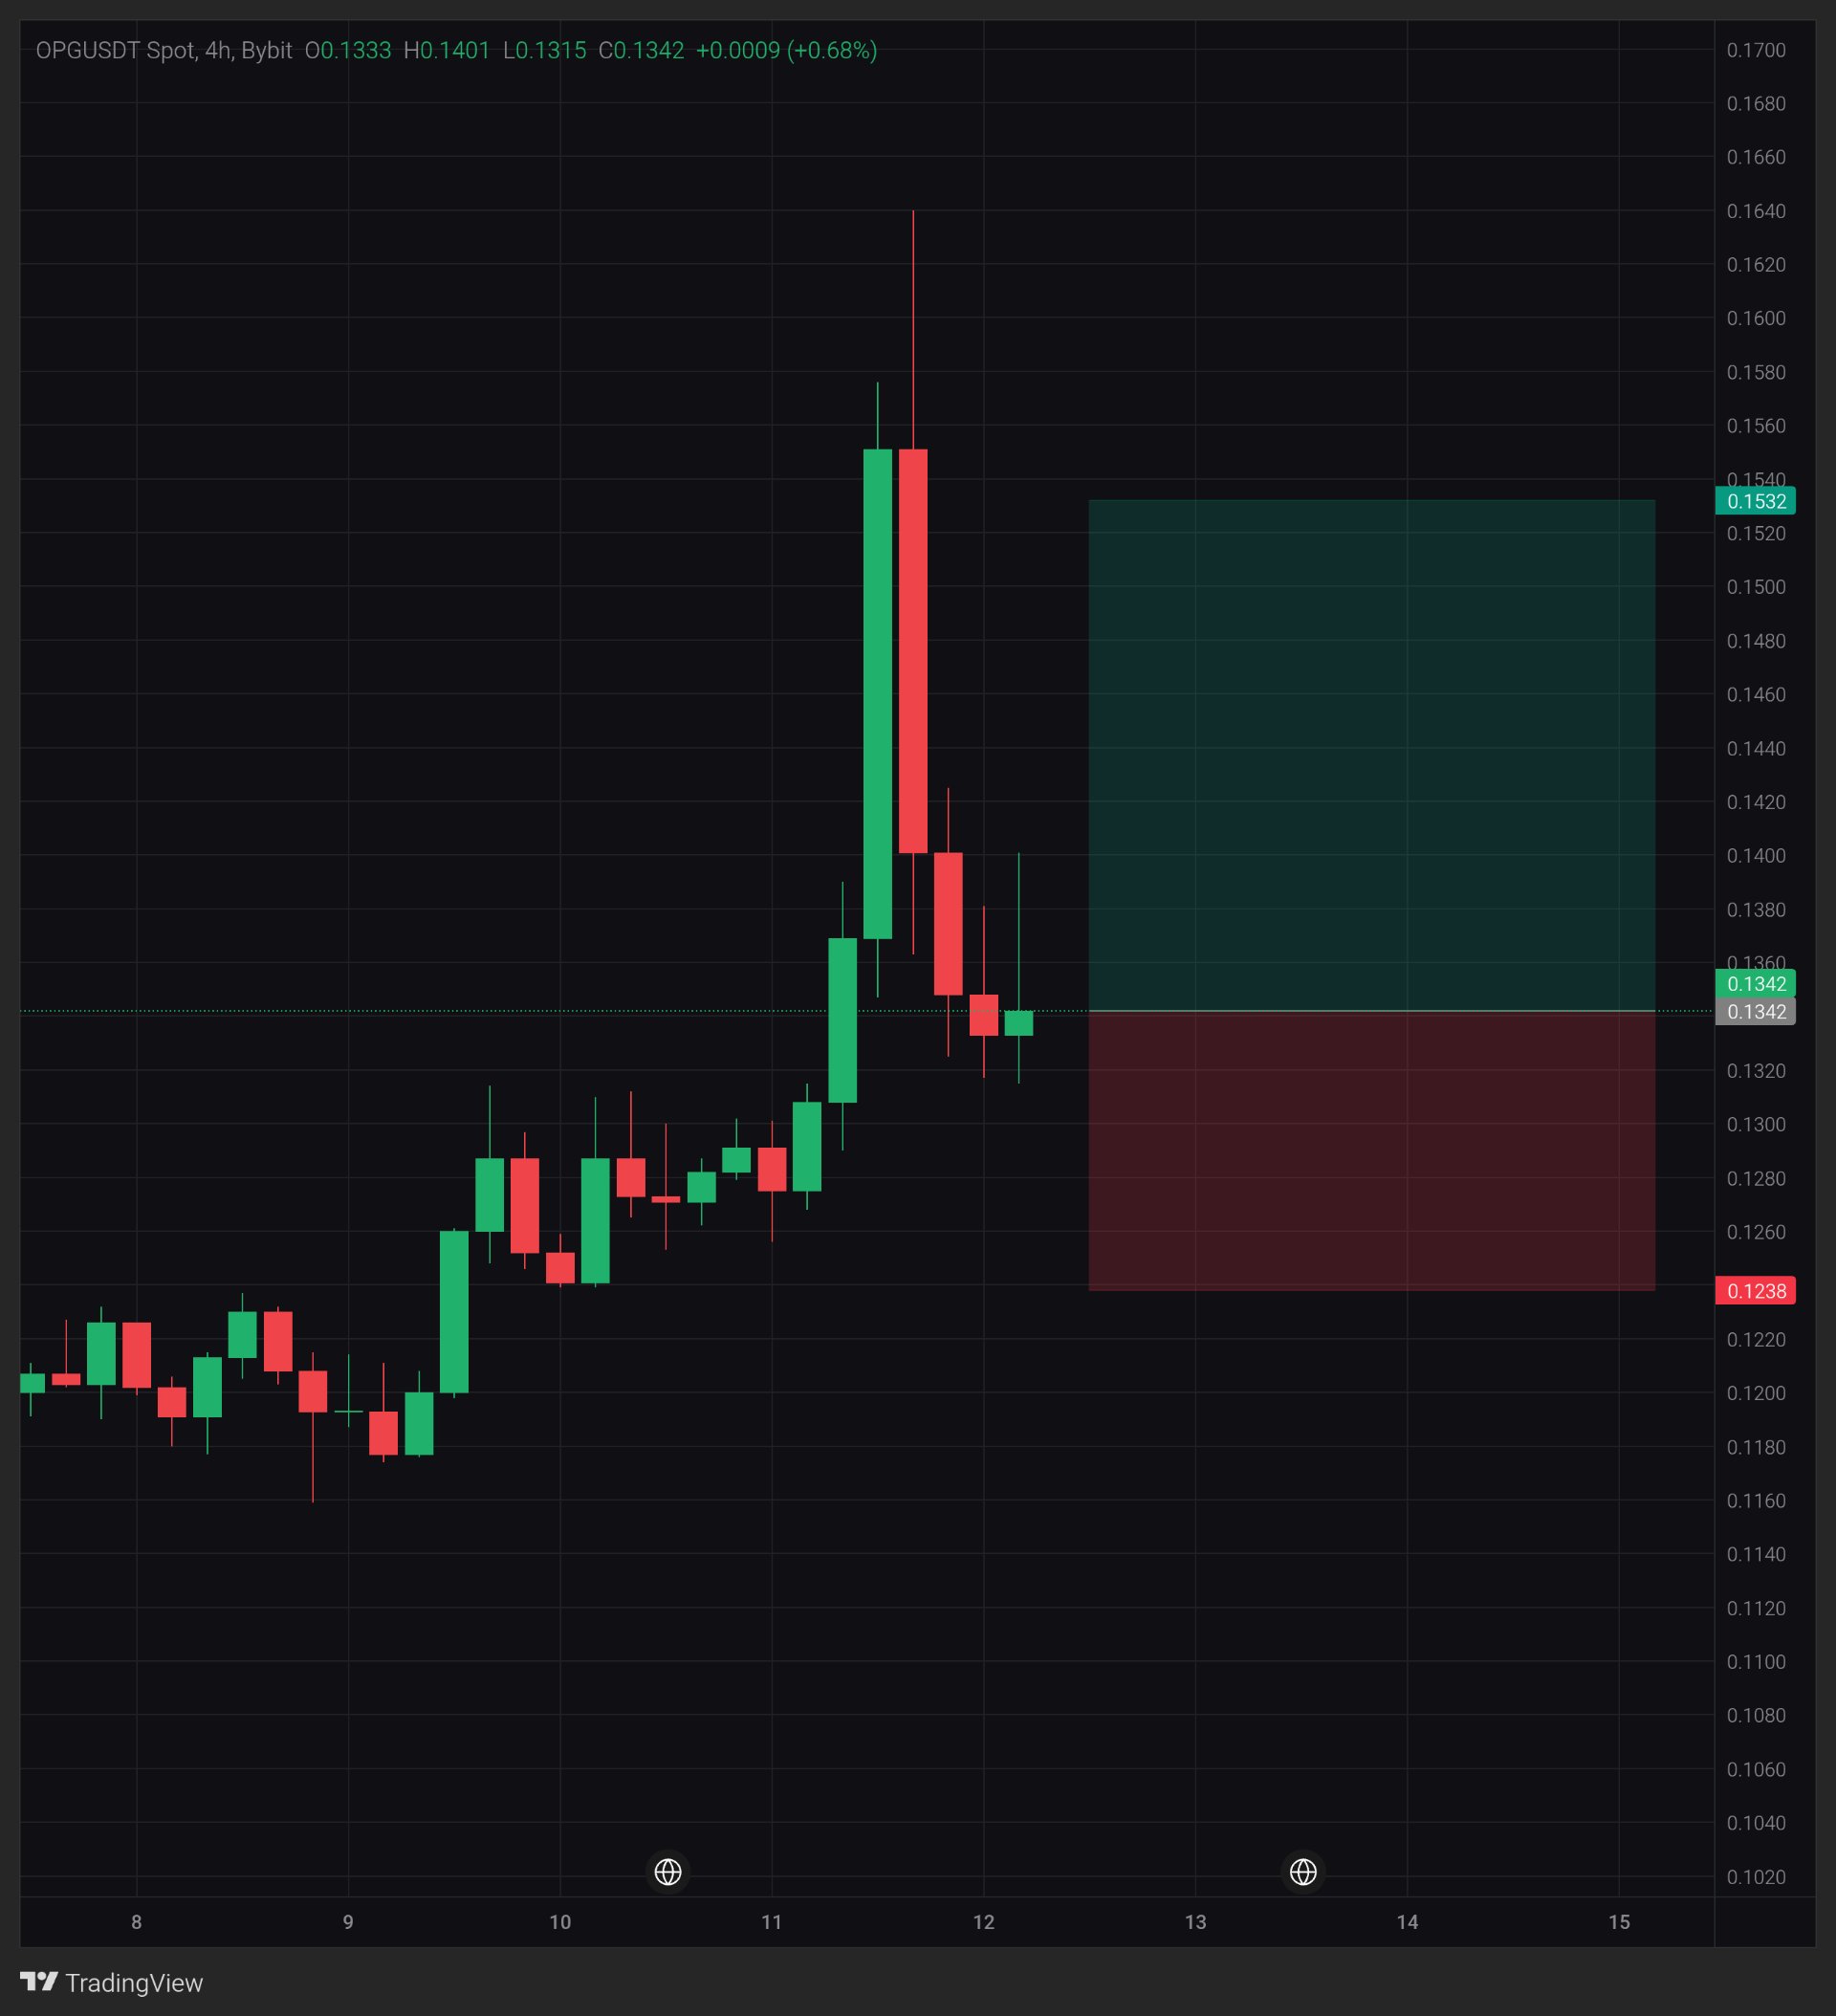
OPG: Can 0.1340 hold after the sharp pullback?
$OPGUSDT — OPG is trying to stabilize around 0.1340 after a powerful rally was followed by an aggressive rejection. What caught my attention is the long upper wick near 0.1640, showing how quickly sellers stepped in after the breakout attempt. Price has now pulled back toward the area where the previous consolidation took place. Is this a healthy correction after the rally, or is the recovery already losing momentum? Timeframe: 4H | Pair: $OPGUSDT Spot, Bybit | Price: 0.1342 | Latest candle: O 0.1333 / H 0.1401 / L 0.1315 / C 0.1342 (+0.68%). Candle close status not confirmed. Macro note November 12, 2026 — Reuters reported that the US dollar reached a 19-month high as stronger-than-expected inflation and hawkish Federal Reserve comments increased expectations of further interest rate hikes. This is broader market background, not the reason for OPG's price movement. What the chart shows OPG climbed from approximately 0.1180 to 0.1550 before a sharp rejection, with an upper wick reaching around 0.1640. The interesting detail is that the pullback has brought price back toward 0.1315–0.1340, an area where buyers may attempt to regain control. Key levels Support: 0.1315, then 0.1280–0.1260. Resistance: 0.1401, then 0.1550–0.1640. What would strengthen it First, buyers need to defend 0.1315. A break above 0.1401 followed by a confirmed 4H close above that level would provide an initial recovery signal. Holding it on a retest would strengthen the case. Concern The rejection from 0.1550 was aggressive, and the long upper wick near 0.1640 highlights significant selling pressure. Losing 0.1315 on a confirmed 4H close would weaken the recovery scenario. What changes my mind A 4H close below 0.1315 would make me more cautious about further downside. The lesson A strong rally does not automatically mean a trend will continue. The reaction after a sharp rejection often tells us more than the rally itself. My view I'm watching the 0.1315–0.1401 range closely. OPG has shown strong upward momentum, but the latest rejection means buyers still need to prove that they can defend the recovery. This is a scenario, not a prediction. A reading at posting time, not a guarantee. Will OPG recover above 0.1401, or will sellers push it lower? Not financial advice. Always manage your risk. 📊 #BitcoinHitsTwoMonthLowAfterUSMidterms