Bao 宝
6406Лайк0Акциялар172Жанкүйерлер253Жазылу
$GRAMUSDT just did something rare: every average agrees on the price. After sliding from 1.113 to 1.016 (about 8.7%), GRAM is sitting at 1.049 with the 7, 14 and 28-period MAs stacked at 1.051, 1.049 and 1.049. On the 1h chart, that's a market that has stopped disagreeing with itself. For most of this move, the 28 MA was a ceiling sloping down and every bounce died under it. Now it's flat, and price is sitting on it instead of below it. That's not a reversal. It's the end of the one-way pressure. What bothers me is the volume. The latest bar is 156K against a 5-bar average of 384K. The sell-off came on heavy volume. The recovery from 1.016 came on lighter, fading volume. Buyers stepped in, but they haven't paid for the move yet. The order book shows 91% bids, but I wouldn't lean on that. Bids can be pulled in seconds, and a lopsided book next to shrinking volume often means people are placing orders, not taking price. What I'm watching -Above 1.073: the 24h high and the first higher high since the drop. That's the real signal. - Below 1.016: the low gets swept and the recovery was just a pause. - 1.016–1.073: a range about 5.6% wide, and price is sitting in the middle of it. The part most people will skip Suppose GRAM breaks 1.073 and you chase it, with a stop under 1.016. Risk is about 5.3%. The first logical target, 1.113, is only about 3.7% away. That's roughly 0.7R, which is a bad trade even if you're right about direction. The better version is a reclaim of 1.073, a retest that holds, and a tighter invalidation. Without that, this isn't a setup yet. It's a compression, and a compression on fading volume resolves with a candle, not an opinion. I'm not calling it either way. I need a close above 1.073 with volume well above that 384K average, or a break under 1.016 that fails to bounce. #IMPACTbyTrade
$MNT bounced 4% off the low and walked straight into resistance Mantle has recovered from 0.3631 to 0.3773, and the 1h chart has just run into the 28-period MA near 0.3786. The latest candle is red with an upper wick, so buyers got the touch but couldn't hold it. That matters more than the bounce itself. Price only climbed back above the 7 and 14 MAs (0.3750 and 0.3731) after the slide had already stretched. The 28 MA is still the highest of the three and still sloping down, so the structure hasn't flipped. This is a recovery inside a downtrend until proven otherwise. The volume tells the same story. The selloff printed heavy bars, with several well above the 10-period average of 974K. The bounce has been quieter, and the latest bar is around 795K, below both averages. A real reversal usually has participation behind it. This looks more like the market catching its breath. Don't read too much into the 98% bid in the order book. Resting bids are easy to place and easy to pull. What counts is whether price can close above resistance. Where the bounce stands: - The recovery covers about 35% of the drop from 0.4036 to 0.3631. - The 50% retrace sits near 0.3834, and the 24h high is 0.3940. Both are untouched. - A hold above 0.3786 would be a real change in tone. What I'd need to see - A 1h close above the 28 MA, followed by a retest that holds it as support. - Volume that expands on the push instead of fading. Hypothetical setup, not a live signal: an entry near 0.379 after a confirmed hold, a stop under 0.3725, and a first target at 0.3940 would give roughly 2.3:1. If price loses 0.3731 first, the setup is off and 0.3631 is back in play. A break below that low would suggest the bounce was just a pause. I'm not chasing this into resistance. Right now the market has shown a bounce, not a reversal. The 0.3786 close is what separates the two. Not financial advice. $MNTUSDT #IMPACTbyTrade

$HYPEUSDT HYPE swept $60 and rebounded 13.7%. The volume tells me the easy part is over. HYPE's wick to $60.063 came on the heaviest volume of the whole move. Buyers answered within hours, and price is now back at $68.27, above the 7, 14 and 28 hourly MAs. That is a real reclaim. It also changes the question. The capitulation candle printed the biggest volume bar on the chart. The latest bar is around 9K against a 5-period average above 31K. The sell-off had conviction and the recovery is quiet. Buyers are not leaving, but they are not pressing either. $69 is the ceiling. The 24h high is $69.008, and the last pushes up were rejected with an upper wick. Price is about 1.1% below it and has not cleared it yet. The MAs have also not turned bullish. MA7 is up at $66.90, but MA14 ($65.92) is still under MA28 ($66.14), and the downward slope of the whole leg is only now flattening. Price is also 6.7% below the $72.86 high that started this drop. I would not call a trend reversal until that level is reclaimed. Where the R:R changes These are hypothetical setups, not signals. Chasing a break above $69: with an invalidation near $66.90, risk is about $2.10 and the move to $72.86 is about $3.86. That is roughly 1.8:1. Waiting for a retest of $66.1–66.9: the reward-to-risk is much better, but a stop tucked under $65.9 sits inside normal hourly noise. A wider stop erases most of that edge. I'd rather see a retest hold on lighter selling than buy the breakout. If $66 fails, the sweep low was just the first half of the move. Buyers were fast. Whether they are still willing to pay up is the part nobody has proved yet. #IMPACTbyTrade
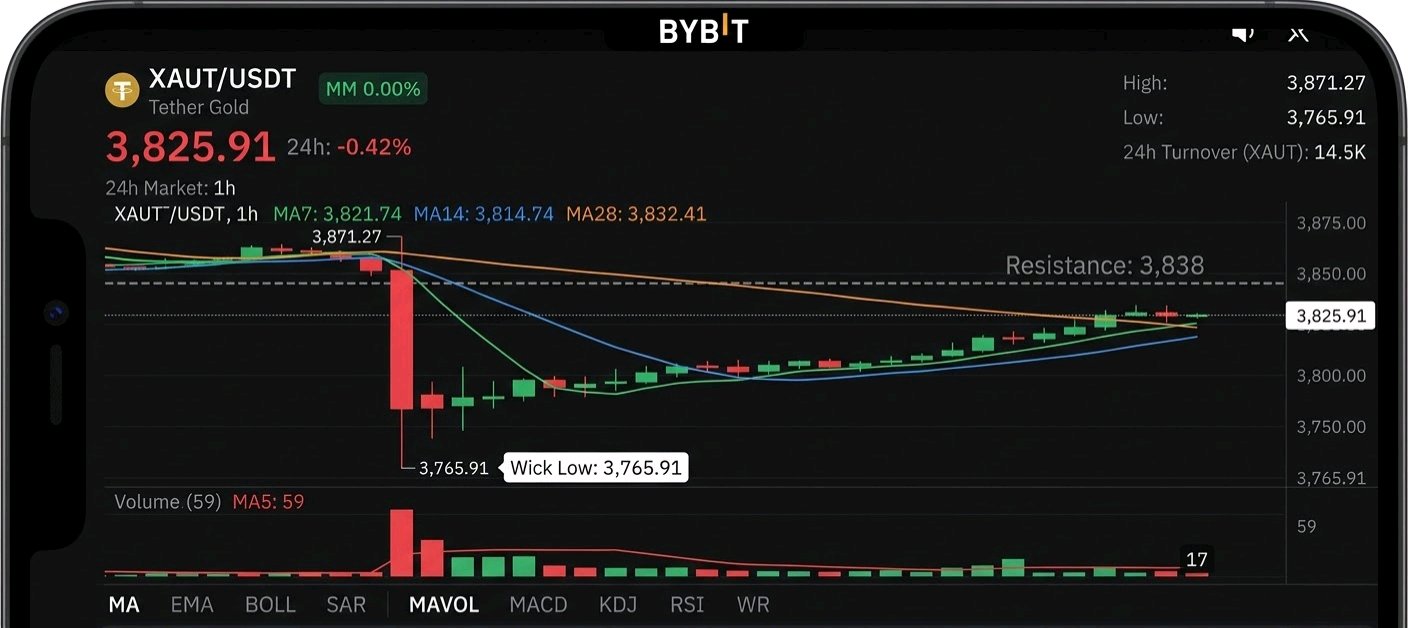
$XAUTUSDT XAUT swept the lows at 3,765.91, but the recovery is running on fading volume The drop was violent. XAUT fell through the 1h moving averages in one heavy-volume leg and wicked down to 3,765.91. The buyers who stepped in there did real work, and price is back at 3,825.91, about 57% of the 24h range. But the volume has gone quiet. The flush came on the biggest bars of the session. The bounce has been built on shrinking participation, and the latest bar shows about 17 against a 5-bar average near 59. A reversal needs buyers to show up with conviction, and so far they haven't. The moving averages show the same split: - MA7 (3,821.74) and MA14 (3,814.74) have been reclaimed. That's the good news. - MA28 (3,832.41) is still above price, sloping down, and only about 6.5 points away. It's the line that separates "bounce" from "trend repair." - The recovery's first rejection came around 3,838, so that's the nearby ceiling to clear. The order book also leans sell at 79%. That's a snapshot and can flip quickly, so I wouldn't build a thesis on it. But the pressure above price matches what the volume is saying. What I need to see A 1h close above MA28 and the ~3,838 rejection high, ideally with volume expanding rather than shrinking. That would turn the sweep into a real higher-low structure and put the 24h high (3,871.27) back in play. What weakens it Losing the MA7/MA14 cluster (3,815–3,822) would turn this into a lower-high retest of the lows. Gold-backed tokens can also whip hard around the sweep zone, so I'm not interested in chasing the bounce under the MA28. I'm not offering an entry or stop here. The chart doesn't confirm one, and I'd rather wait for the reclaim. The sweep is done. What's still unproven is whether anyone wants to buy the recovery. #IMPACTbyTrade
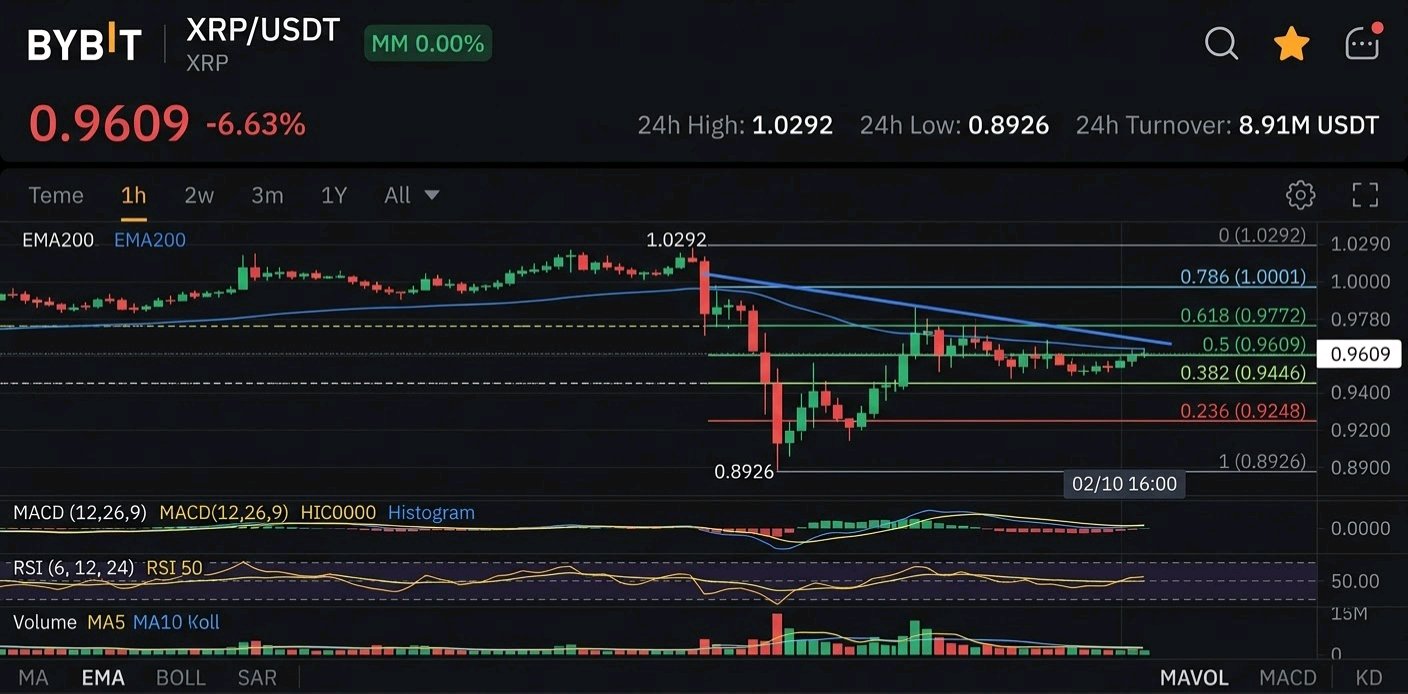
XRP just sold off 13%, bounced 8%, and is now sitting on the exact midpoint of its range XRP dumped from 1.0292 to 0.8926, a 13.3% flush, then recovered to 0.9635. That is a 52% retracement of the entire drop. The 50% level of that range is 0.9609, so price is parked right on equilibrium. Everything else lines up there too. The MA7 (0.9607) and MA28 (0.9590) have collapsed into the same spot, and the 24h high of 0.9977 sits just above. When trend, mean, and midpoint all agree on one price, the market is waiting for someone to break the tie. The recovery itself looks stronger than it is. The bounce topped out around 0.978, below the earlier 0.99+ area, so it is a lower high. Volume on the rebound has also been fading, with the 5-period average now below the 10-period. The big volume came on the flush and the first green recovery candle. Buyers showed up at the low, but they haven't followed through. One caveat: the current candle is only a few minutes old, so its 38.59K volume means little. I'm judging the trend of the volume average, not that bar. What I need to see - A 1h close above ~0.978 would take out the recovery high, and the 0.995 to 1.00 zone becomes the next test. - A rejection here followed by a close below the MA14 (0.9397) would suggest the bounce was just relief, with 0.8926 back in play. The order book shows 59% bids, but a single snapshot is easy to fake, so I wouldn't lean on it. I don't see a clean entry yet. Chasing a bounce into its own midpoint isn't edge. The decision comes at 0.978 or 0.94, and I'd rather let the market pick the side first. $XRPUSDT #IMPACTbyTrade
PEPE bounced 7% off the lows, but the math says it isn't a trade yet PEPE swept the 0.000003697 low, reclaimed the 7 and 14-period moving averages on the 1h, and is now at 0.000003956. That looks like a recovery, but I'm not convinced yet. The selloff came on heavy volume. The bounce has come on visibly lighter volume. Sellers pushed price down with conviction, while buyers are only drifting it back up. The current candle also isn't closed, with about half an hour left on the clock. A close above the MA14 (0.000003903) is the first thing I want to see. A wick above it that gets rejected doesn't count. The level that matters more is the MA28 at 0.000004096, about 3.5% above price and sloping down. PEPE already tried this bounce yesterday and was rejected near that area. It's the same test, and the bounce hasn't passed it yet. Why I'm not chasing Take a hypothetical entry at the current price, with a stop just under the 0.000003697 low (say 0.00000369): - Risk is about 0.000000266. - A target at the MA28 pays about 0.53R. - A target at the 24h high of 0.000004320 pays about 1.37R, and only if price clears the MA28 first. Buying here means risking a break of the low for less than 1:1 to the first real resistance. This is a hypothetical calculation, not a signal. What would change my mind - A retest of the MA14 or MA7 that holds as support, on a quiet pullback, gives a much better entry and tighter risk. - An hourly close above 0.000004096, followed by a hold on the retest, would shift the structure. - A break back under 0.000003697 cancels the bounce and reopens the downside. The sweep of the low was real, but a sweep alone doesn't make a reversal. The market still has to prove it by reclaiming the MA28 on volume that matches the selling. $PEPEUSDT #IMPACTbyTrade

DOT's 15% flush is down to one question: where are the buyers? is down 15.4% to 0.6877 on DOT/USDC, and the big red candle is no longer the part I'm watching. The damage came in one hourly candle that sliced through MA7 on the heaviest volume of the whole move. That was real selling. Since then, price wicked to 0.6811, bounced once, and slipped back to about 1% above that low. Volume has faded sharply from the flush, though the current candle is still open, so I'd judge it at the close. The order book shows 87% bids, yet price won't lift off the low. Bids are sitting there, but nobody is paying up. A resting bid is a stated intention, and it can be pulled in seconds. Context I found no DOT-specific catalyst. The wider market is risk-off: fear & greed was 26 as of Nov 11, and total market cap was down about 5.8% on the week. It's also Sunday, and this pair's 24h turnover is only 17.34K. I'd cross-check the move against DOT/USDT before reading too much into the 15%. What I need to see Price is below all three MAs, and they're stacked bearishly: MA7 at 0.7066, MA14 at 0.7346, MA28 at 0.7655. The first real sign of life is a reclaim of MA7 on rising volume. A touch of 0.6811 isn't a reversal, and neither is a bounce. Hypothetical setup, not a signal: a reclaim of 0.7066 with a stop under 0.6811 risks about 0.0255. - MA14 at 0.7346 pays only about 1.1R. - MA28 at 0.7655 pays about 2.3R. - Falling MAs mean those targets shrink every hour. A reclaim of MA7 alone doesn't give an attractive trade. It needs follow-through to MA28 to justify the risk. Invalidation: a clean break below 0.6811 on volume. At that point the 87% bids stop mattering. The sellers have shown their hand. The buyers haven't yet. $DOTUSDT #IMPACTbyTrade

SOL is sitting on its low with 81% bids and no buyers The order book says buyers. The chart says nobody is buying. SOL/USDC is at 75.49, down 7.37% on the day, and only 0.71 above the 24h low of 74.78. About 81% of the visible order book is on the bid side, which looks bullish. But look at what price did with it. After tagging 74.78, SOL bounced into a tight, overlapping range. The candles are small and the wicks are short, with no follow-through. Heavy resting bids and a price that won't lift usually mean passive demand is absorbing sells while real buyers stay on the sidelines. That is a bid wall, not a trend change. The trend is still down - MA28 is at 77.84 and sloping down. - MA14 is at 75.84, still above price. - MA7 is at 75.56, flat and hugging price. Price is wrapped around the fast average while the slower ones keep pressing down from above. Every bounce since the 82.32 high has topped out lower than the one before. Volume tells both sides of it Current hourly volume is 1.45K against a MA5 of 1.70K and a MA10 of 1.81K. The selling that drove the leg down has dried up. That is a real change, since the market is no longer being pushed lower. But the bounce has no volume behind it either. A base with no volume is a pause, not a reversal. What I need to see - Reclaim: an hourly close back above 75.84 (MA14). A wick through it doesn't count. - **Real confirmation:** a hold above 77.84 (MA28). Until then, any move up is a bounce inside a downtrend. - Invalidation: an hourly close below 74.78. That level has already been tested once, and a second test with weaker volume rarely holds. Here is the hypothetical setup, not an active trade. If SOL reclaims 75.84 and holds, with a stop below 74.78 and a first target at 77.84, the risk is about 1.06 against a reward of about 2.00. That is roughly 1.9:1. It's acceptable, not exceptional, and it only exists after the reclaim. Buying now means entering below both averages with the stop on the same level that just got tested. I'm not chasing the bid wall. SOL has stopped falling, but stopping isn't the same as turning. The next hourly close above 75.84 will tell us whether those bids were real demand or just a floor waiting to be swept. This is a chart observation, not financial advice. I worked only from the screenshot and didn't check news, funding or derivatives data, so check those before acting. $SOLUSDT #IMPACTbyTrade

HYPE's bounce is running on fumes HYPE flushed from the low 71s to 67.113 in a single hourly candle, and the 3-4 hour bounce that followed has already stalled. The dip got bought. The bounce isn't getting follow-through. The 24h range is 75.308 to 67.113, and price now sits at 68.85, down 5.87%. The 75.3 spike was a one-candle wick that got rejected immediately, so the selloff started from a failed push, not from weakness. The bounce is the problem The sell-off candle printed the heaviest volume on the chart, close to 60K. The rebound candles that followed show visibly less, and the current hour is at 7.76K against a 10-period average of 20.72K. A flush that big on that volume looks like forced selling. A recovery on a fraction of that volume looks like a pause. The moving averages agree. Price is under the 7, 14 and 28 MAs (69.37, 69.93, 71.48), and all three are sloping down. The bounce tagged the MA7 area, failed, and printed a lower high. Now the current candle is red again. What I'm watching - 67.113: the capitulation low. A retest that holds on lower volume would be constructive. A clean break means the flush was only the first leg. - 69.4-69.9: the MA7/MA14 cluster. A reclaim and hold above it would change my read. - 71.5: the MA28 and the origin of the drop. Without a reclaim here, I'd call this a bounce inside a downtrend. The order book showing 70% sell pressure fits the picture, but it's a snapshot and can change in seconds, so I wouldn't lean on it. I'm not chasing a bounce into declining averages. A long needs a reclaim of ~69.9 on real volume, and a short needs a failed retest or a loss of 67.1. Until one of those happens, there's no setup, only a market deciding. The flush was the loud part. What happens at 67.1 on the retest will say whether it was the low or just the first leg down. Based on the 1h chart only. I haven't verified any news, funding or flow data behind this move. $HYPEUSDT #IMPACTbyTrade

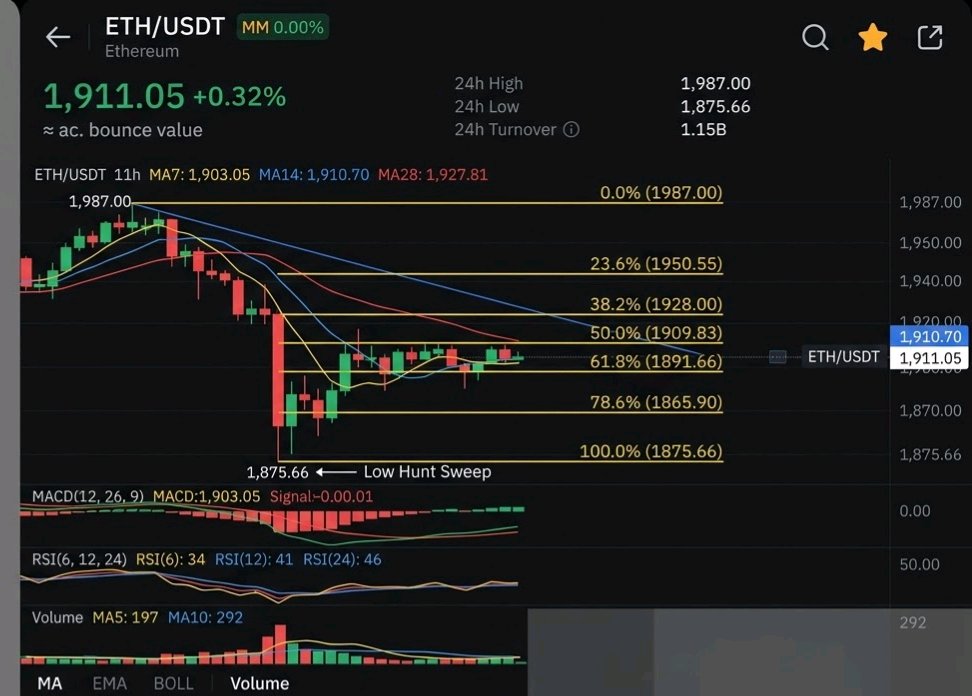
ETH took the low it was hunting. The recovery hasn't followed. The sell-off already swept the downside. ETH wicked to 1,875.66 on the heaviest volume of the session and snapped back. That is usually where I start looking for a reversal. But look at what came after the wick. The bounce has carried price from 1,875 to 1,910, right into the 14-period MA at 1,910.70, on volume that keeps shrinking. The 5-period volume average is about 197 against 292 for the 10-period. A bounce on fading volume is a pause, not a verdict. The structure is the bigger problem. Hourly highs keep stepping down, from the 1,987 24h high to roughly 1,950, and now to around 1,917. The MAs are stacked bearishly with MA28 (1,927.81) above MA14 above MA7 (1,903.05), all sloping down. Price sits in the lower third of the 24h range, about 31% up from the low. What I need to see - An hourly close above 1,927.81. That alone doesn't flip anything, but it's the first sign the bounce has legs. - A push through the roughly 1,950 area. That is the last lower high, and taking it out breaks the lower-high sequence. What kills the idea If ETH loses 1,875.66 again, the sweep stops being a sweep and becomes a support break. Every buyer who stepped in on that wick is then underwater. I'm not chasing this bounce under the MA28. There's no confirmed entry here, only a hypothetical setup waiting on a reclaim. The order book also shows 65% sell-side, but that's a snapshot, not a signal. ETH didn't fail at 1,875. It just hasn't been rewarded for holding it. $ETHUSDT #IMPACTbyTrade
LINK's 10.214 breakout never had a chance to hold LINK pushed to 10.214 on the 1H chart, then gave up the entire move. One long-wicked candle was followed by a full-bodied red one that erased it. That's the signature of a failed breakout: buyers got price there, but nobody wanted to pay it. Since then the structure has only gotten weaker. Every bounce has made a lower high, and the stack is now fully bearish: MA7 (9.615) under MA14 (9.735) under MA28 (9.838). Each rally has died at or near the fastest average, which tells me sellers are still using strength to exit rather than buyers using weakness to accumulate. Volume agrees. The heaviest bars on the chart are the red ones, while the green recovery candles trade on noticeably lighter volume. That's a bounce nobody is committing to. Price is now 9.577, down 3.25%, only about 0.7% above the 24h low at 9.510. The latest candle did wick down to 9.510 and bounce, so there's a hint of buying there. But a wick is not a reclaim. Until LINK closes back above 9.615, it's just a pause inside a downtrend. Why a bounce isn't automatically a trade Suppose a long only triggers after a hourly close above MA14 at 9.735, with a stop below 9.510: - Risk: 0.225 - Reward to MA28 (9.838): 0.103, which is about 0.46R - Reward to 10.038: 0.303, which is about 1.35R So even a successful recovery offers poor reward-to-risk until price is well above the moving averages. That's hypothetical, not a signal, since the chart doesn't establish an entry. But it explains why I'd rather wait than catch this. What I'm watching - Bullish: A close above 9.615, then 9.735, ideally on rising volume. That would turn the averages from a ceiling into support. - Bearish: A close below 9.510 would take out the day's low. There's no visible support beneath it on this chart, so that break would open fresh downside and shouldn't be treated as a dip to buy. The 9.510 low is holding for now, but the market has to prove buyers will defend it with volume, not just a wick. Note: This is based only on the screenshot, so I didn't verify news, derivatives data or broader market context. Add anything you know of, such as BTC direction or a LINK catalyst, and I can sharpen the angle. $LINKUSDT #IMPACTbyTrade

STX Gave Back Its Entire Bounce, and the Volume Warned Us The 24h change reads +2.42%, but the 1H chart tells a different story. STX swept the 0.2730 low on Nov 13, then snapped back with one large green candle. The move ran straight to 0.2996, just under the 0.30 round number, and stalled there. It never got a clean look at 0.30. What bothers me is the volume. The climb to 0.2996 happened on almost nothing. The rejection candle and the selloff behind it carried the biggest volume bars on the chart. Buyers pushed price up quietly, and sellers came in loud once it got there. Now price sits at 0.2796, almost exactly on the MA7 (0.2797) and still below the MA14 (0.2869) and MA28 (0.2862). Those two averages have converged around 0.286, so that zone is the first real test. The sweep of 0.2730 held, which is something, but I don't call a bounce a reversal until price gets back above that cluster. The math, as a hypothetical setup only (no confirmed entry here): - Long from 0.2796 with invalidation under 0.2730 risks about 2.4%. - Target 0.2865 gains about 2.5%, roughly 1:1. That isn't worth taking. - Target 0.2996 gains about 7.2%, roughly 3:1. That works, but only if price gets through the MA cluster first. Waiting for a reclaim above 0.287 makes it worse. With the same stop, the risk is about 0.0140 against 0.0126 of upside to 0.2996, so the trade is under 1:1. The best entry was near the low, and the late chase isn't attractive. I'm watching two things: a 1H close back above 0.2870, and whether volume shows up on the way. If 0.2730 breaks, the sweep-and-reclaim idea is dead and the range is gone. One caution: turnover on this pair is thin (3.46K), so moves here can look cleaner or uglier than they would on deeper liquidity. I didn't check news or other catalysts for STX. This is a read of the chart alone. If you want, I can research Stacks developments and fold them in. $STXUSDT #IMPACTbyTrade

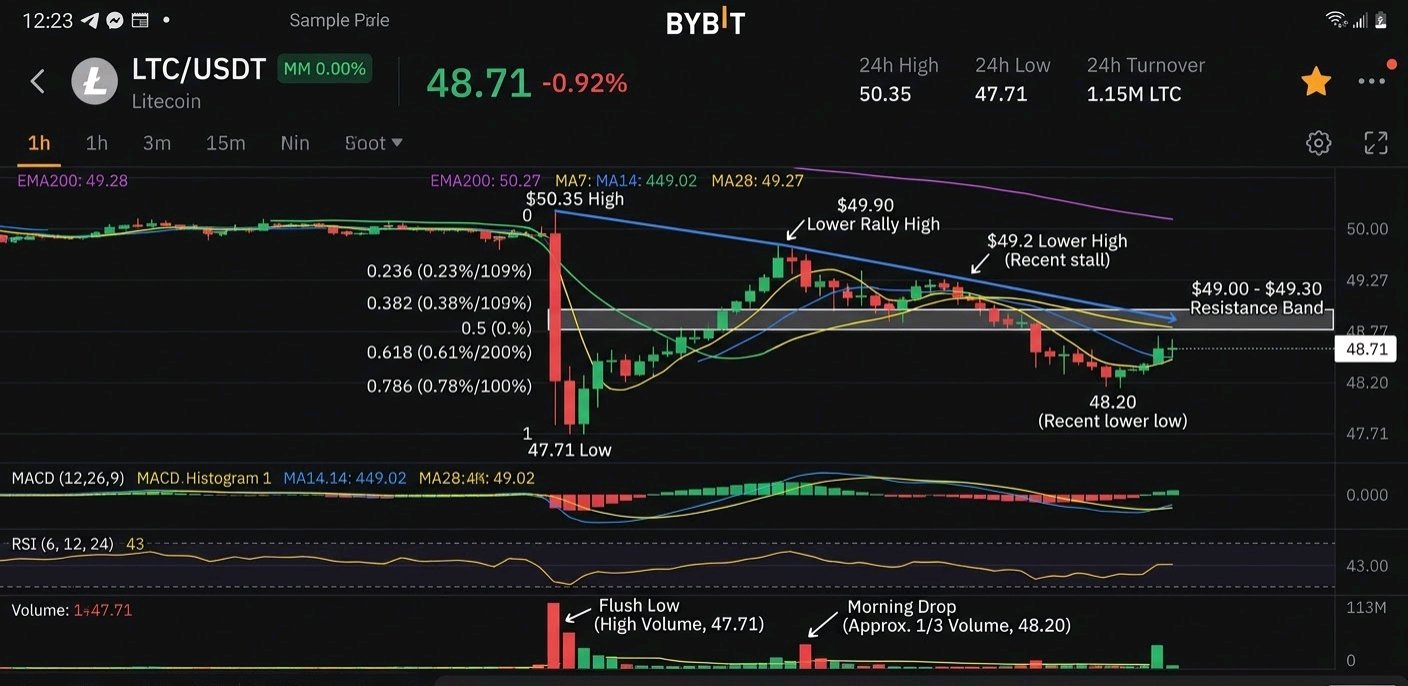
Litecoin's $47.71 low is still standing, but the bounces keep failing below it LTC swept $47.71 in a heavy flush yesterday, then rallied. Every rally since has made a lower high, and the latest sell-off stopped around $48.20, well above that low. Price is now coiling between a floor it hasn't revisited and a ceiling that keeps getting lower. On the 1H chart the high is $50.35, followed by a lower rally high near $49.90. The most recent push stalled around $49.2. Price is at $48.71 and sits under the MA7 ($49.02), MA14 ($49.27) and MA28 ($49.11). Those three are bunched within about 25 cents, so $49.00-$49.30 is one resistance band, not three separate levels. The volume is the interesting part. The first drop to $47.71 was by far the biggest volume bar on the chart, which looks like a real flush. The second drop this morning printed roughly a third of that volume. Sellers pushed price lower again with much less force, and that is why the $47.71 low hasn't been tested again. The bounce isn't convincing either. The current green candle's volume (about 79) is below its 5-bar average (about 91), and the order book shows 66% asks to 34% bids. That's a snapshot and can change in seconds, but it does mean buyers aren't being aggressive here. What would change my mind I'm not interested in buying anything under $49.00. A 1H close above $49.30 that holds on a retest would tell me the lower-high sequence is broken. Until then, this looks like a pause in a weak structure, not a reversal. Risk management Even a confirmed reclaim has a problem. Say a long triggers on a $49.30 retest, with invalidation just under the $47.71 low (about $47.65) and a first target at $50.35. That's about $1.65 of risk for $1.05 of reward, roughly 0.6:1. This is a hypothetical setup, not a signal. The confirmation costs you the reward-to-risk. You'd need either a tighter structural stop, such as under $48.20, or a target beyond $50.35 to make it worth taking. If $47.71 breaks on rising volume, the flush low becomes a failed support and the downside story takes over. Right now neither side has proven anything. The level that matters is $47.71 below and $49.30 above. LTC has to leave that range before there's a trade, and I'd rather wait for it than guess which way it goes. Based only on the 1H chart provided; I didn't research news or derivatives data. Not financial advice. $LTCUSDT #IMPACTbyTrade
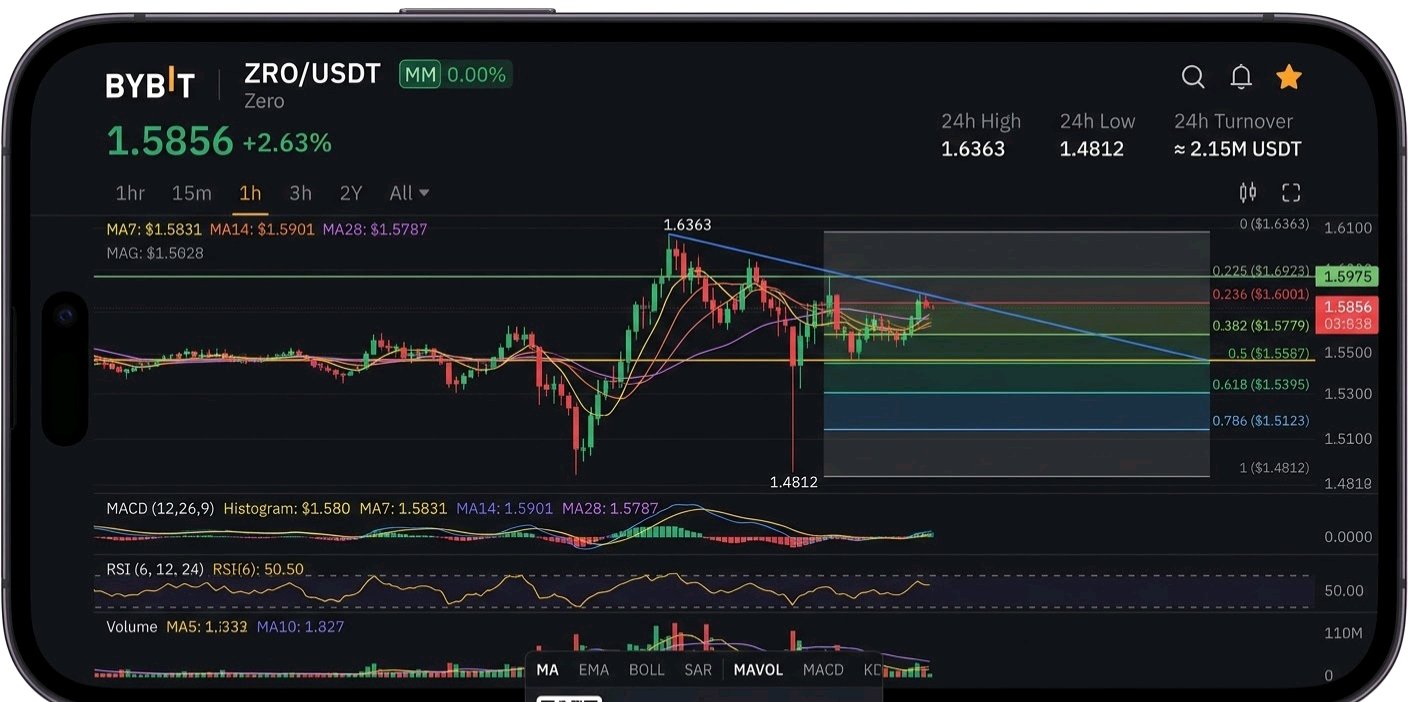
ZRO bought the dip, then went quiet. That silence matters. ZRO is at $1.5856 (+2.63%) after a V-shaped recovery from the $1.4812 low. The hourly chart is now squeezed into a tight band under the $1.6363 high. The recovery looks strong, but the price action since the $1.6363 rejection is a series of lower highs. The latest dip also swept the $1.55 area. Sellers pushed price down to roughly $1.52 on a long wick, buyers absorbed it, and price snapped back. That's a liquidity grab that failed to follow through, which is mildly constructive. But the follow-through is what I'm not seeing. Volume on the current candle is about 19K, well under both the 5-period (34K) and 10-period (28K) averages. The only big volume spike in the last stretch came on a red candle, and the bounce after it was thin. The moving averages show the same indecision. MA7 ($1.5831), MA14 ($1.5901) and MA28 ($1.5787) are bunched together within about a cent, and price is sitting on all of them. That's compression, not trend. The order book adds a small caution: 45% bids against 55% asks. That's a snapshot and shouldn't carry much weight alone, but it doesn't contradict the fading volume. What I need to see - Bullish confirmation: an hourly close above $1.5975 on volume above the 5-period average. That would turn the lower-high sequence around, with $1.6363 as the next test. A close above that would confirm the recovery as more than a bounce. - Warning sign: a close back below the $1.5587 shelf. That would make the sweep wick look like a trap, and the $1.52 wick low becomes the level to watch. Losing it would put the $1.4812 low back in play. There is no confirmed trade here. Price is mid-range, so a long gives you poor reward-to-risk until it clears resistance or retests support. I'd rather let the range resolve than guess the direction. The dip was bought. What matters now is whether anyone will pay up to break $1.5975. Not financial advice. Based on the 1h chart only; I haven't verified any news or catalysts. $ZROUSDT #IMPACTbyTrade
SUI just gave back 38% of its rally and stopped exactly where it needed to SUI ran from 0.7646 to 0.8280 in a few hours, a move of about 8.3%. It has since pulled back to 0.8036, which is almost exactly the 38.2% retracement of that leg (about 0.8038). The market is now pausing at the first level that tells you whether the move had real demand behind it. The most interesting candle isn't the spike. It's the large red hourly candle after it. That sell-off drove price down to roughly 0.7985, right into the cluster where MA14 (0.7979) and MA28 (0.7984) sit. It then recovered most of the candle, leaving a long lower wick. Sellers got their flush, and buyers defended the moving-average cluster anyway. Right now that looks like a pullback, not a reversal. But it isn't confirmed. What I'm still not convinced by - Price is below MA7 (0.8087), and the last few candles are red. Short-term momentum has cooled. - The order book is roughly balanced, 48% buy to 52% sell. Nobody is clearly in control at this price. - 0.8087 is the first level that matters. Until SUI reclaims it, this is a bounce attempt, not a trend. The risk/reward problem Suppose I wait for a clean hourly close above 0.8087 and use 0.7975 as invalidation, just under the MA cluster. That's a hypothetical setup, since no entry exists yet. - Target 0.8158: about 0.59R. That is not worth taking. - Target 0.8280: about 1.65R. This is the only target that justifies the risk. So chasing the first pop toward 0.8158 pays poorly. The trade only makes sense if you expect a full retest of the 0.8280 high, and that high still has to be cleared. What invalidates it An hourly close below 0.7979 means the MA support failed, and the 0.7646 low comes back into play. That would turn the wick into a trap instead of a defense. My view: the dip-buyers showed up where they should, but they haven't been tested again yet. The next test is 0.8087. Note: this is based only on the chart in your screenshot (1h, 13 Nov, 21:23). I didn't check news, unlocks or derivatives data, so add any catalyst you know of before posting. This isn't financial advice. $SUIUSDT #IMPACTbyTrade

INJ's rally was one candle, not a trend INJ is up 11% to 8.183, but almost all of that move came from a single hourly candle. Volume shows the same thing: one spike to about 3.29K, while nearly every other bar on the chart is flat. That is how a burst of aggressive buying looks, and it is not yet a sustained trend. Before that, INJ bled lower under all three moving averages until it swept the 7.172 low with a long wick and snapped back. Buyers defended that level immediately. The 1h MA7 (7.943) has now curved up through MA14 (7.659) and MA28 (7.548), and price sits above all of them. That is a real change in short-term structure. I'm not trusting it yet, for three reasons: - Price is already roughly 8% above MA28 after a near-vertical run. The averages haven't caught up, so a pullback toward MA7 would be normal and healthy. - The 8.352 high was rejected, and the candle right after it printed red with a wick. That is a pause at resistance, not a breakout. - The 24h turnover is only 29.66K. On a pair this thin, one large order can create a move like this, and it can disappear just as fast. What I'd need to see - Bullish: a hourly close above 8.352 that holds on a retest. Until then, this is only a touch of resistance. - Weakening: a drop back into the body of the spike candle, roughly the 7.9 area by my read of the chart. That would suggest the move was a one-off squeeze with no follow-through. I wouldn't chase this. No entry or stop has been established, so any trade here is hypothetical until price confirms. The best entries usually come after the first pullback is defended, not at the top of a vertical candle. The question now is whether the volume returns on the next push or stays on that single bar. $INJUSDT #IMPACTbyTrade

SOL took the 77.85 liquidity and snapped back, but the bounce hasn't earned my trust yet The selloff to 77.85 was violent, and the reversal was almost as fast. Solana has now climbed back above its 7, 14 and 28-period MAs on the 1h chart. That is the first time it has closed above the 28 MA (around 80.86) since the drop began. Here's what bothers me. The MA28 had been capping every bounce since the 84.82 high, so reclaiming it matters. But look at the volume. The washout candles printed the heaviest bars on the chart, while the current push shows only 3.51K against a 5-period average of 2.51K. A move up through the average is fine, but the sellers who dumped into 77.85 were far louder than the buyers now lifting price. The price is also sitting at a very specific spot. The 84.82 → 77.85 range is about 6.97 points, and the 61.8% retracement lands near 82.16. The last candle printed 82.04 and stalled right under it. A V-shaped recovery that stops at the golden pocket is where I want to see a clean close above, not a wick. What I'm watching Bullish confirmation: an hourly close above ~82.2 that holds on a retest, with volume expanding. The next resistance is 83.07, then the 84.82 high. Healthy pullback: a retest of the MA28 area (~80.9) that holds. A hypothetical setup there, with invalidation below ~79.6, would give roughly 1.5R to 83.07 and about 2.7R to 84.82. That is a scenario, not a signal, and I haven't established an entry. Failure: a loss of the MA cluster and the 79.6 area would turn this into a sweep followed by a dead-cat bounce. The sweep is done. Whether the recovery is real depends on whether buyers show up when price meets 82.2. $SOLUSDT #IMPACTbyTrade

BNB bounced 17 points off the low, but the bounce hasn't proven anything yet BNB dumped from 688.15 to 622.55, a drop of about 9.5%. The sell-off candle carried the heaviest volume on the chart. The bounce since then has been quiet: volume fades with each green candle. Price is at 640.12 (-3.32% on the day), sitting right on the 14-period MA at 639.76. It has reclaimed the 7-period MA (635.90), but the 28-period MA at 649.03 is still above and still sloping down. All three averages remain stacked bearishly. Buyers have retaken the fast average, but they haven't touched the one that matters. The bounce retraces only about 27% of the entire drop. The 38.2% level lands near 647.6, almost exactly on the 28 MA. The 50% level is 655.35. So the first real test sits around 648-649, where trend resistance and the first Fibonacci retracement overlap. What concerns me is the volume. The heavy volume came on the way down, and the recovery has been thin. The last candle's volume is around 202 against a 5-period average of 537. That's a relief bounce, not conviction. The order book is slightly bid-heavy at 53/47. That's a mild positive, but order books change fast and I wouldn't build a thesis on it. What I need to see - A 1h close above 649, ideally with volume rising instead of fading. - Then 655.35, followed by the 24h high at 662.39. - If price loses the 635.9 MA7 and rolls over from here, the 622.55 low gets retested. - A close below 622.55 would invalidate any recovery idea. I'm not chasing a candle that's pressed against a falling MA with fading volume. There's no confirmed entry here, only a level to watch. Until BNB closes above 649, this is a bounce inside a downtrend. Chart-based only. I haven't checked news, listings or derivatives data, so add those if you want a fundamental angle. $BNBUSDT #IMPACTbyTrade

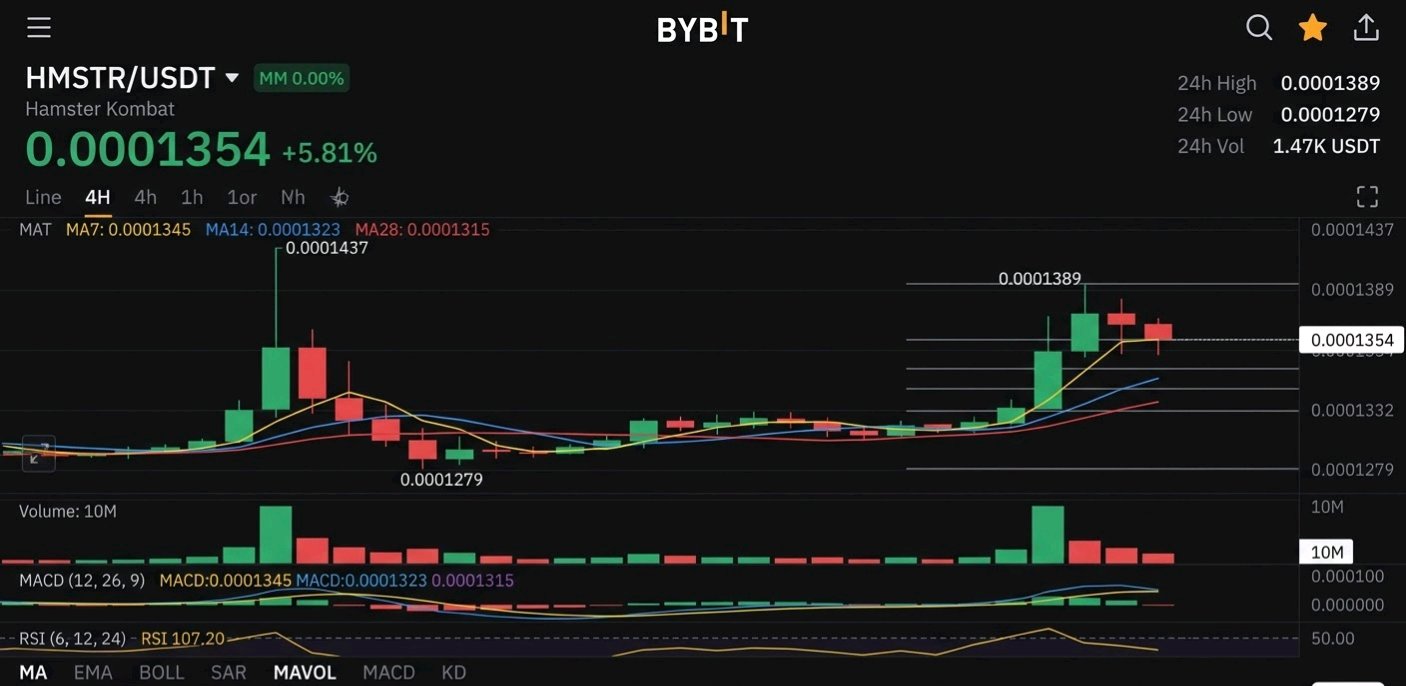
HMSTR just did what its November 8 spike couldn't: it came back with volume. The first push to 0.0001437 on the 4h chart was a fade. Buyers sprinted, sellers hit the wick, and within two days price had given back the entire move and tagged 0.0001279. That was a spike with no follow-through. This one is different. After roughly two quiet days of base-building between 0.000128 and 0.000132, the breakout candle carried the largest volume bar on the chart, around 10M. The earlier spike never came close to that. Price is now at 0.0001354, above MA7 (0.0001345), MA14 (0.0001323) and MA28 (0.0001315), with the shorter averages stacked above the longer ones. That is the first clean bullish alignment on this chart. But it isn't confirmed. The breakout ran into 0.0001389, left a long upper wick, and the next 4h candle closed red. Buyers pushed, sellers answered, and price is now sitting in between. What I need to see - A 4h close above 0.0001389 to turn that wick into reclaimed territory. - Dips holding the 0.0001318-0.0001323 zone, where MA14 and MA28 cluster. Losing 0.0001301 (the 24h low) would invalidate the breakout. As a purely hypothetical setup, a 0.0001354 entry with a stop under 0.0001300 and a first target at 0.0001437 gives roughly 1.5R. That is acceptable, not exciting. A pullback toward 0.000132 would improve the ratio a lot more than chasing here. The caution The order book shows 94% bids to 6% asks, which looks bullish. But 24h turnover is only about 1.47K, so that book is thin and easy to move or spoof. I wouldn't read it as conviction until real volume holds up through the next push. The setup is better than last week's, but 0.0001389 still has to be reclaimed. Not financial advice. $HMSTRUSDT #IMPACTbyTrade

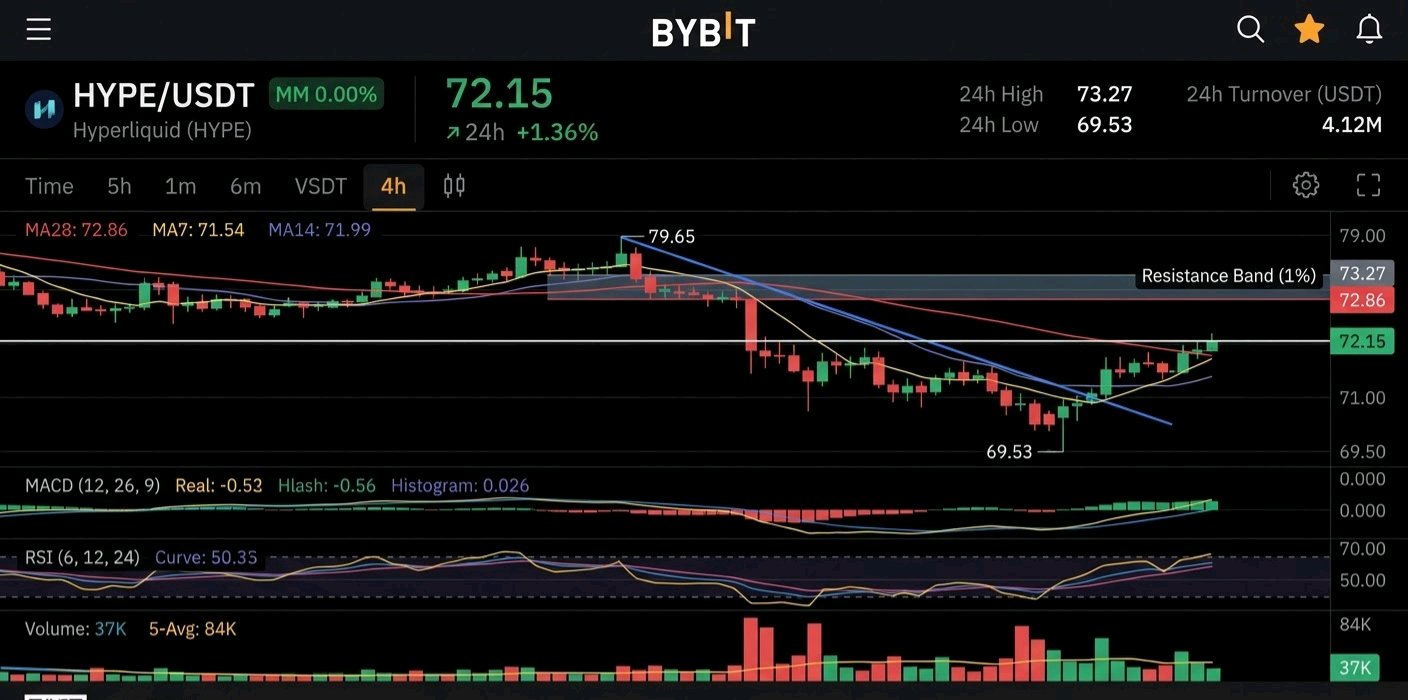
HYPE just got its bounce. The real test is a line it was rejected at hours ago. HYPE has dropped about 12.7% from the 79.65 swing high to the 69.53 low. It is now back at 72.15, up 1.36% on the day. The bounce itself isn't the interesting part. The price level is. The 4h MA28 sits at 72.86, and the last rejection came from that area. The 24h high of 73.27 is just above it. That puts a resistance band about 1% above current price, so there is very little room before buyers hit it again. Two things stand out to me. Buyers defended the low twice. The 69.5 to 70 zone drew two sharp lower wicks, and the second one bottomed slightly higher. That is the first sign of absorption after a clean downtrend. The bounce isn't getting volume yet. The tall volume bars all sit inside the sell-off. The current 4h candle shows 37K against a 5-period average of 84K. It is still forming, so I wouldn't read too much into it, but a recovery needs participation to mean anything. MA7 (71.54) and MA14 (71.99) are now flat and below price, but the MA28 is still sloping down. Price has reclaimed the short averages, not the trend. The reward-to-risk problem. Say you wait for a confirmed 4h close above 73.27. This is a hypothetical entry, not a signal. With invalidation at 69.53, you risk about 3.7. The first target near 75.98 pays about 2.7, which is roughly 0.7R. Even the full retrace to 79.65 is only about 1.7R. Confirmation costs a lot of the move, and it's the same reason chasing into resistance is unattractive. What I need to see: A 4h close above 73.27, ideally with volume above the 10-period average. A retest of that zone that holds as support. If 69.53 breaks, the double-bottom idea is dead and the 79.65 high stops being relevant. Until then, this looks like a relief rally under a falling average. It hasn't confirmed a reversal. $HYPEUSDT #IMPACTbyTrade