Nouman
7870Лайк0Акциялар155Жанкүйерлер122Жазылу
Crypto Market Analyst | Technical Levels • Volume • Market Structure • On-Chain & Fundamentals | Data-Driven Analysis, No Hype.
Crypto Market Analyst | Technical Levels • Volume • Market Structure • On-Chain & Fundamentals | Data-Driven Analysis, No Hype.
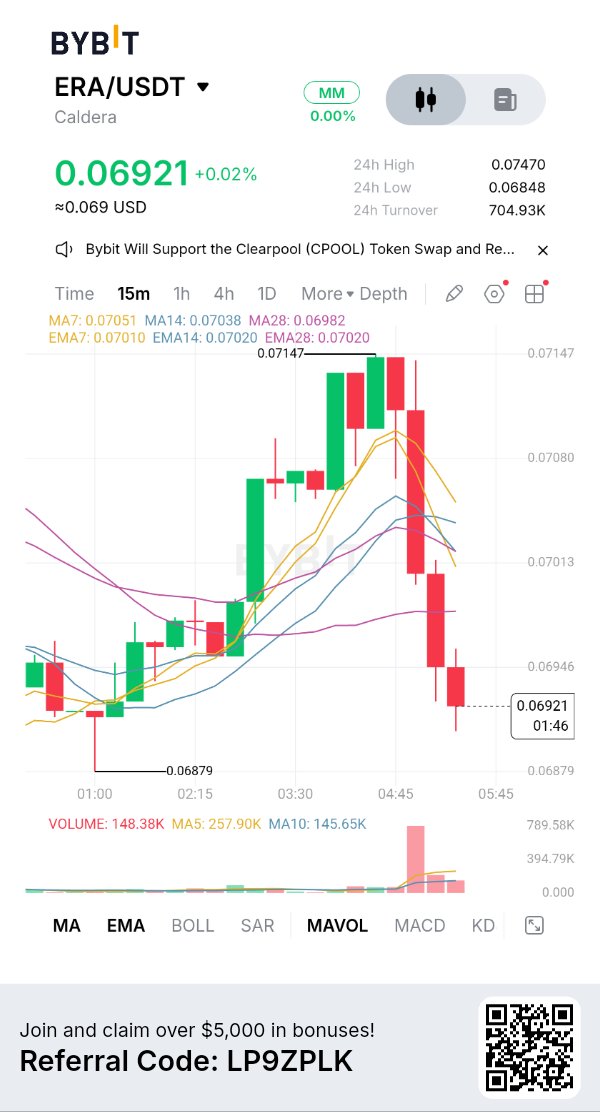
#ByXIMPACT $ERAUSDT ERA The Rollup Thesis Faces a Supply Shock Tomorrow. Caldera’s ERA trades around $0.070, with market cap near $10.4M and FDV around $69.9M. CoinGlass shows a $0.0666–$0.0743 range, down 7.4% over seven days but up 20.8% over 30 days. Structure remains fragile. Caldera targets Ethereum’s rollup fragmentation. Its Rollup Engine lets teams deploy customized chains using OP Stack, Arbitrum Orbit and ZK Stack. The Metalayer is designed to connect them through messaging, intents and cross-chain asset movement. Caldera has reported 60+ rollups, 1.7M unique wallets and $800M TVL. These are ecosystem metrics, not proof every chain generates recurring revenue. The second signal is the gap between adoption and token utility. ERA is intended as the Metalayer’s cross-chain gas asset, staking token and governance instrument. But decentralized relayers, validator staking, shared-liquidity access and fee sinks remain developing mechanisms — not proven sources of continuous ERA demand. More chains do not automatically mean more ERA buying until cross-rollup activity consumes or locks the token. Tomorrow’s unlock is the immediate event. Tokenomics.com lists 26.4M ERA unlocking November 17, worth roughly $1.9M at current prices. That is 2.64% of total supply and 8.4% of market cap. About 50.6% goes to private investors and 23.4% to insiders; the rest goes to community and foundation recipients. Not every unlocked token will be sold, but the scale is material against the 148.5M circulating supply reported by CoinMarketCap and CoinGlass. If all became tradable, it would equal roughly 18% of that float. Watch exchange deposits, not just the calendar. Derivatives show an unusual setup. CoinGlass reports $25.35M futures volume versus $13.04M spot, about 1.9x. Open interest is $11.06M, down 10.5%, while OI exceeds 100% of market cap — leverage is large relative to the reported float. Funding is deeply negative at -0.13% per eight hours; 93% of $116.9K liquidations were longs. Falling price and OI suggest long positions are closing. Negative funding raises squeeze potential, but $1.5M spot net outflow says buyers have not absorbed supply. Trade map: $0.067–$0.0666 is immediate support. Losing it exposes $0.060; reclaiming $0.0744 is the first recovery signal. Confirmation needs spot inflows and stabilizing OI after the unlock. Stance: high-risk; wait for supply absorption. Caldera addresses real rollup fragmentation, but ERA’s value capture is developing and tomorrow’s unlock is large relative to market cap. Watch post-unlock flows, active Metalayer usage and whether staking/fee utility becomes operational. The edge: recurring cross-rollup demand for ERA.
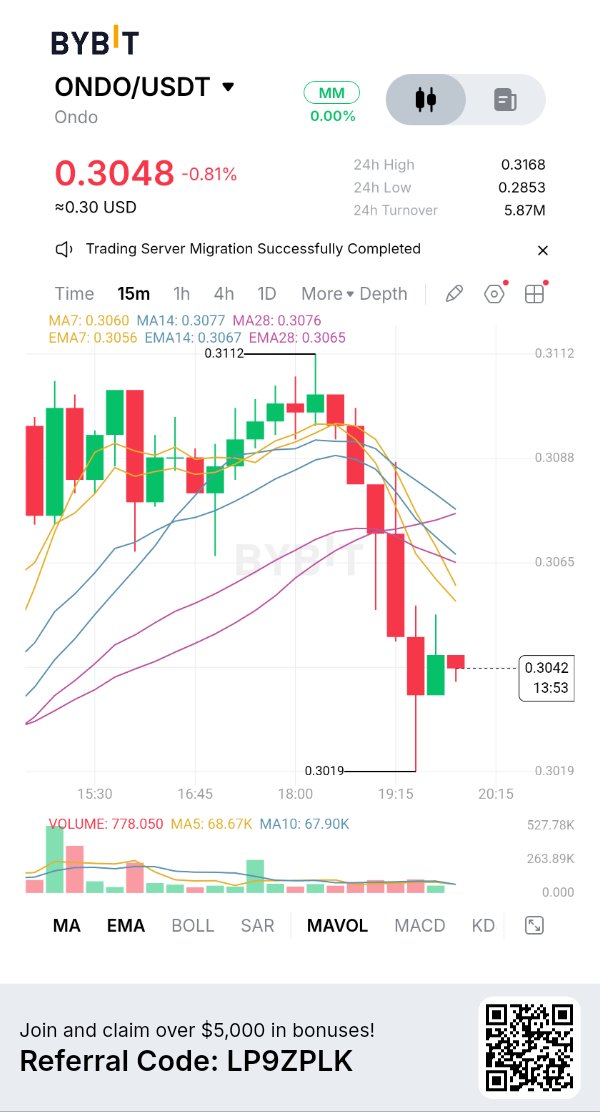
#ByXIMPACT $ONDOUSDT ONDO $4B in Tokenized Assets. The Token Has a Different Problem. ONDO trades near $0.309, down 5.3% in 24 hours and 11.7% over seven days. Market cap is about $1.50B, with 4.87B tokens circulating against a 10B maximum. The daily range is $0.2845–$0.3277. The sell-off comes as Ondo’s business reaches a major milestone. On November 5, Ondo Finance announced more than $4B in tokenized real-world assets across 484 assets and 565,000 holders. RWA.xyz ranked it first among 203 tracked platforms, representing roughly 10% of non-stablecoin tokenized RWA value. Growth now extends beyond Treasuries: Ondo Global Markets gives eligible non-US investors onchain economic exposure to US stocks and ETFs, while Intelligent Portfolios introduced strategies developed for Ondo by BlackRock. But here is the second signal: platform adoption and ONDO demand are not the same thing. ONDO is primarily a governance token for Ondo DAO and Flux Finance. It does not secure Ondo Chain, automatically receive platform revenue, or become necessary simply because more securities are tokenized. Ondo Chain’s validator model uses tokenized real-world assets, not ONDO staking. The business can grow while the token’s direct economic capture remains limited. That is the market’s blind spot. The $4B measures assets tokenized through Ondo products — not ONDO market cap, protocol revenue or value accruing to holders. Until a binding fee-sharing or value-accrual mechanism is approved and implemented, governance remains the token’s clearest utility. Supply is the other major risk. About 48.7% of the 10B supply circulates. DefiLlama lists a major cliff unlock on January 17, 2027: 1.71% of total supply, roughly 35% of today’s circulating float. It includes 792.05M ONDO for ecosystem growth, 660M for protocol development and 258.05M for private sales. Unlocking does not mean every token is sold, but it increases potential supply. Derivatives show a leverage flush. CoinGlass reports $289.9M futures volume against $83.2M spot, around 3.5x. Open interest is $157.3M, down 13.6%; funding is negative at -0.0015%. Liquidations reached $3.99M, with 99% from longs. Spot net flow is negative by $10.1M. This is not clean accumulation: leverage and spot flows are both weakening. Trade map: $0.2845 is immediate support. Losing it risks another leg lower. Reclaiming $0.3277 is the first recovery signal; confirmation needs spot inflows and stabilizing open interest, not just a futures bounce. Stance: constructive on Ondo’s business, cautious on ONDO. The platform is winning distribution, but the token needs a clearer economic link to that growth while a large unlock approaches. The question is how much of Ondo’s success ONDO holders actually capture
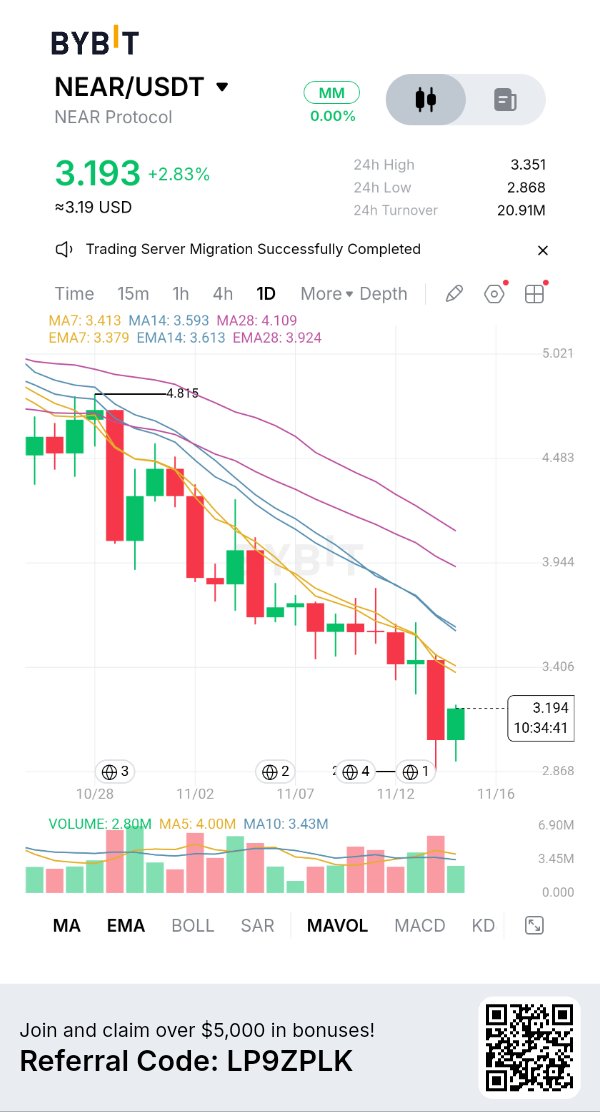
#ByXIMPACT $NEARUSDT NEAR. Buybacks Are Accelerating. Price Is Still Rejecting the Story. NEAR trades near $3.20, down 3.8% in 24 hours. CoinGlass shows a $2.865–$3.351 daily range, a $4.2B market cap and 1.31B circulating tokens. The weekly picture remains weak, with NEAR still around 84% below its $20.42 all-time high. The strongest development is no longer just Intents volume — it is the revenue conversion. NEAR Intents routed about $3.76B over the latest 30 days and generated roughly $8.68M in fees since October 1. Around $2.82M was retained by the protocol; the rest went to solvers and partner applications. Q4 buybacks have reached about $2.7M, already close to Q3’s $3.07M, while cumulative purchases since February are around $8M. That is measurable token demand, not simply a roadmap promise. NEAR Intents also went live inside Talos’ institutional trading workflow on November 9, giving institutional clients access to cross-chain liquidity through an execution system they already use. Confidential Intents TVL is around $130M, up more than 360% in 90 days. But here is the second signal: revenue is growing while price and institutional flows are moving the other way. U.S. spot NEAR ETFs have seen about $10.58M in net outflows since October 27, with no reported inflows after October 26. Buybacks help absorb supply, but they have not been large enough to reverse the broader selling pressure. Tokenomics offer another potential tailwind, but timing matters. House of Stake passed HSP-029 to lower maximum annual issuance from 2.5% to 1.6% over 24 months. It still requires Security Council review, a 90-day grace period and a validator software upgrade. It is approved governance direction, not an already-active 1.6% rate. The proposal estimates 11.8M fewer NEAR issued over two years. Derivatives show a leverage reset. Open interest is $712M, down 7.2% in 24 hours. Futures volume is $1.44B versus $330M spot — about 4.4x. Funding is slightly positive at 0.0013%, while $15.3M in positions were liquidated, 89% longs. Both spot and futures show net outflows over the past week. A single intraday bounce is not enough to call accumulation. Trade map: $2.865 is immediate support; a decisive break would expose fresh downside. Reclaiming $3.351 is the first recovery signal. Stronger confirmation needs sustained spot inflows, falling leverage and buybacks continuing through weakness. Stance: fundamentally improving, technically defensive. NEAR now has real cross-chain volume, retained revenue, institutional distribution and a path to lower issuance. But ETF outflows and weak price action show that the market is not yet rewarding those improvements. The edge is whether buybacks and lower emissions can outlast persistent external selling.
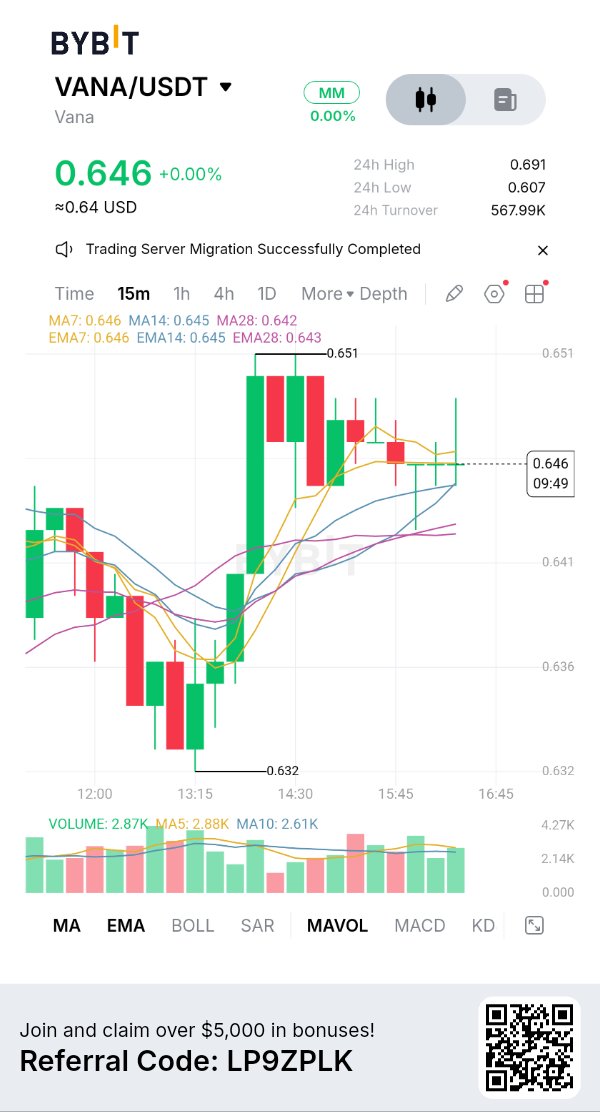
#ByXIMPACT $VANAUSDT VANA The Data Economy Has Real Usage. Token Demand Must Catch Up. VANA trades near $0.639, down 8.4% in 24 hours, 10.9% over seven days and 36.2% in 30 days. Market cap is $19.25M against $76.7M FDV. The daily range is $0.6026–$0.6998. Price is near its recent low as crypto sentiment sits in Extreme Fear. The fundamental story has moved beyond a whitepaper. Vana’s Vega upgrade made data portability a first-class network function: an app requests access, a user grants permission, data moves under that permission, and every read is recorded. The Vana App, launched October 15, sits between personal data sources and apps such as OpenPet, letting users approve requests and revoke access. The live dashboard shows 284 registered applications, 1.09M permission grants, 1.16M personal servers and 8.59M settled scope reads. It reports a 79% re-access rate, suggesting data is being used repeatedly rather than only onboarded once. That is more useful than sign-up totals. Here is the second signal: usage is real, but the economic base is still early. At $0.01 per scope-read, 8.59M cumulative reads imply roughly $85.9K in gross metered fees before other fee sources and allocation. The protocol routes 60% to stakers, 20% to open-market VANA buybacks and burns, and 20% to ecosystem growth. This is clear value capture, but activity must scale substantially before burn can offset annual issuance of roughly 440,700 VANA. The dashboard shows 1.07M VANA actively delegated — just 0.93% of current supply. Supply needs careful reading. CoinGlass estimates 30.08M VANA circulating against a 120M cap, while the official dashboard reports 114.53M current supply. Tradable float and total issued supply are different measures; do not confuse the 25% circulating figure with the amount already issued. Derivatives are not confirming a bottom. Futures volume is $5.54M versus $2.96M spot, about 1.9x. Open interest is $2.54M, down 13.05%; funding is negative at -0.0046%. All $85K in reported liquidations came from longs, and spot net flow is negative by $75K. This looks like long unwinding with weak spot demand, not accumulation. Trade map: $0.6026 is immediate support. Losing it risks a fresh low; reclaiming $0.6998 is the first recovery signal. A stronger reversal needs rising spot volume, positive net flows and growth in paid reads. Stance: cautiously interested, not chasing. Vana has a working permission layer and measurable recurring reads, but the token thesis depends on fee growth becoming meaningful relative to issuance. Watch settled reads, actual burn transactions and staked supply — not app counts alone. The edge is simple: data must be used repeatedly, paid for, and converted into verifiable VANA demand.
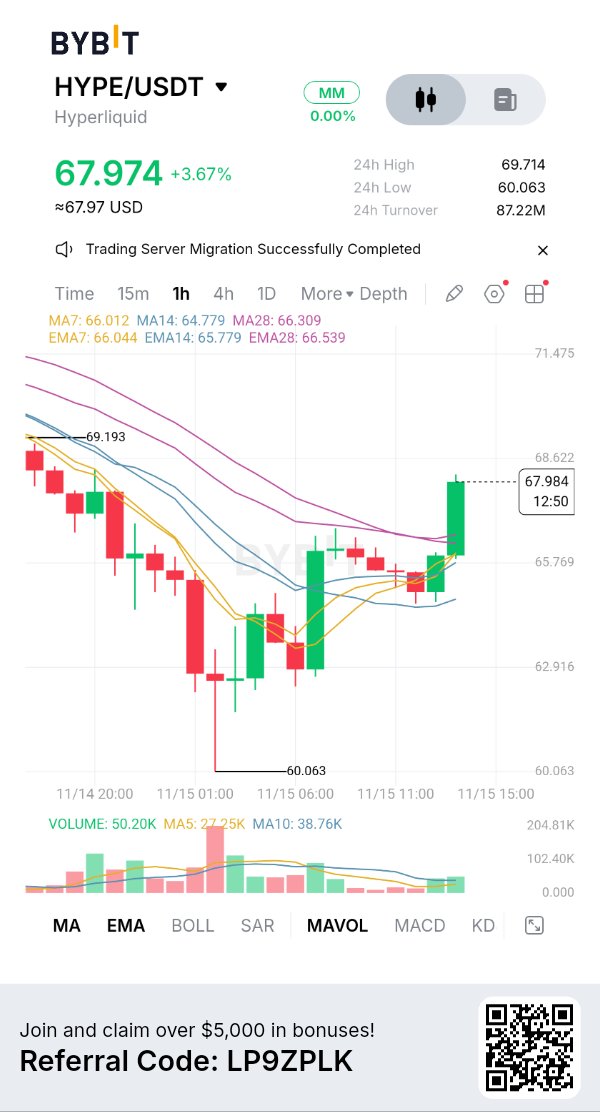
#ByXIMPACT $HYPEUSDT HYPE Revenue Buybacks Are Strong. The December Unlock Is the Test. HYPE trades near $65.2, down 7.8% in 24 hours and 12.4% over seven days. It is 33% below September’s $98 high. The 30-day range is $62.43–$96.35. This is a sharp correction. Hyperliquid’s core advantage is visible in its fee engine. The protocol generated about $76.9M in fees over the latest 30 days: $47.8M from perpetuals, $7.3M from HIP-3 markets, $12.4M from builder fees and $2.5M from spot. HYPE is backed by a working exchange business, not just a governance narrative. The strongest token mechanism is the Assistance Fund. It routes the large majority of protocol revenue into open-market HYPE purchases. The fund holds roughly 48.96M HYPE, accumulated through fee-funded buying. Purchases continued through November 14. This creates a structural bid — but purchases are not burns. Tokens held by the fund remain part of the supply picture, and the buyback pace can change with trading activity. The second signal is the mismatch between buybacks and upcoming supply. The next scheduled contributor unlock is December 6: approximately 9.92M HYPE. That is material, even if not every unlocked token is sold. The market must absorb new tradable supply while protocol purchases compete on the other side. Strong revenue helps, but does not eliminate unlock risk. HIP-3 is another growth vector. It lets builders deploy permissionless perpetual markets with their own collateral and oracle design, expanding beyond crypto-native pairs. It already contributes around $7.3M in monthly fees. The opportunity is broader market access; the risk is that new markets need deep liquidity, reliable oracles and sustained traders to become durable businesses. Positioning is elevated. Hyperliquid’s API snapshot shows $1.33B in 24-hour perpetual volume against about $220M spot, open interest near $667M and hourly funding around 0.00125%. Derivatives dominate, so liquidations can accelerate moves. Staking is substantial: about 438.5M HYPE delegated across 35 validators, roughly 44% of total supply. Trade map: $62.43 is the key 30-day low. Holding it and reclaiming $70 would be the first stabilization signal. A sustained recovery needs spot demand to rise alongside open interest, not just leveraged futures volume. A clean break below $62.43 weakens the structure. Stance: fundamentally constructive, tactically cautious. HYPE has one of DeFi’s clearest fee-to-token purchase mechanisms, but the correction and December unlock create a supply test. Watch net buybacks after unlocks, HIP-3 fee growth and spot participation. The real edge is whether protocol revenue can keep absorbing supply when the market stops rewarding leverage.
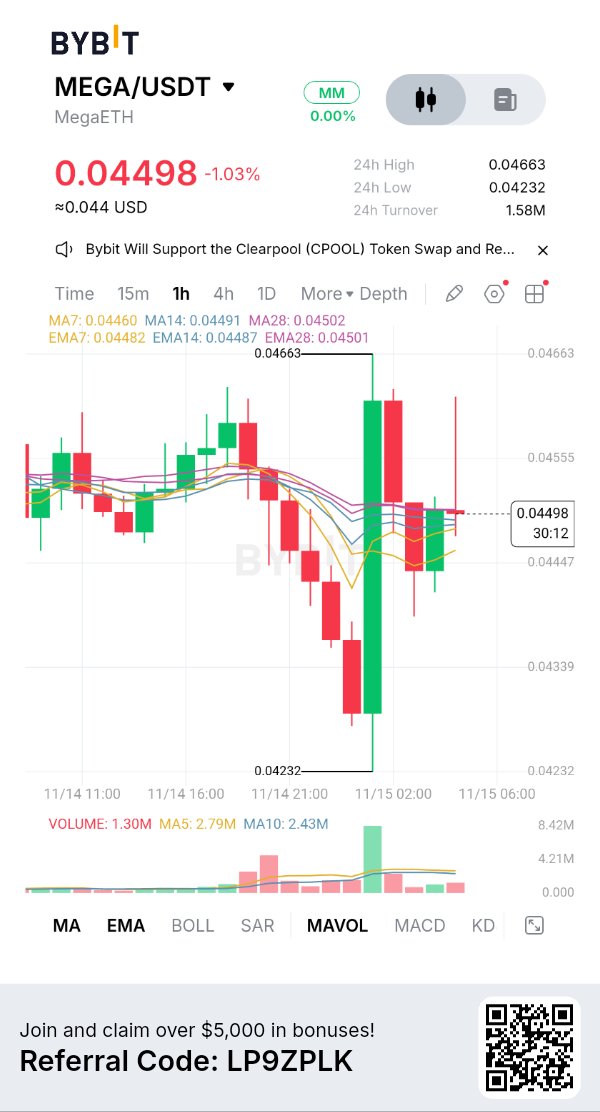
#ByXIMPACT $MEGAUSDT MEGA $30M AI Pivot. A 20% Workforce Cut Changes the Risk. MEGA trades near $0.0451, down 9.8% over seven days. Market cap is $50.9M versus $450.6M FDV. CoinGlass shows a $0.0421–$0.0466 daily range. Only 1.13B of the 10B maximum supply circulates — 11.3%. That is a small float against substantial future supply. On November 10, the former MegaETH Foundation rebranded as MEGA and committed $30M from its treasury to new products, starting with an AI inference marketplace targeted for December. The goal is to make inference providers more interchangeable, letting developers compare prices and access a wider supplier market. New products will run on MegaETH. The second signal is an execution contradiction. On November 13, MEGA confirmed a 20% workforce reduction as it restructures. Cuts affect people who built the L2, wallet and ecosystem, while founders and core engineering remain. A $30M commitment is meaningful, but a smaller team must deliver both the chain and a new AI marketplace. December is a target, not proof of product-market fit. Token value capture is unclear. MEGA says its mandate includes expanding token utility, but has not detailed how inference will require MEGA, how payments settle, or whether revenue reaches holders. The token could benefit if providers stake it, buyers spend it, or fees create recurring demand. Until mechanics are published, AI adoption is a business thesis — not a confirmed token sink. Supply is the other major risk. About 88.7% of maximum supply is not circulating. Earlier plans tied 53.3% of supply to KPI-based staking rewards, released against ecosystem, decentralization, performance and Ethereum milestones. Future float depends on KPI progress and distribution. The $450M FDV is not theoretical dilution. Derivatives add volatility. CoinGlass shows $29.7M open interest, about 58% of market cap, with positive funding at 0.007%. About $75.9K was liquidated in 24 hours, mostly longs. Futures account for only 23.2% of turnover. In a thin-float token, small flows can move price sharply; positive funding while price weakens is not bullish confirmation. Trade map: $0.0421 is immediate support; losing it risks further downside. Reclaiming $0.0466 is the first stabilization signal. A sustained move needs stronger spot participation, not just a futures bounce. Stance: high-risk, wait for execution. The $30M commitment gives MEGA resources and AI direction, but layoffs, unclear token capture and an 11.3% circulating float complicate the thesis. Watch the December launch, payment mechanics, inference volume and unlock disclosures. The edge is not the AI narrative. It is whether the marketplace creates measurable MEGA demand while the team executes with fewer people.
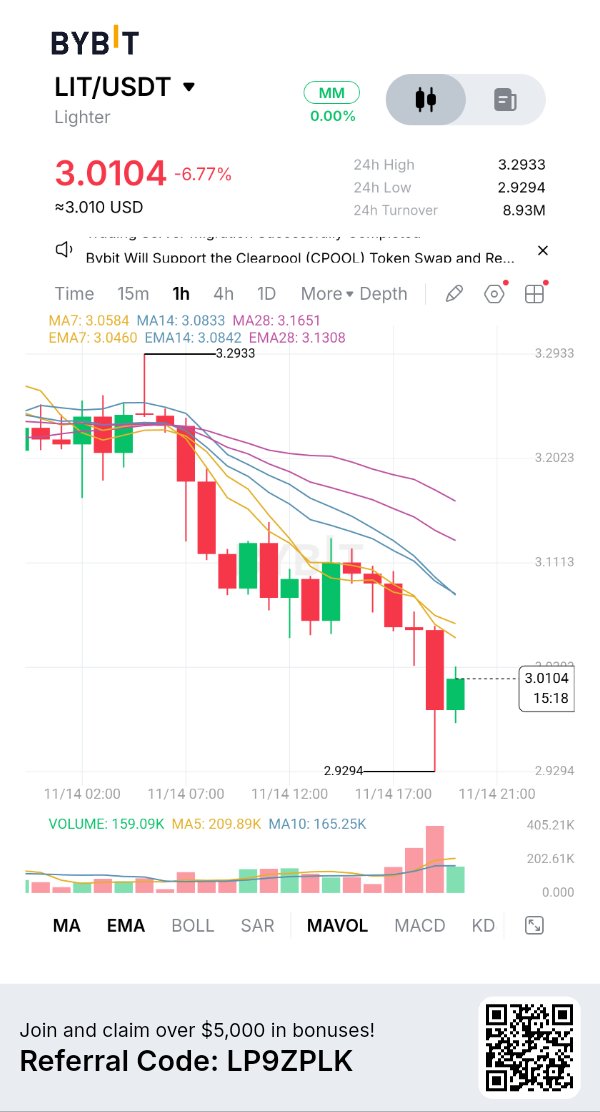
#ByXIMPACT $LITUSDT LIT Buybacks Are Real. Future Supply Is the Bigger Risk. Lighter trades near $3.10, down 3.6% in 24 hours and 6.2% over seven days. Market cap is about $774M, with 250M tokens circulating from a 1B maximum. Price is 44% below its September high of $5.54. Daily range: $3.05–$3.40. Lighter is an Ethereum-based ZK rollup exchange that cryptographically proves matching and liquidations, with proofs verified on Ethereum. It offers zero fees for retail traders and competitive pricing for high-frequency firms. DefiLlama estimates $6.57M in fees and $5.43M in protocol revenue over the latest 30 days. This is measurable commercial activity, not just points-driven volume. The strongest token signal is buybacks. Public tracking records about $4.43M of LIT purchases in the 30 days to November 13, including $172K on November 13. Cumulative purchases are around $34.7M since January. DefiLlama’s Q4-to-date accounts show $5.67M in token-holder net income / buybacks. Revenue is visibly linked to token demand. But buybacks are not burns. Purchased LIT is held by the protocol, treasury or a dedicated fund; it is not automatically destroyed or removed from circulation. This creates recurring demand, but does not reduce the 1B maximum supply. Track actual purchases and wallet balances, not an annualized estimate based on one strong month. Supply is the major overhang. Only 25% of maximum supply circulates, leaving roughly 750M tokens outside the float. Vesting trackers differ: Tokenomics.com lists a January 28, 2027 release of 13.5M LIT to insiders and investors, while DefiLlama shows weekly team and investor vesting beginning December 29, 2026. Exact timing needs official confirmation, but dilution continues. Derivatives add volatility. CoinGlass reports $235M futures volume versus $29.2M spot, about 8x. Open interest is $347M, down 5% in 24 hours and nearly 45% of market cap. Funding is slightly positive at 0.0096%; liquidations reached $424K, mostly longs. Futures dominate price discovery, while falling OI points to long unwinding rather than fresh conviction. Trade map: $3.05 is immediate support; losing it exposes $3.00. Reclaiming $3.40 is the first recovery signal. A sustained move needs spot volume to expand while open interest stabilizes—not another leveraged spike. Stance: cautiously constructive on the business, selective on the token. Lighter has revenue and measurable buybacks, but a 25% float means future supply is substantial. The test is whether recurring purchases can absorb vesting releases through a full market cycle. That is the real supply-demand equation.
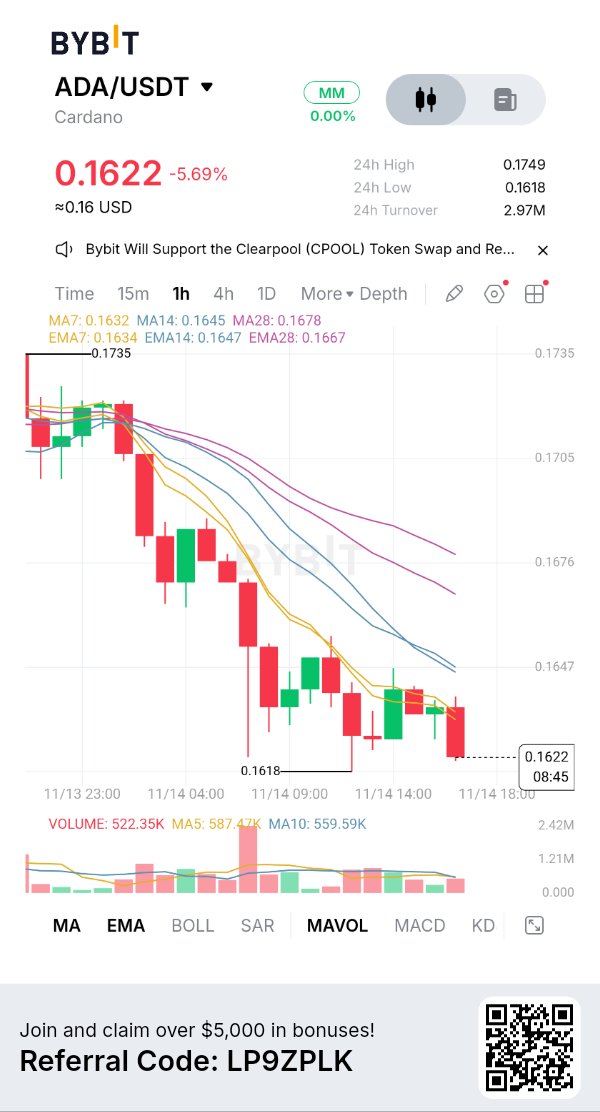
#ByXIMPACT $ADAUSDT ADA Enterprise Progress Is Real. Market Demand Is Still Missing. Cardano trades near $0.1638, down 2.85% in 24 hours and 9.79% over seven days. Market cap is $6.03B; 36.82B of 45B ADA circulate. The daily range is $0.1620–$0.1747. Price is testing the range floor, not confirming a reversal. The strongest update is programmable assets. Cardano Foundation says CIP-0113 went live on mainnet in October. It lets issuers embed transfer rules into native tokens — for example, restricting a tokenized bond to verified investors in approved jurisdictions. CMTA recognized its profile as equivalent to its token framework for certified tokenized shares. The first asset, Veridian shares, has been tokenized under it. The standard is live. Enterprise integrations are moving too. Petrobras is testing Cardano to issue and retire tokens representing verified sustainable aviation fuel certificates. Fireblocks plans to add custody for Cardano native tokens, expected in March 2027. These improve institutional rails, not yet proven capital demand. Here is the second signal: infrastructure is advancing while market liquidity contracts. CoinGlass shows $492M futures volume against $62.9M spot — 7.8x. Open interest is $347.5M, down 5.3%; funding is negative at -0.0059%. Liquidations reached $1.58M, 96% longs. Spot net flow is negative by $2.8M. Longs are being flushed, but spot buyers are not absorbing supply. Negative funding can support a squeeze; it cannot create one without demand. Scaling is a catalyst, but timing matters. The public Dijkstra testnet opened in October. Node 11.2 is a pre-release without Leios and is not recommended for mainnet; Node 11.3 is expected to include Leios. There is no confirmed mainnet activation date; governance approval is still required. Treat throughput gains as a development path, not a live upgrade. Supply is capped at 45B, but 18.2% remains outside circulation. Cardano’s treasury holds roughly 1.4B ADA, so governance and funded projects matter. Trade map: $0.1620 is immediate support. Losing it exposes $0.1604, then $0.1500. Reclaiming $0.1651–$0.1667 is the first stabilization signal; $0.1743 is the next resistance. Recovery needs spot inflows and rising open interest without overheated funding. Stance: constructive on the technology, defensive on the chart. Programmable assets, enterprise pilots and Leios development are meaningful, but derivatives dominate and spot flows remain negative. Watch actual tokenized-asset issuance, stablecoin liquidity, DeFi growth and spot demand. The edge is not another roadmap announcement. It is whether Cardano’s infrastructure attracts capital that stays on-chain.
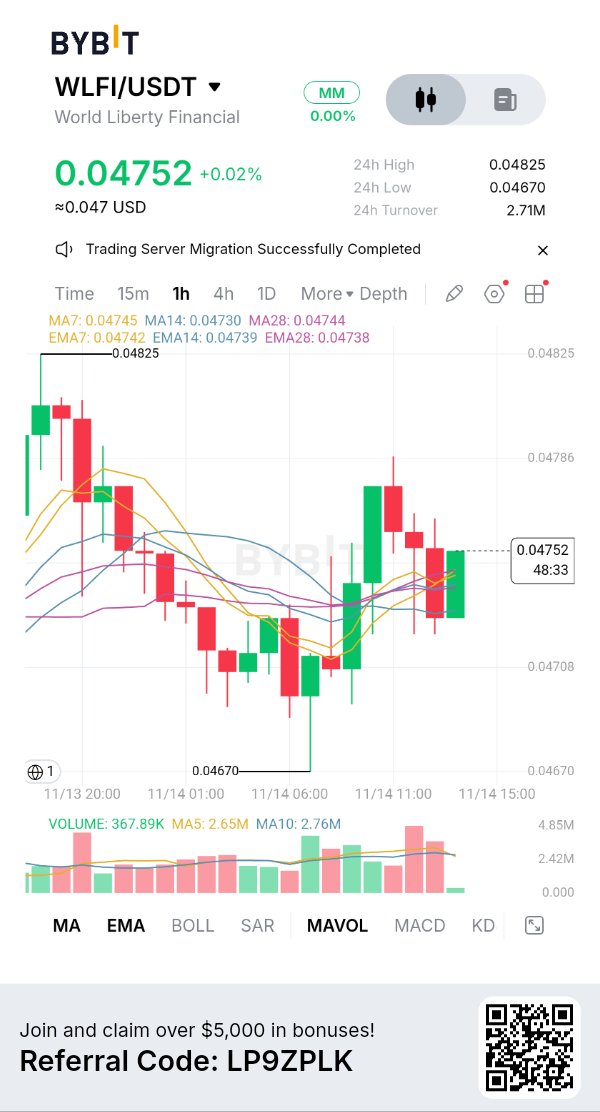
#ByXIMPACT $WLFIUSDT WLFI: Buyback Wallet Is Live. The Missing Number Is Still the Budget. WLFI trades near $0.0472, up 1.7% in 24 hours and 2.3% over seven days. Market cap is approximately $1.5B, with 31.78B tokens circulating against a 100B maximum. The daily range is $0.04655–$0.04826. Price has stabilized slightly, but remains nearly 90% below its $0.46 all-time high. The latest catalyst is the buyback program. On November 9, World Liberty identified Aster as the execution venue and disclosed a BNB Chain wallet for tracking purchases. This adds an actual execution route to the November 6 announcement, which said USD1 reserve fees and other sources could fund ongoing WLFI acquisitions. But here is the second signal: execution transparency is improving while economic commitment remains undefined. No fixed budget, purchase schedule or minimum allocation has been disclosed. World Liberty also acknowledged that a substantial portion of USD1 gross revenue goes to partners and service providers. That means gross stablecoin revenue is not the amount available for buybacks. More importantly, the project has not committed to burning acquired tokens. The current program does not guarantee permanent supply reduction. Tokens could be held in treasury, and their governance impact depends on how they are used. A buyback announcement is not equivalent to a completed burn. USD1 is the underlying business to watch. Its supply is around $3.08B, giving World Liberty a meaningful stablecoin footprint. The project says USD1 is backed by cash, US government money-market funds and cash equivalents, with reserve reporting and redemption support. However, the economic link between USD1 growth and WLFI demand depends on actual reserve income, partner costs and the percentage allocated to purchases. The governance incentive adds another layer. WLFI introduced a $1.25M USD1 staking-reward pool for holders who lock tokens and participate in governance. This can encourage longer holding periods and voting participation, but rewards are incentives — not organic market demand. Watch whether participation remains after rewards end. Market positioning is still crowded. CoinGlass reports $71.6M futures volume against $16.8M spot, roughly 4.3x. Open interest is $287M, around 19% of market cap, placing leverage in a high historical percentile. Funding is positive at 0.0068%, while spot net flow is negative by $262K. Price stability alongside negative spot flow deserves caution. Supply remains the structural overhang: only 31.78% of the 100B maximum is circulating. The remaining allocation is not an immediate unlock, but future distribution and vesting can dilute demand. There is also unresolved legal risk: Justin Sun's dispute with World Liberty over approximately 4B frozen WLFI tokens remains a headline overhang. Trade map: $0.0465 is immediate support; $0.0483 is the first resistance. A sustained break above it with positive spot flows would improve momentum. Losing $0.0465 would weaken the recovery. Stance: cautiously watchful. The buyback wallet is progress, but the market needs verified purchases, disclosed allocation and clarity on token treatment. WLFI's next catalyst is measurable execution not another promise
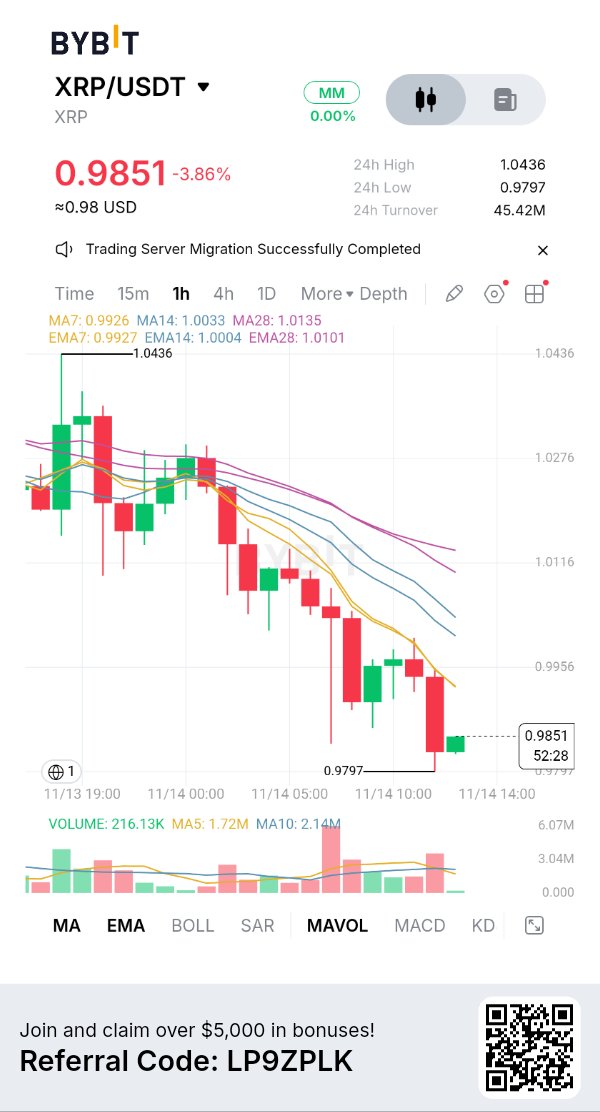
#ByXIMPACT $XRPUSDT XRP Whales Are Accumulating. The Market Is Still Selling. XRP trades near $0.997, down 0.8% in 24 hours and 14.2% over seven days. Market cap is about $63.2B, with 63.52B circulating against the 100B maximum. The daily range is $0.983–$1.043. The $1 level is now the key battleground. XRPL’s institutional stack — Credentials, Permissioned Domains, Permissioned DEX and Token Escrow — is live. Its native PriceOracle amendment is also active, allowing signed price feeds to be published on-ledger. Confidential Transfers, Dynamic MPTs, Batch transactions and permission delegation are still seeking validator approval. These upgrades target regulated tokenization and institutional settlement. But the second signal is the gap between ecosystem growth and XRP demand. LendingProtocol has 22 of the required 29 validator votes; SingleAssetVault has 23. Neither is in the mandatory 14-day activation countdown, so native lending is not live. Even after approval, lending activity will not automatically create proportional XRP demand: deposits may use other assets. The token benefits only if growth drives XRP liquidity, collateral use or transaction demand. There is a counter-signal among holders. Santiment data cited this week shows wallets holding at least 10,000 XRP reaching a 2026 high despite the sell-off. Larger holders may be accumulating weakness. But wallet counts do not reveal cost basis, exchange activity or whether balances belong to independent investors. It is a signal, not proof of a bottom. Derivatives still show sellers in control. CoinGlass reports $2.95B futures volume against $696M spot — about 4.2x. Open interest is $2.21B, slightly lower; funding is negative at -0.0033%. Liquidations reached $13.3M, including $11.4M in longs. Spot net taker flow is also negative, while US spot XRP ETFs lost $1.09M on November 13. Cumulative ETF inflows remain positive, but the latest direction is not supportive. Supply is a constraint: 63.52B XRP circulate, with the remainder released from escrow over time. Escrow releases are not the same as immediate market selling; net distribution and exchange flows matter more than gross unlock headlines. Trade map: $0.983 is immediate support. Losing it risks further downside; reclaiming $1.043 is the first stabilization signal. A sustained move above $1.05 with positive spot flows would strengthen the recovery case. Stance: cautiously defensive. Whale accumulation and institutional upgrades are constructive, but lending is not approved, ETF flows are negative and spot sellers remain active. Watch validator votes, spot demand and whether $1 can become support again. The real test is not whether XRPL adds financial features. It is whether those features create measurable demand for XRP.
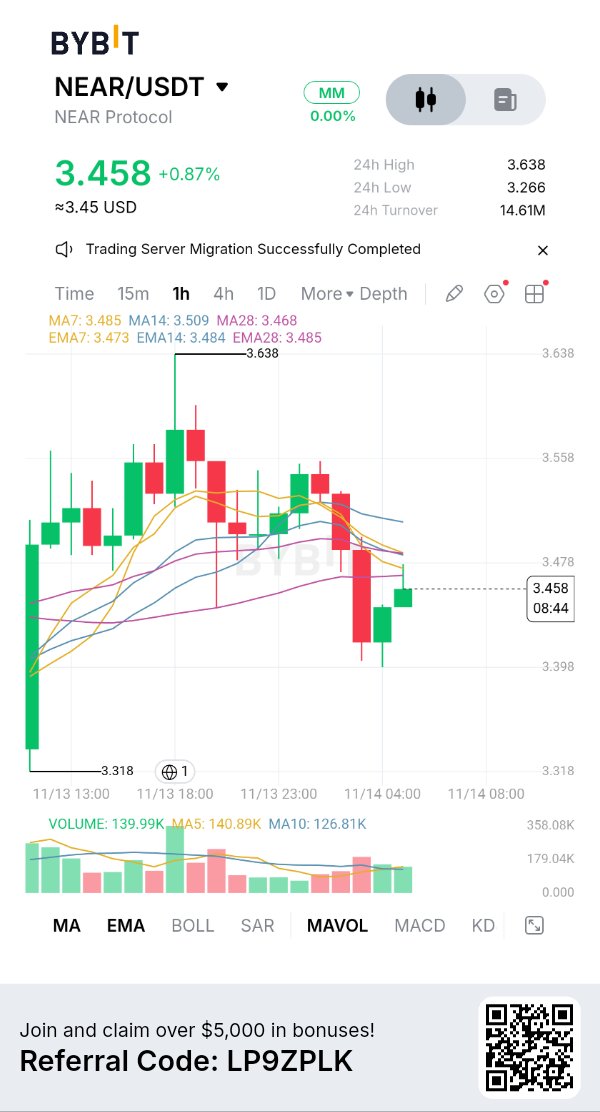
#ByXIMPACT$NEARUSDT NEAR: $3.7B in Monthly Intents. The Token Still Has a Value-Capture Test. NEAR trades near $3.54, up 3.2% in 24 hours but down 4.7% over seven days. Market cap is $4.64B, with 1.312B tokens circulating. The daily range is $3.26–$3.64. A bounce is underway, but weekly structure has not repaired. The strongest fundamental signal is NEAR Intents. It routed $3.77B in cross-chain volume over 30 days, across 26 chains, with $181.9M TVL. November volume reached $1.6B in its first 12 days. Users specify an outcome; solvers execute swaps across networks. This is activity beyond NEAR-native DeFi. Chain Signatures also reached a security milestone. All operations now run inside trusted execution environments, with 17 independent mainnet operators and an 11-of-17 signing threshold. This makes cross-chain signing more verifiable and reduces reliance on a single operator. But here is the second signal: volume is not revenue, and revenue is not automatically token demand. DefiLlama records $5.81M in NEAR Intents fees over 30 days, but only $1.84M as protocol revenue after solver, partner and dApp payouts. That is the figure to monitor for sustainable token value capture. The $3.77B routing headline looks impressive; retained economics are much smaller. Tokenomics are improving, but NEAR is not yet deflationary. Since November 4, 100% of transaction fees are burned instead of 70%, after the gas rebate ended. Yet fees burned only about 1.5% of newly issued NEAR over the past year. Supply still grows under the current 2.5% annual issuance ceiling. The next change is important but not live. House of Stake passed HSP-029 to reduce the ceiling to 1.6% over 24 months. The Security Council veto window runs to November 16; ratification, a 90-day grace period and validator software upgrade are still required. Do not price the full cut as active. Derivatives show heavy positioning: $822M open interest, up 3.7% in 24 hours, with positive funding near 0.0098%. Futures volume is about 8.7 times spot. Rising leverage can amplify either direction. Bitcoin has slipped below $70K, keeping the macro backdrop defensive. Trade map: $3.26 is immediate support. Losing it risks lower levels. Reclaiming $3.64 is the first recovery signal; $3.81 is next resistance. A breakout needs spot volume and retained protocol revenue to improve together. Stance: cautiously constructive on the network, selective on the token. NEAR has meaningful cross-chain usage and stronger security, but retained revenue, fee burns and reduced issuance must outgrow emissions. The edge is not headline Intents volume alone. It is how much economic value NEAR actually keeps.
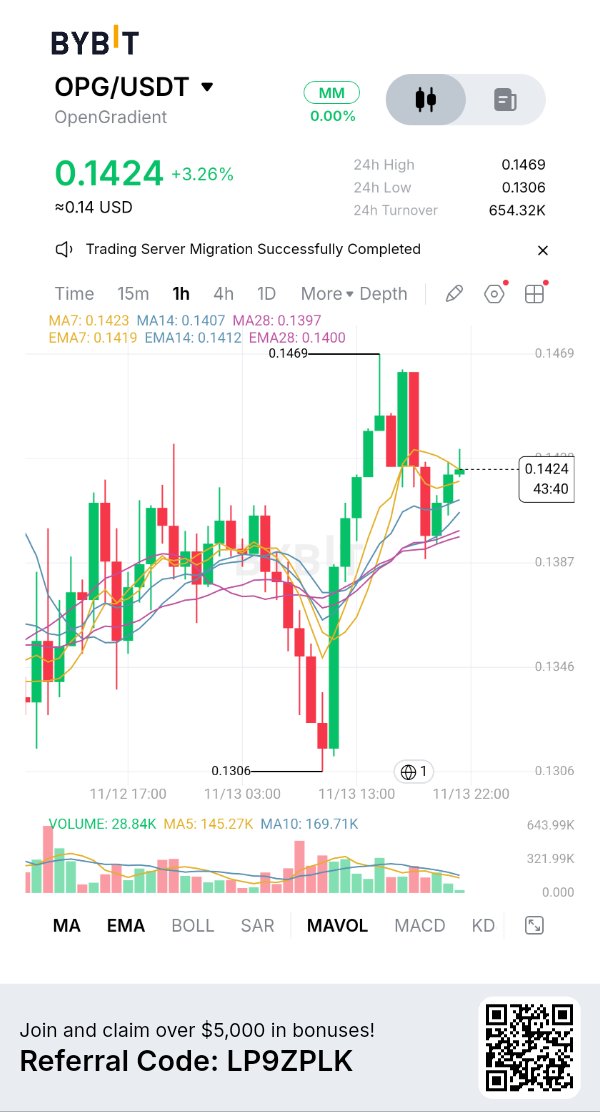
#ByXIMPACT $OPGUSDT OPG AI Inference Is Live. Decentralization Is the Next Proof. OpenGradient’s OPG trades around $0.14, up roughly 18% over seven days. Market cap is near $32–34M against $135–143M FDV. Only 238–240M of the 1B maximum supply is circulating. The rally is notable, but so is the supply overhang. OpenGradient is building verifiable AI infrastructure. Models run through GPU and Trusted Execution Environment (TEE) nodes; the network verifies attestations and settles results. Its Model Hub hosts 4,500+ models on Walrus-backed storage. OPG pays for inference and supports staking, security and governance. LLM payments settle in OPG on Base; execution and proof settlement happen on OpenGradient’s own network. The second signal is the gap between catalog size and operational decentralization. The public explorer lists 4,500+ models but only three active TEE operators, one approved enclave identity, and no displayed settlement or transaction totals. Model count is not proof of distributed compute demand. Operator diversity, verified inference volume and recurring payments matter more. Roadmap status also needs precision. TEE-verified LLM inference and OPG payments are available now. Broader on-chain ML execution, ZKML verification, model scheduling and price feeds remain alpha-testnet or coming-soon features. The full future stack is not yet production-ready. Derivatives add caution. CoinGlass reports $28.4M futures volume versus $6.24M spot, about 4.5x. Open interest is around $16.5M, slightly lower; funding is positive near 0.0103% per eight hours. Liquidations total roughly $32K, mostly longs. Spot net flow is negative by about $256K. The weekly rally is meeting leverage and net selling, not clear spot accumulation. Tokenomics are the structural risk. Only about 24% of the 1B cap circulates, leaving 76% outside circulation. Ecosystem receives 40%, Foundation 15%, contributors 15%, investors/advisors 10%, and staking rewards 10%. Contributor and investor allocations face a 12-month cliff, then 36 months of linear vesting. Other major allocations also release over time. Fixed max supply does not mean low dilution. Trade map: $0.130–$0.132 is immediate support; losing it exposes the $0.114 weekly low. Reclaiming $0.144–$0.145 is the first breakout signal; $0.164 is the next range ceiling. A durable move needs spot inflows and stable OI, not just futures turnover. Stance: interested, but selective. OpenGradient addresses a real AI trust problem and has working payment infrastructure. It still needs to prove distributed operators, sustained inference revenue and demand strong enough to absorb future releases. The edge is not 4,500 models listed. It is how many are used, verified and paid for.
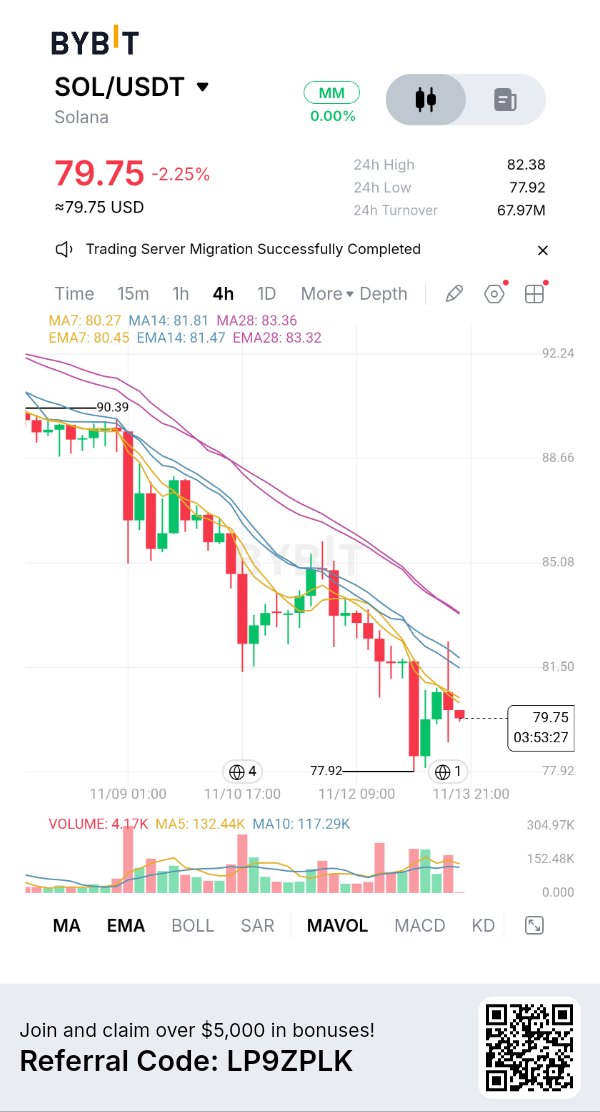
#ByXIMPACT $SOLUSDT SOL Network Growth Is Accelerating. The Market Is Deleveraging. Solana trades near $79.79, down 3.71% in 24 hours and 11.11% over seven days. Market cap is around $47.3B, with 591.5M SOL circulating. The daily range is $77.85–$83.48. Price is testing the lower end of the range as risk appetite deteriorates. Solana’s October ecosystem update reports that Alpenglow went live on mainnet October 21, targeting around 150ms finality. Slot targets were cut to 200ms on October 9. RWA value reached a record $5B, DEX volume hit $60B for October, and stablecoin-holding addresses reached 14M. Samsung announced USDC transfers in Samsung Wallet for eligible US Galaxy users, while Fiserv’s Digital Asset Platform went live with its first deployment. Q3 numbers reinforce the scale: 14.2B non-vote transactions, up 61% year over year; 1,786 average non-vote TPS; $16.3B stablecoin supply in September; and $4.7B in RWA value. Network Real Economic Value reached $97M in Q3, while application revenue rose to roughly $378M. But here is the second signal: activity is growing faster than the quality of demand can be established. Memecoin trading remained a major contributor to the Q3 recovery. High throughput and application revenue are positive, but they do not prove durable fee demand for SOL. The test is whether tokenized assets, payments and stablecoin settlement keep expanding when speculative trading cools. Derivatives show a clear reset. CoinGlass reports $7.29B futures volume versus $806.9M spot — roughly 9x. Open interest is $4.75B, down 8.84%; funding is negative at -0.0061% per 8 hours. Liquidations reached $57.8M, with 96% from longs. This is leveraged long exposure being forced out. Negative funding can support a squeeze, but it is not a buy signal without spot buyers. ETF demand is mixed. US spot SOL ETFs saw a partial $1.7M inflow on November 12, after outflows of $5.9M and $13.4M on November 11 and 10. Cumulative net flows remain negative at $121.9M. One positive session does not reverse that trend. Trade map: $77.85 is immediate support; reclaiming $83.48 is the first recovery signal. Until price holds above the range with rising spot volume and stabilizing open interest, rallies remain vulnerable. Stance: cautious on price, constructive on infrastructure. Alpenglow, tokenized assets and payment integrations strengthen Solana’s long-term case. But leverage is unwinding, ETF flows are still net negative and speculative activity remains a meaningful driver. Watch sustained spot demand and real-world settlement growth. The edge is not how many transactions Solana can process. It is whether those transactions create durable economic demand for SOL.
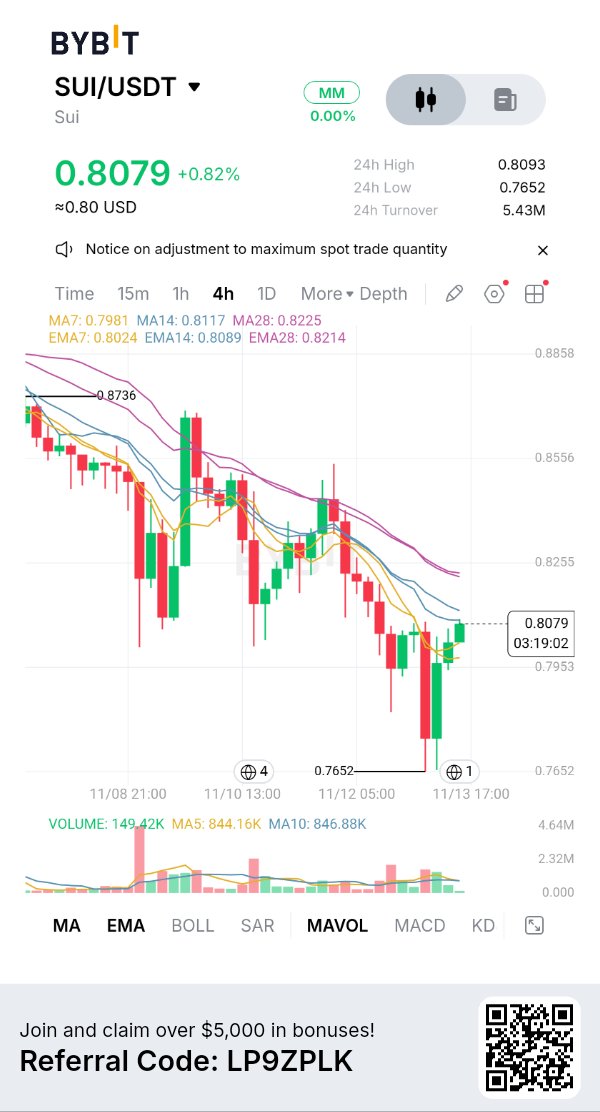
#ByXIMPACT $SUIUSDT SUI: Stablecoin Growth Is Real. User Retention Is the Test. SUI trades near $0.80, down 1.5% in 24 hours and 8% over seven days. Market cap is $3.3B; 4.14B of 10B tokens circulate. The daily range is $0.764–$0.819. Price remains weak despite improving stablecoin liquidity, and SUI is still 85% below its $5.35 peak. Trend repair remains substantial. DefiLlama puts Sui stablecoin supply at $537.8M, up 6.05% in seven days and 10.34% over 30 days. USDC represents 68.5%. Dollar liquidity is building. Hashi is another catalyst. Sui announced over $500M in capital commitments for its Bitcoin-finance infrastructure, with Anchorage Digital. Hashi is designed to keep BTC on Bitcoin while hBTC represents collateral on Sui for DeFi. Commitments are not deposits. A November 2 investigation still found the official Hashi page describing testnet, with no confirmed mainnet launch post. Verify deployment before pricing in the $500M headline. The second signal: liquidity is growing while user retention looks weaker. Suiet wallet is shutting down, with API support ending November 14. Its team says user assets remain onchain and can be restored elsewhere; this is not a protocol exploit. But the closure follows other ecosystem exits. Cointelegraph cited average daily active users near 128K in October, down from 601K in November 2025, even as October transactions rose to 324M from 101M. More transactions, fewer users: automated or concentrated activity may be lifting throughput without broadening adoption. That gap matters. DefiLlama shows $412M DeFi TVL, down 3.26% in 24 hours, $22.1M daily DEX volume and just $2,738 in chain fees. Stablecoin growth has not yet translated into strong protocol revenue. Derivatives remain fragile. CoinGlass records $581M futures volume versus $105M spot, about 5.5x. Open interest is $481M, down 0.8%; funding is negative at -0.0026%. Liquidations reached $4.16M, 97% longs, while spot net flow is negative by $7.4M. Leverage is being flushed; spot accumulation is absent. Supply is the overhang: only 41.4% of the 10B maximum is circulating. Unlock trackers show further vesting in early December, but event totals differ; avoid treating one tracker estimate as definitive. Trade map: $0.764 is immediate support. Losing it risks $0.75; reclaiming $0.819 is the first recovery signal. Confirmation needs spot inflows, rising TVL and sustained user activity. Stance: cautiously watchful. Stablecoin liquidity and Bitcoin finance are promising, but weaker users, low fees and supply releases complicate the bull case. The next proof is deployed BTC, repeat users and fee-generating activity — not another capital-commitment headline.
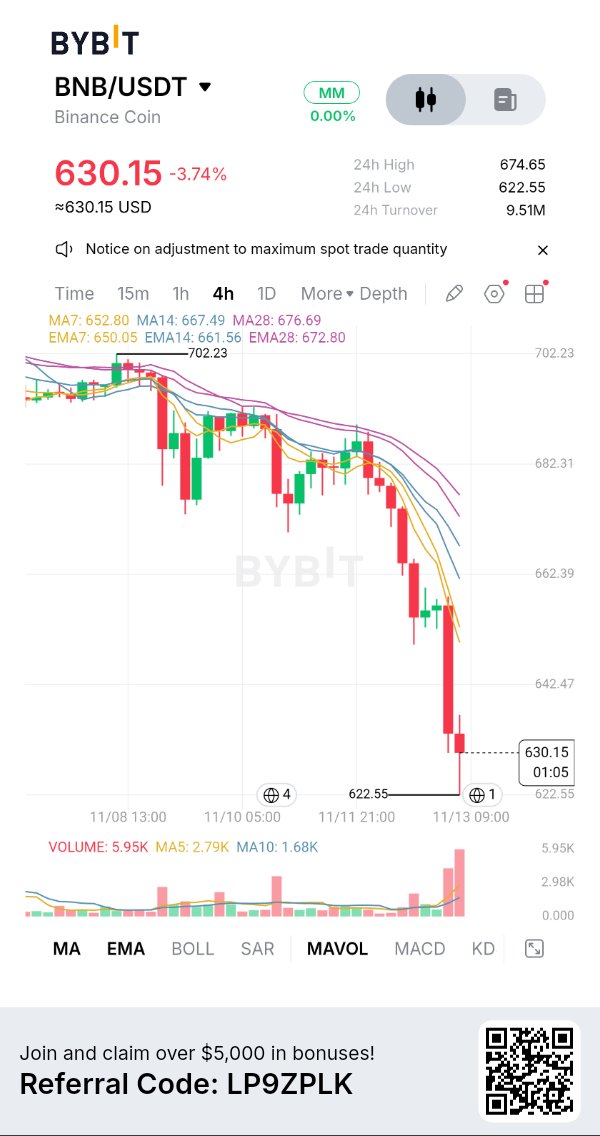
#ByXIMPACT $BNBUSDT BNB: December’s Upgrade Is Coming. The Market Is Still Selling. BNB trades near $635, down 5.9% in 24 hours and 8.4% over seven days. Market cap is about $83.1B, with 131.51M circulating against a 132M maximum. The daily range is $630.27–$676.44; RSI is near 28. The next catalyst is Jenner. The hard fork is scheduled, not live; deployment is still ahead. BNB Chain’s v1.8.2 sets the BSC mainnet hard fork for December 8 at 02:30 UTC. BEP-702 introduces CAS20, a compliant asset standard for tokenized assets and stablecoins. BEP-703 reserves 5% of block gas by default for eligible BNB transfers and approved payment contracts, preserving payment capacity during congestion. These are meaningful rails for regulated issuance and payments. But the second signal is security execution. On November 6, BSC-Reth released v0.1.4-hotfix after an upstream Reth bug was found that could produce an incorrect state root under specific legacy-path conditions. Operators must upgrade and restart; no database migration or hard fork is needed. BNB Chain said impact on BSC-Reth was limited and opBNB does not use op-reth. Ordinary users need take no action. This was a client correctness issue, not evidence of stolen funds — but it puts client diversity, patch discipline and state verification in focus ahead of Jenner. Supply mechanics remain a long-term positive. The 37th quarterly Auto-Burn on October 19 removed 1,646,196.44 BNB, leaving 131.512M. Auto-Burn aims to reduce supply toward 100M, while BEP-95 burns part of BSC gas fees continuously. Both mechanisms are auditable and separate from Binance exchange operations. But shrinking supply cannot guarantee a rising price when marginal demand weakens. Derivatives show pressure. CoinGlass reports $978M futures volume versus $147M spot — around 6.7x. Open interest is $1.04B, down 5.83%; funding is mildly positive at 0.0026%. Liquidations reached $11.51M, with $11.39M from longs. This is long-side deleveraging, not a convincing short-squeeze setup. Spot participation remains comparatively thin. Trade map: $630 is immediate support; $622 is the next downside reference. Reclaiming $658 is the first stabilization signal; $676 is the next resistance. A sustained break above that range with rising spot volume would improve the recovery case. Losing $622 keeps downside risk active. Stance: structurally constructive, tactically defensive. BNB has a transparent burn model and a relevant December upgrade, but the market is pricing risk and weak demand. Watch hotfix adoption, Jenner readiness, real CAS20/payment deployments and spot inflows. The edge is not the burn headline. It is whether new rails create sustained activity and BNB demand.
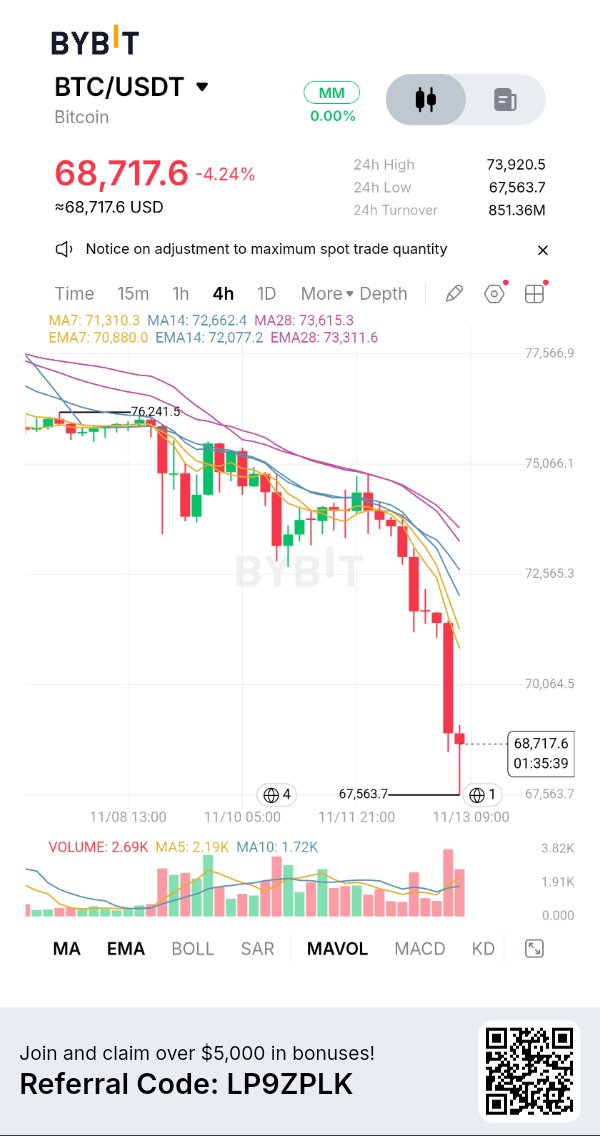
#ByXIMPACT $BTCUSDT BITCOIN The $70K Test Is Now About Demand, Not Just Liquidations BTC is near $68,194, down 7.24% in 24 hours. CoinGlass records a $67,449–$73,708 daily range, $1.37T market cap and 20.11M BTC circulating against the 21M cap. Price is now 46% below its $126,198 all-time high. This is a sharp risk-off move, not an ordinary dip. The immediate trigger is a macro and liquidity squeeze. October US CPI rose 0.4% month over month, above the 0.3% forecast. Markets raised the probability of a December Fed rate hike to around 90%. At the same time, US spot Bitcoin ETFs have recorded consecutive outflows; Tuesday’s withdrawal was $95M, extending the streak to four sessions. Bitcoin failed to participate in the equity rebound. The failed $73K reclaim left the market exposed when sellers returned, turning a former pivot into overhead supply. The second signal is more important than the liquidation headline: both spot and futures are selling. CoinGlass shows $93.2B futures volume against $8.06B spot — roughly 11.6x. Open interest has fallen 7.11% to $47.51B, while 24-hour liquidations reached $901.7M, with 97% from longs. But spot net outflow is also $435.5M, and seven-day spot flow remains negative. This is not simply leveraged longs being washed out; aggressive spot sellers are overwhelming buyers. That distinction changes the recovery test. A liquidation flush can produce a violent bounce, but durable recovery needs spot buyers to absorb supply and ETF flows to turn positive. CoinGlass shows ETF net outflow of $47.7M for November 12 (partial), not a return of institutional demand. Supply remains Bitcoin’s structural advantage: 20.11M coins are already circulating, with issuance constrained by the 21M hard cap. But scarcity does not create a floor when marginal demand contracts. With stablecoin liquidity also weakening — USDT market cap reportedly down $6.6B over 60 days — the market has less fresh purchasing power available. Technical map: $67,449 is immediate support. A clean break exposes the $65K area, with no confirmed floor below it. Reclaiming $70K is the first stabilization signal; $72K–$73.2K is the key recovery band, with the 200-day average near $73.2K. The 365-day average near $76.4K is a much higher trend-repair level. Until BTC reclaims $73.2K, rallies remain vulnerable. Stance: defensive, not permanently bearish. Extreme Fear at 21 and heavy long liquidations can set up a squeeze, but the spot-flow data has not confirmed a bottom. Watch ETF flows, spot net buying and whether price can hold $67.4K before treating a bounce as a trend change. Bitcoin’s scarcity is unchanged. The market is repricing the availability of buyers.
#ByXIMPACT $AAVEUSDT AAVE Lending Growth Is Real. Risk Controls Are Being Tested. AAVE trades near $113.6, down 7.4% in 24 hours and 11.4% over seven days. Market cap is $1.76B, with 15.44M of 16M tokens circulating. The $110.60 daily low is immediate support. This is a sharp pullback, not a reversal. Aave V4’s Base Equities Hub has reached $25M in deposits, enabling loans against tokenized U.S. stocks using USDC. The market is isolated from other pools, limiting cross-market contagion. This brings traditional collateral into DeFi — but $25M is deposits, not outstanding loans or protocol revenue. The second signal is risk discipline. After the October 29 Binance hot-wallet exploit, Aave temporarily froze reserves across V3 and V4 while attacker wallets were monitored. One related Aave position supplied $60M USDT and borrowed about $43.8M WETH; risk advisers said it remained overcollateralized and did not threaten suppliers. The response shows fast containment, but broad freezes also disrupt liquidity and market access. Risk work continues. LlamaRisk’s November 10 proposal would reposition V3 Core around liquid blue-chip collateral, with rsETH, osETH, LBTC, tBTC and rETH under review. It cites $1.33B collateral backing $1.03B debt. This is a forum proposal, not an approved freeze or liquidation. Threshold’s tBTC bridge has resumed, but Aave’s tBTC reserve remains restricted pending review. Controls protect lenders, yet can constrain utilization. Token value capture is meaningful. Aave’s DAO buyback program has a $50M annual budget. Acquired AAVE goes to the Ecosystem Reserve for governance-approved uses; it is not automatically burned. The April “Aave Will Win” vote directed 100% of revenue from Aave-branded products to the DAO. Track realized revenue and actual purchases, not just the budget. Derivatives show stress: CoinGlass reports $389M futures volume versus $69.7M spot, about 5.6x. Open interest is $289M, down 6.8%; funding is slightly negative and liquidations reached $1.7M, 99% longs. Spot and futures both show net taker selling. This is deleveraging, not confirmed accumulation. BTC near $73.4K and broad risk aversion add pressure. Trade map: $110.60 is immediate support. Losing it risks further downside; reclaiming $120.99–$122.79 is the first stabilization signal. Until then, rallies may remain corrective. Stance: constructive on Aave’s franchise, defensive on AAVE price. New collateral markets and DAO revenue alignment are positives, but risk events and falling open interest dominate the tape. Watch for spot buyers to return as restrictions ease. Aave’s edge is risk management at scale. The next move depends on converting growth into durable revenue and token demand.
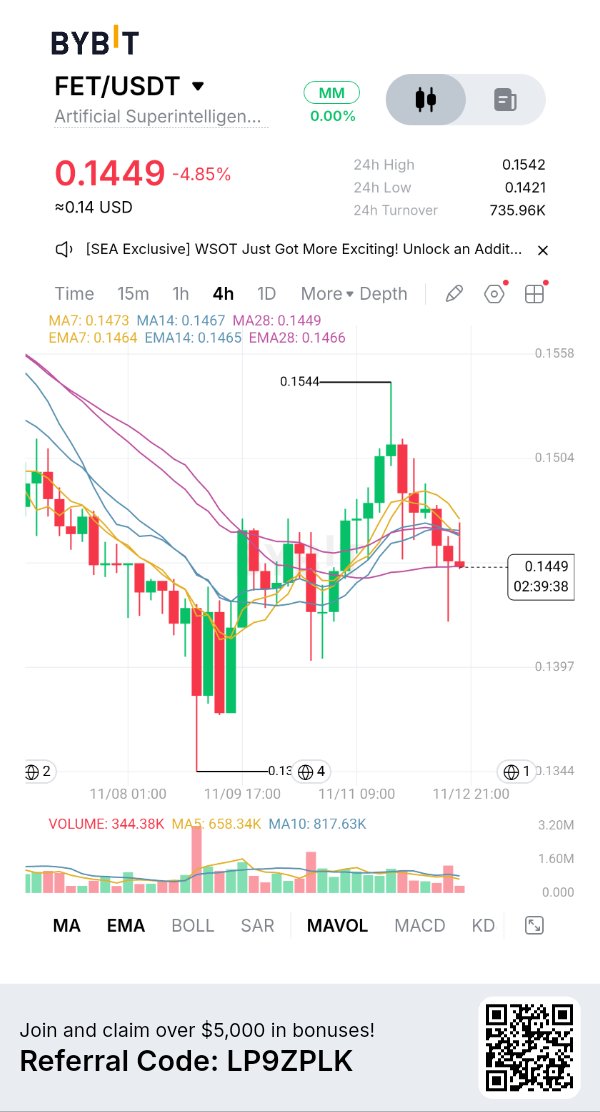
#ByXIMPACT $FETUSDT FET AI Progress Meets a $1.56M Security Setback FET trades near $0.1478, down 0.27% in 24 hours, with a $358.7M market cap. CoinGlass shows a $0.1451–$0.1543 daily range and a 3.38% weekly gain. The rebound is holding, but a fresh security issue changes the risk picture. The ASI Alliance is still shipping. Its latest update reports larger ASI:Chain bridge tests, stronger node-data checks and completed QA for the redesigned Web Wallet and Wallet SDK. Singularity Compute released Super Decider, an open-source model on ASI:Cloud, while Omega adds tool use and memory transfer. These are engineering milestones, not proof of scaled commercial demand. The immediate issue is security. The Alliance disclosed an exploit involving the FET migration converter and bridge architecture. An unauthorized party withdrew approximately $1.56M in FET from the converter. The team says treasury, exchange wallets and FET held in personal wallets or on exchanges were unaffected. An investigation is ongoing, with a full report promised. This is not a reported compromise of every holder’s wallet, but it is a serious migration-infrastructure failure. The second signal: product development and token confidence are diverging. ASI:Chain bridge testing is expanding, while the migration/bridge architecture has suffered an exploit. Until the post-mortem explains the attack path and remediation, judge bridge progress by security evidence — not roadmap headlines. Derivatives remain active relative to spot. CoinGlass records $76.36M futures volume versus $13.46M spot, a 5.7x gap. Open interest is $68.91M, up 0.67%; funding is positive at 0.0055% per 8 hours. Liquidations reached $87.5K, including $52.95K in longs. Leverage remains present, but funding is not extreme. Supply data is inconsistent. CoinGlass reports 2.43B circulating against a 3B maximum. Tokenomist lists 2.312B circulating, 2.714B total and 2.709B max, with 81.65% unlocked. Its next listed release is November 28 to the AGIX migration allocation. Verify supply before relying on FDV or dilution estimates. Bitcoin is near $73.7K, down 8.6% over seven days; sentiment remains in Fear. Trade map: $0.1451 is immediate support; $0.1350 is the seven-day low. Reclaiming $0.1543 improves structure; $0.1576 is the range ceiling. Losing $0.1451 puts the weekly low back in focus. A bounce alone is not a reversal. Stance: cautious until the bridge incident is explained. The AI stack is progressing, but security credibility is now the gating factor. Watch the post-mortem, verified fixes, spot volume and whether price holds support without futures doing all the work. The question is whether ASI can secure what it has built.
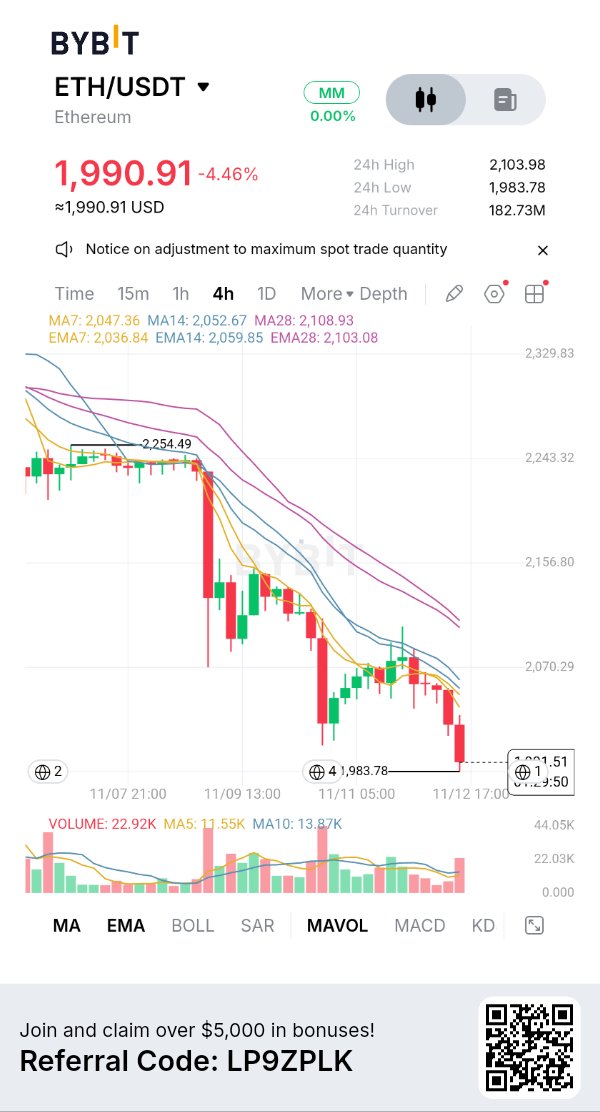
#ByXIMPACT $ETHUSDT ETH Network Adoption Is Growing. ETH Scarcity Is Not. ETH trades near $2,046, down 0.5% in 24 hours and 8.4% over seven days. Market cap is around $250B, with a daily range of $2,035–$2,104. Price is near the lows; no confirmed reversal yet. The fundamental story is stronger. Ethereum mainnet averaged 2.17M daily transactions from January to October 2026, up 54% year over year. Stablecoin transfers reached $25.8T, up 61%, while median fees averaged just 3.5 cents. Ethereum and its L2s together averaged around 25M transactions daily. This is a settlement network expanding reach while keeping usage cheap. Security participation is rising: 44.2M ETH was staked by October 31, equal to 36.1% of circulating supply, versus 27.6% a year earlier. More capital is committed to securing the chain. But here is the second signal: cheap usage is not creating meaningful scarcity yet. Over the latest 30 days, Ethereum issued 89,682 ETH and burned only 2,925. Net issuance was 86,758 ETH (+0.07%); burn offset just 3.26% of issuance. The network can win adoption while ETH supply expands. More transactions are not automatically bullish if fees remain too low to generate significant burn. Institutional access is broadening. 24X and Standard Chartered expanded prime-brokerage access to Ether, with Cumberland DRW and Wintermute among liquidity providers. Yet flows remain weak: US spot ETH ETFs recorded a $144.8M net outflow on November 11. Derivatives show deleveraging is not finished. CoinGlass reports $26.6B futures volume against $1.76B spot — about 15x. Open interest is $24.99B, down 1.89%; funding is slightly positive at 0.004%. Liquidations reached $38.8M, including $21.2M in longs. Futures dominate activity while spot confirmation remains weak. Roadmap risk: Ethereum Foundation says Glamsterdam testing uncovered compatibility issues involving EIP-8037 and EIP-8038. Hoodi testnet activation has been postponed with no replacement date. This is a development delay, not evidence of protocol failure. Trade map: $2,035 is immediate support; the seven-day low near $2,010 is the next downside reference. Reclaiming $2,104 is the first improvement; $2,200 is the next psychological test. A break below $2,010 keeps downside risk active. Do not treat oversold readings as a standalone buy signal. Stance: structurally constructive, tactically defensive. Ethereum is attracting stablecoin activity and staking capital, but current supply data says ETH is inflationary, not deflationary. Watch fee burn, spot inflows and a clean resistance reclaim before calling a bottom. The question is no longer whether Ethereum is being used. It is whether that usage creates enough economic demand to accrue value to ETH.
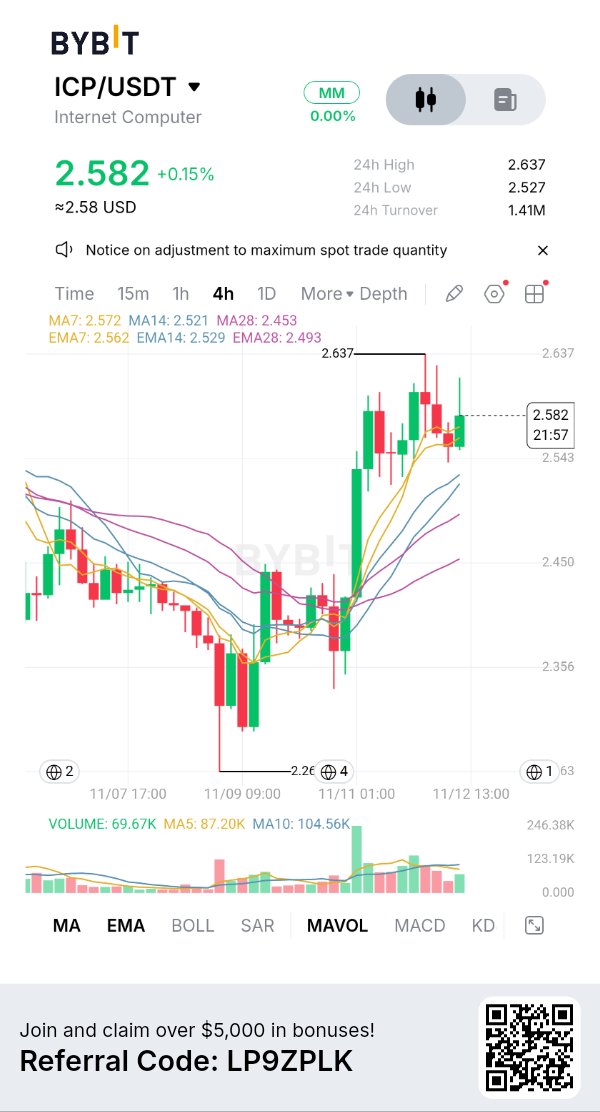
#ByXIMPACT $ICPUSDT ICP Cloud Engines Are the Catalyst. Spot Demand Is the Test. Internet Computer trades near $2.56, up 0.4% in 24 hours and 7% over seven days. The rebound from November’s $2.27 low is real, but ICP remains 18% lower over 30 days. At a $1.43B market cap, this is recovery — not a confirmed trend reversal. The fresh catalyst is Cloud Engines. DFINITY founder Dominic Williams confirmed commercial release this week, with early-access passes going to enterprise developers. Organizations can configure private subnets from selected compute nodes, choosing providers, geography and jurisdiction. It is a direct pitch for sovereign cloud workloads and data-localized applications. Two more adoption signals: Caffeine added European Cloud and Encrypted Cloud deployment options for AI-built apps. DFINITY’s Claude connector lets users discover canisters, query on-chain data and perform approved app actions through natural-language prompts. ICP is pushing beyond crypto-native distribution. Here is the second signal: product capability is advancing faster than proof of paid demand. Early access is not evidence of enterprise contracts, recurring revenue or meaningful compute consumption. The key question is whether organizations deploy workloads and pay for compute — creating demand for ICP-converted cycles. That link is central to ICP tokenomics. ICP is burned to mint cycles, whose cost is pegged to the XDR basket, keeping developer costs stable. More compute usage can increase ICP burn. But supply also expands through neuron reward spawning and node-provider rewards. Net supply depends on cycle consumption versus new issuance. Adoption headlines alone do not prove deflation. Derivatives show activity, not clear spot leadership. CoinGlass records $77.7M futures volume against $14.1M spot — about 5.5x. Open interest is $81.4M, up less than 1%; funding is mildly positive at 0.0062%. Liquidations are balanced, but spot net flow is negative by $46K. Futures are doing far more trading than spot. Technical map: $2.51 is immediate support; $2.27 is the key November low. $2.56 is the first reclaim level, while $2.68–$2.71 is major resistance where daily moving averages converge. A daily close above $2.71 improves the reversal case and opens $3.00. Losing $2.27 risks $2.00. Stance: cautiously constructive, no chase. ICP is building a credible decentralized cloud and agentic-computing stack, but the token needs proof that paid workloads create sustained cycles demand and outpace issuance. Watch deployments, cycle burn and spot inflows — not launch announcements. The real catalyst is measurable compute consumption. If Cloud Engines become a business, ICP’s token economics should show it.