IBADURRAHMAN
7464Лайк0Акциялар170Жанкүйерлер10Жазылу
Market Analysis, Content Strategy, Content Writing,
Market Analysis, Content Strategy, Content Writing,
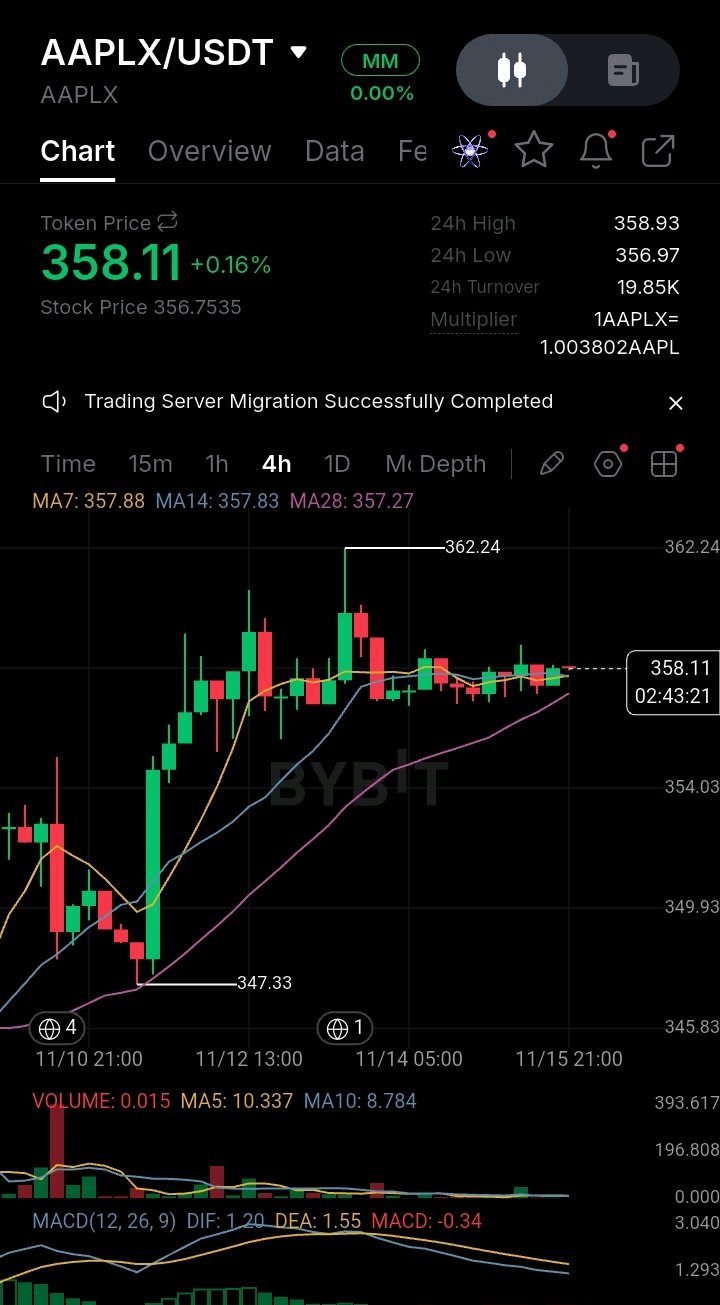
🔍 Market Analysis: $AAPLXUSDT | Apple Holds Above Key Moving Averages as Buyers Defend Consolidation (4H Chart) AAPLX is maintaining a relatively stable structure around $358.11 following a strong recovery from the $347.33 region, with buyers continuing to defend the recent consolidation. The token is currently trading at $358.11, up 0.16% over 24 hours. Although price remains below the recent $362.24 high, its position above all three moving averages suggests that the broader recovery structure remains constructive. Technical Analysis: The 4H structure remains cautiously bullish, with price trading above all three moving averages: MA7: $357.88 MA14: $357.83 MA28: $357.27 The moving averages maintain a bullish arrangement, with MA7 slightly above MA14 and both positioned above MA28. This suggests that buyers retain a slight advantage, although the relatively narrow separation between the averages indicates consolidation rather than strong directional momentum. MACD shows weakening bullish momentum. DIF stands at 1.20 against DEA at 1.55, with a histogram of -0.34. DIF remains below DEA, indicating that immediate bullish momentum has weakened. However, both lines remain above zero, suggesting that the broader recovery structure has not yet turned decisively bearish. Current volume is 0.015, significantly below MA5 of 10.337 and MA10 of 8.784. This suggests limited trading participation during the latest consolidation, with buyers yet to demonstrate strong volume confirmation. Fundamental & News: Apple reported strong fiscal Q4 2026 financial results, with quarterly revenue reaching $114.5 billion, representing 12% year-over-year growth. Diluted earnings per share increased 14% to $2.10, while Services revenue reached a new all-time high. Additionally, Apple launched its new HomeView smart-home device on November 13, priced at $299. The device combines a 7-inch display, smart-home management and Apple Intelligence with Siri AI. These developments highlight continued strength in Apple's hardware and services businesses, alongside its expansion into AI-powered consumer products. This provides constructive fundamental support, although the current technical structure still requires stronger buying participation before another bullish breakout can be confirmed. Market Outlook: Bullish: Holding $356.97 and breaking above $358.93 with stronger volume could open a recovery toward $362.24. Bearish: A confirmed 4H breakdown below $356.97 could weaken the current consolidation structure and expose further downside. Invalidation: A sustained 4H breakdown below $356.97 would invalidate the immediate bullish recovery setup. The key question is whether buyers can generate enough momentum to break above $362.24, or whether weakening MACD momentum will keep Apple trapped in its current consolidation range. ⚠️ Educational analysis only. Not financial advice. #ByXIMPACT

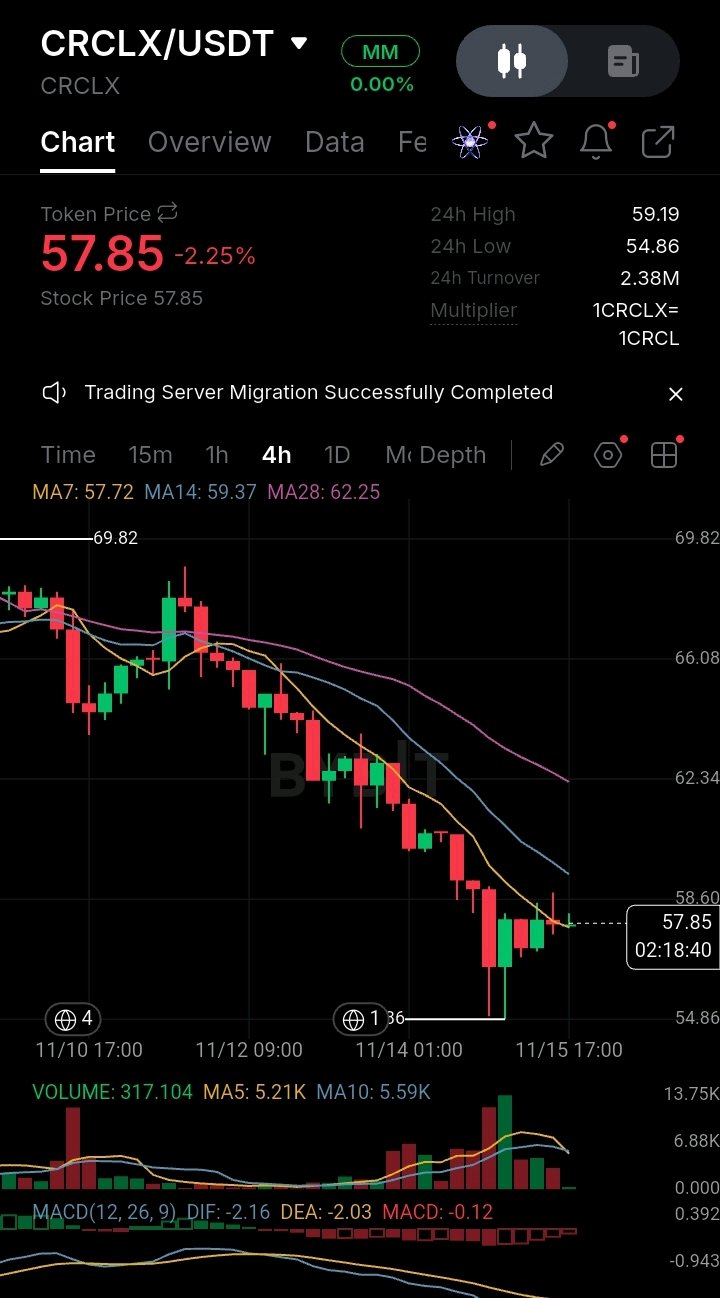
🔍 Market Analysis: $CRCLXUSDT | Circle Faces Continued Selling Pressure Despite Strong USDC Growth (4H Chart) CRCLX is attempting to stabilize near $57.85 following an extended decline from the $69.82 region, but the broader 4H structure remains bearish. The token is currently trading at $57.85, down 2.25% over 24 hours. Although price has recovered slightly from the $54.86 low, buyers have yet to establish a convincing bullish reversal. Technical Analysis: The 4H structure remains bearish, with price trading below MA14 and MA28, while holding marginally above MA7: MA7: $57.72 MA14: $59.37 MA28: $62.25 This indicates that short-term buying activity is attempting to stabilize price, but the broader trend remains under selling pressure. MACD also confirms negative momentum. DIF stands at -2.16 against DEA at -2.03, with a histogram of -0.12. Both MACD lines remain below zero, while DIF stays below DEA. This suggests that bearish momentum remains dominant, although the relatively small histogram indicates some easing in immediate selling pressure. Current volume is 317.104, significantly below MA5 of 5.21K and MA10 of 5.59K. This suggests limited trading participation during the latest recovery attempt, with buyers yet to demonstrate strong volume confirmation. Fundamental & News: Circle reported strong third-quarter 2026 financial results, with total revenue and reserve income reaching $865 million, representing 17% year-over-year growth. Average USDC circulation reached $73.3 billion, while on-chain transaction volume increased 49% year-over-year to $13.9 trillion. Adjusted EBITDA also grew 85% to $317 million. Additionally, Circle announced a partnership with Global Citizen on November 10 to expand economic opportunities across Africa through digital financial innovation. These developments highlight continued growth in Circle's payment infrastructure and stablecoin ecosystem. However, strong business performance has not yet translated into a bullish recovery in CRCLX price action. This creates a clear contrast between improving company fundamentals and continued weakness in the market structure. Market Outlook: Bullish: Defending $54.86 and reclaiming $59.37 with stronger volume could open a recovery toward $62.25. Bearish: A confirmed 4H breakdown below $54.86 could extend the current selling pressure and expose further downside. Invalidation: A sustained 4H recovery above $62.25 would significantly weaken the current bearish structure. The key question is whether Circle's strong USDC growth can support renewed buying interest, or whether continued technical weakness will push CRCLX toward another support test. ⚠️ Educational analysis only. Not financial advice. #ByXIMPACT

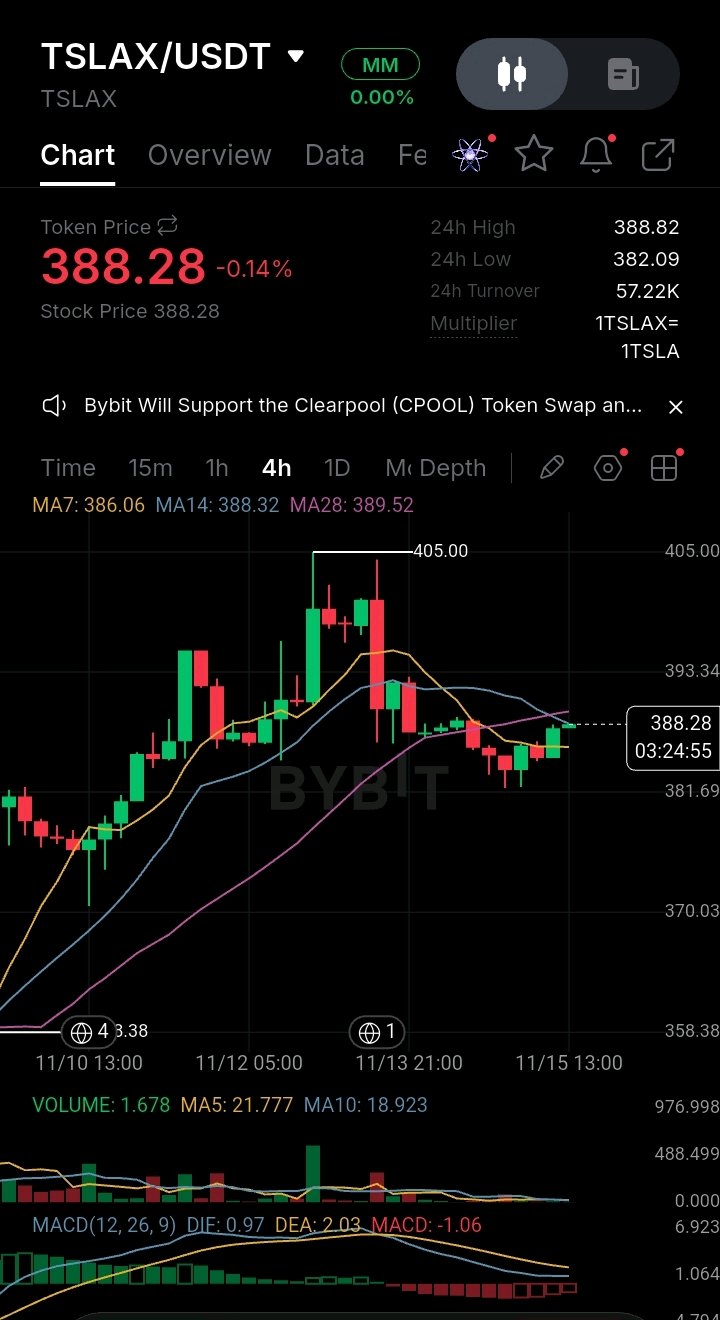
🔍 Market Analysis: $TSLAXUSDT | Tesla Stabilizes After Pullback as Buyers Test Key Resistance (4H Chart) TSLAX is attempting to recover after facing selling pressure from the $405.00 region, with price now stabilizing around $388.28. The token is currently trading at $388.28, down 0.14% over 24 hours. Although buyers have managed to push price back above the short-term moving average, the broader recovery remains unconfirmed. Technical Analysis: The 4H structure shows improving short-term price action, but resistance remains around the medium-term moving averages: MA7: $386.06 MA14: $388.32 MA28: $389.52 Price has reclaimed MA7 but remains marginally below MA14 and MA28. This suggests that buyers are gradually regaining control, although a sustained move above $389.52 is needed to strengthen the recovery. MACD still shows bearish momentum. DIF stands at 0.97 against DEA at 2.03, with a histogram of -1.06. DIF remains below DEA, indicating that the recent price recovery has not yet received bullish momentum confirmation. Current volume is 1.678, significantly below MA5 of 21.777 and MA10 of 18.923. This suggests limited trading participation during the latest recovery attempt, with buyers yet to demonstrate strong conviction. Fundamental & News: Tesla recently announced that selected customers are being invited to purchase its fully autonomous Cybercab for personal use, with a starting price of $29,990 and a required $299 monthly autonomy subscription. This development represents an important step in Tesla's transition toward autonomous transportation and could strengthen long-term expectations around its Robotaxi business. However, regulatory approval and the commercial expansion of autonomous services remain important challenges. This creates a constructive long-term development for Tesla, although its immediate impact on TSLAX price action remains unconfirmed. Market Outlook: Bullish: Holding $382.09 and reclaiming $389.52 with stronger volume could open a recovery toward $393.34 and potentially $405.00. Bearish: A rejection around $388.32–$389.52 followed by a confirmed 4H breakdown below $382.09 could expose further downside. Invalidation: A sustained 4H recovery above $393.34 would weaken the current cautious bearish outlook and strengthen the recovery structure. The key question is whether buyers can reclaim the $389.52 resistance zone with sufficient volume, or whether the current recovery will face another rejection. ⚠️ Educational analysis only. Not financial advice. #ByXIMPACT

🔍 Market Analysis: $XAUTUSDT | Gold Extends Its Decline as Inflation Concerns Strengthen Selling Pressure (4H Chart) XAUT is testing a critical support area near $3,765.91 as persistent selling pressure continues following its decline from the $4,130.11 high. The token is currently trading at $3,820.69, down 1.17% over 24 hours. Although price has attempted a minor recovery from its recent low, the broader 4H structure remains bearish. Technical Analysis: The 4H structure remains bearish, with price trading below all three moving averages: MA7: $3,829.82 MA14: $3,851.87 MA28: $3,909.13 The moving averages remain arranged in bearish order, confirming that sellers continue to dominate the broader structure. MACD also confirms negative momentum. DIF stands at -46.33 against DEA at -45.82, with a histogram of -0.50. Both MACD lines remain below zero, while DIF stays below DEA. This indicates that bearish momentum remains dominant, with no confirmed bullish reversal signal. Current volume is 65.337, significantly below MA5 of 522.585 and MA10 of 408.474. This suggests limited trading participation during the latest recovery attempt, with no strong confirmation of renewed buying pressure. Fundamental & News: US October CPI increased 0.4%, exceeding the 0.3% forecast. The hotter inflation reading strengthened expectations of further Federal Reserve tightening, adding pressure to Gold through higher Treasury yields and a stronger dollar. On the fundamental side, Tether announced that KPMG had completed an independent audit of TG Commodities' 2025 financial statements, issuing an unqualified audit opinion. Additionally, Tether reported that XAUT's physical gold reserves reached approximately 25.7 tonnes, valued at $3.44 billion at the end of September 2026. These developments support the long-term credibility and physical backing of XAUT. However, they have not prevented short-term selling pressure in the underlying Gold market. This creates a clear contrast between growing tokenized gold reserves and weakening macroeconomic conditions for precious metals. Market Outlook: Bullish: Defending $3,765.91 and reclaiming $3,829.82 could open a recovery toward $3,851.87 and potentially $3,856.96. Bearish: A confirmed 4H breakdown below $3,765.91 could extend the current selling pressure and expose further downside. Invalidation: A sustained 4H recovery above $3,909.13 would significantly weaken the current bearish structure. The key question is whether buyers can defend the $3,765.91 support area, or whether persistent inflation concerns and rising rate expectations will push Gold into another downward move. ⚠️ Educational analysis only. Not financial advice. #ByXIMPACT
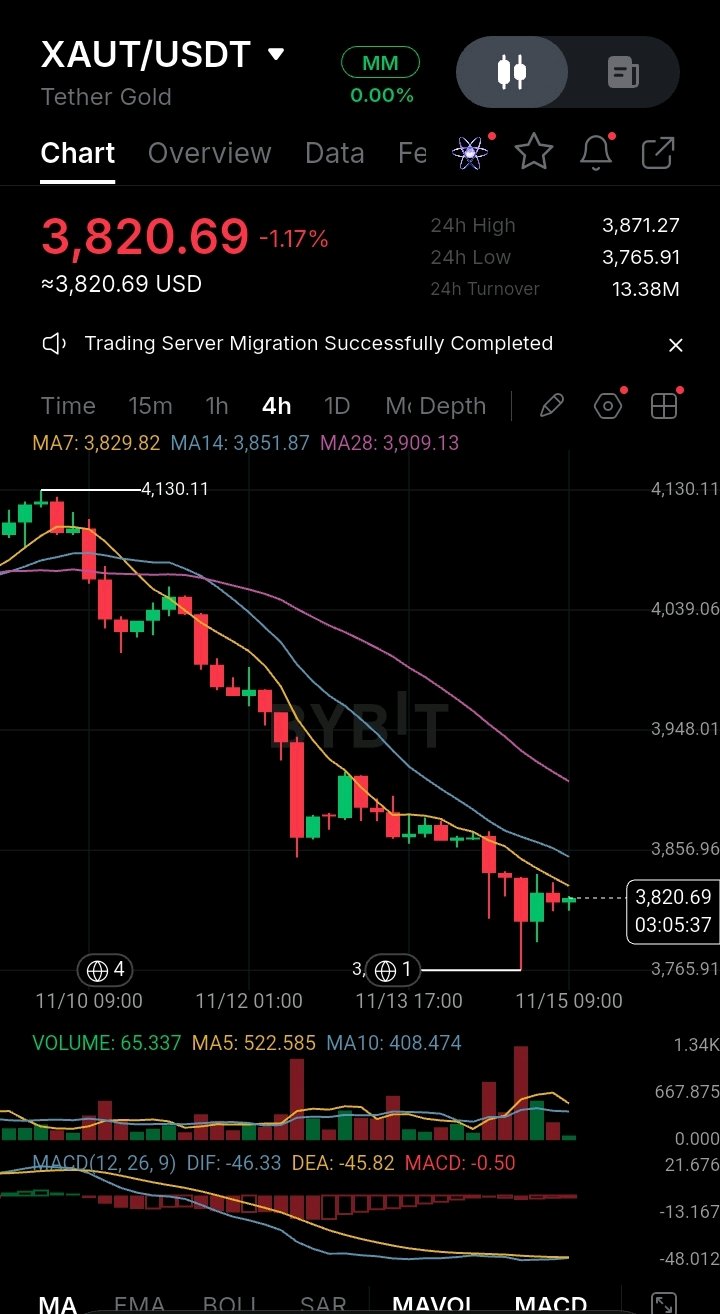

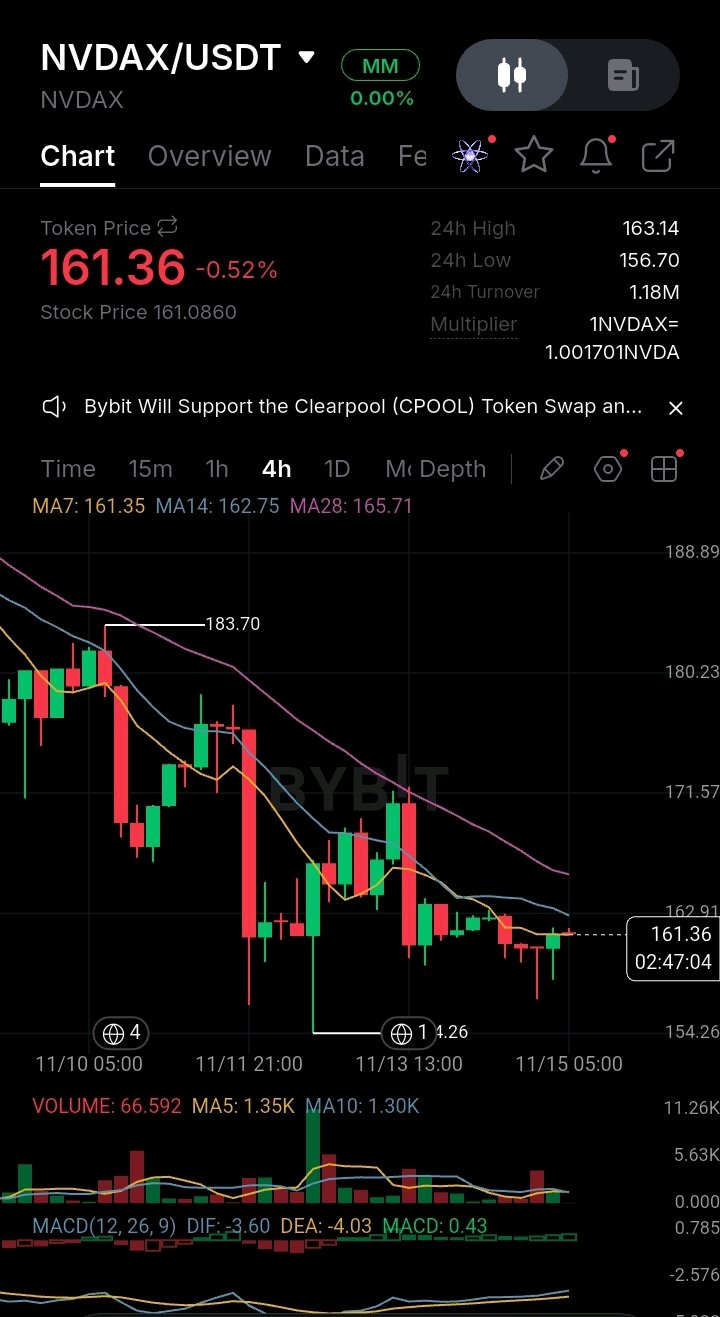
🔍 Market Analysis: $NVDAXUSDT | NVIDIA Faces Leadership Uncertainty as Bearish Structure Persists (4H Chart) NVDAX is attempting to stabilize near $161.36 following a prolonged decline from the $183.70 region, but the broader 4H structure remains under pressure. The token is currently trading at $161.36, down 0.52% over 24 hours. Although recent candles suggest a short-term recovery attempt, price remains below the medium-term moving averages. Technical Analysis: The 4H structure remains bearish, with price trading below MA14 and MA28, while holding marginally above MA7. MA7: $161.35 MA14: $162.75 MA28: $165.71 MACD shows an improvement in short-term momentum. DIF stands at -3.60 against DEA at -4.03, with a positive histogram of 0.43. DIF has moved above DEA, suggesting a bullish momentum shift. However, both lines remain below zero, meaning a broader bullish reversal is not yet confirmed. Current volume is 66.592, significantly below MA5 of 1.35K and MA10 of 1.30K. This suggests limited trading participation during the latest recovery attempt, with no strong volume confirmation from buyers. Fundamental & News: NVIDIA announced a major leadership transition on November 12, following Jensen Huang's resignation as President and CEO, effective immediately. CFO Colette Kress was appointed Interim CEO while the board begins searching for a permanent successor. This development introduces uncertainty around leadership continuity and investor confidence, particularly given NVIDIA's importance to the global AI industry. Additionally, NVIDIA is scheduled to release its Q3 FY2027 financial results on November 17. The upcoming earnings announcement could become an important catalyst for market sentiment and price volatility. These developments create a challenging environment for NVIDIA, with leadership uncertainty ahead of an important earnings announcement. Market Outlook: Bullish: Holding $156.70 and reclaiming $162.75–$163.14 could open a recovery toward $165.71 and potentially $171.57. Bearish: A rejection below $162.75–$163.14 followed by a confirmed 4H breakdown below $156.70 could expose the $154.26 support area. Invalidation: A sustained 4H recovery above $165.71 would weaken the current bearish structure and improve the recovery outlook. The key question is whether improving MACD momentum can attract stronger buying participation, or whether leadership uncertainty and continued selling pressure will push NVIDIA lower ahead of its earnings announcement. ⚠️ Educational analysis only. Not financial advice. #ByXIMPACT

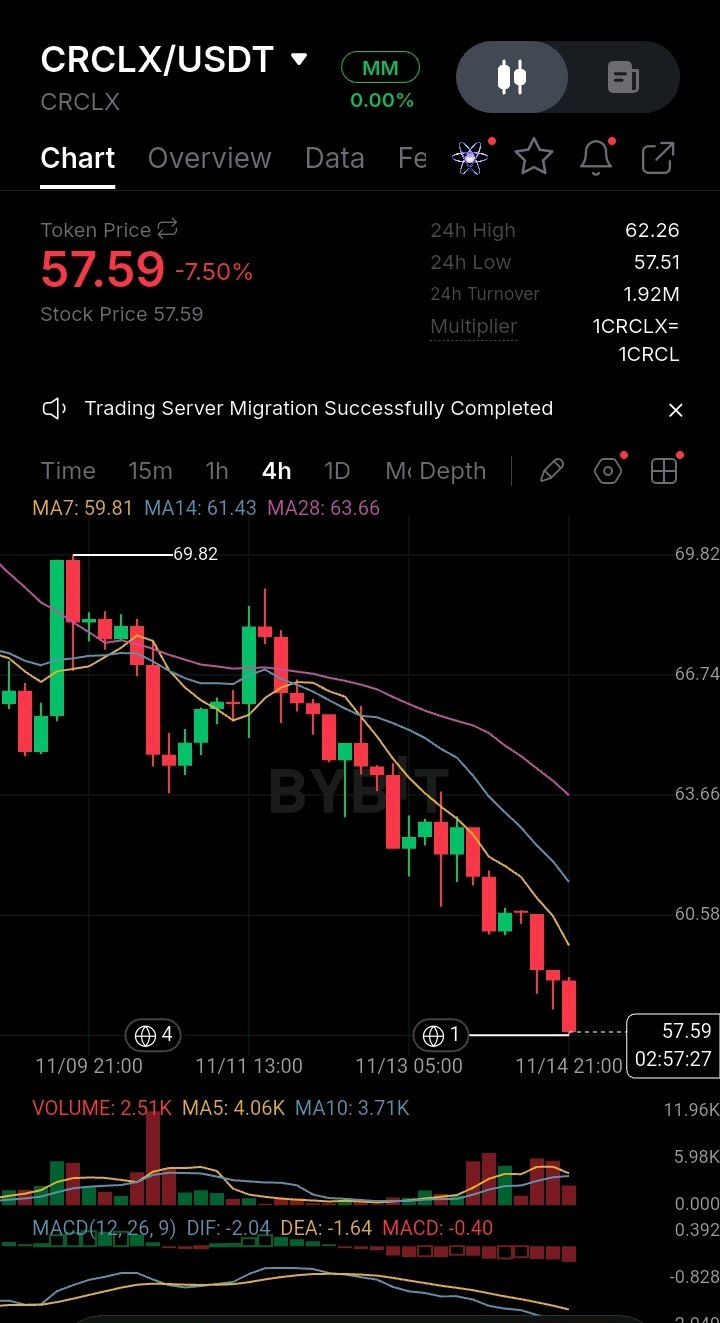
🔍 Market Analysis: $CRCLXUSDT | Circle Faces Heavy Selling Pressure as Bearish Momentum Accelerates (4H Chart) CRCLX is approaching a critical support area near $57.51 as persistent selling pressure pushes the token toward its recent 24-hour low. The token is currently trading at $57.59, down 7.50% over 24 hours, following a sustained decline from the $69.82 region. Technical Analysis: The 4H structure remains strongly bearish, with price trading below all three moving averages: MA7: $59.81 MA14: $61.43 MA28: $63.66 The moving averages are arranged in bearish order, confirming that sellers remain in control of the broader structure. MACD also confirms negative momentum. DIF stands at -2.04 against DEA at -1.64, with a histogram of -0.40. Both MACD lines remain below zero, while DIF stays below DEA. This indicates that bearish momentum remains dominant, with no confirmed bullish reversal signal. Current volume is 2.51K, below MA5 of 4.06K and MA10 of 3.71K. Although recent selling candles showed increased activity, the latest volume reading does not confirm renewed buying participation. Fundamental & News: Circle reported Q3 2026 revenue and reserve income of $865 million, representing 17% year-over-year growth. Adjusted EBITDA increased 85% to $317 million, while USDC on-chain transaction volume reached $13.9 trillion. Additionally, Circle announced a partnership with Global Citizen to support economic opportunities across Africa through digital financial innovation. These developments highlight continued business growth and ecosystem expansion. However, positive company fundamentals have not translated into stronger short-term price performance. This creates a clear contrast between Circle's improving business performance and the current bearish market structure. Market Outlook: Bullish: Defending $57.51 and reclaiming $59.81 could open an initial recovery toward $60.58 and potentially $61.43. Bearish: A confirmed 4H breakdown below $57.51 could extend the current selling pressure and expose further downside. Invalidation: A sustained 4H recovery above $61.43 would weaken the immediate bearish structure. The key question is whether buyers can defend the $57.51 support area, or whether continued selling pressure will push CRCLX into another downward move. ⚠️ Educational analysis only. Not financial advice. #ByXIMPACT

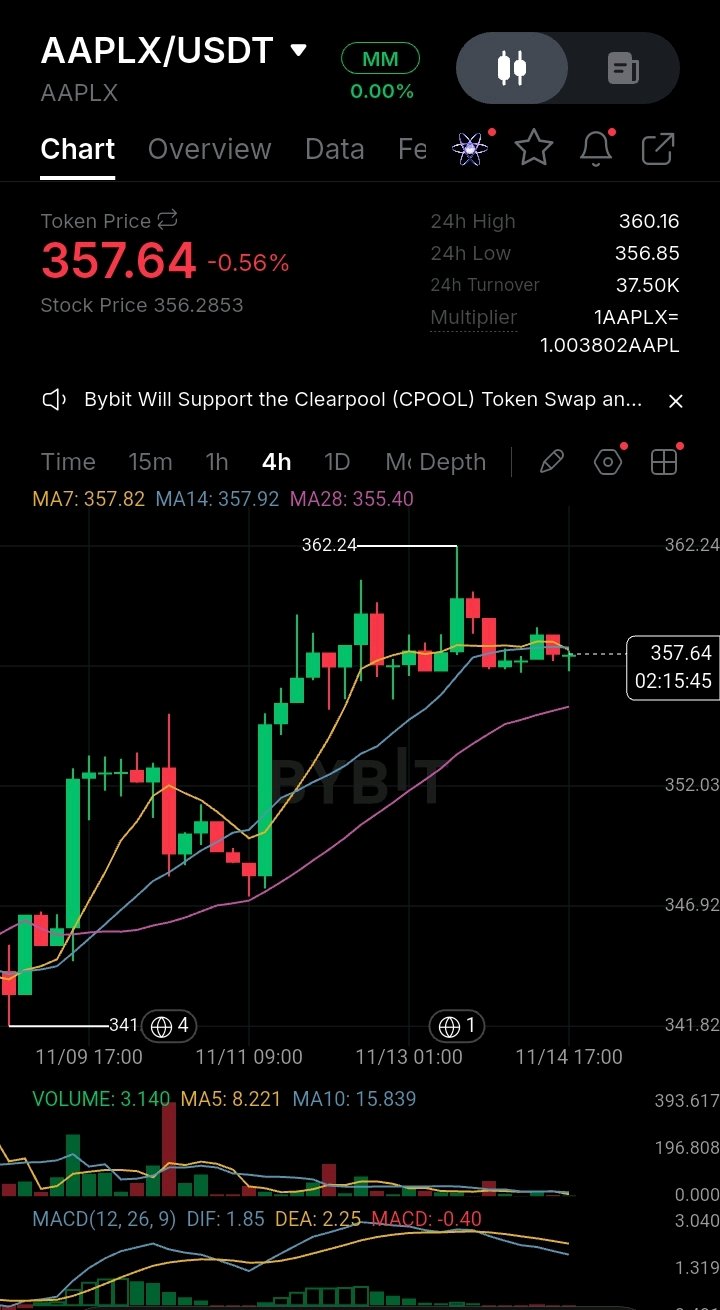
🔍 Market Analysis: $AAPLXUSDT | Apple Consolidates as Short-Term Buying Momentum Weakens (4H Chart) AAPLX is holding above an important support area near $355.40 following its recovery from the $341 region, but recent price action shows weakening buying momentum. The token is currently trading at $357.64, down 0.56% over 24 hours, after facing resistance near the $362.24 high. Technical Analysis: The 4H structure remains relatively constructive, but short-term momentum is weakening, with price trading below MA7 and MA14 while remaining above MA28. MA7: $357.82 MA14: $357.92 MA28: $355.40 MACD also signals weakening momentum. DIF stands at 1.85 against DEA at 2.25, with a histogram of -0.40. DIF remains below DEA, indicating short-term bearish pressure. However, both lines remain above zero, suggesting that the broader positive momentum has not been completely lost. Current volume is 3.140, below MA5 of 8.221 and MA10 of 15.839. This indicates reduced trading participation during the current consolidation, with no strong confirmation of renewed buying interest. Fundamental & News: Apple reported fiscal Q4 2026 revenue of $114.5 billion, representing 12% year-over-year growth. Diluted EPS increased 14% to $2.10, while Services revenue reached a new record. Additionally, Apple shares reached a record intraday high of $359.37 on November 12 before closing at $354.88. These developments provide a constructive fundamental backdrop for AAPLX, although positive company performance does not guarantee immediate price appreciation. The current market reflects a contrast between strong underlying company performance and weakening short-term technical momentum. Market Outlook: Bullish: Defending $355.40 and reclaiming $357.92 could open a recovery toward $360.16 and potentially $362.24. Bearish: A confirmed 4H breakdown below $355.40 could expose the $352.03 support area. Invalidation: A sustained 4H breakdown below $352.03 would significantly weaken the current recovery structure. The key question is whether buyers can defend the $355.40 support area and restore upward momentum, or whether continued selling pressure will trigger another downward move. ⚠️ Educational analysis only. Not financial advice. #ByXIMPACT

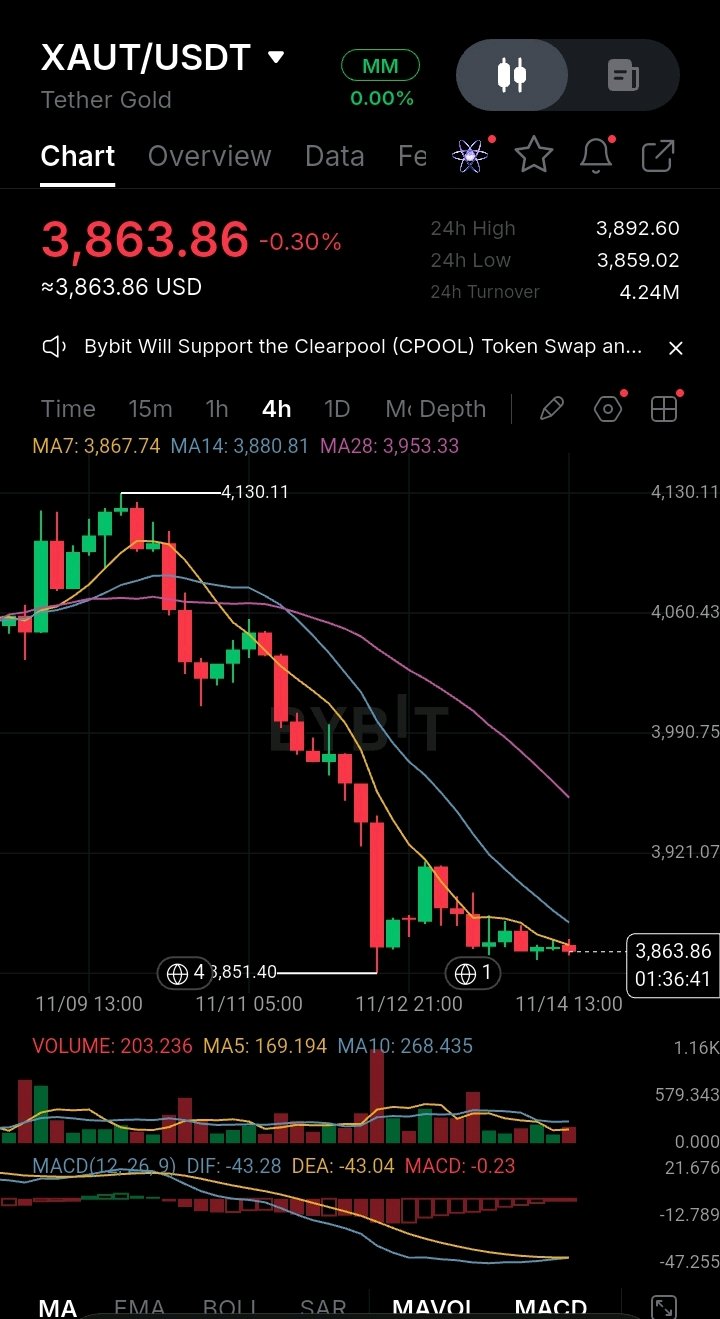
🔍 Market Analysis: $XAUTUSDT | Gold Remains Under Selling Pressure as Rate Expectations Weigh on Momentum (4H Chart) XAUT is testing a critical support area near $3,851.40 as persistent selling pressure continues following its rejection from the $4,130.11 high. The token is currently trading at $3,863.86, down 0.30% over 24 hours. Price remains below all three moving averages, indicating that the broader 4H bearish structure is still intact. Technical Analysis: The 4H structure remains bearish, with price trading below all three moving averages: MA7: $3,867.74 MA14: $3,880.81 MA28: $3,953.33 MACD also confirms negative momentum. DIF stands at -43.28 against DEA at -43.04, with a histogram of -0.23. The histogram remains negative, although its relatively small reading suggests that immediate selling momentum has weakened. Current volume is 203.236, above MA5 of 169.194 but below MA10 of 268.435. This indicates increased activity compared with the five-period average, without strong confirmation of renewed buying pressure. Fundamental & News: US October PPI increased 0.3%, below the 0.4% forecast. However, persistent inflation concerns and expectations surrounding Federal Reserve interest-rate policy continue to influence gold market sentiment. Higher interest-rate expectations and Treasury yields can create additional pressure on non-yielding assets such as Gold. On the fundamental side, Tether announced that KPMG had completed an independent audit of TG Commodities' 2025 financial statements, issuing an unqualified audit opinion. This supports transparency around XAUT's gold-backed structure, although the development does not directly change the underlying gold price trend. The current market therefore reflects a contrast between improving token-related transparency and continued macroeconomic pressure on Gold. Market Outlook: Bullish: Defending $3,851.40 and reclaiming $3,880.81 could open a recovery toward $3,892.60 and potentially $3,953.33. Bearish: A confirmed 4H breakdown below $3,851.40 could expose further downside as the existing bearish structure extends. Invalidation: A sustained 4H recovery above $3,953.33 would significantly weaken the current bearish structure. The key question is whether buyers can defend the $3,851.40 support area, or whether persistent macroeconomic pressure will push Gold into another downward move. ⚠️ Educational analysis only. Not financial advice. #ByXIMPACT

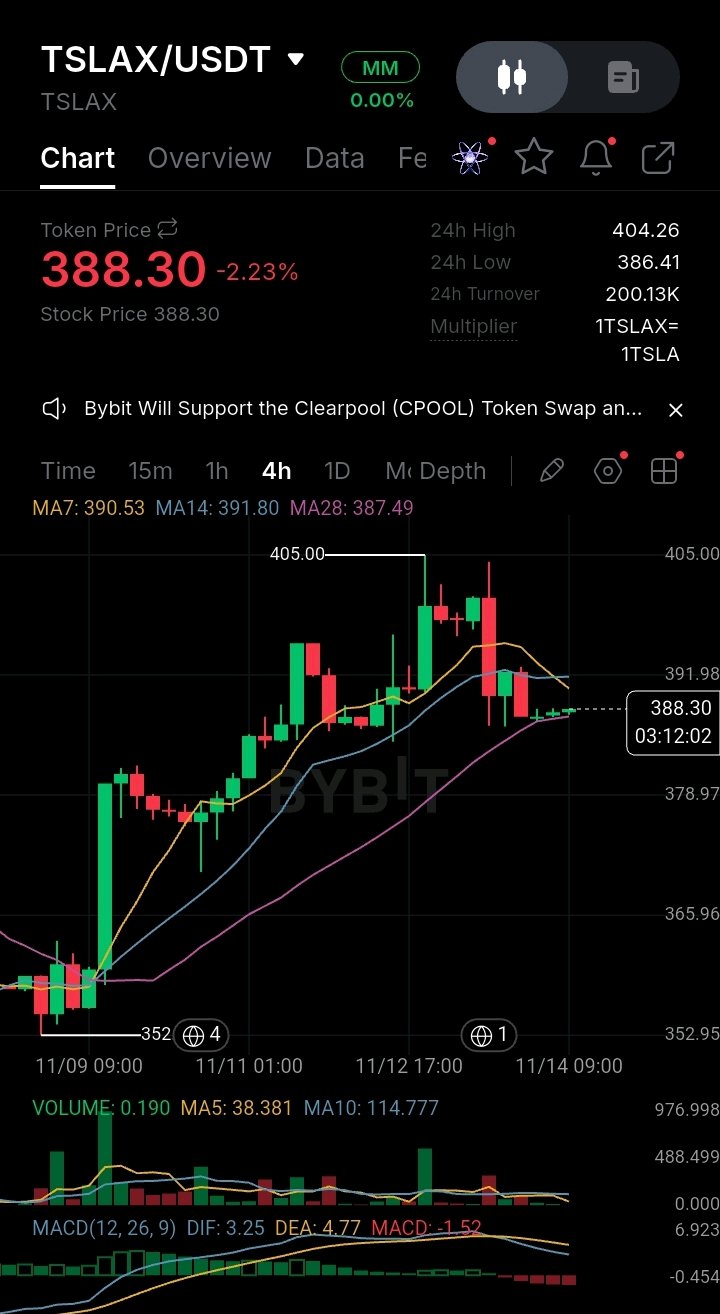
🔍 Market Analysis: $TSLAXUSDT | Tesla Opens Cybercab Sales to Select Buyers as Price Faces Short-Term Correction (4H Chart) TSLAX is facing short-term selling pressure after retreating from the $405 area, while Tesla's latest Cybercab development brings renewed attention to its autonomous driving and Robotaxi strategy. TSLAX is currently trading at $388.30, down 2.23% over 24 hours, following a rejection near the $404.26 24-hour high. Fundamental & News: Tesla has started inviting select customers to purchase its Cybercab for personal use at an estimated price of $29,990, with deliveries expected in December 2026. The vehicle also requires a $299 monthly Autonomy Subscription to operate, while initial availability is limited to supported service areas. This marks an important step in Tesla's effort to expand its autonomous transportation business beyond its existing Robotaxi fleet. Tesla's Q3 2026 update also reported that cumulative unsupervised Robotaxi miles grew eightfold quarter over quarter, reflecting continued progress in its autonomous mobility operations. These developments strengthen Tesla's long-term focus on AI and autonomous transportation, although regulatory requirements and the commercial expansion of Robotaxi services remain important challenges. Technical Analysis: The 4H structure shows a short-term correction after the recent bullish move, with price trading below MA7 and MA14 but remaining above MA28: MA7: $390.53 MA14: $391.80 MA28: $387.49 MACD confirms weakening short-term momentum. DIF stands at 3.25 against DEA at 4.77, with a negative histogram of -1.52. This indicates that bearish momentum is increasing, although both MACD lines remain above zero. Current volume is 0.190, significantly below the MA5 of 38.381 and MA10 of 114.777. This suggests limited trading activity around the latest price movement, without strong volume confirmation of the selling pressure. Market Outlook: Bullish: Holding above $386.41 and reclaiming the $390.53–$391.80 resistance zone could open a recovery toward $404.26 and $405. Bearish: A confirmed 4H breakdown below $386.41 could expose the $378.97 support area. Invalidation: A sustained 4H recovery above $391.80 would weaken the current short-term bearish momentum. The key question is whether Tesla's Cybercab expansion and Robotaxi progress can support renewed buying interest, or whether short-term selling pressure will push TSLAX toward lower support levels. ⚠️ Educational analysis only. Not financial advice. #ByXIMPACT

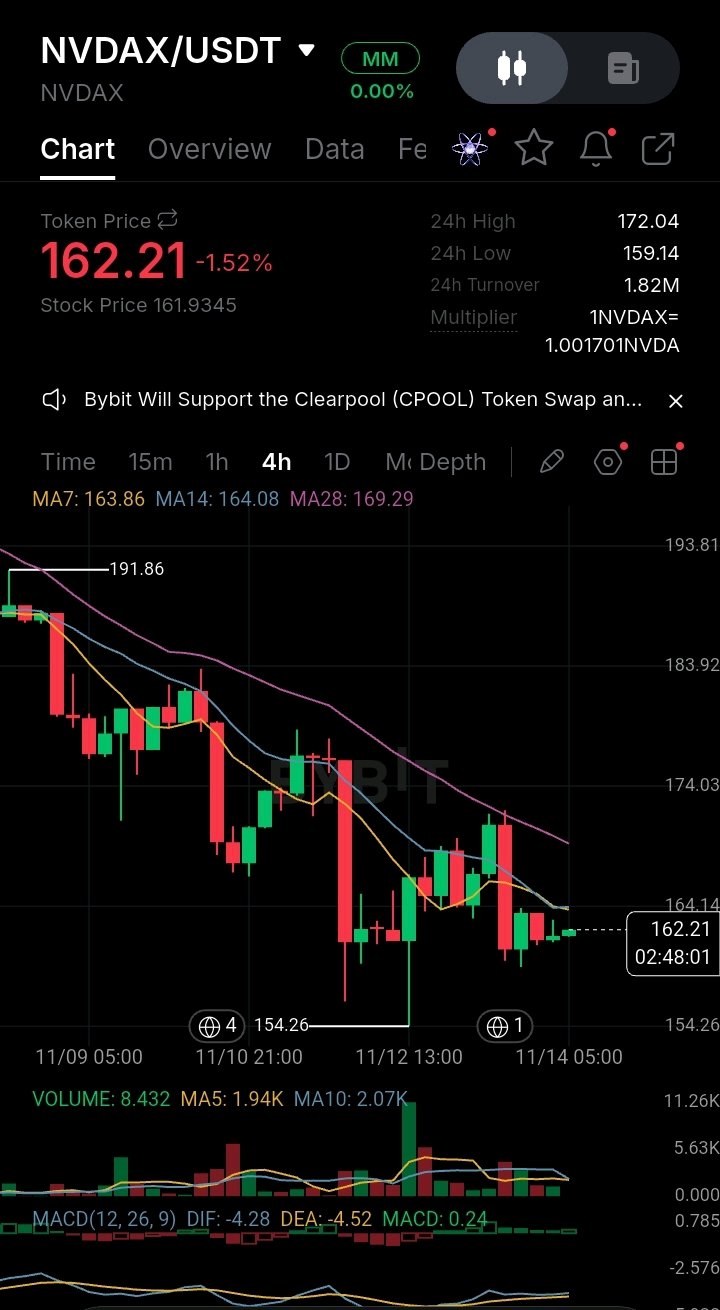
🔍 Market Analysis: $NVDAXUSDT | NVIDIA Attempts Stabilization as Leadership Uncertainty Weighs on Market Sentiment (4H Chart) NVIDIA tokenized stock is showing signs of short-term stabilization after an extended decline, but the broader market structure remains under pressure. NVDAX is currently trading at $162.21, down 1.52% over 24 hours, following a rejection from the $172.04 high. Price is now consolidating near the $159.14 intraday low as buyers attempt to defend the current support region. Technical Analysis: The 4H structure remains bearish, with price trading below all three moving averages: MA7: $163.86 MA14: $164.08 MA28: $169.29 This alignment confirms that sellers still control the broader trend. However, the narrowing distance between price and the short-term moving averages suggests that selling pressure may be gradually losing intensity. MACD shows an early improvement in momentum. DIF stands at -4.28 against DEA at -4.52, with a histogram of +0.24. Although both MACD lines remain below zero, the positive histogram suggests that bearish momentum is weakening. This is an early recovery signal, not yet a confirmed bullish reversal. Current volume is 8.432, while MA5 stands at 1.94K and MA10 at 2.07K. The displayed volume remains below both averages, indicating limited participation in the latest price stabilization. Fundamental & News: NVIDIA is facing an important leadership transition following its official November 12 announcement that Jensen Huang resigned as President and CEO, effective immediately. CFO Colette Kress has assumed the role of interim CEO while the company searches for a permanent successor. The development has increased uncertainty around corporate leadership and contributed to negative sentiment across the broader AI and semiconductor sector. According to Reuters reports on November 13, NVIDIA shares extended their decline amid concerns about leadership continuity and potential changes to US chip export policy, particularly regarding access to the Chinese market. However, NVIDIA's underlying business fundamentals remain significant. Its Q2 fiscal 2027 revenue reached $96.2 billion, representing 106% year-over-year growth, while Data Center revenue reached $89 billion. Another important catalyst is approaching. NVIDIA is scheduled to release its Q3 fiscal 2027 financial results on November 17. Investors will be watching revenue growth, AI infrastructure demand and management's forward guidance. Additionally, NVDAX gained expanded trading accessibility following KuCoin's November 2 announcement of its tokenized stock listing. This creates a market environment where strong AI business fundamentals are competing with leadership uncertainty and broader semiconductor market pressure. Market Outlook: Bullish: Defending $159.14 and reclaiming the $163.86 to $164.14 resistance region could open a recovery toward $169.29 and $172.04. A confirmed breakout above $172.04 would strengthen the recovery structure. Bearish: A confirmed 4H breakdown below $159.14 could expose the $154.26 support region. Losing this level would increase the risk of further downside. Invalidation: A sustained 4H recovery above $172.04 would significantly weaken the current bearish outlook. The key question is whether the improving MACD momentum can develop into a meaningful recovery before NVIDIA's November 17 earnings announcement, or whether leadership uncertainty will continue to dominate market sentiment. ⚠️ Educational analysis only. Not financial advice. #ByXIMPACT

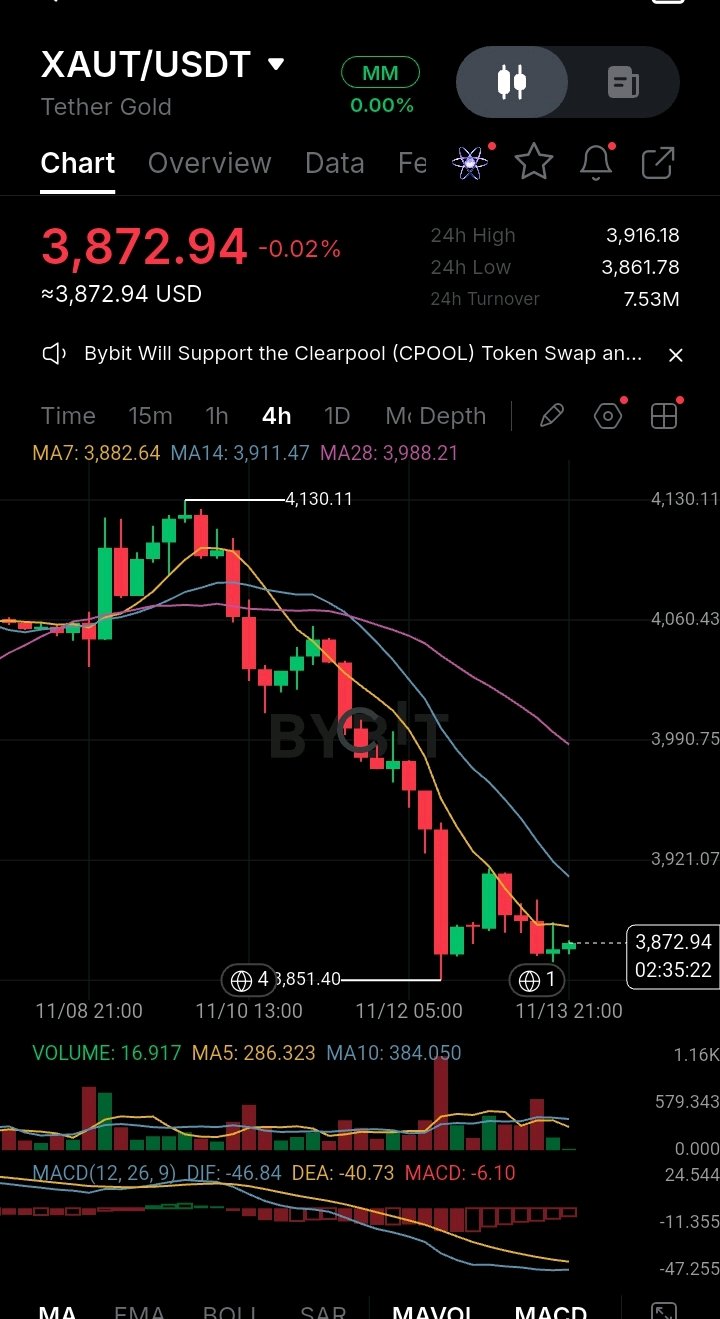
🔍 Market Analysis: $XAUTUSDT | Gold Remains Under Heavy Selling Pressure as Price Struggles to Recover (4H Chart) Gold continues to face strong selling pressure, with XAUT consolidating near the $3,870 area after a sharp decline from the $4,130.11 swing high. XAUT is currently trading at $3,872.94, down 0.02% over 24 hours, while the 24-hour trading range stands between $3,861.78 and $3,916.18. Technical Analysis: The 4H structure remains strongly bearish, with price trading below all three moving averages: MA7: $3,882.64 MA14: $3,911.47 MA28: $3,988.21 MACD also confirms negative momentum. DIF stands at -46.84 against DEA at -40.73, with a histogram of -6.10. Current volume is 16.917, significantly below the MA5 of 286.323 and MA10 of 384.050. This suggests reduced trading activity and a lack of strong buying participation during the current consolidation. Fundamental & News: Gold continues to face macroeconomic pressure following stronger-than-expected US inflation data, which increased expectations of further Federal Reserve interest rate hikes. On November 13, US October PPI increased 0.3%, below the 0.4% forecast. However, elevated core inflation and hawkish Fed expectations continue to support the US dollar and Treasury yields, limiting Gold's recovery attempts. Reuters +1 This creates continued pressure on Gold despite some bargain-hunting activity after the recent sharp decline. Market Outlook: Bullish: Defending the $3,851.40 support area and reclaiming $3,882.64 could open a recovery toward $3,911.47 and $3,988.21. Bearish: A confirmed 4H breakdown below $3,851.40 could expose Gold to further downside. Invalidation: A sustained 4H recovery above $3,988.21 would weaken the current bearish structure. The key question is whether buyers can defend the $3,851 support zone and initiate a meaningful recovery, or whether continued macroeconomic pressure will push Gold toward lower levels. ⚠️ Educational analysis only. Not financial advice. #ByXIMPACT

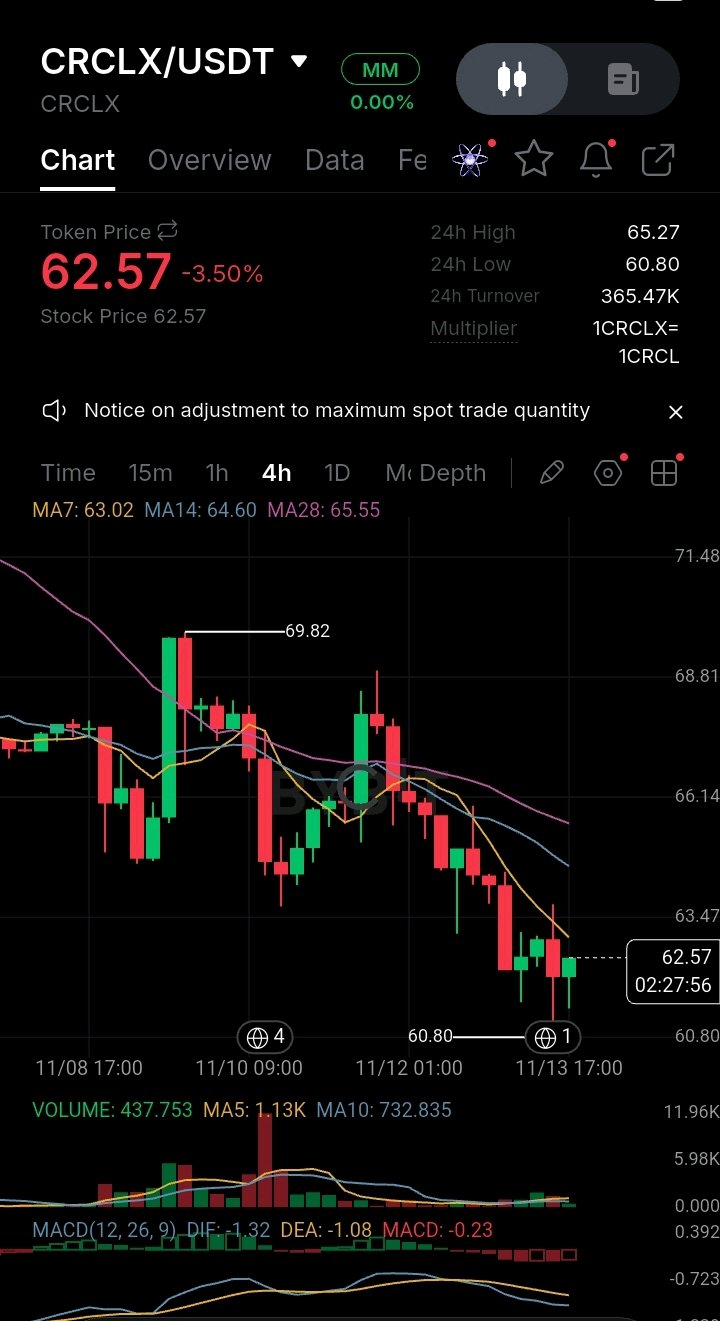
🔍 Market Analysis: $CRCLXUSDT | CRCLX Remains Under Bearish Pressure as Price Tests Critical Support (4H Chart) CRCLX is facing continued selling pressure, with price approaching a critical support zone near $60.80 as the broader 4H structure remains bearish. CRCLX is currently trading at $62.57, down 3.50% over 24 hours, following a decline from the $69.82 swing high. Technical Analysis: The 4H structure remains bearish, with price trading below all three moving averages: MA7: $63.02 MA14: $64.60 MA28: $65.55 MACD also confirms negative momentum. DIF stands at -1.32 against DEA at -1.08, with a histogram of -0.23. Current volume is 437.753, below the MA5 of 1.13K and MA10 of 732.835. This suggests relatively weak trading activity during the latest price movement. Fundamental & News: No verified project-specific news is available from the provided screenshot to establish a fundamental catalyst behind the current decline. For now, the visible market structure suggests that technical selling pressure remains the dominant factor. Market Outlook: Bullish: Defending $60.80 and reclaiming $63.02 could open a recovery toward $64.60 and $65.55. Bearish: A confirmed 4H breakdown below $60.80 could expose CRCLX to further downside. Invalidation: A sustained 4H recovery above $65.55 would weaken the current bearish structure. The key question is whether buyers can defend the $60.80 support zone and trigger a meaningful recovery, or whether continued selling pressure will push CRCLX toward lower levels. ⚠️ Educational analysis only. Not financial advice. #ByXIMPACT

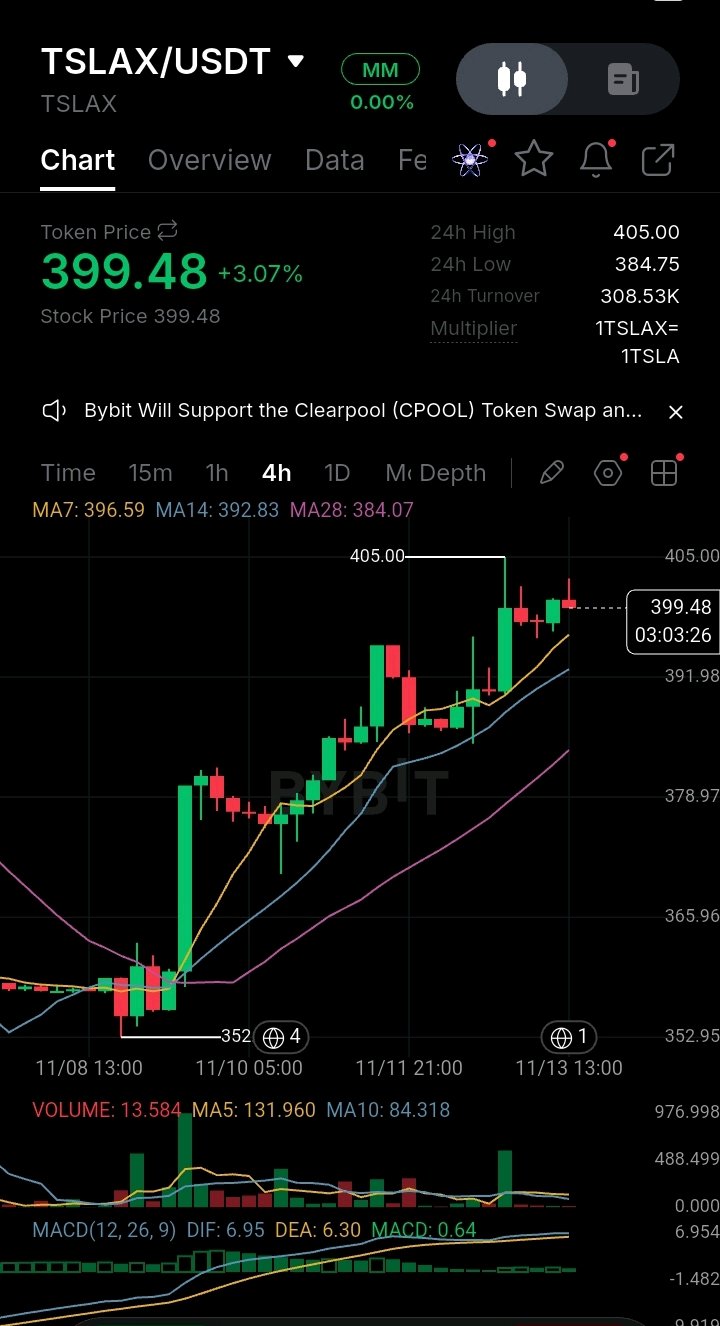
🔍 Market Analysis: $TSLAXUSDT | Bullish Momentum Faces Resistance Near $405 (4H Chart) TSLAX is maintaining a bullish market structure, with buyers pushing price higher following a strong recovery from the $352 region. However, the recent consolidation near $400 suggests that buying pressure may be slowing as price approaches a critical resistance area. TSLAX is currently trading at $399.48, up 3.07% over 24 hours, following a rally toward the $405 high. Technical Analysis: The 4H structure remains bullish, with price trading above all three moving averages: MA7: $396.59 MA14: $392.83 MA28: $384.07 MACD confirms positive momentum. DIF stands at 6.95 against DEA at 6.30, with a histogram of +0.64. Current volume is 13.584, below the MA5 of 131.960 and MA10 of 84.318. This suggests weaker trading activity during the latest candle, indicating that stronger participation may be needed to sustain further upside. Market Outlook: Bullish: A confirmed 4H breakout above $405 with increasing volume could support further upward continuation. Bearish: Failure to break $405 could trigger a pullback toward $396.59 and $392.83, with the $384.75–$384.07 region providing a deeper support area. Invalidation: A sustained 4H breakdown below $384.07 would weaken the current bullish structure. The key question is whether buyers can generate enough momentum to break above $405, or whether sellers will defend this resistance and trigger a correction. ⚠️ Educational analysis only. Not financial advice. #ByXIMPACT

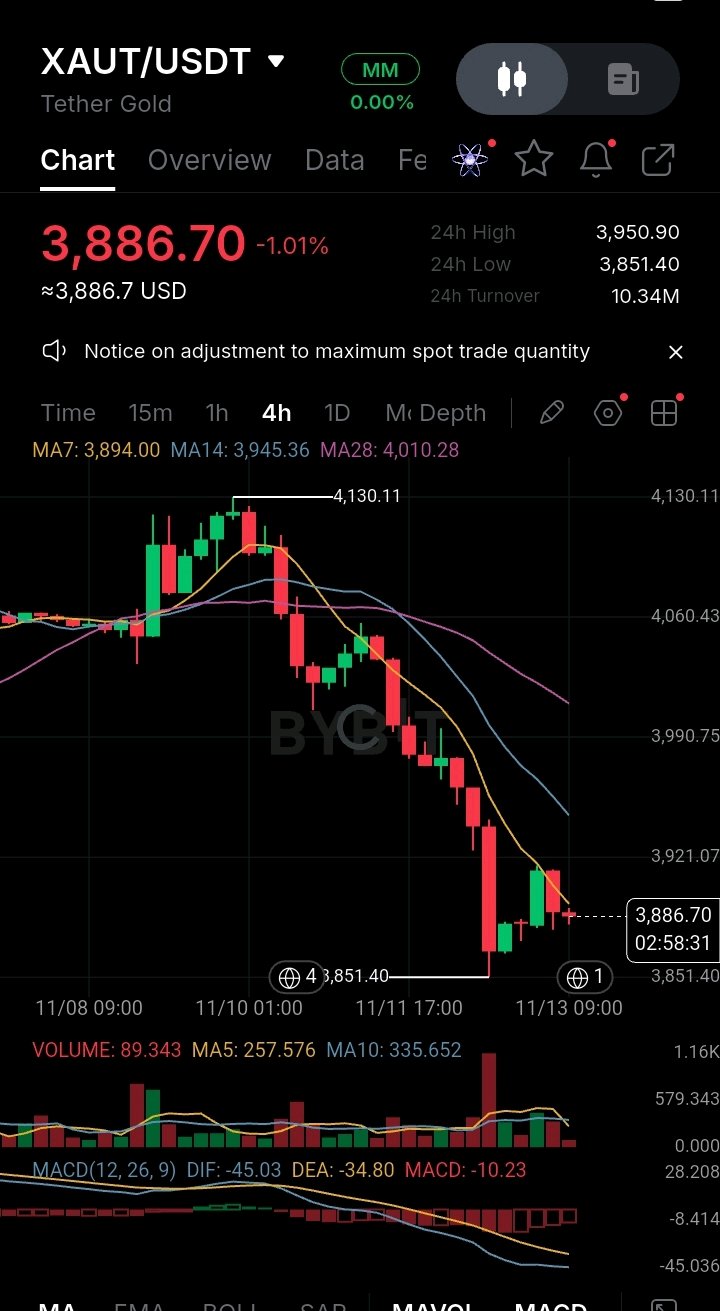
🔍 Market Analysis: $XAUTUSDT | Gold Remains Under Pressure as Fed Tightening Risks Persist (4H Chart) Gold is struggling to recover after breaking below the $4,000 psychological level, with bearish technical signals and renewed Federal Reserve tightening expectations keeping sellers in control. XAUT is currently trading at $3,886.70, down 1.01% over 24 hours, following a decline from the $4,130.11 swing high. Technical Analysis: The 4H structure remains bearish, with price trading below all three moving averages: MA7: $3,894.00 MA14: $3,945.36 MA28: $4,010.28 MACD confirms negative momentum. DIF stands at -45.03 against DEA at -34.80, with a histogram of -10.23. Current volume is 89.343, below MA5 of 257.576 and MA10 of 335.652. This suggests the recent recovery lacks strong participation from buyers. Fundamental & News: Reuters reported that gold recovered slightly on November 13 following bargain hunting, but remained on track for a 4.1% weekly decline. Markets are pricing in an 89% probability of a 25-basis-point Federal Reserve rate increase in December. Investors are also awaiting US Producer Price Index data, which could influence Treasury yields, the dollar and gold's short-term direction. On the fundamental side, Tether Gold announced that KPMG completed an independent audit of its financial statements, confirming that XAUT is fully backed by allocated physical gold. This strengthens transparency and institutional trust in the token. Market Outlook: Bullish: Defending $3,851.40 and reclaiming $3,894 could open a recovery toward $3,921 and $3,945. Bearish: A confirmed 4H breakdown below $3,851.40 could expose further downside. Invalidation: A sustained recovery above $3,951 would weaken the current bearish structure. The key question is whether buyers can defend the recent low while macroeconomic pressure continues to weigh on gold. ⚠️ Educational analysis only. Not financial advice. #ByXIMPACT

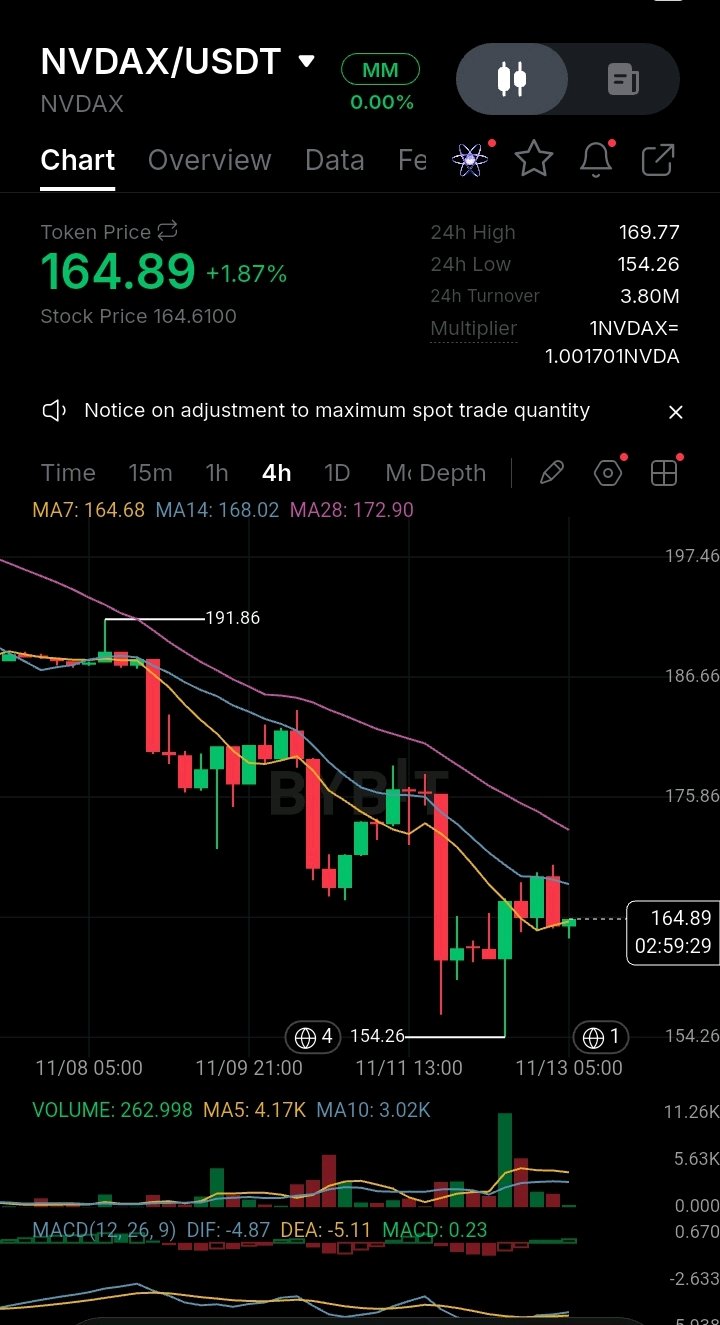
🔍 Market Analysis: $NVDAXUSDT | NVIDIA Attempts a Recovery as AI Demand Supports Long-Term Market Sentiment (4H Chart) NVDAX is showing early signs of recovery after an extended decline, with buyers attempting to stabilize price around the $164 support area. NVDAX is currently trading at $164.89, up 1.87% over 24 hours, following a recovery from the $154.26 swing low. However, price remains below major resistance levels, suggesting that the broader market structure is still under bearish pressure. Technical Analysis: The 4H structure remains bearish, with price trading below MA14 and MA28, although it has slightly reclaimed MA7: MA7: $164.68 MA14: $168.02 MA28: $172.90 MACD shows early signs of improving momentum. DIF stands at -4.87 against DEA at -5.11, with a histogram of 0.23. Current volume is 262.998, significantly below the MA5 of 4.17K and MA10 of 3.02K. This suggests limited trading participation during the recovery, indicating that stronger buying volume is needed to confirm a sustained reversal. Fundamental & News: NVIDIA continues to benefit from strong global demand for artificial intelligence infrastructure and advanced computing technology. The company reported Q2 FY2027 revenue of $96.2 billion, representing a 106% increase year over year. Data Center revenue reached $89 billion, up 117%, highlighting the continued expansion of AI infrastructure demand. Furthermore, NVIDIA has confirmed that it will release its Q3 FY2027 financial results on November 17, 2026. The company previously projected approximately $108 billion in quarterly revenue, making the upcoming earnings announcement an important catalyst for market sentiment. This creates a constructive long-term fundamental outlook, although short-term price weakness and reduced trading participation continue to present challenges for buyers. Market Outlook: Bullish: Holding $154.26 and reclaiming $168.02 could open a recovery toward $172.90 and $175.86. Bearish: A confirmed 4H breakdown below $154.26 could expose the $150 psychological support area. Invalidation: A sustained 4H recovery above $172.90 would weaken the current bearish structure. The key question is whether improving MACD momentum and strong AI demand can attract enough buyers to push NVDAX above $168, or whether continued selling pressure will drive price toward lower support levels. ⚠️ Educational analysis only. Not financial advice. #ByXIMPACT

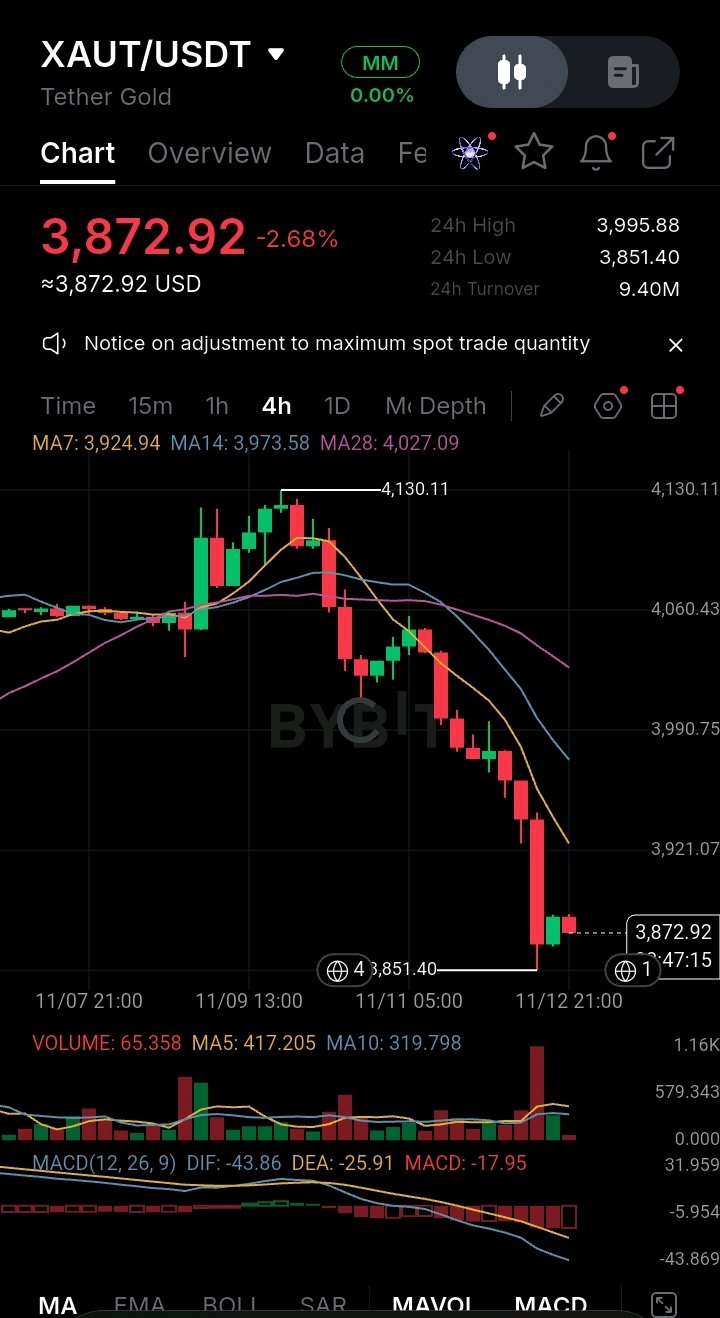
🔍 Market Analysis: $XAUTUSDT | Gold Extends Selling Pressure as Hawkish Fed Expectations Weigh on Precious Metals (4H Chart) Gold is testing a critical support area near $3,850 as stronger US inflation data, rising Treasury yields and expectations of further Federal Reserve tightening put renewed pressure on precious metals. XAUT is currently trading at $3,872.92, down 2.68% over 24 hours, following a sharp decline from the $4,130.11 swing high. Technical Analysis: The 4H structure remains strongly bearish, with price trading below all three moving averages: MA7: $3,924.94 MA14: $3,973.58 MA28: $4,027.09 MACD also confirms strong negative momentum. DIF stands at -43.86 against DEA at -25.91, with a histogram of -17.95. Current volume is 65.358, below the MA5 of 417.205 and MA10 of 319.798. However, the latest major selling candle recorded a significant volume spike, suggesting strong selling activity during the breakdown. Fundamental & News: US October CPI increased 0.4%, exceeding the 0.3% forecast, while persistent inflation concerns strengthened expectations of further Federal Reserve tightening. The US dollar climbed to a 19-month high, while markets priced in an 87% probability of a 25-basis-point Fed rate increase in December. Rising oil prices and hawkish comments from Federal Reserve officials have also added pressure to Gold. However, longer-term demand remains supported by continued central bank purchases and structural interest in precious metals. The World Gold Council has also identified the $3,858 region as an important technical support level in its latest market outlook. This creates a clear conflict between short-term macroeconomic pressure and longer-term structural demand. Market Outlook: Bullish: Defending $3,851.40 and reclaiming $3,924.94 could open a recovery toward $3,973.58 and $4,027. Bearish: A confirmed 4H breakdown below $3,851.40 could expose the $3,800 psychological support area. Invalidation: A sustained 4H recovery above $4,027 would weaken the current bearish structure. The key question is whether institutional demand can absorb the selling pressure around $3,850, or whether rising rate expectations and continued dollar strength will push Gold toward lower levels. ⚠️ Educational analysis only. Not financial advice. #ByXIMPACT

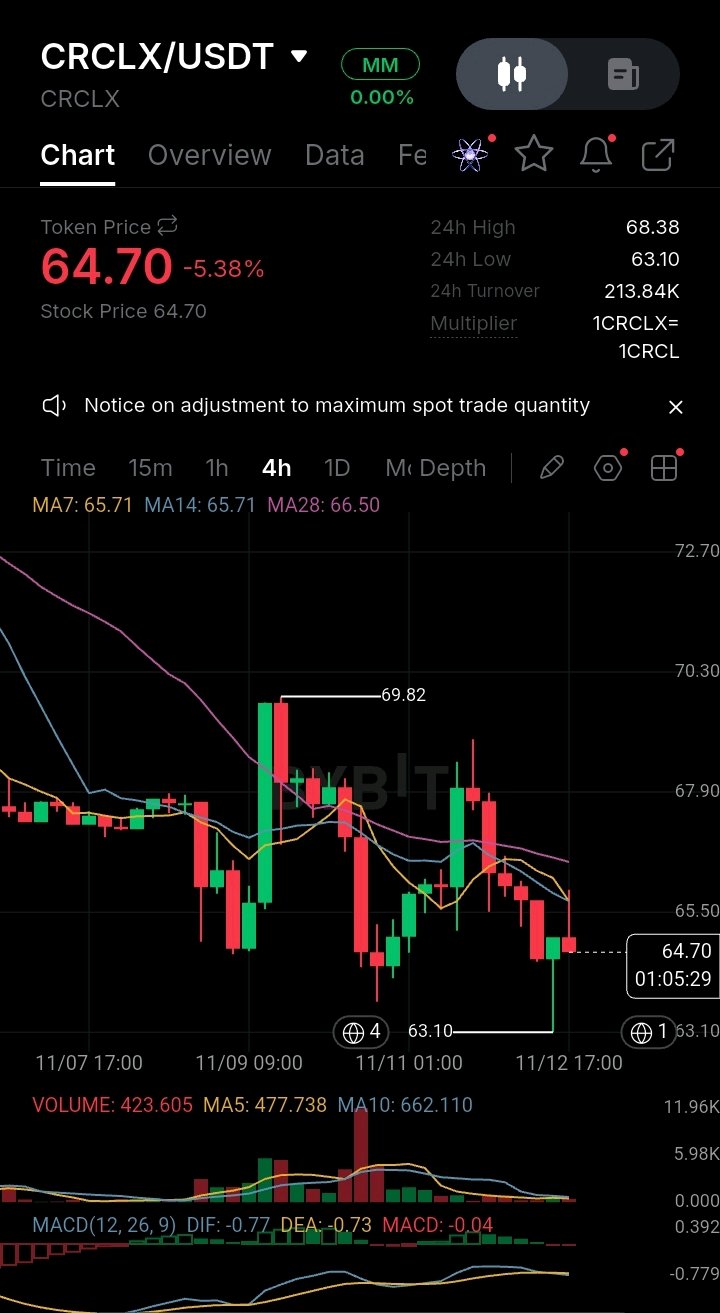
🔍 Market Analysis: $CRCLXUSDT | Circle Faces Renewed Selling Pressure as Regulatory Uncertainty Weighs on Market Sentiment (4H Chart) CRCLx is testing a critical support area near $63.10 as continued selling pressure pushes price below key moving averages. CRCLx is currently trading at $64.70, down 5.38% over 24 hours, following a rejection from the $69.82 swing high. The recent decline suggests that sellers are maintaining control of the short-term market structure. Technical Analysis: The 4H structure remains bearish, with price trading below all three moving averages: MA7: $65.71 MA14: $65.71 MA28: $66.50 MACD also confirms negative momentum. DIF stands at -0.77 against DEA at -0.73, with a histogram of -0.04. Current volume is 423.605, below the MA5 of 477.738 and MA10 of 662.110. This suggests relatively weak trading participation, indicating that buyers have yet to demonstrate sufficient strength to reverse the current selling pressure. Fundamental & News: Circle reported strong Q3 2026 financial results, with total revenue and reserve income reaching $865 million, representing 17% year-over-year growth. Average USDC circulation increased 8% to $73.3 billion, while USDC on-chain transaction volume surged 49% to $13.9 trillion. However, a significant regulatory development takes effect on November 12, as the European Banking Authority assumes direct supervision of USDC under the EU's MiCA framework following its classification as a significant e-money token. This could introduce additional capital, reserve and liquidity requirements for Circle's European operations, potentially increasing compliance costs. On the positive side, Circle recently partnered with Global Citizen to expand economic opportunities across Africa through digital financial innovation, highlighting its continued expansion into global payment infrastructure. This creates a clear conflict between strong USDC adoption and growing institutional demand for digital payments versus short-term regulatory and market uncertainty. Market Outlook: Bullish: Defending $63.10 and reclaiming $65.71 could open a recovery toward $66.50 and $67.90. Bearish: A confirmed 4H breakdown below $63.10 could expose the $60 psychological support area. Invalidation: A sustained 4H recovery above $67.90 would weaken the current bearish structure. The key question is whether buyers can defend the $63.10 support area, or whether continued selling pressure and regulatory uncertainty will push CRCLx toward lower levels. ⚠️ Educational analysis only. Not financial advice. #ByXIMPACT

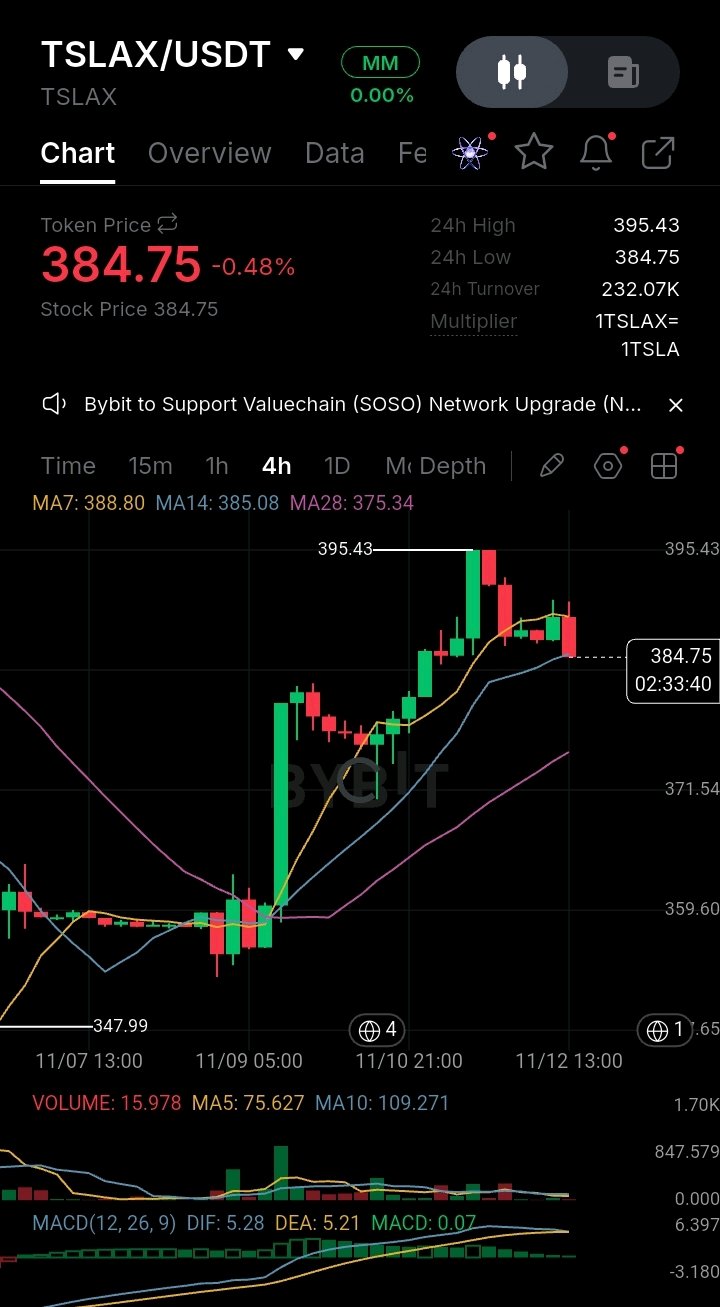
🔍 Нарықты талдау: $TSLAXUSDT | Тесла қарқынды өсуден кейін шоғырлануда, ал сатып алушылар 395 доллар маңында қарсылыққа тап болды (4 сағаттық график) Тесла қарқынды көтерілуден кейін қысқа мерзімді шоғырлану белгілерін көрсетуде, баға 395,43 доллар қарсылық аймағында импульсті сақтап қалуға тырысуда. TSLAx қазіргі уақытта 347,99 долларлық минимумнан кейін қалпына келуден кейін 24 сағат ішінде 0,48%-ға төмендеп, 384,75 долларға саудалануда. Жақында болған құлдырау сатып алушылардың алдыңғы раллиден кейін демалыс алып жатқанын көрсетеді. Техникалық талдау: 4 сағаттық құрылым сақтықпен болса да өсу тенденциясын сақтап тұр, баға MA28-ден жоғары тұр, бірақ MA7-ден төмен және MA14-тен сәл төмен саудалануда: MA7: 388,80 $ MA14: 385,08 $ MA28: 375,34 $ MACD оң импульстің әлсірегенін көрсетеді. DIF 5,28 деңгейінде, DEA 5,21 деңгейіне қарсы, гистограмма 0,07. Ағымдағы көлем 15,978-ді құрайды, бұл MA5 (75,627) және MA10 (109,271) көрсеткіштерінен айтарлықтай төмен. Бұл қазіргі шоғырлану кезеңінде сауда белсенділігінің төмендегенін білдіреді. Фундаменталдық және жаңалықтар: Тесла өзінің автономды жүргізу және AI стратегиясын ілгерілетуді жалғастыруда, соңғы бірнеше оқиға нарық назарын аударды. 11 қарашада Финляндия Тесланың қадағаланатын Full Self-Driving жүйесін «Tesla Assisted Driving» атауымен мақұлдады, бұл оның еуропалық кеңеюіндегі тағы бір қадам болды. Сонымен қатар, Тесланың 2026 жылғы 3-тоқсандағы жаңартуы Солтүстік Америкадағы жаңа көліктерді жеткізудің 75%-дан астамы FSD жазылымдарын қамтитынын, ал оның Robotaxi операциялары жиынтық есептеу бойынша 2 миллион мильге жуық қадағалаусыз жүрісті құрағанын хабарлады. Осы арада Илон Маск өтелмеген тапсырыстарды орындау үшін Cybertruck өндірісін 2027 жылдың жазына дейін ұзарту жоспары туралы жариялады, бұл компанияның өндірістік стратегиясына енгізілген түзетулерді көрсетеді. Бұл әзірлемелер Тесланың автономды ұтқырлық пен AI саласындағы ұзақ мерзімді амбицияларын нығайтады, дегенмен реттеуші мақұлдаулар, орындау тәуекелдері және бәсекелестік маңызды қиындықтар болып қала береді. Нарық болжамы: Өсу тенденциясы (Bullish): 385 доллар аймағын ұстап тұру және 388,80 доллар деңгейін қайтару 395,43 долларға және одан жоғары деңгейлерге қарай қалпына келуге жол ашуы мүмкін. Төмендеу тенденциясы (Bearish): 375,34 доллардан төмен 4 сағаттық құлдыраудың расталуы 371,54 долларлық қолдау аймағын ашуы мүмкін. Жарамсыз болуы: 395,43 доллардан жоғары 4 сағаттық серпіліс өсу сценарийін нығайтады. Басты сұрақ - сатып алушылар 388,80 доллардан жоғары бақылауды қайтара ала ма және 395 долларлық қарсылықты сынай ала ма, әлде әлсіреген импульс тереңірек түзетуге әкеле ме? ⚠️ Тек білім беру мақсатындағы талдау. Қаржылық кеңес емес. #ByXIMPACT

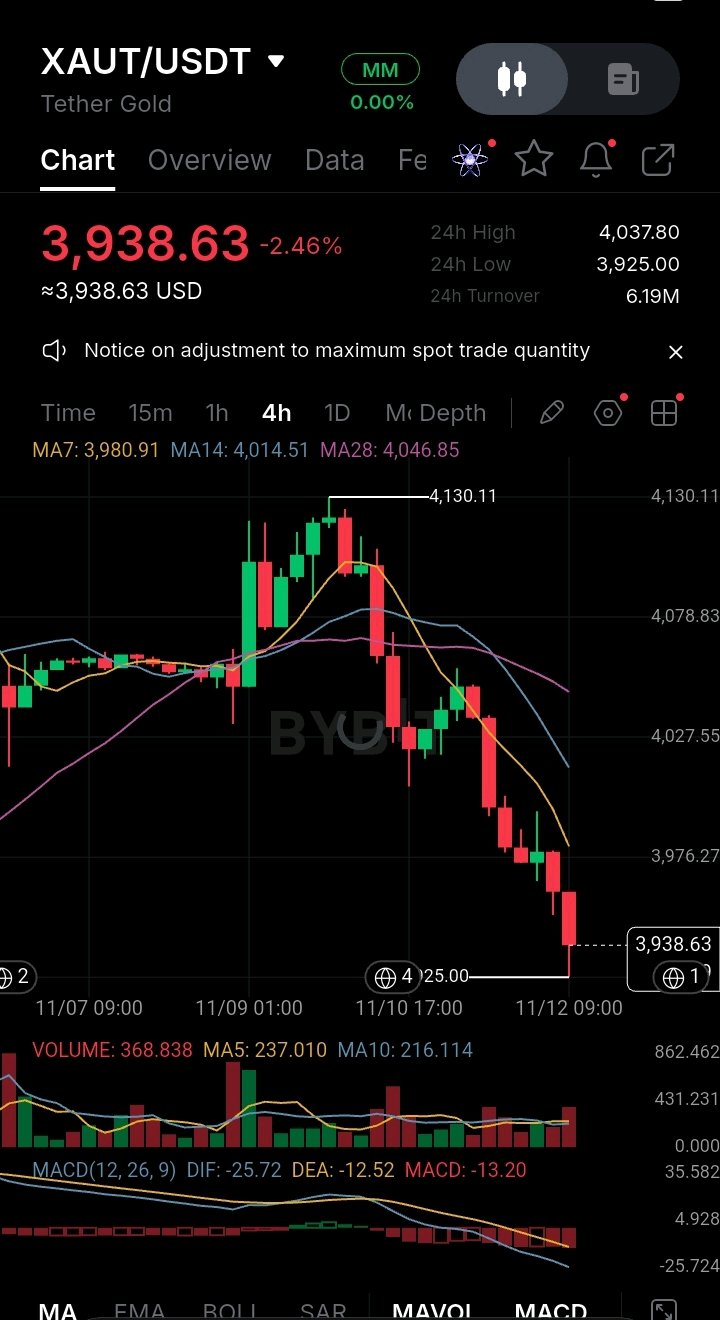
🔍 Market Analysis: $XAUTUSDT | Gold Extends Its Decline as Selling Pressure Intensifies (4H Chart) Gold is facing renewed selling pressure as bearish momentum continues to dominate the market, pushing prices closer to the critical $3,925 support area. XAUT is currently trading at $3,938.63, down 2.46% over 24 hours, following a rejection from the $4,130.11 swing high. Technical Analysis: The 4H structure remains bearish, with price trading below all three moving averages: MA7: $3,980.91 MA14: $4,014.51 MA28: $4,046.85 MACD also confirms negative momentum. DIF stands at -25.72 against DEA at -12.52, with a histogram of -13.20. Current volume is 368.838, above MA5 at 237.010 and MA10 at 216.114. This suggests increased trading activity during the latest selling move, supporting the current bearish structure. Fundamental & News: Gold continues to face macroeconomic pressure as stronger US inflation data and rising Federal Reserve rate expectations strengthen the US dollar and Treasury yields. US October CPI increased 0.4%, exceeding the 0.3% forecast, reinforcing concerns that monetary policy could remain restrictive for longer. However, longer-term demand remains supported by central bank gold purchases and continued institutional interest in precious metals. This creates a clear conflict between short-term macroeconomic pressure and longer-term structural demand for Gold. Market Outlook: Bullish: Defending $3,925 and reclaiming $3,976 could open a recovery toward $3,980 and $4,014. Bearish: A confirmed 4H breakdown below $3,925 could expose the $3,900 psychological support area. Invalidation: A sustained 4H recovery above $4,047 would weaken the current bearish structure. The key question is whether buyers can defend the $3,925 support area, or whether continued selling pressure and rising rate expectations will push Gold toward lower levels. ⚠️ Educational analysis only. Not financial advice. #ByXIMPACT

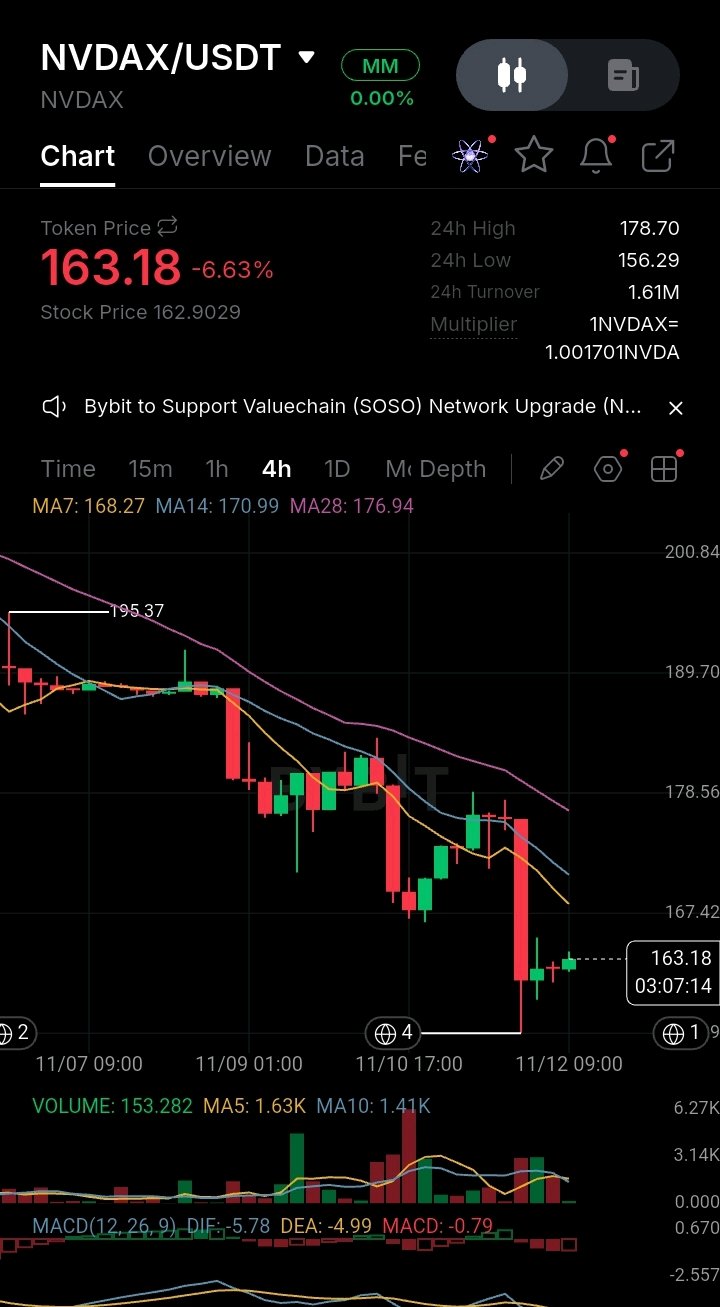
🔍 Market Analysis: $NVDAXUSDT | NVIDIA Faces Renewed Selling Pressure Amid Leadership Uncertainty and China Export Concerns (4H Chart) NVDAx is facing significant selling pressure as growing uncertainty surrounding NVIDIA's leadership and US-China chip export restrictions weigh on market sentiment. The token is currently trading at $163.18, down 6.63% over 24 hours, following a sharp decline from the $195.37 swing high. Price recently tested the $156.29 area before attempting a small recovery. Technical Analysis: The 4H structure remains bearish, with price trading below all three moving averages: MA7: $168.27 MA14: $170.99 MA28: $176.94 MACD also confirms negative momentum. DIF stands at -5.78 against DEA at -4.99, with a histogram of -0.79. Current volume is 153.282, significantly below MA5 at 1.63K and MA10 at 1.41K. This suggests that buying participation remains relatively weak despite the recent recovery attempt. Fundamental & News: NVIDIA is facing increased market uncertainty following reports of a board investigation involving CEO Jensen Huang and concerns surrounding potential leadership changes. On November 12, US senators also called for the preservation of records relating to NVIDIA's chip exports to China, adding further pressure to the company's regulatory outlook. Additionally, Baird recently downgraded NVIDIA from Buy to Neutral and reduced its price target from $500 to $200, citing China export restrictions and concerns about future AI spending. However, the long-term AI infrastructure opportunity remains an important fundamental driver. NVIDIA's upcoming quarterly earnings on November 17 could provide fresh insight into demand for its GPUs and the company's future growth outlook. This creates a clear conflict between NVIDIA's long-term AI growth potential and the short-term uncertainty surrounding leadership, regulation and investor confidence. Market Outlook: Bullish: Defending $156.29 and reclaiming $168.27 could open a recovery toward $170.99 and $176.94. Bearish: A confirmed 4H breakdown below $156.29 could expose the $150 region. Invalidation: A sustained 4H recovery above $176.94 would weaken the current bearish structure. The key question is whether buyers can defend the $156 support area and restore confidence ahead of NVIDIA's upcoming earnings, or whether continued uncertainty will push NVDAx lower. ⚠️ Educational analysis only. Not financial advice. #ByXIMPACT