Crypto BOSS
129047Лайк92Акциялар1355Жанкүйерлер2Жазылу
📊 Crypto Boss 📈 Technical Analysis | Market Structure & Whale Dynamics 💎 Decoding Crypto Trends & Real-World Assets 👇 Explore Daily Setup & Deep Insights
📊 Crypto Boss 📈 Technical Analysis | Market Structure & Whale Dynamics 💎 Decoding Crypto Trends & Real-World Assets 👇 Explore Daily Setup & Deep Insights
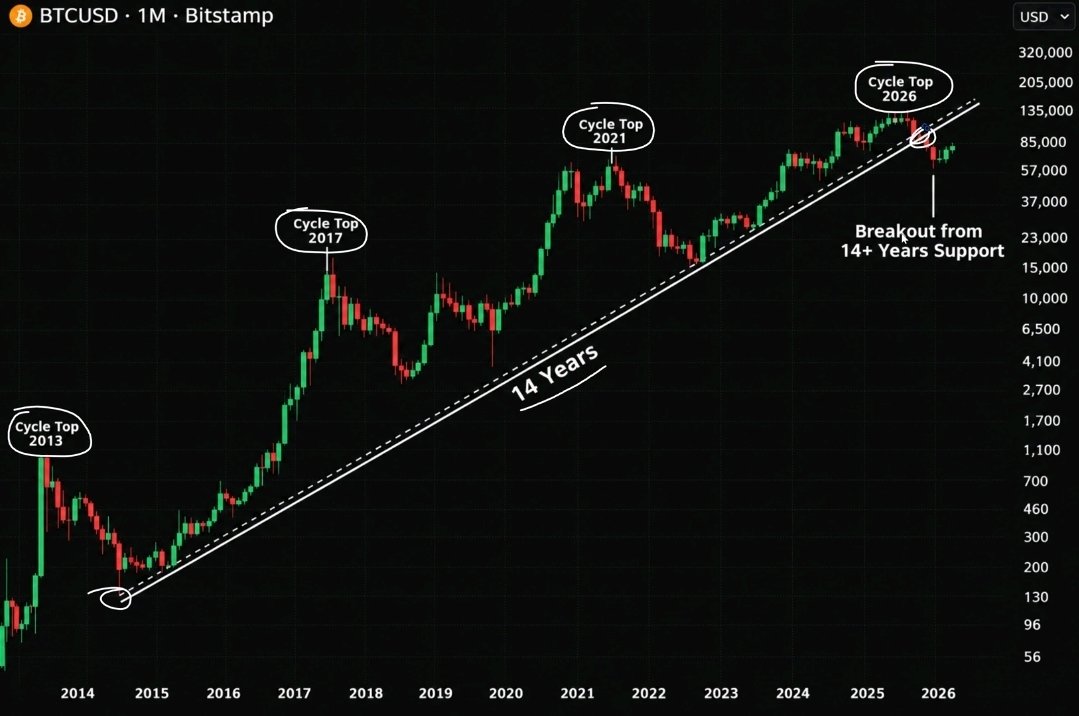
Bitcoin has finally broken below its 14-year trendline. And almost NOBODY understands how serious this could be. Look at the historical pattern: 2013 → Cycle Top. 2017 → Cycle Top. 2021 → Cycle Top. 2026 → Another major breakdown. For over a decade, this rising trendline has defined Bitcoin's long-term bullish structure. Now, for the first time, $BTC is trading BELOW it. But here's what everyone is MISSING: → Bitcoin has lost $70K. → The 200-week moving average near $68K has been breached. → $62K is the next critical level. → Below that, $58K comes back into play. This isn't just another ordinary correction. If Bitcoin fails to reclaim its broken support, we could be witnessing a MAJOR shift in the entire market cycle. One thing matters now: the MONTHLY CLOSE. A recovery could turn this into a massive BEAR TRAP. But a confirmed monthly breakdown would be a serious warning. Same Bitcoin. Different market structure. $BTCUSDT $SPCXXUSDT #ByXIMPACT

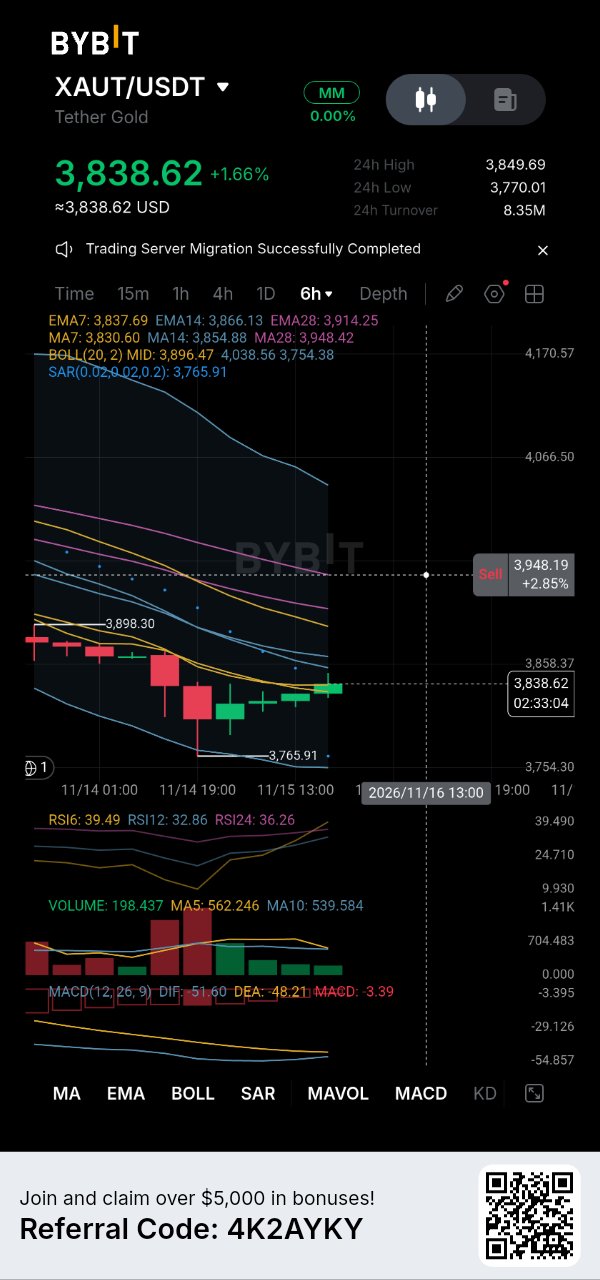
Tether Gold is trading near $3,838.62, up 1.6%, after falling toward the $3,765.91 area on the 6H chart. The latest candles show buyers attempting to stabilize the price. XAUT has moved back above EMA7 at $3,837.69 and MA7 at $3,830.60. That is an improvement, but I would not confuse short-term stabilization with a confirmed trend reversal. The bigger resistance remains overhead. EMA14 sits at $3,866.13, followed by the Bollinger midline at $3,896.47. A sustained move above these levels would provide stronger evidence that buyers are regaining control. Momentum still calls for patience. RSI6 is at 39.49, RSI12 at 32.86, and RSI24 at 36.26. MACD remains negative, with DIF at -51.60 against DEA at -48.21. The selling pressure may be easing, but bullish momentum has not been established. Volume adds another layer of caution: 198.4, compared with MA5 at 562.2 and MA10 at 539.6. The rebound is occurring with relatively limited participation. My focus is now on whether XAUT can hold $3,830 and reclaim $3,866. If it does, $3,896 becomes the next important test. Failure to hold the short-term averages could bring $3,800 and the previous low near $3,766 back into focus. I prefer to wait for confirmation rather than assign too much importance to a modest rebound. Is this the start of a stronger recovery, or simply a pause before another test of the lows? Not financial advice. $XAUTUSDT $BTCUSDT #ByXIMPACT

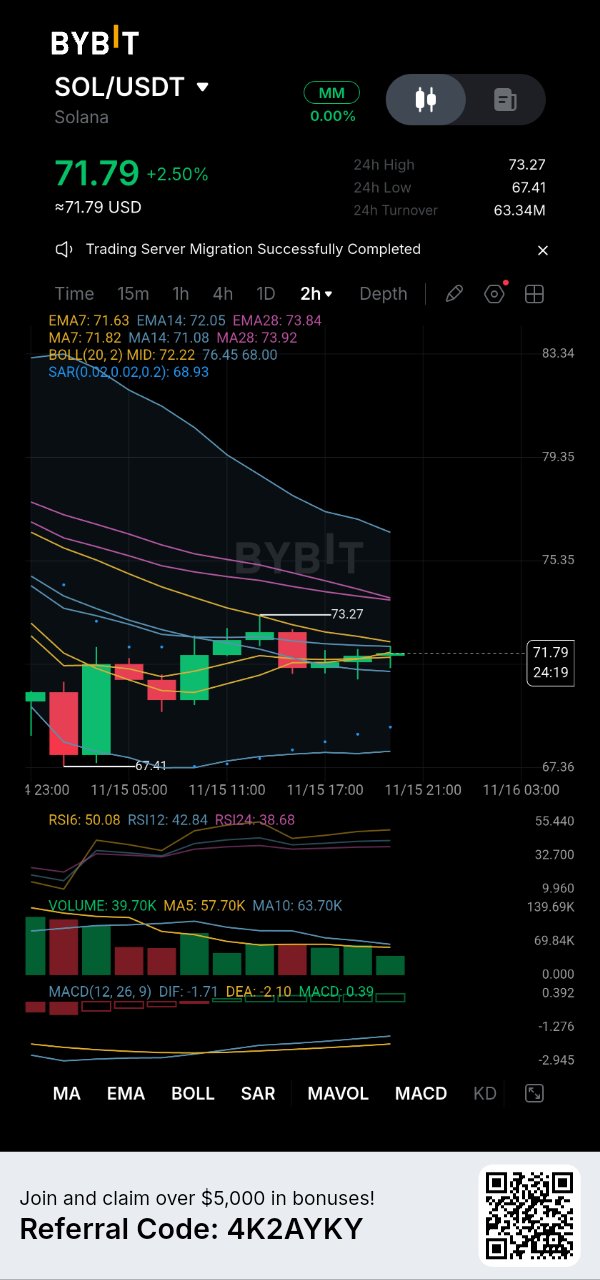
SOL is trading around $71.79, up 2.50% on the 2H chart, after recovering from the $67.41 low. What interests me is not the rebound itself, but whether buyers can turn this recovery into a more sustainable structure. There are some early improvements. RSI6 has returned to 50.08, and the MACD histogram has moved into positive territory at 0.39. Price is also holding near the short-term moving averages. However, the recovery still faces obstacles. The Bollinger midline around $72.22 and EMA14 near $72.05 form the first resistance zone. Above that, $73.27 is the recent local high, while the EMA28 around $73.84 remains another hurdle. Volume is the main caution: approximately 39.7K, below both the MA5 at 57.7K and MA10 at 63.7K. The price is recovering, but participation has not yet strengthened enough to confirm the move. My levels are straightforward: - Above $72.22: recovery gains credibility. - Above $73.27: buyers have a stronger case for continuation. - Below $71: momentum could weaken again. - Below $67.41: the current recovery structure would be invalidated. I would rather see SOL reclaim resistance with stronger volume than assume that one green move has changed the trend. The next few 2H candles should tell us more. Is SOL building a genuine recovery, or does it still need a deeper test of support? Not financial advice. $SOLUSDT $AAVEUSDT #ByXIMPACT

HYPE: 50.59 million tokens reportedly burned but the pace matters as much as the total. According to Odaily, citing Onchain Lens: - 47,700 HYPE were repurchased and burned over the reported 24-hour window. - Average purchase price: $66.37. - Purchase value: approximately $3.17 million. - Cumulative burns: 50.59 million HYPE, equivalent to 5.06% of maximum supply. What I find important is the distinction between cumulative supply reduction and current buying pressure. The latest 47,700-token burn represents roughly 0.094% of the cumulative total. It adds to the long-term reduction, but one strong day does not establish a sustainable trend. The $66.37 figure is a historical buyback average—not a guaranteed support level. Sellers can still overwhelm recurring purchases. My focus is net supply: tokens permanently removed versus tokens becoming available, alongside genuine demand. Burns alone do not tell us whether circulating supply is shrinking. For HYPE, the stronger thesis is sustained token removal not a headline dollar valuation or an automatic price target. Are you tracking daily burns or only the cumulative total? $HYPEUSDT $VVVUSDT #ByXIMPACT

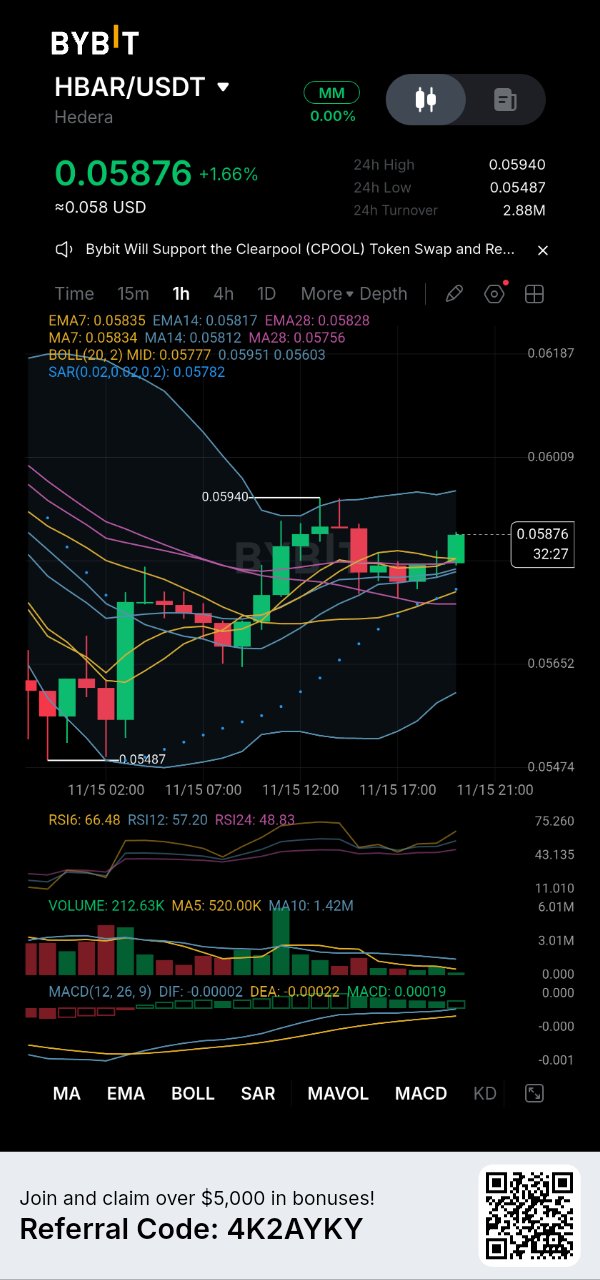
HBAR is methodically reclaiming lost ground, and I am keeping a tight leash on my active trade. The bears tried to dictate the narrative, but the buyers have firmly taken back the wheel. Looking at this 1-hour chart, the price defended the 0.05487 trench and is now driving upward to 0.05876. It is currently pressing against the moving average ribbon, testing the immediate ceiling. Here is my technical reality check: The Power: The MACD has just printed a fresh bullish cross, and the SAR dots are anchored below at 0.05782. The momentum has clearly swung in favor of the bulls. The Danger: The RSI is climbing at 66.48, and the price is staring down the upper Bollinger Band at 0.05951. Furthermore, the local high of 0.05940 is acting as a stubborn lid. A brief pause is expected before breaking through. The Foundation: The EMA cluster (0.05817 - 0.05835) is providing a solid, unyielding cushion, preventing any structural collapse. My Execution Strategy and Risk Management: I am avoiding the urge to chase the momentum here. My Plan for Existing Positions: Since my entry is already locked in from the lower base, I am sitting comfortably in the green. Treating this exact consolidation as the structural floor means buying now is buying the bottom. I am actively managing my winner to hold my ground and ride the continuation. My Ironclad Stop Loss: I have mapped a strict exit trigger just beneath the absolute swing low at 0.05400. If sellers drag the price below this threshold, the setup is void, and I cut the position instantly. No hesitation, just pure discipline. My Target: A decisive breakthrough above the recent 0.05940 peak to unlock further price discovery. I am trading the structure, safeguarding my capital, and letting the market play out. Are you managing your HBAR position through this setup with me? $HBARUSDT $INITUSDT #ByXIMPACT

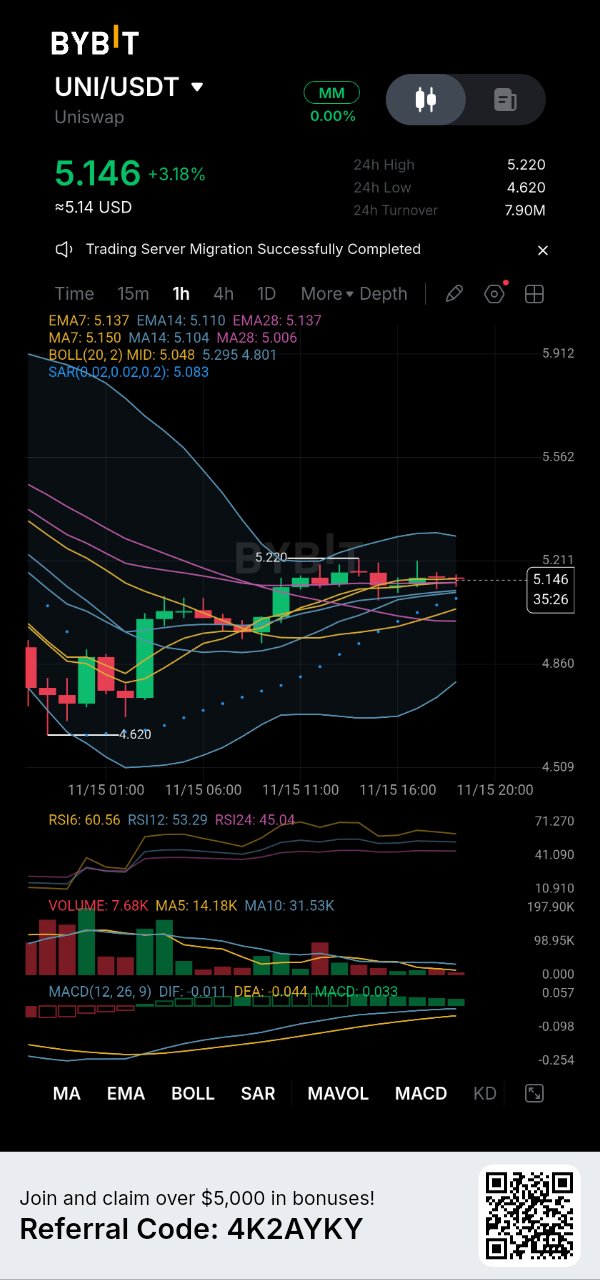
UNI is currently flexing immense resilience, and I am navigating my active trade through this vital testing phase. The bears tried to drag it down, but the buyers are firmly holding the line. Looking at this 1-hour chart, the bulls defended the 4.620 valley perfectly. After a strong bounce, the asset is now compressing tightly at 5.146, wrestling directly with the moving average ribbon to establish a new base. Here is my technical reality check: The Power: The MACD is displaying a clear bullish crossover with a green histogram, and the SAR dots at 5.083 are solidifying the upward bias. The Danger: The RSI is hovering neutrally at 60.56. Furthermore, the price is wrestling with the Bollinger Band midline (5.048) and facing immediate resistance at the local high of 5.220. The Foundation: The EMA cluster (5.110 - 5.137) forms a concrete bedrock, absorbing selling pressure and keeping the bullish structure intact. My Execution Strategy and Risk Management: I am executing with calculated precision, avoiding any emotional entries. My Plan for Existing Positions: Since my ticket is already green from the lower accumulation, I view this current pause as the ultimate ground floor. Treating this exact consolidation as the structural floor means buying now is buying the bottom. I am actively managing my winner to hold my ground and ride the continuation. My Ironclad Stop Loss: I have anchored my strict exit trigger just beneath the absolute swing low at 4.600. If sellers force a break below this threshold, the recovery is invalid, and I cut the position instantly. No hoping, just pure discipline. My Target: A decisive breakthrough above the recent 5.220 peak to unlock fresh price discovery. I am trading the structure, protecting my downside, and letting the market do the heavy lifting. Are you managing your UNI position through this setup with me? $UNIUSDT $GRAMUSDT #ByXIMPACT

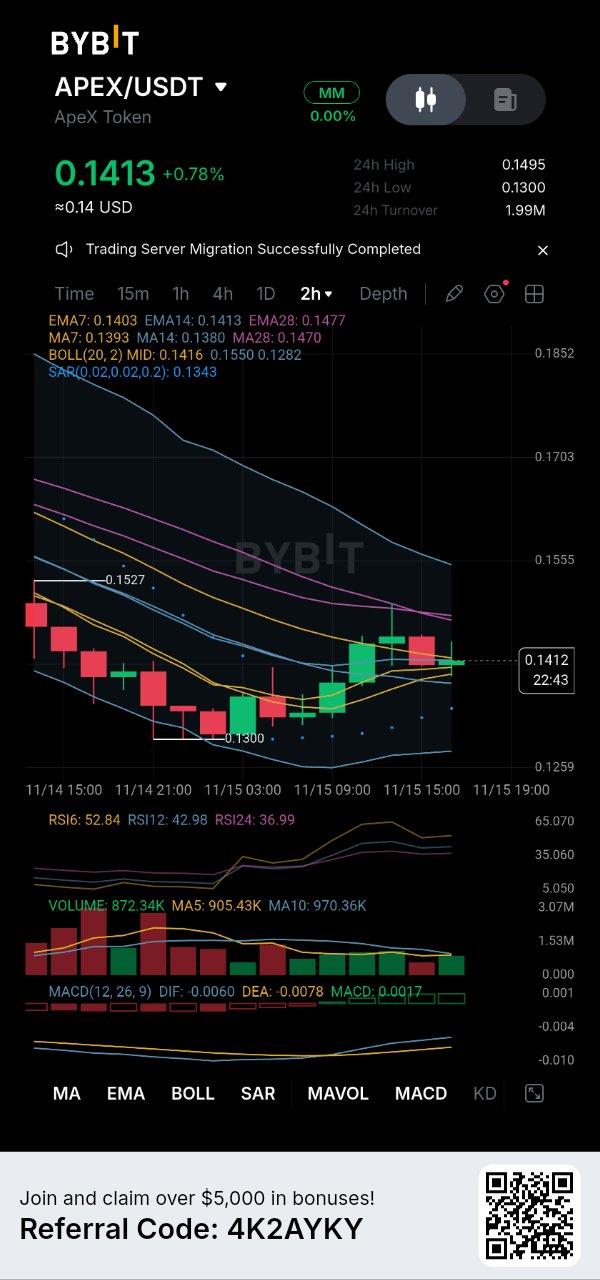
APEX is currently printing a convincing recovery pattern, and I am keeping a firm grip on my active position. The bears had their run, but the tide is quietly turning. Looking at this 2-hour chart, the asset clawed its way back from the 0.1300 abyss. It is now pressing against the EMA cluster at 0.1413, attempting to break the short-term downtrend and establish a new base. Here is my technical reality check: The Power: The MACD just executed a bullish cross with the histogram turning green, while the SAR dots act as a safety net below at 0.1343. The selling momentum is clearly exhausted. The Danger: The RSI sits at a cautious 52.84. Additionally, the EMA28 at 0.1477 remains a heavy overhead ceiling that must be shattered to confirm the trend reversal. The Foundation: The lower Bollinger Band at 0.1282 is holding strong, providing a sturdy bedrock for this recovery to build upon. My Execution Strategy and Risk Management: I am avoiding the urge to blindly chase green candles. My Plan for Existing Positions: Since my entry is already locked in from the lower bounce, I am in the green. Treating this consolidation as the definitive structural floor means buying now is buying the bottom. I am actively holding my ground to ride the upcoming continuation. My Ironclad Stop Loss: I have mapped a strict exit trigger just beneath the absolute swing low at 0.1280. If sellers drag the price below this threshold, the recovery is void, and I cut the position instantly. No hesitation. My Target: A decisive breakthrough above the recent 0.1495 peak to explore uncharted price territory. I am trading the structure, protecting my downside, and letting the market do the heavy lifting. Are you managing your APEX position through this setup with me? $APEXUSDT $GLMRUSDT #ByXIMPACT

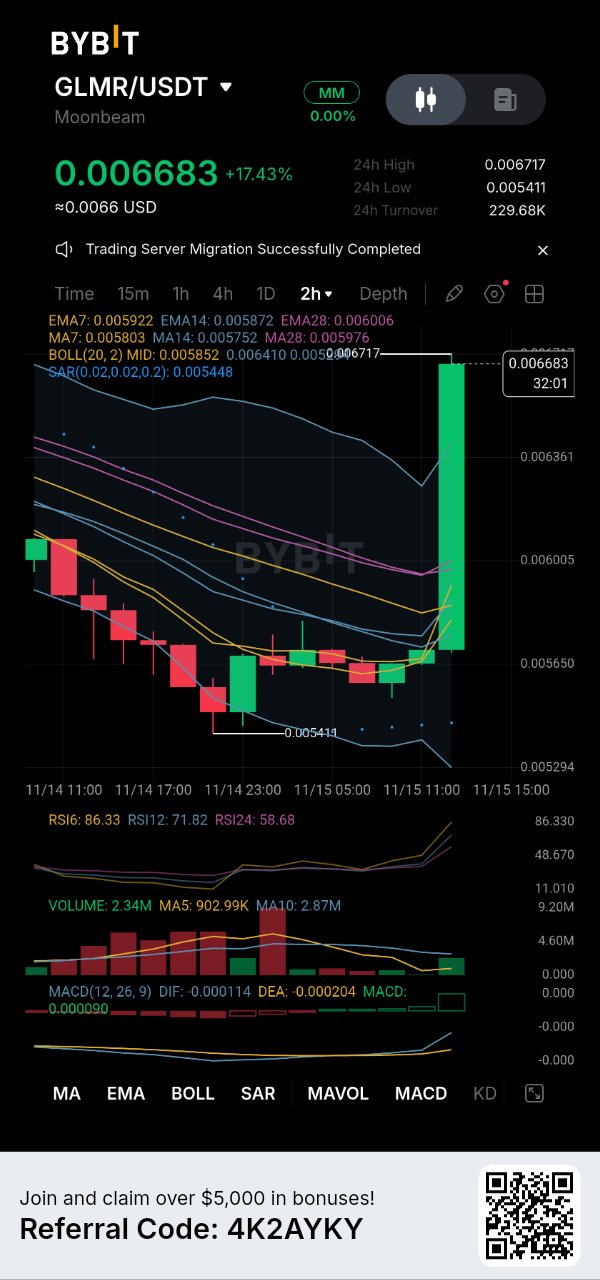
SPCXX жексенбі күні 135 долларлық IPO бағасын қорғап қалды, дәл осы мен бақылағанды ұнататын деңгей. 14 қараша күні сағат 21:00 шамасында ол 133,51 долларға дейін түсті, бұл SpaceX-тің 12 маусымда өз акцияларын сатқан 135 долларлық бағасынан сәл төмен, бірақ сатып алушылар оны бірден қайтарып алды. Сағат 03:00-де үлкен жасыл шам шамамен 1,9%-ға өсті, ал содан бері ол 15:00-де 138,95 долларға дейін көтерілді. Сағат 17:00-де ол 138,68 долларды құрады, 7 кезеңдік орташа көрсеткіштің 138,06 доллар деңгейінде, яғни күніне 2,54%-ға өсті. 2 сағаттық RSI6 көрсеткіші 78-ге жақын, сондықтан мен оның өздігінен келуін күткен жөн деп ойлаймын. Төмендеу кезінде кіруге тұрарлық аймақ — 14 және 28 кезеңдік орташа көрсеткіштер орналасқан 136,80 доллардан 137,70 долларға дейінгі аралық, ал егер баға 136,00 доллардан төмен жабылса, идея қате деп саналады. 138,95 долларлық ең жоғары деңгейдегі ішінара сату алғашқы кезеңді бекітеді, ал 141,50 долларға дейінгі толық қозғалыс 3-тің 1-ге қатынасындай нәтиже береді. Демалыс күндерінде өтімділік төмен және дүйсенбідегі ашылуда алшақтық (gap) болуы мүмкін, сондықтан мен көлемді шағын ұстап, стоп-лосс ордерін осыны ескере отырып қояр едім. Мұндай акцияда сіз үшін не маңыздырақ: IPO бағасының қолдау ретіндегі рөлі ме, әлде дүйсенбідегі алғашқы шам ба? Бұл тек менің пікірім, қаржылық кеңес емес. $SPCXXUSDT $NVDAXUSDT #ByXIMPACT

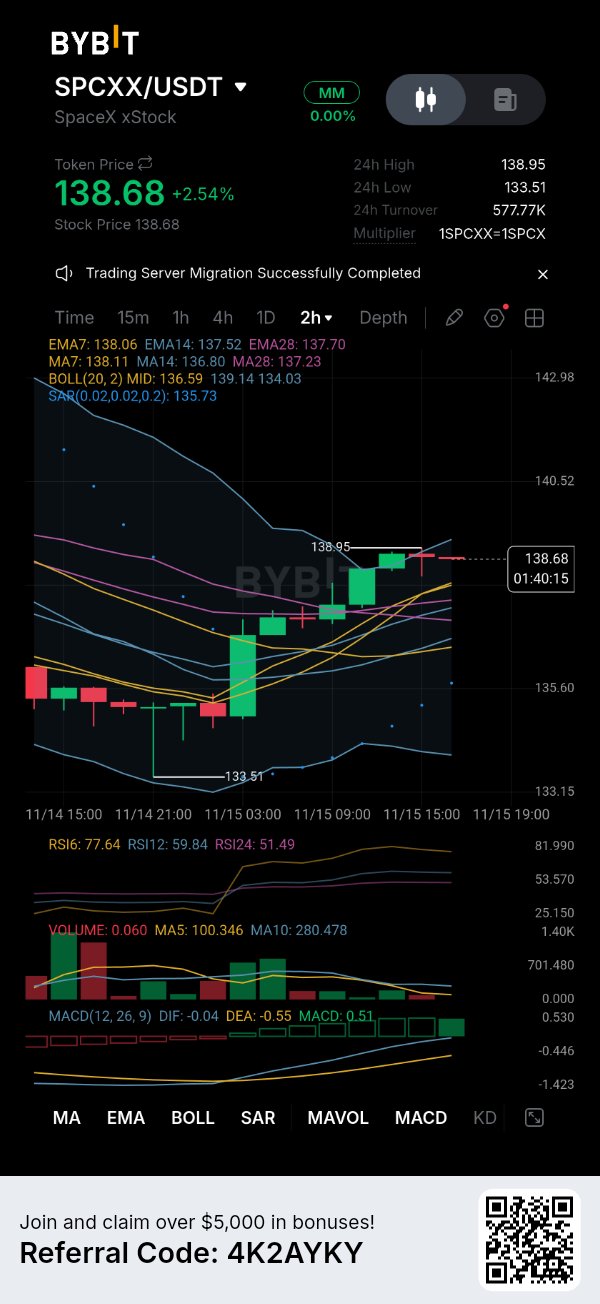
CSPR қазір нағыз жанартау атқылауындай әсер қалдыруда, мен болсам осы дүмпулі құбылмалылық кезінде өз белсенді саудамды абайлап жүргізіп жатырмын. Нарық қызу қарбаласта, бірақ менің тәртібім маған сабыр сақтауға көмектесуде. Мен ешқашан көпшіліктің шуылына еріп, тәуекелдерді бағалау қабілетімнен айырылмаймын. Осы 2 сағаттық графикті қарасақ, бұқалар (bulls) ойсырататын тік шабуыл жасады. Біз 0.001527 деңгейіндегі ұйқылы-ояу негізден бірден 0.002160 шыңына дейін атып шықтық. EMA таспасы алыста қалып, әлдеқайда төмендегі парашют секілді көрінеді. Міне, менің техникалық сараптамам: Күші: MACD орасан зор жасыл энергиямен кеңейіп жатыр, ал SAR нүктелері 0.001527 деңгейінде бекітілген, бұл сатып алушылардың толық үстемдігін растайды. Қаупі: RSI көрсеткіші 89.80-ді нұсқап тұр. Бұл өте жоғары, басты айналдырарлық биіктік, баға болса жоғарғы Боллинджер белдеуінен әлдеқайда жоғарыда қалықтап тұр. Кенеттен болатын күрт кері құлдырау сөзсіз дерлік. Менің орындау стратегиясы және тәуекелдерді басқару: Мен есептелген ұстамдылықпен әрекет етудемін. Бұл параболалық өрлеудің шыңын қуудан аулақпын. Қолданыстағы позициялар бойынша жоспарым: Кіру нүктелерім төменгі траншеялардан қамтамасыз етілгендіктен, мен қазір қомақты пайда көріп отырмын. Осы шоғырлануды құрылымдық негіз ретінде қарастыру – қазір сатып алу арқылы төменгі деңгейден ұстау деген сөз. Мен жеңімпаз позициямды басқара отырып, өз орнымды сақтап қалуға және трендтің жалғасын күтуге тырысамын. Менің мызғымас Stop Loss-ым: Мен өзімнің қатаң шығу триггерімді 0.001480-дегі абсолютті swing low деңгейінің дәл астына бекіттім. Егер сатушылар бағаны осы шектен төмен түсірсе, бүкіл болжамым күл-талқан болады да, мен сауданы дереу тоқтатамын. Үміттену жоқ, тек таза тәртіп. Мақсатым: Соңғы 0.002160 шыңынан жоғары бағаны барынша ашу. Мен құрылымға сай сауда жасап, тәуекелдерімді қорғап, трендтің дамуын бақылап отырмын. Сіз де CSPR позицияңызды осы дүмпу кезінде менімен бірге басқарып жатырсыз ба? $CSPRUSDT $INITUSDT #ByXIMPACT

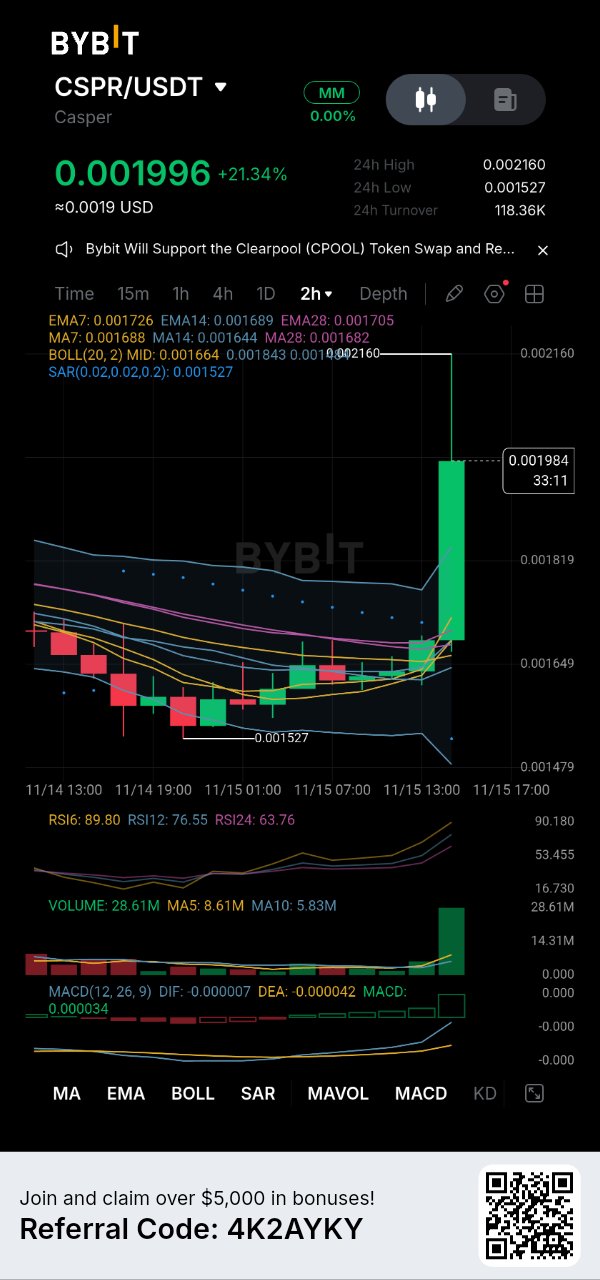
⚡ $HYPE: $60-дан +12% секіріс — шынайы өзгеріс пе, әлде үлкен құлдырау ішіндегі жай ғана түзету ме? Баға 60.063-тен бастап бірнеше сессияда 69-ға жуықтады (қазір 67.37 деңгейінде, +0.74%). Бұл қуантарлық жағдай, бірақ мен дәлелдерін тексермейінше, бұл оқиғаға сенбеймін. Менің толық талдауым: 1️⃣ Секіріске не түрткі болды? Биржадағы басты жаңалық: "Сауда серверінің көшірілуі сәтті аяқталды." Көшіруден кейінгі инфрақұрылымның тұрақтылығы, әсіресе HYPE сияқты өтімділікке сезімтал активтерде, көбінесе сатып алушылардың сенімін қалпына келтіреді. 2️⃣ SAR ерте сигнал берді 🟢 SAR 60.914-ке ауысты — бұл бағадан әлдеқайда төмен. Нүктелер енді сатып алушыларды қолдайды, бірақ SAR өз табиғаты бойынша артта қалатын индикатор; оған ғана сүйенуге болмайды. 3️⃣ ⚠️ Көлем жағдайды бұзып тұр Ағымдағы көлем: 8.44K, ал орташа көрсеткіш 92.64K — қалыпты деңгейдің 10%-ынан да аз! Осындай көлеммен болған секіріс = жауынгерлері жоқ шабуыл сияқты. Немесе тыныш жинақтау басталып жатыр, немесе шешім қабылданғанға дейін нақты қатысушылар жоқ. Негізгі сұрақ осында. 4️⃣ Нағыз шайқас: 68.1–68.7 қарсылық кластері • Баға EMA28 (68.083) және MA28 (68.689) деңгейлерінен төмен — бұл аюлардың қорғанысының соңғы шебі • Бейтарап RSI (54.99 / 48.72 / 45.35) — артық сатылған да емес, артық сатып алынған да емес = шешімсіздік • MACD: DIF (1.045) нөлден жоғары, бірақ DEA-дан төмен қиылысты — серпін дәл шешім қабылдайтын аймақта бәсеңдеп барады • Bollinger: баға ортаңғы жолақта (67.023) — бұл жалғасу мен серпіліс әрекеті арасындағы бөлу сызығы 5️⃣ Осы сауда басқарылатын деңгейлер: • 69.008 — 24 сағаттық ең жоғарғы мән. Оны бұзу 71.58 (Bollinger жоғарғы жолағы) деңгейін ашады • 66.0–66.9 — қолдау кластері (EMA7 + MA7 + MA14). Сатып алушылардың қазынасы • 62.54 — Bollinger төменгі жолағы • 60.063 — ең төменгі мән. Оны жоғалту секірістің толықтай елес болғанын білдіреді 🎯 Менің сауда жоспарым, сандармен: Негізгі сценарий (қайта тексеру кезінде сатып алу — шартты түрде): Кіру: 66.50–66.90 (кластерді қайта тексеру) SL (Stop Loss): 65.00 (кластердің астында, дем алуға мүмкіндік беретіндей) TP1: 69.00 | TP2: 71.50 R:R (Тәуекел/Табыс): TP1-ге ~1.7:1, TP2-ге ~3.3:1 ✅ Балама сценарий (бас тартуды қысқа позицияға айналдыру): Егер 68.70–69.00 деңгейіне жетіп, нақты бас тарту шамымен қайта оралса → қысқа позицияға кіру, 69.60-тан жоғары тоқтату, мақсаттар: 66.00, содан кейін 62.50 🧠 Ең үлкен сабақ: Менің ең табысты саудаларым — шамның артынан жүгірмей, растауды күткен саудаларым болды. HYPE қазір жол айырығында тұр: нақты көлеммен 69 деңгейінің бұзылуы = шынайы сатып алушының келуі. Көлем өспей тұрса = бұл секіріс сатылып кетеді. Нақты позиция $HYPE арқылы қоса берілді $HYPEUSDT $GLMRUSDT #ByXIMPACT

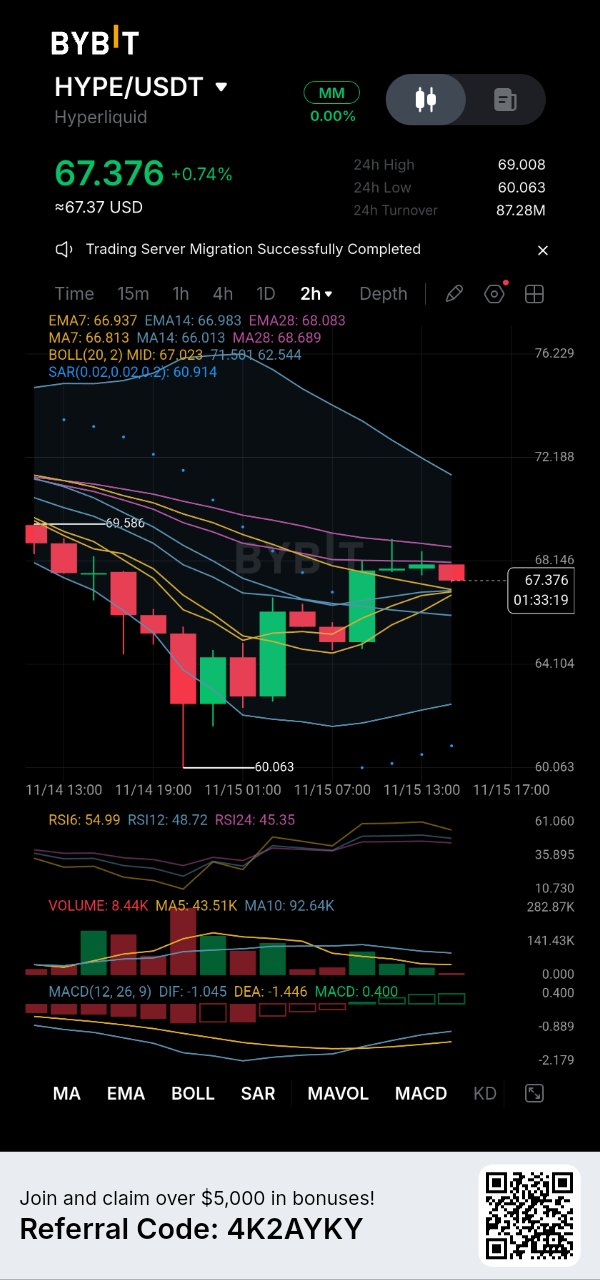
GLMR тыныштықты бұзып, күрт өсуді көрсетті, мен өз активімді осы серпінді толқын арқылы басқарып отырмын. Нарық ұйқыда еді, бірақ бұқалар тізгінді өз қолдарына алды. 2 сағаттық графикке қарасақ, көлемнің кенеттен артуы бағаны 0,005411 базасынан тікелей 0,006717 шыңына дейін көтерді. Актив қазір 0,006683 деңгейінде нық тұр және жылжымалы орташа таспаны толығымен қайтарып алды. Міне, менің техникалық сараптамам: Күш: MACD жарқын жасыл гистограммамен агрессивті түрде кеңейіп жатыр, ал SAR нүктелері 0,005448 деңгейінде бекітілген, бұл бұқалардың толық бақылауда екенін растайды. Қауіп: RSI 86,33 деңгейіндегі экстремалды мәнді көрсетіп тұр, ал баға Боллинджер жолағының жоғарғы сызығынан (0,006410) жоғары өтіп кетті. Бұл қатты шамадан тыс сатып алынған сигнал келесі өсу кезеңіне дейін қысқа мерзімді түзету немесе салқындау ықтималдығы жоғары екенін білдіреді. Негіз: Барлық EMA кластері (0,005872 - 0,006006) күрт өзгеріп, ауыр қарсылықтан астымыздағы мызғымас іргетасқа айналды. Менің орындау стратегиясым және тәуекелдерді басқару: Мен толық тәртіппен әрекет етемін, жасыл шамдардың менің эмоцияларыма әсер етуіне жол бермеймін. Бар позицияларға арналған жоспарым: Менің орным төменгі жинақтау кезеңінен бастап бекітілгендіктен, мен үлкен қорға иемін. Осы шоғырлануды құрылымдық негіз деп санасақ, қазір сатып алу – түбінен сатып алу деген сөз. Мен осы жарылысты жалғастыру үшін өзімнің ұтыс позициямды белсенді түрде басқарып отырмын. Менің қатал Stop Loss деңгейім: Мен өзімнің қатал шығу триггерімді 0,005300 деңгейіндегі абсолюттік төменгі көрсеткіштің астына бекіттім. Егер сатушылар бұл шекті бұзса, серпіліс жарамсыз болып табылады және мен сауданы дереу тоқтатамын. Үміттену жоқ, тек таза тәртіп. Менің мақсатым: Жаңа баға аумағын ашу үшін жақындағы 0,006717 шыңынан шешуші өсу. Мен құрылым бойынша сауда жасаймын, тәуекелдерді қорғаймын және нарықтың өзіне жұмыс істеуге мүмкіндік беремін. Сіз менімен бірге осы өсу кезінде GLMR позицияңызды ұстап тұрсыз ба? $GLMRUSDT $INITUSDT #ByXIMPACT

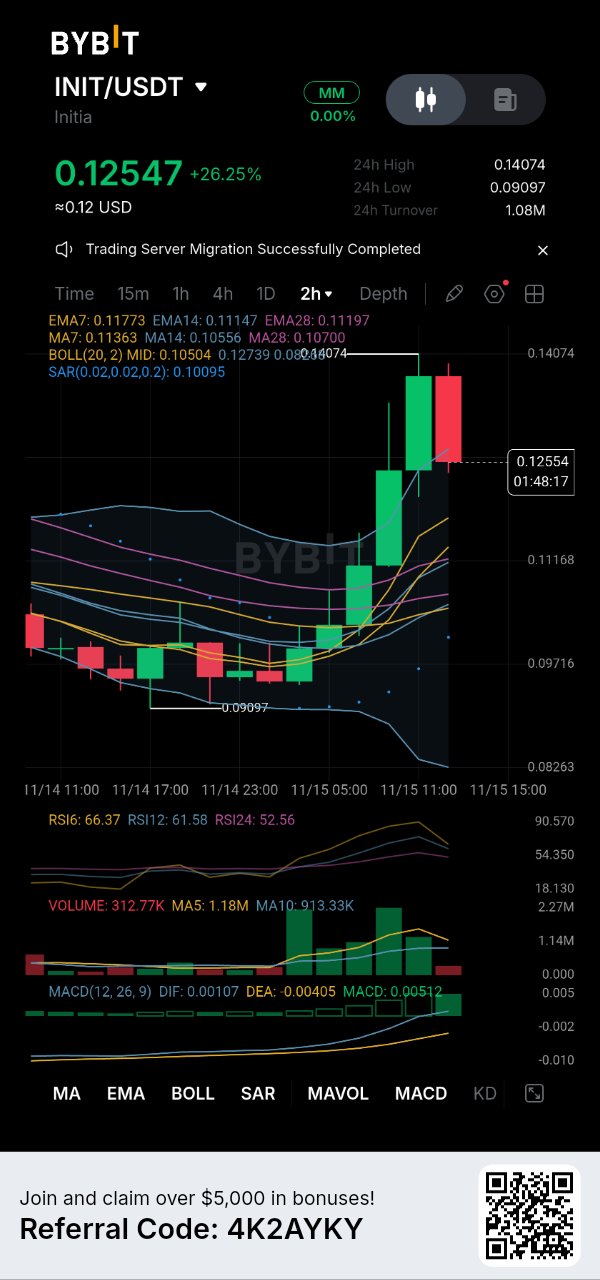
INIT таңқаларлық 26%-дық тік өсуді көрсетті, мен осы нарықтық эйфорияның жарылыс толқынында ашық саудамды белсенді түрде басқарып отырмын. Бұл 2 сағаттық графикке қарасақ, сатып алушылар нағыз дүрбелеңге түсті. 0.09097 тұңғиығының жанында шоғырланғаннан кейін, актив 0.14074 шыңына жету үшін барлық кедергілерді талқандап, тынымсыз шабуыл жасады. Қазіргі уақытта ол 0.12547 деңгейінде демалып, үлкен пайданы нық ұстап тұр. Міне, менің техникалық сараптамам: Күш: MACD жарқын жасыл гистограммамен қарқынды түрде кеңейіп жатыр, ал SAR нүктелері 0.10095 деңгейінде төменірек орналасып, нарықтағы «бұқалардың» бақылауын бекемдеуде. Қауіп: RSI 66.37 деңгейінде қызып тұр және баға жоғарғы Боллинджер белдеуінен (0.12739) сәл шегініп жатыр. Бұл келесі үлкен серпіліс алдындағы қажетті салқындау кезеңін білдіреді. Негізі: EMA кластерінің барлығы (0.11197 - 0.11773) толығымен қалпына келтірілді, бұрынғы кедергіні берік іргетасқа айналдырды. Менің орындау стратегиясы және тәуекелдерді басқару: Мен жасыл шамдардың эмоцияларыма әсер етуіне жол бермей, өте дәлдікпен әрекет етемін. Қолданыстағы позициялар бойынша жоспарым: Мен төменгі деңгейден кіру нүктесін бекітіп үлгергендіктен, айтарлықтай пайда көріп отырмын. Бұл шоғырлануды құрылымдық негіз ретінде қарастыру - қазір сатып алу түбін ұстау деген сөз. Мен позициямды ұстап тұру және жалғасын күту үшін белсенді түрде басқарып отырмын. Менің темірдей Stop Loss-ым: Мен шығынға қарсы қатаң шегіну триггерімді 0.09000 деңгейіндегі абсолюттік төменгі көрсеткіштің астына бекіттім. Егер сатушылар бұл кедергіні бұзса, бүкіл болжамым жойылады және мен дереу шығып кетемін. Ешбір күдіксіз, тек таза тәртіп. Менің мақсатым: Бағаның бұрын-соңды болмаған аумағын зерттеу үшін 0.14074 шыңынан шешуші серпіліс жасау. Мен құрылым бойынша сауда жасаймын, тәуекелімді қорғаймын және нарықтың негізгі жұмысты атқаруына мүмкіндік беремін. Сіз менімен бірге осы өсу кезінде INIT позицияңызды басқарып жатырсыз ба? $INITUSDT $NIGHTUSDT #ByXIMPACT

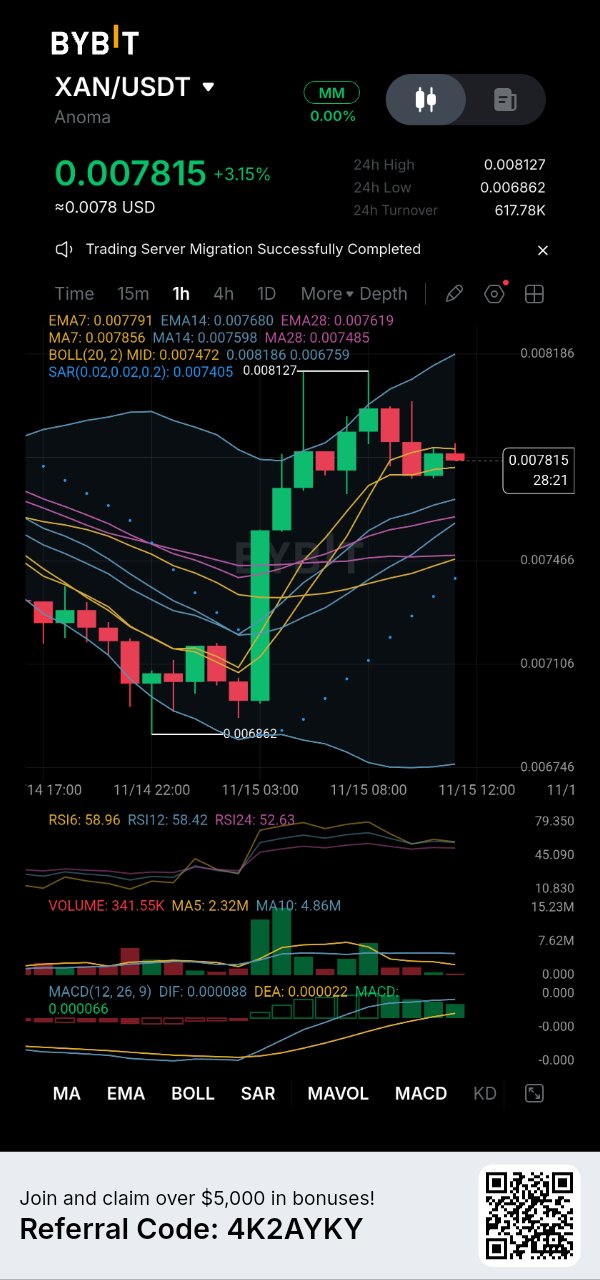
XAN is refusing to give back its recent gains. I am actively monitoring my open trade as the asset builds a fresh foundation above key support. Looking at this 1-hour chart, a sudden burst of volume launched the price from a 0.006862 base straight to a 0.008127 peak. The asset is now resting firmly at 0.007815, consolidating just above the moving average ribbon. Here is my technical reality check: The Power: The MACD is displaying solid green momentum, and the SAR dots are anchored far below at 0.007405, confirming the buyers are still holding the reins. The Danger: The RSI is sitting at a neutral 58.96, but the price is testing the upper Bollinger Band at 0.008186. This indicates we need a fresh surge in volume to break through the overhead ceiling. The Foundation: The EMA cluster (0.007619 - 0.007791) has been completely flipped into a sturdy support floor, absorbing any immediate selling pressure. My Execution Strategy and Risk Management: I am executing with pure logic, refusing to let the recent green candles cloud my judgment. My Plan for Existing Positions: Since I am already riding this wave, I am in profit. Treating this exact consolidation as the structural floor means buying now is buying the bottom. I am actively managing my winner to hold my ground and ride the continuation. My Ironclad Stop Loss: I am placing my strict stop loss just below the absolute swing low at 0.006800. If the price loses this structural floor, the momentum is dead, and I exit instantly. No hoping, just pure discipline. My Target: My primary target is pure price discovery above the recent high of 0.008127. I am trading the structure, protecting my downside, and letting the market do the heavy lifting. Are you managing your XAN position through this setup with me? $XANUSDT $NIGHTUSDT #ByXIMPACT

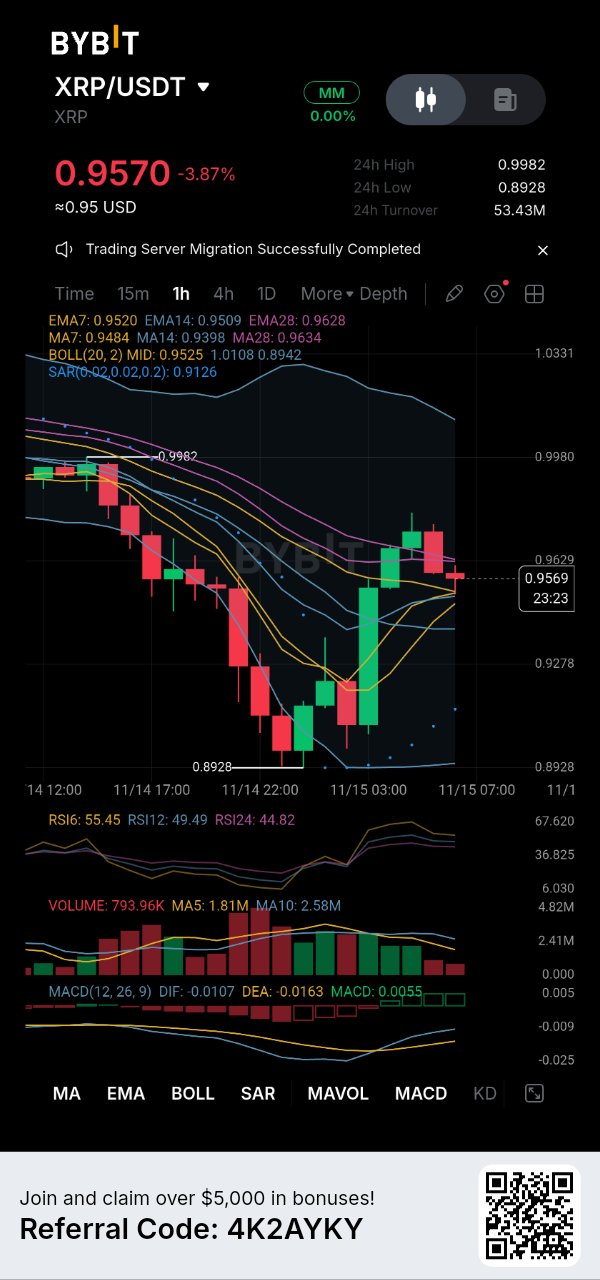
⚡ $XRP: 0.8928 деңгейінен серпіліс жасады: ақылды қалпына келу ме, әлде өтімділік тұзағы ма? 4,11%-дық күрт құлдыраудан кейін, XRP 0,8928-ден ~0,97-ге дейін көтерілді. Бұл импульске алдану оңай, бірақ егжей-тегжейінде қауіп жатыр: 1️⃣ Шын мәнінде не болды? 0,8928 деңгейіне құлдырау кездейсоқ емес еді — бұл алдыңғы төменгі деңгейден төмен өтімділікті жинау (liquidity sweep) болды. Баға құлдырап, stop-loss-тарды жинады да, содан кейін күрт өзгерді. Бұл қуатты серпілістер алдында жиі кездесетін үлгі. 2️⃣ Кәсіпқойлар елеусіз қалдырмайтын ескерту ⚠️ MAVOL-ға назар аударыңыз: әрбір жаңа жасыл шаммен көлем азайып барады. Көлемнің азаюы кезіндегі серпіліс = сатып алушылардың сенімсіздігін білдіреді, бұл институционалдық жинақтау емес. Баға 0,97-ге жақындаған сайын импульс әлсірейді. 3️⃣ MA құрылымы шындықты айтады: • Баға MA7 (0,9485) және MA14 (0,9398) деңгейлерінен жоғары → қысқа мерзімді сатып алу қысымы бар • Бірақ әлі де MA28 (0,9634) деңгейінен төмен → жоғары тренд әлі де төмендеуде (bearish); әзірге бұл тек түзету ғана. 4️⃣ Мен деңгейлерді мұқият бақылап отырмын: • 0,9982 — бұрынғы қолдау деңгейінің бұзылуы = қазіргі негізгі қарсылық. Оны қайтарып алу = нақты өзгеріс (reversal) • 0,9485 / 0,9398 — динамикалық қолдау кластері (MA7+MA14). Оны жоғалту серпіліс сценарийін бірден жарамсыз етеді • 0,8928 — "бүлікшіл" ең төменгі деңгей. Оны бұзу жаңа, қатал құлдырауға жол ашады. 🎯 Менің сауда жоспарым, сандармен: Негізгі сценарий (түзетуге short ашу): Кіру нүктесі: 0,9600–0,9630 (MA28 қайта тестілеуі) SL: 0,9710 TP1: 0,9485 | TP2: 0,9398 | TP3: 0,9100 R:R ≈ 2,5:1 ✅ Баламалы (reversal long) — тек мына жағдайда: Сағаттық жабылу 0,9982-ден жоғары болса, бұл bearish тезисті жарамсыз етеді → 1,0127-ге бағытталған long ашу. 🧠 Ең үлкен сабақ: Менің ең сәтсіз саудаларым жоспарсыз үлкен жасыл шамдарды қуудан болды. Бүгін мен бағаның өзі келуіне жол бердім — өйткені нарық асығыстықты емес, тәртіпті бағалайды. $XRPUSDT $BTCUSDT #ByXIMPACT #ByXIMPACT

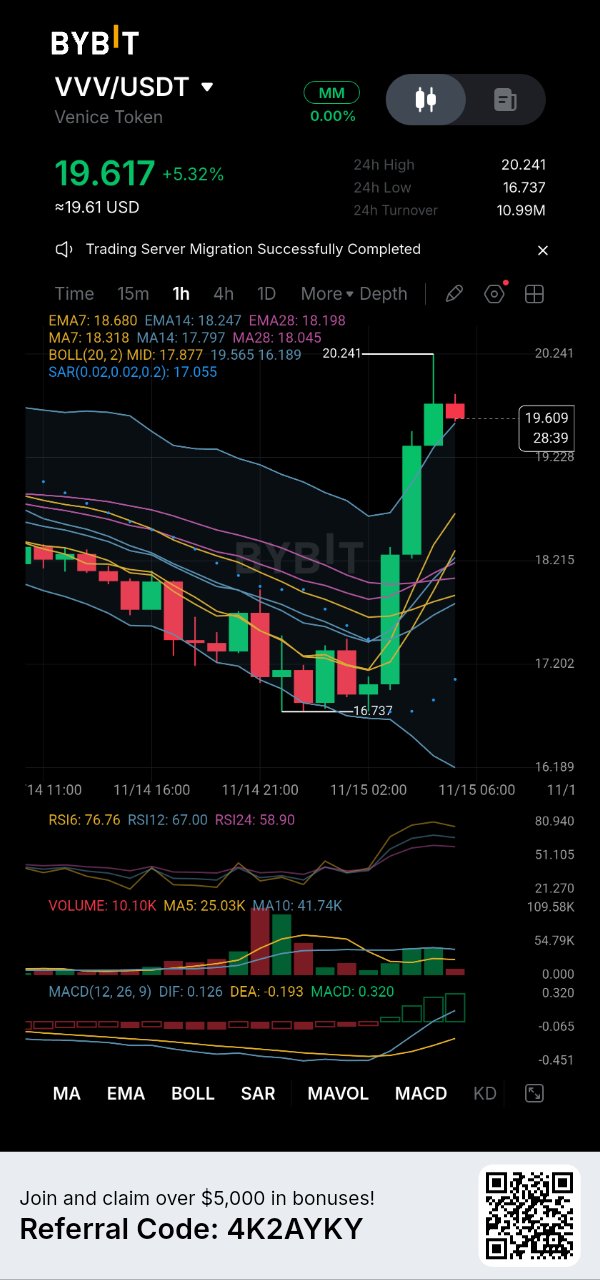
VVV just engineered a spectacular vertical ascent, and I am carefully steering my active trade through this explosive wave of volatility. The chart is glowing, but my focus remains locked on protecting capital. Looking at this 1-hour chart, the buyers completely hijacked the narrative. After bottoming out at 16.737, the asset launched a relentless offensive, shattering resistance to hit a 20.241 peak. It is currently holding strong at 19.617, digesting the rapid climb. Here is my technical reality check: The Power: The MACD is expanding massively with a towering green histogram, and the SAR dots are anchored far below at 17.055, validating the sheer force of this uptrend. The Danger: The RSI is flashing a heated 76.76, and the price is heavily interacting with the upper Bollinger Band (19.565). This extreme overbought reading signals that a short-term cool-off or retest is highly probable. The Foundation: The entire EMA cluster (18.198 - 18.680) has been completely reclaimed, forming a robust concrete floor beneath the price. My Execution Strategy and Risk Management: I am executing with absolute discipline, refusing to let the green candles dictate my emotions. My Plan for Existing Positions: Because my ticket is already deep in the green from the lower breakout, I view this current pause as the ultimate ground floor. Treating this exact consolidation as the structural floor means buying now is buying the bottom. I am actively managing my winner to hold my ground and ride the continuation. My Ironclad Stop Loss: I have mapped my strict exit trigger just beneath the absolute swing low at 16.500. If sellers manage to drag the price below this threshold, the setup is void, and I cut the trade instantly. No hoping, just pure discipline. My Target: A decisive breakthrough above the recent 20.241 peak to unlock further price discovery. I am trading the structure, protecting my downside, and letting the market do the heavy lifting. Are you managing your VVV position through this surge with me? $VVVUSDT $PIEVERSEUSDT #ByXIMPACT

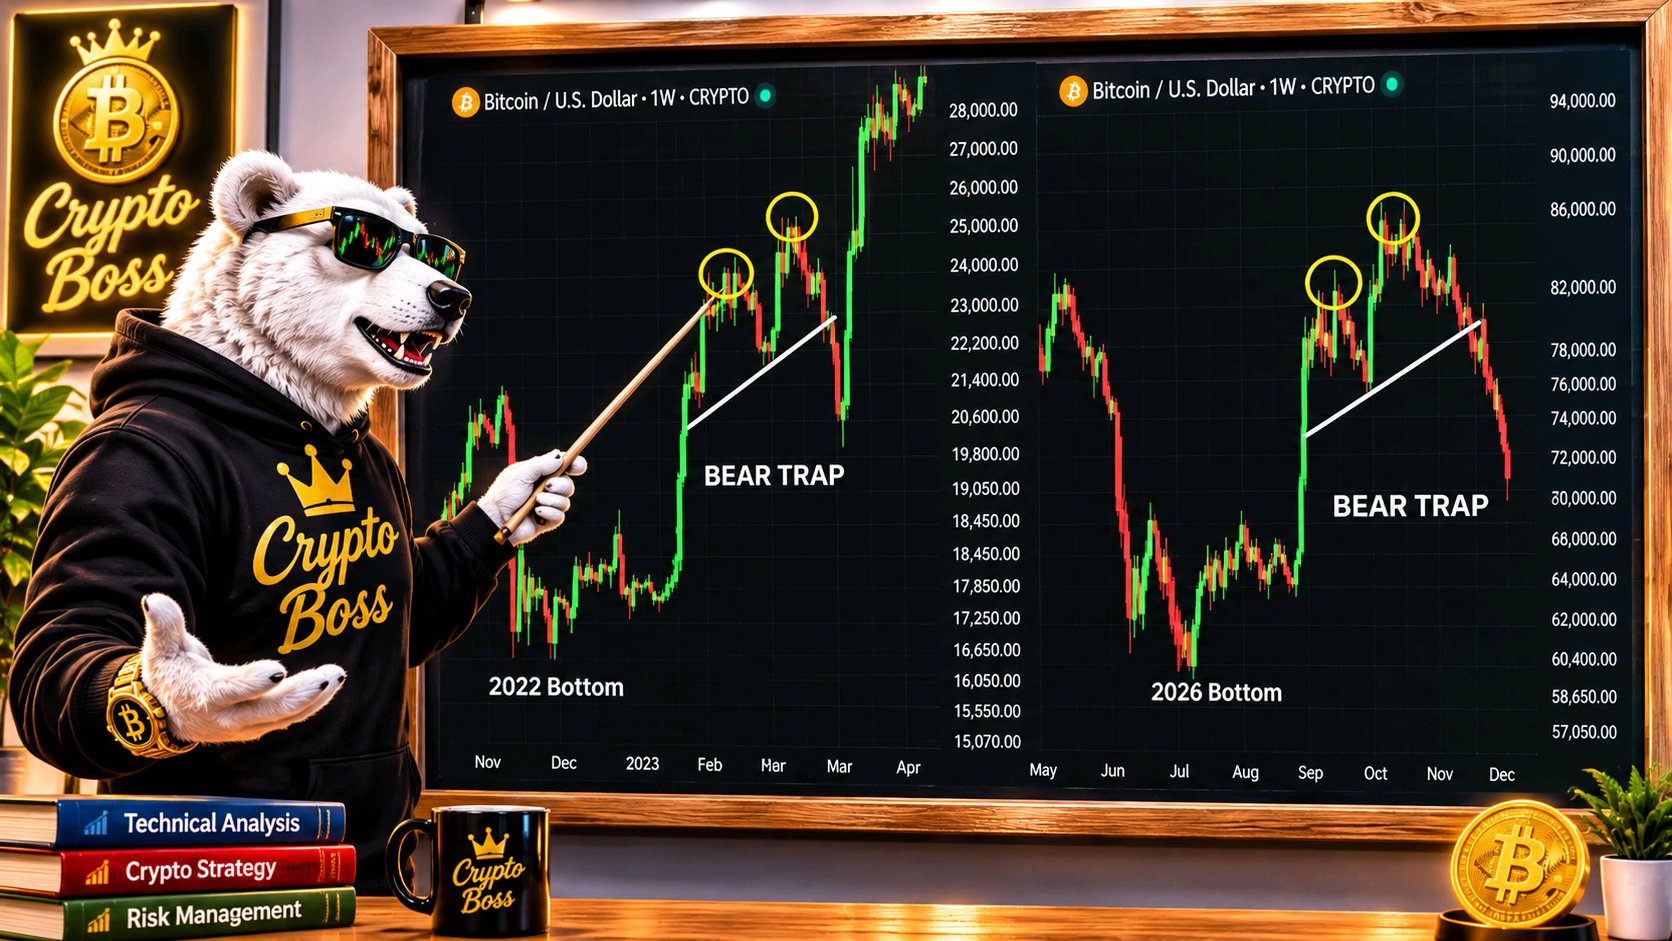
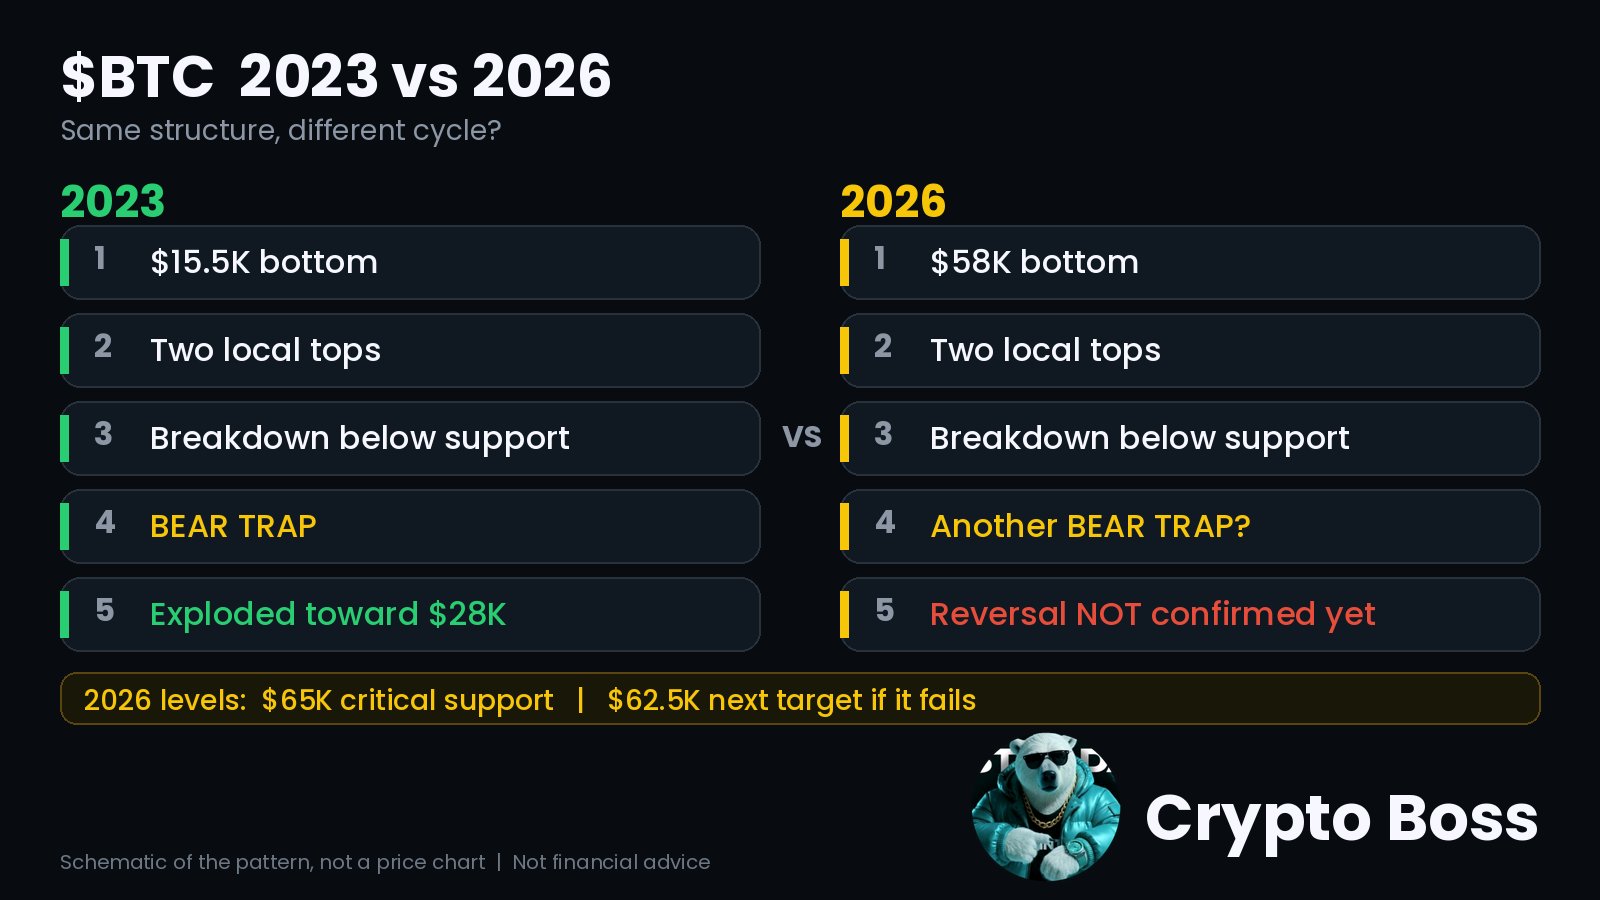
🚨 BITCOIN 2023 жəне 2026: ҚҰРЫЛЫМЫ БІРДЕЙ МЕ?
Бұл екі графикті қатар қарап көріңіз. $BTCUSDC бір үлгіні қайталап жатыр. 2023: → $15.5K түбі → Екі жергілікті шың → Қолдау деңгейінен төмен құлдырау → АЮ ТҰЗАҒЫ (BEAR TRAP) → Bitcoin $28K-ға қарай шарықтап өсті 2026: → $58K түбі → Екі жергілікті шың → Қолдау деңгейінен төмен құлдырау → Тағы бір АЮ ТҰЗАҒЫ ма? Құрылымы бірдей. Бірақ цикл басқа. Сол кезде де, қазір де, құлдыраудан кейін бірдей тізбек орын алды: 1️⃣ Қолдау деңгейі бұзылады 2️⃣ Левереджді лонгтар жойылады (ликвидацияланады) 3️⃣ Аюлар шорт позицияларға жаппай кіреді 4️⃣ Сату қысымы таусылады 5️⃣ Баға қайта көтеріліп, құлдырау кезінде шорт ашқандардың барлығын тұзаққа түсіреді 2026 жылы не болды: - 24 сағат ішінде $1.64 млрд сомасында ликвидация болды - $916 млн Bitcoin фьючерстері ликвидацияланды - Осы айда спот Bitcoin ETF-терінен $1.88 млрд қаражат шығарылды Бұл — левереджді тазалау, 2023 жылғы серпіліс алдындағы дәл осындай тазалау процесі. Бірақ серпіліс әзірге расталған жоқ. Деңгейлер: $65K → маңызды қолдау $62.5K → егер ол өтпей қалса, келесі төменгі мақсат Бұзылған қолдау деңгейінің қайта қалпына келуі аю тұзағы сценарийін нығайта түседі. Мен 2022 жылы $16K түбін көпшілік алдында болжаған болатынмын. Біз тағы бір маңызды бетбұрысқа жақындап келеміз деп ойлаймын. $BTCUSDT #ByXIMPACT
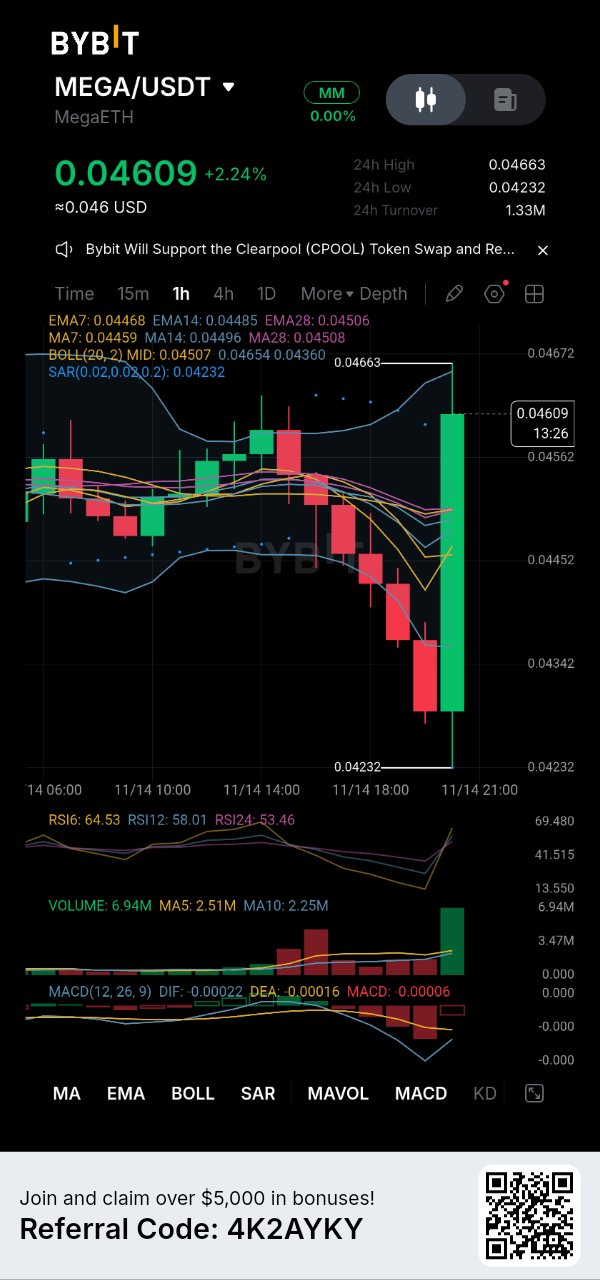
MEGA жаңа ғана күшті шорт сквизді жүзеге асырды, ал бұқалар жоғалтқан позицияларын қайтарып жатқанда, мен өзімнің белсенді саудамды мұқият қадағалап отырмын. Осы 1 сағаттық графикті қарасақ, аюлар бағаны 0.04232 деген қатал деңгейге дейін түсірген болатын. Алайда, көлемнің орасан зор инъекциясы күшті V-тәрізді серпілісті тудырып, активті бірден 0.04663 шыңына дейін көтерді. Қазіргі уақытта ол 0.04609 деңгейінде тұрақталып, қалпына келу үдерісін мықтап ұстап тұр. Міне, менің техникалық талдауым: Күш: MACD күрт жоғары қарай бұрылып жатыр, ал қызыл гистограмма тез өшуде. Оның үстіне, SAR нүктелері төменде 0.04232 деңгейінде бекітілген, бұл бұқалардың бастаманы қолға алғанын растайды. Қауіп: RSI көрсеткіші 64.53-ке дейін күрт көтерілді және баға Боллинджер жолағының жоғарғы сызығымен (0.04654) тікелей әрекеттесуде. Бұл өсуді жалғастыру үшін қысқа мерзімді консолидация немесе шағын ретест қажет болуы мүмкін екенін білдіреді. Негіз: EMA-ның барлық кластері (0.04468 - 0.04506) күшпен қайтарылып алынды, бұл бұрынғы жоғарғы қарсыласу деңгейін берік іргетасқа айналдырды. Менің орындау стратегиясы және тәуекелдерді басқару: Мен бұл жерде ақылды әрекет етемін. Мен FOMO-ға беріліп, осы қозғалыстың ең жоғарғы нүктесінде сатып алмаймын. Қолданыстағы позицияларға арналған жоспарым: Төменгі деңгейден кіргендіктен, менің позициям қауіпсіз және мен жайлы пайдада отырмын. Осы консолидацияны құрылымдық негіз ретінде қарастыру, қазір сатып алу — ең төменгі нүктеден сатып алу дегенді білдіреді. Мен өзімнің табысты позициямды белсенді түрде басқарып, өз орнымды сақтап қалуға және қозғалыстың жалғасын күтуге тырысамын. Менің мызғымас стоп-лоссым: Мен өзімнің қатаң шығу триггерімді 0.04150-дегі ең төменгі нүктенің астына бекіттім. Егер баға осы құрылымдық негізден түсіп кетсе, онда бұл қалпына келудің жалған екені белгілі болады да, мен дереу шығамын. Ешқандай үміттену жоқ, тек таза тәртіп. Менің мақсатым: Менің басты мақсатым — 0.04663-тегі жақындағы ең жоғарғы нүктеден жоғары бағаны анықтау. Мен құрылым бойынша сауда жасап, төмендеу қаупінен қорғанып, нарықтың өзінің негізгі жұмысын жасауына мүмкіндік беріп отырмын. Сіз де MEGA позицияңызды осы өзгеріс кезінде менімен бірге басқарып жатырсыз ба? $MEGAUSDT $PIEVERSEUSDT #ByXIMPACT

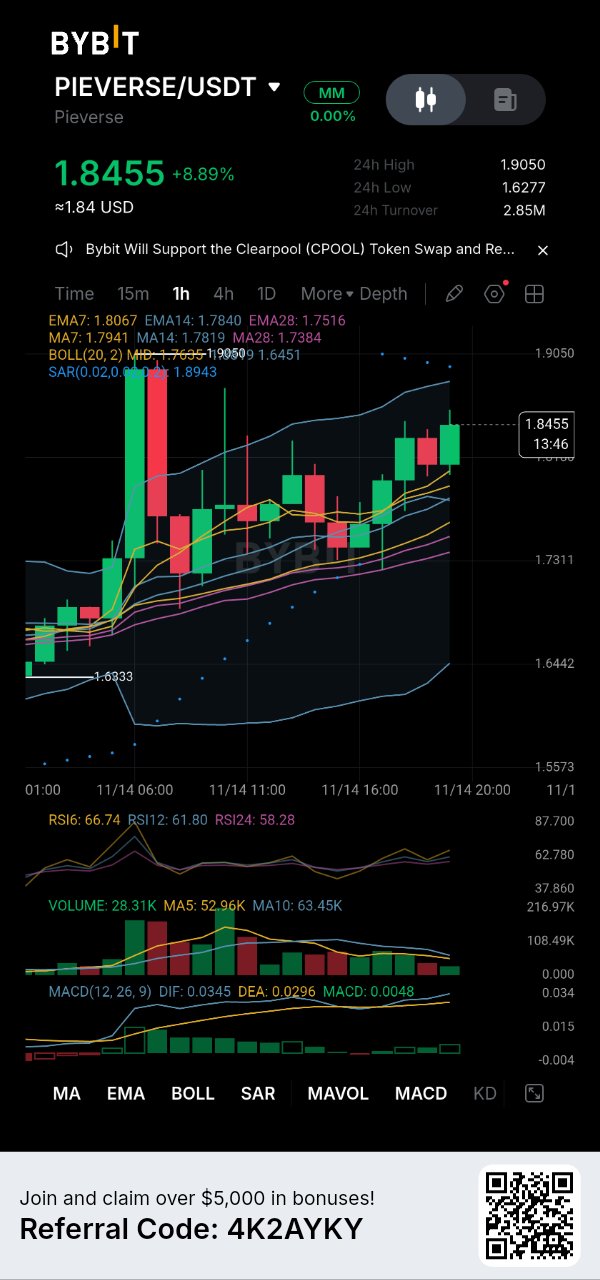
Crypto Boss sees an interesting battle developing in $PIEVERSE, and I'm paying attention to what happens after this sharp rally. PIEVERSE is trading around $1.8455, up 8.89%, but what interests me most isn't the percentage gain. It's how price is behaving after its powerful move from the $1.6277 area. The first thing I noticed is that the short-term structure has improved considerably. Price is trading above EMA7 ($1.8067), EMA14 ($1.7840), and EMA28 ($1.7516). This tells me buyers have managed to establish control over the short-term trend. There's another encouraging detail. MACD remains positive, with DIF at 0.0345 above DEA at 0.0296. RSI readings are also relatively strong, with RSI6 at 66.74. Momentum currently favors buyers, although I don't want to mistake strength for unlimited upside. But there's one challenge I cannot ignore. The $1.9050 area is the immediate resistance I'm watching. Price has approached this region but hasn't established a confirmed breakout above it. Meanwhile, trading volume at 28.31K is below its MA5 and MA10 averages, suggesting that the latest advance still needs stronger participation. Here's how I'm approaching the next move: If buyers push through $1.9050 with expanding volume, I'll have a stronger reason to expect another upward leg. If the breakout fails, I'll be watching the $1.80–$1.78 region first. Holding that area would help preserve the current bullish structure, while a deeper pullback toward $1.75 would require a fresh assessment. I'm encouraged by what PIEVERSE is showing, but I want confirmation at resistance rather than chasing the green candles. For me, the real question isn't how much $PIEVERSE has already gained. It's whether buyers have enough conviction to take it beyond $1.9050. Would you trust this momentum to deliver another breakout, or wait for a healthier retest first? $PIEVERSEUSDT #ByXIMPACT

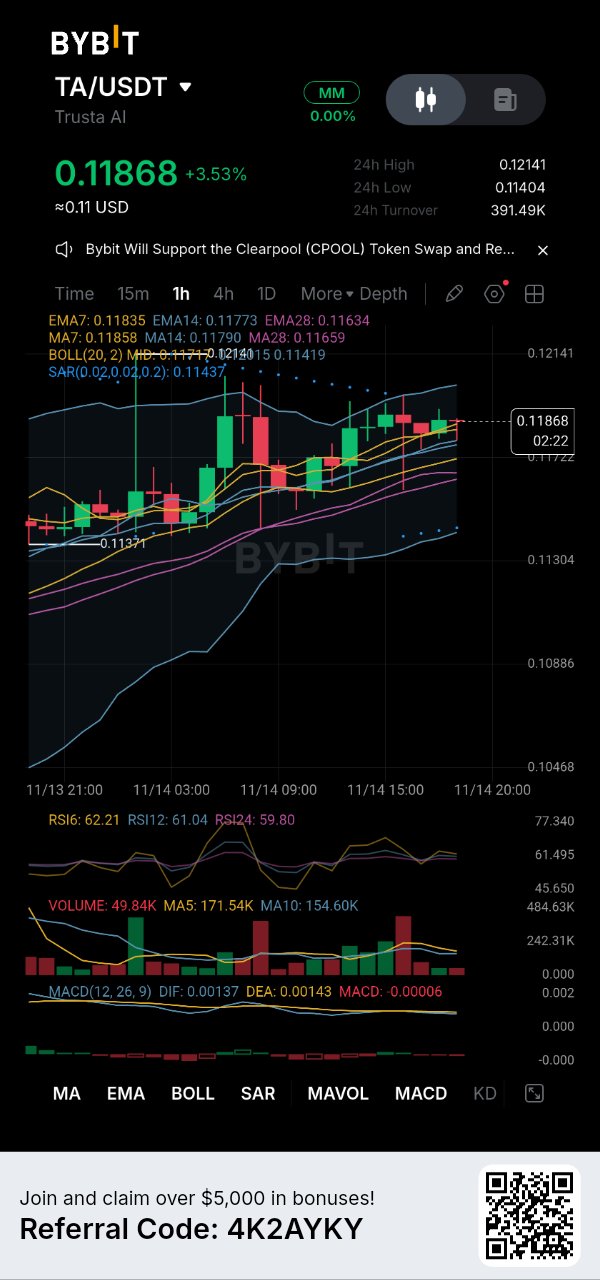
TA/USDT жұбы шамамен $0.1187 деңгейінде саудаланып жатыр, бұл күнделікті өсімнің шамамен 3.5%-ын құрайды, ал 24 сағаттық ауытқу диапазоны $0.1140 мен $0.1214 арасында. 1 сағаттық график бойынша тренд әлі де жоғары бағытталған, бірақ импульс бәсеңдеп келеді. Өсу белгілері (Bullish): - Баға барлық жылжымалы орташа көрсеткіштерден жоғары және олар ретімен орналасқан: MA7 (0.1186) > MA14 (0.1179) > MA28 (0.1166). - SAR бағадан төмен, 0.1144 деңгейінде орналасқан, бұл қысқа мерзімді трендтің жоғары екенін көрсетеді. - RSI шамамен 60-62 аралығында, бұл күшті көрсеткіш, бірақ шектен тыс сатып алынған (overbought) деңгейде емес. - Баға Боллинджер белдеулерінің жоғарғы жартысына қысым жасауда. Төмендеу белгілері (Bearish): - Сауда көлемі азайып келеді: соңғы бар шамамен 50 мыңды құраса, 5 барлық орташа көрсеткіш 172 мыңға жуық. - MACD нөлге жақын жерде тегіс, сигналдық сызық MACD сызығынан сәл жоғары тұр. - Өтімділік төмен: 24 сағаттық айналым шамамен $391 мыңды ғана құрайды. 1 сағаттық графиктегі деңгейлер: - Қолдау: $0.1172 (Боллинджер ортаңғы сызығы), одан кейін $0.1144 (SAR және төменгі белдеу). - Негізгі төменгі деңгей: $0.1137. Осы деңгейден төмен 1 сағаттық жабылу құрылымды бұзады. - Қарсылық: $0.1201 (жоғарғы белдеу), одан кейін 24 сағаттық ең жоғарғы көрсеткіш – $0.1214. - Серпіліс триггері: сауда көлемінің артуымен $0.1214 деңгейінен жоғары жабылу. Менің ойымша: тренд сақталған, бірақ көлемсіз бұл қозғалыс әлсіреуі мүмкін. Мен бағаны қуалаудың орнына, көлемнің расталуын күтер едім. TA $0.1214 деңгейін бұзып өте ме, әлде жоғарғы белдеуде кері қайтарыла ма? Бұл қаржылық кеңес емес. Өтімділігі төмен токен, сауда көлемін аз ұстаңыз. $TAUSDT #ByXIMPACT

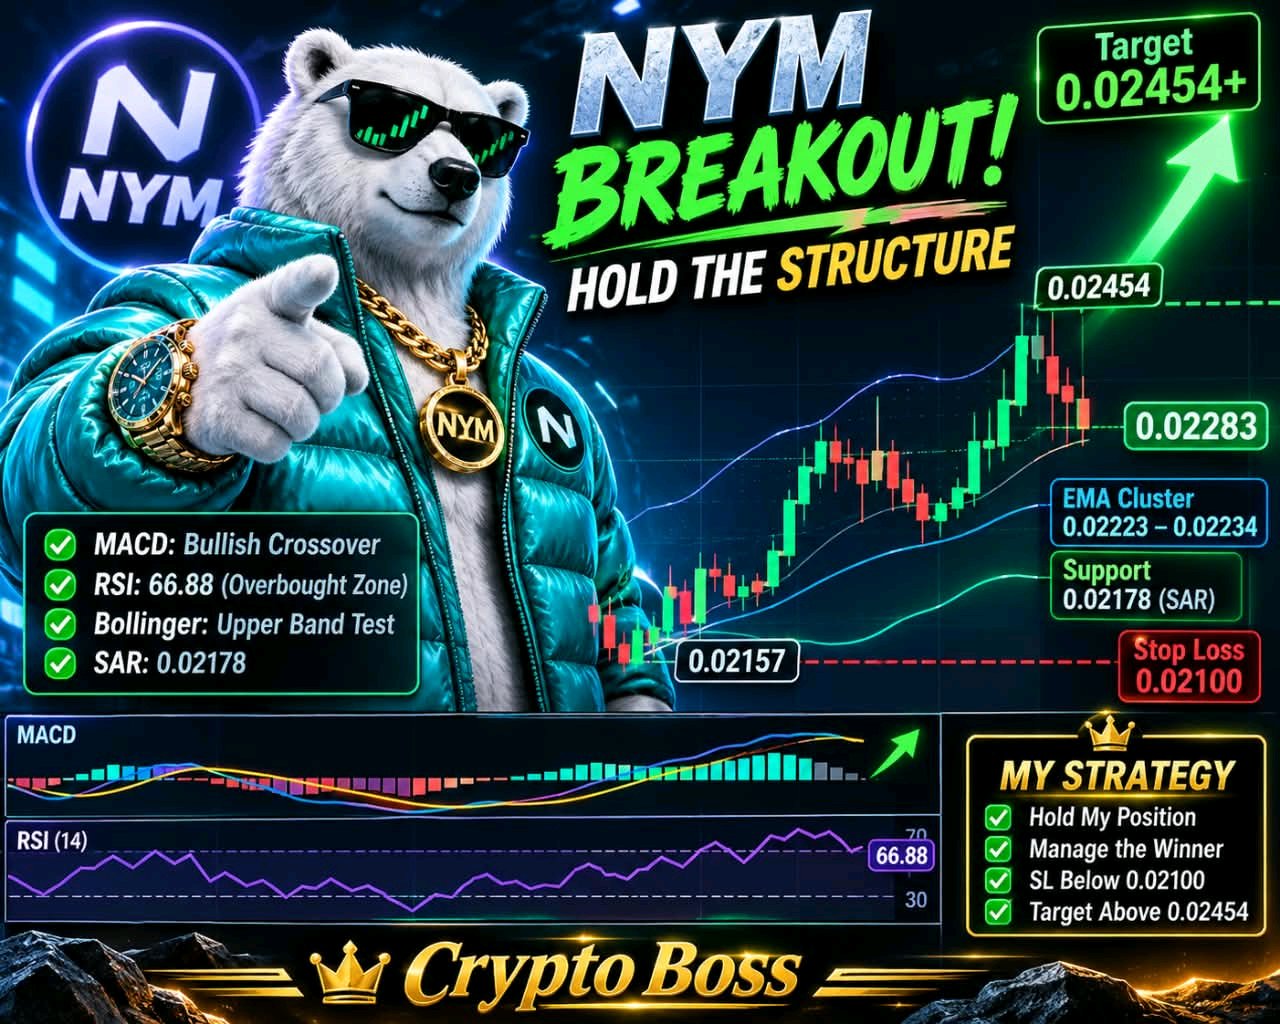
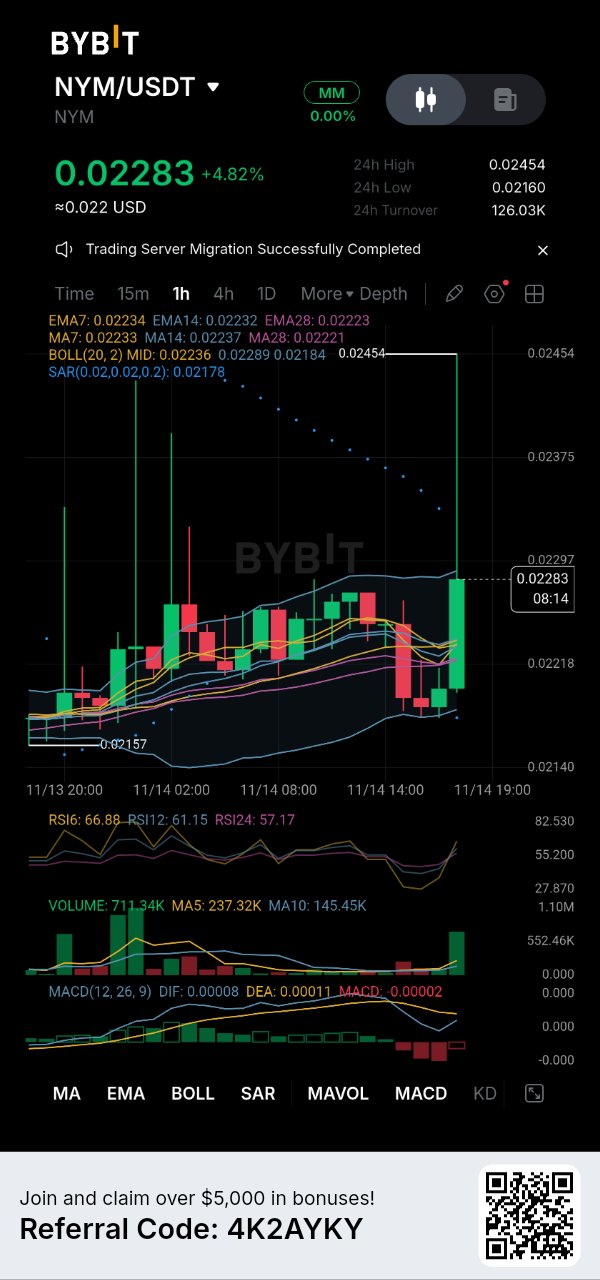
NYM just delivered a brutal wake-up call to the bears, and I am precisely navigating my active trade through this explosive expansion. Scanning the 1-hour chart, the asset was trapped in a tight sideways drift near the 0.02157 base. That silence was shattered by a massive green candle, rocketing the price to a 0.02454 peak. It is currently taking a breath at 0.02283, holding firmly onto the recent gains. Here is my technical reality check: The Power: The MACD is curling upward toward a bullish cross, and the SAR dots are anchored deep at 0.02178, validating the sudden shift in control. The Danger: The RSI is heating up at 66.88, and the price is actively challenging the upper Bollinger Band at 0.02289. This extreme touch warns that a brief pullback is highly likely. The Foundation: The entire EMA ribbon (0.02223 - 0.02234) has been reclaimed, acting as a sturdy springboard for the price. My Execution Strategy and Risk Management: I am executing with strict discipline, refusing to let FOMO dictate my moves. My Plan for Existing Positions: Because my ticket is already green from the lower levels, I am comfortably positioned. Treating this exact consolidation as the structural floor means buying now is buying the bottom. I am actively managing my winner to hold my ground and ride the continuation. My Ironclad Stop Loss: My hard invalidation line is anchored just beneath the absolute swing low at 0.02100. If sellers force a break below this threshold, the breakout is a trap, and I cut the position instantly. No hesitation. My Target: A decisive breakthrough above the 0.02454 peak to unlock further price discovery. I am trading the structure, protecting my downside, and letting the market do the heavy lifting. Are you managing your NYM position through this breakout with me? $NYMUSDT #ByXIMPACT