Sam Usman
4977ចូលចិត្ត (Like)0ភាគហ៊ុន444អ្នកគាំទ្រ781តាមដាន
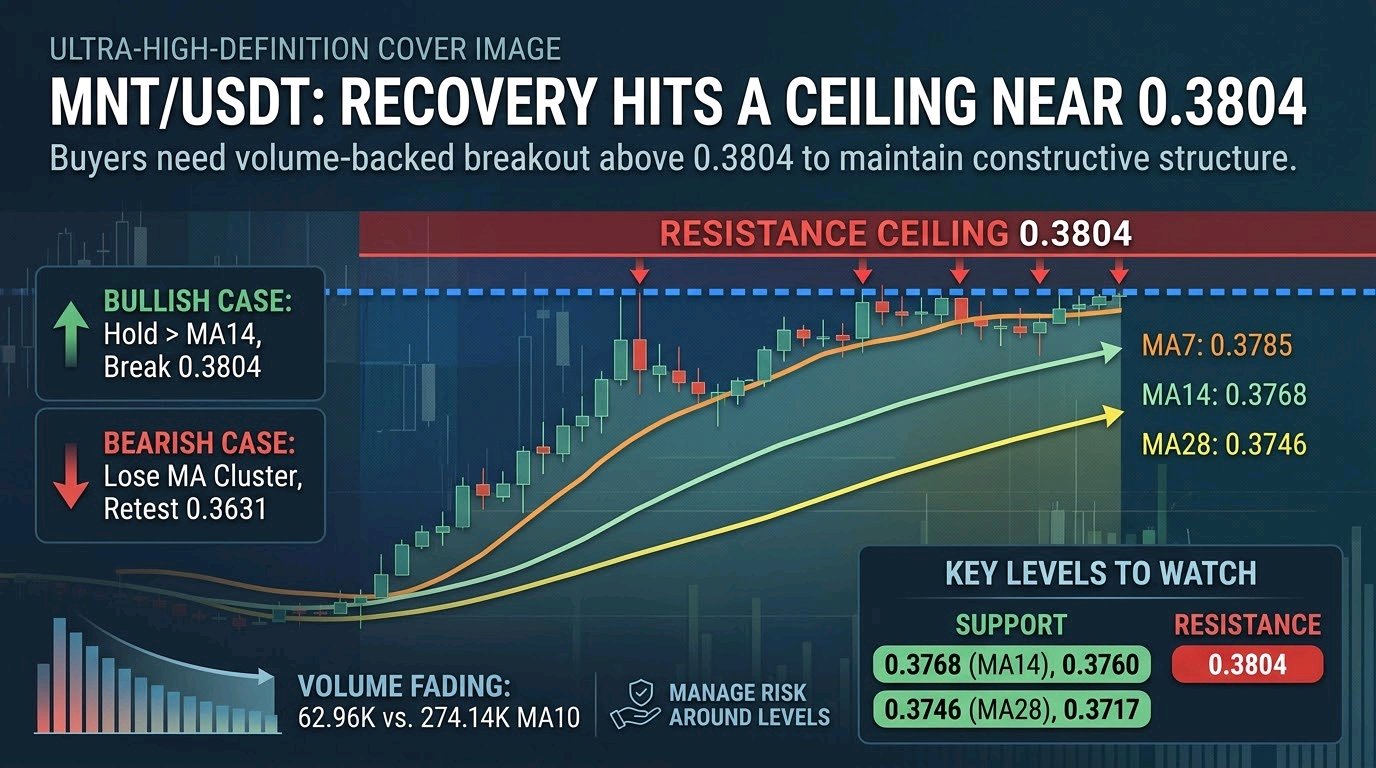
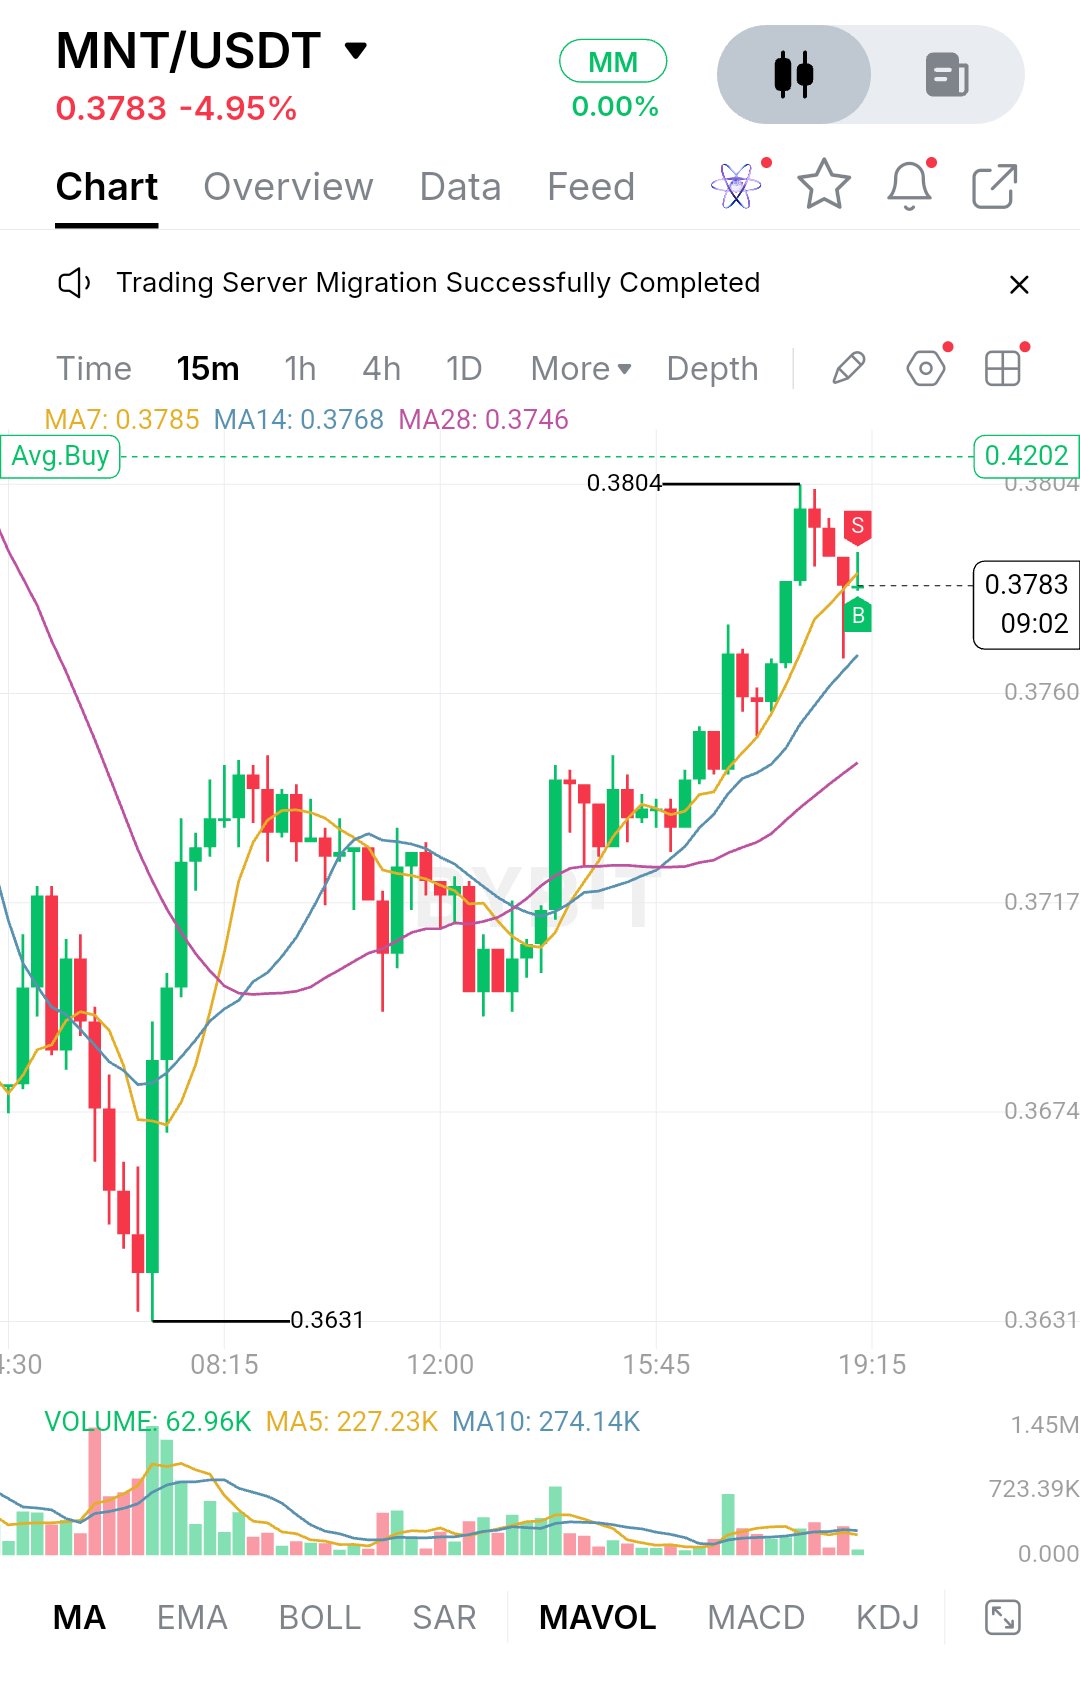
$MNTUSDT: Recovery Hits a Ceiling Near 0.3804 MNT is trading at 0.3783, down 4.95% on the day. That headline number hides the shape of the session. Sellers dominated the early hours and pushed price down to 0.3631, where a large buy candle absorbed the selling. Buyers then rebuilt the move step by step, and price climbed back to 0.3804 before sellers showed up again. The recovery was real, but the day is still negative. After the low, MNT did not shoot straight up. It spent the stretch from roughly 08:15 to 12:00 chopping sideways in the 0.3680 to 0.3730 area, with overlapping candles and wicks on both sides. That kind of base-building is slower and less exciting, but it usually makes for a sturdier recovery. Price finally broke out of the range in the afternoon with a run of strong green candles, which carried it to the session high. The last few candles, though, are red and the push higher has stalled. At the moment it looks like a market pausing at resistance rather than one that has clearly turned over. On the moving averages, MA7 sits at 0.3785, MA14 at 0.3768 and MA28 at 0.3746. They are stacked in the right order for a short-term uptrend, with the faster average on top and all three sloping upward. Price at 0.3783 is hugging MA7, so it is testing the short-term trend line right now. A small dip toward MA14 would be normal behavior in a healthy trend. What I'd be cautious about is volume. The latest candle shows 62.96K against a MA5 of 227.23K and a MA10 of 274.14K, so participation is well below recent averages. The earlier breakout leg had noticeably stronger volume, and the current pullback is quiet. That cuts both ways: it's not aggressive selling, but it also means buyers haven't stepped back in with conviction yet. For support, the first area is the MA14 zone near 0.3768, followed by the 0.3760 level on the chart axis. Price has been respecting the short averages during this climb, so a hold here would keep the structure intact. Below that, MA28 at 0.3746 is the next line to watch, then the 0.3717 and 0.3674 levels, which line up with the consolidation range that served as the launch pad for the breakout. The major floor remains 0.3631. A break below the moving average cluster would suggest the afternoon rally was just a bounce, and price could drift back into the old range. On the upside, resistance is clear: 0.3804 is the session high and the level that just rejected price, which is also where the red S marker sits on the chart. A clean move through it, ideally on better volume than we see now, would mark a higher high and push the structure forward. There is also a dashed Avg.Buy line at 0.4202 on the chart. That is your own average entry rather than a market level, but it shows how far price would need to travel to get back to breakeven, roughly 11% above the current price. I wouldn't treat it as a realistic near-term target. The bullish case is simple. Buyers need to defend the 0.3768 to 0.3760 zone, keep price above the rising MA14, and then close decisively above 0.3804. Volume should expand on that move. If it does, the next area to watch is higher up the chart, where there's no marked resistance, so momentum would have to do the work. The upper range toward 0.40 is a natural psychological reference, but nothing in this chart confirms it yet. The bearish case starts with a failure to reclaim 0.3804 and a loss of the short moving averages. If price slips under MA14 and then MA28 at 0.3746, sellers get control of the short-term structure, and a retest of 0.3717 or 0.3674 becomes likely. A drop under 0.3631 would erase the whole recovery and put the morning low in play as a breakdown level rather than support. **Key Price Levels** - Resistance: 0.3804 (session high) - Immediate support: 0.3768 (MA14) and 0.3760 - Secondary support: 0.3746 (MA28) and 0.3717 - Deeper support: 0.3674 - Major support: 0.3631 (session low) - Short-term trend line: 0.3785 (MA7) The structure is constructive but unproven. Price made a higher-low sequence out of a sharp selloff, yet it is now sitting under a clear ceiling on fading volume. What matters next isn't the daily percentage but how price behaves around 0.3768 and 0.3804. A hold above the averages with a volume-backed breakout would open the next expansion leg, while a loss of the moving average cluster would put the range back in charge. Let price confirm before assuming either direction, and manage risk around the levels above. This is chart analysis, not financial advice. #ByXIMPACT$BTCUSDT
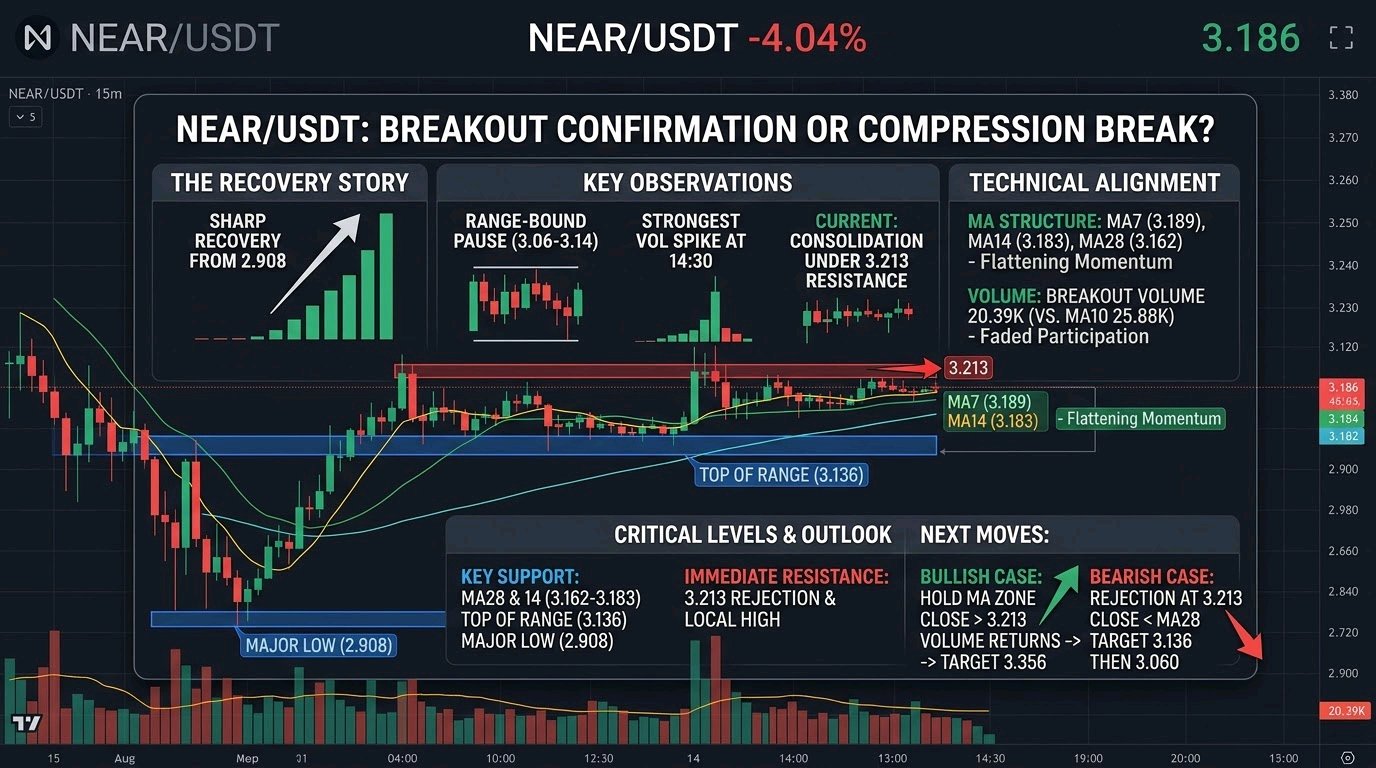
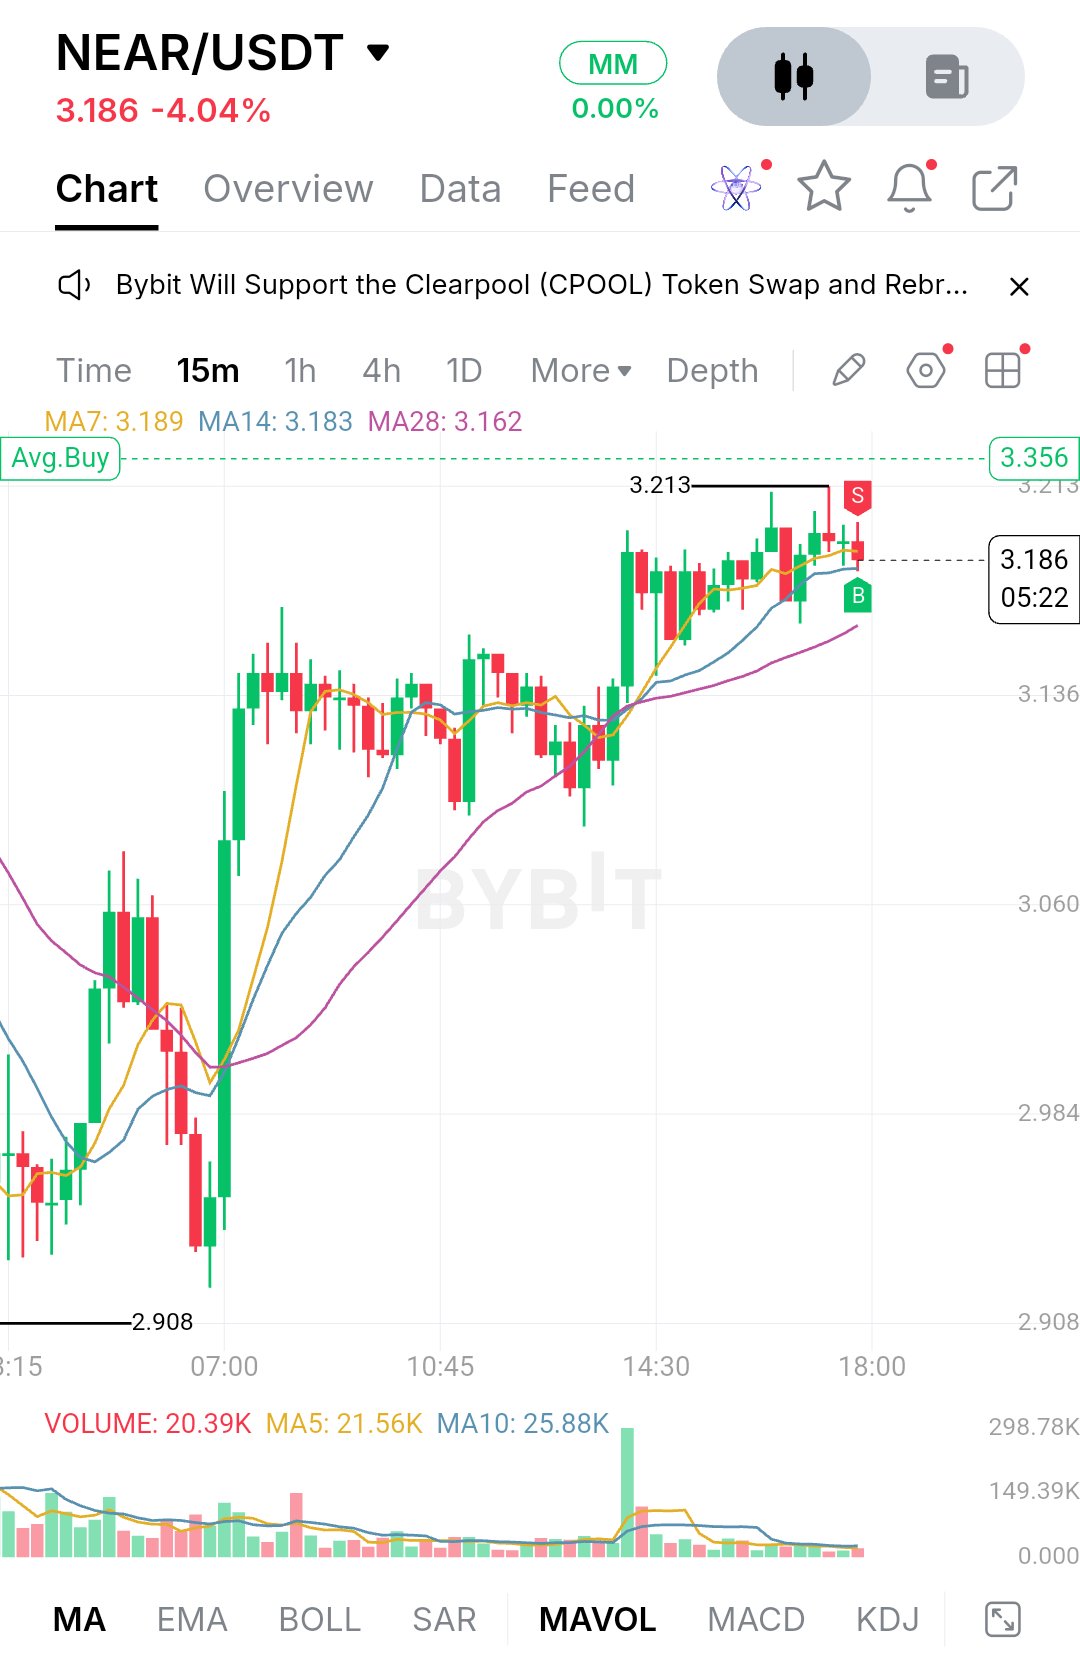
$NEARUSDT is trading at 3.186, down 4.04% on the day. That headline number hides a more interesting story. Sellers hit the pair hard earlier in the session and pushed it down to the 2.908 low, but buyers stepped in aggressively near the 07:00 mark. A large green candle drove price back up through the mid-range. The sellers who caused the drop have been mostly absorbed, and the market has been rebuilding since. After that sharp recovery, price spent several hours moving sideways between roughly 3.06 and 3.14, with candles overlapping and no clear direction. That kind of range is typically where the market decides whether the bounce was real. It resolved to the upside around 14:30, when a strong green candle broke out of the range on the biggest volume spike on the chart. Price then climbed to a local high of 3.213, where it stalled. The last several candles are small and indecisive, with a couple of upper wicks, so this looks like consolidation under resistance rather than a clean trend continuation. On the moving averages, the MA7 sits at 3.189, the MA14 at 3.183 and the MA28 at 3.162. Price is hugging the first two, which tells you momentum has flattened out for now. The structure is still constructive, though: the MA28 is sloping upward and sitting below price, and the shorter averages are stacked above it. Volume tells a similar story. The breakout spike was large, but participation has faded since, with the current bar at 20.39K and the MA5 and MA10 near 21.56K and 25.88K. A move without strong volume behind it tends to be easier to fade. The nearest support is the 3.162 to 3.183 area, where the MA28 and MA14 sit together. If buyers defend it, the structure of higher lows stays intact. Below that, the 3.136 level matters because it marks the top of the earlier range, and old resistance often turns into support after a breakout. A clean loss of 3.136 would put the 3.060 zone back in play, and below that 2.984 and finally the 2.908 low. Losing 2.908 would erase the entire recovery. Immediate resistance is the 3.213 high. Price has already rejected it once, and the red marker near that area shows sellers are active there. A decisive break above it, ideally on rising volume, would open the way toward the upper part of the chart, with 3.356 as the next visible reference level. For the bullish case, buyers need to hold the MA14 and MA28 area, close candles above 3.213, and bring volume back in. If that happens, price has room to extend toward 3.356. The bearish case starts with another rejection at 3.213 followed by a close below the MA28. That would suggest the breakout was only a squeeze, with price likely rotating back to 3.136 and potentially 3.060. Key price levels: - Resistance: 3.356 and 3.213 - Current price: 3.186 - Moving averages: MA7 3.189, MA14 3.183, MA28 3.162 - Support: 3.136, 3.060, 2.984 - Major low: 2.908 The big move has already happened, so the more important question is what comes next. Price is compressing just under resistance while holding above its short-term averages, and compressions like this usually end in expansion. Watch whether the 3.162 to 3.183 zone holds and whether volume returns on a push through 3.213. If both line up, the market has a clean path higher. If neither does, patience is the better trade. None of this is certain, and it should be treated as a read on structure rather than a prediction. Note: your screenshot shows the 15-minute chart, and it has no EMA200, RSI, MACD or Fibonacci levels on it. I only used what is visible, so I left those out rather than make up values. If you add them or send the 1h chart, I can fold them into the post. #ByXIMPACT$MNTUSDT
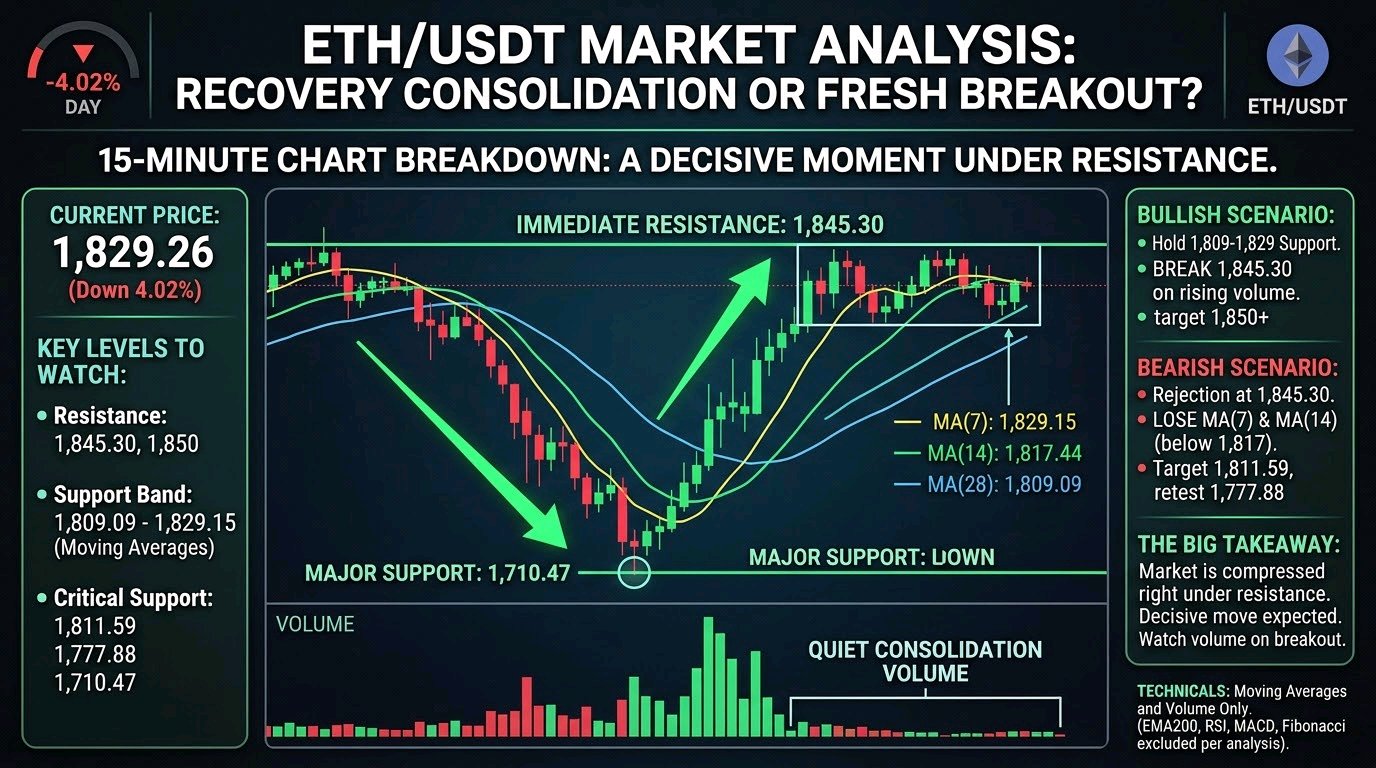
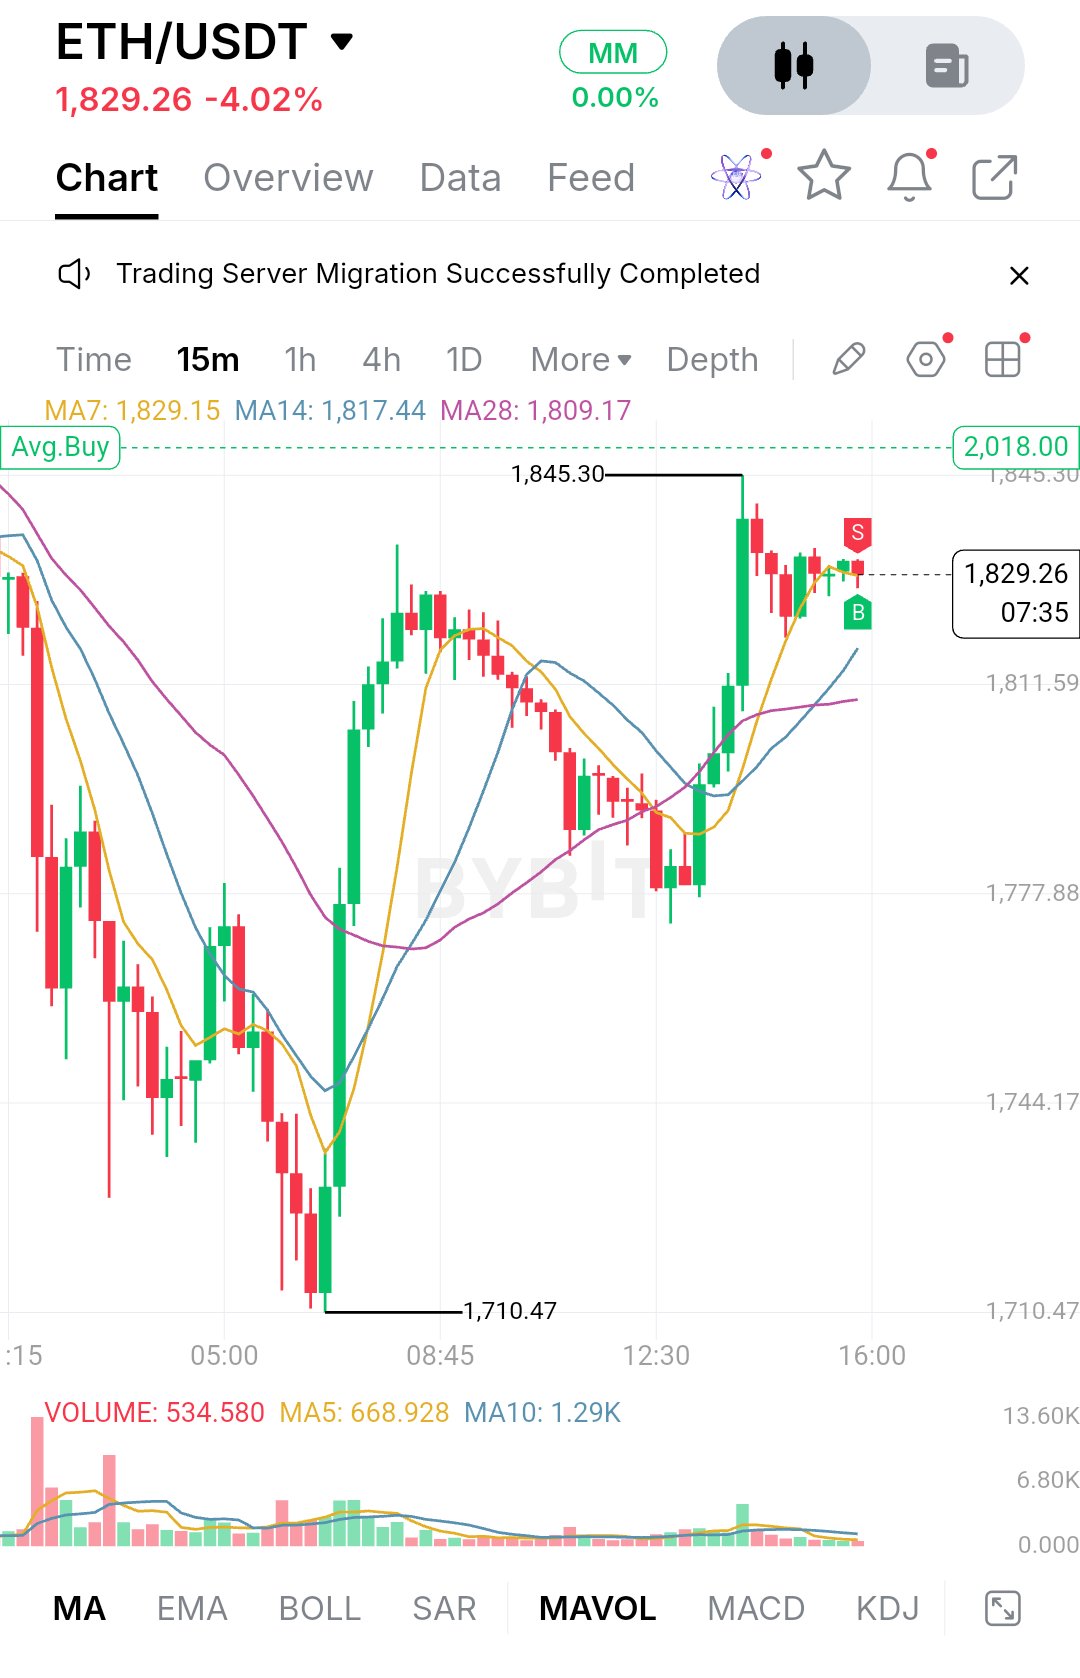
$ETHUSDT is trading at 1,829.26, down 4.02% on the day. The 15-minute chart shows the day's story clearly. Sellers pushed price hard through the early session, and the slide kept going until it bottomed at 1,710.47. That low also marks the extreme of the whole visible move. Buyers stepped in there with real force, and the long, heavy green candles that followed came with a clear pickup in volume. Price ripped back up to a swing high at 1,845.30, which recovered most of the damage in a few hours. Since that peak, the market has cooled off. The last stretch of candles is small and overlapping, with red and green bodies trading inside a tight pocket just under the high. That looks like consolidation after an impulsive recovery rather than a fresh push. Momentum hasn't flipped bearish, but it has slowed. The sellers who showed up at 1,845.30 have been enough to cap price without forcing a pullback so far. A note on the technicals: this screenshot is the 15-minute timeframe, not the 1-hour, and it only shows moving averages and volume. I can't comment on EMA200, RSI, MACD or Fibonacci levels because none of them are on the chart, and I won't make up readings. What is visible is MA7 at 1,829.15, MA14 at 1,817.44 and MA28 at 1,809.09. Price sits almost exactly on the MA7, with the MA14 and MA28 stacked below in bullish order. The MA7 has flattened out after the sharp climb, which fits the sideways chop. The slower averages are still sloping up, which keeps the short-term structure constructive as long as price holds above them. Volume tells a similar story. The surge during the recovery has faded to quiet, low bars, so the market is waiting for its next catalyst. For support, the first area to watch is the MA7 zone around 1,829, since price is sitting on it right now and losing it would be the first sign that the consolidation is breaking down. Below that sits the MA14 near 1,817, followed by the MA28 near 1,809. That 1,809 to 1,817 band is where the recovery leg was built, so it matters for structure. If buyers defend it, the higher-low pattern stays intact. A clean break below it would put the horizontal marker at 1,811.59 in play, and a failure there exposes the 1,777.88 area, where the chart shows earlier reaction. The full base of the move remains the 1,710.47 low. On the upside, the immediate ceiling is the 1,845.30 swing high. That is the level sellers defended once already, and price is pressing just beneath it. A convincing break and hold above it would confirm that the consolidation was a pause rather than a top. The round 1,850 zone sits just above it and will likely draw attention as a psychological level. Beyond that, the chart shows a dashed line at 2,018.00 labeled Avg. Buy, which looks like a position marker on this account rather than a market level, so it isn't a true technical target, though it is where price would head if a strong expansion follows. The bullish case is simple. Buyers need to hold the 1,809 to 1,829 band and then push through 1,845.30 on rising volume. A candle close above that high, followed by a retest that holds, would suggest the market is building higher lows into a continuation. That could open room toward 1,850 and then the bigger levels above, though nothing here is guaranteed. The bearish case starts with rejection at 1,845.30. If price keeps stalling under that high and then loses the MA7 and MA14, the recovery starts to look like a bounce within a larger down day. Sellers would then aim at the 1,811.59 area, and a break beneath it makes a retest of 1,777.88 realistic. The full 1,710.47 low only comes back into view if momentum shifts decisively. Key price levels: - Resistance: 1,845.30 (swing high), 1,850 (psychological), 2,018.00 (Avg. Buy marker on chart) - Current price: 1,829.26 - Moving averages: MA7 1,829.15, MA14 1,817.44, MA28 1,809.09 - Support: 1,811.59, 1,777.88, 1,744.17 - Major low: 1,710.47 Overall, ETH did the hard part by recovering from 1,710.47 to the 1,845.30 area, but the market is now compressed right under resistance, and compression like this usually resolves with a decisive move. Watch how price behaves around 1,845 and whether volume returns on a break. A hold above the moving averages with expanding volume favors upside continuation, while a slip below 1,809 would shift the tone. Let the structure show you the direction instead of anticipating it. This is not financial advice, and risk management matters more than any single read. #ByXIMPACT$SOLUSDT
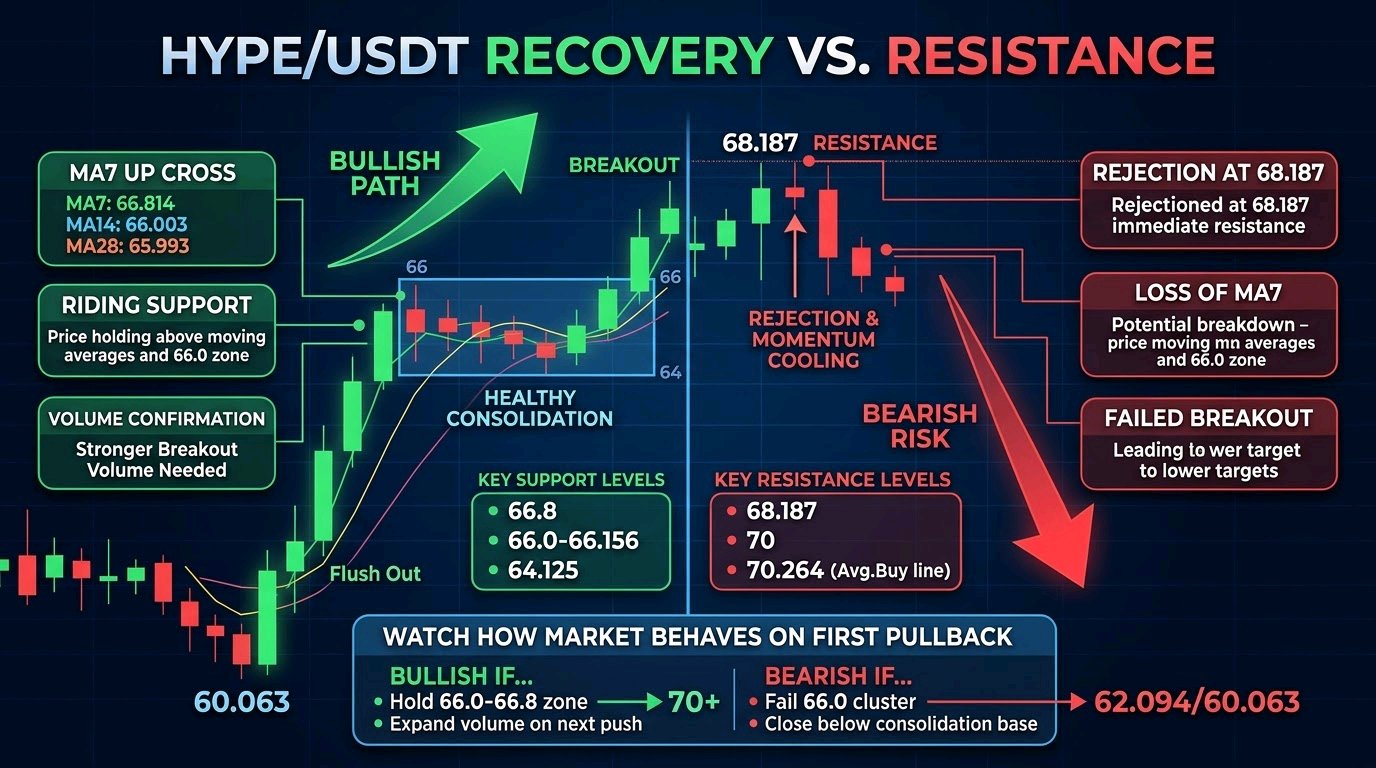
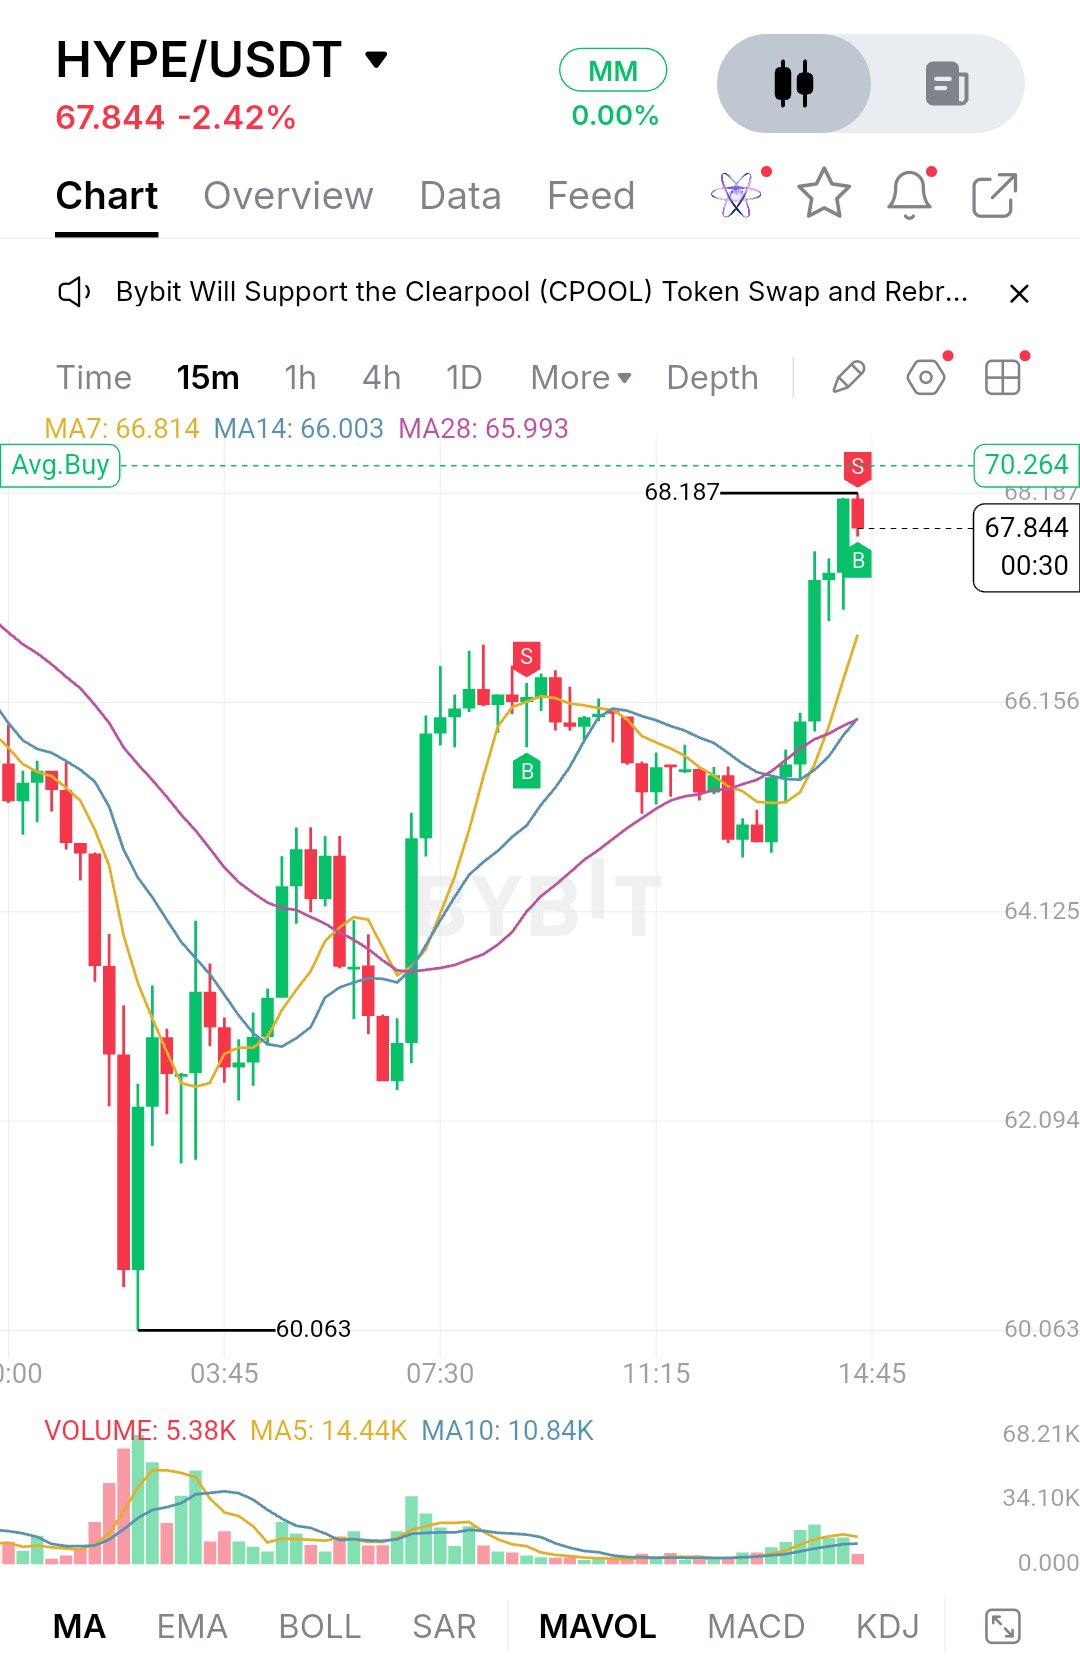
$HYPEUSDT is trading at 67.844, down 2.42% over the last 24 hours. The percentage looks mild, but the intraday action tells a more interesting story. Sellers pushed price all the way down to 60.063, where a long red candle flushed out late buyers. Buyers stepped in right there with a strong green recovery candle, and price has been climbing ever since. It has now pushed into the 68.187 area, which is where sellers showed up again. After the low, the market didn't bounce in a straight line. It rebuilt in stages. Price made a higher low, pushed up into the mid-66s, then spent several hours between roughly 64 and 66 working sideways. That range was healthy consolidation. The pullback inside it was shallow and it never retraced the whole recovery. Late in the session buyers took control again and a run of green candles broke the range to the upside, taking price to 68.187. The most recent candle is red and still open, so it's too early to call it a confirmed rejection, but momentum has cooled a little right under the highs. On the technical side, the moving averages show the shift clearly. MA7 sits at 66.814, MA14 at 66.003 and MA28 at 65.993. The three had been tangled together during the consolidation, a sign the market was indecisive. Now MA7 has turned sharply up and moved above the other two, with price riding well above all of them. That's a constructive structure for short-term traders. One caution is volume. The breakout candles printed decent participation, but the latest bar shows 5.38K against a MA5 of 14.44K and a MA10 of 10.84K. Part of that is because the candle is unfinished, but the follow-through needs to show up in volume for this move to last. For support, the first area is the MA7 near 66.8. Just below it is the more important cluster, where MA14 and MA28 sit almost on top of each other around 66.0, close to the 66.156 gridline. That zone was the top of the earlier consolidation, so if it now acts as support, it confirms the breakout was real. A close back below it would put the 64.125 area in play, which is where the range base formed. Below that, 62.094 and the 60.063 swing low are the deeper levels. Losing 60.063 would break the whole recovery structure. On the upside, immediate resistance is 68.187, the high of the move. Above it, the chart shows a dashed line at 70.264 labelled Avg.Buy, and the round 70 level sits just beneath it, so I'd expect reactions there. Sellers tend to defend psychological numbers, and breakouts through them often get tested more than once. The bullish case is simple. Buyers need to hold the 66.0 to 66.8 zone on any pullback and then push through 68.187 with real volume behind it. A clean close above that opens the way to 70, and then the 70.264 line. A pullback that finds support at the moving averages and bounces would be the healthiest way to continue. The bearish case starts with rejection at 68.187 and a loss of MA7. If price slips through the 66.0 cluster and closes below it, the breakout starts to look like a stretched move that has run out of fuel. That would likely drag price back into the 64.125 range base, and a break of that would revisit 62.094 and possibly the 60.063 low. Key price levels: Resistance: 68.187, 70 (psychological), 70.264 (Avg.Buy line) Support: 66.8 (MA7), 66.0 to 66.156 (MA14/MA28 and gridline), 64.125, 62.094, 60.063 Overall, the structure has moved from a heavy selloff to a recovery with higher lows and a range breakout, and that deserves respect. But price is now pressing against a level that already rejected it once. What I'd watch is how the market behaves on the first pullback. If buyers defend the 66 area and volume expands on the next push, the move toward 70 stays alive. If that zone fails, the rally has likely been a relief bounce inside a larger range. Let the reaction at those levels confirm the direction before committing, and keep risk defined either way. #ByXIMPACT$BTCUSDT
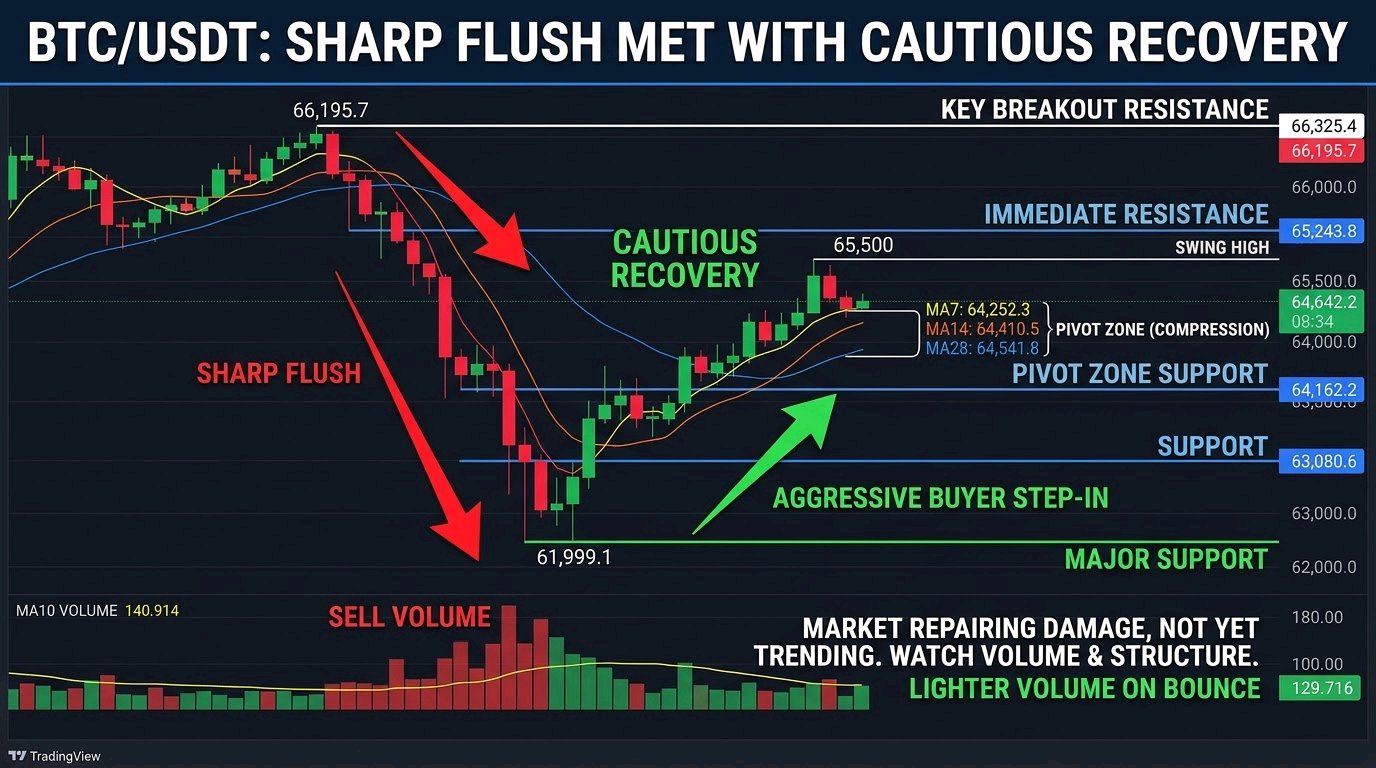
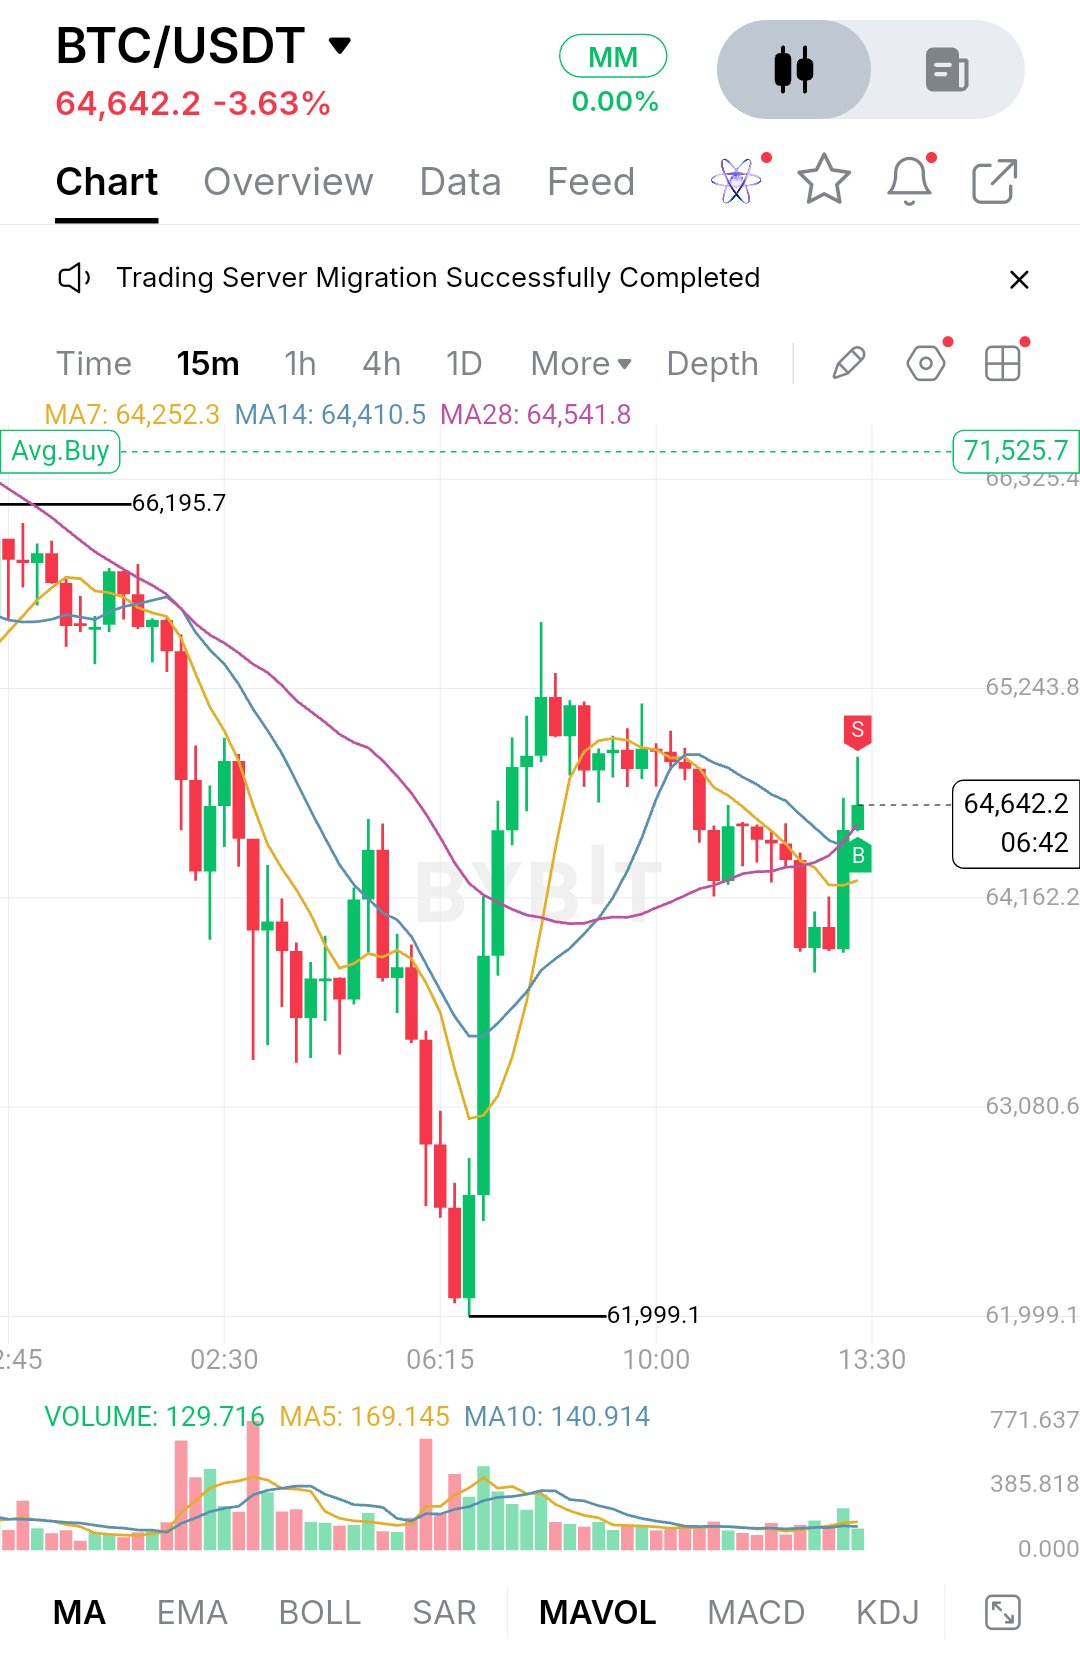
$BTCUSDT is trading at 64,642.2, down 3.63% on the day, and the chart tells a clear story of a sharp flush followed by a cautious recovery.** Earlier in the session, price was still hanging around the 66,195.7 area. Sellers took control from there and pushed Bitcoin down in a steady, heavy sequence of red candles, with the biggest volume bars of the session showing up during the drop. The move bottomed out at 61,999.1, where buyers finally stepped in aggressively and produced one of the largest green candles on the chart. That reaction told us the market was not ready to hand over that zone without a fight. After that bounce, Bitcoin moved into a recovery and then a choppy range. The rebound ran up toward the 65,500 area but stalled there, forming a lower high compared to the 66,195.7 peak. From that point price drifted sideways to lower, dipped toward the 63,900 region, and then printed a fresh green candle that lifted it back to the current level. So the structure right now is a V-shaped recovery that has not yet reclaimed the prior highs. Momentum has improved, but the market is still repairing damage rather than trending. On the technical side, the moving averages are worth a close look. Price is sitting just above all three: MA7 at 64,252.3, MA14 at 64,410.5 and MA28 at 64,541.8. They are bunched tightly together, which usually means the market is undecided and compressing before its next real move. The latest green candle pushed through that cluster, which is a constructive sign, but one candle is not confirmation. Volume is the other piece. The current reading is 129.716 against a MA5 of 169.145 and a MA10 of 140.914, so participation on the bounce is lighter than the average. Buyers are present, but they are not yet showing the conviction that was behind the selloff. That is something to keep an eye on. For support, the first area is the 64,162.2 grid level, which lines up closely with the moving average cluster. If price holds above it on pullbacks, it keeps the short-term recovery intact. Below that, 63,080.6 is the next meaningful zone, and the pullback low from the recent range formed above it. The major support is the 61,999.1 swing low. That level has already been tested once with a strong rejection, so it matters a lot. A clean break below it would shift the structure back to bearish and open the door to a deeper leg lower, since there is no visible support beneath it on this chart. On the upside, the immediate resistance sits around the recent rejection wick near 65,000, where the red "S" marker appears on the chart. Above that is the 65,243.8 level, followed by the swing high near 65,500. The key breakout level is 66,195.7, the high from before the selloff, with 66,325.4 just above it. A move through that area would take out the lower-high structure and change the tone completely. Psychologically, traders will also be watching the 65,000 and 66,000 round numbers. The bullish scenario is straightforward. Buyers need to hold price above the moving average cluster, keep 64,162.2 as support, and then push through 65,243.8 with stronger volume than we have seen on this bounce. If they get above the 65,500 swing high, the focus moves to 66,195.7 and then 66,325.4. A close above those levels would suggest the entire drop was absorbed and the market is ready to rebuild higher. The bearish scenario is a rejection from the 65,000 to 65,243.8 zone, followed by a loss of the moving averages and 64,162.2. That would confirm the bounce as a simple relief move inside a bigger downtrend, with 63,080.6 as the first target. If that gives way, a retest of 61,999.1 becomes likely, and a break below it would be the real warning sign. **Key Price Levels** - Resistance: 65,243.8 / 66,195.7 / 66,325.4 - Pivot zone: 64,162.2 to 64,541.8 (moving average cluster) - Support: 64,162.2 / 63,080.6 - Major support: 61,999.1 In the end, Bitcoin has done the hard part by defending 61,999.1, but it has not yet proven that the recovery has real strength behind it. The compression around the moving averages suggests an expansion is coming, and the direction will depend on whether price can hold above 64,162.2 and break 65,243.8 with improving volume. Watch how the market behaves around that pivot zone rather than chasing the candle. Structure and volume will tell the story, and none of this is a guarantee of where price goes next. Manage risk accordingly. #IMPACTbyTrade$ETHUSDT
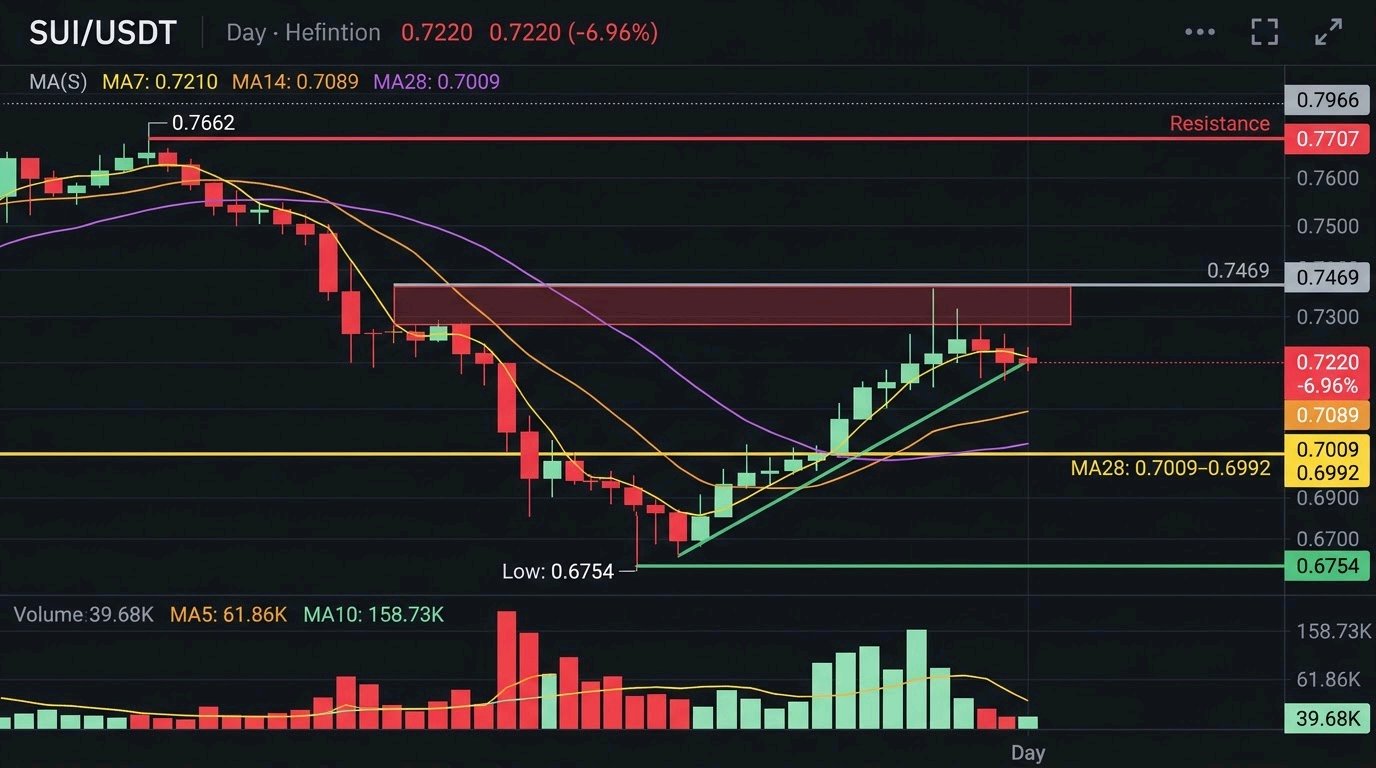
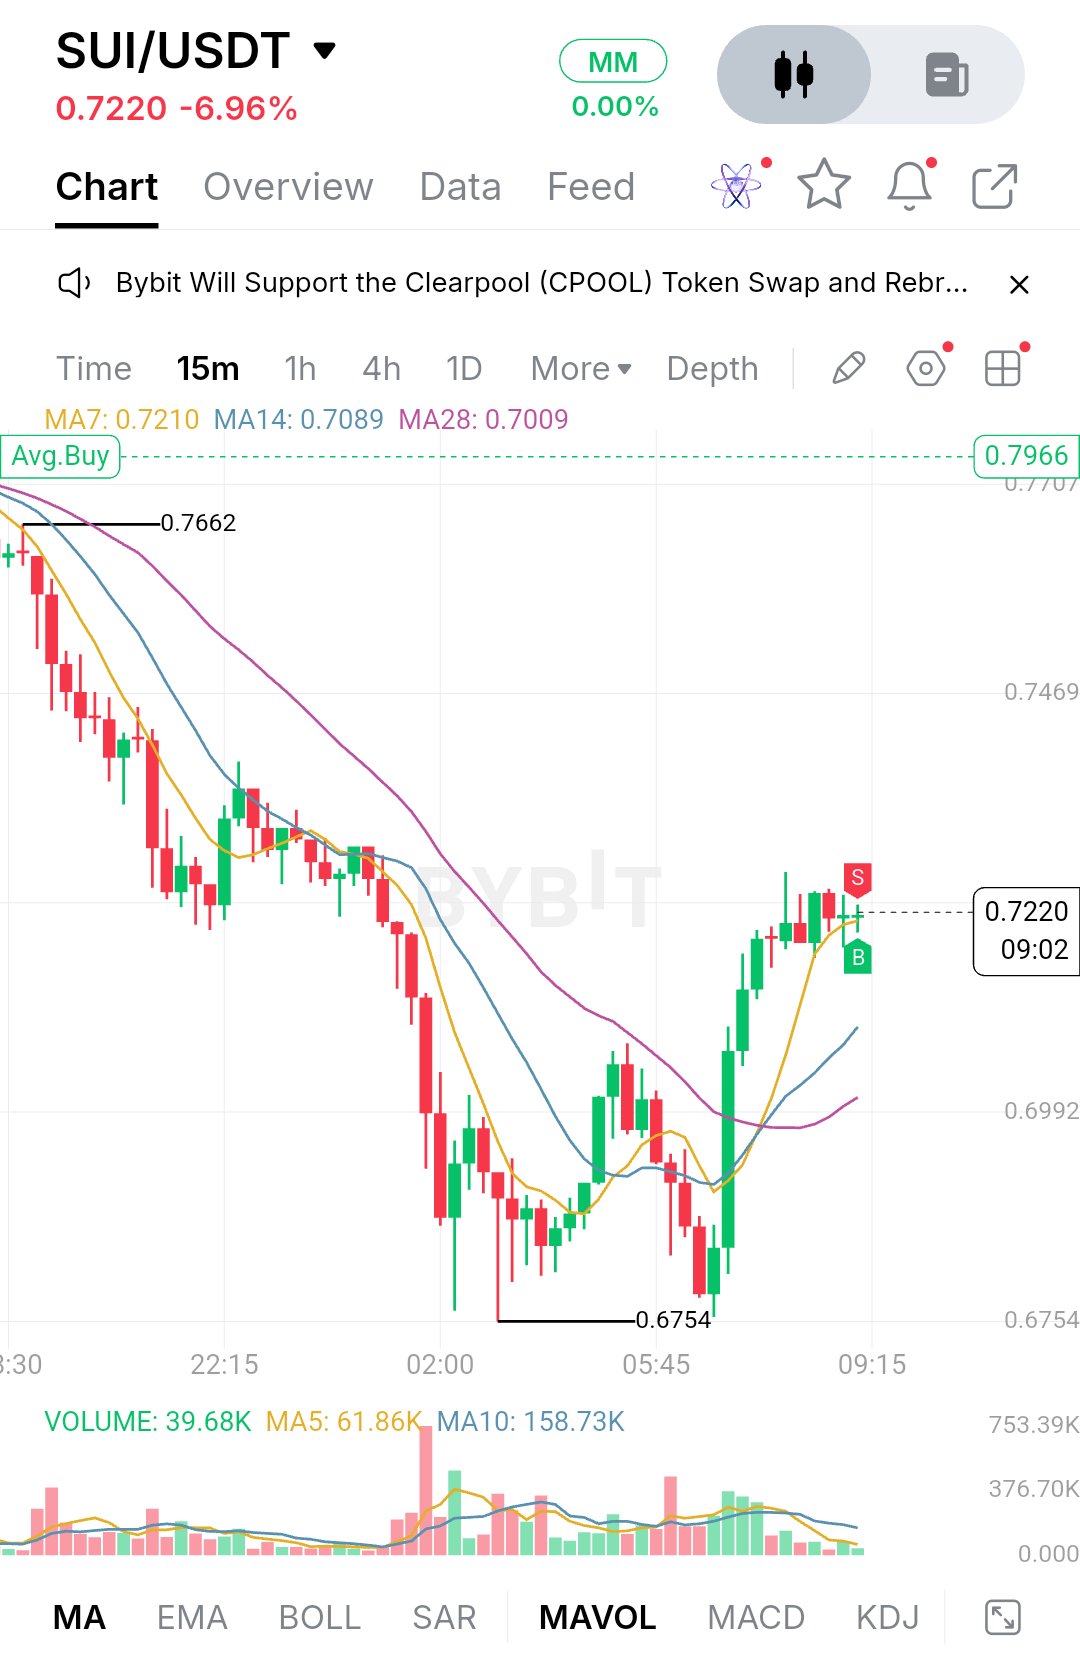
$SUIUSDT is trading at 0.7220, down 6.96% over the last 24 hours. The day started with sellers taking firm control near 0.7662, where price topped out and began a steady, almost uninterrupted slide. There was very little hesitation on the way down. Candle after candle closed red, and each small bounce was sold into until price flushed to 0.6754. That low is where the story changed. Heavy volume came in around the bottom, and the selling pressure stopped producing new lows. Buyers stepped in and pushed price back up in a sharp V-shaped recovery, reclaiming roughly 0.047 from the bottom in a few hours. The structure now looks like a recovery that is still trying to prove itself. Price has climbed back above all three moving averages. MA7 sits at 0.7210, MA14 at 0.7089 and MA28 at 0.7009, and price is trading right on top of the fastest one. The averages are also turning: MA7 has crossed above the other two, and MA14 is curling up toward MA28. That is an early sign of momentum shifting, but the longer averages are still far below the earlier highs, so this is a bounce inside a larger downtrend until proven otherwise. Volume gives a useful hint. The selloff came with large red volume bars, while the recovery has been steady but lighter. Current volume is 39.68K, below its MA5 of 61.86K and well below the MA10 of 158.73K. The bounce is real, but it isn't yet backed by the kind of participation that usually confirms a trend reversal. The last few candles are small-bodied and indecisive, with a rejection wick near the top, which suggests buyers are catching their breath, or that sellers are starting to defend this zone. On the downside, the first support is the MA7/MA14 area around 0.7210 to 0.7089. If price pulls back, this is where buyers need to show up. Below that, the 0.7009 to 0.6992 zone stands out, since it lines up with MA28 and a visible horizontal level on the chart. A close below it would put the whole recovery in doubt. The major support is the 0.6754 low. Losing it would invalidate the bounce and open the door to fresh lows. On the upside, the nearest resistance is just above current price, around the recent rejection wick near 0.73 to 0.74. Above that sits 0.7469, a clear horizontal level on the chart. The bigger breakout zone is 0.7662, the high of this entire move, with 0.7707 just above it. The 0.7966 marker on the chart is the next reference above that if momentum really expands. For the bullish case, buyers need to hold above the MA7/MA14 cluster, build a series of higher lows, and break 0.7469 on stronger volume. A clean push through that level would bring 0.7662 into play. Reclaiming it would be the first real sign that the whole selloff has been absorbed. For the bearish case, a rejection around 0.73 to 0.7469 followed by a loss of 0.7089 would suggest this was only a relief bounce. A break under 0.6992 would turn the focus back to 0.6754, and a close below that would confirm sellers are still in charge. Key price levels: - Resistance: 0.7300 to 0.7400 (recent rejection zone) - Resistance: 0.7469 - Major resistance: 0.7662 and 0.7707 - Support: 0.7210 (MA7) and 0.7089 (MA14) - Support: 0.7009 to 0.6992 (MA28 and horizontal level) - Major support: 0.6754 (recent low) Overall, SUI has done the hard part by defending 0.6754 and recovering above the short-term averages. What matters now is the reaction around 0.73 to 0.7469 and whether volume expands when price gets there. A tight pause above the averages followed by a strong, high-volume breakout would be the healthiest setup. A weak retest that fails at the MAs would tell a different story. Watch how price behaves at those levels rather than chasing the bounce, and let the structure confirm the next move. This is not financial advice, so manage your risk accordingly. #IMPACTbyTrade$ETHUSDT
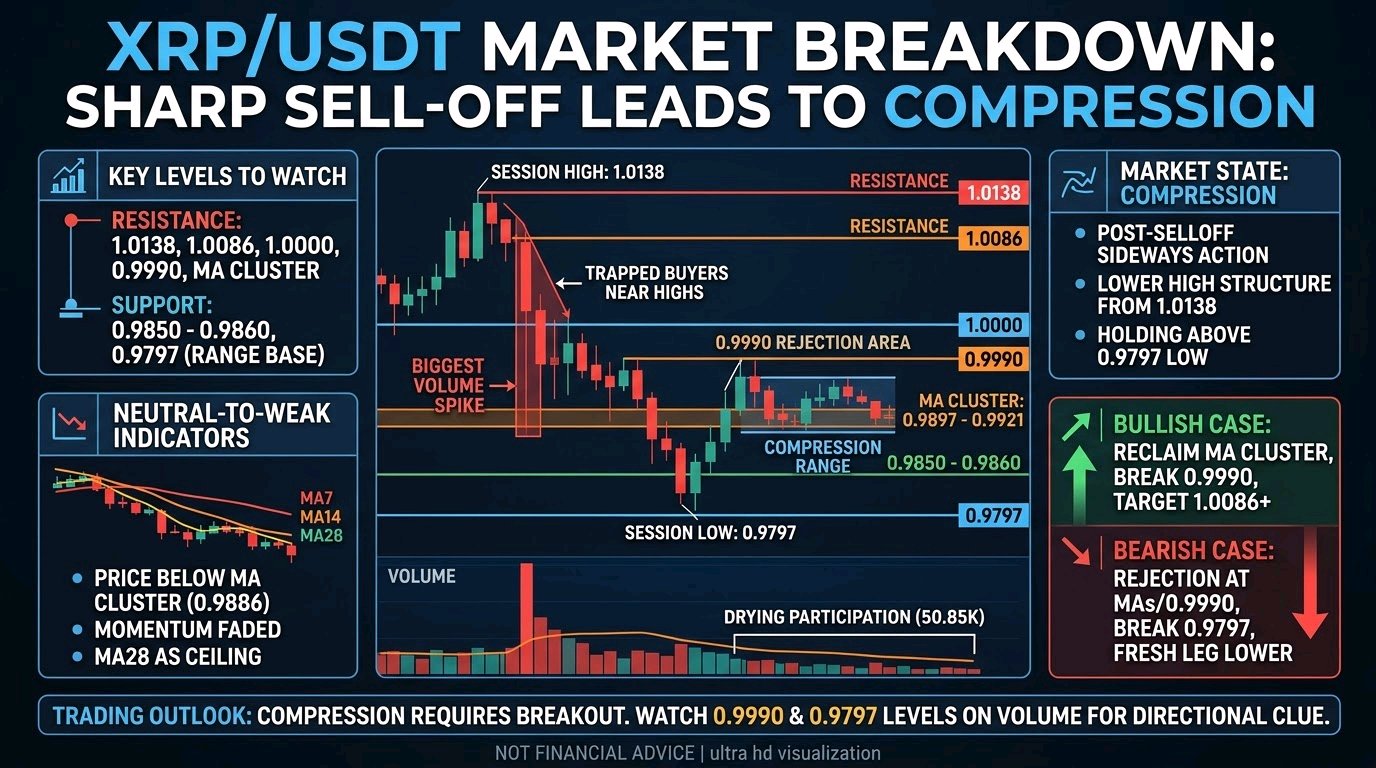
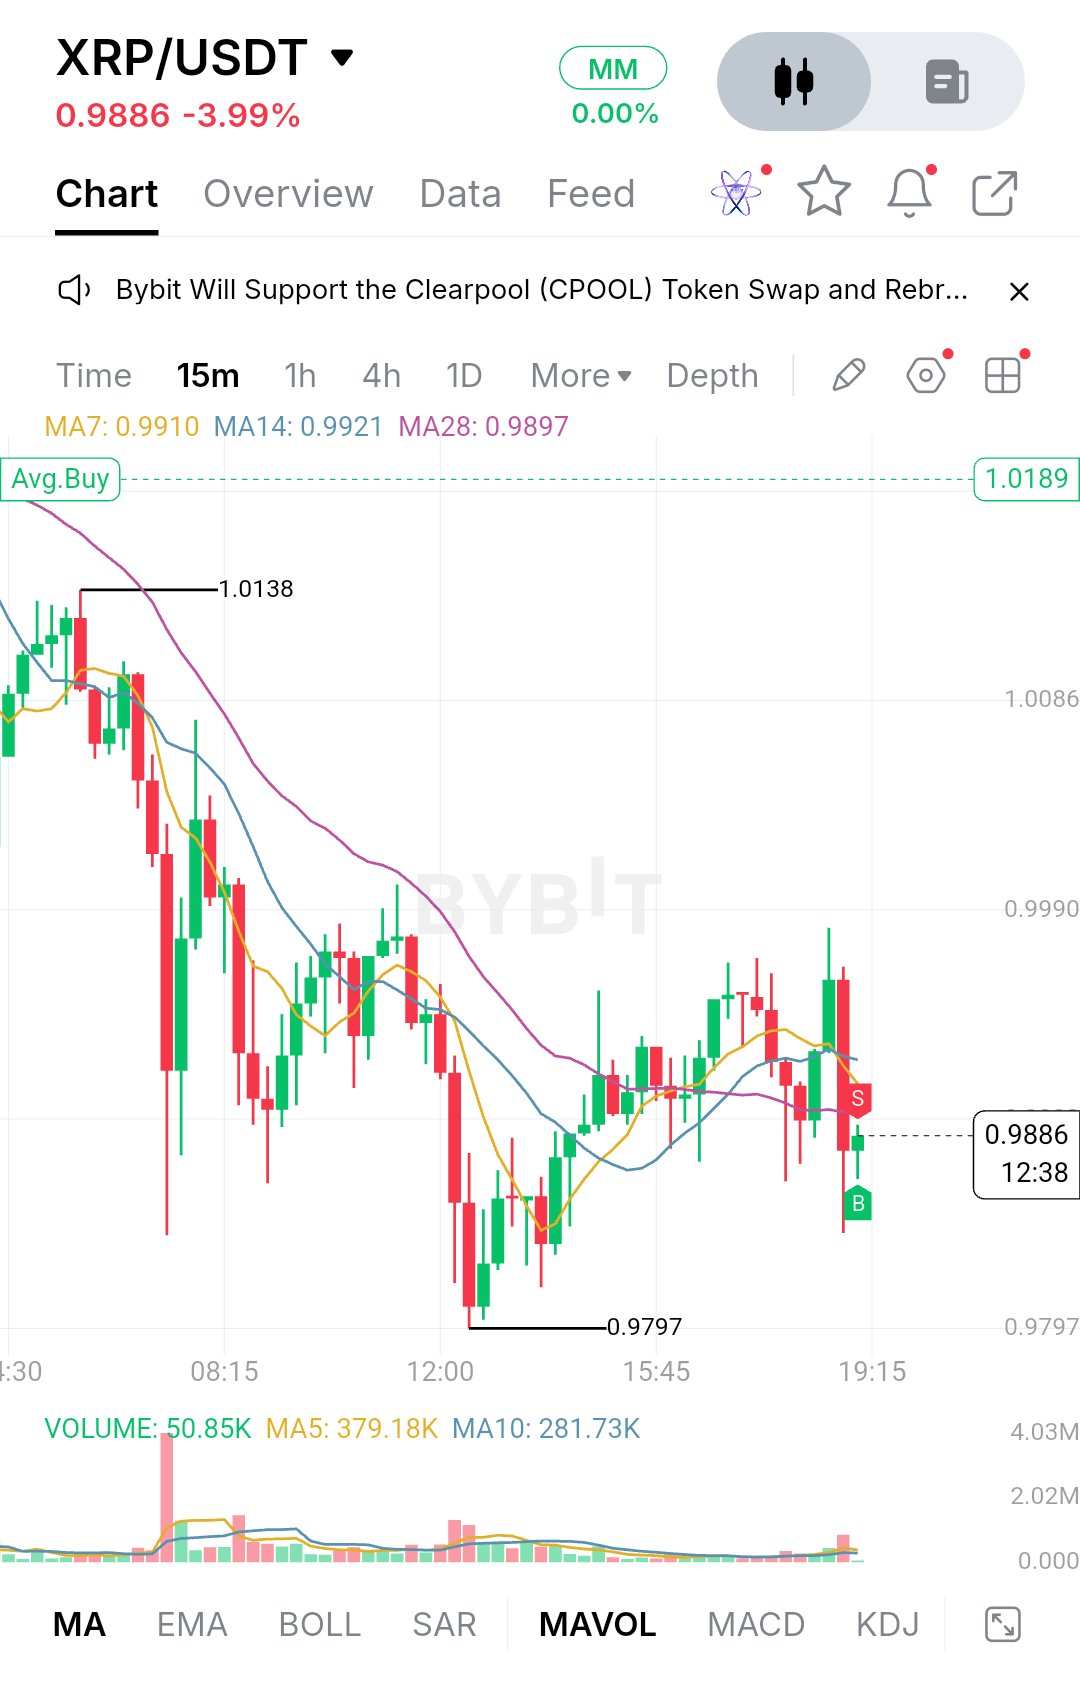
$XRPUSDT is trading at 0.9886, down 3.99% on the day. The move wasn't gradual. Buyers pushed price up to the 1.0138 high early in the session, and sellers stepped in right there. What followed was a sequence of heavy red candles, with the biggest volume bar of the whole chart appearing in the middle of that drop. That kind of spike usually means one side got caught off guard, and in this case it was the late buyers near the highs. After the flush, XRP never really recovered the lost ground. It bounced toward the 0.9990 area, stalled, rolled over again, and carved out the 0.9797 low around midday. Since then price has been ranging in a tight band, with sellers capping every push under 1.0000 and buyers defending the lower end. The structure is a lower-high sequence from 1.0138 down to the sub-1.0000 highs of the last few hours, while the recent dips have held above the 0.9797 low. That's a market compressing, not trending, and volume backs it up: the latest reading is 50.85K against a MA5 of 379.18K and a MA10 of 281.73K, so participation has dried up well below recent averages. On the indicators I can actually see, the picture is neutral-to-slightly-weak. MA7 sits at 0.9910, MA14 at 0.9921, and MA28 at 0.9897, and price at 0.9886 is trading just under all three. They're bunched tightly together and flattening out, which says momentum has faded in both directions. The MA28 was the slow-moving ceiling during the whole decline, and the fact that the shorter averages have climbed up to meet it shows how much the selling pressure has cooled. Still, price sitting below the cluster means sellers keep the short-term edge until proven otherwise. For support, the first zone is the 0.9850 to 0.9860 area, where the latest wick found buyers. Below that, 0.9797 is the level that matters most, because it's the session low and the base of the entire range. If buyers keep defending it, the range holds and a bounce becomes more likely. A clean break below it, especially on rising volume, would remove the floor and open the door to a fresh leg lower, since there is no visible structure beneath it on this chart. Resistance starts at the moving average cluster around 0.9897 to 0.9921, which price needs to reclaim first. Above that, 0.9990 is the key level. It lines up with the recent rejection highs and sits just under the psychological 1.0000 mark. If XRP clears 1.0000, the next reference is 1.0086, followed by the 1.0138 session high. The Avg.Buy marker at 1.0189 sits above all of that, so it would only come into play after a full recovery. The bullish case is straightforward. Buyers need to push price back above the MA cluster, hold it, and then break 0.9990 with real volume behind it. A move like that would flip the lower-high structure and make 1.0000 and 1.0086 realistic next targets. Without a volume pickup, though, any push higher risks being another rejection. The bearish case starts with price failing at the MA cluster or at 0.9990 and rolling over again. That would extend the lower-high pattern and put 0.9850 back under pressure. If that gives way and 0.9797 breaks, the range would be invalidated and sellers would likely take control of the short-term structure. Key price levels: - Resistance: 0.9897 to 0.9921 (MA cluster), 0.9990, 1.0000, 1.0086, 1.0138 - Support: 0.9850 to 0.9860, 0.9797 - Invalidation of the range: a close below 0.9797 on strong volume XRP is sitting in compression after a sharp sell-off, and compression tends to resolve with a decisive move. Rather than chasing the next candle, watch how price behaves around 0.9990 on the upside and 0.9797 on the downside, and pay attention to whether volume returns when it gets there. The break, not the bounce, will tell you which side is in control. None of this is a prediction, just a map of where the next expansion is likely to start. #IMPACTbyTrade$BTCUSDT
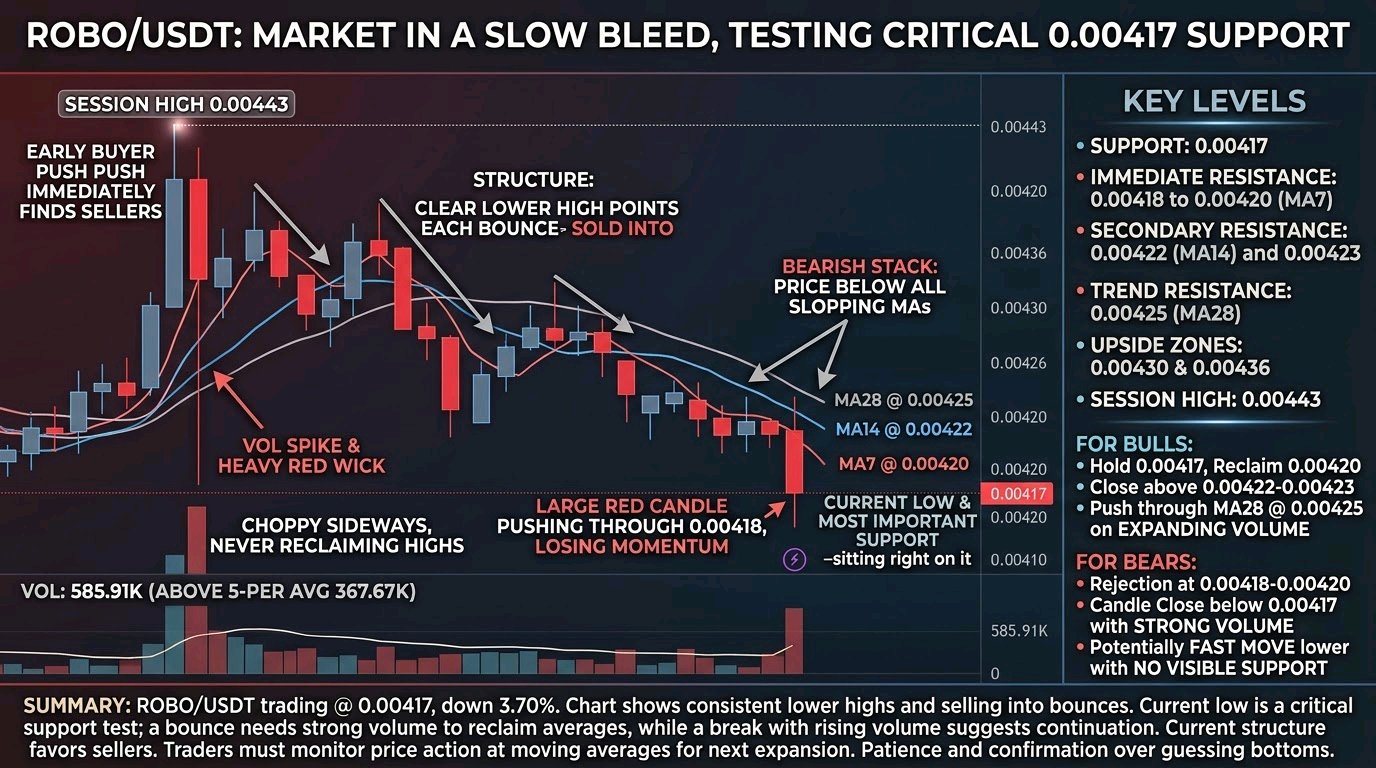
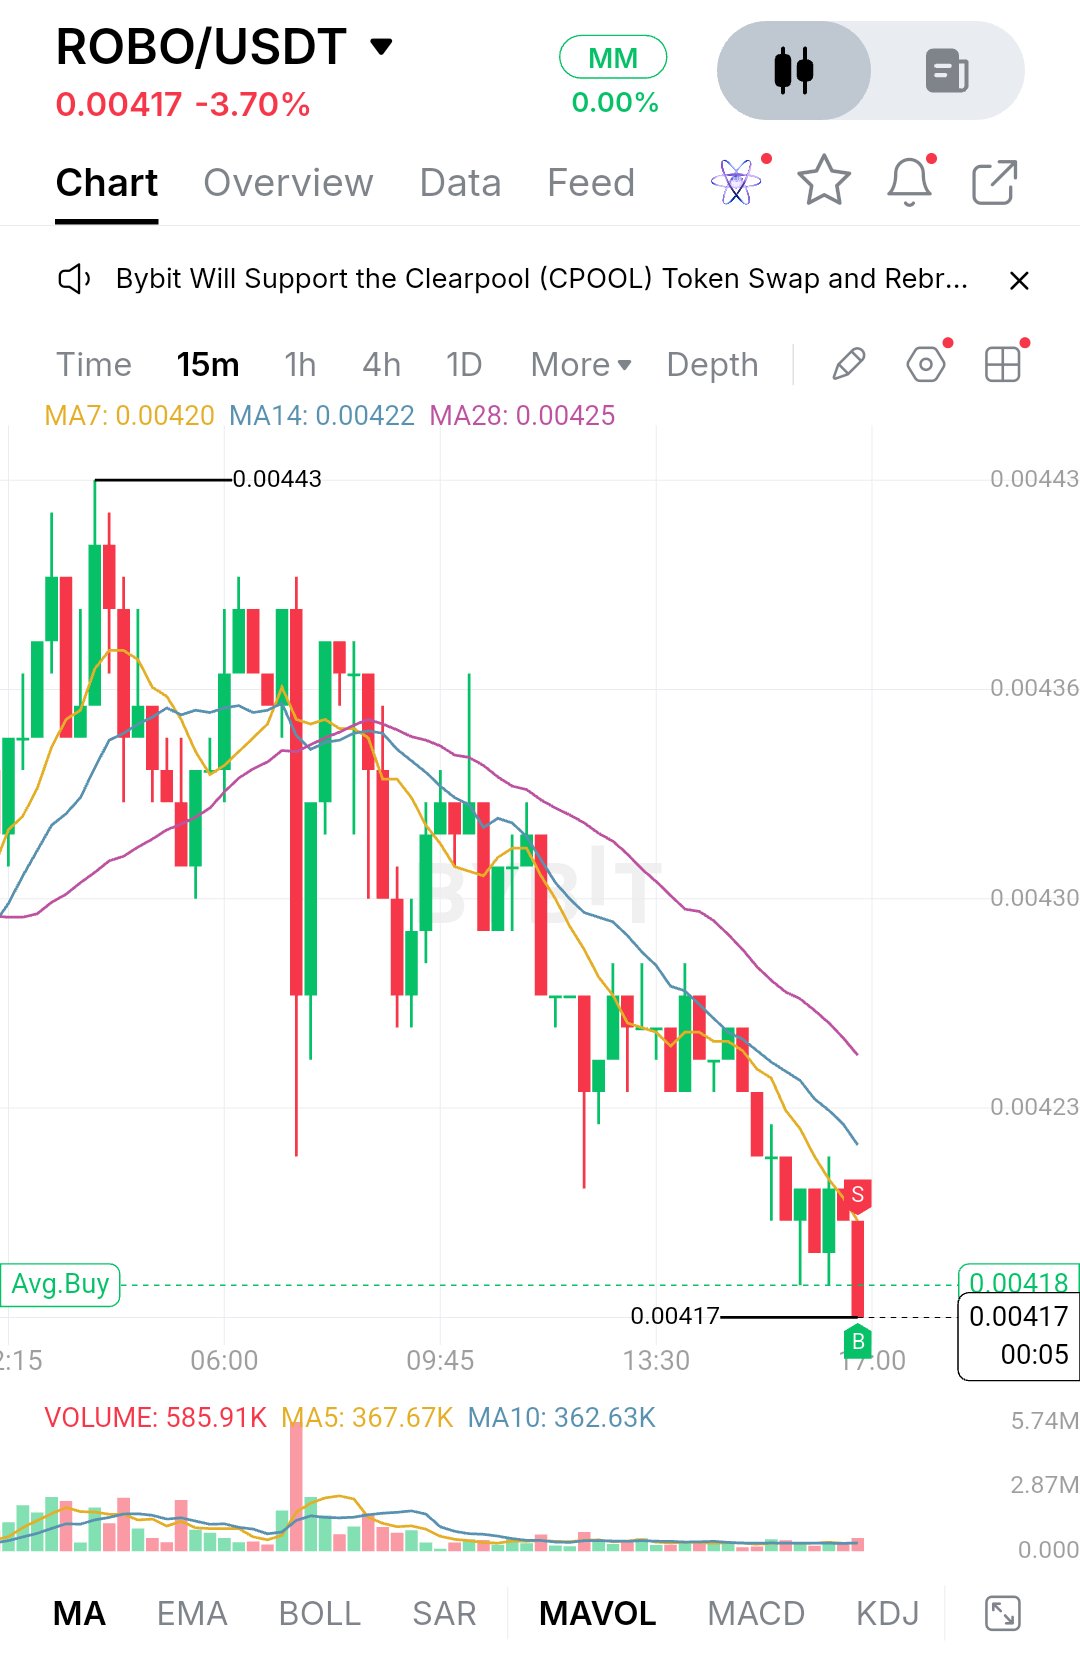
$ROBOUSDT is trading at 0.00417, down 3.70% on the day, and the session has been a slow bleed. Price started the day near the 0.00443 high, where buyers pushed into resistance and sellers stepped in right away. Since then the chart has made a steady series of lower highs, and each bounce has been sold into rather than extended. The structure tells most of the story. After the early push to 0.00443, one heavy red candle with a long wick dragged price down sharply, and volume spiked at that moment. The market recovered part of that move and chopped sideways for a while, but buyers never reclaimed the highs. From the middle of the session onward, price has stepped lower in small waves, and the latest candle is a large red one that pushes straight through the recent consolidation near 0.00418. This is a market losing momentum, not one building a base. The moving averages confirm it. MA7 sits at 0.00420, MA14 at 0.00422 and MA28 at 0.00425, stacked in bearish order with price below all three and every line sloping down. The faster averages have crossed under the slower one and are leaning on price. Volume shows the same pattern. The big spike earlier in the session has faded to quiet trading, and the current reading of 585.91K is above its 5-period average of 367.67K, so the latest sell-off is coming with more participation than the recent drift. The most important support is the current low at 0.00417. Price is sitting right on it, and there is no other tested level visible below, so a clean break would leave the chart without an obvious reference until buyers show up. A hold here would at least keep the market in a slow grind, while a break on rising volume would suggest the sell-off is extending. On the upside, 0.00418 to 0.00420 is the first resistance, where the broken range and MA7 overlap. Above that, MA14 at 0.00422 and the 0.00423 level form a second hurdle, followed by MA28 at 0.00425. The bigger zones are 0.00430 and 0.00436, with the session high at 0.00443 as the final target. For bulls to change the picture, they need to hold 0.00417, reclaim 0.00420 and then close above the 0.00422 to 0.00423 zone. Beyond that, a push through MA28 at 0.00425 would be the first sign the lower-high sequence is ending. Volume should expand on the way up, because the recent bounces have been weak. If sellers keep control, a rejection at 0.00418 to 0.00420 followed by another leg lower is the most likely path. A candle close below 0.00417 with strong volume would confirm the break, and with no visible support underneath, the move could be fast. None of this is guaranteed, but the current structure favors sellers until proven otherwise. Key price levels: - Support: 0.00417 - Immediate resistance: 0.00418 to 0.00420 (MA7 at 0.00420) - Secondary resistance: 0.00422 (MA14) and 0.00423 - Trend resistance: 0.00425 (MA28) - Upside zones: 0.00430 and 0.00436 - Session high: 0.00443 In the end, this is a test of whether 0.00417 can hold. A bounce that quickly reclaims 0.00420 on solid volume would be the first constructive signal, while a break below with rising volume would keep the trend pointed down. Traders should watch how price behaves around the moving averages, because the next expansion will likely start from there. Until then, patience and confirmation matter more than guessing the bottom. #IMPACTbyTrade$GRAMUSDT
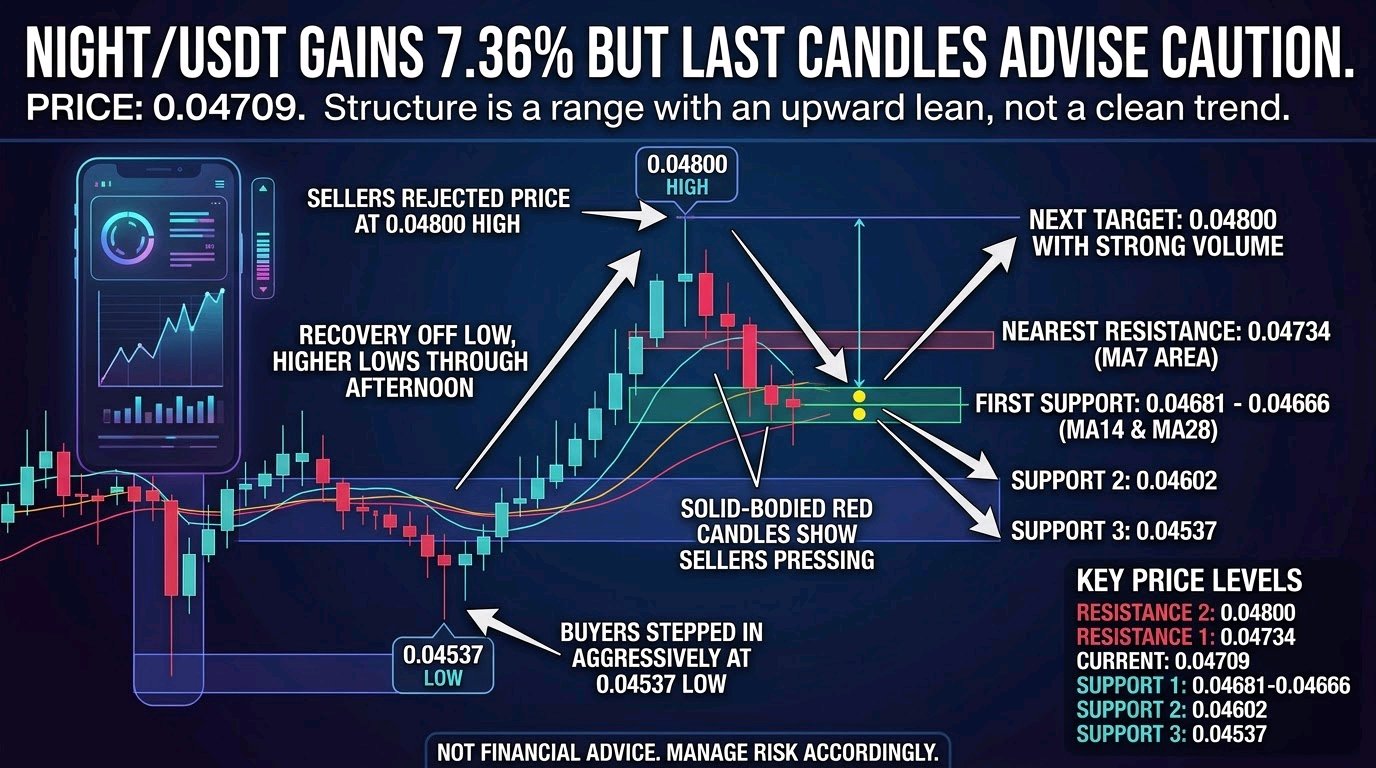
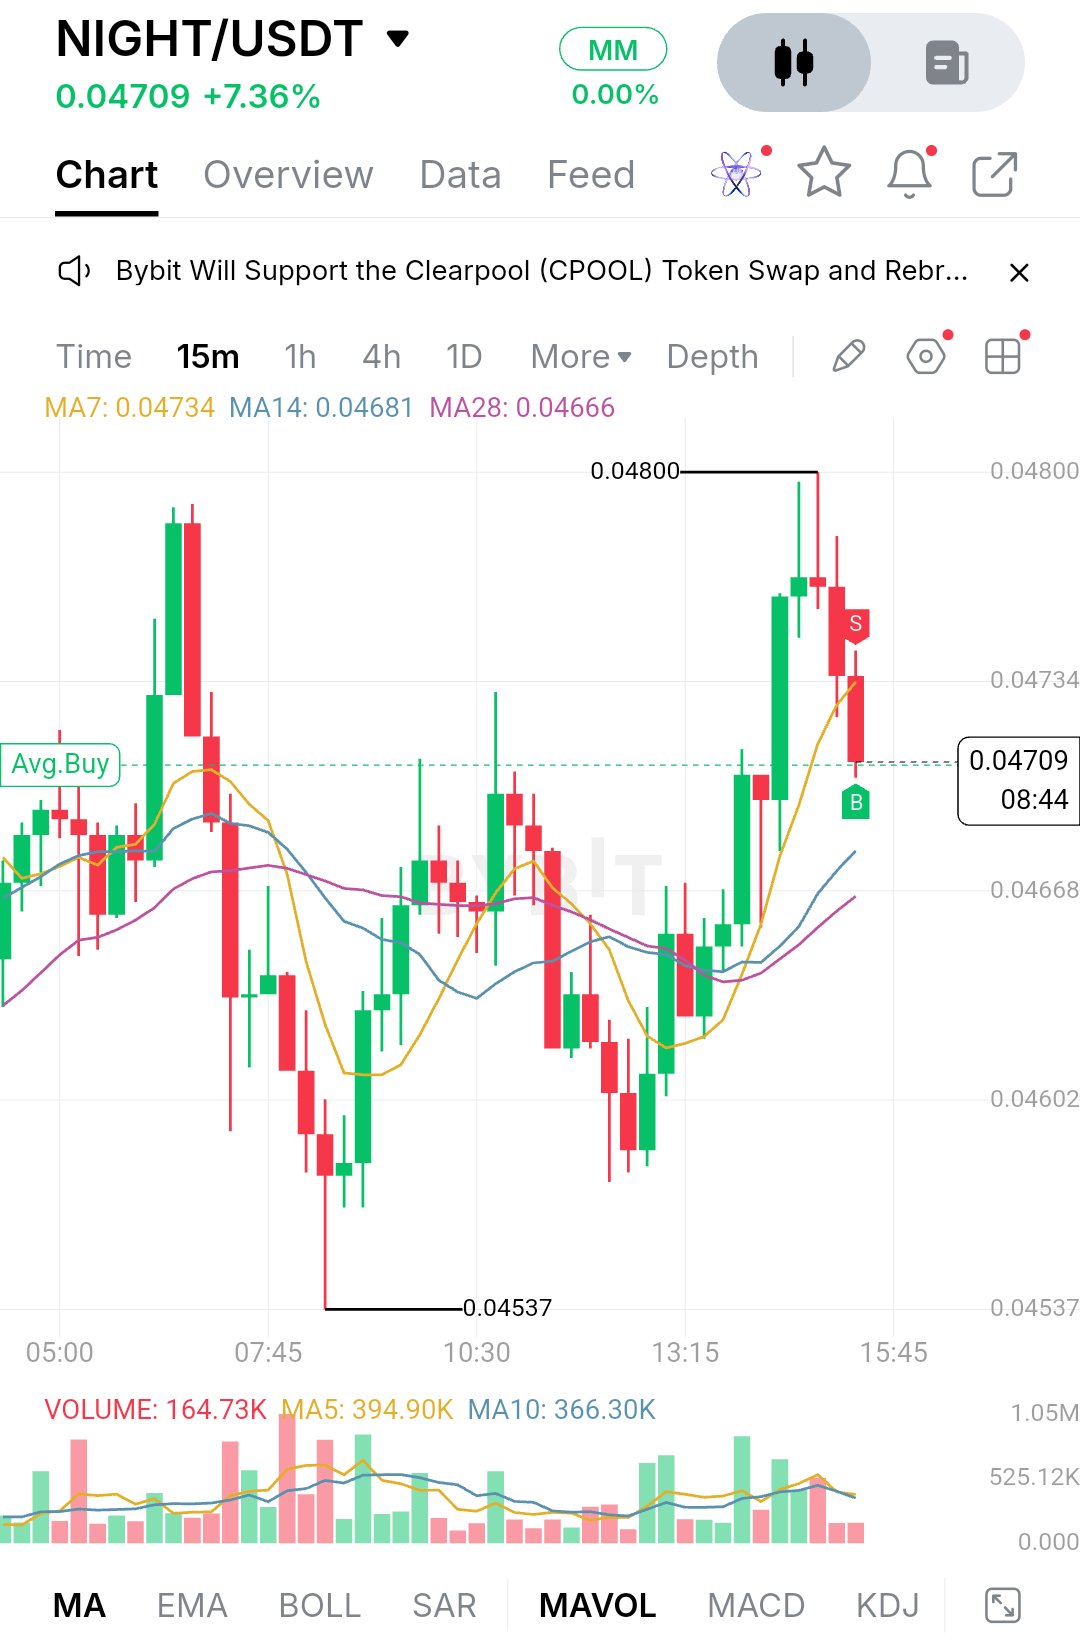
$NIGHTUSDT is trading at 0.04709, up 7.36% on the day, but the last few candles tell a more cautious story than the headline number.** Price spent the early session bouncing around 0.0465 to 0.0472, then dropped hard into the 0.04537 low just before the 08:00 area. That candle left a long lower wick, which shows buyers stepped in aggressively at that level. From there NIGHT rebuilt slowly through the middle of the session, and a stronger push after 13:00 carried it to the 0.04800 high. Sellers answered immediately. The candle at the top has a long upper wick and a small body, and the red candles since then have pulled price back down to the current area. The structure is a range with an upward lean, not a clean trend. The 0.04537 to 0.04800 band has contained nearly everything today, and the market has now tested both edges. The recovery off the low was constructive, with higher lows forming through the afternoon, but the rejection at the top shows momentum has cooled. The latest red candles are also solid-bodied, which suggests sellers are pressing rather than just taking profit. On the moving averages, MA7 sits at 0.04734, MA14 at 0.04681 and MA28 at 0.04666. Price is now below the fast MA7 while still above both slower averages. That's a short-term loss of momentum inside a larger recovery, not a full reversal. The MAs are also stacked in a bullish order and sloping up, with the slower ones fanning out from the earlier flat stretch. Volume is the weak point. The latest bar reads 164.73K against a MA5 of 394.90K and a MA10 of 366.30K, so the current pullback is happening on thin participation. That cuts both ways. Light selling volume means the drop isn't aggressive yet, but the bounce attempts have also lacked conviction. For support, the first area to watch is 0.04681 to 0.04666, where MA14 and MA28 cluster. This is the zone that most likely decides whether the afternoon uptrend survives. Below it, 0.04668 on the price axis lines up closely, which adds weight. If buyers defend it with a visible volume pickup, the higher-low structure stays intact. A clean loss of it would put 0.04602 in play, and below that the real floor is the 0.04537 session low. A break there would erase the whole recovery. On the upside, the nearest resistance is MA7 near 0.04734, which price needs to reclaim first. Above it, 0.04800 is the level that matters, since it's the session high and the spot where sellers showed up hard. The round figure just above it can act as a psychological magnet, but only a close above 0.04800 with strong volume would turn it into a real target. The bullish case is simple. Buyers need to hold the MA14/MA28 zone, push back above MA7 at 0.04734, and then challenge 0.04800 with volume well above the MA5 level of 394.90K. A close above that high would break the range and open room for continuation. The bearish case starts with another rejection near 0.04734 to 0.04800, followed by a break under 0.04666. That would shift the afternoon recovery into a failed higher-low sequence and likely send price back toward 0.04602, with 0.04537 as the larger risk. **Key price levels** - Resistance 2: 0.04800 (session high) - Resistance 1: 0.04734 (MA7 area) - Current price: 0.04709 - Support 1: 0.04681 to 0.04666 (MA14 and MA28) - Support 2: 0.04602 - Support 3: 0.04537 (session low) NIGHT is sitting in the middle of its range after rejecting the top, so the next move depends on how it handles the 0.04666 to 0.04734 pocket. A hold with rising volume keeps the range-expansion setup alive. A loss of the slower MAs says the bounce was just a swing inside the range. Either way, watch how price reacts at those levels rather than chasing the 7% on the day, because the next expansion will come out of that zone. None of this is financial advice, and levels can fail, so manage risk accordingly. #IMPACTbyTrade$LTCUSDT
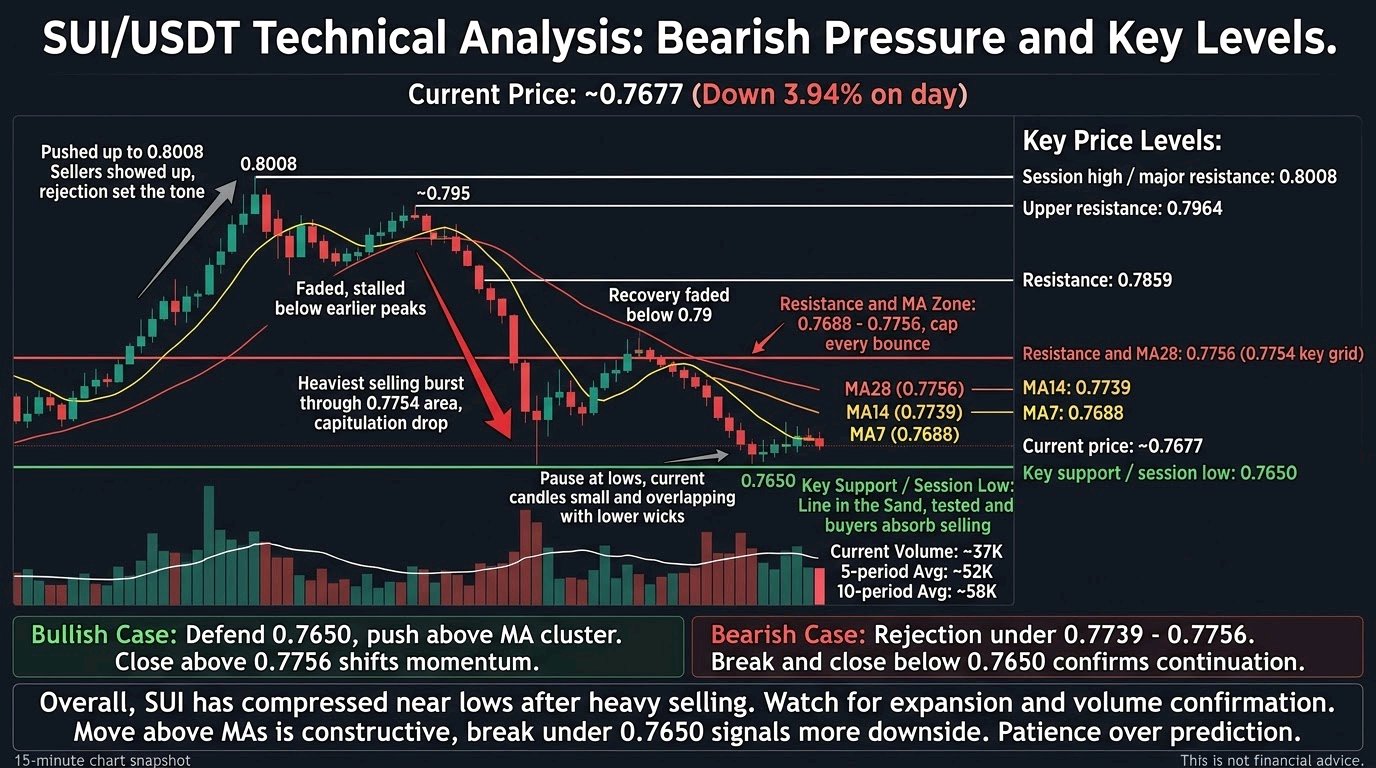
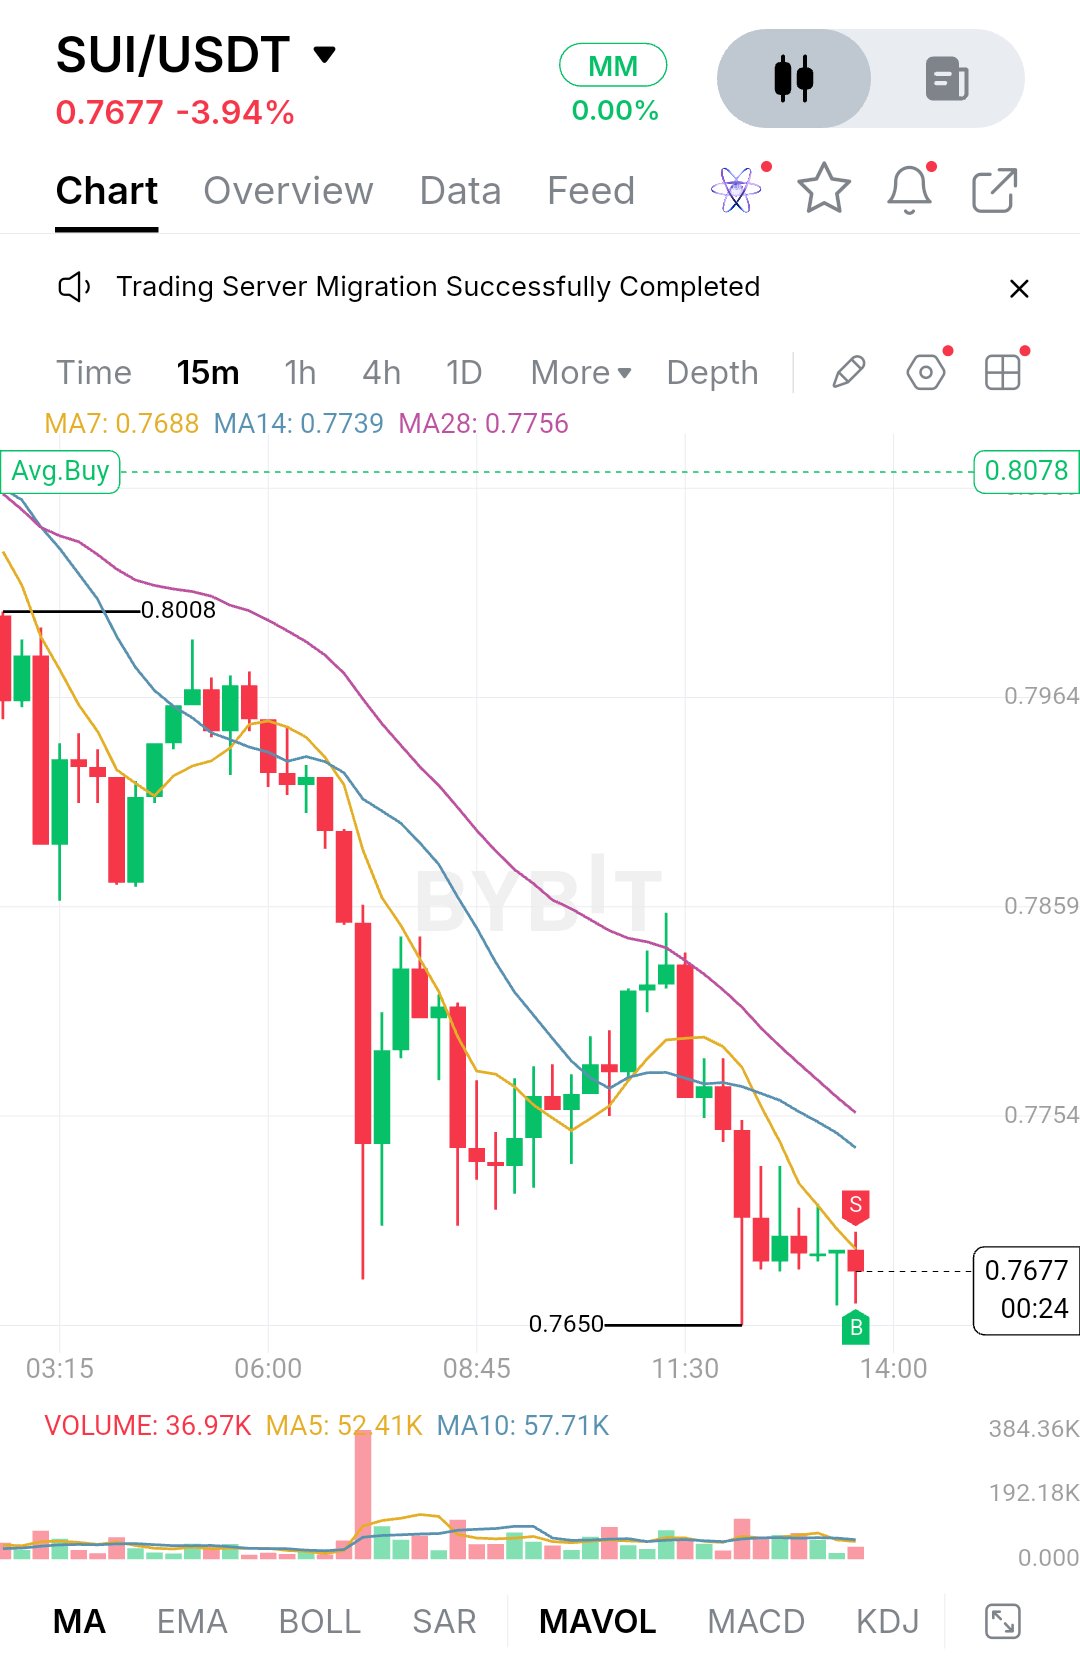
$SUIUSDT is trading around 0.7677, down 3.94% on the day, and the chart shows a market that has spent most of the session giving ground. Early on, price pushed up toward 0.8008, but sellers showed up there and the rejection set the tone. A bounce followed, but it stalled in the mid-0.79s and rolled over again. The heaviest selling came in a single burst of volume that pushed price down through the 0.7754 area in one move. Buyers stepped in afterward and rebuilt a recovery, but it faded below 0.79 and price slipped again into the session low at 0.7650. After that capitulation-style drop, the structure turned into a sequence of lower highs. The recovery into the late morning was real, but it topped out well below the earlier peaks and was sold into. The most recent candles around the lows are small and overlapping, with lower wicks showing some dip-buying, but nothing yet that looks like a decisive reversal. Right now it looks more like a pause at the lows than a base. Volume supports that reading: the current bar sits near 37K against a 5-period average of about 52K and a 10-period average of about 58K, so selling pressure has cooled, but buyers haven't shown up with conviction either. This screenshot is the 15-minute chart, and the only indicators on it are the moving averages (MA7, MA14 and MA28) and volume. There is no EMA200, RSI, MACD or Fibonacci tool visible, so I'm not going to quote values for those. What the chart does show is a clean bearish stack. MA7 sits at 0.7688, MA14 at 0.7739 and MA28 at 0.7756, all sloping down, with price at or below the fastest average. That tells me short-term momentum still belongs to sellers, and each bounce has been capped as it reached the slower averages. The market needs to reclaim and hold above them before the trend can be called improving. For support, the 0.7650 low is the line in the sand. It was tested and defended, with the lower wicks near it showing buyers willing to absorb selling there. If it holds on another retest, especially on shrinking volume, it can become the floor of a short-term range. A clean break below it would put the selling back in control, and with no obvious structure underneath on this view, price could move quickly. Failed support often leads to a fast flush, so I'd treat that level with respect. On the upside, the first hurdle is the cluster of MA7 and MA14 at 0.7688 to 0.7739, with MA28 just above at 0.7756. This zone also lines up with the 0.7754 area where the heavy sell-off began, so it should act as real overhead supply. Above it, the next reference levels are 0.7859 and 0.7964, with the session high at 0.8008 as the major ceiling. Round numbers like 0.80 tend to attract both profit-taking and fresh shorts, so I wouldn't expect it to break easily. The bullish case starts with buyers defending 0.7650 and then pushing price back above the short moving averages. A close above 0.7756, which clears all three averages, would be the first sign that momentum is shifting. From there, 0.7859 becomes the next target, then 0.7964 if volume expands on the move. Without a volume pickup, any bounce is more likely just another lower high. The bearish case is simpler. If price keeps getting rejected under 0.7739 to 0.7756 and rolls over again, sellers will likely try for another test of 0.7650. A break and close below that low would confirm continuation and invalidate the idea that this is a base. Weak bounces into falling averages are what trends usually look like before they extend. Key price levels: - Session high / major resistance: 0.8008 - Upper resistance: 0.7964 - Resistance: 0.7859 - Resistance and MA28: 0.7756 (0.7754 is the grid level where the sell-off began) - MA14: 0.7739 - MA7: 0.7688 - Current price: 0.7677 - Key support / session low: 0.7650 Overall, SUI has moved from a clear rejection at the highs to a heavy sell-off, a failed recovery and now a hesitant stall near the lows. The market is compressing, and compression usually resolves with an expansion. What I'd watch is whether the next push comes with real volume. A move above the moving average cluster would be the first constructive sign, and a break under 0.7650 would signal that the stall was only a pause before more downside. Until one of those happens, patience beats prediction. This is not financial advice, so manage your risk accordingly. #IMPACTbyTrade$BTCUSDT
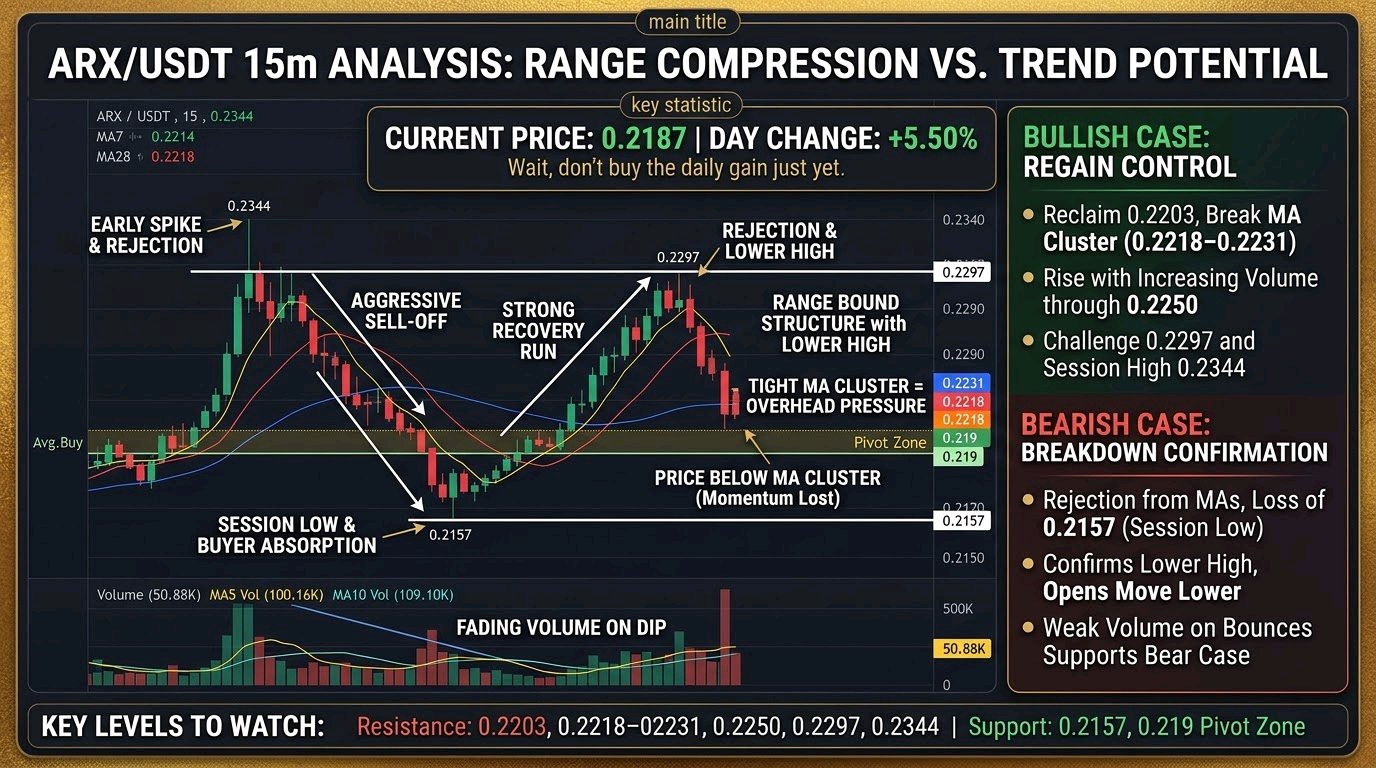
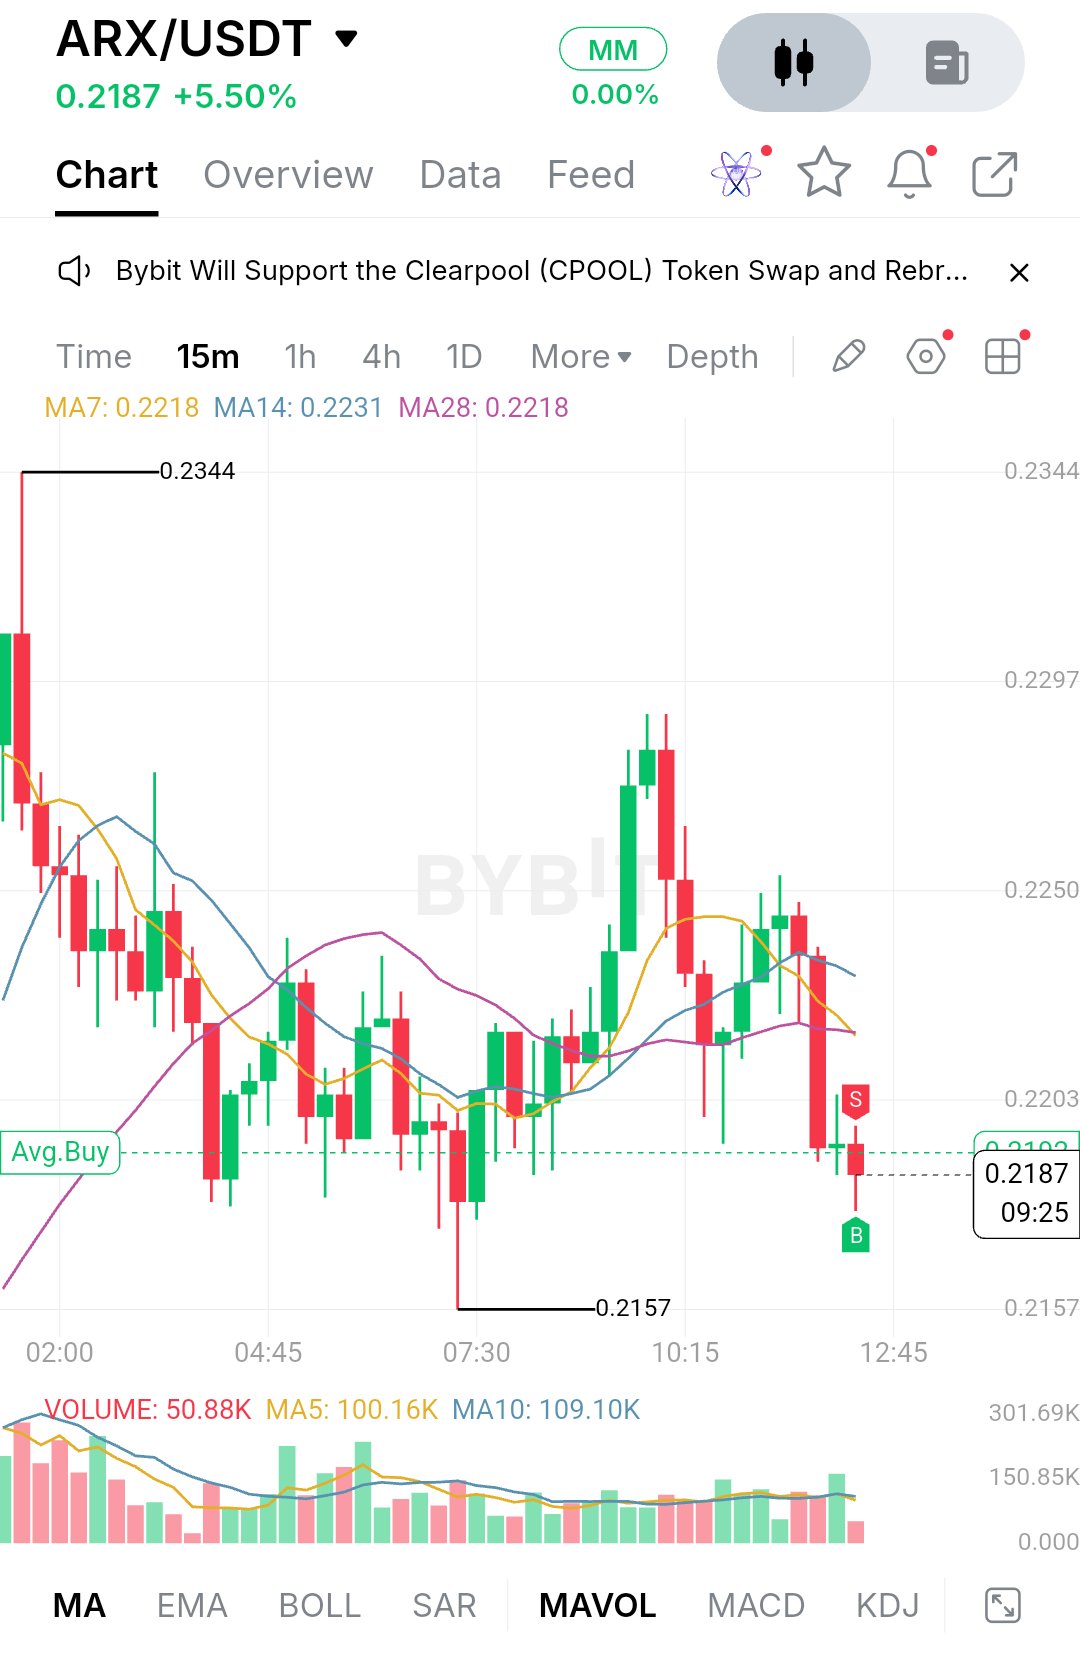
$ARXUSDT is trading at 0.2187, up 5.50% on the day, but the chart tells a more cautious story than that number suggests. Early in the visible session, price spiked to 0.2344 and was sold almost immediately. A tall red candle erased much of the move, and sellers stayed in control through the morning. That slide carried price down to 0.2157 around 07:30, where a long lower wick showed buyers stepping in and absorbing the selling. What followed was a real recovery. Price pushed back up through the mid-session and made a clean run toward the 0.2297 area around 10:15, with a few strong green candles. Sellers showed up again right there, and a large red candle took back most of that run. Since then price has drifted lower and now sits below all three moving averages, which tells me the bounce lost its momentum rather than failing outright. The structure right now is a range with a lower high. The market is bouncing between roughly 0.2157 and 0.2297, and the latest rejection came below the earlier peak. On the chart, MA7 sits at 0.2218, MA14 at 0.2231 and MA28 at 0.2218, so price is under a tight cluster that now acts as overhead pressure. The averages have also flattened and crossed each other repeatedly, which usually means the market lacks direction. Volume supports that read. The latest candle printed 50.88K against a 5-period average of 100.16K and a 10-period average of 109.10K, so the current dip is happening on fading participation, not aggressive selling. Price is also hovering around the Avg.Buy line near 0.219, which makes this a decision zone. The first support is 0.2157, the session low and the spot where buyers defended with that long wick. If it holds again, the range stays intact and a retest of the upper half becomes possible. If it breaks on strong volume, the structure turns into a lower low and the range stops being a useful reference. On the upside, the nearest resistance is 0.2203, followed by the moving average cluster between 0.2218 and 0.2231. Above that, 0.2250 is a clear horizontal level where price stalled several times, then 0.2297, the top of the recovery, and finally 0.2344, the session high. For the bulls, the first job is reclaiming 0.2203 and holding it, then closing back above the 0.2218 to 0.2231 cluster. A move through 0.2250 with rising volume would show buyers are regaining control, and 0.2297 would become the next test. A break above that would put 0.2344 back in play. For the bears, a rejection from the moving average cluster followed by a loss of 0.2157 would confirm the lower-high structure and likely open a move below the session low. Weak volume on bounces would add to that case. Key price levels: - Resistance: 0.2203, 0.2218 to 0.2231 (moving average cluster), 0.2250, 0.2297, 0.2344 - Support: 0.2157 (session low), Avg.Buy zone near 0.219 as the pivot - Volume reference: 5-period average 100.16K, 10-period average 109.10K Overall, ARX is compressed between a defended low and a rejected high, and the daily gain matters less than how price behaves at either edge. Watch whether volume returns on a move through the moving averages or on a retest of 0.2157. Whichever side breaks with real participation will likely set the direction of the next expansion. None of this is a guarantee, so keep risk defined around those levels. One note: this screenshot is the 15-minute chart, and it only shows MA7/14/28, volume with MA5/MA10, and the Avg.Buy line. EMA200, RSI, MACD and Fibonacci levels aren't visible, so I left them out instead of inventing values. If you send the 1-hour chart with those indicators on, I can add them in. #IMPACTbyTrade
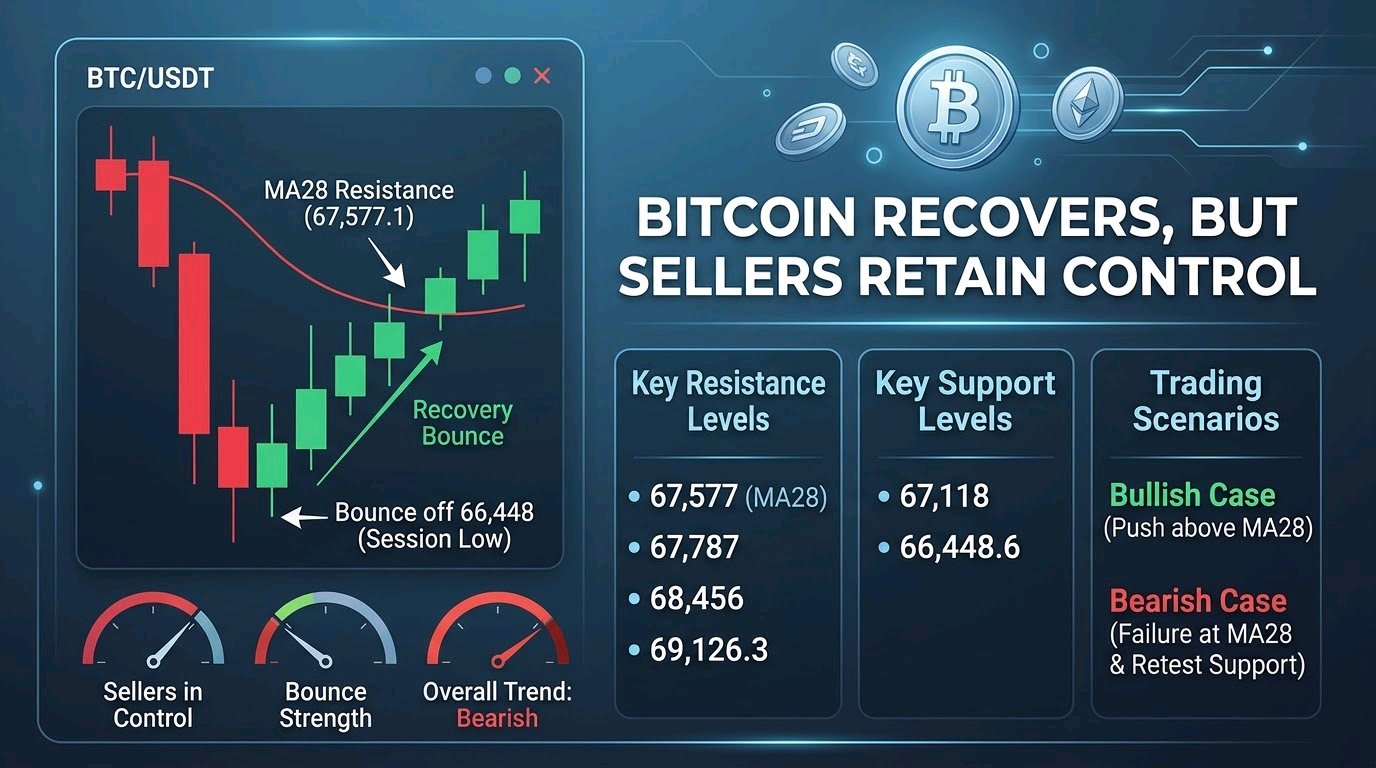
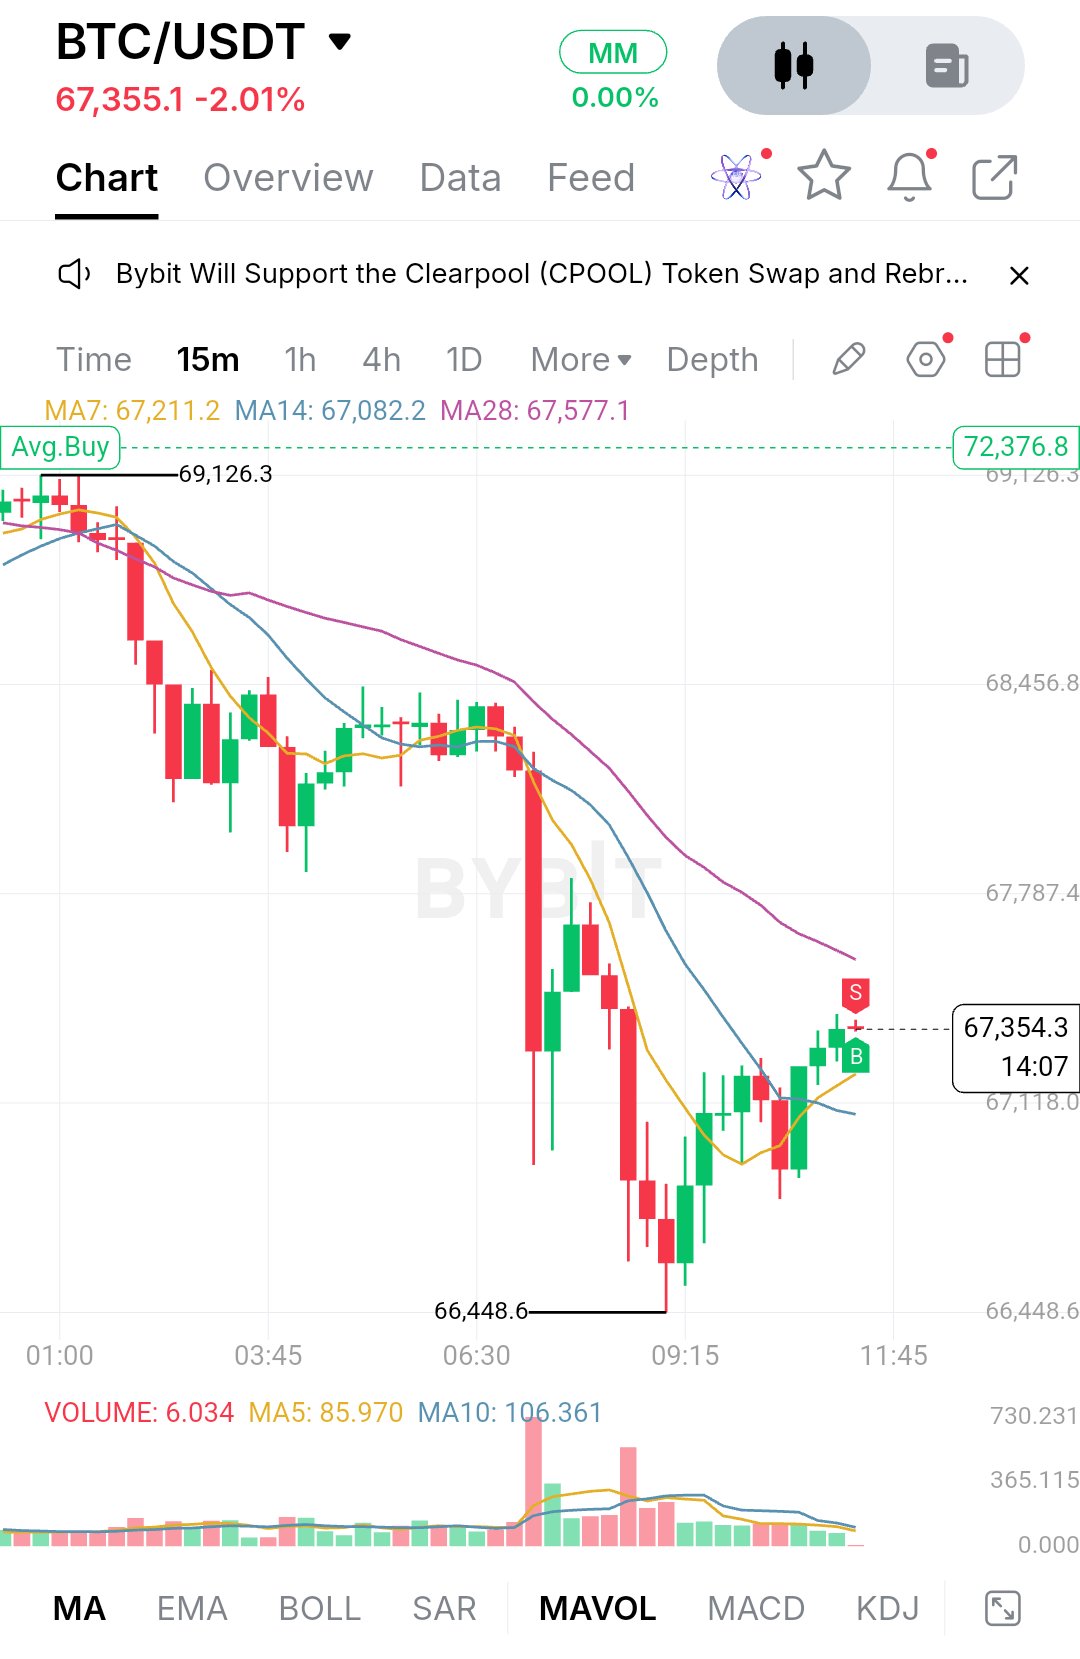
$BTCUSDT Analysis: Bitcoin Bounces Off 66,448, But Sellers Still Control the Bigger Picture** Bitcoin is trading around 67,355 and is down about 2.01% on the day. The session started with price pressing against the 69,126 area, but buyers could not hold it, and sellers took over from there. The decline came in two waves. The first was a steady grind lower through the early hours. The second was a sharp, high-volume flush that took price down to the session low at 66,448.6. That second leg was the real damage, and the volume spike on it shows how aggressively sellers were stepping in. After that low, the character of the chart changed. Price stopped making fresh lows and printed a series of higher lows with green candles, climbing back above 67,300. This looks like a recovery bounce inside a broader downtrend, not yet a confirmed reversal. Selling pressure has eased, as volume has faded noticeably since the capitulation candles, but buyers have not shown a strong follow-through push either. The chart I have is the 15-minute timeframe, not the 1-hour, so I am working with the moving averages on screen: the MA7 at 67,211.2, the MA14 at 67,082.2 and the MA28 at 67,577.1. Price has reclaimed the MA7 and MA14, and both have started to flatten out, which is the first sign that downside momentum is cooling. The MA28 is the one still sloping down above price, and it has capped every attempt to recover since the morning breakdown. Until price closes above it, the short-term trend stays bearish. I am leaving out EMA200, RSI, MACD and Fibonacci because none of them appear on this chart, and I would rather not guess at readings I cannot see. On the downside, the first support sits around 67,118, which lines up closely with the MA14 and the recent pullback zone. If buyers defend this area, the higher-low structure stays intact and the bounce has room to develop. A loss of it would put the 66,448.6 low back in play. That low matters most because it is where the heavy selling got absorbed. A clean break below it, especially on rising volume, would suggest the earlier flush was only the start of a larger move down, and it would open the door to fresh lows. On the upside, the immediate hurdle is the MA28 near 67,577, followed by the 67,787 area, where price was rejected during the decline. Above that, 68,456 is the next meaningful resistance and the zone where the market broke down before the main sell-off. The major level overhead is 69,126.3, the session high. The 68,000 round number also deserves attention as a psychological level where sellers tend to show up. For the bullish case, buyers need to hold the 67,100 to 67,200 zone, push through the MA28, and then flip 67,787 into support. If that happens with volume picking up on the green candles, a move toward 68,456 becomes realistic, and a break above that would put the session high in view. For the bearish case, a rejection at the MA28 or 67,787 followed by a close back below 67,118 would show the bounce was only a relief rally. In that scenario, sellers would likely retest 66,448.6, and a break below it would shift the structure decisively lower. Key price levels: - Resistance: 67,577 (MA28), 67,787, 68,456, 69,126.3 - Support: 67,118, 66,448.6 (session low) - Moving averages: MA7 at 67,211.2, MA14 at 67,082.2, MA28 at 67,577.1 Overall, Bitcoin is in a recovery phase after a sharp, volume-driven sell-off, and the next move depends on how price behaves around the MA28 and 67,787. A clean breakout with expanding volume would signal that buyers are regaining control. Another failure there would suggest the market is still building a base or preparing for another leg lower. Watch how price reacts at those levels rather than chasing the bounce. This is not financial advice, so manage your risk accordingly. A note on the chart itself: it shows the 15-minute timeframe, so I could not do a 1-hour analysis, and EMA200, RSI, MACD and Fibonacci are not visible. If you send a 1-hour screenshot with those indicators on, I can rework the post around them. I also left out the green "Avg.Buy 72,376.8" line, since it looks like a personal position marker rather than a market level. #IMPACTbyTrade$ETHUSDT
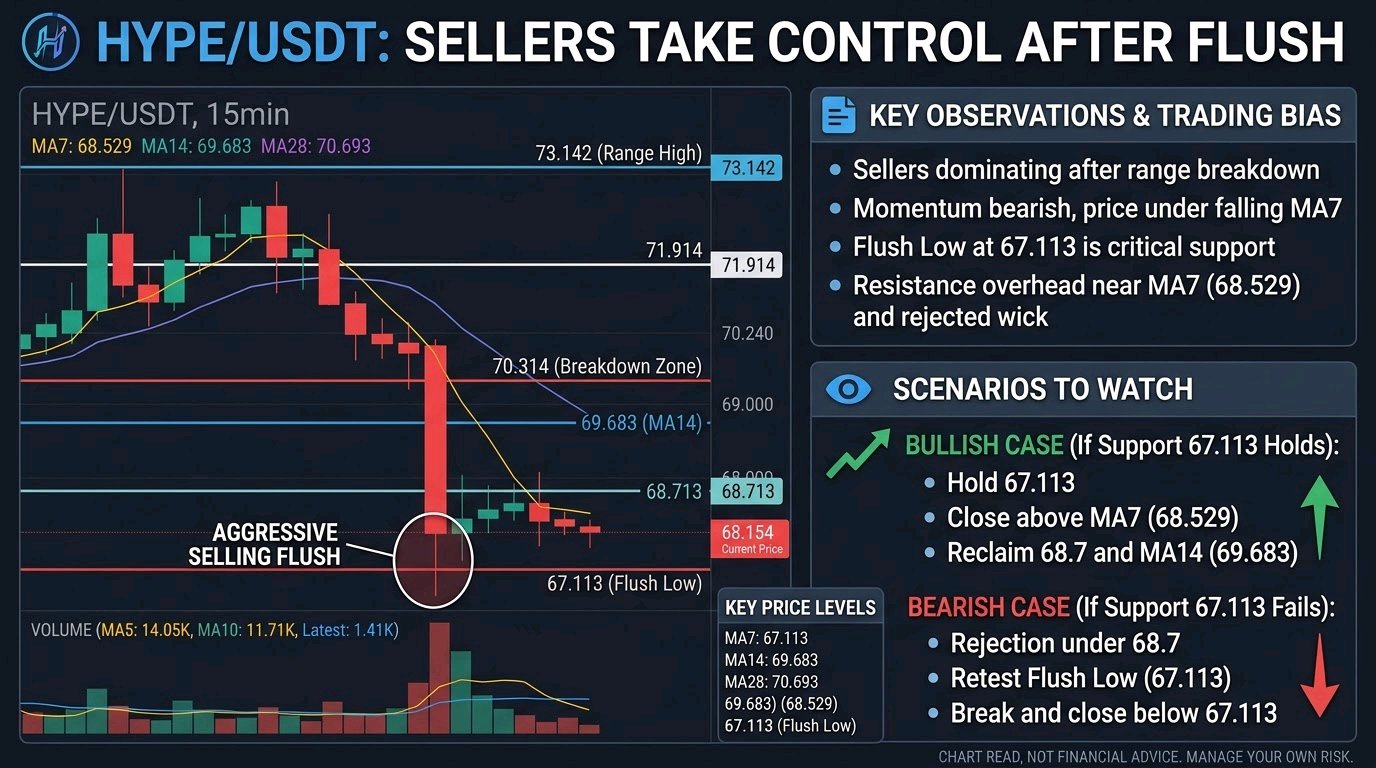
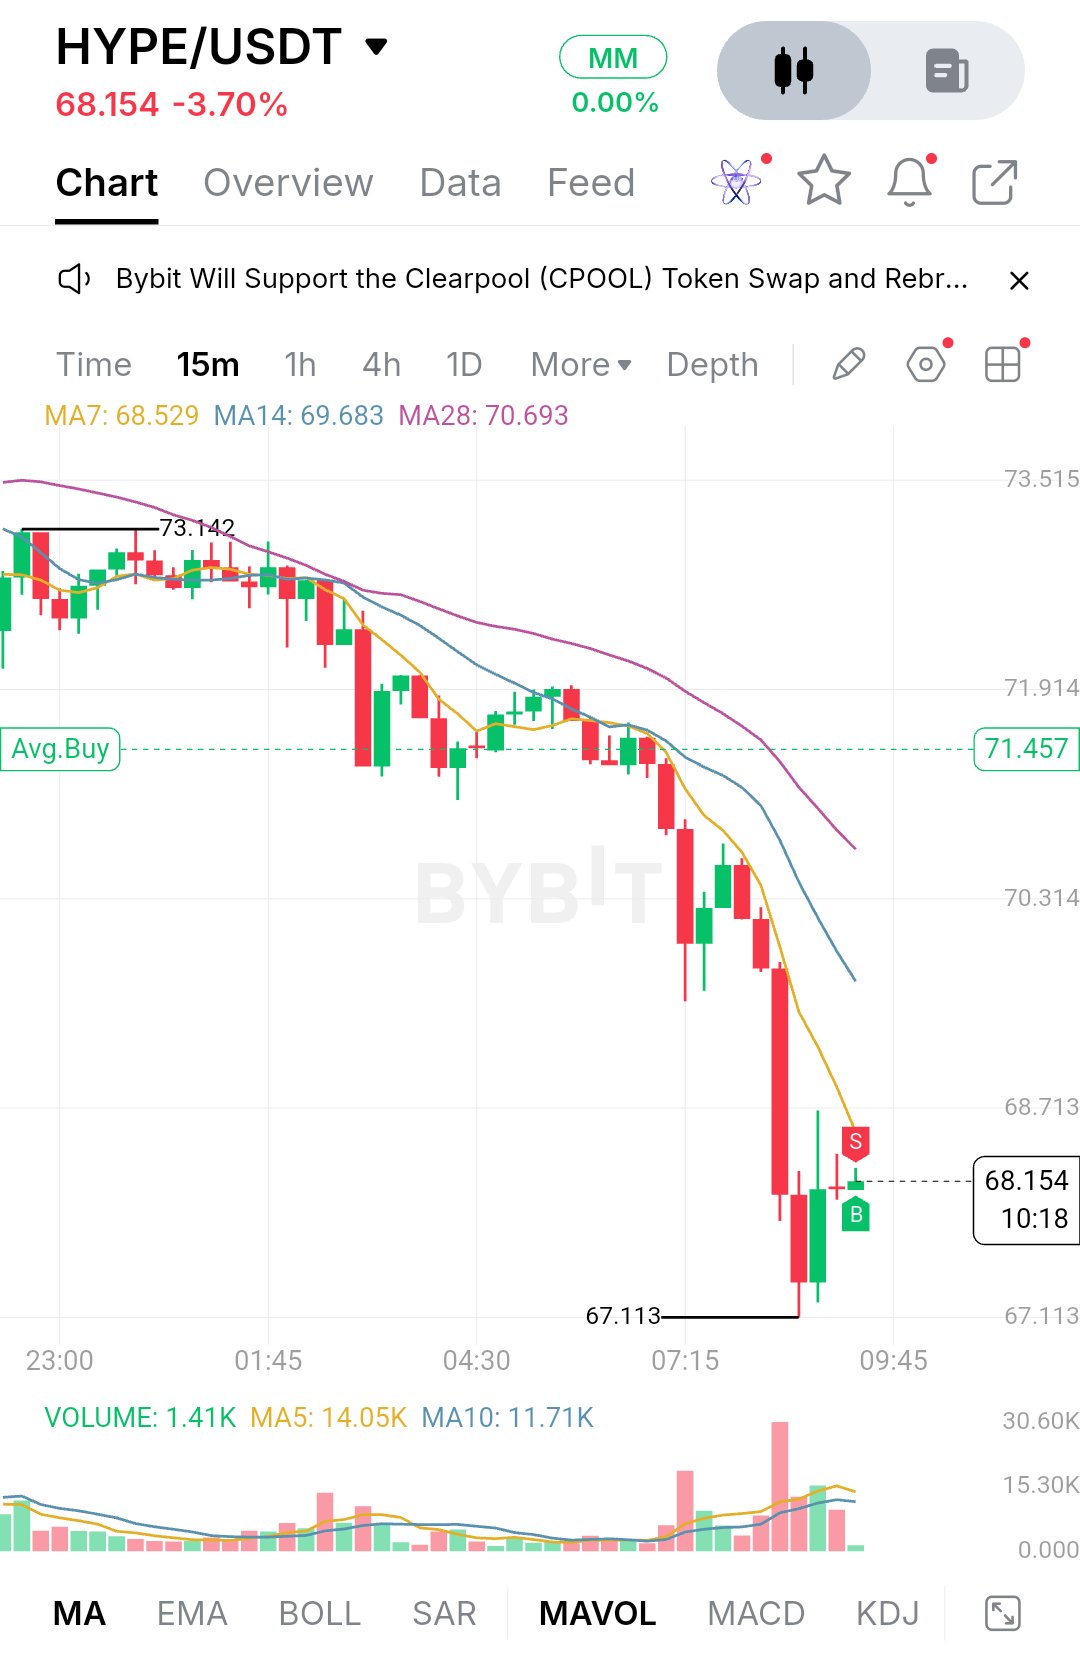
$HYPEUSDT is trading at 68.154, down 3.70% on the day, and the chart tells a clear story of sellers taking control.** For most of the earlier session, price sat in a tight band just under the 73.142 high. Candles were small, wicks went both ways, and neither side committed. That balance broke when price slipped below the 71.9 area. Sellers pressed, price lost the 70.3 zone, and the move accelerated into a sharp flush that ended at 67.113. The most aggressive selling came on the largest red candle of the drop, which also carried the biggest volume spike on the chart. After that flush, price is trying to stabilize. We're seeing a small bounce off the lows, a long-wicked candle that pushed up toward the 68.7 area and got sold back, and a tiny candle at the current price. That looks like hesitation, not a recovery. Buyers stepped in at 67.113, but they haven't shown the strength to reclaim anything meaningful yet. Volume on the latest candle is only 1.41K, well below the volume MA5 at 14.05K and MA10 at 11.71K, so the market is quiet right now after a very loud move. On the 15-minute chart, the moving averages are stacked bearishly. MA7 sits at 68.529, MA14 at 69.683 and MA28 at 70.693, with the shortest one on the bottom and all three sloping down. Price is currently trading just below MA7, which tells me short-term momentum still belongs to sellers. The gap between MA7 and MA28 is wide, which usually means price is stretched. That can lead to a relief bounce, but a bounce into a falling average is not the same as a trend change. The first support is 67.113, the low of the flush. It matters because it's the only level where buyers have clearly defended so far. If it holds on a retest with smaller candles and drying selling volume, it could become the base of a short-term range. If it breaks, there's no visible structure beneath it on this chart, and price could move quickly because there's little to slow it down. A bounce around 67.7 to 68.0 is where I'd expect the first small reactions to be tested. Resistance starts right overhead around 68.5 to 68.7, where MA7 and the rejected wick meet. Above that, 68.713 is the next grid level and MA14 sits near 69.7, so that zone is where a recovery will have to prove itself. Then comes 70.314, the breakdown area, followed by MA28 near 70.7 and 71.914. The 73.142 high is a long way up and would only matter if the whole structure changed. The bullish case starts with buyers holding 67.113 and then closing candles above MA7 and the 68.7 area. A move through MA14 around 69.7 would show real improvement, and the 70.3 to 70.7 zone would then become the main test. That's where the old range broke down, so sellers are likely to defend it. Any move higher has more credibility if volume starts rising on the green candles instead of fading. The bearish case is simpler. If price keeps getting rejected under 68.7 and MA7 turns into a ceiling, sellers stay in control and another test of 67.113 becomes likely. A clean break and close below it, especially on rising volume, would open the door to a continuation lower with no support marked on this chart. **Key Price Levels** - Resistance: 73.142 (range high), 71.914, 70.693 (MA28), 70.314, 69.683 (MA14), 68.713 - Current price: 68.154, with MA7 at 68.529 - Support: 67.113 (flush low) Right now the market is in a pause after an impulsive drop, not a confirmed reversal. What matters next is whether 67.113 holds and whether price can reclaim the MA7 and 68.7 zone with real volume behind it. A tight base followed by a decisive close above that area would be the first sign of strength, while a loss of the lows would suggest the selloff isn't finished. Keep an eye on how price behaves in this compression, because the next expansion will probably come from whichever side breaks it first. This is a chart read, not financial advice, and every trader should manage their own risk. #IMPACTbyTrade$BTCUSDT
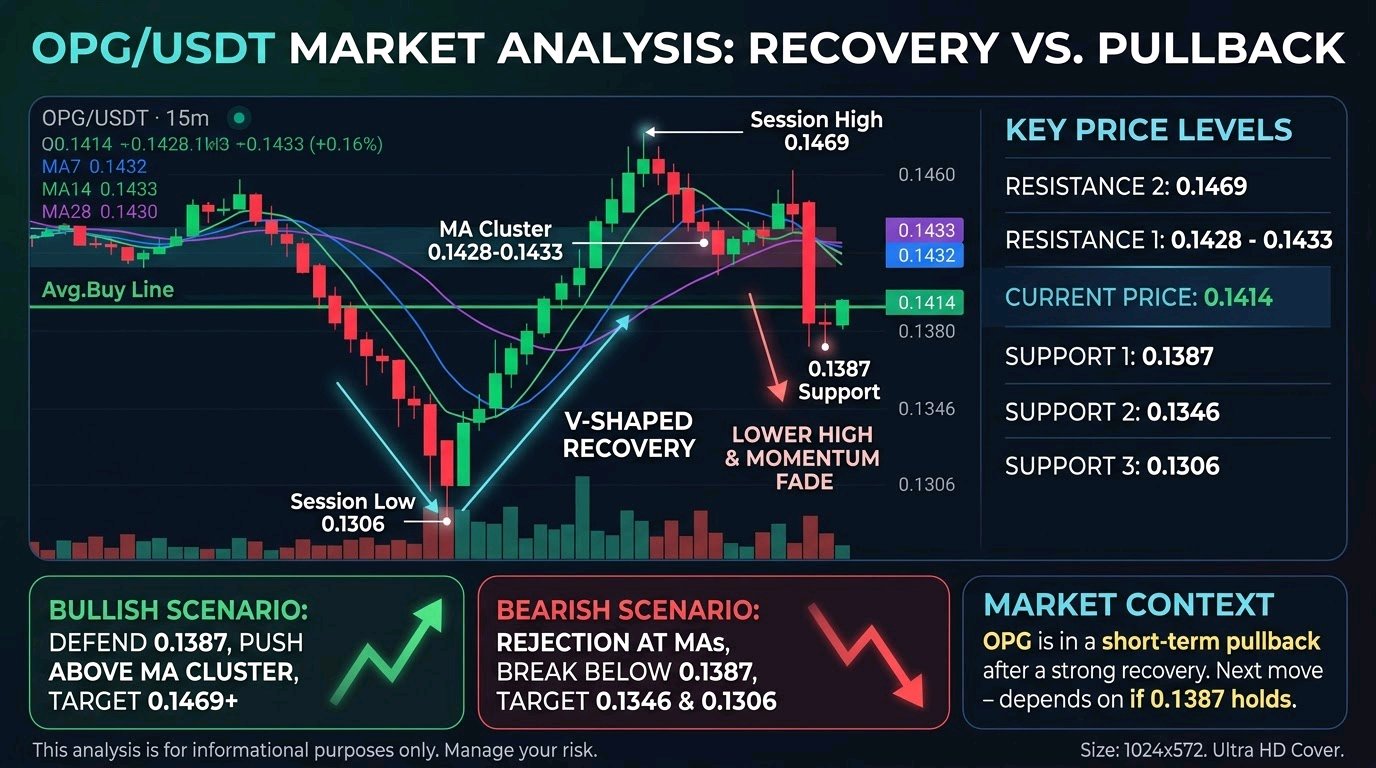
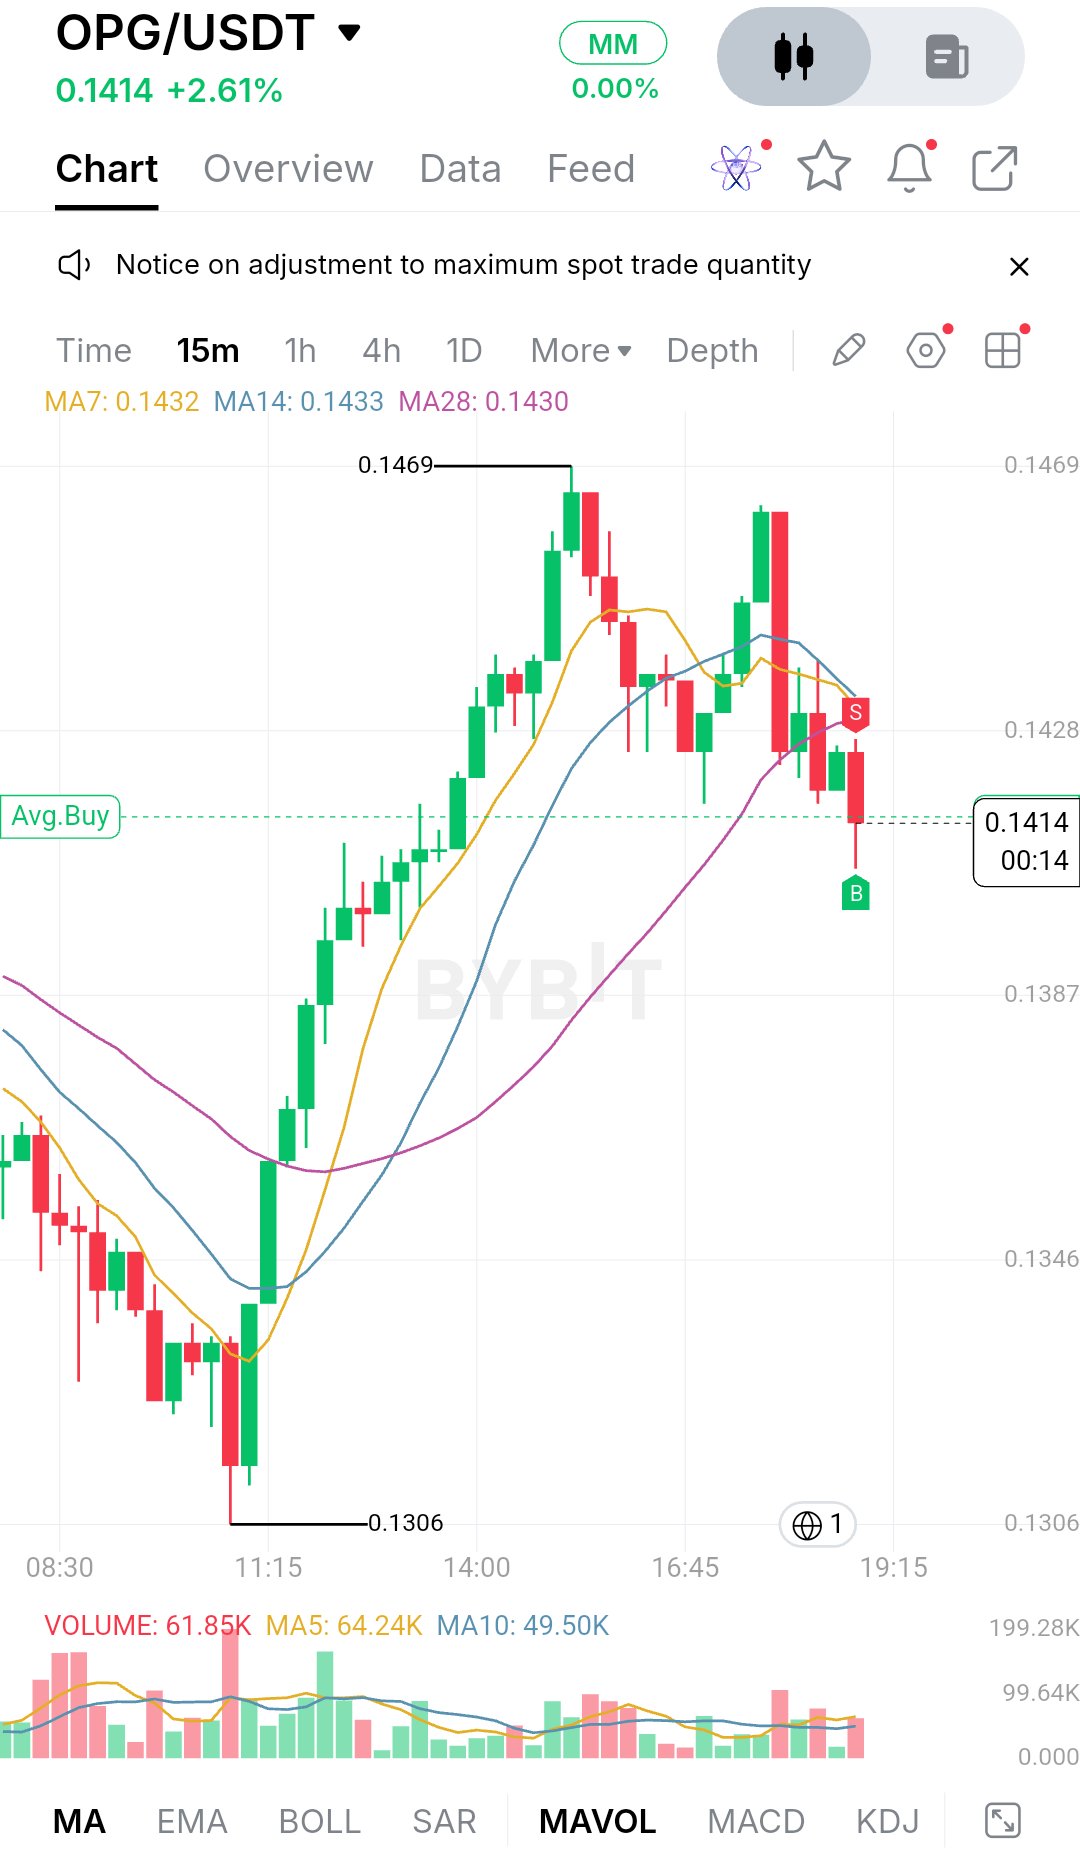
$OPGUSDT is trading at 0.1414, up 2.61% on the day. The session has had two clear phases. Sellers pushed price down to 0.1306 around the 11:15 mark, and buyers stepped in hard there. What followed was a steady run of green candles that carried price up to 0.1469. A second push near 16:45 made a similar high, but it was met by a large red candle that erased most of the move quickly. That second rejection matters for structure. The first leg was a clean V-shaped recovery. The second attempt printed a lower high and sold off with a wide-bodied candle, so momentum has faded. Price is now pressing below the 0.1428 area and sitting right on the Avg.Buy line, which is close to the current price. The market looks like it is deciding whether the rally was a trend change or just a bounce. On the 15-minute chart, MA7 (0.1432), MA14 (0.1433) and MA28 (0.1430) have flattened and bunched together. Price is now below all three. When averages compress like that and price slips under them, the market has usually lost its directional edge in the short term. Volume tells a similar story. The latest bar is 61.85K, close to the MA5 at 64.24K and above the MA10 at 49.50K, so selling isn't panicky, but it isn't dry either. The strongest volume was during the rebound from 0.1306 and the rejection from the highs, which are the two spots that defined the session. For support, the first area is 0.1387, where the lower wick of the latest candle reached. That level also matters because the market had to pass through it on the way up. Below it, 0.1346 is the next major pocket, and the 0.1306 session low is the line the whole recovery was built on. A hold at 0.1387 would suggest buyers are still active. A clean loss would open the way back toward 0.1346, and a break of 0.1306 would erase the entire structure of the day. On the upside, the first hurdle is the 0.1428 to 0.1433 zone, where all three moving averages sit and where the last candles failed. Above that, the 0.1469 session high is the real resistance. Price would need to reclaim it with strength to confirm a higher high. The bullish case is simple: buyers need to defend 0.1387, push back above the MA cluster near 0.1430, and hold it as support. If that happens with expanding volume, 0.1469 becomes the next target, and a close above it would open the door to fresh highs. The bearish case starts with a rejection at the MA zone. If price retests 0.1430 and fails again, that would confirm the lower-high structure. A break below 0.1387 would likely accelerate selling toward 0.1346, and the failure of that level would put 0.1306 back in play. Key price levels: - Resistance 2: 0.1469 (session high) - Resistance 1: 0.1428 to 0.1433 (MA cluster) - Current price: 0.1414 - Support 1: 0.1387 - Support 2: 0.1346 - Support 3: 0.1306 (session low) Overall, OPG is in a short-term pullback after a strong recovery, and the next move depends on whether 0.1387 holds. Traders should watch how price reacts around the MA cluster and whether volume expands on a breakout in either direction. A tight range like this often precedes a bigger move, and which side breaks first will tell you more than the 2.61% gain. None of this is a prediction, and risk management matters most when the market is this undecided. #IMPACTbyTrade
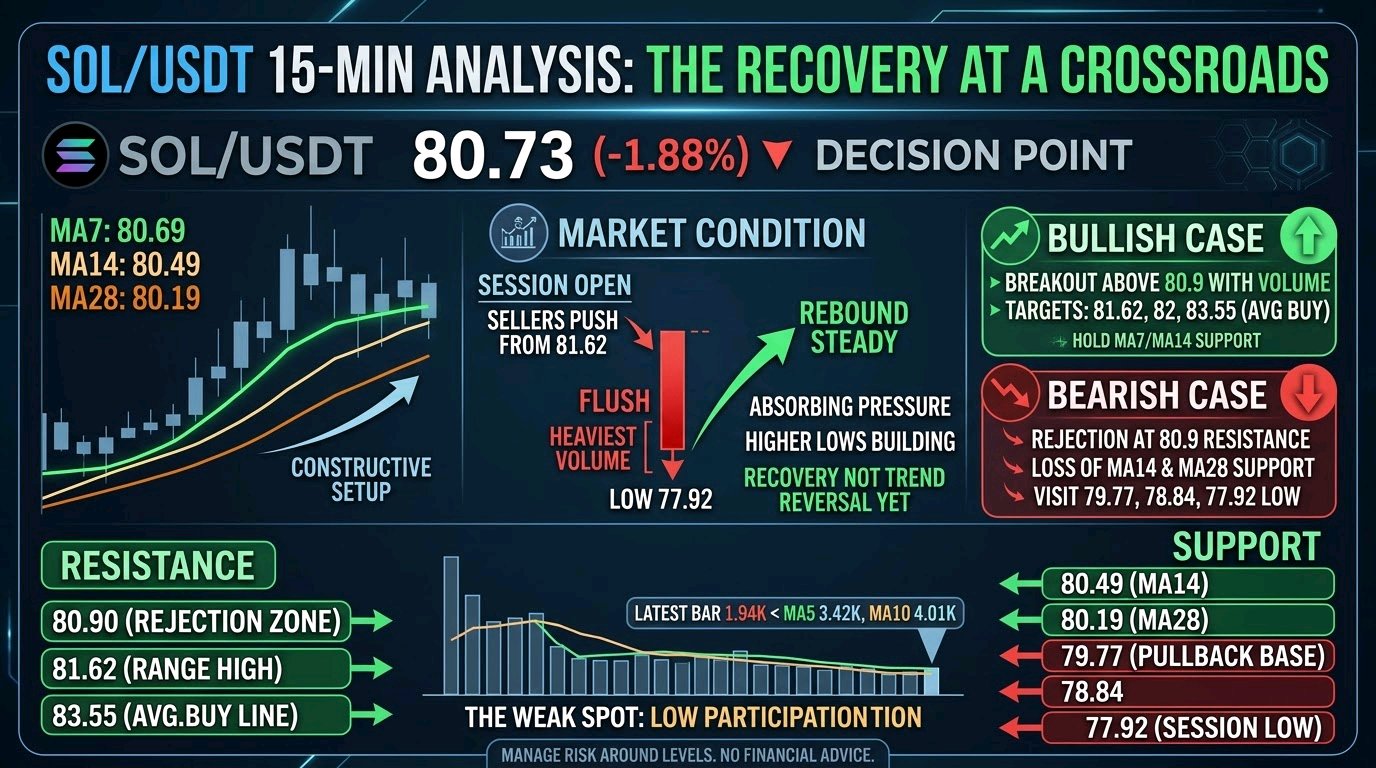
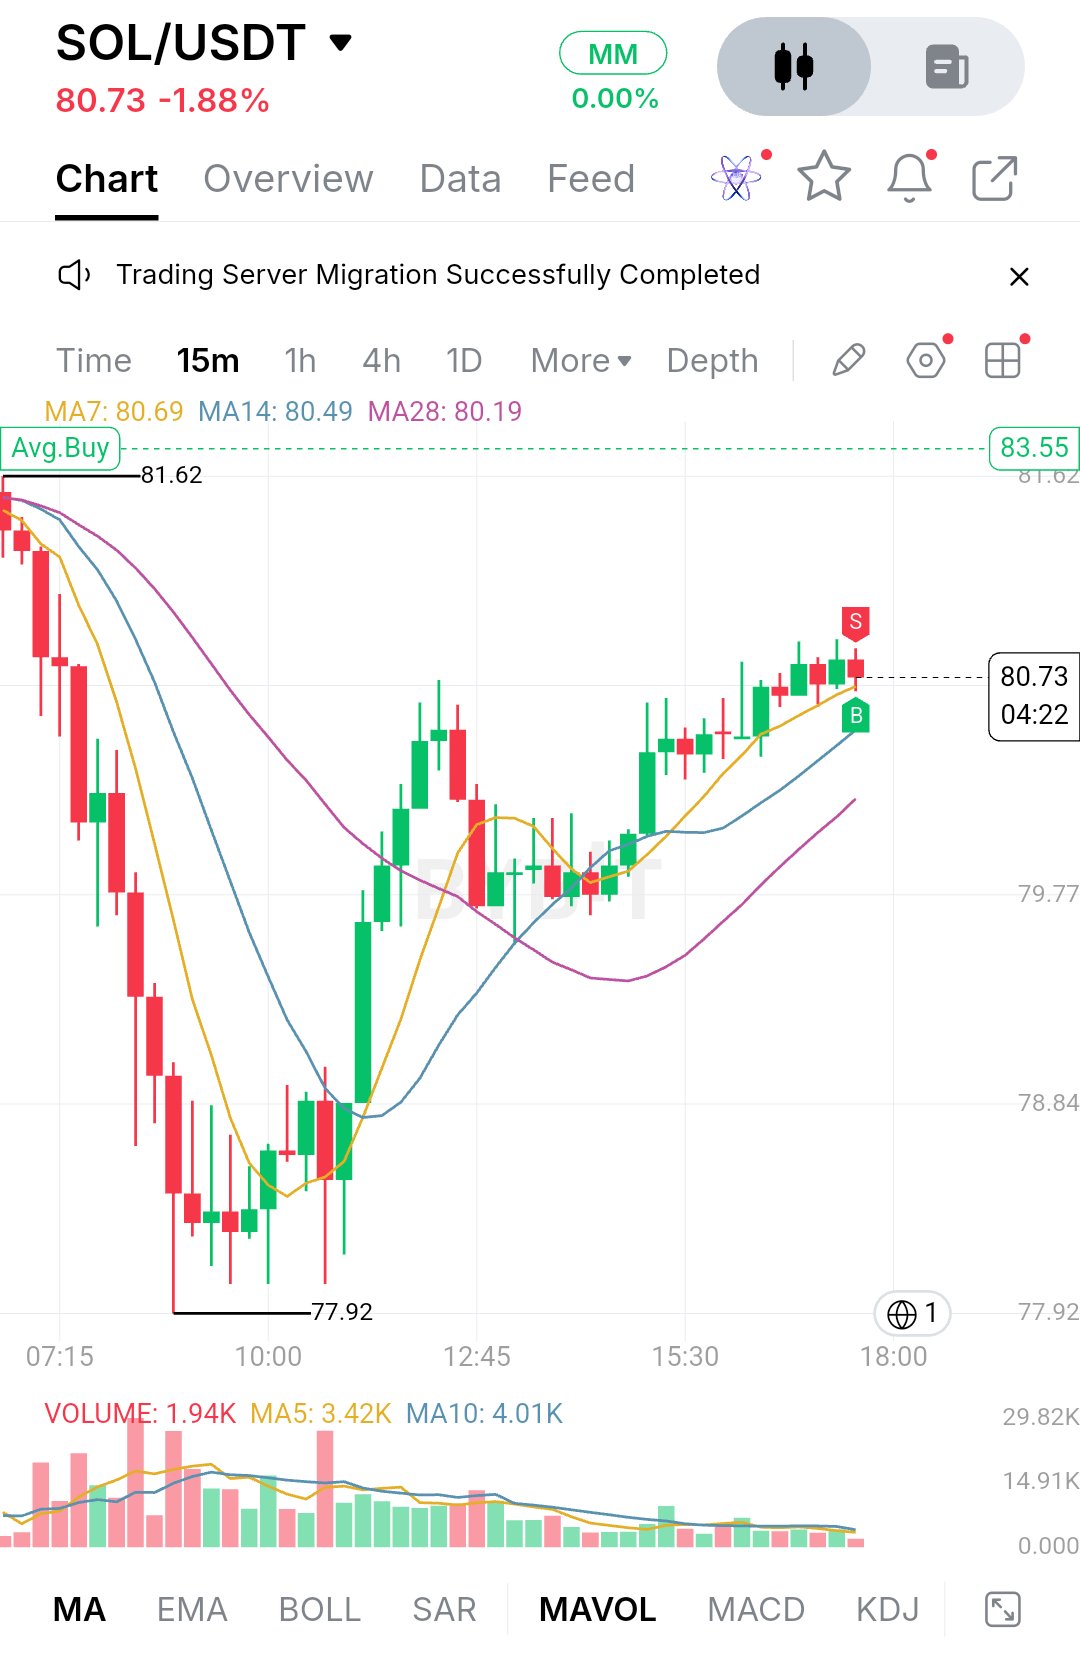
$SOLUSDT is trading at 80.73, down 1.88% on the day. The session started on the back foot, with sellers pushing price down from the 81.62 area and driving it to a low of 77.92. That drop was fast and came with the heaviest volume on the chart. Buyers stepped in at the low and started absorbing the pressure, and the rebound has been steady since. After the flush, price stopped making new lows and began building higher lows, so this looks more like a recovery than a random bounce. It isn't a clean trend reversal yet, though. The push from the lows stalled around 80.7 near the 12:45 mark, pulled back toward 79.7, and has now climbed back to the same zone. Recoveries that keep retesting the same ceiling are either loading up for a breakout or running out of fuel, and volume will decide which. This is a 15-minute chart, so I'm reading it at that resolution. The moving averages show MA7 at 80.69, MA14 at 80.49 and MA28 at 80.19. Price sits right on the MA7 and above the other two, all of which are turning upward, with MA28 curling up after a long decline. That is a constructive short-term setup. The weak spot is volume. The latest bar is 1.94K, well under the MA5 at 3.42K and the MA10 at 4.01K, so the recovery is being carried by thin participation. A move above resistance without a volume pickup would deserve some skepticism. The chart doesn't show EMA200, RSI, MACD or Fibonacci levels, so I'm leaving those out rather than guessing. Support first sits at 80.49 and 80.19, where the MA14 and MA28 are tracking. Holding those would keep the higher-low structure intact. Below that, the 79.77 area is where price based during the pullback, followed by 78.84 and the session low at 77.92. A clean break under 79.77 would put the whole recovery in question, and 77.92 would be the next major test. Immediate resistance is the 80.7 to 80.9 zone, where price has been rejected twice and where a small sell signal marker appears on the chart. Above that, 81.62 is the earlier high of the range and the first real breakout level. The chart also marks an Avg.Buy line at 83.55, which makes a reasonable longer-range target if momentum builds, with 82 as a round-number checkpoint along the way. For bulls, the job is simple: hold above the MA7 and MA14, break 80.9 on rising volume, and then reclaim 81.62. A close above that would flip the session's lower-high structure and open the way toward 82 and potentially 83.55. For bears, the signal would be another rejection at 80.7 to 80.9 followed by a loss of the MA14 and MA28. That would turn the move into a failed retest, and price would likely revisit 79.77. If that gives way too, 78.84 and the 77.92 low come back into play. Key price levels: - Resistance: 80.90, 81.62, 83.55 (Avg.Buy line) - Current price: 80.73 - Support: 80.49, 80.19, 79.77, 78.84 - Session low: 77.92 SOL is at a decision point rather than in a trend. The recovery has been orderly, but the lack of volume leaves it unproven. What matters next is whether price can push through 80.9 with real participation, or whether it stalls again and rolls back into the 80.2 to 79.8 zone. A breakout with volume would be the first real sign of expansion, and a failure would more likely mean more range-bound trading. None of this is guaranteed, so manage risk around those levels. #IMPACTbyTrade$HYPEUSDT
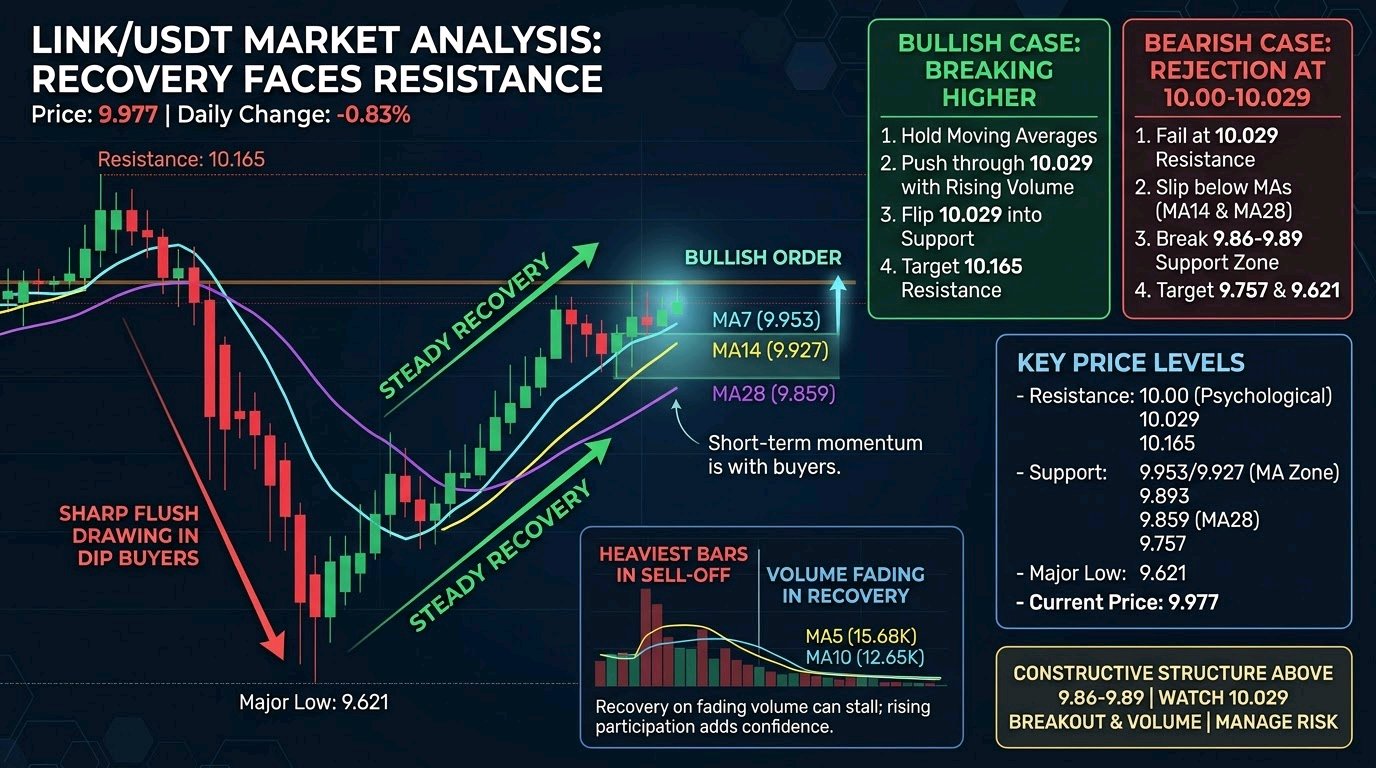
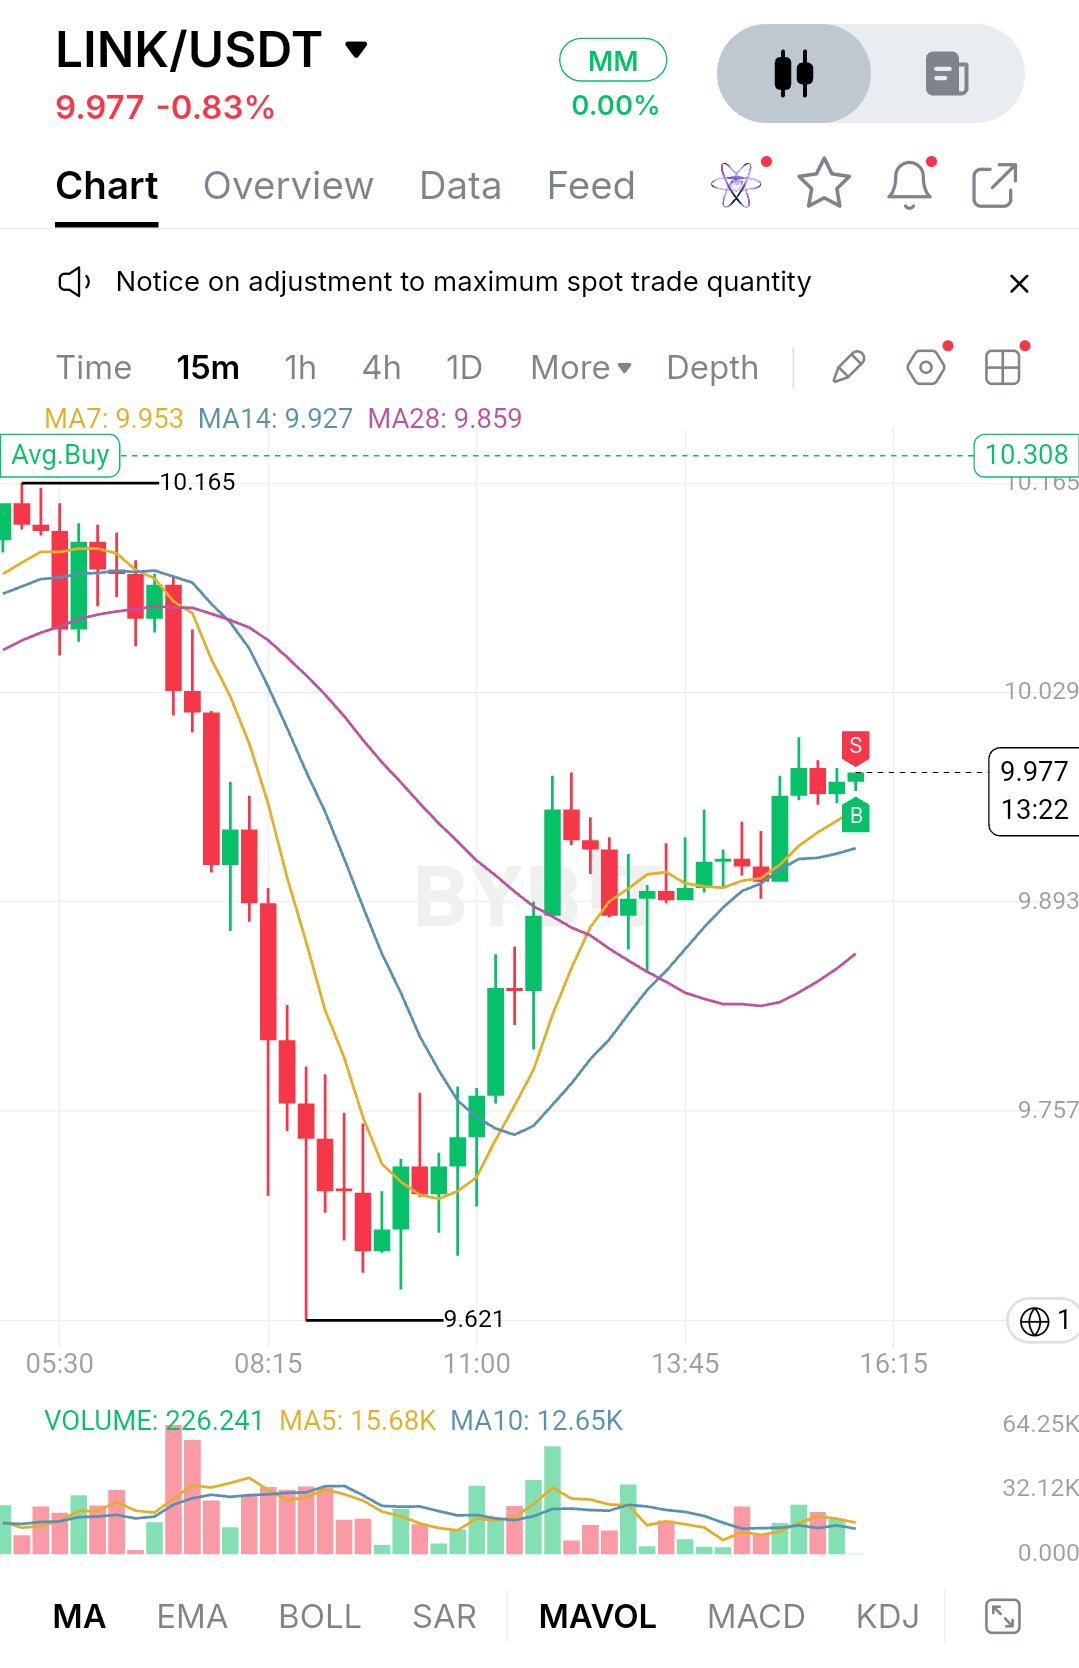
$LINKUSDT is trading around 9.977, down roughly 0.83% on the day. The move that defined the session was a sharp flush from the 10.165 area down to 9.621, where sellers pushed hard through the morning with a run of heavy red candles. That low drew in aggressive dip buyers, and the recovery since has been steady and surprisingly orderly. After the bounce, price has stopped chasing and started building. The rebound has retraced most of the drop, and the candles near the top are smaller, with a few wicks on both sides. That looks like a market digesting the recovery rather than running out of steam, but buyers haven't fully reclaimed the earlier breakdown zone either. Right now it reads as a recovery phase moving into a tight consolidation just under 10.029. On the chart, price sits above all three moving averages. MA7 is at 9.953, MA14 at 9.927 and MA28 at 9.859, stacked in a bullish order with price on top. The short averages have curled up and are tracking price closely, which shows momentum has shifted back to buyers, at least on this timeframe. The slower MA28 is still sloping gently upward after its long decline, so the broader trend hasn't fully turned. Volume tells a similar story. The heaviest bars came during the sell-off, and activity has cooled during the recovery, with the volume averages (MA5 around 15.68K, MA10 around 12.65K) drifting lower. A recovery on fading volume can stall, so a pickup in participation on the next push would add real confidence. For support, the first area is 9.953 to 9.927, where MA7 and MA14 sit just under price. Holding there keeps the short-term structure intact. Below that, 9.893 is a clear horizontal level on the chart and lines up closely with MA28 at 9.859, which makes the 9.86 to 9.89 band the most important pullback zone. If it holds on a retest, the higher-low structure stays valid. If it breaks, price likely revisits 9.757, and a loss of that level puts the 9.621 low back in play. On the upside, the nearest resistance is the psychological 10.00 mark, closely followed by the 10.029 level. Price has been pressing into this area, and the small red candle with a wick near the highs suggests sellers are active here. Above that, 10.165 is the major resistance and the high of the visible range, where the sell-off began. The bullish case is simple. Buyers need to hold the moving averages, push through 10.029 with a strong candle close and ideally rising volume, and then flip that level into support. A clean break would open the way to 10.165. A breakout above that would put price back above the entire range and weaken the case that the morning drop was anything more than a liquidity sweep. The bearish case starts with rejection at 10.00 to 10.029. If price fails there and slips below MA14 and then MA28, the recovery starts to look like a lower-high bounce inside a bigger downtrend. A break under 9.86 to 9.89 would confirm that shift, with 9.757 as the first target and 9.621 as the major downside level. **Key Price Levels** - Resistance: 10.00 (psychological), 10.029, 10.165 - Support: 9.953 / 9.927 (MA7 and MA14 zone), 9.893, 9.859 (MA28), 9.757 - Major low: 9.621 - Current price: 9.977 Overall, LINK has recovered well from the morning low, but it hasn't confirmed anything yet. The structure is constructive while price stays above the 9.86 to 9.89 zone, and the real test is whether it can clear 10.029 with conviction. Watch the volume on any breakout attempt and how price reacts to a pullback toward the moving averages. A strong close above 10.029 or a clean break below 9.86 will likely decide the next expansion. This is analysis, not a guarantee, so manage risk accordingly. $ETHUSDT#IMPACTbyTrade
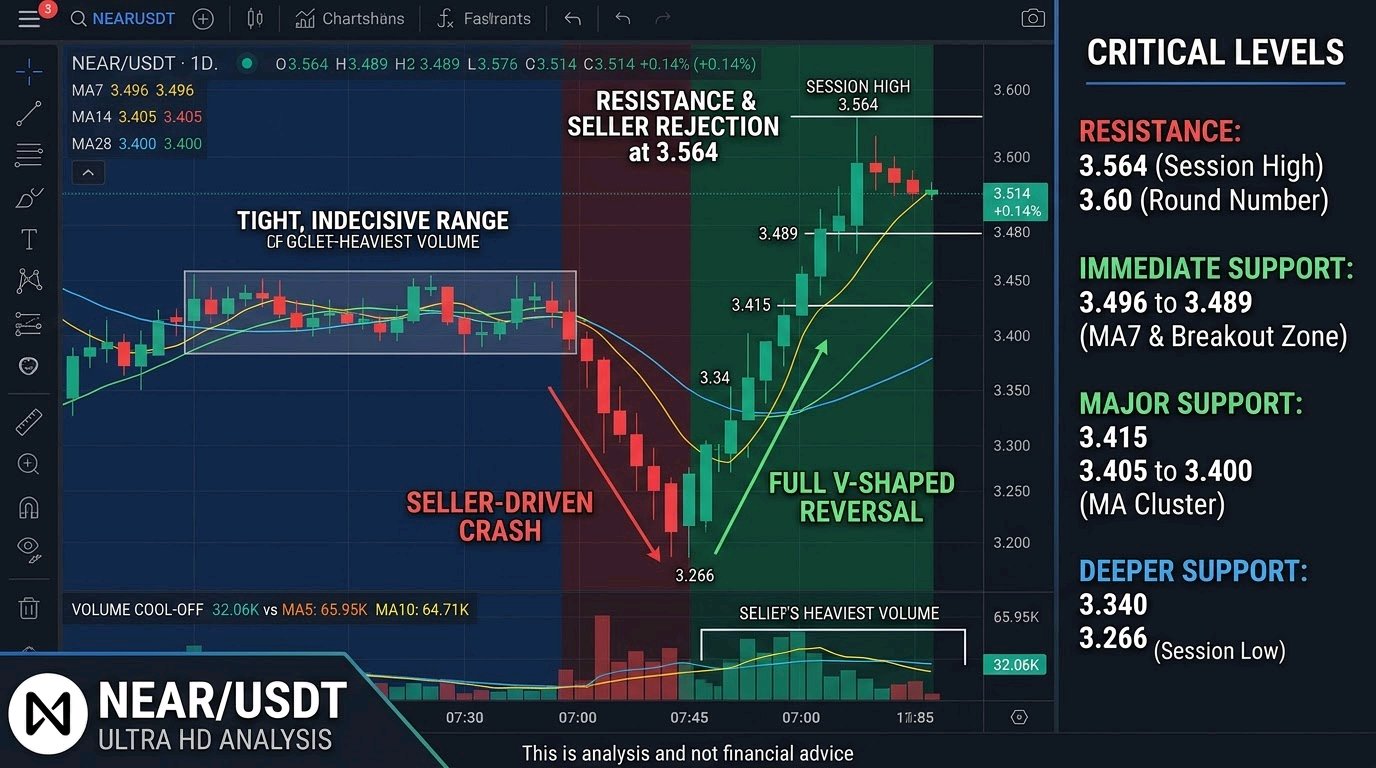
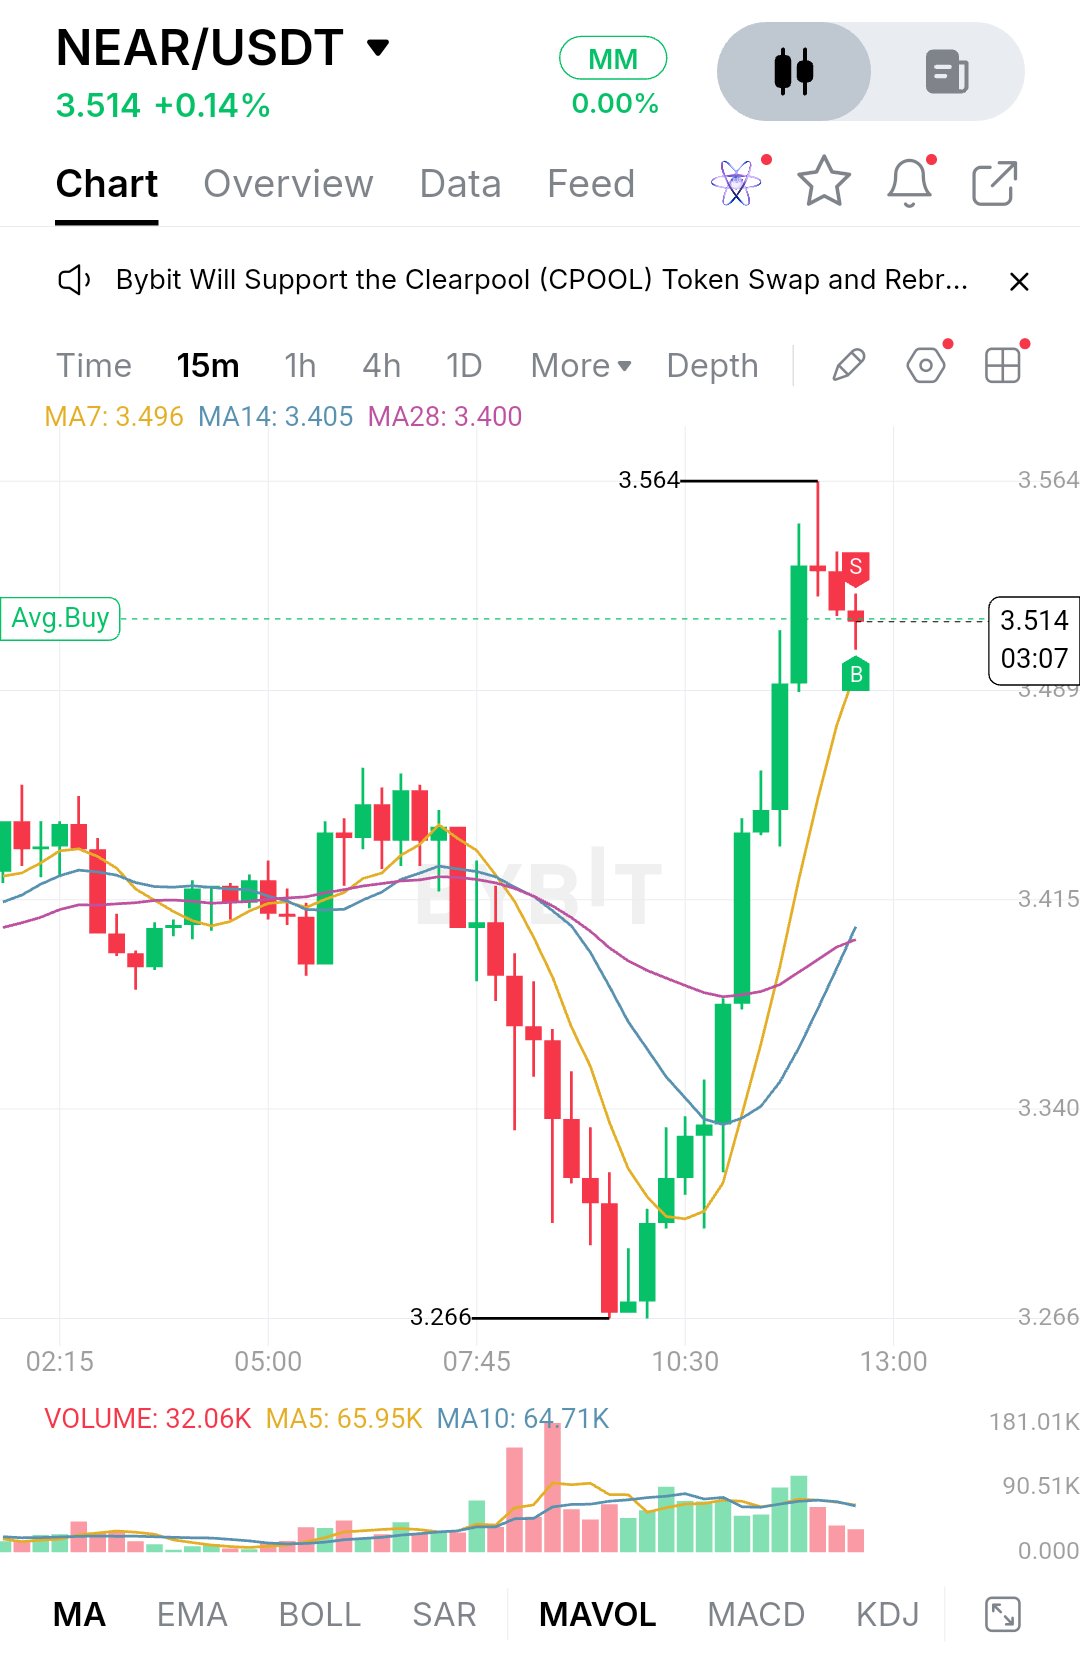
$NEARUSDT is trading at 3.514, up about 0.14% on the day. That flat number hides a pretty violent session. Price spent the morning drifting, then got hit hard by sellers, only to be bought back up with equal force. The first part of the session was a tight, indecisive range. From the early hours until roughly 07:45, candles kept overlapping around the 3.40 to 3.45 zone while the three moving averages tangled together, which is classic low-conviction behavior. Then sellers took control. A run of strong red candles pushed price down through the whole range, with the heaviest volume of the session printing on the way down. The low came in at 3.266, where the selling finally ran out of steam. What followed was the more interesting part. Buyers stepped in around that low and the recovery was fast: a string of strong green candles with rising volume carried price back through 3.34, 3.415 and 3.489, all the way to a session high of 3.564. That is a full V-shaped reversal. But the top of the move left a long upper wick at 3.564, which tells you sellers were waiting there, and the candles since have been small and mostly red as price settles back to 3.514. On the technical side, the structure has flipped from bearish to constructive. Price is now above MA7 (3.496), MA14 (3.405) and MA28 (3.400), and the short-term average has turned sharply upward. MA14 and MA28 are sitting close together just under the 3.415 area, so they now form a support cluster beneath the market. The weak spot is volume. The current bar shows 32.06K, well below the MA5 (65.95K) and MA10 (64.71K), so the push higher is cooling off. That's normal after a spike, but it means the next move needs fresh participation to be trusted. For support, the first area to watch is 3.496 to 3.489, where MA7 and the previous breakout zone overlap. If buyers defend it, the uptrend stays intact and this pullback looks like a pause. If it breaks, price likely slides toward 3.415, and below that the 3.405 to 3.400 cluster of MA14 and MA28 becomes the more important line. Losing that cluster would put the entire recovery in question and bring 3.340 and eventually the 3.266 low back into play. On the upside, resistance is clear at 3.564, the session high and the spot where sellers already showed up once. A clean break and hold above it would be the first real sign that the recovery is turning into a trend, and the round 3.60 figure is the natural next area to watch, since traders tend to react at psychological levels. The bullish case is straightforward. Buyers need to hold 3.489 to 3.496, rebuild volume, and then push through 3.564 with a decisive candle close rather than another wick. If that happens, continuation toward 3.60 becomes realistic. The bearish case starts with another rejection at 3.564, which would make it a potential double-top on this timeframe. Combined with weak volume, a break below 3.489 would suggest the move up was mostly a short squeeze and a retest of 3.415 and the moving average cluster would be likely. Key price levels: - Resistance: 3.564 (session high), then 3.60 (round number) - Immediate support: 3.496 to 3.489 (MA7 and breakout zone) - Major support: 3.415, then 3.405 to 3.400 (MA14 and MA28) - Deeper support: 3.340, then 3.266 (session low) Overall, NEAR has done the hard part by reclaiming its range and turning the short-term averages up, but it hasn't yet proven it can break the high it was just rejected from. Watch how price behaves around 3.49 and whether volume returns on the next push into 3.564. That reaction will say more about the next expansion than the small percentage change on the day. As always, this is analysis and not financial advice, so manage your risk accordingly. $BTCUSDT#IMPACTbyTrade
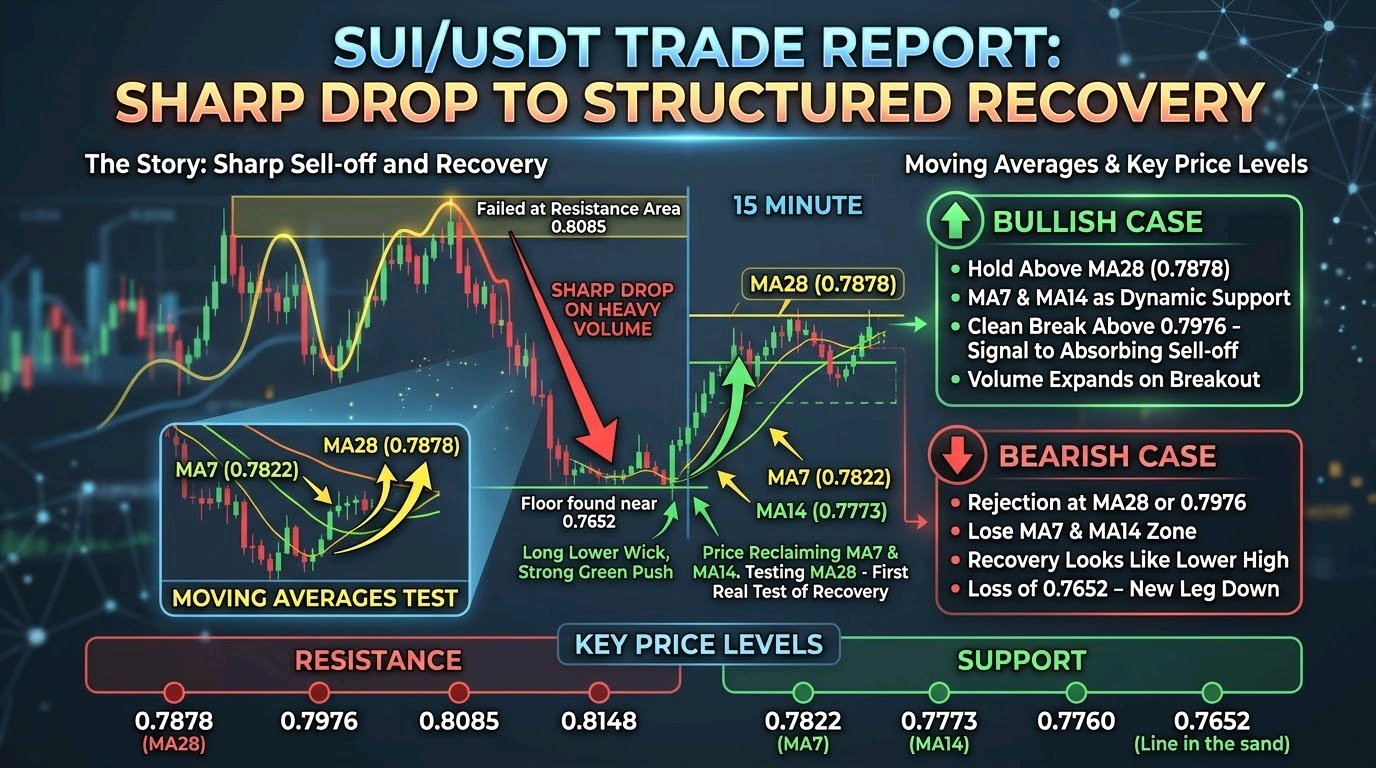
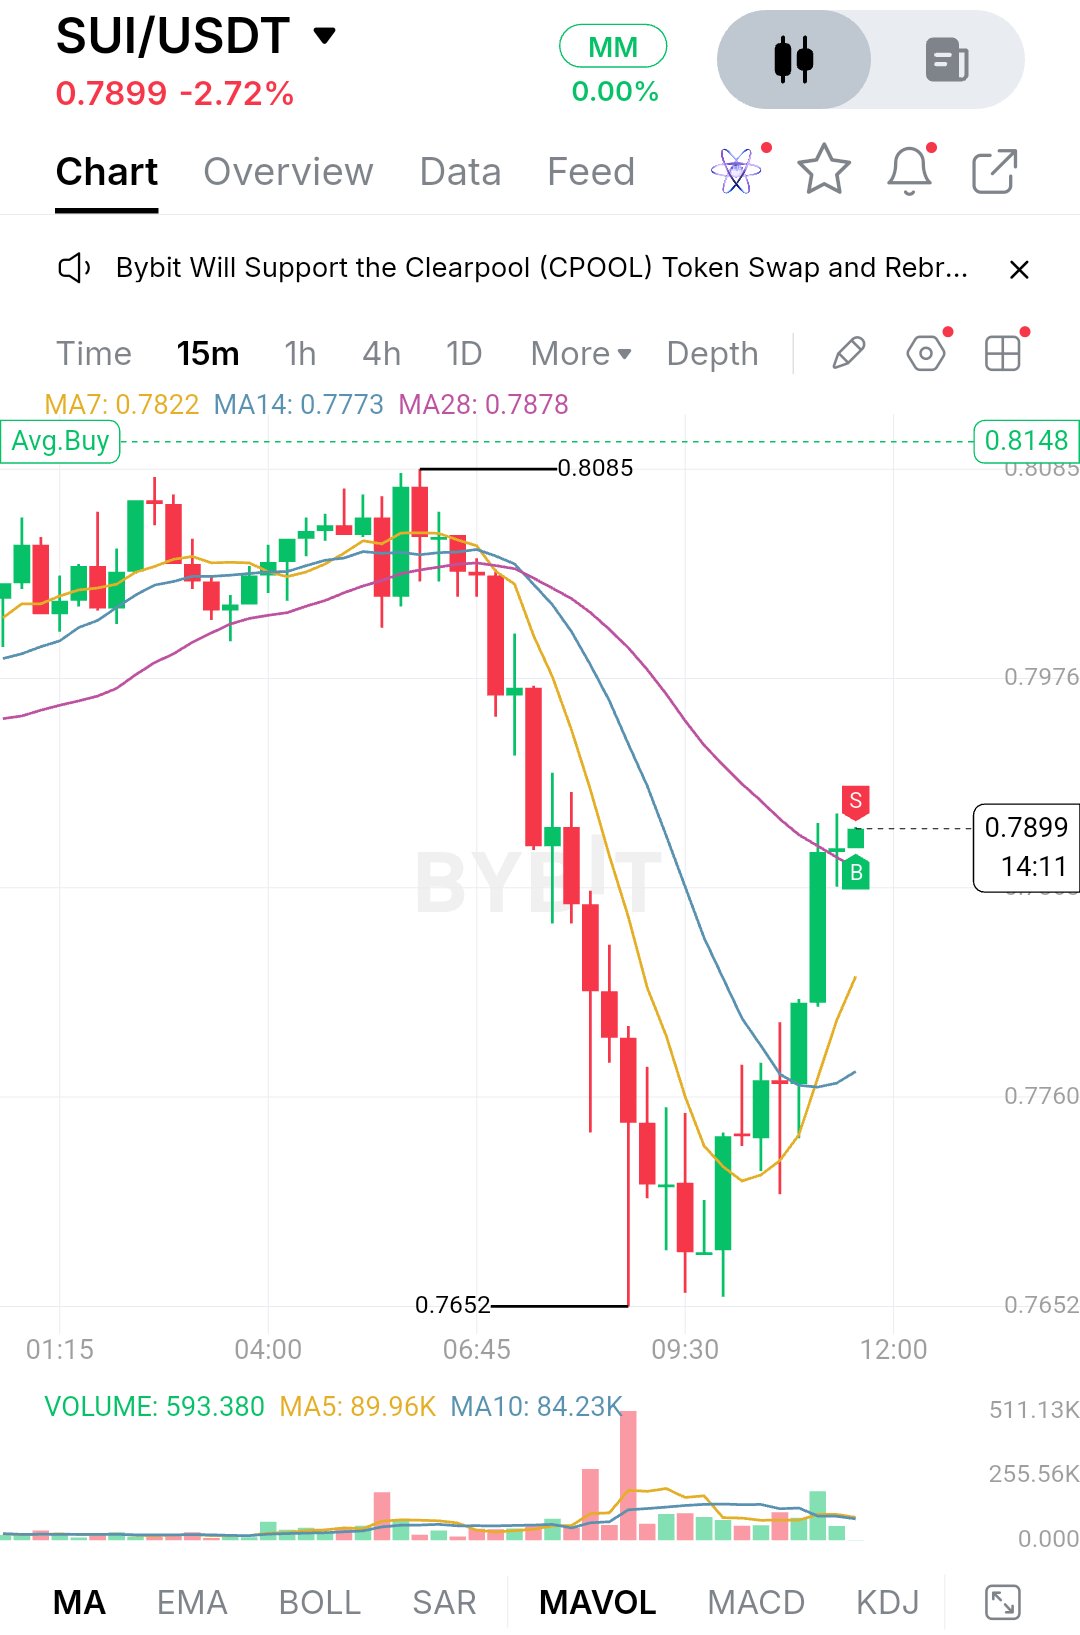
$SUIUSDT is trading around 0.7899, down 2.72% on the day, but the number hides a more interesting story. The session started with price pressing against the 0.8085 area, where buyers ran out of steam and sellers took control. What followed was a sharp, one-directional drop that pushed price all the way down to 0.7652, and the volume bars during that leg were the heaviest of the entire session. That was real selling, not a slow drift. The more important part is what came after. Price didn't bleed out or chop around at the lows. It found a floor near 0.7652, printed a long lower wick, and then built a run of higher lows into a strong green push. For a few hours the structure went from clean downtrend to an active recovery, and price has now retraced a good portion of the drop. On the 15-minute chart, the moving averages tell the same story. The MA7 sits at 0.7822, the MA14 at 0.7773 and the MA28 at 0.7878. During the sell-off, price stayed well below all three and the averages fanned downward, which is what a trending move looks like. Now price has climbed back above the MA7 and MA14 and is sitting right on top of the MA28. That is the first real test of the recovery. Reclaiming the faster averages is easy after a bounce, but holding above the slowest one is what separates a relief move from a genuine shift in short-term control. The MA7 is also curling up sharply, so momentum is clearly on the buyers' side for now. Volume deserves a mention too. The sell-off came with a big spike, while the bounce has been steadier, with the latest bars sitting above the volume averages (MA5 around 89.96K, MA10 around 84.23K). That suggests buyers are participating, though the recovery hasn't yet matched the intensity of the selling. For support, the nearest zone is the 0.7822 to 0.7773 region, where the MA7 and MA14 are sitting. If price pulls back, this is where buyers need to show up again. A hold here keeps the higher-low sequence alive. Below that, the 0.7760 level is the next marked area on the chart, and the real line in the sand is the 0.7652 low. A break below it would erase the entire recovery and confirm that the bounce was just a pause inside a larger downtrend. On the upside, the immediate hurdle is the MA28 near 0.7878, which price is testing right now. Above it, 0.7976 is the next clear level, and it also happens to be where the market stalled earlier in the session. Beyond that, the 0.8085 high is the major resistance, and the 0.8148 line marked on the chart sits just above it. That cluster from 0.7976 to 0.8148 is where I would expect the heaviest supply, since sellers already defended it once. The bullish case is fairly simple. Buyers need to hold price above the MA28 and keep the MA7 and MA14 as dynamic support on any dip. A clean break and hold above 0.7976 would be the signal that the sell-off is being fully absorbed, opening the door to a retest of 0.8085. If volume expands on that move instead of fading, it adds a lot of weight to the breakout. The bearish case starts with rejection at the MA28 or at 0.7976. If price stalls there and then loses the MA7 and MA14 zone, the recovery starts to look like a lower high beneath the broken structure. In that scenario, a return to 0.7760 becomes likely, and a loss of 0.7652 would open a new leg down with no nearby support to slow it. Key price levels: - Resistance: 0.7878 (MA28), 0.7976, 0.8085, 0.8148 - Support: 0.7822 (MA7), 0.7773 (MA14), 0.7760, 0.7652 - Bullish confirmation: hold above 0.7878, then a clean break of 0.7976 - Bearish confirmation: loss of 0.7773 followed by a break below 0.7652 Overall, SUI has gone from a heavy sell-off to a structured recovery, and the next move depends on how price reacts around the MA28 and 0.7976. The percentage on the day matters far less than the structure here. A sustained hold above those levels could set up the next expansion toward the highs, while a rejection would put the lows back in play. Watch how price behaves on the first pullback, because that will say more about the strength of this bounce than the candle that created it. $SOLUSDT#IMPACTbyTrade
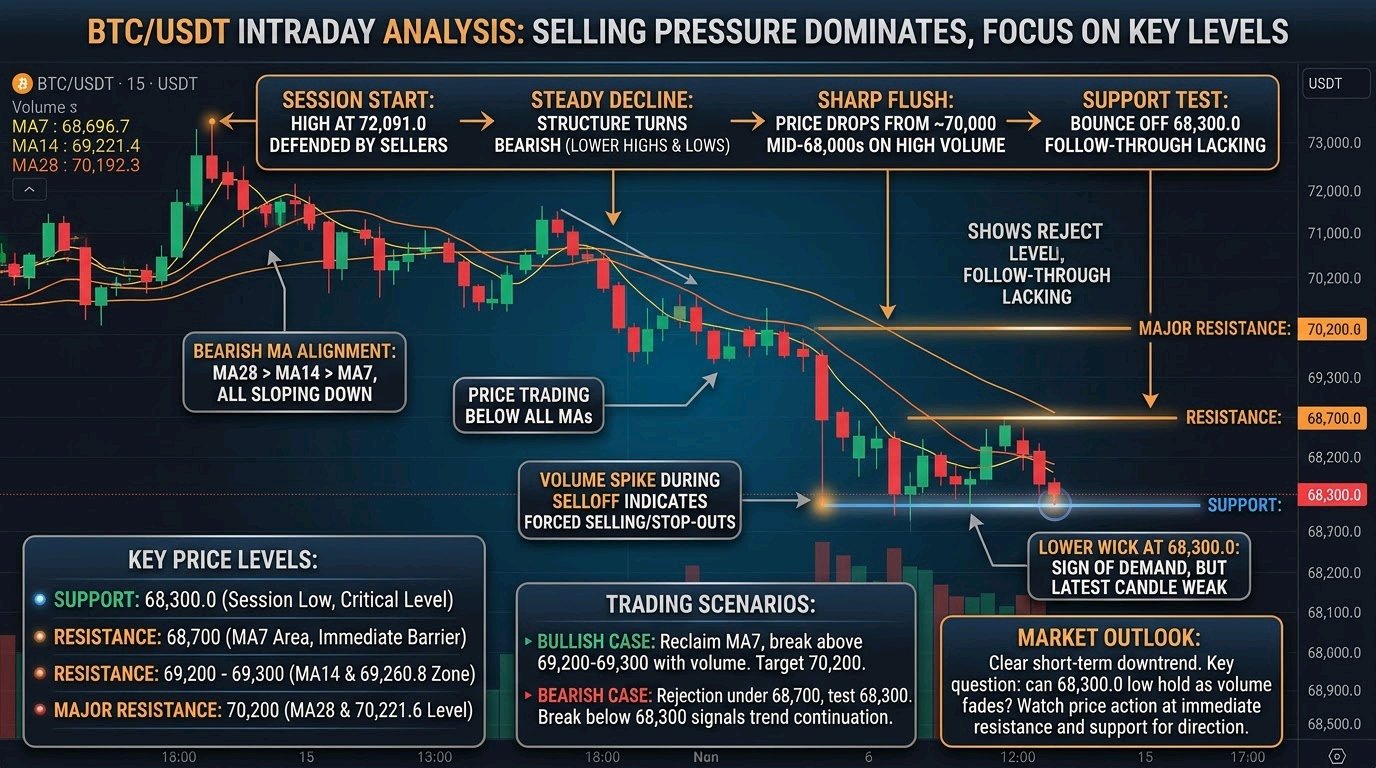
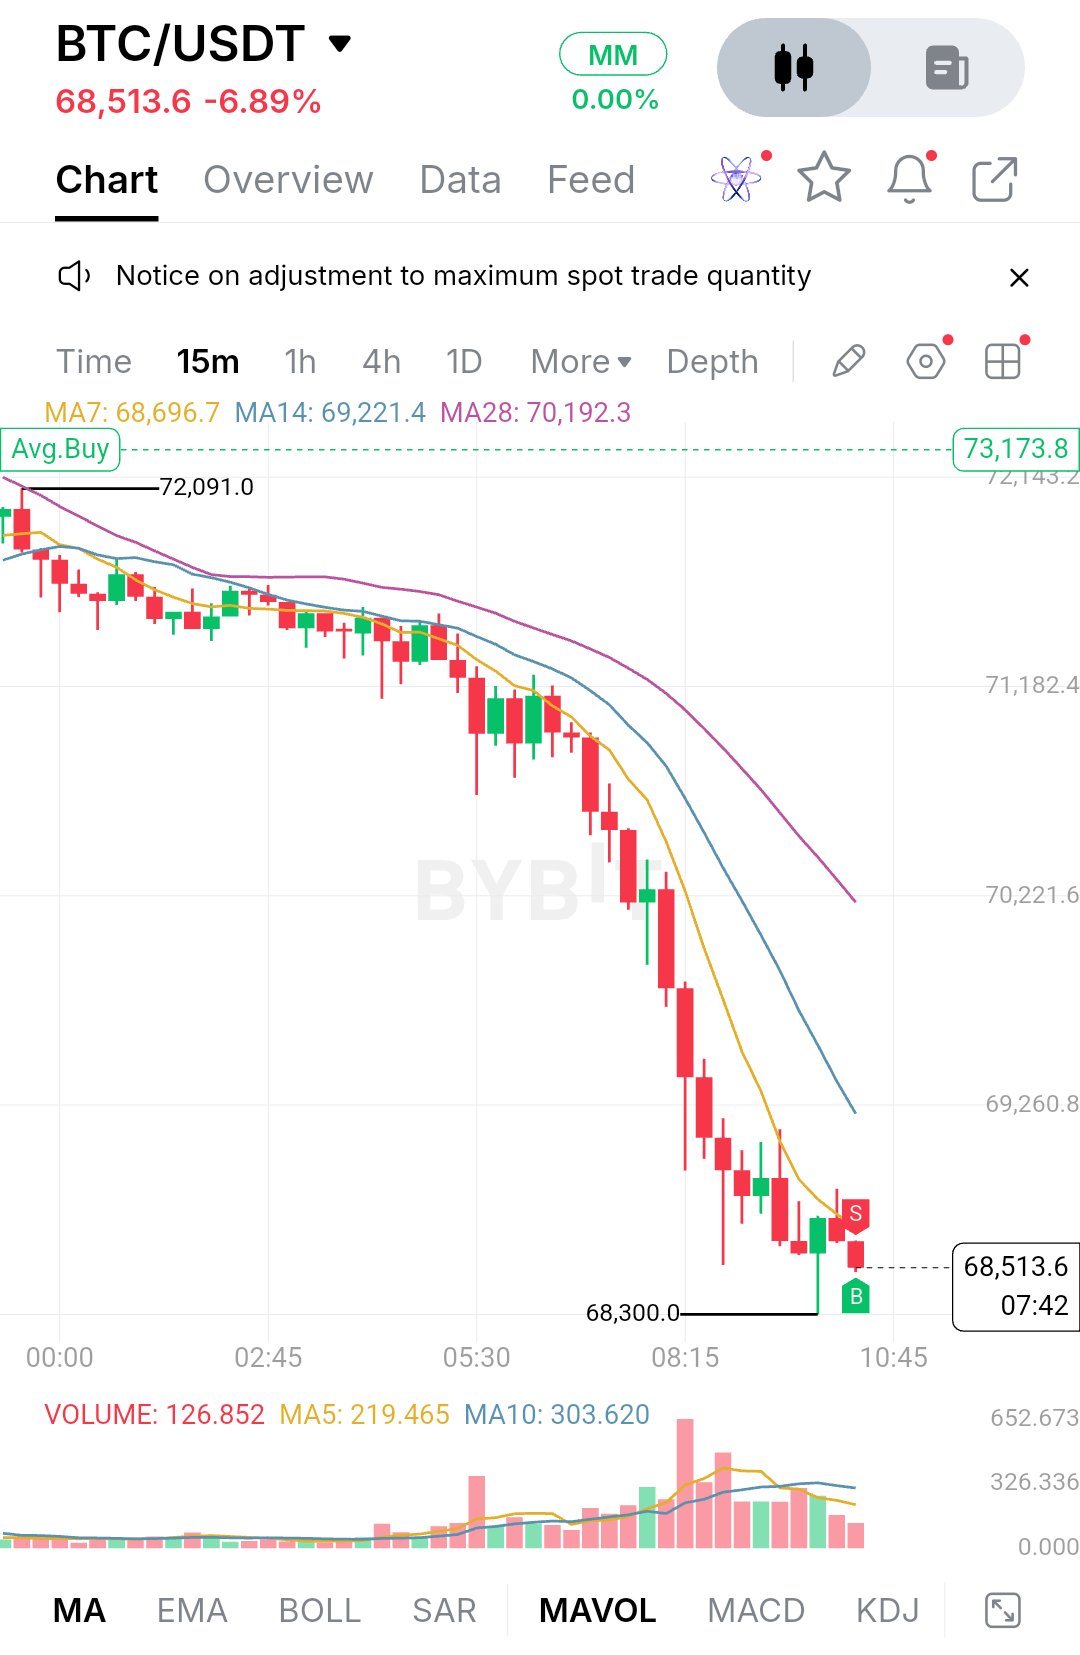
$BTCUSDT is trading at 68,513.6, down 6.89% on the day, and the chart makes the story pretty clear. Earlier in the session price was hovering around the 72,000 area, with the high marked at 72,091.0 near the left edge. Sellers stepped in there and never really let go. What followed was a steady grind lower, then a sharp flush through the middle of the session, and buyers only showed up once price approached 68,300.0. After that high, the structure turned into a clean series of lower highs and lower lows. The early part of the move was slow and controlled, with small candles drifting beneath the moving averages. Then the pace changed. A cluster of large red candles pushed price from roughly 70,000 down toward the mid-68,000s, and volume expanded heavily during that leg. That kind of volume spike usually points to forced selling or a wave of stop-outs rather than a quiet distribution. The bounce off 68,300.0 was a single green candle with a long lower wick, but it did not turn into follow-through. Price has since printed another red candle and is sitting just above the low, so this looks more like a pause at the bottom than a confirmed recovery. One note before the technical read: the screenshot shows the 15-minute chart, not the 1-hour. I can only work with what is visible here, so there is no EMA200, RSI, MACD or Fibonacci tool on this view, and I will not invent readings for them. What the chart does show is the MA set (MA7 at 68,696.7, MA14 at 69,221.4 and MA28 at 70,192.3) along with volume and its own moving averages. The three averages are stacked in perfect bearish order, with the fastest on the bottom and the slowest on top, and all of them are sloping down. Price is trading under all three, and the gap between MA28 and price is wide, which tells you how stretched the move has become. MA7 is the closest to price and is flattening a little, but it has not turned up. Volume is the other detail worth noting: the biggest bars appeared during the drop, and the most recent bars are fading, so selling pressure is easing even if buyers have not taken control. On the support side, the level that matters most is 68,300.0, the low of the session so far. It is where the only real rejection candle formed, and it has already been tested once. If it holds again and price starts building higher lows, it becomes the base for a relief bounce. If it breaks cleanly, especially on a rise in volume, there is no visible structure beneath it on this chart, which would leave price in open space and make a deeper extension possible. A weak bounce that fails to reclaim anything above would also be a warning, because it would show that demand at this level is thin. Resistance starts right overhead at the MA7 around 68,700, which price has been rejected from on the latest candles. The next layer is the MA14 near 69,200, and just above that sits the 69,260.8 horizontal level on the chart axis. After that comes MA28 near 70,200 and the 70,221.6 level, a zone where the sharp selloff accelerated, so it could act as supply if price gets back there. Further up, the 71,182.4 level and the 72,091.0 session high define the larger range that sellers defended earlier. For the bullish case, buyers first need to hold 68,300.0 and reclaim the MA7, then push through 69,200 to 69,300, where the MA14 and the horizontal level overlap. A close above that zone would be the first sign that the selling structure is weakening. From there, 70,200 becomes the natural target, and only a move through it would put 71,182.4 back in play. Ideally that push comes with rising volume on the green candles, not the thin participation we are seeing now. The bearish case is simpler. If price keeps getting rejected under 68,700 and the MA7 turns back down, sellers stay in control and another test of 68,300.0 looks likely. A decisive break below it would confirm continuation of the trend and expose price to fresh lows with no chart support nearby. Any weak bounce into the 69,200 to 69,300 zone that gets sold would also reinforce the downtrend. Key price levels: Support: 68,300.0 (session low and rejection point) Immediate resistance: 68,700 (MA7 area) Resistance: 69,200 to 69,300 (MA14 and horizontal level) Major resistance: 70,200 (MA28 and 70,221.6 level) Upper range: 71,182.4 and 72,091.0 (session high) Overall, Bitcoin is in a clear short-term downtrend, and the big question is whether the 68,300.0 low can hold as sellers lose steam. The drop was sharp, volume is cooling, and the averages are far above price, which is the kind of setup that often leads to either a base or a bounce, but nothing here confirms either yet. Watch how price behaves around 68,700 and 69,200: a reclaim with volume would be the first real shift in structure, while a loss of 68,300.0 would open the door to the next expansion lower. As always, none of this is a guarantee, so manage your risk and let price confirm the move before committing. $ETHUSDT#IMPACTbyTrade
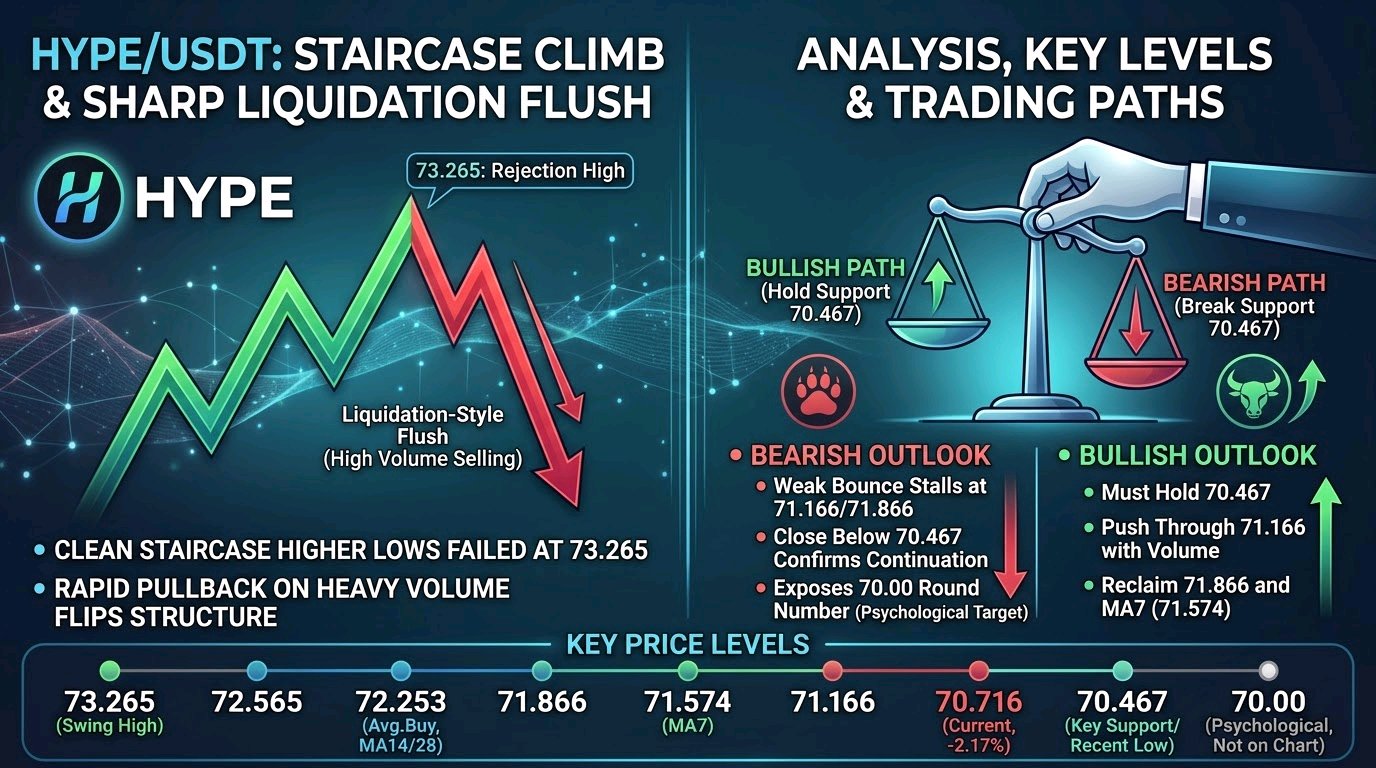
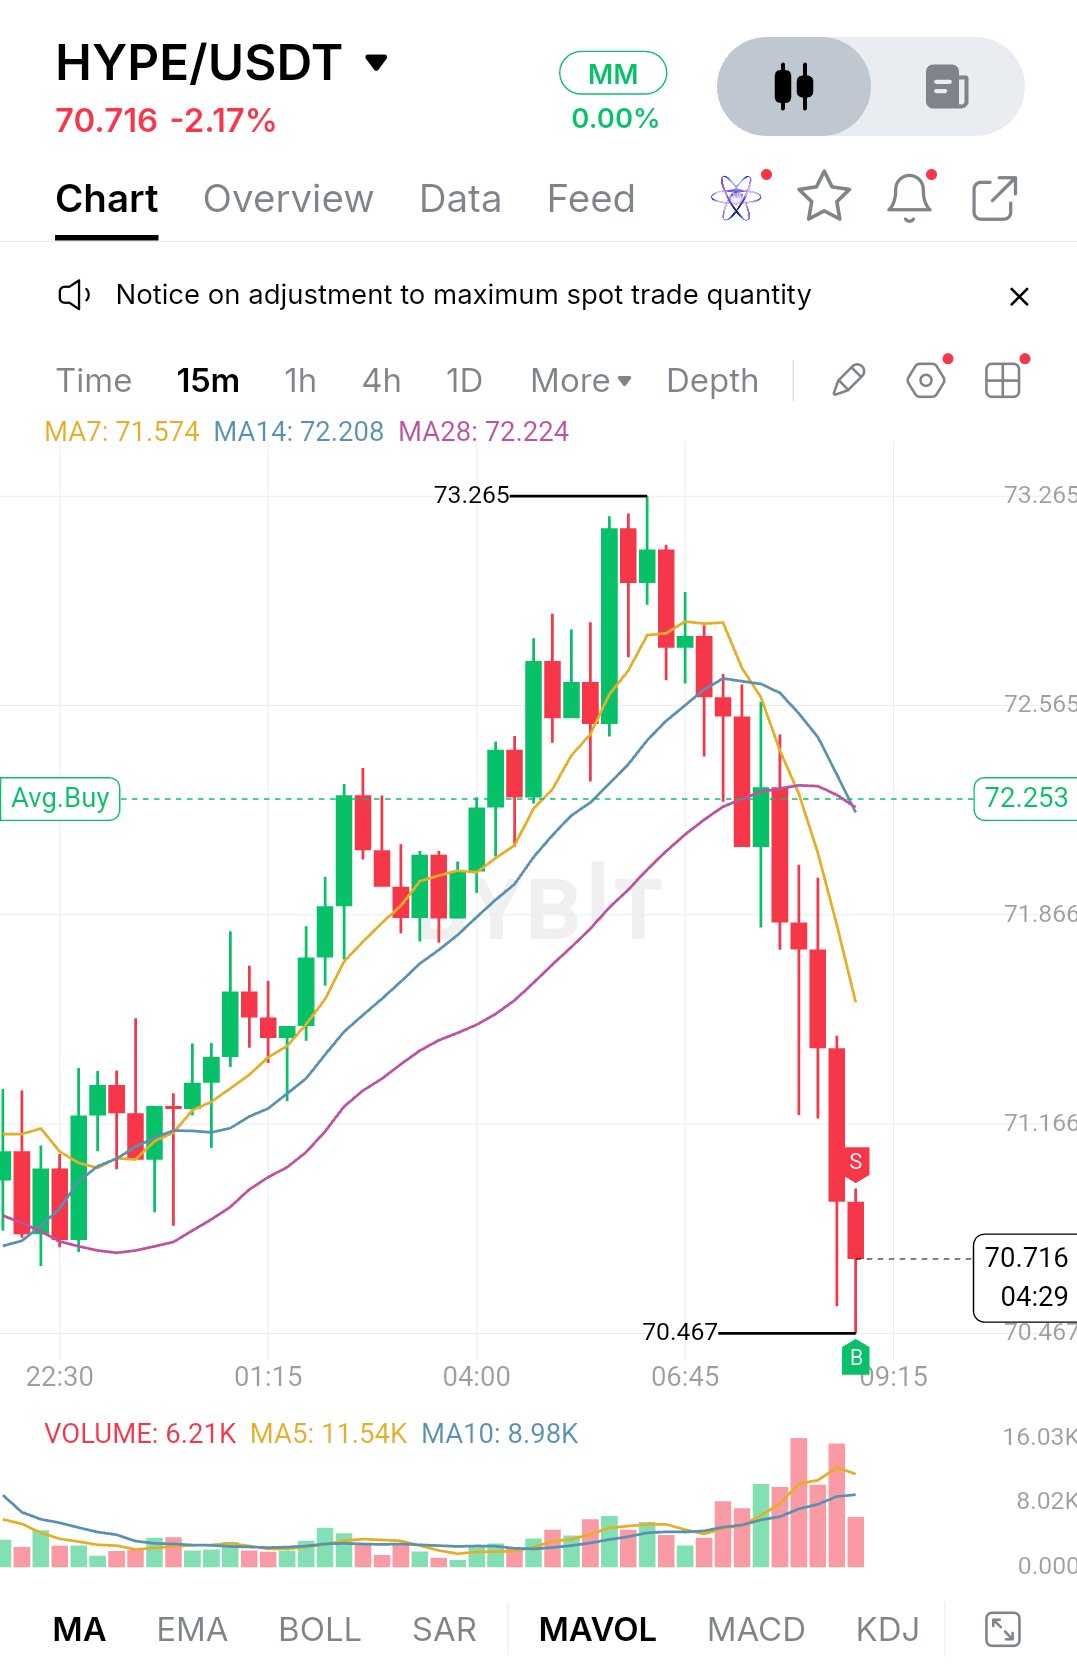
$HYPEUSDT is trading at 70.716, down 2.17% on the session, and the way it got here matters more than the number. Buyers pushed price steadily higher from the 22:30 area, building a clean staircase of higher lows until it tagged 73.265. That high didn't hold. Sellers stepped in right at the top, a couple of indecisive candles printed, and the market gave back almost the entire advance in a few hours. The structure has flipped from trending to corrective. After the rejection at 73.265, price slipped under all three moving averages and then accelerated lower, with a run of large red candles and almost no meaningful bounces in between. That is not a slow bleed. It looks like a liquidation-style flush, and the volume backs that up. The biggest bars on the volume pane line up with the heaviest selling, well above the volume average. The latest candle shows only 6.21K against a MA5 of 11.54K, so selling pressure is cooling off, though that candle is still forming and shouldn't be over-read. On the indicators, the MAs tell the story clearly. MA7 sits at 71.574, with MA14 at 72.208 and MA28 at 72.224. The fast average has crossed well below the slower two, and price is below all of them. The 14 and 28 are bunched together and starting to roll over, which makes the 72.2 area a stacked resistance zone rather than a single line. The 72.253 Avg.Buy line sits right inside it, which is a useful reference for anyone who bought the earlier push. The first support is the 70.467 low, where price printed a long lower wick. That wick shows buyers did show up there, but one rejection isn't a base. If 70.467 holds on a retest, with candles closing back inside the range and volume staying subdued, it could become the floor for a relief bounce. If it breaks cleanly, there's no visible structure on this chart beneath it, so price would be in open space. The 70.00 round number is the obvious psychological magnet where reactions are likely, but that's a general level, not something marked on this chart. Overhead, the nearest resistance is 71.166, followed by 71.866. Those are the levels where earlier consolidation happened during the drop, so expect sellers to defend them. The more important barrier is the 72.2 to 72.565 zone, where MA14, MA28 and the Avg.Buy line all converge. Beyond that, 73.265 is the swing high and the level that would have to break to cancel this entire pullback. For bulls, the job is to rebuild step by step. First they need to hold 70.467 and push back through 71.166 with real volume. Reclaiming 71.866 would put price back near MA7 and open the way toward the 72.2 cluster. Only a close above that cluster would suggest the drop was a flush rather than a trend change, putting 72.565 and then 73.265 back on the table. For bears, the cleanest setup is a weak bounce that stalls at 71.166 or 71.866 and rolls over beneath the falling MA7. That would show the sell-off was just a pause. A close below 70.467 would confirm continuation and expose the 70.00 area. Without chart levels below that, any further targets would be guesswork, so it's better to let price show its hand. Key price levels: - 73.265: Swing high and full invalidation of the pullback - 72.565: Upper resistance - 72.253: Avg.Buy line, inside the MA14/MA28 cluster (about 72.2) - 71.866: Resistance - 71.574: MA7, acting as dynamic resistance - 71.166: First resistance on a bounce - 70.716: Current price - 70.467: Key support and recent low - 70.00: Psychological round number, not marked on the chart Overall, HYPE has gone from a clean expansion to a sharp, volume-driven correction, and the next move depends on how it behaves around 70.467. A quiet hold followed by a reclaim of 71.166 would be the first sign that buyers are regaining control. A break lower would say the market isn't done repricing. Either way, watch the reaction at those levels and the volume behind it rather than the size of the candles. None of this is financial advice, and it's worth waiting for confirmation before committing. $BTCUSDT#BybitAIEvolving